Critical Consideration on Wall Thinning Rate by Liquid Droplet Impingement Erosion
|
|
|
- Richard York
- 5 years ago
- Views:
Transcription
1 E-Journal of Advanced Maintenance Vol.4 No.2 (2012) Japan Society of Maintenology Critical Consideration on Wall Thinning Rate by Liquid Droplet Impingement Erosion Nobuyuki FUJISAWA 1,*, Ryo MORITA 2, Akira NAKAMURA 3 and Takayuki YAMAGATA 1 1 Visualization Research Center, Niigata University, Niigata , Japan 2 Central Research Institute of Electric Power Industry, Tokyo, , Japan 3 Institute of Nuclear Safety System Inc., Fukui, , Japan ABSTRACT In this paper, the experiments on the wall thinning rate by the liquid droplet impingement in literature are studied by examining the erosion process, the method of erosion tests and the measurement accuracy of droplet velocity. Although the wall thinning rates scatter among the researchers, they come to a consistent result when the experimental conditions are considered. The power index of droplet velocity in the wall thinning rate ranges from 6 to 8 for the water jet and spray tests, while that of the rotating disk test shows smaller power index 5.8, which is closer to the theoretical value 5. The difference in the power indices is expected to be due to the influence of liquid film over the test specimen. KEYWORDS Liquid droplet impingement, Erosion, Droplet velocity, Metal material, Wall thinning rate, Nuclear power plant ARTICLE INFORMATION Article history: Received 3 April 2012 Accepted 7 July Introduction Liquid droplets are often generated in a cooling pipe of nuclear power plant due to the entrainment of liquid water from the upstream and also by the heat transfer through the pipe wall. In the region behind the orifice and the valve in the pipeline, the velocity of the droplets is highly accelerated due to the contraction effect. This results in the occurrence of high impact pressure on the inner surface of the pipe due to the liquid droplet impingement. The impact pressure of the droplets increases as high as several hundred MPa, which is beyond the elastic limit of the pipe-wall material, so that the pipeline is often damaged by the impact pressure of droplets. This phenomenon is called liquid droplet impingement (LDI) erosion, which is known as one of the major causes of pipeline leakage in the plants. In general, the LDI occurs on the dorsal side of the elbow in the pipe, where the droplets cannot follow the steam flow due to the inertia of the droplets. A schematic illustration of LDI can be seen in Fig. 1, which demonstrates the combined geometry of the flow acceleration by the orifice and the droplet impact on the outer wall of the elbow. The T-type joint and the various types of valves are other examples of the leakage due to LDI reported in literature [1], [2]. The impact pressure generated by LDI has been studied first by the theory of water hummer [3]. The theoretical study on the impact pressure is further extended by Heymann [4], who takes into account the generation of shock wave by the impingement of droplets and the propagation of the pressure wave to the spreading edge of the contact point, which results in the pressure about three times the normal impact pressure. Later, Field et al. [5] study the process of LDI experimentally by using the high-speed photography, and confirm the theoretical considerations on the LDI in literature. The process of LDI consists of the generation of shock wave, the pressure wave propagation and the occurrence of side jet (flow parallel to the surface), which speeds up to 10 times the impact speed of the droplets. In order to predict the LDI erosion, the erosion model has to be established, which expresses the relationship between the erosion rate and the droplet parameters (the velocity, the diameter and the * Corresponding author, fujisawa@eng.niigata-u.ac.jp ISSN / JSM and the authors. All rights reserved. 79

![Hattori-Takinami [10], Hama et al. [11] and Hayashi et al. [12]. However, it is known that these experimental results on the wall thinning rate are scattering widely.](/docs-images/93/117987604/images/2-1.jpg "Therefore, the investigation into the causes of data scattering among the experiments are necessary.")
2 Fig. 1. Schematic illustration of liquid droplet impingement erosion number of impinging droplet). Since the pioneering work by Heymann [6], there have been several experimental studies on liquid droplet impingement erosion, such as Ito-Okabe [7], Miyata-Isomoto [8], Isomoto-Miyata [9], Hattori-Takinami [10], Hama et al. [11] and Hayashi et al. [12]. However, it is known that these experimental results on the wall thinning rate are scattering widely. Therefore, the investigation into the causes of data scattering among the experiments are necessary. In the present paper, the wall thinning rate by the LDI erosion is studied by examining the erosion process, the method of experimental tests and the accuracy of velocity measurement. 2. Erosion Process by Liquid Droplet Impingement Typical erosion process of solid materials by the liquid droplet impingement is shown in Figs. 2(a), (b). The time variations of the erosion depth are shown in Fig. 2(a), and the wall thinning rate (the gradient of the erosion depth with time) is indicated in Fig. 2(b). These results are obtained by assuming that the test material is 12Cr steel (Vickers hardness: Hv450) and cobalt metal (Hv450) in the empirical equations proposed by Ito-Okabe [7], which is written as follows: E a bt)[1 exp{ ( t t )/ ) }] (1) ( 0 where E: erosion depth, t: time and a, b, α, t 0, t s are material constants. The material constants are set to a = 0.55, b = , α = 1.2, t 0 = 2, t s = 10.7 for the 12Cr steel and a = 0.38, b = , α = 2.05, t 0 = 0, t s = 38.2 for the cobalt metal in reference to Ito-Okabe [7]. Note that the wall thinning rate is obtained by the time derivative of Eq.(1). These results indicate that the erosion process by LDI can be categorized into four stages. In the incubation stage, the material surface does not change by the LDI because of the elastic deformation of the material. In the acceleration stage, the erosion initiates on the surface by the stress concentration beyond the fatigue limit of the material, and the wall thinning rate increases rapidly. Then, the wall thinning rate reaches a maximum value (maximum rate point). When the material surface becomes rough by the plastic deformation due to the LDI, the wall thinning rate is decreased due to the cushioning effect by the presence of the liquid film over the rough surface (deceleration stage). Thereafter, the wall thinning rate approaches the terminal stage, where the erosion rate becomes a constant with respect to the time. Note that the period of the incubation stage to the maximum rate point depends on the characteristics of the metal materials. In the actual erosion process, the period of incubation stage to maximum rate point is considered small in comparison with the very long plant operation time. Therefore, the LDI erosion in the pipe is mostly governed by the wall thinning rate in the terminal stage. In the past, the wall thinning rate is defined by the maximum erosion rate or the erosion rate in the terminal stage. The former definition of the wall thinning rate does not represent the average erosion rate of the pipe-wall thinning in the pipe. Furthermore, the maximum wall thinning rate cannot be determined accurately, because the thinning rate varies rapidly near the maximum rate point. The wall thinning rate in the terminal stage is, therefore, considered as the representative of the wall thinning rate of the LDI erosion. t s 80
3 3. Theoretical Consideration on Wall Thinning Rate The wall thinning rate by LDI is governed by the droplet velocity V, the droplet diameter d and the number of impinging droplets in a unit area N m. According to the dimensional analysis by Sanchez-Caldera [13], the wall thinning rate V m, defined by the time variation of the erosion depth, is expressed as follows; V m 4 dropmdropv 2 2 p C C Nm (2) where C: empirical constant, ρ drop : droplet density, m drop : droplet mass, p: hardness of oxide layer, ε C : cumulative strain to damage oxide layer. Note that the number of impinging droplets in a unit area N m can be expressed by the number density of droplet n m multiplied by the droplet velocity V, as follows; N m n m V (3) Therefore, the wall thinning rate V m is proportional to the 5th power of the droplet velocity V and grows linearly with the number density of droplets n m. While, the wall thinning rate V m is proportional to the 3rd power of the droplet diameter d, because the droplet mass is expressed as 3 mdrop drop d / 6. Therefore, the droplet velocity V is considered as the most influential parameter to the wall thinning rate V m by LDI. It should be noted that the liquid film over the material surface is not considered in the theoretical analysis. However, the liquid film exists on the actual material surface of LDI in the plant. To clarify the influence of the liquid film, the impact pressure on the solid material by the impingement of one droplet coupled with the pressure wave propagation in the material is numerically studied by Ikohagi [14]. He found that the impact pressure due to LDI was drastically reduced by the cushioning effect of the liquid film. It is also shown that the plastic volume, which exceeds the fatigue limit of the material, is proportional to the droplet velocity to the power of 5.3 without any liquid film over the material. However, this power index increases to 7.7 by the presence of a liquid film of 2.5 μm in thickness with respect to the droplet diameter of 100 μm [14]. This means that existence of the liquid film may change the dependency of the droplet velocity (power index) on the wall thinning rate. However, the assumption on the wall thinning rate and the volume of the plastic deformation is not clarified in the present state of the art. (a) Erosion loss versus time 81

![3(a)), the water jet test (Fig. 3(b)) and the spray test (Fig. 3(c)). In the rotating disk test [6, 7], a test specimen is set on an edge of the rotating disk.](/docs-images/93/117987604/images/4-1.jpg "The LDI erosion occurs when the test specimen go through the spray or falling droplets during the rotation of the disk.")
4 (b) Erosion rate versus time Fig. 2. Erosion process by liquid droplet impingement 4. Experimental Consideration on Wall Thinning Rate Most of the experiments on wall thinning rate by LDI have been conducted by one of the following methods, such as the rotating disk test (Fig. 3(a)), the water jet test (Fig. 3(b)) and the spray test (Fig. 3(c)). In the rotating disk test [6, 7], a test specimen is set on an edge of the rotating disk. The LDI erosion occurs when the test specimen go through the spray or falling droplets during the rotation of the disk. The merit of this experimental method is to evaluate directly the droplet velocity from the rotating speed of the test specimen, so that the measurement of droplet velocity can be conducted with high accuracy. However, it is difficult to evaluate the other droplet parameters (droplet diameter and number density of droplets), because they are not uniform in the spray. In case of falling droplets, the diameter of the droplets becomes as large as an order of mm, which is much larger than the droplets in actual plants (less than 100 μm in diameter). It should be mentioned that the thickness of the liquid film over the material surface in the rotating disk test becomes thinner than that of the actual plant condition due to the strong centrifugal forces. The water jet test [10] and the spray test [8, 9, 11, 12] are carried out using the high-speed water jet injected from the high-pressure pump to wear the test specimen. The difference between water jet test and spray test comes from the liquid structure impinging on the test specimen, which depends on the nozzle geometry and the distance from the nozzle. In the water jet test, a circular straight nozzle is used and the water jet impinges on the test specimen instead of the droplets. Therefore, the jet column is assumed equivalent to the droplets. Note that the droplet diameter is represented by the jet diameter in this test. The jet velocity is evaluated accurately from Bernoulli equation with the pump pressure, or from the continuity equation with the flow rate. On the other hand, the spray test has been carried out by impinging the droplets injected from the spray nozzle [11, 12, 15]. The water jet breaks up into the droplets in a short distance from the spray nozzle, and they hit on the test specimen. The elliptic nozzle is effective to generate a high-speed mist flow. However, it is difficult to evaluate the droplet velocity from the pump pressure or flow rate, because the local velocity increases near the nozzle exit by the influence of cavitation in the nozzle, and the droplet velocity decreases gradually further downstream due to the drag force acting on the droplet. Therefore, it is necessary to measure the local velocity near the test specimen by non-intrusive measurement techniques, such as LDV or PIV [16]. To simulate the LDI erosion, a wet steam flow test is also conducted [17]. This method uses the wet steam flow, which is closer to the flow condition in the plant. Therefore, it is suited for the LDI test, but the experimental cost is higher than other methods due to the necessity of the steam boiler. 82

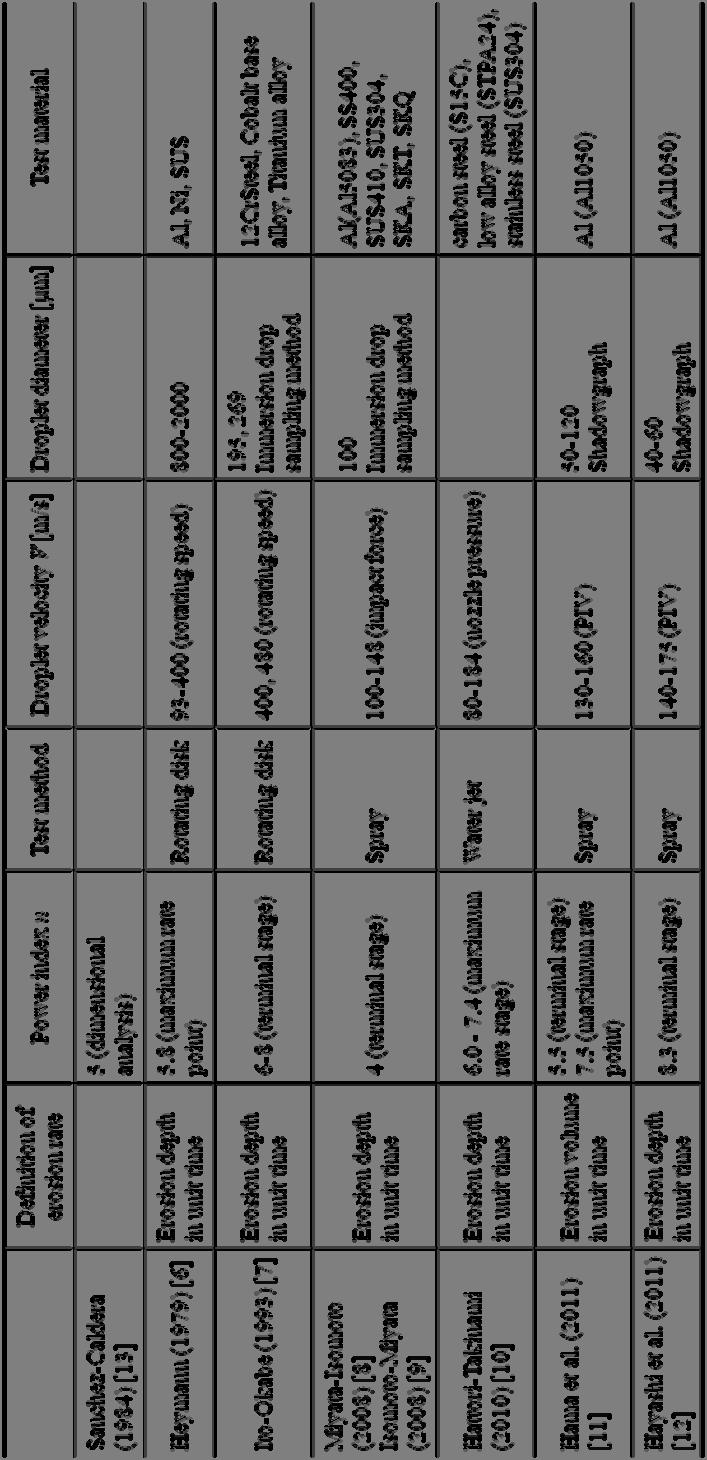
![Isomoto-Miyata [9], Hattori-Takinami [10], Hama et al. [11] and Hayashi et al. [12]. These results are summarized in Table 1.](/docs-images/93/117987604/images/5-1.jpg "Heymann [6] reported the conclusions from the LDI experiments conducted by the rotating disk tests with spray and jet at 10 laboratories, and found that the wall thinning rate was proportional to the")

![Ito and Okabe [7] reported the wall thinning rate of three materials, 12Cr-steel, cobalt base alloy and Ti base alloy using the rotating disk test with spray.](/docs-images/93/117987604/images/5-3.jpg "They reported that the wall thinning rate in the terminal stage was proportional to the droplet velocity with the power index ranging from 6 to 8.")
5 (a) Rotating-type apparatus (b) Water jet (c) Spray Fig. 3. Experimental apparatus for liquid droplet impingement erosion 5. Dependency of Droplet Velocity on Wall Thinning Rate The experimental results on the dependency of the droplet velocity on the wall thinning rate are reported by Heymenn [6], Miyata-Isomoto [8], Isomoto-Miyata [9], Hattori-Takinami [10], Hama et al. [11] and Hayashi et al. [12]. These results are summarized in Table 1. Heymann [6] reported the conclusions from the LDI experiments conducted by the rotating disk tests with spray and jet at 10 laboratories, and found that the wall thinning rate was proportional to the 5.8th power of the droplet velocity. However, the droplet diameters used in these experiments are larger than 0.8 mm, which is much larger than the actual droplet diameters in the plants. In this test, the thinning rate is evaluated at the maximum rate point of LDI erosion. Ito and Okabe [7] reported the wall thinning rate of three materials, 12Cr-steel, cobalt base alloy and Ti base alloy using the rotating disk test with spray. They reported that the wall thinning rate in the terminal stage was proportional to the droplet velocity with the power index ranging from 6 to 8. The experiments were conducted in two droplet velocities 400 m/s and 480 m/s, and the droplet diameters were found to be 195 μm and 269 μm in Sauter mean diameter. However, the power index of droplet velocity may have large uncertainty, because it is obtained from the measurements at only two droplet velocities. Miyata and Isomoto [8] reported the wall thinning rate from the spray test with a high pressure pump. Although they used a circular straight nozzle with 0.4 mm in diameter, the standoff distance was set as far as 200 mm from the nozzle to obtain the spray condition. The droplet diameter is about 100 μm, which is measured by the immersion drop sampling method. The experimental results show that the wall thinning rate of the maximum erosion depth is proportional to the 4th power of the droplet velocity in the terminal stage. However, the droplet velocity may not be evaluated correctly, because it is calculated from the impact force measurement combined with the momentum theory, which cannot be applied to the droplet impingement. They also conducted the LDI test with various materials, carbon steel, stainless steel and brass and so on, and reported the wall thinning rate was proportional to the Vickers hardness to the power [9]. Hattori and Takinami [10] conducted the water jet test to simulate the LDI erosion with a circular straight nozzle of 0.4 mm in diameter. The standoff distance was short as 12 mm from the nozzle exit. The experiments are carried out for carbon steel, low alloy steel and stainless steel. They reported that the power index of the velocity was ranging from 6.0 to 7.4. Hama et al. [11] conducted the spray test in a range of the droplet diameters from 50 μm to
6 μm, which was measured by the shadowgraph method combined with the image analysis [17]. The droplet velocity was evaluated from PIV measurement near the test specimen. From the tests of Aluminum material, they found that the wall thinning rate was proportional to the 5.5th power of the droplet velocity in the terminal stage, while the power index increases to 7.5 in the maximum rate point. The power index of droplet velocity in the maximum rate point is larger than the terminal stage. More recently, Hayashi et al. [12] carried out the LDI test using the spray under the condition that the test specimen is smaller than the sprayed area, which allows a uniform thinning rate of the test specimen by the spray test. They found that the wall thinning rate of Aluminum is proportional to the droplet velocity to the power 8.3 in the terminal stage. The difference in the power index of droplet velocity between two tests may be caused by the influence of erosion depth distribution by LDI. These considerations on the wall thinning rate indicate that the power index of droplet velocity is strongly influenced by the erosion process, the method of erosion tests and the accuracy of the velocity measurement. The wall thinning rates obtained from the erosion volume does not need to correspond to those of the maximum erosion depth. This is expected to be due to the cross-sectional distribution of the erosion depth in the water jet and the spray tests in the terminal stage. Note that the data of the maximum erosion depth scatters largely due to the local measurement of the erosion surface. Considering the experimental methods, the liquid film thickness on the test specimen is expected to be different among the rotating disk, water jet and spray tests. The liquid film thickness in the rotating disk test can be thinner than that in the water jet and the spray tests. The liquid film in the rotating disk test may be blown off by the influence of centrifugal forces during the calm period of liquid droplet impingement from the nozzle. On the other hand, thicker liquid film may exist on the material surface in the water jet and the spray tests. This experimental condition of liquid film in the water jet and spray tests is closer to the actual condition of LDI than that of the rotating disk test. In summary, it is rather difficult to compare the thinning rates reported in the past literatures directly because of the difference in the droplet diameter and the liquid film thickness. However, the following conclusions can be obtained. The rotating disk test by Heymann [6] showed that the power index of droplet velocity is 5.8, which is close to the theoretical value 5 by Sanchez-Caldera [13]. This is expected to be due to the negligible influence of liquid film on the material surface in the rotating disk test. On the other hand, the power indices of droplet velocity in the water jet and the spray tests range from 6 to 8, which is larger in magnitude than that of the rotating disk test except for the power index of Miyata-Isomoto[8], where the droplet velocity may not be evaluated correctly. One of the causes of this difference in the value of power index may come from the influence of liquid film on the material surface. Therefore, it is considered that the experiments with relatively thicker liquid film may have larger power index of droplet velocity. This tendency agrees qualitatively with the numerical results by Ikohagi [14], who found the growth of the power index from 5.3 to 7.7 by the presence of liquid film on the material surface. Although the qualitative study is conducted in the wet steam [17], the influence of the liquid film on the thinning rate has not been clarified quantitatively. It is, therefore, recommended to study further the wall thinning rate combined with the accurate measurements of the droplet velocity, the droplet diameter, the number density of droplets, and to understand the influence of the liquid film on the wall thinning rate comprehensively. 84
7 85
8 6. Conclusions This paper presents the critical consideration on the wall thinning rate of the metal materials in the liquid droplet impingement tests in literature. The experimental data are examined by taking into account the erosion process, the method of erosion test and the measurement accuracy of droplet velocity. Although the power indices of the droplet velocity scatter widely among the researchers, they come to a consistent value, when the erosion process, the liquid film thickness and the accuracy of velocity measurement are considered. The power index of droplet velocity ranges from 6 to 8 in the experiments of water jet and spray tests, while that of the rotating disk test indicates the smaller power index 5.8, which is close to the theoretical value of 5. The deviation of the velocity indices among these tests is considered to be due to the influence of the liquid film on the test specimen, which supports the larger value of power index in the water jet and the spray tests for the pipe-wall thinning prediction in actual plants. Acknowledgement The authors acknowledge Dr. F. Inada from Central Research Institute of Electric Power Industry for his suggestion on this work. References [1] JSME, Codes for Power Generation Facilities, Rules on Pipe Wall Thinning Management (in Japanese). JSME S CA1, [2] JSME, Research Committee on Basic Technology to Improve Pipe-wall-thinning Management (in Japanese), P-SCCⅡ-2, 13-20, A [3] S.S.Cook, Erosion by water-hammer, Proc. Roy. Soc., A, 119 (1928), [4] F.J.Heymann, High-speed impact between a liquid drop and a solid surface, J. Applied Physics, 40(1969), [5] J.E.Field, J.P.Dear, J.E.Ogren, The effects of target compliance on liquid drop impact, J. Applied Physics, 65 (1989), [6] F.J.Heymann, Conclusions from the ASTM Interlaboratory test program with liquid impact erosion facilities, Proc. 5 th Int. Conf. Erosion by Liquid and Solid Impact (1979), 20, [7] H. Itoh and N. Okabe, Evaluation of erosion by liquid droplet impingement for metallic materials, Trans. JSME (A), 59(1993), (in Japanese). [8] H. Miyata and Y. Isomoto, Erosion phenomenon caused by water droplet impingement and life prediction of industrial materials, Part 1 Investigation of droplet impingement factors and erosion testing methods, Zairyo-to-Kankyo, 57(2008), (in Japanese). [9] Y. Isomoto and H. Miyata, Erosion phenomenon caused by water droplet impingement and life prediction of industrial materials, Part 2 Establishment of predictive equations and evaluation of material performance, Zairyo-to-Kankyo, 57(2008), (in Japanese). [10] S. Hattori and M. Takinami, Comparison of cavitation erosion rate with liquid impingement erosion rate, Wear, 269 (2010), [11] D.Hama, T. Yamagata, G. Takano and N. Fujisawa, Investigation on liquid droplet impinging erosion, Evaluation of erosion rate by high-speed spray, Maintenology, 10(2011), 36-41(in Japanese). [12] K. Hayashi, D. Hama, T. Yamagata, T. Takano, N. Fujisawa, Investigation on liquid droplet impinging erosion by high-speed spray, Evaluation of erosion rate and its velocity dependency, Preprint Japan Soc. Maitenology(2011), (in Japanese). [13] L.E.Sanchez-Caldera, Mechanism of corrosion-erosion in steam extraction lines of power stations, Ph.D. thesis, Dep. Mech. Eng., Massachusetts Institute of Technology, (1984). [14] T. Ikohagi, On evaluation of LDI erosion rate based on fluid/solid coupled simulation, Proc. 8th Int. Conf. Flow Dynamics, 2011, Sendai, Japan, [15] Shinogaya, T. Shinohara and M. Takemoto, Erosion of metals in high speed mist flow evaluation of threshold velocity by acoustic emission system, Proc. 10th Int. Cong. Metalic Corrosion, India, 1987, pp [16] N. Fujisawa, T. Yamagata and T. Takano, A. Ikarashi and Y. Kudo, Optical measurement of spray-jet properties for the study of liquid-droplet impingement erosion, Proc. Int. Symp. Flow Visualization, 2010, Daegu, Korea, 1D06. 86
9 [17] R. Morita and Y. Uchiyama, Proposition of wall thinning rate model for liquid droplet impingement erosion, CRIEPI Research Report, L10018, 2011 (in Japanese). 87