Critical Raw Materials and Recycling. Dr. Burçak Ebin
|
|
|
- Elijah Lewis
- 5 years ago
- Views:
Transcription


1 Critical Raw Materials and Recycling Dr. Burçak Ebin Chalmers University of Technology, Gothenburg Department of Nuclear Chemistry and Industrial Recycling


2 Outline Critical Raw Materials Factors affecting criticality analysis Critical raw materials assessments Management strategy Recycling Recycling rate of metals&metalloids Research on recycling Industrial Material Recycling studies From waste to advanced materials Conclusion


3 What is critical raw material? Raw materials are crucial to economy and essential to maintaining and improving our quality of life. Natural resources are limited and secure access of various raw materials is crucial for a sustainable economy and development. Securing reliable and unhindered access to certain raw materials is a growing concern within the countries and across the globe.
4 Factors affecting criticality analysis The criticality analysis of raw materials is based on a complex combination of their economic importance and supply risk level Geopolitical situation Internal potential or access the source Technology level Political situation Economic changes/fluctuations Local and provincial instability

5 Criticality analysis of elements Serious threat in the next 100 years Rising threat from increased use Limited availability, future risk supply Mike Pits, UK Chemistry Innovation Knowledge Transfer Network Endangered elements, Chemistry World, January 2011, 50.
. Report on Critical Raw Materials for the EU.")
6 Critical raw material assessments for the EU for 2013 European Commission. (2014). Report on Critical Raw Materials for the EU. May 2014.


7 Applications of critical raw material Mn Li Ni Co In Au Ag Cu
. U.S. Department of Energy Critical Material Strategy. December 2010.")
8 Critical raw material analysis for energy of US Department of Energy in 2010 Bauer, D., et al., (2010). U.S. Department of Energy Critical Material Strategy. December 2010.
. U.S. Department of Energy Critical Material Strategy. December 2010. Gordon, et al., (2003).")
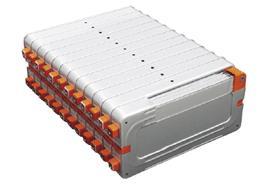
9 Demand (tonnes) Case Study: In and Zn consumption In, Ga Zn Zinc s present depletion time (reserves/annual use) is about 20 years Bauer, D., et al., (2010). U.S. Department of Energy Critical Material Strategy. December Gordon, et al., (2003). Resource, Conservation and Recycling, 39,
10 Management strategy of the critical raw materials Strengthen the deeper connections and cooperation contracts with producer countries. Activating and encouraging internal resource potential. Developing substitutes. Promoting recycling. Supporting research & development and data collection. Education

11 Recycling rates for 60 metals and metalloids. Reck, K. B., Graedel T. E., Science 337 (2012) 690.
 690.")
, Report on the environmental")
12 Case Study: Nickel Recycling Reck, K. B., Graedel T. E., Science 337 (2012) 690. Grimes, et al. (2008), Report on the environmental benefits of recycling, BIR
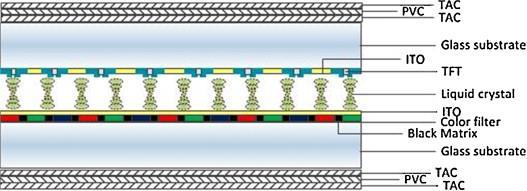
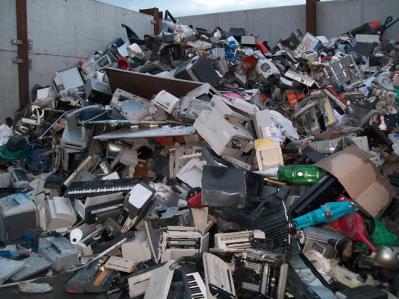
13 Comparison of the concentration of main elements in ore and in waste electrical and electronic equipment (WEEE). Element Average minimum content in ore (%) Average content in WEEE a (%) Copper (Cu) Iron (Fe) Aluminum (Al) Zinc (Zn) Nickel (Ni) Tin (Sn) Lead (Pb) Antimony (Sb) Gold (Au) Silver (Ag) Palladium (Pd) Indium (In) (in zinc ores) b a Minimum and maximum values of heterogeneous WEEE stream, PCBs from PCs, mobile phones, and other electronics. b Indium content in liquid crystal display (LCD) screens. Ebin, B., Isik, M. I., Chapter 5: Pyrometallurgical Processes for the Recovery of Metals from WEEE in WEEE Recycling: Research, Development and Policies, Elsevier, 2016.
. Development of recycling process for alkaline and Zn-C batteries. Recycling of NiMH batteries.")
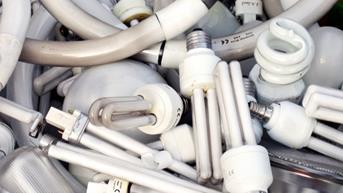
14 Present and Ongoing Research Industrial Material Recycling Recycling of CIGS solar cell waste materials. Recovery and reuse of TiO 2 and other pigments from paint waste. Recycling of magnets. Recycling of phosphorus. Recycling of antimony and zinc from metal oxide varistors (MOVs). Development of recycling process for alkaline and Zn-C batteries. Recycling of NiMH batteries. Recycling of Li-ion batteries. Nuclear waste, radium (Ra) chemistry.


15 Recycling by Solvent Extraction Thermostated contacting device for 3-10 ml samples AKUFVE centrifuges, automated extraction system (liquid/liquid) Pulsed column with 2 m sections with a maximum height of 10 m. Mixer-settler battery
16 Flow Chart of REE recycling process Phosphors fraction 2 M HNO3 S/L 10% w/v, 20C, 24 h. 1 M HNO3 S/L 10% w/v, 20C, 15 min. Leaching of impurities Residue Glass etc.; REEs (Ce, La, Gd, Eu, Tb, Y) Other undissolved metals Leaching of REEs High efficiency for Eu, Y (>95%) Low efficiency for La, Ce, Gd and Tb Residue Glass etc.; REEs (Ce, La, Gd and Tb); other metals Acidic leachate High Ca and Ba content; Al, Cd, Cr, Cu, Fe, Mg, Mn, Ni, Pb, Sb, Sn, W, Zn etc. Minor amounts of REEs Further leaching of REEs (?) Leaching of the remaining La, Ce, Gd and Tb with HNO3 High acidity, temperature and long leaching time needed Leachate containing REEs Also other metals 50% Cyanex 923 in kerosene (solvent 70) Mixer-settler; 3 extraction stages Contact time < 60 sec; 20C Phase ratio O:A = 2 Solvent extraction of REEs Depleted aqueous phase Unextracted metals in acidic solution Sent to the leaching step or further processing Loaded organic phase REEs; Fe; Hg Water Weak acidic solution Water washing (washing of co-extracted acid) 2-4 M HCl Phase ratio A:O = stages Stripping of REEs REEs in acidic solution Organic phase without REEs Final product (so far) 2-4 M HNO3 Scrubbing Aqueous solution Fe; Hg Depleted organic phase

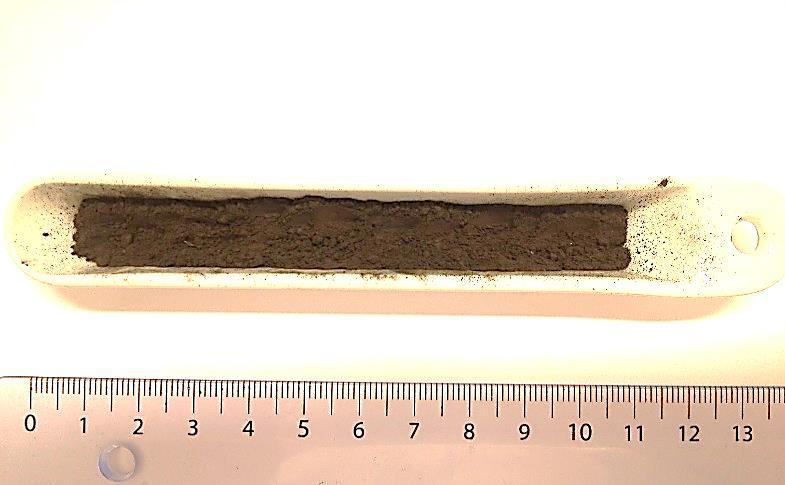
17 Alkaline Battery Waste


18 Alkaline Battery Waste Unwashed battery waste Average Particle Size: 355 nm Agregations&Coarse Particles: <10 µm BET Surface Area: 3.67±0.03 m 2 /g Washed battery waste BET Surface Area: 6.12±0.03 m 2 /g
19 Alkaline Battery Waste ICP-OES XRD Elements Battery Waste % (w/w) Washed Batttery Waste% (w/w) Mn 28 ± 1 33 ± 2 Zn 25 ± 1 29 ± 2 K 4 ± ± 0.4 Fe 0.83 ± ± Ni 0.1 ± ± Co 0.01 ± ± Cu 0.03 ± ± Cr 0.02 ± ± Pb 0.02 ± ± Cd 0.01 ± ± Hg C 7 6


20 Alkaline Battery Recycling H 2 N 2 Research Parameters Temperature Reducing Agent Time Type of Gas Gas Flow Rate Feeding Amount Ebin B., et al. (2016). Waste Manage., 51, Ebin B., et al. (2016). J. Anal. App. Pyrol., 121,
21 Thermodynamic Calculations ZnMn 2 O 4 Equilibrium composition as a function of temperature
22 Zn recovery, % Zn Recovery Rate Temperature and Time Relation Unwashed battery sample % 58% 38% 97% 94% 80% 850 C 900 C Elements % (w/w) Mn Zn 0.85 K 3.45 Fe 1.64 Ni 0.2 Co C Cu 0.04 Cr 0.01 Time (min) Pb 0.01 Cd 0 Hg 0
23 Residue Temperature and Time Relation
 Average")

24 950 o C, 60 min, N 2(g) Average Particle Size BET Surface Area 2.9 µm 0.39±0.02 m 2 /g
25 Zn 850, 900 and 950oC, 60 min, N2(g)


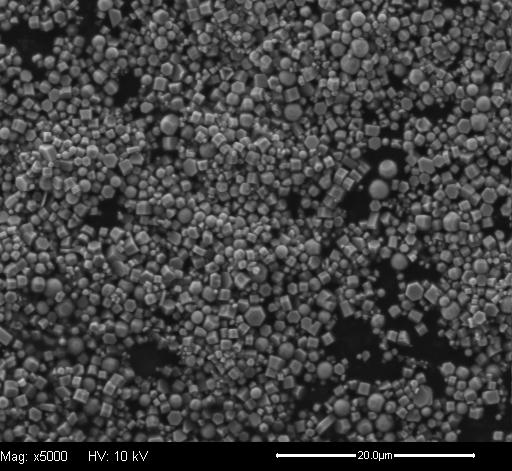
26 Zn 850, 900 and 950oC, 60 min, N2(g) 850oC 900oC 950oC 850oC 900oC 950oC

27 Zn 850, 900 and 950 o C, 60 min, N 2(g) Sample Average particle size (nm) Cumulative Undersize (nm) 10% below 25% below 50% below 75% below 90% below 850 C 852 nm 452 nm 573 nm 746 nm 1069 nm 1388 nm 900 C 864 nm 321 nm 468 nm 752 nm 1083 nm 1582 nm 950 C 867 nm 459 nm 591 nm 780 nm 1031 nm 1426 nm
28 Zn Recovery Rate Gas Flow Rate and Additive Relation Washed battery sample 99.7% 99.6% 75% 80% 80% 61% 79% Elements % (w/w) Mn 59 Zn 0.1 K 0.72 Fe 1.63 Ni 0.2 Co 0 Cu 0.05 Cr 0.01 Pb 0.01 Cd 0 Hg 0
29 Zn Particles Gas Flow Rate Relation 3.0 L/min 2.0 L/min 1.0 L/min 0.5 L/min


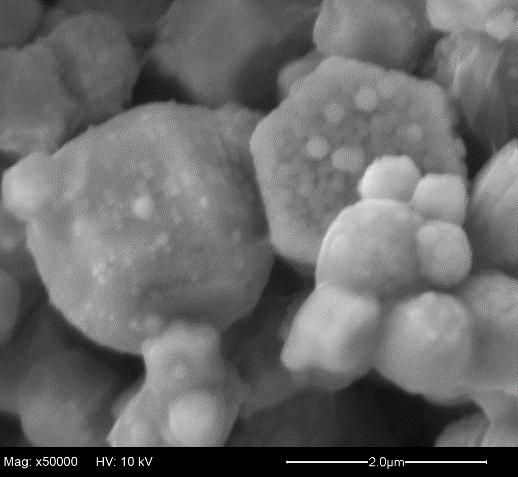

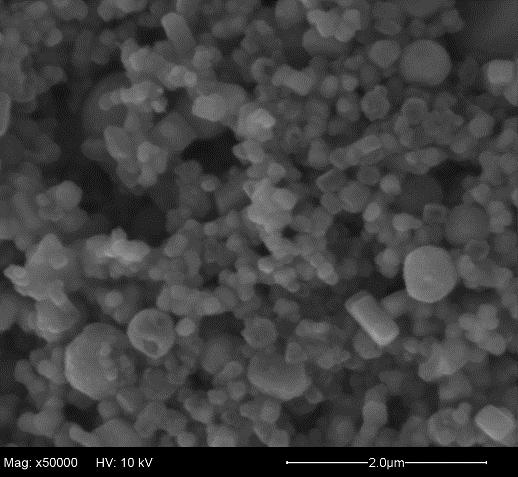
30 Zn Particles Gas Flow Rate Relation 0.5 L/min 1 L/min 2 L/min 3 L/min
31 Zn Particles Gas Flow Rate Relation Sample Average particle size (nm) 10% below Cumulative Undersize (nm) 25% below 50% below 75% below 90% below BET Surface Area (m 2 /g) Calculated Particle Size (nm) 0.5 L/min 874±11 nm 304 nm 453 nm 704 nm 1096 nm 1634 nm ± nm 1.0 L/min 765±8 nm 301 nm 421 nm 613 nm 892 nm 1250 nm ± nm 2.0 L/min 669±9 nm 341 nm 448 nm 605 nm 818 nm 1074 nm ± nm 3.0 L/min 534±13 nm 285 nm 368 nm 489 nm 649 nm 837 nm ± nm
32 Manganese Oxide Particles Cooling Rate Relation (a) rapid cooling at room temperature under air, (b) cooling to 300 C by 10 C/min cooling rate under air and (c) rapid cooling at room temperature under N2(g).

 (b) (d) @950 C")

 cooling to")

. (f)")
33 Manganese Oxide Particles Cooling Rate Relation (a) (c) (e) (b) C for 60 min (a,b) rapid cooling at room temperature under air, (c,d) cooling to 300 C by 10 C/min cooling rate under air and (e,f) rapid cooling at room temperature under N 2(g). (f)
34 Manganese Oxide Particles Cooling Rate Relation Sample BET Surface Area (m 2 /g) Calculated Particle Size (nm) Pore Size (nm) Mixture of MnO and Mn 3 O 4 ;rapid cooling at room temperature under air Mn 3 O 4 ; Cooling to 300 C by 10 C/min cooling rate under air MnO; rapid cooling at room temperature under N 2(g) 1.30± ± ±
35 Conclusion Critical raw materials analyses are crucial for sustainable development and economy. Local factors (geopolitical position, internal sources, technology infrastructure) dominate the criticality analysis. Basis of the critical raw materials management strategy: Establish long-term relations. Encourage internal sources. Promote recycling. Support science & technology and education. We need innovative recycling solutions to attract industrial interest. Waste can be a suitable raw material to prepare advanced technology materials and cutting-edge products.
36 Waste is what is left when imagination fails! (Christian Ekberg, Prof., Chair of Nuclear Chemistry & Industrial Materials Recycling)

37 Thanks for your attention!

38
39 Research Approach Thermodynamic Calculations Vacuum Metallurgy P-T Diagram of several metals (Antoine Equation) Volatile Metal Compounds Halogenation Reactions of In and Sn Ebin, B., Isik, M. I., Chapter 5: Pyrometallurgical Processes for the Recovery of Metals from WEEE in WEEE Recycling: Research, Development and Policies, Elsevier, 2016.