(CORSYM 2018) Chennai, Tamil Nadu, India. March 23 24, Edited by
|
|
|
- Janel Dennis
- 6 years ago
- Views:
Transcription
1


2 Corrosion: Fundamental and Practical Aspects for Prevention, Control, and Mitigation Strategies Proceedings of the 5 th International Corrosion Prevention Symposium for Research Scholars (CORSYM 2018) Chennai, Tamil Nadu, India March 23 24, 2018 Edited by Radhakrishna G. Pillai Deepak K. Kamde Nancy David N. Rajendran U. Kamachi Mudali Organized by Supported by Published by Sricreeper Technologies, Chennai, India

3 Proceedings of the International Corrosion Prevention Symposium for Research Scholars (CORSYM 2018), IIT Madras, Chennai, March 23-24, Disclaimer Although care is taken to ensure the integrity and quality of this publication and the information herein, no responsibility is assured by the editors or the publishers for any damage to property or persons as a result or operation or use of this publication and/or the information herein. The views and data interpretation contained in the articles are exclusively those of the authors. The editors or publishers do not own the copyright of any information presented in this book. All rights belong to the authors. Publisher Sricreeper Technologies 3, Potter s Street, Saidapet, Chennai , Tamil Nadu, India Mobile: vrkonline@gmail.com Coordinator NIGIS South Zone Students Section New No. 3, First Floor, Potter s Street, Saidapet, Chennai , Tamil Nadu, India Mobile: nacesz@gmail.com Media Partner The Masterbuilder Publishers Pvt. Ltd. 102/11, Tripti Apartments Marshalls Road, Egmore Chennai , Tamil Nadu, India ISBN Cover Page designed by Lakshmi Prabha E. Sachin P. R. ii
4 About CORSYM CORSYM the International Corrosion Prevention Symposium for Research Scholars is an annual flagship event organized under the NACE International. The first CORSYM (in 2013) was held at Chennai, India and was organised by the NIGIS South Zone Student Section. Subsequent CORSYMs were held in Mumbai (2014), Chennai (2015), and Kuala Lumpur, Malaysia (2017). This 5 th edition of CORSYM is being held at the Indian Institute of Technology (IIT) Madras, Chennai, India and organized by South Zone Students Section of NACE Gateway India Section (NIGIS) and IIT Madras. CORSYM is a gathering of young scientists, research scholars and students in the area of corrosion prevention and control. CORSYM serves as a platform for young researchers to showcase their technical knowledge, research findings, creative thinking, and effective communication skills in generating innovative solutions for global corrosion issues. It also helps in networking with the current and future experts in the field and getting feedback and guidance on their research projects. About NACE International In 1945, with 268 members, NACE was officially incorporated under Texas law as a not-for-profit technical association. In 1946, the Houston Section was the first section formed and association membership grew to 801. The South Central and Western Regions were established in 1946, followed by the Southeast and North Central Regions in By the end of the 1940s, NACE had five regions, 17 sections, and more than 1,700 members. Today, the association (renamed NACE International The Corrosion Society in 1993) has four areas and 80 sections in North America, four international areas with 62 sections, and a total of nearly 36,000 members from 130 countries. In addition to NACE headquarters in Houston, there now are staff offices in San Diego, California; Shanghai, China; Kuala Lumpur, Malaysia; Al-Khobar, Saudi Arabia; and Sao Paulo, Brazil. For details, visit About NACE International Gateway India Section (NIGIS) NIGIS was established in NIGIS has become one of the largest and most active sections of NACE International. With more than 1100 members, NIGIS has organized over 187 CIP Level 1, 2, & Peer Review, CIP 2 Emphasis, Nuclear Power Plant course, O-CAT, PCS 2, Basic Corrosion, Direct Assessment, Internal Corrosion for Pipeline, Refinery Corrosion and Cathodic Protection 1, 2, & 3 certification courses of NACE International besides hosting 23 annual conferences. NIGIS presents awards to individuals and institutions for their contributions to corrosion awareness and developments in the field of corrosion science and technology. NIGIS sponsors two student chapters in Mumbai and Chennai/Kalpakkam. NIGIS regularly organizes CORCON International Conference & Exhibition on Corrosion which is a popular event. NIGIS is committed to enhance the quality and range of its services and activities in the field of corrosion awareness and dissemination of knowledge regarding corrosion protection and control in India. Visit for details. NACE International East Asia & Pacific Area (EAPA) NACE EAPA spans from Pakistan in the west to the far east of Japan, and the north to Mongolia, down to the south encompassing Australia, New Zealand and the Pacific Islands. This is NACE International s fastest growing geographical areas with approximately 6000 members. The area is vibrant with the dedication of our members, coming from the various industries, challenging ourselves and striving to meet the NACE s mission of Protecting People, Assets & the Environment from Corrosion. As today s worldwide corrosion cost stands more than USD 2.5 trillion, education courses, conferences, and seminars are held within the Area as part of our efforts in mitigating and minimizing these through incorporation of modern and the latest technologies as well on-going research in corrosion mitigation and prevention. iii
5 International Advisory Committee 5 th CORSYM, Chennai, India, March 2018 Mr. Anand Kulkarni, Trustee, NIGIS & Secretary/Treasurer, EAPA Mr. Dipen Jhaveri, Secretary, NIGIS Mr. Manohar Rao, Chairman, NIGIS Ms. Michelle Lau, Past Director, EAPA Dr. Rolf Gubner, Area Chairman, EAPA Dr. Samir Degan, President, NACE International Mr. Toyoji Takeuchi, Director, EAPA Mr. Tushar Jhaveri, Past President, NACE International Dr. U. Kamachi Mudali, Vice Chairman, NIGIS Mr. Vivek Natu, Treasurer, NIGIS NIGIS South Zone Executive Committee Dr. U. Kamachi Mudali, Dept. of Atomic Energy, Govt. of India (Advisor) Dr. S. Rangarajan, BARC Kalpakkam (President) Dr. R. Venkatesan, NIOT Chennai (Vice President) Prof. M. Kamaraj, IIT Madras (Vice President) Dr. Radhakrishna G. Pillai, IIT Madras (Secretary) Dr. K.M. Veerabadran, MIT, Anna University (Joint Secretary ) Dr. Rani P George, IGCAR Kalpakkam (Treasurer) Prof. K. Ravichandran, University of Madras (Chairman- Training Courses) Dr. T. Subba Rao, BARC Kalpakkam (Chairman - Technical Activities) Dr. N. Rajendran, Anna University (Chairman Membership/Publicity & Faculty Advisor) Dr. T.M. Sridhar, University of Madras (Chairman, Membership Drive & Support) Sh. R. Venu, Akzo Nobel Coatings India Pvt. Ltd. (Chairman, Awareness Programmes) Shri. Venkatesh Kumar, Harita NTI Ltd. (Member) Sh. V. Jeyakumar, Ti Anode Fabricators Pvt. Ltd. (Member) Prof. S.K. Seshadri, IIT Madras - Retired (Member) Dr. John Paul (Member) Sh. N. Sriram (Member) Prof. B. Venkatachalapathy, SRM University (Member) Dr. Balraj Velu, Sibitec Consultants (Member) Shri V. Vijayaraghavan, Nextgenn (Member) iv
6 Student Organising Committee Deepak K. Kamde, IIT Madras Manu Harilal, IGCAR, Kalpakkam Abdul Ahad Ahmed, BSAR Crescent Mohan Sathyaraj, Madras University Abdul Basit Peerzada, IIT Madras Nancy David, Anna University Alvin Balasundaram, IIT Madras Nandesh Babanagar, IIT Madras Agilan Perumal, Anna University Rekha Mahendrakar, IISc Bangalore Aviral Bisht, IIT Madras Shanmugharaj S., IIT Madras Balasubramani, Madras University Sharanya Sriram, IIT Madras Bincy George, IIT Madras Sripriya Rengaraju, IIT Madras Dyana Joseline, IIT Madras Sudha Uthaman, IGCAR Kalpakkam H. Usha Rani, Madras University Sundar Rathnaraj, IIT Madras Manovasuki J., Madras University Umar Mohammad, BSAR Crescent Editorial Committee Abdul Ahad Ahmed Sharanya Sriram Agilan Perumal Sriram K. Bincy George Sundar Rathnaraj Deepak K. Kamde Sripriya Rengaraju Dyana Joseline Sudha Uthaman Kiran Ram Swathy Manohar Manjari T. Umar Mohammad Manovasuki J. H. Usha Rani Nancy David Vaishnav Nithya Nair V. G. v
7 NIGIS South Zone Student Section Mohan Sathyaraj (President), University of Madras Simi V.S. (Vice President), Anna University Nancy David (Secretary), Anna University Chiranjit Poddar (Treasurer), IGCAR, Kalpakkam A. Adhilakshmi, University of Madras Abdul Basit Peerzada, IIT Madras Abinaya R., University of Madras Aghilan Perumal, Anna University Anand Godara, IIT Madras Ashok Raja, University of Madras Balasubramani V., University of Madras Bhavana Rikhari, Anna University Deepak K. Kamde, IIT Madras Dyana Joseline, IIT Madras Ezhil Vizhi M., IGCAR, Kalpakkam Geeti Suhbra Jena, IGCAR, Kalpakkam Iynoon Jariya S.A., University of Madras Jayachandran K., IIT Madras M. Kalaiyarasan, Anna University Madhura B., IGCAR, Kalpakkam Manovasuki J., University of Madras Manu Harilal, IGCAR, Kalpakkam Mohammad Umar, BS Abdur Rahman University, Chennai Mohandoss S., Rajalakshmi Engg. College Padmapriya Arulkumar, IIT Madras Paulson Varghese, IGCAR, Kalpakkam Poonam Sharma, Anand International College, Jaipur Pradeep K. Premkumar, Anna University R. J. Kavitha, University of Madras Rasitha P.K., IGCAR, Kalpakkam Rasmi K.R., IGCAR Kalpakkam Saranya Kannan, Anna University Sooraj Kumar AO, IIT Madras Sripriya Rengaraju, IIT Madras Sudha Uthaman, Sathyabama University Sundar Rathnaraj, IIT Madras Vinodhini S.P., Rajalakshmi Engineering College 5 th CORSYM, Chennai, India, March 2018 vi

 2556 3360 /2556 3243 Direct Number: (022) 2556 0870 2548 6505 E-mail: ce@mum.hwb.gov.")
 along with NACE International Asia Pacific Area, NIGIS, Mumbai and IIT Madras during March 23-24, 2018 at IIT Madras, Chennai, India.")

8 ISO 9001:2008 ORGANISATION ड. य. क म च म दल DR.U.KAMACHI MUDALI अध यक ष व म य क ययकक Chairman & Chief Executive भ त स क प म ण उर यक व भ ग भ प न ब डयक GOVERNMENT OF INDIA DEPARTMENT OF ATOMIC ENERGY HEAVY WATER BOARD व क रम स भ ई भ न, अण शव नग, म बई Vikram Sarabhai Bhavan, Anushaktinagar, Mumbai Web site : Fax.: (022) / Direct Number: (022) ce@mum.hwb.gov.in MESSAGE With immense pleasure I am happy to know that NACE International Gateway India Section (NIGIS) s South Zone (SZ) Student Section is organizing the 5 th edition of International Corrosion Prevention Symposium for Research scholars (CORSYM 2018) along with NACE International Asia Pacific Area, NIGIS, Mumbai and IIT Madras during March 23-24, 2018 at IIT Madras, Chennai, India. After the success of first CORSYM held in 2013 at Chennai, 2 nd CORSYM at Mumbai (2014), 3 rd CORSYM again in Chennai (2015), and 4 th CORSYM at Kuala Lumpur, Malaysia (2017), 5 th edition is again held at Chennai. This annual event continues to serve as a platform for close interaction between research scholars, students, scientists and faculties all over the world to network, present research activities, and share ideas. The importance of CORSYM 2018 is evident from the overwhelming response of 109 abstracts being received and based on these, about 80 oral presentations and 30 poster presentations will be made. I am sure that the proposed sessions will be extremely useful to participating scholars to understand the future direction in the field of corrosion and prevention and related materials issues that will further provide guidance on their research activities. It s also my pleasure to welcome all the participants from countries including India, Malaysia, Germany, UK, etc. In the current era, research and development on corrosion resistant materials, know-how and technological additions to industrial sectors, including chemical, petrochemical, power, oil, refinery, fertilizers, etc. have become mandatory. The importance and growing success of corrosion research activities linked to the need to solve industrial corrosion problems are ever growing. Thereby, development of better and corrosion resistant materials, self-healing and newer protective coatings for the current materials, corrosion probes, online monitoring, etc. are some of the important steps towards realizing the benefits and minimizing corrosion-related failures. Research in the mitigation and management of corrosion is a continuing process. Similarly, academic research at universities/research institutes in close interaction with industry needs to play a significant role in developing innovative materials and corrosion control processes. Nevertheless, significant and advanced corrosion research is still the need of the hour to tailor material surfaces with improved stability and lifetime for designing better corrosion resistant materials exposed to highly aggressive and harsher environments. I wish all the delegates a pleasant and fruitful stay at Chennai and wish the event all the best and a grand success. [U. Kamachi Mudali] vii
9 viii 5 th CORSYM, Chennai, India, March 2018

10 Greetings to all participants of CORSYM 2018! On behalf of NACE International Gateway India Section, it is my great pleasure and honour to convey my best wishes for the success of this prestigious Conference 5 th International Corrosion Prevention Symposium for Research scholars (CORSYM 2018) to be held at the Indian Institute of Technology (IIT) Madras, Chennai, India during March 23-24, This is an important conference for students especially for research scholars which will provide an international platform to share their research findings in the area of corrosion and also provide a great opportunity for networking in furthering their research. It is hoped that the occasion is made use of to meet and share ideas with the Industry leaders, Academicians, Scientists, and Research Scholars and Students from around the world. I am sure that this conference will be a milestone in ensuring the highest standards. I, on behalf of the Section Governing Board, do convey our best wishes for the success of the Conference. N. Manohar Rao Chairman NIGIS ( ) ix
11 x 5 th CORSYM, Chennai, India, March 2018
12 xi 5 th CORSYM, Chennai, India, March 2018
13 xii 5 th CORSYM, Chennai, India, March 2018


14 Dear CORSYM 2018 Participants: The return of CORSYM to Chennai for the third time reflects the excellent work of the committee since the first event in CORSYM is unique in that there is no equivalent globally such as this where students get to present their work exclusively. A few words about NACE, - today NACE International is the world s largest corrosion society covering all aspects concerning corrosion. We are in our 75th year, with 36,000 corrosion professionals worldwide in 130 countries, represented by over 140 sections. Our mission is to equip society to protect people, assets and the environment from the adverse effects of corrosion. We accomplish this through our 4 main focus areas; The first are our standards and NACE is accredited by the American National Standards Institute (ANSI) which means its standard development procedures are approved and meet ANSI s and ISO s highest standards for transparency, openness and consensus. Our second focus is providing platforms for the corrosion professional to network and exchange ideas that lead to solutions in the work space. This is accomplished by hosting conferences, seminars and workshops, CORSYM being a perfect example. The third focus is through training and certification. We are at the forefront globally of aligning the certifications in line with ISO 17024, where we have moved to computer based testing. This is a radical change from paper based exams of the past and the results already indicate a much higher value for certifications from asset owners using this system. Our fourth major focus is public advocacy. Our members and staff work across the globe in getting the message across to policy and decision makers. Efforts are underway in several parts of the globe, including India, To give you all flavour of the new offerings from the NACE stable, let me mention three new developments. First, is the global rollout of the NIICAP program - NACE s Contractor accreditation program. Across the globe we are seeing great interest for this program. This program is unique from any other as it requires an on site audit of the contracting company on an annualised basis. Such a system provides confidence to facility owners when they have an accreted vendor executing contracts for them. The second is the acquisition of the Master Painter s Institute, a Vancouver based organisation that writes standards, lists coatings products and provides educational programs in the architectural coatings space. MPI is well known in North America and specified in the US and Canadian Government contracts and DoD contracts. In the near future, NACE will roll out xiii
15 MPI s products and services across the globe. With this acquisition NACE International covers the complete coatings space. The Third is IMPACT Plus which was launched in December last year and is a web based tool which allows organisations to bench mark themselves against their peers on their corrosion management systems and also identify where deficiencies exist or improvements can be made. With these new initiatives, we have significantly increased the offerings to the asset owners and professionals globally. All these efforts mentioned have taken place due to the efforts and dedication of the NACE members and staff globally. Further, one can see that NACE constantly strives to improve and provide more programs to society at large to tackle the issues concerning corrosion. We now look forward to you, our young leaders and students, to take this noble effort forward. Your presence at this event demonstrates your commitment and willingness to work towards NACE s goals. We also encourage you to participate in several of the opportunities that exist at NACE. Every year, the NACE Foundation distributes scholarships to students. This year, from India, NACE is providing four scholarships for students in Masters and Doctoral programs. In future, we hope to provide more scholarships and possibly extend this to post doctoral scholars as well. In addition to these programs there are many opportunities at NACE for the student or young professional. We strongly encourage to take advantage of these opportunities as you are the future leaders of our association. NACE member leaders and staff in India are here to help you. Please feel free to interact, ask questions and get the information you seek. We are here to serve you. I do hope that the three days will be fruitful for all of you and wish CORSYM the very best. Best wishes, Dr. Samir Degan, President - NACE ( ) xiv
16 PREFACE xv 5 th CORSYM, Chennai, India, March 2018 Premature corrosion of metallic components has been a major threat to many infrastructure systems such as highway bridges, buildings, public utility systems, offshore structures, gas & liquid transmission pipelines, waterways & ports, petroleum refineries, chemical plants, hazardous materials storage units, etc. In general, the cost of corrosion in most countries is estimated to be about 3 to 4% GDP. To minimize this cost, the scientific communities across the world have been engaged in developing the science and technology to enable us to develop strategies to prevent, control, and mitigate corrosion in various infrastructure systems. CORSYM - the international corrosion prevention symposium for research scholars - serves as a platform for young researchers to showcase their technical knowledge, research findings, creative thinking, and effective communication skills in generating innovative solutions for global corrosion issues. It also helps in networking with the current and future experts in the field and getting feedback and guidance on their scientific/technological adventures. CORSYM is an annual flagship event organized under the leadership of NACE International Gateway India Section (NIGIS), NACE East Asia Pacific Area (EAPA), and NACE International. The first CORSYM (in 2013) was held at Chennai, India and was organised by the NIGIS South Zone Student Section under the leadership of Dr. U. Kamachi Mudali, the founding Faculty Advisor of NIGIS South Zone Student Section, who proposed the idea of CORSYM. Subsequent CORSYMs were held in Mumbai (2014), Chennai (2015), and Kuala Lumpur, Malaysia (2017). The 5 th edition of CORSYM is jointly organized by the NIGIS South Zone Student Section and IIT Madras, and being held at IIT Madras. This book is privileged to have latest research findings covering a wide range of topics addressing the current and advanced research in the various areas of corrosion. There are 84 extended abstracts selected from a total submissions of about 109 abstracts from countries including India, Malaysia, Indonesia, Germany, and UK. These presentations cover the areas of Advanced materials and coatings, Corrosion of biomaterials and devices, Electro deposition and nanotechnology for corrosion control, Electrochemical testing techniques, Corrosion and inhibitors, Corrosion in concrete structures, Smart, organic, and inorganic coatings, and Corrosion of weld joints and hot corrosion. These extended abstracts presents the problem statements, knowledge gaps, and the state-of the-art solutions for various corrosion-related challenges faced by several sectors. It is anticipated that this book will help the readers, especially young researchers, to enrich their knowledge in corrosion prevention, control, and mitigation strategies for various sectors experiencing the threat of premature corrosion. We are extremely thankful to all the authors for their contribution towards this book. The volunteering work by the editorial team in reviewing/editing the submissions and designing/compiling this book is highly appreciated. It is my pleasure to thank the Student Organising Committee for their tireless efforts towards organising a successful CORSYM. I take immense pleasure in thanking Prof. U. Kamachi Mudali, who is the backbone of NIGIS South Zone and CORSYM, for his excellent advice and support. Also, the support in various
17 capacities extended by Dr. Rani P George, Mr. T.D. Sundarakshan, Dr. S. Rangarajan, Dr. T.M. Sridhar, Dr. N. Rajendran, Dr. Veerabadran, Dr. Haji Sheikh Mohammed, Dr. R. Venkatesan, Dr. Kamaraj, and Dr. Ravichandran and other executive committee members of NIGIS South Zone is highly appreciated. This event would not have been successful without the sincere support from the above as well as other NACE members from South Zone. I also thank the administrative support extended by the IIT Madras by allowing us to organize the event at the excellent facilities in the Industrial Consultancy and Sponsored Research (IC&SR) Building. Also, the support extended by the administrative units, especially by Prof. Ganesan, Registrar, at Anna University is highly appreciated. I thank Mr. Manohar Rao, Chair and the NIGIS Section Governing Board for the generous financial support towards organsing this CORSYM. Also, the financial support from Vector Corrosion Technologies, Ametek, Evergreen Technologies (India) Private Limited, Srinivasaka Enterprises, Moon Construction additives are highly appreciated. I thank Sricreeper Technologies for their excellent work on typesetting, printing, and publishing of the book. Finally, I thank Shri T.D. Sundarakshan, Manager, NIGIS SZ and all my student colleagues of NIGIS South Zone Student Section, who had put in tremendous efforts in making CORSYM 2018 a grand success. I anticipate that the CORSYM 2018 will be a win-win experience for all the stakeholders. Sincerely, Radhakrishna G. Pillai Chairman (CORSYM 2018) and Secretary (NIGIS South Zone, ) Associate Professor (Civil Engg.), IIT Madras xvi
18 Table of Contents 5 th CORSYM, Chennai, India, March 2018 ADVANCED MATERIALS AND COATINGS 1. The Corrosion Behavior of MgAZ91D+SIC Nano Composite in Canola Oil Biodiesel P Hariprasath, S Premkumar, S T Selvaman, M Vigneshwar & D Jayaperumal 2. Chemistry and Morphology of Oxide Products Formed on Reduced Activation Ferritic Martensitic and Grade 91 Steels During Atmospheric Exposure N Sreevidya, C R Das & Shaju K. Albert 3. Optimization of Cvd Silicon Carbide Interlayer for Plasma Sprayed Yttria on High Density Graphite for Pyrochemical Reprocessing B Madhura, Vetrivendan E, Ch. Jagadeeswara Rao, A Udayakumar & S Ningshen 4. Effect of End Group Modification of Novel Hyperbranched Polymers on Corrosion Inhibition and High-Performance Polyurethane-Urea Coating Properties Rajnish Kumar, Ramanuj Narayan & K V S N Raju 5. Effect of Strain Induced Martensite Reversal on the Corrosion Resistance and Degree of Sensitization of Cr-Mn Austenitic Stainless Steel Sourabh Shukla, Awanikumar P Patil & Vipin Tandon 6. Study of Flow Accelerated Corrosion on AZ91D Magnesium Alloy Used in Engine Radiator Thakur Ashish, Shashi Bhushan Arya & Ajmal T S 7. A Novel Hybrid Electropolymerised Composite Coating of Poly-2,5- Dimercapto-1,3,4-Thiadiazole/TiO2 on Copper for Corrosion Inhibition in 3.5% Nacl Medium K Vinothkumar & M G Sethuraman 8. Insights into Chemistry of High Temperature Oxide Scales, Grain Boundaries and Interfaces Ashok Vayyala, Ivan Povstugar, Dmitry Naumenko & Willem J Quadakkers 9. Effect of Aluminium s Layer Amount on Corrosion Resistance and Wear Resistance in the Coating Process of API 5l Grade B Steel Using Wire Arc Spray Method Agung Purniawan, Rangga Al Gifary Imanullah, Jordy Revanda Widardo Apcar & Siska Ayu Pratiwi xvii
19 10. Effect of Time Dip on Process Hot Dip Galvalum (Al55% -Zn-Si) to Adhesive Properties, Layer Thickness and Endurance of Corrosion in 580 Grade B Steel Fikri Muafa Syarif Alamudi, Aulya Fadilla Rachman, Febriana Puspitasari Waluyo & Agung Purniawan 11. Effect of Nozzle Spacing on Corrosion Resistance and Abrasion Resistance on Thermal Spray Process Aluminum Material API 5L Grade B Muhammad Naufal Prawironegoro, Muhammad Bagas Ananda, Rizkiy Amalia, Agung Purniawan & Ghafar Fahzrizal Aziz 12. Corrosion Behavior of Ni-based Coatings Deposited by Thermal Spray on Low Nickel Cr-Mn Stainless Steel Ankush S Marodkar, Ravindra V Taiwade & Himanshu Vashishtha 13. Electrochemical and Microstructure Properties of Pure SnZn and SnZn-Go Composite Coatings Rekha M Y, Anshul Kamboj & Chandan Srivastava 14. Antibacterial Efficacy of Graphene Oxide-Polyvinylpyrollidone Composite Coating on 316l Stainless Steel Geetisubhra Jena, B Anandkumar, S C Vanithakumari, R P George, U Kamachi Mudali & John Philip 15. High Corrosion Resistance Offered by Multi-Walled Carbon Nano Tubes Directly Grown over Mild Steel Sweety Arora, Rekha M Y, Abhay Gupta & Chandan Srivastava CORROSION OF BIOMATERIALS AND DEVICES 16. Electrochemical Migration Behavior on SAC305, SAC0307 and SAC P-0.005Ni Solder Alloy Paste in Simulated Body Fluid Sarveswaran Chandrasegaran, Emee Marina Salleh,A Jalar, Z Samsudin, M Yusuf Tura Ali& Norinsan Kamil Othman 17. Vancomycin Incorporated Chitosan/Gelatin Coatings Coupled with TiO2 SrHAP Surface Modified Cp-Titanium for Osteomyelitis Treatment D Nancy & N Rajendran 18. Corrosion Behaviour of Fluoride Conversion Coating on AZ31 Magnesium Alloy for Biomedical Applications K Saranya & N Rajendran 19. Anodization of AZ31 Magnesium Alloys to Improve Corrosion Resistance for Biomedical Applications M Kalaiyarasan & N Rajendran xviii
20 20. Electrochemical Behavior and Biocompatibility of Mixed Oxide Coated 316L SS for Biomedical Applications K Pradeep Premkumar & N Rajendran 21. Spray Pyrolysis Coating of Bioactive Glass/TiO2 Composite Coatings on CP- Ti For Load Bearing Osseointegration Applications P Bargavi, S Chitra, D Durgalakshmi, P Rajashree & S Balakumar 22. Fabrication of PANI/AgNPs Composite on Titania Nanotubes Arrays for Biomedical Applications P Agilan & N Rajendran 23. Design and Characterization of E-waste based Bio-composites for Biomedical applications Arun Raja A K, Kiran Bose A, Yogendar V & Vignesh K 24. Reduced Graphene Oxide (RGO)/PCL Composite Coating on Calcium Phosphate Coated Ti Nanotubes for Orthopaedic Implant Application S A Iynoon Jariya & K Ravichandran 25. Long Term Corrosion Behavior of YSZ Bioinert Ceramic Coatings in Artificial Saliva S Mohandoss, V Balasubramani, R Sasikumar, B Venkatachalapathy & T M Sridhar ELECTRODEPOSITION AND NANOTECHNOLOGY 26. One-step Electrodeposition of Sulfur and Platinum on Larger Area GDL for ORR: Materials and Methods K Lokesh, S Mohan, K Sahu & D Kalpana 27. Size-Dependent Anti-Microbial Response of Silver Nanoparticles for Anti- Fouling Applications in Marine Environment Y Raghupathy, K Karthiga Devi, K A Natarajan & C Srivastava 28. Hybrid Electro and Electroless Ni based Polymer (PVA) Composites on stainless steels for industrial applications H Usharani, T S N Sankaranarayanan & T M Sridhar 29. Improvement of Corrosion resistance of Mild steel with Pulsed Electrodeposited ZrO2 -TiO2 Nano composite coating Chitrada Prasad, Raffi Mohammed, K Srinivasarao & K Ramji 30. Enhanced Corrosion Resistance of PT Modified Polyaniline Coated on 316l SS as Metallic Bipolar Plates for PEM Fuel Cell Application K Sriram, Raman Vedarajan & N Rajalakshmi xix
21 31. Effect of Electrodeposition Techniques on the Performance of Platinum Electrocatalyst towards Methanol Oxidation Bincy George Abraham and Raghuram Chetty 32. High Corrosion Resistance Performance of Graphene- TiO2 Nanocomposite, Synthesized by a Green Route B. Niveditha Reddy, V N Ruchira, K S Aneesha, V Sumedha & C H Shilpa Chakra 33. Study and Synthesis of Nanoparticles in Antifouling Coatings for Preventing Microbially Induced Corrosion (MIC) K Yaduraj, M Vivek, Sruthy C Nair & Shijina ELECTROCHEMICAL TESTING TECHNIQUES 34. Effect of Corrosion on Bond Strength of Reinforced Concrete Element due to Impressed Voltage Sheetal Sahare & Bilavari Karkare 35. The Effect of Electrochemical Migration of Pb-free Sn 3.0Ag 0.5Cu Solder Reinforced by NiO Nanoparticles Fakhrul Rifdi Omar, Emee Marina Salleh, Norinsan Kamil Othman, Fakhrozi Che Ani & Zambri Samsudin 36. Performance Evaluation of Coated Rebar under Accelerated Corrosion using Electrochemical Techniques Shilpa Patil, Prafulkumarl Yenape & Bilavari Karkare 37. Effect of Cell Geometry on Electrochemical Measurements of Steel- Cementitious Systems Sripriya Rengaraju,Kokubo Wataru, Radhakrishna G. Pillai & Lakshman Neelakantan 38. Flow Accelerated Corrosion of API X70 Pipeline Steel in Oilfield Water T S Ajmal, Shashi Bhushan Arya & K Rajendra Udupa 39. Corrosion Investigation of Commercially Available Linepipe Steel in CO2 Environment Muhammad Haris, Saeid Kakooei & Mokhtar Che Ismail 40. Mechanistic Analysis of Ta Dissolution in Aqueous HFP P M Ranjith & S Ramanathan 41. A Low Energy Electrochemical Approach for Dual Waste Management Saranya Sriram, Raghuram Chetty & Indumathi Nambi xx
22 CORROSION AND INHIBITORS 42. Failure Analysis on Refinery Assets Amirul Haiqal Anif, Azmahani Sadikin & Azzura Ismail 43. Electrochemical Corrosion Studies of Oxides Formed on Carbon Steel in Presence of Metal Ions by Hydrothermal Method Sumathi Suresh, S Rangarajan & V Velmurugan 44. Corrosion Evaluation of Incoloy 800 in Octadecylamine Solutions Subrata Kuilya, Veena Subramanian, S Rangarajan & S Velmurugan 45. Evaluation of Corrosion Inhibition of Tetrabutylammonium Bromide for Mild Steel in 3.5%NaCl Medium N Subasree, J Arockia Selvi & M Arthanareeswari 46. The Effect of Leachable Chloride on Pitting Initiation of Austenitic Stainless Steel under Thermal Insulation: Case Study Prema Sivanathan 47. Zinc Free Pigment for Anti-Corrosive Coating J Nithyaa, K V Krishnapriya & K G Nishanth 48. Green Silicate-Based Corrosion Inhibitor from Rice Husk Ash as Anti- Corrosion for Carbon Steel Nadzirah Mohamad, Zulhusni Dasuki, Emee Marina Salleh & Norinsan Kamil Othman 49. Quantitative Structure-Property Relationships of Heterocyclic Organic Compounds as Corrosion Inhibitors of Steel Abhishek Agarwal, Pradeep Rathore, Vinay Jain & Beena Rai 50. Electrochemical and Surface Investigation of 3-Aminomethyl-5-Methyl- Hexanoic Acid as Effective Corrosion Inhibitor for Copper in 1.0 M HNO3 G Vengatesh & M Sundaravadivelu 51. Microwave-Assisted Synthesis of Chitosan Schiff Base as Green Corrosion Inhibitor for Mild Steel in Acid Chloride Medium: Electrochemical, SEM and DFT Studies Jiyaul Haque, Vandana Srivastava & M A Quraishi 52. Characterization of Thin Films Formed by Plasma Electrolytic Oxidation on Zircaloy-2 Sinu Chandran, H Subramanian, Veena Subramanian, S Rangarajan & S Velmurugan 53. Chitosan: A Green Corrosion Inhibitor for Mild Steel in 1M Sulphamic Acid Prathamesh G Joshi, M A Quraishi & V Srivastava xxi
23 CORROSION IN CONCRETE STRUCTURES 5 th CORSYM, Chennai, India, March Electrochemical Response and Service Life Estimation of Reinforced Concrete Structures with Fusion-Bonded-Epoxy-Coated Rebars Deepak K Kamde & Radhakrishna G Pillai 55. The Inhibition Effect of Several Inhibitors on Rebar in Saturated Calcium Hydroxide Solution with Reduced Alkalinity Rahul Khurana, Ashish Kumar Tiwari & Shweta Goyal 56. Corrosion Properties of High-Performance Fly Ash Lightweight Aggregate Concrete Manu S Nadesan & Dinakar Pasla 57. Effect of Corrosion Inhibitor on Corrosion Rate of Quenched and Self- Tempered (QST) Steel Embedded in Mortar Exposed to Chlorides P Sharmila, P Rajesh Kannan, Jayachandran Karuppanasamy & V Muthupandi 58. Industrial Application of Rubberised Sand Concrete for Corrosion Resistance Rijo C Andrews, Anaswara, J Akhil Raj, M Akhil Raj & A Fazil 59. Influence of Surface Modification & Surface Configuration of Steel Rebars on Flexural Performance of RCC Beams Ahmad Abdul Ahad, S Raghavendran & M S Haji Sheik Mohammed 60. Microbial Induced Corrosion in Concrete and its Preventive Measures (An Overview) Mohd Umar, M S Haji Sheik Mohammed, Naheetha Fathima & S Hemalatha 61. Determination of ph Threshold of Corrosion Initiation for Cementitious System with Supplementary Cementitious Materials Sundar Rathnarajan & Radhakrishna G Pillai 62. Reinforcement Corrosion Rate Measurement Using Linear Polarization Resistance Method Mohamad Zaitoun, Sultan Ahmad & Shamsad Ahmad 63. Pitting Corrosion Considering Effect of Temperature and Relative Humidity: Numerical Model Aditi Chauhan & Umesh Kumar Sharma 64. Effects of Corrosion on Seismic Behaviour Of RC Columns Aditya Singh Rajput & Umesh Kumar Sharma 65. Corrosion Behavior of OPC, PPC and PSC based Concretes in Harsh Marine Environment by Implying Electrochemical Impedance Spectroscopy Sharan Kumar, S B Arya & B B Das xxii
24 66. Electrochemical Studies for Establishing a Two-Stage Corrosion Arrest Process for Steel Reinforcement Nikita Rathod, Gamini Seneviratne, George Sergi & Peter Slater 67. Enhancement of Biodeterioration Resistance on Fly Ash Concrete Through Nanoparticles Inclusion for Marine Applications Sudha Uthaman, Vinita Vishwakarma, D Ramachandran, Rani P George, M Premila, Rajaraman & U Kamachi Mudali 68. Studies on High Performance Green Concrete Mortars with Enhanced Biofouling Resistance by Incorporating Nanoparticles and Inhibitor Manu Harilal, Sudha Uthaman, R P George, B Anandkumar, John Philip & U Kamachi Mudali 69. Comparitive Study on Strength Enhancement of Concrete Using Magnetic and Normal Water P Sivakumar, A Praveen Frank Tub & D Usharani 70. Analysis of Cathodic Protection Design Criteria for Embedded Steel Reinforcement in Prototype Structure Hirudayasamy Dolli, Andiappan Kavitha, Lily flora & Selvamani SMART, ORGANIC AND INORGANIC COATINGS 71. Superior Anticorrosive Properties in Epoxy Coating Through Waste Utilization Aparna Arun Agrawal, Shweta Yashwant Amrutkar, Aarti More & S T Mhaske 72. Effect of Silicon Oxide (SiO2) Powder Addition on Adhesion Strength, Corrosion Resistant and Abrasion Resistant of Epoxy Coating Radhovan Zanata, Hilmy Suryadinata, Alif Farrel Nayondra & Agung Purniawan 73. Development of Self-Healing Coating using polyurea-formaldehyde (PUF) Microcapsules Containing Sea Mango Oil as Healing Agent on Carbon Steel Nurul Nadiah Zulbakeriamerudin & Nor Roslina Rosli 74. Effect of Solvent Composition and Thickness of Epoxy Cat on Stickiness and Blistering on the NaCl Environment Applied to Carbon Steels Arfiansyah, Rizki Marcelino Sani, W Nindio Mahendra, Agung Purniawan & Maulana Mufti Muhammad 75. Synthesis, Characterization and Anticorrosion Studies of EPI/CuO Composites Coating Jeetendra Malav, Ramesh C Rathod & Suresh S Umare xxiii
25 76. Amino Acid-Functionalized Graphene Material as Corrosion Inhibitor on Mild Steel in 1M Sulphuric Acid Environment N Palaniappan, C Lal, K Balasubaramanian, I S Cole & Caballero-Brionesd 77. The Analysis of Effectiveness of Polyethylene and Polypropylene as the Top Coat on Three Layer Coating Method Against Corrosion Resistance of B- Grade API 5l Steel Deni Rizky Febrisal, Yoseph Lintong J Samosir, Alif Azizia Putri, Yosafat Sondang Marcellinus Siahaan & Agung Purniawan 78. Effect of Heavy Percentage in Al203, on Corrosion Resistance of Al Layers of Composite, on Magnesium by Powder Flame Spray Method Ellysda Aulya Santy, S T Agung Purniawan, Fikra Muhammad Iqbal, Aldi Megantara Arifin & Muhamad Rizqy Jafa WELDING AND HOT CORROSION 79. Effect of Welding Processes on the Intergranular Corrosion of Ultra Low Nickel Chromium Manganese Austenitic Stainless Steel Atul V Tidke, Sachin P Ambade, Awanikumar P Patil & Yogesh M Puri 80. Influence of Process Parameter for Joining Highly Stable AISI 409M FSS by Resistance Spot Welding S J Hariharan, S T Selvamani, K Shanmugam & V Balasubramanian 81. Mechanical Behavior of the Advanced CMT welded AA7075-T651 Grade Aluminum Alloy for Automotive Application S T Selvamani, P Govintarajan, M Ajaymohan, S J Hariharan& M Vigneshwar 82. Comparison on Mechanical and Metallurgical Properties of Friction Stir Welded and Advanced CMT Welded AA 7075 Aluminum Alloy Butt Joints S T Selvamani, P Govintarajan, M Ajaymohan, S J Hariharan &M Vigneshwar 83. A Study on Corrosion Sensitivity of Friction Stir Spot Welded Dissimilar Al/Cu Joints Siddharth Sampathkumar & T Senthilkumar 84. Welding and Corrosion Study of Ferritic Stainless Steel Weld Joint Prateek Shendre, Ravindra Taiwade & Jagesvar Verma 85. Oxidation and Corrosion Behaviour of Ni-based Amorphous Alloy in Nitric Acid Environment Chiranjit Poddar, J. Jayaraj and S. Ningshen xxiv
26 ADVANCED MATERIALS AND COATINGS 5 th CORSYM, Chennai, India, March 2018
27
28 The Corrosion Behavior of Mgaz91d+SIC Nano Composite in Canola Oil Biodiesel P.Hariprasath 1*, S.Premkumar 2,S.T.Selvaman 3,M.Vigneshwar 4,D.Jayaperumal 5 1 Department of Manufacturing Engineering, Annamalai University, Chidambaram, Tamilnadu, India. 2 Quest Global India Private Ltd, Bangalore, Karnataka, India 3 Department of Mechanical Engineering, Veltech Multitech Engineering college, Avadi, Chennai, Tamilnadu, India 5 Department of Mechanical Engineering, Vel Tech Dr.RR Dr.SR University, Avadi, Chennai, TN, India Corrosion and Materials Protection Division, Central Electrochemical Research Institute (CSIR), Karaikudi, Tamilnadu, India. *hariprasathp12mech@gmail.com Abstract In current scenario, the usage of green energy and advances of lightweight materials have significant role in automotive applications. The biodiesel is a promising alternate fuel for diesel to overcome the diesel paucity. But the corrosion and high susceptibility to oxidation are main concern associated to biodiesel compatibility issues, especially in automotive materials. Therefore, in this investigation, the canola oil biodiesel produced with less acidic value through transesterification reaction. Also with help of the emerging stir casting method, SiCNP reinforced magnesium Nano composite were produced without any defects. Using weight loss method, the magnesium Nano composite and its base metal was immersed in the produced biodiesel to understand its corrosion behavior. The immersion test was carried out at room temperature for 3600 hrs and it was observed that the corrosion rate of composite is drastically reduced up to 10% from its base metal because of the reinforcement of Nano particulate. Also, Total Acid Number (TAN) & FTIR analysis has been carried out. The surface morphology revealed a significant difference between biodiesel exposed magnesium Nano composites and its base metal. Keywords - Magnesium, Nano composite, Biodiesel, Corrosion, Surface study. 1 INTRODUCTION The biodiesel is a commercial alternative for fossil fuel due to its emission characteristics. The automobile and railway industries have increased usage of alternative fuels (Biodiesel) in order to overcome the deficiency. Meanwhile engine components in the same sectors were changed into composite materials to enhance its performance because corrosion and wear resistant properties are not satisfactory in non-ferrous materials like aluminum, magnesium [4]. Also the major concern in biodiesel reactivity of unsaturated hydrocarbon leads corrosion. By which usage of composite materials have create a new trend in material science and engineering as it gives a better mechanical property than base material. Fazal investigated the corrosion products of different types of automotive materials such as copper, brass, aluminum and cast iron upon exposure to diesel and palm biodiesel to identify the degradation of metal surfaces and found that, copper is the least resistant in biodiesel [1]. Li Jiang experimentally studied [2] the effect of palm biodiesel on corrosion properties of ASTM 1045 mild steel using static immersion tests. Haseeb investigated the comparative corrosion of light-weight metals such as aluminum and magnesium in palm biodiesel using immersion test [3]. To overcome the above problems, the composite materials were tested in the biodiesel to understand its characteristics. 2 RESEARCH SIGNIFICANCE The Mg-SIC Nano composite materials were fabricated by an emerging stir casting method and subsequently tested in the Canola oil biodiesel produced by transesterification method to understand the corrosion behavior; also to overcome the problem faced by the manufacturers in existing engines. 3 MATERIALS AND METHODS 3.1 Fabrication In this research, the magnesium alloy of MgAZ91D and SIC were used for produce Metal Matrix Nano Composite (MMNC) by stir casting method. The molten magnesium has reinforced with 2% Nano level SIC about 800 o C. 1

29 3.2 Preparation of biodiesel The biodiesel was prepared from canola oil with help of miniature biodiesel plant by transesterification method. The biodiesel has been produced with effective of process parameters of temperature, time, molar ratio, stir speed, alcohol content and catalyst concentration. The reaction temperature and time about 70 o C, 120 mins. The physiochemical properties biodiesel has yielded about 93% to diesel fuel. 3.3 Corrosion measurement The corrosion measurement has done by use of weight loss method, while the coupon has prepared with 15x15 mm square bar. The coupon has polished with SiC abrasive papers with varies grades. The specimen immersed with biodiesel in visible container at normal atmosphere for 150 days. After conducting the experiment, the coupon were cleaned with soft brush to remove corrosion products. Thus Weight of the coupon had calculated before and after conducting experiment and the corrosion rate of the MMNC specimen was calculated. biodiesel exposed metal reveals the formation of grey color layer in MMNC coupon. The color creation due to monocarboxylic acids presents in quantity of trace amounts which leads to corrosion. The fig.1 represents the secondary electron SEM image that shows the development of oxide layer in MMNC specimen surface, also the metal losses were identified. 5 CONCLUSION Mechanical properties of metal matrix Nano composite (MMNC) show the excellent difference between alloys. The yielding percentage of biodiesel about 85% by transesterification method. The corrosion rate of the magnesium composite coupon is mpy with time period of 3600 hr. The surface characteristics have been investigated with aid of SEM which shows the development of oxide layer in MMNC specimen surface 6 ACKNOWLEDGEMENTS The authors are grateful to the chancellor Dr. R. Rangarajan, Vel Tech Dr.RR and Dr.SR technical University, Avadi, Chennai, Tamilnadu, India for extending the facilities of material testing lab to carry out this investigation. We would also specially thank to the Department of Corrsoion Protection and Divsion, CECRI, Karaikudi for their guidance in the production of alternate fuels studies. Fig.1. SEM micrographs for MMNC 4 RESULTS AND DISCUSSION The produced stir casted metal matrix Nano composite were mechanically tested to identify its properties. The results shows that the Tensile strength has been increased to 12%, the Yield strength has been increased to 18% and the Hardness has been increased to 25% from its base metal. The extracted canola oil biodiesel properties were analyze by ASTM standards. The density and kinematic viscosity of biodiesel 3%, 22% less than base oil. Also the yield percentage of biodiesel was found to be 85%. The corrosion rate of biodiesel exposed MMNC coupon after time period of 3600 hr (150 days) is mpy (millions per year). The surface characteristics 7 REFERENCES [1] Fazal M.A., Haseeb A.S.M.A., Masjuki H.H., Degradation of automotive materials in palm biodiesel, Energy 40 (2012) [2] Dingfeng Jin, Xuehua Zhou, Panpan Wu, Li Jiang, Hongliang Ge Corrosion behavior of ASTM 1045 mild steel in palm biodiesel, Renewable energy 81 (2015) [3] K.V. Chew, Haseeb A.S.M.A., Masjuki H.H., Fazal M.A., Gupta M., Corrosion of magnesium and aluminum in palm biodiesel: A comparative evaluation, Energy 57(2013) [4] Luciana Cursarua, Gheorghe Branoiu, Ibrahim Ramadana, Florin Miculescub Degradation of automotive materials upon exposure to sunflower biodiesel, industrial crops and products 54 (2014)
30 Chemistry and Morphology of Oxide Products Formed on Reduced Activation Ferritic Martensitic and Grade 91 Steels During Atmospheric Exposure N. Sreevidya, C.R. Das, Shaju K Albert* Material Engineering Group, Indira Gandhi Centre for Atomic Research Kalpakkam, INDIA *shaju@igcar.gov.in Abstract Reduced Activation Ferritic Martensitic Steel (RAFMS), the candidate structural material for future fusion reactors is a generic version of P91 steel. Significant oxidation on RAFMS wire developed for welding of this steel was observed during storage making this wire almost unsuitable for continuous wire feeding during welding operation. Hence a detailed study was carried out to understand the oxidation behaviour of the steel by exposing it to atmosphere. Similar study was also conducted on P91 steel for comparison. SEM with EDS and EBSD techniques were used to characterise the oxide products. Most of the oxides were Fe and Cr based with W being present in the oxides of RAFMS and Mo in that of P91 steel. The difference in oxide chemistry seemed to affect the adherence and stability of the oxides formed and led to the faster corrosion rate in RAFMS compared P91. Keywords-RAFMS, P91 steel, Oxidation, SEM, EBSD. 1 INTRODUCTION RAFMS, one of the candidate structural materials for future fusion reactors is developed by replacing Mo and Nb with W and Ta respectively in widely used P91 steel and limiting elements that can produce radioactive isotopes in a reactor environment at very low levels. However, this steel appears to oxidize faster than P91 steel when exposed to open atmosphere. It is noticed that oxidation of RAFM filler wires developed for welding is so high that wire feeding is found to be difficult due to presence of oxides on the surface; but such difficulties are not encountered for P91 filler wires. Though information on oxidation behaviour of P91 steel and its variant P92 steel is available in open literature [1-3], similar information on recently developed RAFM steel is sparse. Hence, a comparative study on the oxidation behaviour of the two steels in open atmosphere was undertaken. This work presents the results from the oxidation studies carried out on RAFMS and P91 using different characterization techniques and discusses the possible reasons for the difference in the oxidation behaviour of these two steels. 2 MATERIALS AND METHODS RAFM steel and P91 steel plates in the normalized and tempered conditions of dimensions mm 3 were kept in open environment where temperature and humidity varied in the range 26 C-35 C and 50%- 80% respectively for a period of ~two year. The top surfaces of both the plates were examined. A confocal microscope was used to study the morphology, colour and distribution of the oxides and degradation on the surface after exposure. Specimens were examined insemfor detailed morphological analysis of the oxide films. Composition of the oxides were analysed using Energy Dispersive Spectrometer (EDS) attached with SEM. RAFMS and P91 specimens containing oxide layers were prepared using standard metallographic procedures for Electron Back Scattered Diffraction (EBSD) analysis and specific oxide phases grazing just above the surface of steel after all spallation were identified. For this purpose, the loose oxide films present on the surface were removed by grinding and polishing and only the oxides adherent to the substrate were subjected to diffraction. 3 RESULTS AND DISCUSSION Confocal 3D images of attacked locations of RAFMS and P91 steel showed pits and projections across the oxide film. Pits correspond to the spallation of oxide film whereas projection corresponds to oxide film formed on the original surface and retained without spallation. The maximum height corresponding to oxide layer on the surface is found to be ~12 µm in RAFMS and ~ 15 µm in P91. Maximum pit depths measured on RAFMS and P91steel were ~10 µm and ~5 µm respectivelyconfirming the poor oxidation resistance of former in comparison to that of P91 steel. However, in both the steels, the oxides are spreading over the surface gradually during which the oxide formed spalls off resulting in pits and continued oxidation of the newly formed pit surface resulting in continued degradation of the steel surfaces with time. SEM micrographs of oxidized surfaces of RAFMS and P91 steel at different magnifications after one year of atmospheric exposure is shown in Figure 1(a-h).Composition analysis of oxides in EDS is given in Figure 2. Figures 1(a) and (b) provide 3
 and (d) indicate the presence of mainly two types of oxides on the surfaces of both the steels; one with spherical particle morphology spread on the surface and other like continuous")
) as Fe rich while the one that is continuous turned out to be Cr. What is interesting is the presence of Cl in the Fe rich side.")
 of RAFM steeland these oxides also contain W, V and Ta (figure 1(h)).")
31 the full view of the attacked locations. Figures 1(c) and (d) indicate the presence of mainly two types of oxides on the surfaces of both the steels; one with spherical particle morphology spread on the surface and other like continuous film. A high magnification image covering both these oxides on RAFM steel surface is shown in Figure 2 along with EDS line scan taken across these oxides for various elements. These reveal the oxides with spherical morphologies (Figure 1(g)) as Fe rich while the one that is continuous turned out to be Cr. What is interesting is the presence of Cl in the Fe rich side. Figure 1(e) and (f) gives the idea that the oxide spallation is more in RAFMS than P91 steel; oxides seems to form a continuous layer on the surface of P91 steel except at the locations where chlorine was present.fine cracks were noticed in the continuous oxide films (rich in Cr) of RAFM steeland these oxides also contain W, V and Ta (figure 1(h)). This clearly shown by SE(topology contrast) and BE(Z contrast) images in Figure 3.The morphologies of the oxides observed on P91 steel is also similar, but the number of microcracks are much lessand Fe rich oxides with spherical shape is almost absent after two years of exposure. EDS area mapping carried out at lower magnification after two years of exposure revealed the presence of Fe, Cr, V, Si across oxide film with W rich oxide in RAFMS and Mo rich oxide in P91. Cl enriched areas also observed at isolated location. The major difference was the presence of W in RAFMS and that of Mo in P91. WO 2.96 with very less symmetry elements were the major phase of W which could be identified by EBSD in RAFMS. Figure 1.SEM micrographs ofthe oxidised surface of P91 and RAFMS ~after 1year of atmospheric Figure 2. Line scan showing the effect of chlorine on RAFM steel oxides ~ after 1 Year of atmospheric Exposure Figure 3. SE and (b) BE images for cracking of Cr/V rich oxide in presence of W and Ta rich particles (c) EDS spectrum on a point on white particle The misorientation varied much along a line of 150 μm length as shown in Figure 4 which indicates the ordering is low and this in turn indicates the stability of these oxide films, as they grow would be less. But the phase Mo 3O identified in P91is highly ordered which indicated better stability. Strain contouring map generated from the EBSD data indicated strain on oxide film of RAFM steel is much higher than the oxide films on P91 steel. Figure 4. (top) Phase map of W rich oxide on RAFMS and (bottom) Mo rich oxide on P91 with misorientation profile 4 CONCLUSION Results from the present studies confirm that oxidation resistance of RAFM steel is inferior to that of P91 steel especially in the presence of chloride ions in the atmosphere. Replacement of molybdenum in P91 with tungsten to form RAFM steel and the hence the difference in the chemistry of the oxides formed in both the steels is responsible for the differences observed in the oxidation resistance of the two steels. Presence of tungsten oxide in the oxide films of RAFM steel seems to increase the strain experienced by the film making it unstable and causing to spall off from the surface. 5 REFERENCES [1] Swaminathan S., Mallika C., Krishna N. G., Thinaharan C., Jayakumar T. and Mudali U. K. (2014), Corr. Sci. 79, pp [2] Ehlers J., Young D. J., Smaardijk E. J., Tyagi A. K., Penkalla H. J. Singheiser L. and Quadakkers W. J. (2006), Corr. Sci. 48, pp [3] Yin K., Qiu S., Tang R., Zhang Q. and Zhang L. (2009), J.Supercrit. Fluids.50, pp
32 Optimization of CVD Silicon Carbide Interlayer for Plasma Sprayed Yttria on High Density Graphite for Pyrochemical Reprocessing Madhura B. 1,2, E. Vetrivendan 1, Ch. Jagadeeswara Rao 1, A. Udayakumar 3 and S. Ningshen 1, * 1 Homi Bhabha National Institute, Mumbai , India 2 Corrosion Science and Technology Division, IGCAR, Kalpakkam , India 3 Materials Science Division, CSIR-National Aerospace Laboratories, Bangalore , India *ning@igcar.gov.in Abstract SiC coating offers very good oxidation protection for carbon materials up to 1600 C and provides thermal expansion coefficient value in between HDG and Yttria, it can be an ideal interlayer to enhance the operational temperature beyond 1500 C and durability of plasma sprayed yttria coating. Chemical Vapor Deposition (CVD) is industrially proven process for efficient deposition of dense SiC coating over HDG using methyl tri-chlorosilane (MTS) as precursor and hydrogen as carrier gas at temperatures 980 to C. The surface preparation of CVD SiC for subsequent yttria deposition by APS plays a crucial step in determining the adhesion and durability of the top coat. Optimization of the alumina grit blasting with respect to grits size and blasting pressure were attempted to minimize the SiC layer removal with good surface roughening. Attempts were even made to roughen the surface by chemical etching of SiC surface. The micro structure features SiC coating and phase analysis are carried out using SEM and XRD. The SiC coated samples after optimal grit blasting and chemical etching were deposited with yttia top coat by APS and subjected to thermal cycling at temperature >1450 C to study the improvement in durability of coatings. Keywords -Chemical Vapor Deposition, Silicon Carbide, Yttria, Plasma Spraying, Thermal Cycle. 1 INTRODUCTION High density Graphite (HDG) is extensively used as the crucible material for the cathode processing and consolidation of spent metallic fuel in pyrochemical reprocessing and U-Zr alloy melting. Since graphite is prone to severe oxidation in air at temperatures above 500 C as well as to limit the chemical interaction of molten uranium [1], protective oxidative cum chemical barrier coating is required on graphite crucibles. Ki Hwan Kim et al.[2]carried out series of uranium melt interaction of plasma sprayed HfN, ZrC, TiC and Y 2O 3 coatings in U-20% Zr alloy concluded that yttria offered better resistance to carbon contamination. By providing an intermediate carbide, oxidation resistance of graphite can be improved and thelayer act as a reaction barrier between graphite and yttria. Silicon Carbide (SiC) coating offers very good oxidationprotection for carbon materials up to 1600 C, due to formation of glassy SiO 2 film on the surface of the coating, which acts as a diffusion barrier for oxygen diffusing into the graphite substrate[3]. SiC interlayer also reduces the thermal expansion mismatch strain and thusenhances the operational temperature beyond 1500 C and durability of yttria coating. 2 RESEARCH SIGNIFICANCE The optimized surface preparation for yttria coating after development of SiC interlayer over HDG is less studied. APS coating stands only on mechanical interlocking of solidifying molten splat over the surface rather than chemical interaction or metallurgical bonding between substrate and coating material. Thus the surface preparation of SiC coated surface for subsequent yttria deposition by APS is a crucial step in determining the adhesion and durability of the top yttria coat. 3 MATERIALS AND METHODS The commercially available HDG rods of density 1.8 g/cc and dimension dia.25 mm and thickness10 mm were used as substrates. SiC interlayer was deposition by CVD technique using methyl tri-chlorosilane (MTS) as precursor and hydrogen as carrier gas at temperatures C and pressure 75 mbar. 3.1 Surface preparation Prior to yttria coating the sample surface was alumina grit blasted using 35 and 100 mesh alumina grits to create rough surface. Chemical etching of the surface was done using NaOH/KOH eutectic mixture molten saltetchant at temperature 550 C for 20 minutes. 5

 shows the surface modification after molten salt etching and cross section of yttria coating over etched surface. 4 RESULTS AND DISCUSSION 4.")
. Figure 1: SEM surface morphology of SiC interlayer over HDG The X-ray diffraction pattern corresponds to formation of β-sic over HDG by CVD process (fig. 2).")


 and very fine (100 mesh) alumina grit at minimum")
.")
33 3.2 Development of yttria top coating Commercially available thermal sprayable yttria powder (M/S Green resource South Korea) of particle size µm was used as the feedstock powder. The coated samples have tested for thermal cycling in high temperature tubular furnace at temperatures 1450, 1500, C under inert argon atmosphere. Another set of SiC coated samples were subjected to molten salt chemical etching using eutectic mixture of NaOH/KOH molten salt at 550 C for 20 minutes. The fig.4(a,b) shows the surface modification after molten salt etching and cross section of yttria coating over etched surface. 4 RESULTS AND DISCUSSION 4.1 Characterisation of SiC interlayer The SEM micrograph of the SiC surface reveal typical CVD microstructure with mushroom pattern type grown morphology with dense packing and uniform and smooth coverage of the HDG surface(fig.1). Figure 1: SEM surface morphology of SiC interlayer over HDG The X-ray diffraction pattern corresponds to formation of β-sic over HDG by CVD process (fig. 2). Figure 4: The SEM micrograph of (a) NaOH/KOH molten salt etched surface and (b) cross section after yttria coating 4.3 Thermal cycle analysis Thermal cycle durability of the SiC interlaid yttria coated samples at 1450, 1500 and 1550 C showed premature cracking and delamination in the yttria top coat (<4 thermal cycles) even after possible surface modification. The visual appearance of coating failure during thermal cycle studies is showed in fig.5. In case of grit blasting the brittle SiC interlayer is removed completely so the advantage of having developed SiC interlayer could not be realized.in case of molten salt surface etching the fine roughness produced is not sufficientenough tohave a strong mechanical interlocking of yttria top coat. Figure 2: XRD plot for SiC interlayer over HDG 4.2 Surface preparation and Yttria deposition The as prepared SiC coated HDG samples are subjected to grit blasting step using coarser (35 mesh) and very fine (100 mesh) alumina grit at minimum blasting pressure (1.5 bar). The surface micrograph of the grit blasted surface is shown in fig.3a, reveal absence of mushroom patterns and the cross section micrograph shown in fig.3b confirmed the complete removal of brittle SiC interlayer even with very minimal grit blasting pressure and fine alumina grit (100 mesh). Figure 5: Photographs of failure in the coatings during thermal cycling 5 CONCLUSION Though SiC is a potential interlayer material for plasma sprayed yttria top coat over HDG, the need for grit blasting or surface roughening for mechanical adhesion of any thermal spray coating removes the CVD grown brittle SiC layer. However the SiC interlayer laid on other uncoated yttria surface enhances the durability by limiting the high temperature oxidation of HDG. 6 REFERENCE Figure 3: SEM micrograph of (a) grit blasted SiC surface and (b) cross section micrograph after yttria coating [1] C.Jagadeeswara Rao, A. Ravi Shankar, C. Mallika, U.Kamachi. Mudali, 41 (2015) [2] K.H. Kim, C.T. Lee, C.B. Lee, R. Fielding, J. Kennedy, 519 (2011) [3] Y.-L. Zhang, H.-J. Li, Q.-G. Fu, K.-Z. Li, J. Wei, P.-Y. Wang, 201 (2006)
34 Effect of End Group Modification of Novel Hyperbranched Polymers on Corrosion Inhibition and High-Performance Polyurethane-Urea Coating Properties Rajnish Kumar 1,2, Ramanuj Narayan 1,2, and K. V. S. N. Raju 1,2 * 1 Polymers & Functional Materials Division, CSIR- Indian Institute of Chemical Technology, Hyderabad. 2 Academy for Scientific and Innovative Research, New Delhi. *rajnishkrsharma@yahoo.co.in Abstract Hyperbranched Polymers (HBPs) can be cheaply synthesized (one pot) for high solid functional coatings.we have designed and synthesized three novel HBPs and studied corrosion inhibition and polyurethane (PU)-urea coating properties. The study was unique in a way that the same HBP acted as both corrosion inhibitor and high performance PU resin. HB polyols were synthesized by solvent-free polycondensation reaction of A3 (N-core tribasic carboxylic acid) and B3/B2B* monomers withdob varying from 55% to 75%.Corrosion inhibition study of polymers with 0.1 N HCl has revealed 82 to 96 % efficiency for 25 to 250 ppm concentration based on weight loss, polarisation and impedance.moisture cured PU-ureas resulted in strong, tough and durable antimicrobial coating.coatings showed high Tg(130 o C), tensile (64 MPa) and onset thermal degradation (250 o C). Corrosion study was performed on mild steel coated panels (one year aged) by salt spray, polarisation and impedance. So, the material is highly anticorrosive, biocompatible with good thermomechanical properties. Keywords Nitrogen richhyperbranched polymer, Corrosion inhibitor, Polyurethane coating, Multifunctional and high performance. 1 INTRODUCTION Highly branched HBPs exhibit low viscosity at high molecular mass, globular shape and less chain entanglement, high solubility and multiple end groups which can be further modified to impart functionality [1]. Limited availability of AB n (n 2) type monomers have led to new synthetic methodologies such as A n+b m(n 2, m 3) which has been adopted for this work [1, 2]. PUs are one of the most versatile polymeric materials and widely used for industrial applications due to excellent corrosion and chemical resistance, good thermomechanical properties and biocompatibility [3]. TEA core and periphery based novel monomer and HBP were synthesized and their PU-urea based coating properties were studied by us as in [2]. With same core monomer, we developed two new HBPs with glycerol (GLY) and trimethylol propane (TMP) as periphery. These HBPs can act as corrosion inhibitor due long carbon chain, and electron rich heteroatom-n, multiple ester and hydroxyl groups and are readily soluble in water [4]. So, we designed the molecule in such a way that it acts both as inhibitor and high-performance PU coating. The synergistic effects of these two properties have greatly improved corrosion resistance and we believe that it is first of its kind report. 2 RESEARCH SIGNIFICANCE Our goal for this work was to design environment friendly HBPs which can exhibit multifunctional properties. We incorporated nitrogen atoms, long carbon chains and synthesized polyester polyols so that they can act as good corrosion inhibitor and form strong PU coating with direct metal adhesion. We also studied the effect of end group modification on the properties of HBPs and corresponding PU-ureas. HBPs play dual role of effective corrosion inhibition and barrier protection. 3 MATERIALS AND METHODS 3.1. HB polyester polyols were synthesized by solvent free melt polycondensation reaction of the tribasic ester, TESA (A 3), with TEA, TMP (B 3), andgly (B 2Bʹ) respectively in 1:3 molar ratios [2]. The temperature was maintained between o C and reactions were monitored based on acid values HB based NCO terminated PUs were formed by dropwise addition of H 12 MDI to the reaction mixture containing HBPs at 50 o C and the NCO:OH ratio was varied as 1.8:1, 1.6:1, and 1.4:1 and 1.2:1. The reaction was carried out at 70 o C for about 3 hours and finally the film was casted and allowed to moisture cure for about days. 4 RESULTS AND DISCUSSION HBPs were confirmed by FTIR, ESI-MS and NMR spectroscopy. Their DOB was calculated based on 7

35 Z'' (ohmcm 2 ) Current (macm -2 ) 5 th CORSYM, Chennai, India, March 2018 linear, terminal and dendritic peaks integration values in 13 C NMR spectra. TGA/DTG thermograms reveal two steps degradation: PU-urea at o C range and ester at about 400 o C. Viscoelastic behavior by DMTA (fig 1) and UTM reveal that storage modulus (E ), tensile and Tg increased regularly with increasing NCO/OH ratio. Storage Modulus (MPa) PGLY 1.4 PGLY 1.6 PGLY Temperature ( o C) Figure1: DMTA figures of HBPU-ureas Tg value varied from 101 to 122 o C and tensile from 36 to 64 MPa with increment in NCO content (table 1). Salt spray (750h, 5% NaCl) study shows no sign of corrosion as there is no blister or filiform corrosion. There is no corrosion at the cross-cut section which implies very good adhesion of coating to mild steel substrate (fig 2). Inhibition study of GLY and TEA based HBPs were done in 0.1 M HCl solution. Results are shown in figures 3 and 4 and table 2. SEM (fig 5) revealed polymer adsorption on metal surface and XRF showed that no iron chloride formed due to 12 h immersion in HCl. Fig 2: Salt spray of PU Tan Delta Storage Modulus (MPa) PTMP 1.4 PTMP 1.8 PGLY 1.4 PGLY Z' (ohm cm 2 ) Blank TEA 25 TEA 50 TEA 100 TEA Temperature ( o C) Fig 3(a): Tafel of TEA Fig 3(b): Imp for TEA Fig 4(a): Tafel for GLY Table 1: Thermo-mechanical and Tafel result of PUurea Sample Tg Corr. Tensile Abrasion (mg) ( o C) (mm/y) (MPa) PGLY x PGLY x PGLY x PTMP x PTMP x Current (macm -2 ) 0 1E-3 1E-4 1E-5 Blank TEA 25 TEA 50 TEA100 TEA 250 PTMP 1.4 PTMP 1.6 PTMP E-3 1E-4 1E-5 1E-6 Blank GLY25 GLY50 GLY100 GLY250 Voltage (V) Voltage (V) Tan Delta PTMP x The inhibition efficiency by various methods are listed in Table 2. Z'' (ohmcm 2 ) Fig 4(b): Imp of GLY Fig5:(a)Bare,(b)TEA),(c)GLY Table2: corrosion inhibition efficiency (%) in 0.1 N HCl Sample η (Tafel) η ( Imp.) η (wt. loss, 24h) TEA TEA TEA TEA GLY GLY GLY GLY CONCLUSION The present work describes environment friendly designed synthesis of HBPs and their PU-ureas for anticorrosion application. The design yielded in a polyol which is an efficient corrosion inhibitor and has ability to form high performance and biocompatible moisture cured PU coating. The synergistic effect lead to very good adhesion and improved corrosion resistance as observed by salt spray and other electrochemical tests. 6 ACKNOWLEDGEMENTS Authors thank Dr. CRK Rao, CSIR-IICT, Hyderabad and DST, Govt. of India, for INSPIRE fellowship. 7 REFERENCES Z' (ohm cm 2 ) Blank GLY 25 GLY50 GLY 100 GLY 250 [1] Caminade, A.M., Yan, D. and Smith, D.K. (2015), Dendrimers and hyperbranched polymers, Chemical Society Reviews, Vol. 44, pp [2] Kumar R., Narayan, R., Aminabhavi, T.M., and Raju K.V.S.N. (2014), Journal of Polymer Research, Vol. 21, pp. 547(1-16). [3] Chattopadhyay D.K., Raju K.V.S.N. (2007), Structural engineering of polyurethane coatings for high performance applications, Prog. in Polym. Sci, Vol. 32, pp [4] Saha, S.K., Dutta, A., Ghosh, P., Sukul, D. and Banerjee, P. (2015), Physical Chemistry Chemical Physics, Vol. 17, pp a b c 8
36 Effect of Strain Induced Martensite Reversal on Degree of Sensitization of Cr- Mn Austenitic Stainless Steel Sourabh Shukla 1 *, Awanikumar P. Patil 1 and VipinTandon 2 1,2 Department of Metallurgical and Materials Engineering, Visvesvaraya National Institute of Technology (VNIT), Nagpur *sourabhshukla9876@gmail.com Abstract In this study, the effect of degree of cold work (CW) and subsequent thermal ageing (TA) on the sensitization behaviour of metastable Cr-Mn ASS was investigated. Samples were cold worked (25% and 45%) and then thermal aged at different temperatures of 750 C and 900 C for 2 hrs. Microstructural study shows that with the increasing thermal ageing temperature, Strain induced martensite (SIM) undergoes reversal to austenite and is associated with grain refinement. XRD analysis has revealed that as cold work reduction increases, volume fraction of martensitealso increased and vice-versa in case of thermal ageing. Degree of sensitization (DOS) decreases with increasing thermal ageing temperature after cold work. Keywords DOS, Strain induced martensite, & cold work 1 INTRODUCTION Martensitic transformation induced by plastic deformation of metastable ASS is well known phenomenon [1] depending on steel composition and deformation conditions. During deformation of steels, ε- martensite and α-martensite formed. As deformation of steel increases, more α-martensite grows as it follows sequence of γ ε α, or γ α [2,3]. SIM which formed during deformation, can have unfavorable effect such as delayed cracking phenomenon of deep-drawn ASS component [4]. Therefore, SIM in metastable ASSs has been extensively studied mainly for practical reasons. On the other hand, details of SIM transformation during ageing of the deformed metastable ASS are less known. The aging causes reversal transformation of SIM, i.e., α γ. Due to this, grain refinement takes place which helps to increase the yield strength without impairing ductility of the material. Many studied has been done on the mechanical properties of steel due to martensitic reversal, but its effect on corrosion properties of ASS are less known. So, aim of this work is to show the effect of reverted austenite on the sensitization behavior of metastable ASSs. 2 RESEARCH SIGNIFICANCE ASS are subjected to different levels of cold work and heat treatment during the final manufacturing stages of component for numerous application in industry. Cold work might affect the corrosion resistance and also increases degree of sensitization of stainless steel. Therefore, properties of surface can improved by changing its microstructure as well as residual stress. So, it mainly involves cold working followed by heat treatment to results in grain refinement which helps to decrease the sensitization and increases the yield strength. 3 MATERIALS AND METHODS The Cr-Mnsample were solution annealed for 60 min at temperature 1050 C followed by 25% and 45% CW. Then these two sets of samples were TA at 750 C, and 900 C. For optical microstructure, samples were electrochemically etched in 10 wt % oxalic solution with 1A/cm 2 current density according to practice A, A262, ASTM. Specimens of mm were cut for X-Ray diffraction analysis. The diffraction pattern is carried out at room temperature (30 C) using a Cu target with Kα radiation.the DOS results obtained by using double loop electrochemical potentio-kinetic reactivation test (DL-EPR). The solution used for this test is 0.5 M H 2SO M NH 4SCN at room temperature. The ratio of reactivation current density and activation current density was calculated. Table 1. Chemical composition of studied base materials Materials Chemical composition (wt %) AISI C Ni Mn Si Cr P S Cr-Mn RESULTS AND DISCUSSION X-ray diffraction patterns after solutionannealing and the as-deformed samples are depicted in Fig. 2. Change in relative intensity of picks for both phases clearly shows that amount of α-martensite significantly 9
37 decreases with increasing ageing temperature. This confirms the results of reversal of strain induced martensite into austenite. During cold work, increase in dislocation density takes place. As we do TA, those dislocation started to form sub-grain boundary and results in recovery of austenite. As TA temperature increases, recrystallization of austenite takes place as shown in Fig.1 of 45% CW at 900 C. Fig.3 shows the DLEPR curve at different thermal ageing temperature. In table 3 after CW, we observed that at 750 C, highest DOS obtained and then it decreases at 900 C. During CW, large number of dislocations formed not only near grain boundary but also under the grains. Thus after thermal ageing, those dislocations becomes active and causes more carbides formation which results in increase in DOS.As microstructure of 750 C shows those dark spots which are the carbides formed inside the grains. But as TA temperature increases upto 900 C, dislocation density decreases which helps to form a new set of reverted austenite having low energy grain boundary. Due to this low energy, Cr will not be able to diffuse and hence, it decreases formation of Cr 23C 6 precipitation which results in decrease in DOS. 4.1 Microstructure Figure 1. Microstructure of CW samples at different TA temperature 4.2 XRD-45% AR % SA 750 C 900 C C 750 C Figure 2. XRD of CW sample at different TA temperature Table 2. Volume fraction of CW & TA samples SA 750 C 900 C 0% CW % CW % CW Degree of Sensitization 45% Fig 3. DOS of CW sample at different TA temperature Table 3. DOS of CW & TA samples SA 750 C 900 C 0% CW % CW % CW CONCLUSION XRD analysis revealed that the for AR cold work condition, volume fraction of strain induced martensite increased with increases in the cold work but after thermal ageing, it decreased with increase in ageing temperature. As cold work percentage increases from 25% to 45%, DOS increases for all thermal aged conditions. During thermal ageing at 45% cold work, it results in grain refinement which helps to decrease the DOS. 6 REFERENCES [1] Maksimova OP (1999) Martensite transformations: history and laws. Met Sci Heat Treat 41: [2] Fukuda Tet. al. (2006) Effect of high magnetic field and uniaxial stress at cryogenic temperatures on phase stability of some austenitic stainless steels. Mater Sci Eng A : [3] Das A et. al. (2008) Morphologies and characteristics of deformation induced martensite during tensile deformation of 304 LN2 stainless steel. Mater Sci Eng A 486: [4] Berrahmoune MRet. al. (2006) Delayed cracking in 301LN austenitic steel after deep drawing. Mater Sci Eng A :
38 Study of Flow Accelerated Corrosion on AZ91D Magnesium Alloy Used in Engine Radiator Thakur Ashish 1, Shashi Bhushan Arya 1* and T. S.Ajmal 1 1 Department of Metallurgical and Materials Engineering, National Institute of Technology Karnataka, Surathkal, Mangalore , India *sbarya@nitk.edu.in Engine radiators made up of AZ91D magnesium alloy for cooling internal combustion engine are prone to flow accelerated corrosion (FAC). An investigation was carried out to study the FAC of AZ91D magnesium alloy in a loop system. A synthetic test solution of engine coolant was prepared based on ASTM D , which circulates in the piping loop test rig. 20 electrodes were fixed at different angles of the elbow test section for the FAC study at a flow velocity of 3 m/s. The electrochemical characterization was carried out by potentiodynamic polarization tests. The study shows that the corrosion rate is more for the specimens kept at the inner wall of the elbow and less for the specimens kept at the outer wall. It also shows that the corrosion rate is increasing along the fluid flow direction in each column of electrodes. The electrochemical results show that corrosion rate was influenced by the hydrodynamic effect of the fluid flow. The SEM and EDS analysis were performed to analyze the corrosion products after FAC study. Keywords - Flow Accelerated Corrosion (FAC), Hydrodynamics, AZ91D magnesium alloy 1 INTRODUCTION Magnesium alloys have low density, high strengthto-weight ratio, and good mechanical properties. They replace aluminum alloys and steel used in theautomotive industry mainly in the cooling system of an engine block.the radiator, located at the front of the engine compartment of a vehicle, is a heat exchanger which cools the engine cooling water.the radiators are made of aluminum cores which have a density of 2.7 gm/cc and can be replaced by magnesium made cores having adensity of 1.8 gm/cc thus reducing the overall weight and increasing the efficiencyand moreover a reduction of the greenhouse gas CO 2 can be achieved [1]. The magnesium alloys are highly susceptible to corrosion. The hydrodynamic parameters of a flowing fluid also affect the corrosion behavior by influencing mass transfer process and removal of protective layer [2]. Therefore in this study flow accelerated corrosion (FAC)testwas performed on AZ91Dmagnesium alloy to understand the corrosion behavior in the elbow of a radiator tube in the corrosiveand flowing medium. 2 RESEARCH SIGNIFICANCE Three major methods for FAC study are rotating disk electrode (RDE) or rotating cylinder electrode (RCE) technique, impingement jet system and loop system [3]. In this study loop system is employed to understand the FAC on AZ91Dmagnesium alloy used in radiator tubes. This study will help the automobile designers and corrosion engineers. 3 MATERIALS AND METHODS The FAC test specimens were made up of commercially available AZ91Dmagnesium alloy. Twenty specimens with exposed area 5 5 mm were polished with emery papers and cleaned with acetone and dried.the test solution used is ASTM D1384 which is the standard solution specified by ASTM to study corrosion in engine coolants in thelaboratory. The test solution contains 148 mg/l Na 2SO 4, 165 mg/l NaCl and 138 mg/l NaHCO 3. The solution was made up in 40 liters of distilled water using analytical grade reagents. FAC test Figure 1. Schematic diagram of FAC loop test system and array electrodes test section was conducted using a loop system as shown in Figure 1. The velocity of fluid was maintained 3 m/s at room temperature and atmospheric pressure. Twenty electrodes were fixed at theinner wall of pipe elbowto conduct electrochemical tests. The internal surface of elbow and sample surfaces were at same level. A threeelectrode system was used to conduct electrochemical corrosion tests. The test specimen, a platinum plate, and a saturated calomel electrode (SCE) were used as the 11
39 working electrode (WE), the counter electrode (CE), and the reference electrode (RE) respectively.the Tafel extrapolations were performed at -250 to +250 mv (SCE) vs. OCP with a scan rate of 1 mv/s. 4 RESULTS AND DISCUSSION FAC test of AZ91Dmagnesium alloy was carried out using the electrochemical potentiodynamic polarization method in asynthetic test solution of engine coolant was prepared based on ASTM D at the flow velocity of 3 m/s in a loop system. The corrosion rates of the outer right wall electrodes at the points 1, 2, 3, and 4 are 614.1mpy, 552.9mpy, 433.1mpy and 448.7mpy respectively. The corrosion rates of the outer wall electrodes at the points 5, 6, 7, 8, and 9 are 556.4mpy, 774.9mpy, 547.2mpy, 437.5mpy, and 498.5mpy respectively. The corrosion rates of the outer left wall electrodes at the points 10, 11, 12, and 13 are 595.8mpy, 529.2mpy, 552.6mpy and 610.8mpy respectively. The corrosion rates of the inner left wall electrodes at the points 14, 15, and 16 are 450.8mpy, 452.9mpy and 693.3mpy respectively. The corrosion rate of the inner wall electrode at the point 17 is 508.1mpy. The corrosion rates of the inner right wall electrodes at the points 18, 19, and 20 are 590.3mpy, 526.2mpy and 587.8mpy respectively. The polarization curves for representative electrodes 1, 2, 3 and 4 are given in figure 1. Corrosion kinetics parameters such as corrosion potential (E corr), Tafel s slopes (β c and β a), corrosion current density (i corr) and corrosion rates of electrodes 1 and 2 are listed in Table 1. The results show that corrosion rate varies with respect to the position of the electrodes. It is due to the variation in the hydrodynamic parameters at different locations of the elbow. Even though the inlet velocity is constant at the elbow when the direction of the flow changes the hydrodynamic properties also changes. That is the reason for the variation in the corrosion rates at different locations of the same elbow. The corrosion rate is comparatively higher at inner wall side of the elbow than outer wall due to the higher hydrodynamic parameters. The corrosion rate increases along the fluid flow direction in the same column. From the SEM morphology, it is found that more loose products are present at the inner side of the elbow due to higher velocity and wall shear stresses.from EDS analysis it is found that primary elements contained in the corrosion products are O and Mg, with a trace amount of Al, Si, Zn, and C. It demonstrates that the major corrosion products are composed of magnesiumhydroxide. 5 CONCLUSION FAC study was carried out at the elbow of a loop system with multiple electrodes of AZ91Dmagnesium alloy by potentiodynamic polarization tests. From the results, it is clear that different electrodes placed at various locations of the elbow exhibit different corrosion rates. The corrosion rate is more at theinner wall of the elbow compared to the outer wall. It is due to the higher hydrodynamic parameters at inner wall compared to the outer wall. The corrosion rate increases along the fluid flow direction in the same column. It is also due to the increasing tendency of the hydrodynamic parameters like flow velocity and wall shear stresses along the flow direction. 6 ACKNOWLEDGEMENTS One of the authors, Mr. T. S. Ajmal would like to thank the Ministry of Human Resources Development (MHRD), Government of India, for the research fellowship. Figure 2. Polarization curves for electrode 1, 2, 3 and 4 in FAC condition Table 1. Fitted parameters and corrosion rates for the polarization curves of electrodes 1 and 2in FAC Electrode icorr (µa) βc (mv) SCE βa (mv) SCE Corrosion Rate (mpy) 7 REFERENCES [1] Blawert C., Hort N.,and Kainer K.U., (2004), Trans. Indian Inst. Met, Vol. 57(4), pp [2] Huang H., Zhang G., Yang J., Pan Z., and Guo X. (2015),, J. Chem., pp 1-8. [3] Zhang G. A., Zeng L., Huang H. L., and Guo X. P. (2013), Corros. Sci., Vol. 77, pp
40 A Novel Hybrid Electropolymerised Composite Coating of Poly-2,5- Dimercapto-1, 3, 4-Thiadiazole/Tio2 on Copper for Corrosion Inhibition in 3.5% NaCl Medium K. Vinothkumar, and M.G. Sethuraman * Department of Chemistry, The Gandhigram Rural Institute Deemed to be University, Gandhigram , Dindigul, Tamil Nadu, India *mgsethu@gmail.com Abstract- A novel hybrid composite coating of poly-2,5- dimercapto-1,3,4-thiadiazole (p-dmtd)/tio2was synthesized over copper metal using cyclic voltammetry and its corrosion inhibition ability in 3.5 % NaCl medium was evaluated. The electropolymerised composite film was duly characterised by Fourier transform infrared spectroscopy, X-ray photo electron spectroscopic analysis and Energy dispersive X-ray spectroscopy. X-ray diffraction analysis of polymeric composite revealed the presence of TiO2 in the polymeric matrix. Scanning electron microscopy was used to analyse the surface morphology of the polymeric composite films. The corrosion inhibition behaviour of polymeric and composite film was evaluated by electrochemical impedance spectroscopy and potentiodynamic polarization measurements. Impedance measurements showed that charge transfer resistance (Rct) was greater for polymeric composite film than the polymeric film. Similarly the current density (icorr) values of polymeric composite film were lower than the polymeric film. The enhanced corrosion resistance of polymeric composite could be due to the synergism between organic polymer and inorganic particles. Keywords- Electropolymerisation, 2,5-dimercapto-1,3,4- thiadiazole, TiO 2, Composite coating, Copper corrosion 1. INTRODUCTION Copper is a noble metal, which is widely used for many domestic and industrial applications in view of its high electrical and thermal conductivities and good mechanical workability. However it is susceptible to different forms of corrosion under aggressive environments especially when chloride ions are present[1]. Organic compounds containing π-system and hetero atoms such as O, N, S or P are well known corrosion inhibitors for copper as they facilitate the adsorption of these compounds on the metal surface [2]. Azole derivatives with N and S atoms are the potential candidates for the mitigation of copper corrosion. Electrodeposition of polymeric films over the metallic substrates is a preferred method for protecting metals from corrosiondue to various advantages including simplicity, rapidity and control over the film thickness [3]. In the present study, we have electropolymerised 2,5-dimercapto-1,3,4-thiadiazole (DMTD) and its TiO 2 composite over copper and investigated the corrosion inhibition ability of the polymeric and composite film by using electrochemical impedance spectroscopy and potentiodynamic polarization studies in 3.5% NaCl medium. 2. RESEARCH SIGNIFICANCE Corrosion is one of the important issues having direct impact on society. Especially the economic factor is one of the most important motivating factors for doing research in corrosion. The overall cost of metallic corrosion per annum is approximately 4.2 % of Gross National product (GNP). Therefore a new strategy need to be evolved to mitigate the metallic corrosion. The outcome of the present research work will lead to the prevention of loss due to corrosion. 3. MATERIALS AND METHODS The electropolymerisation of DMTD was carried out by continuously cycling the potential between -0.2 and 0.5 V at a scan rate of 10 mv s -1 using a standard three electrode system.pre-treated copper rod with 1cm 2 working area was used as working electrode. The corrosion inhibition ability of the modified copper electrode was evaluated by EIS and PDS studies. The EIS measurements were carried out with a frequency range of 0.1 Hz to 100 khz with an AC signal amplitude of 5 mv at open circuit potential (OCP). The potentiodynamic polarization curves for bare and modified copper electrodes were obtained by scanning in the potential range of -0.5 to 0.1 V vs SCE at a scan rate of 10 mv s -1 using the same electrochemical workstation. 4. RESULTS & DISCUSSION 4.1 Electropolymerisation of DMTD-TiO2 composite The cyclic voltammogram recorded for copper in monomer - free methanolic NaOH (inset) and 1 mm 13
41 DMTD + 1mM TiO 2 in methanolic NaOH are shown in Fig. 1. Figure.1 Cyclic voltammogram of DMTD+TiO 2 (100 cycles) and bare Cu (inset) The oxidation peak around 0.25 V was due to the oxidation of thiol group in the DMTD. The oxidation peak potential and the current density values decreased for the successive cycles. This shows the easier formation of polymeric composite film over the copper surface. 4.2 EIS & PDS studies From the Nyquist plots (Fig.2) it could be observed that the p-dmtd+tio 2 composite coated copper electrode has the greater charge transfer resistance compared to the bare and p-dmtd coated copper. This indicated that the formed polymeric composite inhibit the copper corrosion efficiently. The inhibition efficiency the polymeric composite was found to be 86 %. The corrosion current density for bare copper (42.84µA) was much higher than modified copper electrode. This showed that corrosion process of copper was inhibited by the formation of polymeric and its composite films. Further, the shift in E corr (Table 1) from -243 mv (bare Cu) to -283 mv (modified copper) revealed that the polymeric and its composite films protect the metal against cathodic corrosion. Figure.2 Nyquist plot for (a) bare Cu, (b) p-dmtd and p-dmtd+tio 2 composite coated copper electrode Table.1 Tafel parameters for bare cu, p-dmtd and p- DMTD+TiO 2 composite Electrodes I corr (µa cm- 2 ) 5. CONCLUSION The p-dmtd+tio 2 composite was electrochemically deposited over the copper electrode using cyclic voltammetry in a facile manner. The EIS and PDS studies revealed that the incorporation of TiO 2 into the polymeric matrix of p-dmtd significantly increased the protection of copper. 6. REFERENCES E corr (mv) [1] Tansug G., Tüken T., Giray E.S., Findikkiran G., Sigircik G., Demirkol O., Erbil M. (2014), A new corrosion inhibitor for copper protection, Corros. Sci. 84 (2014) [2] Ergun Ü.,EmregülK.C. (2014), Azole compounds as corrosion inhibitors: Part I, J. Mater. Eng. Perform. 23 (2014) [3] RajkumarG.,SethuramanM.G. (2015), Electrochemical synthesis of poly-3-amino-5- mercapto-1,2,4-triazole on copper and its protective effect in 3.5 % NaCl medium, Res. Chem. Intermed. 41 (2015) β a (V dec -1 ) β c (V dec -1 ) I.E (%) Bare Cu p-dmtd p-dmtd+tio
42 Insights into The Chemistry of High Temperature Oxide Scales, Grain Boundaries and Interfaces Ashok Vayyala* 1, Ivan Povstugar 1, Dmitry Naumenko 2 and W.J. Quadakkers 2 1 Central Institute for Engineering, Electronics and Analytics (ZEA-3), Forschungszentrum Jülich GmbH, Germany 2 Microstructure and Properties of Materials (IEK-2), Forschungszentrum Jülich GmbH, Germany *a.vayyala@fz-juelich.de Abstract High chromium ferritic steels such as Crofer 22 APU are being used as a construction material for interconnects in solid oxide electrolyser cell (SOEC). In the current investigation, isothermal oxidation behaviour of two ferritic steels (with and without Ti, La) at 800 C were studied in lowpo2 gas (Ar-H2-H2O) simulating service environments of SOEC. Thermogravimetric (TG) data were correlated with the results from microstructural analyses (SEM, TEM). Both alloys exhibited double-layered surface scales consisting of inner chromia and outer Cr,Mn-spinel with a thin layer of Nb rich oxide at the scale-alloy interface. Atom probe tomography (APT) was used for getting more insight into segregation processes in the oxide scale. Keywords - SOEC, Grain boundary, Interface, Segregation, Atom probe tomography. 1 INTRODUCTION In planar designs for Solid Oxide Fuel and Solid Oxide Electrolysis Cells (SOFC and SOEC) the components are assembled in flat stacks, with gases flowing through the spaces between ceramic cell and metallic inter-connects [1 7]. An interconnect thus provides the separation of the gas atmospheres, the electrical connection between the various single cells and it acts as current collector. In both mentioned Solid Oxide Cells (SOC), the interconnect is on one side subjected to an atmosphere with a high oxygen partial pressure (po2), commonly air. The atmosphere on the other side of the interconnect is a low- po2 gas whereby the composition may strongly vary depending on the actually envisaged process. A metallic material commonly used as construction material for interconnects in SOFC and SOEC is the ferritic steel Crofer 22 APU [7 10]. The steel contains a chromium level of approximately 22 wt. % to obtain the required long term oxidation resistance at the high service temperatures of typically C in combination with suitable workability and a low coefficient of thermal expansion (CTE) similar to that of the ceramic parts of the SOC. The steel composition was optimized to prevent the formation of electrically insulating scales of alumina and especially silica at the interface between steel and external, chromia based surface scale during high temperature service; this was achieved by limiting the concentrations of aluminum and silicon to very low levels. The material contains carefully controlled additions of manganese, titanium and lanthanum for improving oxide adherence and reducing the formation of volatile chromium species such as CrO 3 (g) and/or CrO 2(OH) 2(g) in high-po 2 gases. 2 RESEARCH SIGNIFICANCE The present paper presents first results of an ongoing study addressing the effect of alloying additions and test gases relevant to SOEC and SOFC stacks on the oxidation mechanisms of high chromium ferritic steels for the background of their application as interconnect materials. The paper addresses the mechanisms of internal and external scale formation on model ferritic steels containing Ti and La at 800 C in Ar-H 2-H 2O. Isothermal oxidation kinetics for the selected alloyswas measured continuously for 72 h using TG analyses. Scale formation and sub-surface depletion processes after oxidation were investigated by depth profiling using glow discharge optical emission spectroscopy (GD-OES) in conjunction with scanning and electron microscopy (SEM), X-ray diffraction (XRD) and laser Raman Spectroscopy (LRS). Segregation processes of alloying additions and impurities at scale grain boundaries and metal oxide interfaces were studied for a selected specimen using Atom Probe Tomography (APT). 3 MATERIALS AND METHODS The steel used in the tests was manufactured by Outokumpu/VDM using vacuum melting. An ingot of approximately 10 kg was cast and subsequently hot 15
 and hot gas extraction infrared absorption spectroscopy is shown in")
43 rolled down to sheets of 2 mm thickness. The detailed chemical compositions of the steel as determined by inductively coupled plasma optical emission spectroscopy (ICP OES) and hot gas extraction infrared absorption spectroscopy is shown in Table 1. Table 1. Chemical composition of the studied alloys Elements (at. %) Alloy 1 (no Ti & La) Alloy 2 (+ Ti + La) 4 RESULTS AND DISCUSSION Fe Cr Ti La Nb Mn Bal Bal Figure.1 shows surface morphologies (a, b) and metallographic cross sections (c, d) of the studied alloys after 72 hours isothermal oxidation at 800 C in low po 2 test gas. After low-po 2 exposure,majority of the surface is covered by oxide with blade- and needle-like morphologies whereas in few areas a more equiaxed morphology prevails. The metallographic cross sections reveal that the surface scales at least consist of two layers, exhibiting a void region at/near the interface between the two sub layers. Near spherical internal oxide particles are clearly apparent in the sub-surface zone of the alloy with Ti and La. The penetration depth of the internal oxidation is more pronounced in the alloy with Ti and La. APT was performed on the oxides scales formed on alloy 2 in order to understand the diffusion paths for various elements. Minor solutes such as Nb, Mn and Si were segregated at the grain boundaries of chromia whereas Ti appeared both interior and exterior of the chromia grains. Figure 1. Scanning electron micrographs of the two alloys used in the investigation. (a), (b): Surface morphologies and (c), (d): cross-sectional micrographs. 5 CONCLUSION Plate-like morphology and double-layer oxide structure were evident in both the alloys. TEM analysis showed that the chromia scale in alloy 1 (no Ti & La) has some incorporation of Mn-rich oxides which is not the case in alloy 2 (+Ti, +La). It is clearly evident from the results that the addition of Ti modifies the chemistry of chromia scale. APT analysis gave valuable insights on the segregation process of minor solutes at grain boundaries and interfaces. 6 ACKNOWLEDGEMENTS The authors acknowledge the colleagues from the Institute of Microstructure and Properties of Materials (IEK-2), Forschungszentrum Jülich for assistance with various measurements: Pawel Huczkowski (Raman Spectroscopy), Egbert Wessel (SEM and TEM), Mirko Ziegner (XRD), Timur Galiullin (GD-OES) and Heiko Cosler (TGA). 7 REFERENCES [1] W. J. Quadakkers, L. Niewolak, and P. J. Ennis, German Patent DE (2006). [2] W. J. Quadakkers, V. Shemet, and L. Singheiser, German Patent DE (2001). [3] P. Huczkowski, N. Christiansen, V. Shemet, J. Piron- Abellan, L. Singheiser, and W. J. Quadakkers, Journal of Fuel Cell Science and Technology 1, 30 (2004). [4] V. Shemet, J. Piron-Abellan, W. J. Quadakkers, and L. Singheiser, in Fuel Cell Technologies: State and Perspectives (Springer-Verlag, Berlin/Heidelberg, 2004), pp [5] R. Steinberger-Wilckens, L. Blum, H.-P. Buchkremer, S. Gross, L. (Bert) de Haart, K. Hilpert, H. Nabielek, W. (Jo) Quadakkers, U. Reisgen, R. W. Steinbrech, and F. Tietz, International Journal of Applied Ceramic Technology 3, 470 (2006). [6] L. Niewolak, D. J. Young, H. Hattendorf, L. Singheiser, and W. J. Quadakkers, Oxidation of Metals 82, 123 (2014). [7] W. J. Quadakkers, J. Piron-Abellan, V. Shemet, and L. Singheiser, Mater. High. Temp. 20, 115 (2003). [8] P. Kofstad and R. Bredesen, Solid State Ionics 52, 69 (1992). [9] J. Piron-Abellan, V. Shemet, F. Tietz, L. and Singheiser, and W. J. Quadakkers, in Proceedings of the Electrochemical Society (2001), pp [10] L. Niewolak, E. Wessel, L. Singheiser, and W. J. Quadakkers, Journal of Power Sources 195, 7600 (2010). 16
44 Effect of Aluminum s Layer Amount on Corrosion Resistance and Wear Resistance in the Coating Process of Api 5l Grade B Steel using Wire Arc Spray Method Jordy Revanda Widiardo Apcar 1, Siska Ayu Pratiwi 2, Rakaditya Pandu Waskito 1, Rangga Al Gifarry Imanullah 1 and Agung Purniawan *2 1 Department of Ocean Engineering, Institute Technology Sepuluh Nopember, Surabaya, Indonesia 2 Department of Industrial Chemical Engineering, Institute Technology Sepuluh Nopember, Surabaya, Indonesia * agung_pur@mat-eng.its.ac.id Abstract Corrosion is a problem that often arises in the use of carbon steel pipelines in oil and gas industry. Thermal spraying is one of the technique of coating engineering, by depositing particulates in liquid, semiliquid or solid form onto a substrate or into a group of processes in which the coating material is heated and driven as individual particles or droplets to a surface. Methodology used in this experiment were preparation of API 5L Grade B specimen, specimen coating with Wire Spray Aluminum method with variation of 6, 8, and 10 layer. The sealer application includes morphological observation, coating thickness measurement, corrosion resistance test, adherence test, and current rate test. Based on the test results and data analysis on layers 6, 8, and 10, the highest attachment value and the lowest wear rate for layer 6 were obtained. Layer 6 variables are most effective to be applied in the industry because it provides enough protection to prevent corrosion and have good wear resistance. Keywords - Corrosion, Wire Spray, API 5L, Layer 1 INTRODUCTION In the current petroleum and natural gas industry, carbon steel pipes are the most widely used type of pipe forpipeline system. Carbon steel pipes have many advantages compared to other types of pipes such as Fiberglass Reinforced Plastic (FRP), Stainless Steel (SS), and others. The advantages of carbon steel pipe are, among other things, the cost facets relatively inexpensive, easy installation in the field and its reliable mechanical properties in many areas or systems in the field. Problem that often arisesby the use of carbon steel pipe is corrosion [1]. In this research, thermal spraying coating method was used a solution against corrosion. Coating is a process of addition or accumulation of a material to a surface of another material (or the same material). The thermal energy used to melt the material coatings can be divided into two categories, namely electrical and flame heating. Where in this research of thermal energy to do thermal spraying comes from electrical source. Wire arc spray method was used in this research. During the process wire arc spray, first the material is initially heated until the state of the material becomes plastic or melted and given acceleration by the flow of pressurized gas to the substrate [2]. 2 RESEARCH SIGNIFICANCE Thermal spraying coating method was used a solution against corrosionin this research.this is a process of addition or accumulation of a material to a surface of another material (or the same material).this research was conducted to compare and analyze the effect of multilayer variation on strength value, bonding, abrasion resistance, and corrosion resistance in API steel 5L Grade B in seawater area. 3 MATERIALS AND METHODS The materials used in the study are- 1. API 5L Grade B steel 2. Aluminium wire 99,8% 3.1 API 5L Grade B Specimen Preparation Total of 18 specimens were cut with the specimen dimension of 100mm x 50mm x 3mm. The specimens are then cleaned and marketed by sandblasting method until it reaches SA 3 standard with its material abrasive type in the form of aluminum oxide sand. 3.2 Coating Process One wire of aluminum is flooded by a positive current, while the second wire of aluminum is flooded by a negative current. The two wire meet in the spray gun causing splashes and melting aluminum. Molten aluminum is exposed to pressurized gas which causes the splats of aluminum to be thrown from the spray gun and is deposited on the surface of the steel substrate. Three different variation in the coating process were used with the number of layers are 6, 8, and Testing 1. Morphology and Composition of Coatings Results. 17
 Gauge Elcometer. This tool measures the coating film thickness when it is dry. 3.")

45 Analysis of surface and coating morphology, coating layer thickness at cross section were investigated using Scanning Electron Microscope. The composition of the coating was observed using EDX. 2. Coating thickness Coating thickness is measured using DFT tool(dry Film Thickness) Gauge Elcometer. This tool measures the coating film thickness when it is dry. 3. The Power of Adhesion Coating against Substrate. Testing Pull off Bonding aims to analyzing the strength of adhesion between the coatings with the substrate. Pull-off Bonding is done by using the tool PosiTest AT-M Adhesion Tester with ASTM D-4541 standard. 4. Analysis of Corrosion Rate. This test aims to determine the rate of corrosion which occurs in carbon steel that has been coated with variations multilayer and aluminum coating material, on the media environment of 3.5% NaCl. The variation used is without layer, 6 layers, 8 layers, and 10 layers. Test duration performed for approximately 15 minutes per specimen with using a 3.5% NaCL solution with the polarization method potentiodinamic (tafel). 4 RESULTS AND DISCUSSION 4.1 Thickness Testing Thickness testing is used to determine the effect of changes in the extent of exposure to the number of layers in the coating process. Thickness testing using the DFT (Dry Film Thickness) Gauge Elcometer tool. In the 6 layer variable, the average thickness of the coating of 3 specimens is microns, the 8 layer variable is 1184 micron, and the 10 layer variable is micron. For comparison, measurement of thickness with used SEM is done in the cross-section area. Figure 1. The measurement of thickness using SEM on 6 layer, 8 layer, and 10 coating. 4.2 Sticky Power Test In the 6-layer variable, we get the nodes closecoating on the substrate of MPa; variable 8 layers has a fixed strength of MPa; and on variable 10layer, obtained by the low strength in the thirdvariable, the size of MPa. 4.3 Corrosion Resistance Corrosion resistance to every specimenobtained by measuring the analytical properties analyzed by using polarization potentiodynamics that occur in eachspecimen when in environmentnacl 3.5% (sea water). Onspecimens not coated coating, obtained rate valuecorrosion of mm/year; on 6 layersobtained corrosion rate of mm/year; on variable 8layer, obtained corrosion rate of mm/year; and onvariable 10 layer, has the smallest corrosion rate that is mm/year. 4.4 Wear Resistance Data of abrasion resistance value orthe wear resistance of the three variables analyzed withusing the Pin-on-disc Tribometer tool. The abrasion resistance of each specimen is obtained by measuring the wear rateoccurs in each specimen at a rotational speed of ± 250 diskrpm with mg / cm 2 / hr unity. On specimens with variables6 layer, the value of the wear rate is 5,21mg / cm 2 / hour; at variables8 layer the value of wear rate is 5.46 mg / cm 2 / hour; and 10 layers,have the most rapid rate of 5.71 mg / cm 2 / hour. 5 CONCLUSION Based on the test results and data analysis on layer 10 obtained the highest value of thickness and the lowest corrosion rate and at layer 6 obtained the highest attachment value and the lowest wear rate. It can be concluded that the layer 6 variable is the best because the fewer the number of layers the coating attachment to the higher the substrate. The layer 6 variable is also most effective to be applied in the industry because it provides good enough protection to prevent corrosion and have good wear resistance. 6 ACKNOWLEDGEMENTS We sincerely thank you to Mr. Agung Purniawan as Faculty Advisor for his guidance and encouragement in carrying out this project paper. And also to NACE SC ITS who has provided much information about CORSYM REFERENCES [1] Pawlowski, L The Science and Engineering of Thermal Spray Coatings Second Edition. London: John Wiley & Sons Ltd. [2] Rafferty, Kevin Geothermal District Piping-A Primer. Klamath Falls, Oregon : Geo Heat Center. [3] Schoop, M.U., dan Guenther, H Das Schoopsche Metallspritz-Verfahren. Stuttgart: Franckh-Verlag 18
46 Effect of Time Dip on Process Hot Dip Galvalum (Al55% -Zn-Si) To Adhesive Properties, Layer Thickness and Endurance of Corrosion In 580 Grade B Steel Fikri Muafa, Syarif Alamudi, Aulya Fadilla Rahman,Febriana Puspita Waluyo,and *Agung Purniawan Sepuluh Nopember Institute of Technology * agung_pur@mat-eng.its.ac.id Abstract - Requirements for each upholstery coating liner, its attachment, and capable of protecting the substrate. In this research we investigated the influence of dye time on the thickness, thickness, and corrosion resistance. The research was conducted by using API 5L Grade B substrate material coated with Al55% -Zn-1, 5% Si (Galvalum) alloy. The coating process was carried out by hot-dip method using time range 1, 5, 9, 13 minutes. The results of this study were then tested with OES, SEM, thickness (DFT), viscosity, corrosion and XRD test. From the research, the thickness and proximity of coatings is directly proportional to the duration of hot dip dip which has the highest value of each at 13-minute time. While for the corrosion rate is still a significant decrease in dipping time 5 minutes and after stagnant stable of mpy Keywords: Hot dip Al55% -Zn, galvalum, dye time, steel API 5L Grade B 1 INTRODUCTION In many industries corrosion is one of serious problem to reduce losses due to corrosion, a variety of corrosion protection methods are used, one of them using coating. In the application, coatings are the earliest protection for corrosion protection One of the longest used coating methods is the hot dip method, and hot dip galvanizing is one of the hot dip methods known for excellent coatings in significantly slowing corrosion rate even in seawater environments. Hot dip galvanizing using Zinc metal (Zn) as sacrificial anode for protection. Its applications are often used on pipes, plates and so on. Zn is used because its cell potential is lower than Fe. For this research, metal coatings used are Aluminum and Zinc alloy with Al55% - Zn composition or commonly called Galvalum. Aluminum is added because of its better protection from Zn. The advantages of aluminum sacrificial anode protection are longer reliability and better current characteristics and lighter weight compared to zinc alloy sacrificial anodes (Tsai, 1996). In addition, the formation of Aluminum oxide coating makes protection longer (Schweitzer, 2006). 2 RESEARCH SIGNIFICANCE Corrosion is one of the most problem To reduce losses due to corrosion, used coating and one of method is hot dip galvanizing. Zinc metal (Zn) as sacrificial anode for protection.. For this research, metal coatings used are Aluminum and Zinc alloy with Al55% -Zn composition or commonly called Galvalum. luminum is added because of its better protection from Zn 3 MATERIALS AND METHODS 3.1 Material and Experiment Equipment The materials required in conducting this experiment are as follows: 1. Ingot Aluminum 2. Ingot Zink (zinc) 3. Ingot alloy Al-10.5% Si 4. Steel API 5L Grade B and Experimental Equipment The tools required in conducting this experiment are as follows: 1. Furnace 2. SEM 3. Thickness meter 4. XRD 5. Digital balance 6. Adhesion Tester 7. Salt Spray Chamber 8. Crucible,The sample used is API 5L Grade B Sch 40 with size 5 cm x 4 cm x 0.3 cm 3.2 Procedure Experiment 1.) The initial preparation of the specimen aims to remove specimens from impurities such as rust, oxides, and oils attached to the surface so that the coating process can proceed well and deposit coating layers well. 2) Material Making 55% Al-Zn-1.5% SiMaterial making process 55% Al-Zn-1.5% Si with zinc ingot composition of grams, aluminum ingot of grams and Al- 10.5% Si allot ingot of 42.9 grams and then put into furnace to melt at temperature 800 o C 3) Immersing Process: The immersing process was carried out on a specified 5L Grade B API specimen in the preparation stage of the test specimen immersed in a liquid Al55% -Zn material at a temperature of 600oC with varying dye time, 60 seconds, 300 seconds, 540 seconds, and 780 secondsand further observations were made using OES, SEM, XRD, thickness test, attachment test, corrosion rate 19

47 4 RESULTS AND DISCUSSION 4.1 Visual and Micro Observations The physical differences between specimens that have not been experienced in the hot dip coating process, specimens are still gray or silver typical as metal. In contrast to specimens that have been dicoating a bright gray surface that is somewhat concentrated,micro observation To determine whether the deposited or not, the observations are made on the cross-section that presents the interface conditions between the coating and the substrate use Scanning Electron Microscopy (SEM) and optical microscopes. From Scanning Electron Microscopy (SEM) substrate deposited because at the interface between the coating and the substrate there is no cavity due to the formation of intermetallic compounds between galvalum and steel. for micro observation Figure 1.Cross Section interface analysis with from layer coating galvalum optical microscope is done to know the morphology at interface coating-substrate visible intermetallic layer in the form of black line divider between substrate with coating layer This intermetallic compound is a FeAl3 or Fe2Al5 compound whose growth is inhibited by Si T HI C K N E SS (m m) ThicknessTest testing of coating thickness is done to find out the change of coating thickness that happened due to variation of dye time the result of the dye TIME (s) time is directly proportional to the thickness of the thicker coating. This is Figure 2. variable chart vs thickness CorrosionTest Figure 3.variable Chart vs corrosion rate due to the coating alloy having sufficient time to form the deposit layer This is to determine the behavior / rate of corrosion in the affected layer on each specimen variable. Testing is done by salt spray method which refers to ASTM B117 the result between dye and corrosion rate is 20 directly proportional where if the dye time is getting lanu corrosion progressively slower This test is performed to determine the effect of dye time on the ability of coating to adhere to the substrate and the type of Figure 4.variable chart vs attachment attachment. Testing is done by using Pulloff method and referring to ASTM D-4541.the result from graphic is dye time still straight with higher coating attachment strength 5 CONCLUSION Hot dip galvalum research by varying the time of dip has been done to obtain experimental data. Generated data thickness and stickiness coating where the longer the dye then the thickness and attachment value becomes higher. From Adhesive test resulted the data in the form of cohesive failure on coating material / coating. In testing the corrosion rate obtained the longer the dye time, the smaller the corrosion rate that occurs. However, at the time of dip starting 5 minutes the corrosion rate obtained is relatively the same 6 ACKNOWLEDGEMENTS We thank Dr Agung Purniawan S.T, M. eng for guidance and also our collagues from Sepuluh Nopember Institute of Technologies who provided insight and also,we sincerely thank you to NACE ITS for the information about this paper competition 7 REFERENCES [1] ASM Metals Handbook Vol th Edition: Corrosion [2] ASM Metals Handbook: Desk Edition [3] ASTM International A 36: Standard Specification for Carbon Steel [4] Fontana, Mars G Corrosion Engineering 3 rd Edition. Ohio: Fontana Corrosion Center [5] Paunovich, et al Fundamental Consideration Modern Electroplating Fifth Edition. New Jersey, USA. JohnWiley & Sons [6] Schweitzer, Philip A Paint and Coating Applications and Corrosion Resistance. New York: Taylor & Francis [7] Yulianto, Sulis. et al Jurnal Teknik Mesin UMJ vol (2). [8] Paunovich, et al Fifth Edition. New Jersey, USA. JohnWiley & Sons. [9] Yulianto, Sulis. et al Mikro Baja Karbon Rendah. Jurnal Teknik Mesin UMJ vol (2).
48 Effect of Nozzle Spacing on Corrosion Resistance and Abrasion Resistance on Thermal Spray Process Aluminum Material API 5L Grade B Naufal Prawironegoro 1, Muhammad Bagas Ananda 1, Rizkiy Amalia 2, Agung Purniawan* 1, and Ghafar Fahrizal Aziz 1. 1 Departemen of Material Engineering, Institute Technology Sepuluh Nopember, Surabaya, Indonesia 2 Departemen of Environmental Engineering, Technology Sepuluh Nopember, Surabaya, Indonesia *agung_pur@mat-eng.its.ac.id Abstract Steel API 5L Grade B is a suitable material its application on oil pipeline. However, with the conditions the seawater environment required an appropriate corrosion control in steel is not easy to anticipate. System coating consist of two types, organic coating and metallic coating. Metallic coupling requires a more anode metal to protect steel. Aluminum is one suitable metal as coating or coating for steel due aluminum forms a passive layer as a steel protector on degree of acidity. This research analyze the effect of thermal nozzle distance variation aluminum spray against corrosion in oil production activities. This research analyze the effect of thermal nozzle distance variation aluminum spray against corrosion resistance and abrasive resistance on the sea water environment. The testing variables such as coating layer thickness, coating attachment, corrosion resistance, abrasion resistance, coating morphology testing were considered. The restriction of the problem of environmental influences is negligible, the process temperature is considered constant, the test specimens are considered homogeneous and flawless. Keywords Acidity, Coating, Layer, Nozzle. 1 INTRODUCTION Corrosion in pipe of oil production especially in the corrosive environment such as sea water is a common problem faced by oil company. With this condition, the material of pipe line should have high corrosion and abrasive resistance. API 5L Grade B is one of the material which applicable for pipe line in corrosive environment. But we also need to control the corrosion with another method which often used it is coating. Controlling the corrosion by providing a protective coating or coating is intended as a barrier or a barrier between the steel and the environment. As in [1] there are two types of coating systems or coatings: organic coatings and metallic coatings that use metals that are more reactive than the metals you want to protect. To protect metals from corrosive environments, Coatings can be applied. As in [2] organic coating and metals are used, have different properties and various uses. Generally, for both types of Coatings this is isolating metal from corrosive media. The main difference is that metal coatings are conductive, whereas organic Coating is not. 2 RESEARCH SIGNIFICANCE This research will analyze the effect of thermal nozzle distance variation aluminum spray against corrosion resistance and abrasive resistance on the sea water environment. This research also gives recommendation to related parties in handling of steel material of API 5L Grade B in oil piping applications in corrosive marine environments. 3 MATERIALS AND METHODS On this research will be conducted with research methods, namely the study of literature and experimental. There are several experiments conducted in this study are testing immersing, salt spray, water vapor permeability, adhesion, and SEM. This research used the material low carbon steel ASTM A36 Grade B, electrolytes, and material coating. 3.1 Type of testing conducted On this research, there are several procedures that must be performed there are, substrate preparation, preparation of an electrolyte ( an electrolyte used is 3.5% NaCl ), testing immerse ( to know the quality of the coating against electrolyte ), the salt spray testing ( to know the nature of the corrosion resistance of the layers of paint ), water vapor transmission rate testing ( to know the propagation of water vapor that passes through the layers of paint ), SEM testing ( to know the shape of the pore and its spread in the coating). 4 RESULTS AND DISCUSSION The specimen preparation aims to make the surface of the coarse substrate coating material so as to adhere. microns. Flatten the surface of the specimen by means of the grinding. 21

49 4.1 Visual Observation specimen after the aluminum thermal spray process. The preparation of test specimens was performed by cutting the specimen with dimensions of 50 mm x 100 mm x 3 mm. From visual observation it can be seen that the surface of the specimen is coated evenly by the coating material. The surface of the coated specimen has a good level of flatness, indicated by whether or not the surface of the specimen is open or uncoated by the coating material. On the specimen surface there is no pore. 4.2 Sticking Power Testing Tests of adhesion or adhesion are performed to determine how coatings can be attached to the surface of the substrate. This test is based on ASTM D-4541 standard. Dolly who had previously been given glue araldite then withdrawn using the tool Pull of Tester. This test is performed on three different points. that the coating thickness value increases, the value of the adhesive force decreases because with increasing thickness, the residual stress between the specimen and the coating material is increasing which will result in decreasing the adhesion force. on the stand and then rubbed on a high-speed scrubbing paper with a loading of 100 grams. The unit of abrasive rate or wear rate is mg / cm 2 / hr. Figure 2. Polarization Test Specimens 4.6 Coating Morphology Coating This test is performed to determine the morphology of the coating material. It is intended to know the spread of flat coating material or not and see the presence or absence of pores on the surface of the coating material. This test uses SEM (Scanning Electron Microscopy). surface coating with 100 mm range of fire has a more compact and rigid structure. It can be seen that the very low pore on the surface of the coating layer. This can be inferred from SEM imaging with the contrasting color of the one with the other. it is seen that the mechanical bond between the coating material and the surface of the substrate is well bonded and the surface of the coarse substrate as a result of the preparation process of the sand blasting specimen. 5 CONCLUSION Figure 1. Result of Latch Material Coating Tests 4.3 Thickness Testing Thickness testing is used to determine the effect of coating thickness change on the change of shot distance in the coating process. Thickness testing using DFT (Dry Film Thickness) that the farther the nozzle distance the coating layer thickness increases. From the thickness test results also found that the thickness of the coating layer evenly seen from the thickness value at three different points which shows the value that is not too different from one point to another point. 4.4 Corrosion Resistance Testing Tafel method was performed to determine the corrosion rate in 3.5% NaCl solution. The reference electrodes used are AgCl and Platinum as auxiliary electrodes. The result of the Tafel test is the Nova curve and the corrosion rate value of the material itself. It can be seen that the farther the nozzle distance the corrosion rate value decreases. This is proportional to the increasing value of coating thickness where the increase in coating thickness protects better specimens and longer wear life. 4.5 Testing of Abrasive Resistance This test is performed to determine the value of wear resistance in coating material. Coating material is placed After the analysis of test results, it can be taken a conclusion from this study. Here are the conclusions: The farther the nozzle distance the corrosion rate decreases because it has the thickest thickness. The lowest corrosion value at a distance of 300 mm nozzle with corrosion value of mm / year. The farther the nozzle distance the abrasive resistance decreases due to the decreasing of the sticking power value between the coating material and the substrate. The highest wear rates were found at 300 mm distance nozzle with 5.04 mg/cm 2 /hour. This leads to use a wire aluminum with a larger diameter to obtain a maximum thickness. 6 ACKNOWLEDGEMENTS We wish to express our sincere thankfor Dr. Agung Purniawan S.T., M. Eng. as Advisor for his guidance and encouragement in carrying out this project paper. We sincerely thank you to National Association Corrosion Engineer (NACE) ITS and Material Department Laboratory for information and administration. 7 REFERENCES [1] Trethewey, Kenneth R., Corrosion for student and engineer. (1991), Jakarta: PT. Gramedia Pustaka Utama [2] Egtvedt, Solveig. (2011), Trondheim: Norwegian University of Science and Technology 22
50 Corrosion Behaviour of Ni-based Coatings Deposited by Thermal Spray on Low Nickel Cr-Mn Stainless Steel Ankush S. Marodkar, Ravindra V. Taiwadeand Himanshu Vashishtha * Department of Metallurgical and Materials Engineering, V.N.I.T., Nagpur , India *marodkarankush3@gmail.com Abstract The low nickel Cr-Mn stainless steel of 200- grade is cheaper than 300-series steels as half of the Ni is replaced by the Manganese provides the same mechanical properties but has inferior corrosion resistance compared to 300-series. In the present work, low Nickel Cr-Mn ss was coated with Ni-based metallic powder (N-480 and N-611) by using spray and fuse thermal spray coating technique. The corrosion behaviour was investigated by potentiodynamic polarization test in 0.5 M H2SO4 and 3.5% NaCl solution before and after the coating. In both the test solutions, N-611 coating showed the better corrosion resistance as it contends Mo and More Cr than N-480. The Low nickel Cr-Mn stainless steel can be a costeffective alternative to replace widely used AISI 304 and AISI 316 austenitic stainless steels by employing coatings. Keywords Low nickel Cr-Mn ss, Corrosion behavior, Thermal spray coating, Pitting resistance environment. N. N. Khobragade et al. [5] studied the corrosion behavior of chrome manganese austenitic stainless steels and AISI 304 stainless steel in chloride environment. The polarization plots reveals that the corrosion current density of Cr Mn ASS is more than that of AISI 304 SS in Cl- free and Cl- containing solution. Also they concluded that Cr Mn ASS should not be used in situations when Cl- concentration is more than 100 ppm. However, research on metal powders coating by thermal spray on low Ni Cr-Mn ss has been insufficient. 2 RESEARCH SIGNIFICANCE This investigation indicated for the improvement in uniform and pitting corrosion resistance after coating. Hence Low nickel Cr-Mn stainless steel can be a costeffective alternative to replace widely used AISI 304 and AISI 316 austenitic stainless steels by employing coatings. 3 MATERIALS AND METHODS 1 INTRODUCTION Because of their excellent mechanical properties and corrosion resistance characteristics, 300-series stainless steel has wide application area. But from past few years, the use of low nickel Cr-Mn stainless steel of 200-grade has increased tremendously like in home appliances, light poles, construction, out-door installation etc[1-2]. As in Cr-Mn ss, Ni is replaced by Manganese to stabilize the austenitic phase,reduces itscorrosion resistance. These low-nickel stainless steels are economical than 300- series and are popularly known as chrome-manganese stainless steel (Cr Mn ss) [2]. Coating is one of the most economical way to enhance the corrosion resistance of material.thermal sprayed thick (from 50 to 3000 μm) coatings are more and more used in industry as they provide specific properties onto substrates which properties are very different from those of the sprayed coating [3]. D. Gopi et al.[4]studied the corrosion protection properties of poly(n-vinyl carbazole-coglycidyl methacrylate) coatings on low nickel stainless steel. This study reveals that Poly(N-Vc-co-GMA), prepared from equal mole ratio of N-Vc and GMA is most suited to protect low nickel stainless steel in acidic 3.1 Coating materials and their deposition Cr Mn ss were procured from the market in form of sheet (8 mm thick).here N-611 and N-480 Metallic powders coating were done by using spray and fuse thermal spray coating technique. Chemical composition of these steel and coating powders has given in Table 1. The spraying powders were used with a nominal size distribution of 45 to +90 μm. The powders were deposited on substrates with coating thickness of 420 μm. The substrate was grit blasted prior to deposition of the coatingat a pressure of 3 kg cm 2.using alumina grits with a size of μm..specimens of 10 mm x 10 mm size were cut by using electrolytic discharge cutting machine (EDM) from bare sheet and coated sheets. 3.2 Microstructure analysis The microstructure of base material was evaluated by using optical Microscope. The coated surfaces and cross section morphologies were evaluated using a scanning electron microscope (SEM) at high magnifications. The optical microstructures were observed after polarization test of bare and coated samples. 23

51 Table1: chemical composition Materials Chemical composition (wt. %) AISI C Mn Ni Cr Mo Fe Si Cr-Mn ss N N Electrochemical corrosion test The tests were done in two types of solutions that are 0.5M H 2SO 4 and 3.5% NaCl solution. 4 RESULTS AND DISCUSSION The electrochemical behaviour of bare and coated samples was investigated by potentiodynamic polarization curve in 0.5M H 2SO 4and 3.5% NaCl solution. In acidic solution, the passivation is accompanied with strong dissolution. Coating create the physical barrier between the substrate and solution provides the better passivation as shown in Figure1(a).The optical micrographs of uncoated and coated samples after polarization test in 3.5% NaCl has shown in Fig 2, indicates a significant difference between the uncoated and coated surface. As shown in fig 2, the surface dissolution and pit formation of base material is much more as compared to coated surface. The sustainability of coated samples in 3.5% NaCl solution was confirmed by potentiodynamic polarization graph as given in figure 1(b). The fitted result of polarization plot has given in table 2. In Both the solution, after application of coating, i corrvalue decreases, indicates that the reduction in surface dissolution in both the solution. Also conform by potentiodynamic polarization plot. From both the coatings, the N-611 coating give the better corrosion protection as it content Mo and more amount of Cr. Figure2: Potentiodynamic polarization plots in (a) 0.5M H 2SO 4 Solution (b) 3.5% NaCl solution Table 2:Fitted results of polarization curve in fig 1 Sample βa (mv) βc (mv) icorr (μamp/cm 2 ) Ecorr (Volts) 0.5M H2SO4 Solution Cr-Mn SS N N % NaCl Solution Cr-Mn SS N N Figure 2: Optical Micrograph (100X) after Potentiodynamic polarization in 3.5% NaCl solution, (a) Cr-Mn ss, (b) Sample coated with N-480, (c) Sample coated with N CONCLUSION 1. Polarization plot reveals that corrosion current density of bare Cr-Mn ss is more than that of coated in both the solution and this attributed to less Cr and Ni content. 2. From the optical microscopy of specimen soon after PD test, it is found that size of pits and its number is more in Cr-Mn ss than coated samples. 3. From both the coating, corrosion resistance is higher in N-611 coated samples. 6 ACKNOWLEDGEMENTS The authors would like to thank Director Dr. N. S. Chaudhari, VNIT Nagpur for providing the necessary facilities and for his constant encouragement for this work. 7 REFERENCES [1] Taiwade R. V.,Shukla R.,Vashishtha H., Ingle A. V.and Dayal R. K. (2013), Vol. 53, pp [2] Vashishtha H., Taiwade R. V.,Khatirkar R. K., Ingle A. V.and Dayal R. K.(2014), ISIJ International, Vol. 54, pp [3] Fauchais P. and Vardelle A. (2012), Thermal Sprayed Coatings Used Against Corrosion and Corrosive Wear [4] SáBrito V.R.S.,Bastos I.N., Costa H.R.M. (2012), Materials and design, Vol. 41, pp [5] Khobragade N. N., Khan M. I., Patil A. P.(2014) Trans Indian Inst Met,Vol. 67, p.p
52 Electrochemical and Microstructure Properties Of Pure Snzn And Snzn-GO Composite Coatings Rekha M Y 1, Anshul Kamboj 2 andchandan Srivastava 1* 1 Department of Materials Engineering, IISc Bangalore 2 Department of Metallurgical and Materials Engineering, IIT Roorkee *csrivastava@materials.iisc.ernet.in Abstract The role graphene-oxide (GO) in enhancing the corrosion resistant property of SnZn- GO composite coatings as compared to pure SnZn coatings has been demonstrated. Pure SnZn and SnZn-GO composite coatings were electrodeposited over mild steel substrate. GO was synthesized by Hummers method. The amount of GO in the electrolytic bath was varied to produce the coatings with four different concentrations of GO. SEM morphological characterization revealed the enhancement of smoothness and compactness of the coatings with increase in the addition of GO. Increase in the GO addition enhances the corrosion resistance property of the SnZn-GO composite coatings when compared to SnZn coatings. This was revealed from Tafel polarization and impedance spectroscopy analysis. TEM investigation revealed the large-scale segregation of Zn-rich and Sn-rich phases in pure SnZn coatings. However, the uniform distribution of Zn phase in Sn-rich matrix was observed in SnZn-GO coating. This distribution causes the formation of ZnO corrosion product yielding better corrosion resistance for the SnZn-GO coatings as compared to pure SnZn coating. Keywords SnZn coatings, Graphene-Oxide, Electrodeposition, Corrosion. 1 INTRODUCTION In recent years, potential of GO as corrosion resistant coating material has been successfully illustrated by the researchers [1]. This is essentiallydue to its high chemical inertness and its high resistance to permeation of corrosive fluids [2]. Application of only GO sheet for corrosion protection, however, is impractical due to limitations such as: (a) high cost and technical challenges associated with the continuous production of large area GO sheets with minimal defects, (b) transfer of these sheets to a foreign surface and (b) problems associated with the reliable adhesion of the transferred GO sheet on to the foreign surface under service conditions. One other way by which GO can be employed for corrosion protection of engineering materials is to incorporate it in the already used metallic coatings to produce metal-go composite coatings. Incorporation of GO into such coatings will enhance the corrosion resistance property of the coatings. Which in turn will facilitate the use of relatively much thinner composite coatings when compared to the thickness of the only metal coatings. Decrease in the coating thickness will desirably reduce the material cost and also the weight of the coated components. Published reports have illustrated that graphene-metal composite coatings exhibit greater corrosion resistance as compared to pure metal coatings [3]. This work focuses on one widely used coating material that is SnZn. This work specifically illustrates the role of GO in enhancing the corrosion resistant property of SnZn-GO composite coating as compared to pure SnZn coating deposited on mild steel substrate. 2 EXPERIMENTAL PROCEDURE 2.1 Synthesis of GO GO was synthesized by the modified Hummer's method [4]. 75 ml of concentrated H 2 SO 4 was poured into a beaker containing 2 g of graphite powder and 2 g of NaNO 3. 6 g of KMnO 4 was then added slowly into this reaction mixture under constant stirring. Temperature of the reaction mixture was kept below 5 C. After 24 h of stirring, the temperature of reaction mixture was increased first to 35 C and then to 95 C. After 15min once it reaches to room temperature, a mixture of de-ionized (DI) water and 30% H 2 O 2 was added slowly into the reaction mixture. In order to obtain a stable dispersion of GO in DI water, the reaction mixture was diluted several times. 2.2 Electrodeposition of the coatings SnZn coating and SnZn-GO composite coatings with four different concentrations of GO was electrodeposited on mild steel substrate using a DC power source. Mild steel plate and Zinc plate were used as cathode and anode respectively. The plating bath for pure SnZn coating contained 20g/l of SnSO 4, 20g/l of ZnSO 4.7H 2 O, 140g/l of C 6 H 11 NaO 7, 20g/l of C 2 H 3 NaO 2 and 0.5g/l SLS. For four different addition of SnZn-GO coatings, 0.125g/l, 0.25g/l, 0.357g/l and 0.5g/l of GO was added in the electrolyte solution. The ph of the electrolyte was maintained at 4.5. The current density of 6.25mA/cm 2 applied for 20min. GO present in the electrolyte was uniformly dispersed by sonication for ~10 h. The electrodeposition was carried out at the room temperature. In all cases the plating solution was 25
. The C1s was deconvoluted into three distinct peaks at C-C (284.4 ev), C-O (286.5 ev) and C=O (287.9 ev). This clearly indicated a considerable degree of oxidation of graphite into GO [5].")
 C1s XPS spectrum (b) TEM bright field image of GO Representative SEM micrographs of SnZn and SnZn-GO (SnZn-GO1, SnZn-GO2, SnZn-GO3 and SnZn-GO4) composite coatings were shown in Figure. 2.")
53 stirred mechanically throughout the deposition process. 3 RESULTS AND DISCUSSION As-synthesized GO was characterized by XPS and TEM techniques. The C1s XPS spectra obtained from GO is shown in Figure. 1(a). The C1s was deconvoluted into three distinct peaks at C-C (284.4 ev), C-O (286.5 ev) and C=O (287.9 ev). This clearly indicated a considerable degree of oxidation of graphite into GO [5]. The representative TEM bright field image of GO sheet is shown in Figure. 1(b). Figure.3. (a) C1s XPS spectrum (b) TEM bright field image of GO Representative SEM micrographs of SnZn and SnZn-GO (SnZn-GO1, SnZn-GO2, SnZn-GO3 and SnZn-GO4) composite coatings were shown in Figure. 2. All the coatings exhibit uniform morphology and the smoothness and the compactness of the coatings increases with increase in the addition of GO in the SnZn coating. µa cm -2, µa cm -2, µa cm -2, µa cm -2 and 19.31µA cm -2 respectively and the corrosion rate values are 104, 72.15, 66.47, and 31.5 mil/year/cm -2 respectively. The increase in the E corr values and the decrease in the I corr and CR values illustrates the inertness of the SnZn-GO composite coatings when compared to pure SnZn coatings. Therefore, the corrosion resistance of the SnZn-GO1 composite coating and further in SnZn-GO2, SnZn- GO3 and SnZn-GO4 composite coatings increases with increase in the addition of GO content in the respective composite coatings. 4 CONCLUSION It is illustrated in this work that the addition of different amount of GO into the SnZn coatings produces uniform morphology in all the composite coatings. The smoothness and compactness of the coatings increases with the increase in the addition of GO in the SnZn coatings. The electrochemical studies revealed that the with increase in the addition of GO increased the corrosion resistance of the SnZn-GO composite coatings when compared to pure SnZn coating. 5 REFERENCES [1] Prasai. D., Tuberquia. J.C., Harl. R. R., Jennings. G.K. and Bolotin. K. I., Graphene: corrosion inhibiting coating, ACS Nano, Vol. 6(2), pp [2] Tanugi. D. C. and Grossman. J.C., Mechanical strength of Nanoporous graphene as a desalination membrane, Nano Lett., Vol. 14(11), pp [3] Punith Kumar. M. K., Singh. M. P. and Srivastava. C., Electrochemical behavior of Zn-graphene composite coatings, RSC Adv., Vol. 5, pp [4] Marcano. D.C., Kosynkin. D. V., Berlin. J. M., Sinitskii. A., Sun. Z., Slesarev. A., Alemany. L. B., Lu. W. and Tour. J. M., Improved synthesis of graphene oxide, ACS Nano, Vol 4 (8), pp [5] Dreyer. D. R., Park. S, Bielawski. C. W and Ruoff. R. S., The chemistry of graphene oxide, Chem. Soc. Rev., Vol 39, pp Figure.4. Representative SEM micrograph of SnZn, SnZn-GO1, SnZn-GO2, SnZn-GO3 and SnZn-GO4 composite coatings. Electrochemical corrosion analysis was performed for SnZn coating and SnZn-GO composite coatings in 3.5% NaCl solution at the room temperature. The corrosion parameters: corrosion potential (E corr), corrosion current (I corr) and corrosion rate (CR) for the coatings were obtained from the Tafel polarization curves. The SnZn coating and SnZn-GO1, SnZn-GO2, SnZn-GO3 and SnZn-GO4 composite coatings E corr values obtained were , , , and V respectively, I corr values obtained were
54 Antibacterial Efficacy of Graphene Oxide-Polyvinylpyrollidone Composite Coating on 316L Stainless Steel Geetisubhra Jena 1, 2, B. Anandkumar 1, S.C. Vanithakumari 1, R P. George 1, *, U. Kamachi Mudali 3, John Philip 1, 2 1 Corrosion Science and Technology Division, IGCAR, Kalpakkam, India 2 Homi Bhabha National Institute, Mumbai, India 3 Heavy Water Board, Mumbai, India *rpg1961@gmail.com Abstract In this work, electrophoretic deposition (EPD) technique was used to coat graphene oxide (GO) /Polyvinylpyrollidone (PVP) composite onto 316L stainless steel (SS). The morphology and chemical composition of GO/PVP composite coating were characterized using Field emission Scanning Electron Microscopy (FESEM), X-ray Photoelectron spectroscopy (XPS), Attenuated total reflectance infrared (ATR-IR) spectroscopy and Raman spectroscopy. The successful adsorption of PVP on GO sheets as well as the presence of hydrogen bond between COOH group of GO and C=O group of PVP was confirmed from XPS analysis, ATR-IR and Raman spectroscopy. The antibacterial activity of GO/PVP coated 316L SS, towards a major biofilm former Pseudomonas sp. was evaluated by Epifluorescence and confocal microscopic and total viable count culture technique. Results showed enhancement in the antibacterial activity of GO/PVP composite coated 316L SS as compared to GO coated 316L SS. Keywords-GO, GO/PVP composite, EPD, bacterial toxicity 1 INTRODUCTION 316L Stainless steel (SS) is widely used as a structural material in many industries due to its excellent corrosion resistance and mechanical properties. In nuclear industry 316L SS find its application in cooling water systems as condenser pipes and pump materials. The microorganisms in the cooling water systems can form biofilm on stainless steel surfaces that may affect the integrity of the passive film and leads to localized corrosion. Hence development of antibacterial coatings on 316L SS is important to ensure long-term integrity of these systems. Graphene family materials have been reported to have antibacterial activities by many earlier researchers [1]. However some studies show that GO interaction with biofilms varies depending on conditions [2]. Ruiz and co-workers reported that GO by itself did not exhibit antibacterial activity [3]. Hence recent trend is to use GO composite with polymers and metals to enhance antibacterial activity [4]. Polyvinyl pyrrolidone (PVP) is one of the hydrophilic, non-conducting polymer, with high chemical stability and film forming ability, used in many biomedical applications because of its solubility in water and extremely low cytotoxicity [4]. This polymer was chosen to fabricate GO/PVP composite coating on 316LSS. Electrophoretic deposition (EPD) technique was used to coat GO and PVP together on the SS surface due to its flexibility over substrate dimension, coating uniformity, stability, simple instrumentation and most importantly its cost effectiveness. 2 RESEARCH SIGNIFICANCE The objectives of the present study are to develop GO and GO/PVP composite coatings on 316L SS by EPD, compare the antibacterial activity of the two types of coatings. 3 MATERIALS AND METHODS GO was prepared by modified Hummers method and dispersed in Millipore water by ultrasonication. GO and GO/PVP suspension were coated on 316L SS by EPD method. Coatings were characterized and antibacterial studies were carried out with Pseudomonas sp. 4 RESULTS AND DISCUSSION 4.1 Surface charecterization of GO and GO/PVP coated 316L SS FESEM images showed the uniform coverage of GO coating on 316L SS and heterogeneous microstructureindicating aggregation of GO/PVP coated specimens which was evident from the lower zeta potential value of GO/PVP suspension Distinct N 1s XPS spectrum (Figure 1) can be seen in GO/PVP coated 316L SS specimen whereas it is absent in GO coated 316 L SS specimen. At the mean time, the N 1s peak of >N-C=O shifts to higher binding energy of ev compared with that of pure PVP (398.4, charged N atom) supported the presence of hydrogen bonding between carbonyl group of PVP and carboxylic acid group of GO. Raman spectra showed a remarkable shift in G band to higher wave number (blue shift) in GO/PVP coated 316L SS specimens in comparison with GO coated 316L SS specimens. This shift in G band is due to the 27

 Control, (b) GO coated, (c) GO/PVP coated 316L SS specimens (TVC values given in each image) Figure 1. XPS survey spectra of (a) GO and (b) GO/PVP coated on 316L SS specimens. 4.")
55 more distortion of graphene structure by the adsorption of PVP. In ATR-IR spectra, along with C-OH stretch, C-H stretching and C=O stretching bands, an additional peak appeared at 1115 cm -1 belonging to C-N bond stretch mode present in GO/PVP coated 316L SS, indicating absorption of PVP on GO sheets in GO/PVP coated 316L SS specimens. Figure 2.Epifluorescence images of Pseudomonas sp. attached on (a) Control, (b) GO coated, (c) GO/PVP coated 316L SS specimens (TVC values given in each image) Figure 1. XPS survey spectra of (a) GO and (b) GO/PVP coated on 316L SS specimens. 4.2 Antibacterial Studies on GO and GO/PVP coated 316L SS The Epifluorescence micrographs of Pseudomonas sp. biofilms on different 316L SS specimens (Figure 2 a-c) showed a significant one order decrease in the number of viable cells (TVC) on coated SS surfaces compared to control surfaces. Among the GO and GO/PVP coated surfaces GO/PVP exhibited least density of attached cells. Confocal micrographs of Live/Dead stained Pseudomonas sp. biofilms on control and coated 316L SS surfaces are given in Figure3. a, b and c respectively. The more live cells are observed on control specimens in comparison to the coated specimens. The fluorescence intensity profiles analyzed on the confocal images are also given in the insets in the Figure 3 a-c. The green and red fluorescence intensity is in accordance with the TVC and epifluorescence microscopic analyses. Antibacterial activity of GO is attributed to oxidative stress imparted by superoxide generated by GO [1]. In this study GO/PVP composite coating on 316L SS specimens showed enhanced antibacterial effect than GO coated specimens. Antibacterial activity of polymers is classified into two types; passive and active. PVP is classified as a passive polymer. Passive polymers can reduce protein absorption on surface which prevents conditioning film formation, an essential prerequisite for bacterial adhesion and multiplication [4]. PVP binds with GO and imparts hydrophilicity to the surface. Bacteria generally are hydrophobic in nature and comparatively Pseudomonas sp. has higher hydrophobicity. Thus enhanced hydrophilicty imparted by the PVP to the PVP/GO composite coating seems to have enhanced antibacterial activity. Figure 3.CLSM images of Pseudomonas sp. attached on (a) Control, (b) GO coated, (c) GO/PVP coated 316L SS specimens (Fluorescence intensity images given in the inset) 5 CONCLUSION GO and GO/PVP composite were successfully coated on the 316L SS by anodic EPD method and characterized by Raman, XPS, FESEM and ATR-IR. Enhanced antibacterial activity is confirmed on GO/PVP coated 316L SS. 6 REFERENCES [1] Ji, H., Sun, H. and Qu, X. (2016), Antibacterial applications of graphene-based nanomaterials: Recent achievements and challenges. Advanced drug delivery reviews, 105, pp [2] Panda, S., Rout, T.K., Prusty, A.D., Ajayan, P.M. and Nayak, S. (2018), Electron Transfer Directed Antibacterial Properties of Graphene Oxide on Metals. Advanced Materials. [3] Ruiz, O.N., Fernando, K.S., Wang, B., Brown, N.A., Luo, P.G., McNamara, N.D., Vangsness, M., Sun, Y.P. and Bunker, C.E.(2011), Graphene oxide: a nonspecific enhancer of cellular growth. ACS nano, 5(10), pp [4] Huang, K.S., Yang, C.H., Huang, S.L., Chen, C.Y., Lu, Y.Y. and Lin, Y.S. (2016), Recent advances in antimicrobial polymers: a minireview. International journal of molecular sciences, 17(9), pp
56 High Corrosion Resistance Offered by Multi-Walled Carbon Nanotubes Directly Grown Over Mild Steel Substrate Sweety Arora, Rekha M Y, Abhay Gupta and Chandan Srivastava* Department of Materials Engineering, Indian Institute of Science, Bangalore, India *csrivastava@materials.iisc.ernet.in Abstract Several synthesis methods such as plasma enhanced, laser ablation, catalytic or thermal chemical vapour deposition, electric arc discharge have been explored for production of high quality carbon nanotubes of different diameters and lengths. Of these catalytic chemical vapour deposition has been proven to produce high quality and large scale CNTs at lower cost. In this paper, a uniform coating of multi-walled carbon nanotubes was directly formed over a steel substrate at 800 degrees by decomposition of ferrocene-benzene mixture which was kept inside a chemical vapour deposition setup. The nanotubes formed over the substrate were characterized using scanning electron microscopy and transmission electron microscopy techniques. Corrosion behavior of the bare and MWCNT coated mild steel substrate was examined through potentiodynamic polarization method. A significant increase in the corrosion resistance was noted with carbon nanotubes coating over the steel plate. Keywords - Carbon Nanotubes, Coating, Corrosion Resistance, Steel. 1 INTRODUCTION Carbon nanotubes due to their highly hydrophobic nature is a promising material for coatings with high corrosion resistance [1-4]. Their application includes using them as a reinforcement material in metallic coatings [5-7] and also as pure coating material [8-10]. Therefore, several methods are being developed for producing carbon nanotubes containing coatings [11-14]. A polished steel substrate was placed inside the chemical vapour deposition chamber. The decomposition of Ferrocene at C led to the formation of Fe nuclei over the substrate with benzene leading to carbon nanotube growth and subsequent MWCNTs coating over the substrate. 2 RESEARCH SIGNIFICANCE In this paper, we have shown a one-step method for directly growing MWCNTs over mild steel substrate which also shows improved corrosion resistance as compared to the bare substrate. Most of the reports involving nanotubes-based coatings proceed with synthesis of nanotubes and then dispersing them in a suitable mixture followed by coating it over a substrate [15-17]. Process mentioned here eliminates the extra process of dispersing nanotubes and their reattachment to the substrate. 3 MATERIALS AND METHODS A quartz tube furnace containing mild steel plate (polished) was heated to 800 C. Argon gas was maintained inside the tube at a constant rate of 200sccm so as to maintain an inert atmosphere. 2g of Ferrocene (Alfa Aesar, 99% pure) dissolved in 100ml Benzene was used as precursor. At 800 o C, the precursor solution was poured dropwise into the tube with a pouring rate of 1ml/min for 100 mins. ESEM Quanta-200-Scanning electron microscope was used to image the MWCNTs coated surface. A 300 kv field emission FEI TITAN transmission electron microscope was used to obtain TEM bright field image. The electrochemical corrosion study was performed in a conventional glass cell by using CHI 604E electrochemical work station at the room temperature. The MWCNTs coated steel plate, saturated calomel electrode and platinum foil were used as working, reference and auxiliary electrodes respectively. Corrosion studies were performed in 3.5 wt% NaCl with 1 cm 2 of the working electrode. 4 RESULTS AND DISCUSSION The presence of CNTs was confirmed by scratching the coating and dispersing it in hexane which was then drop dried over a copper grid coated with carbon and observed using a Transmission electron microscopy. Low magnification TEM image of the CNTs is shown in Fig. 1. It shows the formation of uniform nanotubes with a diameter of 37±14 nm(approx.). Low magnification SEM (top surface) image of the MWCNTs coated steel substrate is provided in Fig. 1b) which again shows a 29

57 uniform (bundles) coating of MWCNTs all over the steel substrate. Figure5.a) TEM image of MWCNTs; b)representative SEM image a) of MWCNT formed b) over mild steel substrate. Electrochemical analysis was performed using 3.5 wt% NaCl solution as electrolyte. The tafel curves or the potentiodynamic polarization curves, for mild steel (MS) and CNT coated mild steel (CNT-MS), shown in Fig. 2, were measured by polarizing the working electrode to ±200 mv with respect to the open circuit potential (OCP) value at a scan rate of 1 mv s -1. The corrosion potential (E corr), corrosion current (I corr) and corrosion rate (CR) values were obtained from the tafel polarization curves. The E corr, I corr and CR values obtained for MS were V, μa cm -2 and 59.3 μg hr -1 respectively. The E corr, I corr and CR values obtained for CNT-MS were V, 35.1 μa cm -2 and μg hr -1 respectively. CNT-MS specimen exhibited significantly increased E corr value towards positive potential and decreased I corr and CR values when compared to the MS specimen. It can be observed that coatings of MWCNTs over steel substrate significantly enhances the corrosion resistance property. Figure 2.Tafel curves for coated and bare mild steel substrates. 5 CONCLUSION MWCNT coatings was formed over a steel substrate by direct decomposition of benzene-ferrocene mixture poured (drop by drop) at C inside a CVD furnace. The average diameter of MWCNTs was found to be ~37 nm. SEM based analysis revealed uniform formation of MWCNT coating over the steel substrate. A significant decrease in corrosion rate was observed for nanotubes coated mild steel as compared to bare steel in 3.5% NaCl solution. 6 REFERENCES [1] ZhangL., WangL., HoltC. M. B., ZahiriB., LiZ., Malek K., NavessinT., Eikerling M. H. and MitlinD.(2012), Energy Environ. Sci., Vol. 5, pp [2] ChenX. H., ChenC. S., XiaoH. N., ChengF. Q., ZhangG., YiG. J.(2005), Surf. Coat. Technol., Vol. 191, pp [3] GaoZ., ZhaoS., WangY., WangX., WenL.(2015), Int. J. Electrochem. Sci., Vol. 10, pp [4] HurleyM.F., ScullyJ.R.(2006), Corros. Sci., Vol. 62, pp [5] ParkM., KimH., YoungbloodJ.P.(2008), Nanotechnology, Vol. 19, pp [6] LiaoS. H., YenC. Y, Weng C. C., Lin Y. F., Ma C. C., YangC. H., TsaiM. C., YenM. Y., Hsiao M. C., LeeS. J., XieX. F.(2008), J. Power Sources, Vol. 185, pp [7] DeyabM.A (2014)., J. Power Sources, Vol. 268, pp. 50. [8] LeeY. B., LeeC. H., LimD. S.(2009), Int. J. Hydrogen Energy, Vol. 34, pp [9] KimC., LimB., KimB., ShimU., OhS., SungB., ChoiJ., KiJ., BaikS.(2009), Synth. Met., Vol. 159, pp [10] LeeC. K.(2012), Tribol. Int., Vol. 55, pp. 7. [11Song] Y. I., KimG.Y., ChoiH. K., JeongH. J., KimK. K., YangC. M., LimS. C., AnK. H., JungK. T., LeeY. H (2006), Chem. Vap. Deposition, Vol. 12, pp [12] XieX., GaoL. (2007), Carbon, Vol. 45, pp [13] ThomasB. J., BoccacciniA. R., ShafferM. S. (2005), J. Am. Ceram. Soc., Vol. 88, pp [14] InoueY., KakihataK., HironoY., HorieT., IshidaA., MimuraH.(2008), Appl. Phys. Lett., Vol. 92, pp [15] BakshiS. R., SinghV., BalaniK., McCartneyD. G., SealS., AgarwalA.(2008), Surf. Coat. Technol., Vol. 202, pp [16] SeegerT., RedlichP., GrobertN., TerronesM., WaltonD. R., KrotoH., RuhleM (2001),Chem. Phys. Lett., Vol. 339, pp. 41. [17] BalaniK., AndersonR., LahaT., AndaraM., TerceroJ., CrumplerE., AgarwalA., Biomaterials (2007), Vol. 28, pp
58 CORROSION OF BIOMATERIALS AND DEVICES
59
60 Electrochemical Migration Behaviour on SAC305, SAC0307 And SAC P-0.005Ni Solder Alloy Paste Using Water Drop Method (WDT) In Simulated Body Fluid (SBF) C. Sarveswaran 1, Emee Marina Salleh 1, A. Jalar 2, Z. Samsudin 3, M. Yusuf Tura Ali 3, andn.k. Othman 1* 1 School of Applied Physics, Faculty of Science and Technology, UniversitiKebangsaan Malaysia, UKM Bangi, Selangor, Malaysia. 2 Institute of Micro Engineering and Nanoelectronics (IMEN), UniversitiKebangsaan Malaysia, UKM Bangi, Selangor, Malaysia. 3 Jabil Circuit SdnBhd, Bayan Lepas Industrial Park, 11900, Bayan Lepas, Pulau Pinang, Malaysia. *emee@ukm.edu.my Abstract Electrochemical migration (ECM) was the migration of metallic ions in the presence of electric field and medium which causes short circuit in electronic gadgets can be occurred. The electronic gadget which was used as sensor for in vitro diagnostic was exposed to aggressive corrosion attack in human biogenic medium. The ECM behavior on SAC305, SAC0307 and SAC P-0.005Ni solder paste alloy has been investigated by using water drop test method in SBF medium. SAC P-0.005Ni has the longest mean-time-to-failure which is 2458s for short circuit to occur. The micrograph of FESEM showed the presence of dendritic branches in SAC P-0.005Ni. XPS results revealed the formation of SnO2as the main corrosion product in the solder alloy paste after WDT. Therefore, SAC P-0.005Ni is an excellent potential to be used in biomedical applications due to low ECM. Keywords Electrochemical migration, short circuit, solder, water drop test. 1 INTRODUCTION According to [1], soldering is a metallurgical joining technique using solder with a melting point of below 315 C as filler. Solders have been used for joining metals since a thousand years ago. Lead bearing solders are not used for microelectronic industry after implementation of restriction of hazardous substances (RoHS) in various nations such as Japan, America and South Korea. Electrochemical migration can be defined as the motion of metal or metal-salt ions under the influence of a voltage bias. The conundrum of electrochemical degradation in electronic systems has long been identified. The first dendritic failure was reported in The type of electrochemical migration that was given focus in this research was surface dendrites. Dendrites can grow from the cathode to the anode under an applied voltage bias when aqueous contamination is present [2]. The main purpose of carrying out this research was to investigate the electrochemical migration behavior of SAC305, SAC0307 and SAC P-0.005Ni solder alloy paste in SBF. 2. RESEARCH SIGNIFICANCE Corrosion control in electronic field plays an important role since electronic components are integrated into various devices in corrosive medium. ECM in electronic and medical gadgets also affects its reliability and durability. Furthermore, the presence of SBF and bias voltage will cause short circuit or failure of electronic gadget to occur that will cause danger and loss to the user of the gadget. 3. MATERIALS AND METHODS In this research, water drop test (WDT) was performed using simulated body fluid (SBF). Electrical conductivity of the solder was examined by using four point probe method. 3.1 Water drop test (WDT) Figure 1 shows the schematic diagram of the applied test platform used for WDT. A droplet of 15µl SBF was placed by using micropipette onto the comb patterns. 10V DC was applied during WDT. After the WDT, the mean-time-to-failure (MTTF) of each sample was computed. 31
 4. RESULTS AND DISCUSSION 4.1 Mean-time-to-failure analysis V From Figure 1, it can be seen that SAC0307-0.03P- 0.")

![The MTTF result of the solder used in this research was longer compared to previous researches regarding electrochemical migration which was performed by [3].](/docs-images/78/76861956/images/61-2.jpg "This shows that the solder used in this research has a higher corrosion resistance. 4.3 XPS analysis Figure 3 shows the stannum elemental analysis in SAC0307-0.03P-0.005Ni solder.")
61 Intensity (cps) 5 th CORSYM, Chennai, India, March 2018 R=1kΩ U Yshows the dendritic structure and Z shows the presence of cracks. Figure1.Schematic diagram of the test platform of Water Drop Test (WDT) 4. RESULTS AND DISCUSSION 4.1 Mean-time-to-failure analysis V From Figure 1, it can be seen that SAC P Ni shows the longest MTTF in SBF which is 2458s compared to the rest of the solder, SAC0307 which is 1827s and SAC305 which is 1323s. This indicates that SAC305 has the highest susceptibility towards ECM whereas SAC P-0.005Ni has the lowest susceptibility towards ECM. The MTTF result of the solder used in this research was longer compared to previous researches regarding electrochemical migration which was performed by [3]. This shows that the solder used in this research has a higher corrosion resistance. 4.3 XPS analysis Figure 3 shows the stannum elemental analysis in SAC P-0.005Ni solder. The spectrum produced by XPS shows that the corrosion product of SAC P-0.005Ni consists Sn and O that can give significant implication towards the solder alloy paste. The main compound that forms on the surface of the solder is SnO 2. This is proven by the bonding energy of SnO 2 which was the most highest at position of 492eV and 494eV. Besides that, this was also because SnO 2compound was more stable than SnO in terms of thermodynamic. The Gibbs free energy value of formation for SnO is kj/mol and kJ/mol for SnO 2which indicates that SnO 2is more stable compared to SnO. SnO 2 SnO 2 SnO SnO Figure2. Schematic diagram of the test platform of Water Drop Test (WDT) 4.2 FESEM analysis Figure 2 shows the presence of dendritic structure, formation of pits and cracks on the surface of the SAC P-0.005Ni solder as seen in Figure 2. The dendrite has tree-like structure. The formation of pits indicates that pitting corrosion have occurred on the surface of the solder. X Y Figure2.Surfacemorphology of SAC P Ni solder. Point X shows the formation of pits, Z Figure3.XPS analysis spectrum for stannum in SAC P-0.005Ni. 5. CONCLUSION The WDT shows that SAC P-0.005Ni has the longest MTTF in SBF. This shows that SAC P-0.005Ni has the lowest ECM and has an excellent potential to be used for biomedical applications. 6. ACKNOWLEDGEMENTS The author would like to thank Ministry of Higher Education of Malaysia for supporting this research under FRGS/1/2016/STG07/UKM/02/1 grant. 7. REFERENCES Bonding energy [1] Efzan, E.M.N. and Marini, A.A. (2012), International Journal of Engineering and Applied Sciences, Vol 1, pp [2] Lawson, W. (2007), Ph. D., University of Salford. [3] Xia, Y.H., Jillek, W. and Schmitt, E. (2008), International Conference on Electronic Packaging Technology and High Density Packaging, Shanghai. 32
62 Vancomycin Incorporated Chitosan/Gelatin Coatings Coupled Withtio2 Srhap Surface Modified Cp-Titanium for Osteomyelitis Treatmentd. D. Nancyand N.Rajendran * Department of Chemistry, Anna University, Chennai , India *rajendranarasi@gmail.com Abstract: Commercially pure Titanium (Cp-Ti) was electrophoretically modified using double layer coatings con-sisting of TiO2 SrHAP as the first layer (TH) followed by vancomycin incorporated Chitosan/Gelatin asthe second layer (THV). The nano crystalline phase of coated Strontium incorporated hydroxyapatite (Sr-HAP) confirmed through X-ray diffraction studies (XRD). The polyelectrolyte complex formation betweenchitosan and gelatin, the stability of the drug, the bonding between chitosan and Sr-HAP were confirmedthrough infra-red spectroscopic studies (IR). The average roughness (Ra) value calculated from atomicforce microscopy (AFM) corroborates with the water contact angle data, which clearly confirms the tuning property of the surface in relation to the surface energy and roughness of the coated samples. Thetotal amount of vancomycin encapsulated was calculated to be 11.5 g. Antibacterial activity was foundagainst both Staphylococcus aureus strains methicillin resistant Staphylococcus aureus (MRSA) and methi-cillin sensitive Staphylococcus aureus (MRSA) for a drug concentration of 2.74 g released after 12 h ofimmersion. The in-vitro cell culture studies showed enhanced cellular activity for THV samples. Thus,THV samples have a dual action at the surface, by resisting the bacterial adhesion and enhancing cellularinteraction at the bio-interface, making it a promising candidate to treat osteomyelitis infection. Keywords - Vancomysin, MRSA, MSSA, Strontium, 1 INTRODUCTION Bone being a hierarchically structured organ at micro and nanoscale, which is a complex structural organ of the human body.human bone is made up of carbonated apatite crystal contributing to 70% deposited over the collagen matrix contributing to 30%.The collagen fibrils are mainly glucosamine-glycans supportingthe mineralization of the apatite in the extracellular matrix (ECM)of the bone morphology. Two types of ossification process areinvolved in healing a defective area, intramembranous and endo-chondral ossification which primarily involves the densification ofnano apatite crystal. Chitosan, a polysaccharide similar to that ofthe collagen in the bone has versatile applications in the field oftissue engineering, varying from wound healing property to itscompatible nature with various anti-inflammatory, antibacterialdrugs, make it a suitable drug delivery systems like nano-carriers,hydrogels etc. [1,2]. Gelatin, a denatured form of collagen consists of RGD sequence similar to that the collagen forming ECMsimilar to that of the natural bone [3]. The combined effect ofchitosan and gelatin have been studied widely, it proves that thecoupled action had far more superior qualities in mesenchymal cellattachment, proliferation, differentiation than the use of singularpolymer [4,5-8]. Strontium (Sr) an alkaline earth metal and trace 2 RESEARCH SIGNIFICANCE One major challenge, as well as a promising area in the fieldof implant material, is to provide a biointeractive surface thatresists the adhesion of bacterial agents and enhance the biological activity. This study focuses on the surface modification of Cp-Tithrough electrophoretic deposition (EPD) of a double layer. Thefirst layer consists of combination of TiO2metal oxide and Sr-HAPceramic oxide, the significance for the addition of metal oxide isto enhance the electrochemical resistance so there will be mini-mum leaching happening due to wear, where Ti metal has low wearresistance and to meet the mismatch in the thermal coefficient ofexpansion while annealing [20,21]. The second layer consists of thevancomycin incorporated chitosan/gelatin coating. One of the rea-sons for choosing EPD for the polymer is that the use of cross linkerscan be avoided [22]. The micro nano topography of the coated second layer would be best suited for the dual objectives of surface andthe first layer would enhance metal interface integration with thebiological environment [23]. Thus the double layer coated samplewould be all in one ideal metallic implant. 3 RESULTS AND DISCUSSION Sufficient time frame of 1 hr was given for each sample both bare and coated to establish standard OCP in the SBF solution. It is clear from that the steady state potential for the coated material has a significant 33
63 positive shift compared to uncoated Ti. This explains decreased corrosion drive and that the material attains stability with V, V and for Cp-Ti, TH and THV samples. The electrochemical impedance results are given in terms of nyquist plot, bode impedance and bode phase angle respectively. The nyquist plots have a clear arc shaped curve for Cp-Ti and THV samples, and a distorted arc for the TH specimen. The maximum the arc depth indicates higher corrosion resistance. High modulus on the lower frequency side from bode impedance plot for the coated substrate, resisting corrosion. The low frequency region of the phase angle has values, Cp-Ti º, TH º and THV º. The increase in the phase angle value suggests that the resistance at the coating/surface interface with the SBF was high for double layer coated sample and also this provides the charge transfer resistance at this interlayer is maximum providing a stable coating resisting corrosion. The area under curve for both nyquist and bode phase angle is high for THV samples. This, in turn, reflects that the capacitive nature of the surface layer to the surrounding electrolyte. In the mid frequency region of bode phase angle has a maximum of 75.8 º for all the three samples indicating the nature of the titanium metal. As it moves from mid-frequency to low frequency region the curve drops for TH, manifesting the partially degradable interfacial layer of Sr-HAP, and there is attack of corrosive ions on the surface. In case of Cp-Ti it is the naturally formed oxide layer and for THV it is due to the hydrophobic layer of vancomycin incorporated chitosan/gelatin polymer layer provides high resistance. The potentiodynamic polarization curve corresponding corrosion data are given in Table 2. Table 2: Potentiodynamic polarization data obtained for Cp-Ti, TH and THV samples Samples EOCP (V) vs SCE Ecorr(V) vs SCE icorr(µa) Rp(MΩ) CR (mm/year) Cp-Ti x TH x 10-5 THV x 10-6 From the figure, it is explanatory that there is a positive shift in corrosion potential value for the coated specimen. The corrosion current density, on the other hand, is high for TH samples, further confirming the interactive layer of Sr-HAP. The polarization resistance values were 5689 MΩ for Cp-Ti, 646 MΩ for TH and a maximum of MΩ for THV samples. The resistance provided by the metal to resist getting polarized or corroded is indicated as R p. Higher the R p value maximum is the metal stable from corrosion. Also, the positive shift in E corr value with low I corrfor THV proves that the polymer layer is stable and not susceptible to corrosion compared to Cp - Ti. The TH follows the same pattern in all the graphs showing higher corrosion, indicates that the TH layer is degradable, which is favorable for our current scenario [39-42]. The corrosion rate was calculated taking into account of the anodic and cathodic polarization slope and was found to be 1.44 x 10⁻⁵ mm/yearfor Cp-Ti-, 5.50 x 10⁻⁵ mm/yearfor TH and 5.68 x 10⁻⁶ mm/yearfor THV samples. It is clear that the THV samples degrade or corrode slowly compared to TH and Cp-Ti. 4 CONCLUSION First layer containing TiO 2 Sr-HAP, over which second layer of vancomycin incorporated chitosan/gelatin polymer layer was fabricated onto Cp- Ti through electrophoretic deposition method at constant voltage and time. Thus the prepared THV coated specimen serves dual purpose of resisting biofilm formation through MRSA and MSSA strain and at the same time providing a biologically favorable environment for the mesenchymal stem cells. The drug released was more than sufficient and comparable with the pristine drug concentration, providing a more significant anti-bacterial activity for a drug concentration of 2.74 µg. In addition the drug release kinetics follows a pattern for composite systems that use polymers. In conclusion the fabricated scaffold would serve as a promising platform for controlling and eradicating osteomyelitis at the site of infection and favoring bone mineralization. 8. REFERENCES [1] J. Venkatesan, I. Bhatnagar, P. Manivasagan, K.-H. Kang, S.-K. Kim,, Int. J. Biol. Macromol., 72 (2015) [2] S. Deepthi, J. Venkatesan, S.-K. Kim, J. D. Bumgardner, R. Jayakumar, Int. J. Biol. Macromol, 93 (2016) [3] M. Nair, D. Nancy, A. G. Krishnan, G. S. Anjusree, S. Vadukumpully, S. V Nair, Nanotechnology, 26 (16) (2015) [4] K. Jahan, M. Tabrizian, Biomater. Sci., 4 (1) (2016) [5] S. Saravanan, R. S. Leena, N. Selvamurugan, Int. J. Biol. Macromol, 93 (2016) [6] W. Wattanutchariya, W. Changkowchai,, Proc. Int. MultiConference Eng. Comput. Sci, 2 (2014). [7] J. Henkel, M. A. Woodruff, D. R. Epari, R. Steck, V. Glatt, I. C. Dickinson, P. F. M. Choong, M. A. Schuetz, D. W. Hutmacher, Bone Res., 1 (3) (2013) [8] [15] M. Swetha, K. Sahithi, A. Moorthi, N. Srinivasan, K. Ramasamy, N. Selvamurugan, Int. J. Biol. Macromol, 47 (1) (2010)

64 Corrosion Behaviour of Fluoride Conversion Coating on AZ31 Magnesium Alloy for Biomedical Applications K. Saranya and N. Rajendran * Department of Chemistry, Anna University, Chennai , India. *nrajendran@annauniv.edu Abstract Magnesium (Mg) and its alloys attracted the attention of the research community as new kind of degradable biomaterials due to their low density, high strength/weight ratio, biodegradability, and biocompatibility. Magnesium alloys have modulus of elasticity around 45GPa, which is more close to that of bone. Moreover, magnesium can be tolerated by the body without ill effect and excess of magnesium are readily excreted through kidneys. The negative difference effect of Mg is a major drawback in using it for biomedical applications. Therefore, surface modification of Mg and its alloys could be a possible strategy to control the degradation rate of Mg in physiological environments.to overcome the problem, fluoride conversion coatings were formed on AZ31 Magnesium alloy. The surface morphology of the conversion coating was analyzed using scanning electron microscope with energy-dispersive X-ray spectroscopy (SEM/EDX). The potentiodynamic polarization was done to analyze the corrosion behavior of the coating. Keywords - AZ31 Magnesium alloy, Fluoride conversion coating, Dynamic electrochemical Impedance spectroscopy 1. INTRODUCTION The unique biological properties of magnesium have attracted the attention as biodegradable orthopedic implant. Magnesium alloys have modulus of elasticity around 45GPa, which is more close to that of bone.moreover, magnesium can be tolerated by the body without ill effect and excess of magnesium are readily excreted through kidneys. The problems associated with the permanent implant such as discomfort, inability to adapt to growth and remodeling of bone in the human body can be prevented. However, the rapid degradation of Mg results in hyper-hydrogen generation and alkalization [1]. Alloying is an effective way to modulate corrosion rate of metals [2]. Howbeit, alloying of Mg is very difficult as the phase segregation may aggravate the corrosion rate. Surface modification with conversion coatings are effective and easier way to rate of corrosion in Mg. Among different kinds of coating, fluoride conversion coating was proven as an effective method. The intake of fluoride in the human diet is suggested to be 2 5 mg. They can stimulate the osteoblast proliferation and increase the new mineral depositions in cancellous bones[3]. The fluoride incorporated into the apatite could increase the size and change lattice structure thereby decreasing the solubility of the apatite crystals[4,5]. 2. RESEARCH SIGNIFICANCE The stress in the bone due to movement generates potential which impact the corrosion of the implanted material. A detailed study in corrosion behavior of the coating with applied potential is essential to understand the coating behavior in the body. 3. MATERIALS AND METHODS AZ31 magnesium alloy samples (10x10x2 mm) were polished and rinsed. The polished samples were immersed in 30% of hydrofluoric acid and maintained at 60 ºC for 48 h. The morphology and thickness of the conversion coating were investigated by high resolution scanning electron microscopy (HRSEM, Model FEI Quanta FEG 200). The phase composition of the coating was analyzed by X-Ray diffraction (XRD). 4. RESULTS AND DISCUSSION Figure 3. (a) Cross section and (b) Distribution of elements on the surface of conversion coating Figure 1 (a and b) shows the cross section and distribution of elements on the surface of conversion coating. The surface of the conversion coating is smooth 35
 shows the surface morphology of the conversion coating after immersion in EBSS for 7 days. The presence of Ca, P and O were observed over the surface.")
65 and uniform with small pores distributed over the entire surface. The thickness of the coating is ~ 7 µm. The EDX spectrum (fig 1c) shows the presence of Mg, F and O. Figure 2 (a and b) shows the surface morphology of the conversion coating after immersion in EBSS for 7 days. The presence of Ca, P and O were observed over the surface. The even distribution of Ca, P and O was found over the entire surface. Hence, the coating enables better bone formation. Figure 4 (a) Surface morphology and (b) Distribution of elements on the surface of conversion coating after immersion in EBSS solution for 7 days From the potentiodynamic polarization studies, a considerable shift i corr was observed. This shows that the conversion coating is efficient in modulating the corrosion resistance of the material. 5. CONCLUSION The fluoride conversion coating was formed with the coating thickness of 7 µm. The formation of conversion was uniform over the entire surface which was confirmed by the EDAX mapping. The potentiodynamic polarization studies reveal that the coating was stable and rate of degradation at the initial stage can be greatly reduced, achieving the better corrosion resistance during the initial wound healing. 6. ACKNOWLEDGEMENTS One of the authors K. Saranya is thankful to Department of Science and Technology (DST), New Delhi, India for financial assistance under women scientist scheme (WOS-A) (Ref. No: SR/WOS-A/ET- 17/2017). The Instrumentation facilities provided by DST-FIST and UGC-DRS to Department of Chemistry, Anna University, Chennai, India are gratefully acknowledged. 7. REFERENCES [1] Amaravathy, P., Sowndarya, S., Sathyanarayanan, S. and Rajendran, N., (2014), Novel sol gel coating of Nb2O5 on magnesium alloy for biomedical applications Surface and Coatings Technology, Vol. 244, pp [2] Biber, R., Pauser, J., Geßlein, M. and Bail, H.J., (2016), Magnesium-based absorbable metal screws for intraarticular fracture fixation, Case reports in orthopedics, Vol. 2016, Article ID [3] Guo, G., Zhou, H., Wang, Q., Wang, J., Tan, J., Li, J., Jin, P. and Shen, H., (2017), Nano-layered magnesium fluoride reservoirs on biomaterial surfaces strengthen polymorphonuclear leukocyte resistance to bacterial pathogens, Nanoscale, Vol. 9(2), pp [4] Ahmad, Z. and Senior, A.E., (2006), Inhibition of the ATPase activity of Escherichia coli ATP synthase by magnesium fluoride, FEBS letters, Vol. 580(2), pp [5] Yan, T., Tan, L., Zhang, B. and Yang, K., (2014), Fluoride conversion coating on biodegradable AZ31B magnesium alloy, Journal of Materials Science & Technology, Vol. 30(7), pp
66 Anodization of AZ31 Magnesium Alloy to Improve Corrosion Resistance for Biomedical Applications M. Kalaiyarasanand N. Rajendran * Department of Chemistry, Anna University, Chennai , India. * nrajendran@annauniv.edu Abstract - Mg and its alloys find wide application in the biomedical field due to several advantages properties. However its lower corrosion resistance and hydrogen gas evaluation in the physiological environment are the drawbacks. The present investigation aims at overcoming the drawbacks through anodization process. AZ31 Mg alloy anodized in the presence of silicate containing electrolyte. The presence of Si-O-Si group was confirmed by ATR-IR spectra. Potentiodyanmic polarization studies revealed enhance the corrosion resistance for the anodized AZ31 Mg alloy. Keywords: Anodization, Corrosion Resistance. 1. INTRODUCTION Magnesium and its alloys are promising biodegradable implant materials for orthopedic applications. Mg is the fourth most abundant element of the human body and its alloys have similar Young s modulus (41-45) GPa and density ( g/cm 2 )to that of human bone. Its unique nature of biodegradability and biocompatibility make it a potential candidate for a new generation of implant materials. Bio-corrodible implants are gaining interest as theyavoids the revision surgery which in turn reduces the rehabilitation time and cost.it helps in recruiting osteoblast cells by increasing the levels of osteocalcin. However, the major drawback of Mg alloys is their low corrosion resistance and hyper-generation of hydrogen gas, which make them unable to provide sufficient time for the wound to heal completely. Hence to improve corrosion resistance is order to ensure clinical application they need surface modification methods such as, micro-arc oxidation, sol-gel, anodization, conversion coating and etc., Anodization is well- known surface modification treatment which it gives thicker and uniform formation of oxide layer that can increase the corrosion resistance and bioactive nature. In this present work, anodization of AZ31 Mg alloy is carried out in the presence of alkaline silicate containing electrolyte solution to improve corrosion resistance. 2. EXPERIMENTAL 2.1 Materials and Methods Commercially available AZ31 Mg alloy was polished with 2000 grade silica abrasive paper, sonicated with acetone and water for 5 min, washed with distilled water and dried in hot air. Anodization of AZ31 Mg alloy in the presence of silicate containing electrolyte at different time period at constant potential of 10V was carried out. Then the anodized substrate was washed with distilled water and dried at room temperature. 2.2 ATR-FTIR studies Attenuated Total Reflectance-Fourier transform infrared spectrometer (ATR-FTIR) was used to analyze the functional groups of anodized substrate. 2.3 Electrochemical analysis The electrochemical experiments were carried out using electrochemicalworkstation (PGSTAT model 12, AUTOLAB). Three electrode system was used, in which a saturated calomel electrode (SCE) was used as the referenceelectrode, a platinum foil as the counter electrode and the test materialas the working electrode. Earle s solution was used as an electrolyte for all corrosion studies. 3 RESULTS AND DISCUSSION 3.1 Anodization Fig (1). shows the current transient anodization curve of AZ31 Mg alloy in silicate containing electrolyte at a constant potential of 10 V.When the potential is applied, there is an increase in thecurrent and simultaneous evolution of H 2 which shows that Mg react with water to form Mg(OH) 2. After 200 sec, there is a gradual decrease in currentdue to the formation MgSiO 4 and steady state has beenreached after 20 min. The movement of Mg and SiO 3 ions are restricted due to the resistance offered by the increase in the thickness of the coating. Mg 2+ + H 2 O + 2e MgO + H 2 MgO + SiO 3 MgSiO 4 37

67 4 CONCLUSION Figure 1: Current transient curve of anodized AZ31 Mg alloy ATR-FTIR The peak around 860 cm -1 is due to MgO,magnesium silicate shows strong vibrational band at 1024 cm -1 is due to Si-O-Si peak. The sharp peak at 3700 cm -1 isattributed to O-H stretching vibration. 3.3 Electrochemical Studies Potentiodynamic polarization was done in the potential range of -2.0 to 0.5 V at the scan rate of 1mVs - 1 in Earle s solution shown in Fig (2). AZ31 Mg alloy was anodized at 20 min showed the corrosion potential shift toward noble direction, to compare the bare, 10 and 30 min specimen.the lower corrosion current density i corr was observed for 20 min anodized sample. Figure 2: Potentiodyanamic polarization curve in Earle s solution. Table: 1 Potentiodyanmic polarization of anodized AZ31 Mg alloy substrate in Earle s solution AZ31 Mg alloy was anodized for various duration as the specimen developed at 20 min duration exhibited better corrosion resistance in comparison with bare, 10 and 30 min anodized sample. ATR-IR spectral study revealed the presence of Si-O-Si group. It can be used for biomedical application. 5 ACKNOWLEDGEMENT One of the authors, M. Kalaiyarasan gratefully acknowledges the Department of Chemistry, Annauniversity, Chennai, India for instrumentation facilities provided under DST-FIST and UGC-DRS 6 REFERENCE [1] P. Amaravathy, S. Sowndarya, S. Sathyanarayanan, and N. Rajendran Novel sol gel coating of Nb2O5 on magnesium alloy for biomedical applications, Surf.Coat.Technol., 244 (2014) [2] A. Srinivasan, K. S. Shinb and N. Rajendran, Applications of dynamic electrochemical impedance spectroscopy (DEIS) to evaluate protective coatings formed on AZ31 magnesium alloy, RSC Adv., 2015, 5, [3] M. Razavi, M. Fathi, O. Savabi and L. Tayebi Surface microstructure and invitro analysis of nanostructured akermanite (CaMgSi2O7) coating on biodegradable magnesium alloys for biomedical applications Colloids Surf. B, 117 (2014) [4] M. C. lopes de, V. S. M. Pereira and R. A. Antunes, Corrosion performance of anodized AZ91D magnesium alloy: Effect of the anodizing potential on the film structure and corrosion behavior J. Mater. Eng. Perform 23 (2014)
68 Electrochemical Behavior and Biocompatibility of Mixed Oxide Coated 316l SS For Biomedical Applications K. PradeepPremkumar * And N. Rajendran 1 Department of Chemistry, College of Engineering Guindy, Anna University, Chennai India *kumarprempradeep@gmail.com* Abstract Mixed metal oxide composite coating materials offer variety of possibilities which favors for biomedical applications. In the present work, Zn incorporated niobium oxide coating material was synthesized by sol-gel method and coated on 316L SS with tailored electrochemical, biocompatibility and mechanical properties. The properties investigated include, surface morphology, chemical composition, phase transition and chemical states using scanning electron microscopy (SEM), energy dispersive X-ray analysis (EDX), X-ray diffraction analysis (XRD) and X-ray Photoelectron Spectroscopy (XPS) studies respectively. A uniform, nanostructured morphology with hexagonal crystalline structures were identified by SEM and XRD. The chemical states of the Zn (2p) in the form of ZnOandNb (V) is in Nb2O5 form which was identified by XPS studies. Electrochemical studies in SBF solution reveals the great enhancement in corrosion resistance for mixed oxide coated 316L SS. Cell culture studies of MG 63, reveals the improved biocompatibility of 316L SS by the Zn incorporated Nb2O5 coated 316L SS. Keywords - Zinc, Nb2O5, 316L SS, corrosion resistance and biocompatibility. 1. INTRODUCTION 316L SS become an issue when it is used as long term implant material in human body because of less biocompatibility and release of ions in aggressive environment and affect the surrounding tissues with inflammations and fibrinogenesis. Development of an effective bone-implant interface is extremely necessary to progress a new kind of biomedical surface-coated materials to prevent the implant from corrosion and to improve the biocompatibility of 316L SS [1]. Multifunctional oxide coatings address recently to fulfill the various fundamental requirements of the biomedical implants. Hence, in the present investigation a new kind of surface modification has been tried with the combination of bio-ceramic Nb 2O 5 and Zn oxides for the enhancement of corrosion resistance and biocompatibility of 316L SS [2]. In order to reach the desired functionalities of the coating materials, a versatile sol-gel techniquewas used. The developed coatings were subjected to the various characterization studies to investigate the performance of the coatings. 2 RESEARCH SIGNIFICANCE The present investigation revealsthe enhancement of multifunctional coating behavior of 316L SS to meet the various requirements implant material. The bio-inertness of 316L SS was greatly modified to biocompatibility material by the Nb 2O 5 and Zn multi oxide bio-ceramic coating. The corrosion resistance of the 316L SS also enhanced long extent by the compact, protective multi oxide coating. Hence, the developed multi oxide (Nb 2O 5and Zn) coating on 316L SS can be the promising material for biomedical applications. 3 MATERIALS AND METHODS Zinc incorporated niobium mixed oxide coatings were synthesized with two different concentrations of Zn in Nb 2O 5 (NZ1 and NZ2) oxideusing sol-gel technique, coated over 316L SS by dip coating method and sintered at 500 C. The sintered specimens of the mixed oxide coatings were subjected to surface characterization studies like ATR-FTIR, XRD, SEM/EDX, AFM and XPS to identify the morphological properties.electrochemical studies like polarization and EIS were carried in SBF solution to evaluate the electrochemical behavior of the coatings. Cell culture studies were done with MG 63 osteoblast cells to witness the biocompatibility of the coated specimens. 4 RESULTS AND DISCUSSION 4.1 ATR-FTIR studies: The ATR-FTIR spectra of Zn incorporated niobium oxide (NZ1 and NZ2) coated 316L SS is depicted in Fig. 1. In the region 450 to 1000 cm -1, two important characteristic peaks were observed due to lattice vibrations of metal-oxygen bond. The broad band in the region 450 to 800 cm-1 is exhibited due to the overlapping of stretching vibrational peaks for Nb-O, Nb=O and bridging Nb-O-Nb groups [3]. The 39

69 characteristic stretching vibrational peaks of Zn-O group was also included in the overlapping band at the region 520 and 700 cm -1 respectively. An extra characteristic peak at 850 cm -1 corresponds to the Zn-O, which may be associated with carbon at the surface. Additionally, small peaks appeared at regions 1650 cm-1 and 1250 cm -1, resembling the bending and stretching vibrations of O-H and CO 3 2- groups remained in the coating. Figure 1. ATR-FTIR for NZ1 and NZ2 coated 316L SS. 4.2 HRSEM/EDX analysis: The surface morphology micrographs and elemental composition of NZ1 and NZ2 coated 316L SS were carried out shown in Fig. 2. The micrographs of NCZ1 and NCZ2 show the uniform nanostructures with grain boundaries.nanoporous morphology with compact structures was observed. The corresponding EDX profile in Fig 2, clearly shows the presence of Nb, O, Zn along with Fe, Cr and Ni thus confirming the incorporation of Zn into the Nb 2O 5coating matrix on 316L SS. All other studies show positive results for the mixed oxide coated 316L SS compare to uncoated.thepotentiodynamic polarization (PDP) studies in simulated body fluid reveals the increase in polarization resistance with decrease in current density (icorr) and electrochemical impedance spectroscopic (EIS) studies with increase in charge transfer resistance (Rct) and double layer capacitance (Qdl) were observed for mixed oxides of Zn incorporated niobium coated 316L SS. Better adhesion, proliferation and differentiation of MG-63 cells with significant cell spreading were observed for mixed oxides of Zn incorporated niobium coated 316L SS compared to uncoated 316L SS. 5 CONCLUSION The presence of Zn in Nb 2O 5over 316L SS and its functional groups, monoclinic crystalline phase, nanostructured porous surface morphology and chemical states Zn(II)&Nb(IV) were confirmed by ATR-FTIR, XRD, SEM with EDAX and XPS studies respectively. The NZ2 coated 316L SS possesses more hydrophilic nature confirmed by Water Contact Angle measurements. The corrosion resistance of the 316L SS was greatly enhanced by the NZ2 coating with decreasing the current density and corrosion potential shift towards positive direction compared to uncoated and NZ1 coated 316L SS measured from electrochemical studies. Increased bode resistance and high phase angle (capacitive behavior) was observed for NZ2 coated 316L SS compare to uncoated and NZ1 coated 316L SS. The NZ2 coated 316L SS exhibited more biological activity in promoting cell adhesion, proliferation and differentiation of MG 63 osteoblast cells which was confirmed with MTT Assay and SEM analysis. 6 ACKNOWLEDGEMENTS One of the authors, K. PradeepPremKumar, gratefully acknowledges the department of Chemistry, Anna University, Chennai, India for instrumentation facilities provided under DST-FIST and UGC-DRS. Figure 2. HR-SEM/EDX of NZ1 and NZ2 coated 316L SS. 7 REFERENCES [1] Pauline S. A and Rajendran. N. (2014), Applied surface Science, Vol. 290, pp [2] Li H.C., Wang D.G., and ChenC.Z.(2015), Ceramics International. Vol.41, pp [3] Xiangyu Zhang, Huizhen Wang, Jiangfang Li, Xiaojing He, Ruiqiang Hang, Xiaobo Huang, LinhaiTian and Bin Tang (2016),Ceramics International, Vol. 42 pp
70 CORSYM, Chennai, India, March 2018 Spray Pyrolysis Coating of Bioactive Glass/Tio2 Composite Coatings on CP-Ti for Load Bearing Osseointegration Applications P. Bargavi 1, S. Chitra 1, D. Durgalakshmi 2, P. Rajashree 1 and S. Balakumar 1 * 1 National Centre for Nanoscience and Nanotechnology, University of Madras, 2 Department of Medical Physics, Anna University, Guindy campus, Chennai , India. *balasuga@yahoo.com Abstract Bioactive glasses (BG) have revolutionized the field of biomaterials as they were shown to tightly bond to both hard and soft living tissues towards a path of regeneration and self-repair. Due to their poor mechanical properties they are unsuitable for loadbearing applications.an effective approach to solve this problem is to form a composite coating of BGand Titania (TiO2). In the present work, spray pyrolysis deposition (SPD) BG/TiO2 composite coating on the surface of CpTi is employed. The apatite layer formation was studied In vitro by immersing the sample in SBF and hemocompatibility was done as per ASTM standard which results in 0.5-2%. The antibacterial activity againsts.aureus, B.subtilis, P. aeruginosa and E.coli was studied and it showed control in biofilm formation over the surface.hence, SPD of BG/TiO2 thin films coatings deposited on CpTi metal surface implants is expected to be a promising load-bearing implant material for biomedical applications. Keywords Bioglass, Titania, Spray pyrolysis, Simulated body fluid, Hemocompatibility, Antibacterial activity. 1. INTRODUCTION Metals and alloys have a wide application in dentistry, medicine, orthopaedic and bone fractures as a component of an artificial implant or restored materials[1]. Orthopaedic implants are mainly made of metals to endure mechanical stresses in service. CpTi have been the most common metal used for orthopaedic implants applications[2]. Their main characteristics is their mechanical properties but varying in degrees, there is always a concern about their corrosion resistance in physiological fluids and their bioactivity. Due to limited corrosion resistance in the human body, especially critical in the case of stainless steel, and the lack of bioactivity, i.e. they are not able to bond to living tissue without cementation or external fixation devices[3]. On the contrary, certain glasses and ceramics are bioactive, but they are not strong enough to be used for load-bearing applications. BG containing CaO SiO 2 P 2O 5 bond to both soft and hard tissue without an intervening fibrous layer. Results of in vivo implantation show that, these compositions produce no local or systemic toxicity, no inflammation, and no foreign-body response [4],[5]. Henceto improve osseointegration, the surface of such implant systems has to be modified crack free and better osseointegration surface. In the present workbg/tio 2was synthesized by sol gel method and coated over CpTi by SPD. In this process both the mechanical stability of CpTi and the biological properties of BG/TiO 2are conserved. 2 RESEARCH SIGNIFICANCE The devised surface modification technique is simple and cost effective techniques. SPD could be utilized to fabricate uniform crack free layers of BG/TiO 2interconnected nanoparticles on CpTi substrate surfaces for better osseointegration. The developed SPD instrument has a unit to convert aggregated particles to finer particles and to select only the finer particles of composite for the deposition of uniform thick films layered on substrate followed by sintering at 600 C. 3 MATERIALS AND METHODS The polished CpTi substrate was ultrasonicated in acetone for 30 mins and dried before used for coatings and it was polished with #240 to #1200, grit sheets, followed with cleaning with acetone to remove the oxide layer and impurities on the substrates. The substrates were pre heated to 500 ºC. Bioactive glass having the composition (in wt %) of 45%SiO 2:24.5%Na 2O:24.5%CaO: 6%P 2O 5 is the system taken for our study. Tetra ethyl orthosilicate (TEOS), calcium nitrate, (CaNO3), orthophosphoric acid and sodium hydroxide (NaOH) were taken as precursors for SiO 2, CaO, P 2O 5, and Na 2O in the bioactive glass composition respectively. Nano TiO 2 powders were loaded in Bioglass sol with ethanol as the solvent medium and stirred using magnetic stirrer for 2 h and followed by addition of 5% ethylene glycol. This solution was used as binder for the coatings. To achieve densification in 41

71 coating, the sintering process was carried out at the heating and cooling rate of 10 C/min up to 550 C and maintained for 2 h. The parameters chosen for designing of experiments are temperature, deposition time, flow rate, particle loading, presence of binder, substrate roughness and are set under different levels based on the maximum and minimum limitations of variation in each trials of deposition. 4 RESULTS AND DISCUSSION The surface morphological and elemental confirmation of BG/TiO 2 coating is given in Figure 1. It was found to be a non-homogenous formation of material, and this might be due to heavy particle loading during the coating and sintering processes. This enhances the surface roughness of the coating, where the higher surface roughness and the presence of nanoparticles facilitates higher cell proliferation and higher rate of osseointegration [3]. The elemental analysis further confirms the presence of elements such as Na, Ca, P, Si, O and Ti in the coated sample and Ti substrate. With the fitted optimization condition the uniform coating was obtained with the thickness of about 5 m - 10 m. Figure 1. SEM cross section morphological analysis and EDS elemental confirmation of composite coated CpTi substrate The parameters involved in deposition of thin films were given in Table 1.The coated samples was immersed in SBF for 1, 3 and 7 days and the results confirms the formation of hydroxyapatite layer, as the days increases the release in calcium and phosphate ions increases and also the formation of apatite takes place which is an interface between bone and implant. The interaction between the blood and the biomaterial was studied by Hemolysis. As per ASTM standard it is found that the hemolysis percentage of the nanocomposites was between 1% to 3%. Which provides us that the composite coated CpTi has good hemocompatibility. Table 1. Parameters involved Parameters Fitted condition Pressure rate 1.2 bars for 60secs Deposition time 1 min Distance between nozzle 25cm and substrate Particle loading 0.1gm (TiO 2) + 0.9gm (BG) Binder (PVA/Ethylene 0.05gm/10ml Glycol) Polishing the substrate up to 1000 grit To control the biofilm formation, bacterial infection and oral infections on the titanium plate the antibacterial activity was studied against the organisms such as E.coli, B.subtilis, P.aeruginosaand S. aureus. The coated Ti plates were incubated for 8-12 h after which the colonies were counted and CFU/mL was enumerated. In which BG/TiO 2 coated Ti plates shows good antibacterial activity. All the nanocomposite coatings showed good antibacterial activity and control in biofilm formation against the org s and proved to be a good oral implant. 5 CONCLUSION The results of the present work showed that BG/TiO 2 has been successfully applied as coatings on the surface of CpTi substrate to form homogenous coating which can execute as load bearing osseointegraion. Which is confirmed by formation of apatite layer formed over the substrate. Also the coated composites showed good hemocompatibility and control in biofilm formation against the org s E.coli, B. subtilis, P.aeruginesoand S.aerus. 6 ACKNOWLEDGEMENTS The authors would like to thank DBT for supporting and funding the project. We also acknowledge the collaborators who extended the facilities for characterization. 7 REFERENCES [1]L. L.Hench, J.Am. Ceram. Soc., 81, (1998)1705 [2]Jodat Askari et al., Biomed J Sci & Tech Res, Vol 1-Issue- 6(2017), 1-5 [3]D.Durgalakshmi, S.P.Subhathirai, S.Balakumar, Procedia Engineering 92(2014) 2 [4]W.P.S.L. Wijesinghe et al., Material Science and Engineering C63 (2016) [5]M.H. Fathi, A. Doostamohammadi, Journal of Material Processing technology 209 (2009)
72 Corrosion Behaviorof PANI/Agnps Composite on Titania Nanotube ArraysFor Biomedical Applications P. Agilan and N. Rajendran* 1 Department of Chemistry, Anna University, Chennai-25, Tamil Nadu, India. *nrajendran@annauniv.edu Abstract Titanium and its alloys have been extensively used for orthopedic implant because of their favorable mechanical properties, corrosion resistance and good biocompatibility. HoweverCp-Titanium and its alloys cannot bond with bone directly due to their poor bioactivity. The implant may fail due to infections and fibrous tissue formation, which isolates the implant from the body. Titania nanotube arrays (TNTA) have attracted increasing attention due to their outstanding properties and potential applications in biomedical field. In this work, self organized titanium dioxide nanotubes were fabricated on titanium by electrochemical anodization process. Further, silver nanoparticles incorporated polyaniline (PANI) hybrid composite was fabricated on titanium nanotubes. Formation and particle size distribution of synthesized silver nanoparticles were investigated by uv/visible spectrophotometer and transmission electron microscope (TEM). The surface morphology, phase transition and functional groups were analysed using Field Emission Scanning Electron Microscopy (FE- SEM), X-ray diffraction (XRD), Attenuated Total Reflection Infrared spectroscopy (ATR-IR) and Raman spectroscopy. Corrosion behavior of the hybrid material was evaluated by Potntiodynamic polarization and Electrochemical impedance spectroscopy. Keywords - Titania nanotubes, Polyaniline, silver nanoparticles, Corrosion. 1 INTRODUCTION Titanium and its alloys have been the most preferred implant material due to their remarkable corrosion resistance, lower elastic modulus and good load bearing ability. Nanostructured materials have acquired great attention in orthopedic research as the bone comprises of nanometer sized structures at the first level hierarchy. Literature survey reveals that TiO 2 nanotubes on Cptitanium have shown positive effect on apatite formation, cell adhesion, proliferation and differentiation [1]. The conducting polyaniline (PANI), has attracted researchers as it is easy to synthesize, low cost, good conductivity, better corrosion resistance, environmental stability and biocompatibility [2]. PANI in the presence of nanohydroxyapatite induces the apatite formation, exhibits antibacterial property in its conducting state and 43 also possesses antioxidant propertybut with poor antimicrobial property for bio-implants. Silver nanoparticles are used in treating infectionsand as anticancer agents. Its notable antimicrobial properties are employed in coating bone prostheses and surgical devices [3]. The aim of this work is to develop a novel nanocomposite coating of silver nanoparticles incorporated PANI on titanium implant and evaluate its potential application as bio-implant in orthopedics. Nanocomposite coating on titanium nanotube arrays (TNTA) was prepared by electropolymerization and characterized by Fourier transform infrared spectroscopy (FT-IR), X-ray diffraction (XRD), scanning electron microscopy (SEM), in vitro biomineralization and corrosion studies. 2 RESEARCH SIGNIFICANCE Fabrication of titania nanotubes on titanium surface enhances the biocompatibility. Polyaniline (PANI) is one of the best conducting polymers with remarkable corrosion resistance and reasonable biocompatibility. Silver nanoparticles (AgNPs) is one of the promising antibacterial agent. In this work we have focused on the fabrication of novel biomaterial for biomedical application. 3 MATERIALS AND METHODS 3.1 Preparation of titanium nanotubes array (TNTA) Titanium nanotube arrays (TNTA) was prepared as reported earlier [4]. In brief, the polished titanium samples were etched using Kroll s reagent. Then the samples were anodized in electrolyte containing equal volume of 1.5 M H 2SO 4 and 0.1 M HF at 20 V in a constant DC supply for 1 h. The samples were washed thoroughly and sintered at C for 3 h in box furnace. 3.2 Synthesis of silver nanoparticles Silver nanoparticles were prepared by citrate reduction method. Silver nitrate (99.9 %) and trisodium citrate (extra pure) were purchased from Merck (India). 1mM silver nitrate solution was brought to boiling. 3 ml of 1% trisodium citrate was added in drops and stirred

73 vigorously. The solution was heated until it turns yellow in color. 3.3 Electropolymerization of AgNP s incorporated PANI Electropolymerization was carried out using PGSTAT Autolab-302 N electrochemical workstation. The electrolyte contained 0.05 M aniline in 1 M H 2SO 4 with 1 ml of prepared silver nanoparticles. The potential was applied from -1.0 to 1.2 V at a scan rate of 50 mvs -1 for 20 cycles. 3.4 Electrochemical Studies Electrochemical studies of the test samples were carried out by electrochemical workstation (PGSTAT model 302 N, MetrohmAutolab B.V, Netherlands). The corrosion studies were performed in Hanks solution the ph of the solution was maintained at Characterization Techniques UV visible spectrum was recorded with quartz cell using UV-spectrophotometer. The morphology and size of the nanoparticle was analyzed using High Resolution Transmission Electron Microscope (HRTEM, JEOL 3010).The surface morphological features of the anodized samples were observed by high resolution scanning electron microscope (HR SEM, FEI Quanta FEG 200). The 2D and 3D profile of the HR SEM images were achieved by the scanning probe image processor WSxM 4.0 beta 8.5 software. 4 RESULTS AND DISCUSSION 4.1 XRD Analysis 4.2 SEM Analysis Figure 2 shows the highly ordered vertically aligned TNTA with relatively round pores were formed. The average diameter and inter-tubular distance of TNTA were found to be 90 nm and 15 nm, respectively. Figure 2: SEM- images of (a) TNTA and (b) PANI/AgNPs-TNTA samples. 5 CONCLUSION The self ordered TNTA with average pore diameter 85 nm and nanotube length 400 nm were achieved on Cptitanium by electrochemical anodization. The conducting polyaniline /AgNPs was successfully incorporated on TNTA by electropolymerization. Surface characterization proves the crystalline titania nanotubes and polyaniline/agnps incorporatedtitania nanotubes on the titanium substrate. The potentiodynamic polarization and electrochemical impedance studies showed the high corrosion resistance of polyaniline/agnps incorporated titania nanotubes in Hanks solution. 6 ACKNOWLEDGEMENTS The authors are thankful to Department of Science and Technology-Science and Engineering Research Board (DST-SERB), New Delhi, India for funding this project (Ref. No SB/S1/PC-14/2013) dated: The Instrumentation facilities provided by DST-FIST and UGC-DRS to Department of Chemistry, Anna University, Chennai, India are gratefully acknowledged. 7 REFERENCES Figure 1: X- ray diffraction pattern for (a) substrate and (b) TNTA samples. Figure 1 shows the XRD patterns of titanium substrate and TNTA samples. The substrate showed peaks at 2θ values of 35.47, 38.14, 41.02, 52.64, 62.90, and The TNTA samples were sintered at 450º C for 3 h to bring about the conversion of amorphous TiO 2 to crystalline anatase TiO 2 phase. The two new peaks observed at 2θ values of and correspond to formation of anatase phase. These peaks confirmed the anatase crystalline phase of the TNTA[5]. [1] Beniash E., (2011), Nanomedicine and Nanobiotechnology, Vol. 3, pp [2] Jakubiec. B.,Marois. Y. and Ze. Z. (1998),, Journal of Biomedical Materials Research Part A, Vol. 41, pp [3] Ghavami Nejad A., Park. C.H and Kim.C.S (2016), Biomacromolecules, Vol. 17, pp [4] Agilan P. and Rajendran N. (2018), Applied Surface Science, Vol. 439, pp [5] Simi, V. S and Rajendran N. (2017), Materials Characterization, Vol.129, pp

74 Design and Characterization of E-waste based Bio-composites for Biomedical Applications Arun Raja A. K. 1, Kiran Bose A. 1*, Yogendar V.1 And Vignesh K. 1 1 St. Joseph s Institute of Technology, Chennai, Tamil Nadu, India *bosekiran97120@gmail.com Abstract: Electronic-waste or e-waste has been one of the biggest threats to human life in recent times due to its non-biodegradable and carcinogenic nature. The use of e-waste as filler in thermo-sets represent a promising method for resolving environmental pollution and reducing its cost, thus attaining both environmental and economic benefits. Two specimens were prepared using Printed Circuit Board (PCB) powder reinforced with glass fibre and linen fabric in addition to General Purpose(GP) resin and catalyst. The blended composites incorporating glass fibre as well as linen fabric were tested for various mechanical properties. Based on the results obtained, the given composites are favourable for usage in the biomedical equipments such as scalpels, stretchers, assistive canes, walkers and crutches. Keywords: E-waste, Printed Circuit Board (PCB), General Purpose (GP) Resin, Blended Composites. 1 INTRODUCTION The hazardous and alarming nature of electronic waste came to light on the global stage when the first comprehensive global environmental agreement was established at the United Nations Basel Convention in the year The encouraging fact was that 176 countries had signed the pact. But studies conducted in 2014, that is 22 years later, have revealed that 41.8 million metric tonnesof e-waste is being generated globally. The major chunk of the e-waste generated in the year 2014 was generated by the Asian continent (16 million metric tonnes) followed by the Americas (11.7 million metric tonnes) and Europe (11.6 million metric tonnes) [1]. Recent studies have claimed that only 15-20% of annual e-waste generated is being recycled. This graph has increased exponentially over the past decade. Finding solutions and novel techniques for e-waste disposal and recycling has become the need of the hour, mainly due to its exponential increase in volume. Composite materials generally involve filler materials, resins and reinforcements. The composites discussed in this paper deals with the introduction of PCB powder in glass fibre and linen fabric (flax matte) which provides various beneficial properties. 2 RESEARCH SIGNIFICANCE The findings of this research will redound to the benefit of the environment as well as revolutionize the field of biomedical equipments. Devices such as scalpels, crutches, assistive canes and stretchers strongly demand for high tensile and compressive strength along with light weight in addition to excellent machinability [2] which can be aptly provided by the composites discussed in this paper. The novel technique used here is the blending of PCB powder with composites. 3 MATERIALS AND METHODS In order to come up with the best alternative to existing biomedical equipment materials, two different composites, namely Composite A and Composite B are prepared. These composites have minor variations in their constituents. 3.1 Composite A Composite A consists of General Purpose (GP) resin, hardener, filler, PCB powder and glass fibre. 3.2 Composite B Composite B consists of General Purpose (GP) resin, hardener, filler, PCB powder and flax matte. 3.3 Technique used Fig. 1. Wooden frame In order to prepare the composites, the hand layup technique is used. Initially, the wooden framework is designed for outer dimensions of 40x40 centimetres and having a thickness of 10 centimetres. An OHP sheet is laid down inside the wooden framework and necessary precautions such as applying castor oil and clearing dust are taken. The fibre material is laid down over the OHP sheet. 45

75 In a separate container, GP resin, PCB powder and hardeners are added after weighing, followed by stirring to obtain a uniform mixture. This mixture is then poured over the fibre sheet. Another fibre layer is placed above the mixture layer and the mixture is poured over it. This procedure is repeated until we obtain the favourable thickness. The prepared composite is then allowed to harden. 3.4 Mass Ratios The various constituents, namely, GP resin, PCB powder and the fibre are combined in the following ratios. Table 1. Mass Ratio By mass (%) Composite A Composite B Resin PCB Glass fibre Resin PCB Flax matte RESULTS AND DISCUSSIONS Fig. 2. Finished composite Composite A and B are successfully prepared using the above mentioned technique. In order to examine the various properties exhibited by the composites, it is cut into plates of size 20x20 centimetres and sent for testing. The samples are tested for tensile strength (MPa), flexural load (kn) and impact strength (J). The following results were obtained. Table 2. Test results for Composite A and Composite B Sample Composite A Composite B Tensile strength (MPa) Flexural load (kn) Impact Strength (J) From Table 2 it can be observed through comparison that composite B has better tensile strength and impact strength, whereas composite A can handle higher flexural load. Scalpel handles demand a good tensile and impact strength. Hence composite B can be used to manufacture handles of scalpels. Since assistive canes require good flexural strengths, composite A makes a good alternative for manufacturing them. Such properties are also favourable for the manufacture of walkers and crutches. 5 CONCLUSION This research work clearly provides an alternative material for manufacture of biomedical equipment, namely, scalpel handles, assistive canes, walkers and crutches. The composites can not only replace such expensive existing materials but can also have a striking positive impact on the environment. E-waste can be significantly put to use, thereby preventing hazardous disposal methods, these composites can also pave the way for economical manufacturing of in-demand biomedical equipment. 6 ACKNOWLEDGEMENT This research was supported by St. Joseph s Institute of Technology. We thank our contributors and technicians from Sakthi Fibreglass (Chennai) and Omega Inspection & Analytical Laboratory who provided insights and expertise that greatly assisted the research. 7 REFERENCES [1] Baldé, C.P., Wang, F., Kuehr, R. and Huisman J. (2014), The Global E-waste Monitor 2014 [2] Neil Scott, Madhav Kittur and David Drake, Use of harmonic scalpel in sphincter pharyngoplasty, British Journal of Oral and Maxillofacial Surgery, 52 (2014)
76 Reduced Graphene Oxide (RGO)/PCL Composite Coating on Calcium Phosphate Coated TiNanotubesfor Orthopaedic Implant Application S.A. Iynoon Jariya 1 and K. Ravichandran 2 * Department of Analytical Chemistry, University of Madras, Guindy Campus, Chennai , India. *raavees@gmail.com Abstract The graphene based composite coatings over Ti substrate containing nano tubes for the development of orthopeaic and dental implant applications. This composite coating is expected to improve the mechanical properties and exert inertness towards body fluids. RGO/PCL composite coating on Dicalcium phosphate Dihydrate (DCPD) deposited over titanium nanotube surface. The titanium nanotubes were developed by anodization process and subsequently a thin film of DCPD coating was provided by cathodic electrochemical method. Further RGO/PCL composite coatings were also deposited using dip coating method. The functional, structural and morphological characteristics of RGO/PCL composite coatings were confirmed by FT-IR, Raman, XRD and SEM analysis. The bioactivity of RGO/PCL nanocomposite coatings was performed by immersion in stimulated body fluid (SBF) solution at 37 o C. Corrosion performances of RGO/PCL composite coatings were characterized using Potentiodynamic polarization method and Electrochemical Impedance Spectroscopy (EIS). Keywords-Tinanotubes, RGO, composite coating, bioactivity, Corrosion. 2 INTRODUCTION Titanium and its alloys have been widely used for metallic implants due to its favorable mechanical aptness and chemical stability. However, owing to its limited bioactivity, they cannot either bond well with bone or promote new bone formation on their surface at the early stage of implantation [1]. Depositing of bioceramic coatings over Ti substrate is regarded as an effective method to improve their surface biocompatiblity and to turn the non-bioactive metal surface into a bioactive one. However, the adhesion of bioceramic coatings over Ti substrate is major concern. Upon, modifying the surface of titanium by anodization process provides stable Nanotube (TN) arrays, which may hold the bioceramic as well improve the adhesion between the bioceramic and underlying Ti substrate. Electrochemical deposition of calcium phosphate bioceramics is an attractive method because of the advantages in the coating fabrication. Although bioceramic coatings have been successfully used in biomedical field, its brittle nature impedes its applications under loadbearing conditions. The incorporation of reinforcing material RGO, graphene oxide, is used to address this weakness and improve the corrosion resistance and bioactivity [2]. Graphene consists of a two-dimensional (2D) monolayer structure of hexagonally arranged sp2- bonded carbon atoms, and has attracted intensive attention because of its unique properties. The advantage of graphene as a reinforcing material, it exhibit improved mechanical properties such as hardness, elastic modulus, fracture toughness, wear resistance and flexural strength when used in composite materials [3]. 3 RESEARCH SIGNIFICANCE The current research aims to integrate the advantages of these materials by preparing a RGO/PCL composite coating on anodized titanium using electrochemical deposition, hence to improve the biological and mechanical properties of calcium phosphate bioceramic coatings. 4 MATERIALS AND METHODS 4.1 Fabrication of Titanium Nanotube arrays Titanium plates were cut into pieces of rectangular shape, area of 2.5 x 2.0 cm and polished with grit SiC abrasive paper, etched for 5 min at room temperature. Etched Ti, were degreased by ultrasonication in acetone for 15 min, followed by a thorough rinse with deionized (DI) water, and dried. Anodization experiments were carried out at RT for 1 h using two-electrode electrochemical anodization cell consisting of Ti as anode and Pt was used as the cathode. Both the electrodes were connected to a Direct Current (DC) voltage and the anodization voltage was kept constant at 60 V. The electrolyte used in this process was ethylene glycol containing 0.3 wt.% NH4F and 10 wt.% DI water. Anodized Ti plates were annealed in air at 450 o C for 2 h, to obtain the desired structure. 47
 2 and 0.06 M (NH 4) 2HPO 4. The ph was adjusted 3.5 at 60 o C.")
77 4.2 Electrochemical deposition of calcium phosphate coatings A two electrode setup was applied using the TN arrays, and a Pt sheet, as cathode and an anode respectively. The electrolyte used for the electrochemical deposition of calcium phosphate coatings contained 0.1 M Ca(NO 3) 2 and 0.06 M (NH 4) 2HPO 4. The ph was adjusted 3.5 at 60 o C. The electrodeposition was performed at constant current density of 1.0 ma cm 2 and various deposition times between 10 and 45 min. The deposited calcium phosphate coatings were rinsed in DI water dried and weighed. 4.3 Synthesis of RGO/PCL composite coating on Ca-P coated TN arrays In this work graphene oxide (GO) was prepared from modified Hummer s method. It is reduceded hydrazine hydrate (100 mg/ml). PCL 5 wt.% was dissolved in DCMand stirred at 1 h, the synthesized RGO (0.1 wt.%) was mixed with above stirred solution to make a RGO/PCL composite solution. The DCPD coated samples were dipped for 30s and withdrawn at a constant speed to form a uniform coating and then dried at room temperature for 24h.The surface morphology, composition, phase purity and functional groups present in the coatings were characterized from SEM, EDS, XRD, FT-IR, and Raman analysis. The bioactivity of the coating was tested from SBF at 37 o C.Corrosion performance was analysed using HBSS by potentiodynamic polarization and EIS. 5 RESULTS AND DISCUSSION HR-SEM micrographs of RGO/PCL composite coated on DCPD deposited TN arrays, was represented in Figure. 1a. It shows a simultaneous presence of both plate-like DCPD crystals and RGO/PCL composite coating. The presence of fine crystals and sheets of RGO/PCL composite coating over the DCPD coated surface was depicted in the marked area in Fig 1a and Fig 1.b respectively. The Fig. 1c shows the respective EDS spectrum of the coating, it reveals the presence of Ca, P, C, O, and Ti and the molar ratio of Ca/P were evaluated as Figure. 1 (a) HR-SEM micrograph, (b) respective high magnification of marked area, (c) EDS spectrum of RGO/PCL composite coating on DCPD coated TN array Figure. 2 represents the Raman analysis of RGO/PCL composite coating on DCPD coated TN arrays; it was employed to identify the existence and property of the RGO in the composite coatings. Both the typical D band at 1296 and G at 1593 cm -1 band in RGO were observed. Together with characteristic Raman peaks for DCPD at 396, 517, 876 and 990 cm -1. From FT-IR spectra, presence of tertiary and secondary phosphate peaks was also confirmed. Figure. 2. Raman spectra of RGO/PCL composite coating on DCPD coated TN arrays 6 CONCLUSION Titanium nanotube arrays were successfully developed by anodization technique and the DCPD was deposited through cathodic electrochemical deposition method. The deposited DCPD coatings were confirmed by FT-IR and Raman spectroscopy. The RGO/PCL composite coating was deposited over the DCPD through dip coating method. The morphology of the coating and the presence of elements were confirmed from HR- SEM and EDS analysis 6 ACKNOWLEDGEMENTS Authors thanks to DST-INSPIRE fellowship (IF150141) and University of Madras for providing infrastructure facilities. 7 REFERENCES [1] Wang H, Lin C, and Hu R (2009), Effects of structure and composition of the CaP composite coatings on apatite formation and bioactivity in simulated body fluid, Applied Surface Science, Vol 255, pp [2] Yan Y, Zhang X, Mao H, Huang Y, Ding Q, Pang X (2015), Hydroxyapatite/gelatin functionalized graphene oxide composite coatings deposited on TiO2 nanotube by electrochemical deposition for biomedical applications, Applied Surface Science, Vol 329, pp [3] Mehrali M, Akhiani A, Talebian S, Mehrali M, Latibari S, Dolatshahi-Pirouz A, Metselaar H, (2016), Electrophoretic deposition of calcium silicate reduced grapheneoxide composites on titanium substrate, Journal of the European Ceramic Society, Vol 36 (2), pp
78 Long Term Corrosion Behaviour of YSZ Bioinert Ceramic Coatings in Artificial Saliva S.Mohandoss 1, V. Balasubramani 2, R. Sasikumar 3, B.Venkatachalapathy 4 and T.M. Sridhar 2* 1 Department of Chemistry, Rajalakshmi Engineering College, Chennai Department of Analytical Chemistry, University of Madras, Guindy Campus, Chennai Department of Physical Chemistry, University of Madras, Guindy Campus, Chennai Department of Chemistry, SRM Eswari Engineering College, Chennai *tmsridhar23@gmail.com ABSTRACT Yttria stabilized zirconia (YSZ) deposits were developed on 316L SS by electrophoretic deposition method (EPD). Zirconia coatings were carried out from a 2 % suspension in isopropyl alcohol on stainless steel by varying the coating voltage and time. In order to strengthen the metal-ceramic interface heat treatment of the coatings obtained were carried out in air atmosphere at 800 C for 1h. The uniform distribution of the coatings plays a vital role in determining the corrosion performance of the coatings. Electrochemical studies consisting of open Circuit potential time measurements, anodic polarization and impedance spectroscopy was used to study the invitro corrosion performance of the coatings in artificial saliva. Surface characteriszation tools were used to study the nature of interfaces formed. The long-term immersion studies were carried to study the changes in electrochemical performance of the coatings on immersion in artificial saliva. Open circuit potential (OCP) time measurements were carried out to evaluate the YSZ coatings on immersion for a period of 30 days. The electrochemical and morphological changes were characterized. The results indicate the improved corrosion performance of the YSZ coatings when compared to uncoated stainless steel. Keywords: YSZ, corrosion, immersion studies, artificial saliva. 1 INTRODUCTION Stainless steelbased dental implants undergo corrosion in the oral environment due to largeamountof various types of metal ions and debris are generated in this oral environment, of which accumulation may lead to adverse tissue reactions in the oral environment.itcause for implantation failure, because of saliva withsalt, acts as a weakelectrolyte. The electrochemicalproperties of saliva depend on the concentrations of its components, ph, surface tension, and bufferingcapacity. Each of thesefactorsmay influence the strength of anyelectrolyte. In acidic medium, the active dissolution of metal ions can occuruponexposure to the bulk metalcorrosion can severelylimit the fatigue life and ultimatestrength of the materialleading to mechanicalfailure of the dental materials. Stainless steelis an inexpensive dental implants andstainlesssteel have been usedwidely as an alternative to noble metals and alloysbased dental implants. The surface of the stainlesssteel dental implants can beprotected by usingsuitablecoatingmaterialsuch as Yttria stabilisedzirconia.yszis a bioinertceramicsplay a vital role in modern dental industry, it posses high biocompatibility, chemicalstability,chemicalinertness,highflexuralstrength and fracture toughness are essential in order to allow an efficient restoration of the toothappearance and functionalitythesematerials and it posses high corrosion resistance with biocompatibility in the oral cavity. They are chemicallyinertmaterials, allowing good celladhesioncompared to other dental ceramics. 2 RESEARCH SIGNIFICANCE YSZ deposits were developed on the surface of the 316L SS by Electrophoretic deposition method(epd).this process required very simple equipment and provides highly packed uniform coating from the alcoholic suspension and rate of deposition can be controlled by varying applied voltage, low cost and coating process can be completed in a few minute. 3. MATERIALS AND METHODS The electrochemicalperformanceof YSZ coated 316L SS werestudied in artificial saliva medium.theartificial saliva containsvarious types of ions sodium, potassium, calcium, chloride and phosphate. These ions vigorouslyattack the YSZ coated 316L SS surface. 49
79 The OCP time measurementswerecarried out underequilibrium conditions betweenreferenceelectrode and the workingelectrode.ocp for bothuncoated and YSZ coated 316L aftersintering in artificial saliva observed OCP values indicatethatuncoatedsamples shift towards more active direction whereas the YSZ coated surfaces can act as a good barrieritresistvariousmetal ion attackfrom the artificial saliva. 4. RESULTS AND DISCUSSION The CPP measurements corrosion parameters such as E corrand I corrvalues was calculated from tafel fit analysis from the polarization curves. The decrease in E corrand increase in I corrvalues occurs was observed in uncoated samples as the ions in solution can easily try to penetrate in to the passive layer of the metal surface. The E corrand I corrvalues for optimisedysz coated (70 V and 5 minutes) sample were found to be -230 mv and µa /cm 2 respectively. The increase in E corr and decrease in I corr value for this coating potential is due to the uniform coatings with desired thickness Nyquist and Bode impedance studies the polarization resistance and Bode impedance value of coated layer value is very high than polarization resistance of passivation layer and metal surface, optimised YSZ coated sample posses high polarization resistance and very low capacitance value than other coating potential and uncoated sample. Bode phase plot we observed the phase angle of optimized YSZ coated sample is very high other samples. The optimised YSZ coated 316L SS possess uniform and crack free coatings. It showed low I cor value and maximum impedance and phase angle value.theoptimised YSZ coated samples act as a good barrier against attack of various vigorous ion attack from artificial saliva medium.theoptimised YSZ coated 316L SS samples are novel biomaterial for modern dental industry. 5. CONCLUSION Electrochemically stable and uniform coatings were obtained by EPD of YSZ on 316LSS followed by sintering in air. The optimum coating parameters were obtained at 70 V and 5 minutes. Electrochemical studies OCP, tafel plot, Nyquist and bode plots confirm the optimal corrosion resistance of YSZ coatings in artificial saliva. 6. REFERENCES [1] U.Kamachi Mudali, T.M.Sridhar and Baldev Raj, Corrosion of Bio Implants, Sādhanā, (Academy Proceedings in Engineering Sciences, Indian Academy of Sciences), 28, Parts 3&4 (2003), [2] Jiho Kang,Ph.D. Thesis," Electrochemical Studies of Coatings and Thin Films", Ohio State University,(2006). [3] UHyun Sam Ryu, Jungho Ryu, Dong-Soo Park and Seong-Hyeon Hong, J. Electrochem. Soc. 2011, Volume 158, Issue 2, Pages C23-C28. [4] Rodriguez H.H., Vargas G., Cortes D.A., Electrophoretic deposition of bioactive wollastonite and porcelain wollastonite coatings on 316L stainless steel, Ceramics International, (2008), 34, [5] Sridhar T. M., Eliaz N., Kamachi Mudali U., Raj B..Electrophoretic deposition of hydroxyapatite coatings and corrosion aspects of metallic implants. Corros. Rev. 20, 2002,
80 ELECTRODEPOSITION AND NANOTECHNOLOGY
81
82 One-Step Electrodeposition of Sulfur and Platinum on Larger Area GDL for ORR: Materials and Methods K. Lokesh, S. Mohan, A. K. Sahu, and D. Kalpana * Central Electrochemical Research Institute-Madras Unit, CSIR Madras Complex, Taramani, Chennai *drkalpanaa@gmail.com Abstract The sluggish kinetics of the oxygen reduction reaction (ORR) is a critical parameter in the energy conversion efficiency for fuel cells (FCs). The electrodeposition is a simple process which improves the catalyst utilization and accessibility of active sites to be located within the three phase reaction zones for better ORR kinetics. Sulfur electrodeposition has not been widely studied for ORR in fuel cells. This can be achieved by simple one-step electrodeposition of sulfur and Pt by galvanostatic mode on commercial graphene oxide coated gas diffusion layer. The deposition was confirmed by cyclic voltammetry and SEM. In this work, we have optimized the electrodeposition process and studied the electrochemical properties of sulfur for ORR where sulfur acts as an inhibitor for oxidation reaction that leads to increase in ORR kinetics. Keywords Sulfur, Pt Electrodeposition, Galvanostatic, Oxygen Reduction Reaction, Fuel cells. 1 INTRODUCTION ORR kinetics has a major influence in fuel cells performance where sluggish kinetics at the cathode is the major limitation to the highly successful application in transportation markets. The catalyst stability is another pertinent concern, whereby commercial Pt/C catalyst degrades during PEMFC operation due to carbon corrosion, platinum nanoparticles agglomeration, dissolution and Ostwald ripening [1]. Introduction of sulfur can prevent this problem since it binds strongly to platinum and carbon due to its similar electronegativity values [2,3]. Three-phase reaction zones are an important parameter in fuel cells where the electrolyte, catalyst and gaseous fuel meet for electrochemical reactions and it is vital for the catalyst particles to be located in this interface for its complete utilization. But the conventional methods such as spraying or brush coating has large number of inactive catalyst sites which are not in good contact with electrolyte phase, consequently the catalyst is not fully utilized. Therefore, there is a need to increase the accessibility of catalyst sites and complete utilization for better performance in fuel cell and this work was mainly focused to solve the problems in terms of stability, cost and kinetics of ORR with the help of simple one-step electrodeposition method. 2 RESEARCH SIGNIFICANCE Electrodeposition offers a novel way to deposit many metals, selectively, at desirable locations in the substrate where protonic and electronic conduction coexisted. This method easily controls the nucleation and growth of the metal nanoparticles which increases the triple phase boundary density (TPB) and reduces TPB length [4]. In this method, the Pt loading can be reduced ten-fold without any significant loss of cell performance as compared to the conventional deposition technique. Thus, this method guarantees that the fuel cell performance will be improved. 3 MATERIALS AND METHODS Commercial GDL (Grade BC39), Commercial graphene oxide (Angstron chemicals), sodium sulfide (Na 2S), chloroplatanic acid (H 2PtCl 6), urea (CH 4N2 O), sulphuric acid (H 2SO 4) were used as starting materials for this work. 3.1 Electrodeposition of sulfur and platinum: CGO was brush coated on 2x2 area of GDL with loading of 0.25 mg/cm 2. Electrodeposition experiments were carried out in a two-electrode system using galvanostatic mode where 2 x 2 cm 2 area of commercial GDL (Grade BC39) and Pt rod was used as working and counter electrode respectively. The current density of 2 ma/cm 2 was applied to deposit sulfur from the electrolyte solution of 0.1 mol/l Na 2S aqueous solution. Pt electrodeposition was carried out at a fixed current density of 10 ma/cm 2 until achieving a total charge density of 2C/cm 2 in the electrolyte containing 0.5 M H 2SO 4, 5 mm H 2PtCl 6 and 150 mm urea. 4 RESULTS AND DISCUSSION 4.1 SEM The electrodeposited samples were analysed by Scanning Electron Microscopy (SEM). Figure 1a, 1b reflects the agglomerated morphology of electrodeposited sulfur and platinum on GDL. Sulfur nanodots of nm 51

83 and Pt nanoparticles of 250 nm were achieved on graphene oxide coated GDL which showed that GDL has a major influence in morphology. Figure 1e shows Pt deposited on sulfur and GDL/GO/S/Pt sample shown in Figure 1f has a uniform deposition of sulfur and platinum where there is a possibility of Pt covered the sulfur due to its small size. rgo which indicated that it has well structural arrangement of graphene. Figure2. Cyclic Voltammograms (CV) of a) GDL, GDL- CGO b) GDL-Pt, GDL-CGO-Pt c) GDL-S, GDL-CGO-S d) GDL-S-Pt e) GDL-CGO-S-Pt and f) Raman spectra of GO, rgo & S doped rgo. Figure1. SEM images of a) GDL-S b) GDL-Pt c) GDL- CGO-S d) GDL-CGO-Pt e) GDL-S-Pt and f) GDL-CGO- S-Pt 4.2 Cyclic voltammetry and Raman spectra: From Figure 2a, GDL and CGO coated GDL shows the capacitive behavior and the presence of redox behavior shown in Figures 2b-2e imply that Pt and sulfur electrodeposition has occurred. Moreover, the onset of the anode oxygen chemisorption (oxide formation) on platinum (0.9V vs SCE) in Fig 2b has slightly shifted to more positive potentials with the addition of sulfur (1.05V vs SCE) in Fig 2c-2e. This difference is attributed to the presence of S which inhibits the chemisorption of OH on the Pt sites at high potentials by the change in electronic effects. This may be favorable to the oxygen adsorption at low overpotential, and thus the ORR kinetic improvement. Fig 2f shows Raman spectra for graphene oxide (GO), reduced graphene oxide (r-go) and sulfur doped GO. In this, the intensity of D-band is lower in S-GO compared to 5 CONCLUSION We have optimized the process for one-step electrodeposition of sulfur and platinum on larger area GDL which can be used as a catalyst for oxygen reduction reaction for fuel cell applications. The future work will be focused on studying the single fuel cell assembly efficiency of GDL/CGO/S/Pt electrode. 6 ACKNOWLEDGEMENTS We thank Naval Research Board, DRDO for providing the grant and support for the project GAP28/17. 7 REFERENCES [1] Lu Z. et al. (2017), Sulfur doped graphene as a promising metal-free electrocatalyst for oxygen reduction reaction: a DFT-D study, RSC Adv., vol. 7, no. 33, pp [2] Hoque M. A. et al. (2016), Optimization of sulfur-doped graphene as an emerging platinum nanowires support for oxygen reduction reaction, Nano Energy, vol. 19, pp [3] Yang Z. et al. (2012), Sulfur-Doped Graphene as an Efficient Metal-free Cathode Catalyst for Oxygen Reduction, ACS Nano, vol. 6, no. 1, pp [4] Thompson S. D., Jordan L. R. and Forsyth M., Platinum electrodeposition for polymer electrolyte membrane fuel cells, Electrochimica Acta, vol. 46, no. 10, pp
84 Size-Dependent Anti-Microbial Response of Silver Nanoparticles for Anti- Fouling Applications in Marine Environment Y. Raghupathy 1*, K. Karthiga Devi 1, K. A. Natarajan 1 and C. Srivastava 1 1 Indian Institute of Science Bangalore, India *yraghupathy@gmail.com Abstract There is a growing need for eco-friendly antifouling materials for marine applications. This study explores anti-microbial response and electrochemical stability of Ag nanoparticles (Ag NPs) as a function of particle size. Ag NPs of different particle size (12, 27, 46 nm) were synthesized via chemical reduction. SEM, XRD and TEM were employed to determine their morphology, size and structure. Anti-microbial response against sulphate reducing bacteria was determined by bacterial growth curves, electro kinetic analysis and morphological characterization. Tafel plots and dissolution kinetics unveiled their electrochemical stability in Cl - media. Below 25 nm, Ag NPs were strongly chemisorbed to cell walls, leading to bacterial growth inhibition. Additionally, smaller Ag NPs were more stable in aerated Cl - media due to formation of stable Ag2O at nanoparticle surface. This study advanced fresh insight that Ag NPs can exhibit size-dependent chemisorption to bacterial cell walls, which can be harnessed to develop Ag-based marine materials with tunable anti-fouling behavior. Keywords Anti-microbial response and electrochemical stability, Ag nanoparticles, sulphate reducing bacteria 1 INTRODUCTION Bio-fouling of metallic materials is the curse of marine based industry as the former often promote corrosion and premature materials failures [1]. Microbes such as sulphate reducing bacteria (SRB) spontaneously colonise the materials surfaces, and form corrosion-inducing bio-films [1]. There is a great need to replace existing anti-fouling materials with alternative schemes that are compatible with marine environment. The present study explores electrochemical stability and anti-microbial response of Ag nanoparticles as a function of their particle size. Ag NPs exhibit major advantages, namely excellent anti-microbial properties and commercial feasibility [2]. Additionally, toxicity due to Ag + ions can be minimized due to formation of highly stable silver compounds such as AgCl and AgSO 4, and Ag 2S in marine environments [2]. Currently, information on Ag-SRB interactions is conspicuously scarce, necessitating a systematic investigation into nano-scale Ag-SRB interactions in the context of anti-fouling applications for marine industry. In this study, Ag NPs were prepared via direct chemical reduction, and subsequently characterized with regard to their morphology, size, structure, electrochemical corrosion behavior and anti-microbial properties against SRB. 2 RESEARCH SIGNIFICANCE SRB are most widely implicated in bio-fouling related failures in marine environment, and nano-scale Ag is a well-known anti-microbial material [1]. Nonetheless, Ag- SRB interactions remain poorly understood to this day. This research work sought to unveil nano-scale Ag-SRB interactions leading up to SRB growth inhibition, and their electrochemical stability in Cl - media. This knowledge will provide useful guidelines for designing Ag-based antifouling materials for marine industry. 3 MATERIALS AND METHODS 3.1 Materials Analytical grade AgNO 3, N 2H 4.H 2O (hydrazine hydrate), and PVP (polyvinyl pyrrolidone) were procured from SD-Fine Chemicals Ltd, and used as received. All the chemicals used in various analytical estimations were of analytical grade. De-ionised water (DI) with resistivity > 10 MΩcm was obtained from a Milli-Q system (Millipore, USA). 3.2 Synthesis, electrochemical chracterisation and anti-microbial testing of Ag nanoaprticles To prepare Ag NPs, N 2H 4.H 2O ( 80% in H 2O) was injected dropwise to a precursor solution containing AgNO 3 and PVP under constant agitation and Ar purging. After 0.5 h refluxing, the nanoparticles were collected and cleaned as described elsewhere [2]. The synthesis was conducted at various solution temperatures, Ag + concentrations, and [Ag + ]/N 2H 4.H 2O molar ratios. TEM and XRD were employed to obtain their size, morphology and structure. To determine their anti-microbial response against SRB, bacterial growth experiments were conducted by dispersing 5, 10 and 15 mg of dried Ag NPs per litre of postgate growth media (ph 7). Cell number, Eh, ph, and sulphate content were examined as a function of time. Electrochemical stablility of Ag NPs in 3.5% NaCl was investigated via Tafel analysis and exposure tests before and after their interaction with SRB. 53

85 4 RESULTS AND DISCUSSION 4.1 Synthesis and characerisation of Ag NPs Chemical reduction of Ag + ions by hydrazine produced Ag NPs with average particle size of about 12, 27, and 44 nm. Decrease in solution temperature and increase in [Ag + ]/N 2H 4.H 2O molar ratio favored reduction in average particle size. As shown in Fig. 1 (a-c), TEM based bright field micrographs and selected area electron diffraction confirmed formation of Ag NPs with a FCC structure. Particle size obtained from TEM was in good agreement with crystallite size derived from scherrer analysis of Ag (111) peak broadening (Fig. 1d). SEM based EDAX analysis confirmed high purity of the as-prepared particles. Figure 2. Anti-microbial beahviour (a) & (b), and electrochemical stability (c) & (d) of Ag NPs 5 CONCLUSION Direct reduction of Ag + ions by hydrazine in the presence of PVP can be fine-tuned to obtain near-spherical Ag NPs with desired particle size. Smaller Ag NPs (<25 nm) strongly chemisorbed to cell walls leading to cell damage. Smaller Ag NPs also exhibited improved stability in Cl - media due to formation of stable Ag 2O at surface. Size-dependent chemisorption is fresh insight that can stimulate further research in this field. 6 ACKNOWLEDGEMENTS Figure 1. Morphology, size and structure of as-prepared Ag NPs: (a). 12 nm sized, (b). 27 nm sized, and (c). 46 nm sized Ag NPs. (d). variation of Ag (111) peak broadening with particle size, (c). EDAX analysis of 27 nm sized Ag NPs. 4.2 Anti-microbial response and Electrochemical stability Bacterial growth studies revealed the minimum concentration of Ag NPs for complete inhibition of bacterial growth. Fig. 2a illustrates the effect of 27 nm sized Ag NPs on the bacterial growth. As shown in Fig. 2b, the minimum inhibitory concentration decreased appreciably with average particle establishing that the smaller particles are more effective in fighting the growth. Electrokinetic and SEM analysis revealed that chemisorption of Ag NPs to bacterial cell membranes led to growth inhibition. Fig. 2c shows the Tafel plot for 27 nm sized Ag NPs in 3.5% NaCl. Analysis of E corr and i corr values obtained from Tafel studies demonstrated that electrochemical stability of Ag NPs in Cl - media improved with decreasing particle size (Fig. 2d). Enhanced Ag + release from smaller Ag NPs led to oxidation of nanoparticle surface to create a stable Ag 2O outer layer which prevented further Ag release into the media [3]. Authors acknowledge the research funding from SERB, Govt. of India and JATP, IISc Bangalore, India. 7 REFERENCES [1] Raghupathy Y., Natarajan K. A. and Srivastava C. (2016), Anti-corrosive and anti-microbial properties of nanocrystalline Ni-Ag coatings, Materials Science and Engineering B, Vol. 206, pp [2] Raghupathy Y., Natarajan K. A. and Srivastava C. (2017), Microstructure, electrochemical behaviour and bio-fouling of electrodeposited nickel matrix-silver nanoparticles composite coatings on copper, Surface & Coatings Technology, Vol. 328, pp [3] Peretyazhko T. S., Zhang Q. and Colvin V. L (2014), Size-controlled dissolution of silver nanoparticles at neutral and acidic ph conditions: kinetics and size changes, Environmental Science & Technology, Vol. 48, pp
86 Hybrid Electro and Electroless Ni Based Polymer (PVA) Composites on Stainless Steel for Industrial Applications. H. Usharani 1, T. S. N. Sankaranarayanan 2 and T.M. Sridhar *1 1 Department of Analytical Chemistry, University of Madras, Guindy Campus, Chennai Department of Chemistry, Department of Dental Biomaterials, School of Dentistry Chonbuk National University, Jeonju , South Korea *tmsridhar23@gmail.com ABSTRACT- A process of electro and electroless deposition of Ni-Bgraphene based polymer composite film is investigated on stainless steel. The deposition of metal layers on steel plate was achieved by hybrid electro-electro less deposition (HEED) techniques. The high tensile strength and flexibility of Poly vinyl alcohol (PVA) reduces the friction and wear of the coated materials. Moreover, a thin layer of PVA coating provides a highly effective coating on plates. The polymeric materials are widely used to control the corrosion of metals and prevent loss of structural integrity. In the present work involves the development of graphene/pva composites that were incorporated into nickel boron (Ni B) matrix by electroless plating method. The incorporation of the graphene into polymer matrices can be provided advanced multifunctional layer of composite materials. The composites were characterized by different microscopic and spectroscopy methods. Keywords: Hybrid electro-electroless coating (HEED), PVA, graphene, Sodiumborohydrid 1 INTRODUCTION: Electroless nickel plating on stainless steel provides moderate abrasion resistance, high wear and hardness resistance. The technique of HEED coatings has been a found numerous applications in many areas due to excellent coatings properties such as high corrosion resistance, high wear-resistant, good lubricity, high hardness and acceptable ductility. Moreover, Hybrid deposition gives a long-lasting life for coated substrates. The single-layer of hexagonal packed lattice of graphene sheet have unique properties such as, high thermal, electrical and mechanical. The borohydride reduced hybrid nickel-graphene based composite depositions are improving hardness and wear resistance of the surfaces [1]. Zhaodi Ren et al. [2] reported and observed the dense coatings of metal-graphene composites, compare to graphene oxide composite, which increase both the elastic modulus and the hardness of the metal matrix. Tao chengan et al. [3] described the preparation of graphene oxide/pva composites. In this case, the tensile strength of the composite film was decreased gradually. In the present study, we have prepared Nickel-Boron/graphene/PVA composites on stainless steel by electro and electroless deposition methods. Low amount of graphene and PVA of composite could improve the chemical and mechanical strength of film and can provides multifunctional layer of composite on different surfaces. 2 RESEARCH SIGNIFICANCE: This paper is aimed to improve the corrosion and wear resistance using HEED method. This allows the coating to have long life circle and high protecting efficiency and it leading to the enhancement in the mechanical properties. Hence in this study, it was proposed to incorporate Nickel/graphene based polymer on stainless steel to obtain the good mechanical strength and rust proof also. 3 EXPERIMENTAL DETAILS Stainless steel (grade 304 with size mm) was used as cathode substrate for composite coatings. AR grade Nickel chloride, ethylene diamine, disodium tartarate, Sodium borohydride were used. Stainless steel surface was mechanically cleaned and degreased with a detergent solution. This was used for further coatings with different chemical composition. The chemical composition of electro and electroless Ni-B/Graphene/PVA coating bath is given below: Alkaline bath contains, nickel chloride 30gL -1, ethylene diamine 80ml L -1,disodium tartarate 50gL -1 complexing agent, sodium hydroxide 50gL -1 to provide the alkaline condition, sodium borohydride 2gL -1 as reducing agent, succinic acid 20mgL -1 as stabilizer, and cationic surfactant CTAB 0.1 gl -1 was used to prepare electroless Ni B coatings on stainless steel. The ph and temperature of bath maintained at 13 and 40±1 respectively. 4 RESULTS AND DISCUSSION: The morphological behaviour of composite coated stainless surface was studied by SEM. Figure.1 depicts the SEM microscopic images of Nickel-Boron/graphene/PVA 55

87 on stainless steel. Non uniform coatings were observed in pristine Nickel coating surface. In the case of graphene/ nickel coated surface shows the improvement in terms of thickness and uniformity. 5 CONCLUSION: Ni-B/graphene/PVA composites on stainless steels have been prepared by using Hybrid electro and electroless method. The coating weight of the composite increased when compared with Ni and Ni-graphene coatings, Further electrochemical corrosion studies are under progress. 6 ACKNOWLEGEMENTS: The authors acknowledge UGC SAP DRS-I program of the department for providing financial support. Figure1. The SEM image of Nickel/graphene/PVA coated on stainless steel. Finally, the Ni-B/graphene/PVA reveals the formation of dense deposits of the composite on stainless steel. This composite is expected to be a polymeric material of PVA surround and non-covalently with graphene and nickel composites. 4.1 WEIGHT GAIN: The weight gain and deposition rates of hybrid deposition of Ni-B/graphene/PVA are given below: % Ni-B coated % Ni- B/graphene % Ni- B/graphene- PVA 7 REFERENCES: [1] T.S.N. Sankara Narayanan, S.K. Seshadri (2003) Formation and characterization of borohydride reduced electroless nickel deposits Journal of Alloys and Compounds 2004, vol.365, pp [2] Zhaodi Ren, Nan Meng, KhurramShehzad, Yang Xu, Shaoxing Qu, Bin Yu, and J K Luo (2015) Mechanical properties of nickel-graphene composites synthesized by electrochemical deposition. Nanotechnology (8pp) [3] Tao cheng-an, Zhang Hao, Wang Fang, Zhu Hui, Zouxiaorong, and Wang Jianfang (2017) Mechanical properties of Graphene oxide/polyvinyl alcohol composite Film Polymers & Polymer Composites, Vol. 25, pp1. 56
, Visakhapatnam, A.P, 530003, India 2 National Institute of Technology, Tadepalligudem, A.P, 534101, India *chitrada.prasad@gmail.")
88 Improvement of Corrosion Resistance of Mild Steel with Pulsed Electrodeposited Zro2 -Tio2 Nano Composite Coating Chitrada Prasad 1 *, Raffi Mohammed 2, K.Srinivasa Rao 3 and K.Ramji 4 1,3,4 Andhra University College of Engineering (A), Visakhapatnam, A.P, , India 2 National Institute of Technology, Tadepalligudem, A.P, , India *chitrada.prasad@gmail.com Abstract Present work pertains to improvement of corrosion resistance of mild steel with nano composite coating. Pulse electrodeposition is a relatively recent technique of obtaining smooth, hard and strongly bonded nano composites on metal substrate. Aim of this work is to study the effect of pulse time on corrosion resistance of nano composite coated mild steel. In the present investigation 10% Zirconia doped TiO2 nano composites are prepared by Sol-Gel synthesis method. Electrodeposition ofcoating was carried out using direct and inductive pulses with nickel electrolyte bath. The ZrO2-TiO2nano composites are characterized by the X- ray diffraction(xrd), Infrared spectroscopy, field emission scanning electron microscopy (FESEM) and energy dispersive X-ray spectroscopy (EDX) techniques for phase identification, crystalline size, absorbance spectrum, and particle size and composition analysis respectively. TiO2 peaks became sharper and zirconium titanium oxide peaks appeared. Coating adhesion on the steel substrate with different pulse time electrodeposits were characterized by XRD and microscopic techniques. An EDAX/SEM study suggests that the metal surface was protected through the coating with ZrO2 TiO2 composite films. Potentio dynamic polarization and electrochemical impedance spectroscopy (EIS) studies were carried out in 3.5% NaCl environment to study the corrosion resistance of the coating. Potentio dynamic polarization test results revealed the shifting of corrosion potential (Ecorr) towards noble values and indicated formation of compact passive film on steel surface. ZrO2-TiO2 nano composite coating in nickel electrolytic bath resulting highest corrosion resistance. The high protection efficiency of composite coating may be due to mutual influence of TiO2 and ZrO2 films. DC pulse ON time less than that of pulse OFF time produced homogenous surface layers with less porosity, which may be attributed to uniform distribution of ions in deposited and sufficient charging of the double layer during short pulse ON time. Keywords - Sol-Gel process, Nano Composites, Pulse current electrodeposition, Corrosion resistance 1 INTRODUCTION Now a days the protection of the surface of metals and alloys from the corrosive aggressive environment is necessary in electronics and electrical industry, automotive engineering, aerospace industry, marine and defence applications [1, 2]. Mild steel is mostly used material which is highly active metal prone to corrosion [3]. According to past research in several techniques to control the corrosion, hydrophobic surface coatings with antifogging and self-cleaning properties have been successfully used. Failures from the literature recognized that hydrophobicity coatings like titanium based composites lower the surface energy and improve surface roughness [4]. A ceramic coating by sol gel dip coating method produces cracks and material decomposition at high temperatures. Aggressive media allows via cracks to contact base metal surface [4]. 2 RESEARCH SIGNIFICANCE Electrodeposition is an ecofriendly process to produce transition metal matrix with homogeneous and nonporosity coatings to minimize the corrosion effect. The material selection with nano scale range 10% ZrO 2-TiO 2 composites to form Nickel based ZrO 2-TiO 2 composite ceramic metal matrix coatings are fabricated in this work. 3 MATERIALS AND METHODS Figure1.Experimental Methodology Tio 2 precursors (Avra 98%), ZrOCl 2.8H 2O (Himedia 99%),isopropanol (FINAR), HCl(<35% Merck),N- Cetyltrimethyl Ammonium Bromide(CTAB) Himedia- Indiapt Ltd materials were used. 57


89 Transmittence (a.u.) 1054 Ti-oH OR Ti-O-Ti C-O-H C-H 1636 Ti-oH th CORSYM, Chennai, India, March Experimental TiO 2 solution (sol1) was prepared by 1.8grm of TiO 2 mixed with 9.3ml of isopropanol and sonicated at room temp for 3min.0.1M HCl was added to stabilize ph to 1.3. the solution was sonicated for 3min and stirred at 70 o C for 2hr. ZrO 2 solution (sol2) was prepared by adding 0.523grm of ZrOCl 2.8H 2O to 100ml de ionized water, stirred for 30min at room temperature which formed into a transparent solution. Sol2 was added drop wise to sol1, and stirred for 2hrs at 70 o C, air dried at 100 o C then 10% ZrO 2- TiO 2 powder was formed, and the obtained powder is then calcinated at 950 o C. Electrodeposition of 10% ZrO 2-TiO 2 (10ZT) in Nickel metal matrix was carried out with various pulses on timefrequencies at 5V, mild steel cathode and Nickel anodewere used. Table1. Electrolyte composition and deposition parameters wats bath Electrodeposition Composition parameters Chemicals amount current density 3A/dm 2 NiSO 4.6H 2O 200g/l temperature 30 o C NiCl 2.6H 2O 50g/l duration 5min CTAB 0.5g/l Stirring speed (rpm) 180 ZrO 2-TiO 2 1g/l ph 4.05 Figure 2.PWMExperimental setup & wave forms 4 RESULTS AND DISCUSSION The average crystalline size of the sol gel synthesized 10ZTwas 65nm obtained by Debye Scherer equation. Figure 3. XRD pattern of 10%ZrO 2-TiO Figure 4.FESEM image and FTIR spectra of 10ZT Wave number (/cm) 10% ZrO 2 -TiO 2 Fig3 shows crystalline phase, peak intensitiestio 2antase(011) at 2Ɵ=24.966, rutile(100) at 2Ɵ=27.07, t-zro 2(011) at 2Ɵ= and tetragonal crystalline structure was observed for ternary compound. Particlesize of 10ZT was recorded as 45nm with FESEM seen in Fig 4. Corrosion behaviour of coated samples reveals in Fig 5. Figure 5. Tafel curves and E corr values of the coated samples with different pulse frequencies 5 CONCLUSION 10%ZrO 2-TiO 2 nanocomposite material was prepared by sol gel method and characterized by XRD, FTIR, FESEM and electrocodeposited with Nickel watsbath. In this work different wave forms were used at 5V. DCpulsed frequencies have significant impact on the coating process. At low voltage and low current densities with pulse of t on<t off condition high corrosion resistance is produced. 6 ACKNOWLEDGEMENT The financial support from TEQUIP -PHASE II-COE is gratefully acknowledged. 7 REFERENCES [4] Hany M. Abd El-Lateef and Mai M. Khalaf. (2015), Corrosion resistance of ZrO2 TiO2 nanocomposite multilayer thin filmscoated on carbon steel in hydrochloric acid solution,materials Characterization, vol.108, [5] Liana Maria Muresan (2015), Electrodeposited Zn- Nanoparticle Composite Coatings for Corrosion Protection of Steel, Handbook of Nano electrochemistry, Springer International journal. [6] Mai M. Khalaf and Hany M. Abd El-Lateef, (2016), Corrosion protection of mild steel by coating with TiO2 thin films codoped with NiO and ZrO2 in acidic chloride environments, Materials Chemistry and Physics, vol. xxx, pp [7] Fen Zhang a, Shougang Chen a,yanhua Lei a, Tao Liu a and Yansheng Yin b, Preparation of superhydrophobic films on titanium as effective corrosion barriers, Applied Surface Science vol. 257, pp
90 Enhanced Corrosion Resistance of Pt Modified Polyaniline Coated on 316LSS as Metallic Bipolar Plates for PEM Fuel Cell Application K. Sriram, Raman Vedarajan * and N. Rajalakshmi Centre for Fuel Cell Technology, International Advanced Research Centre for Powder Metallurgy and New Materials (ARCI), IITM Research Park, India. *vedarajan.raman@arci.res.in Abstract-Stainless steel (SS) has been proven to be an effective alternative material for bipolar plates (BPPs) in proton exchange membrane fuel cells (PEMFCs). However, stainless steel BPPs are prone to corrosion and/or oxidation due to the acidic environment in PEMFCs, resulting in the formation of oxidants, passive layers and metal ions which ultimately degrades the performance of the fuel cells. To improve the corrosion resistance and durability of 316L stainless steel (SS), surface coating is required. Conducting polymers are one of the promising corrosion inhibitor which has high corrosion resistance and good electrical conductivity. In the present work, we have coated polyaniline on SS using electro-polymerization method followed by platinum deposition using electro-deposition method. The electropolymerization of polyaniline was achieved by cyclic voltametry at a scan rate of 20mVs -1 upto 3 cycles to achieve uniform coating over SS. The platinum particles were deposited on PANI/316L by potentiostatic method at a constant potential of V vs Ag/AgCl. The deposition of Pt was thought to improve the conductivity of the substrate and minimize the corrosion via blocking of pores. The surface morphology of the coated samples were examined by SEM. The XRD analysis has been carried out to study the composition. The corrosion current densities of polyaniline coated 316L SS in the simulated PEMFC anodic and cathodic conditions were around 0.2 µa/cm -2 and 7 µa/cm -2 respectively, which meets the 2020 DOE electrochemical corrosion target of 1 µa/cm INTRODUCTION In a PEMFCs (Proton Exchange Membrane Fuel Cells) environment, metallic bipolar plates are prone to corrosion and/or oxidation due to the presence of the acidic electrolyte membrane and at operating condition, which degrades the performance of the fuel cell. A feasible solution is to coat the metallic bipolar plate with a polymer layer. Although this method could inflict the corrosion problem, the method itself arises a new problem, as polymers are, in general, insulators and hence the very important requirement of bipolar plates viz., electrical conductivity. In the current work, Pt particles and PANI hybrid coatings on 316L SS were scrutinized using a two step electrochemical deposition technique for application in PEMFC BPPs. A thin layer of PANI coating was deposited in the primitive step pursued by Pt particle growth. 2 RESEARCH SIGNIFICANCE The adopted deposition technique is simple and economical, well controlled which minimizes the precious metal loading, thus, making the whole process costeffective and suitable for commercialization. 3 MATERIALS AND METHODS A three electrode system consisting of platinum counter electrode (CE), Ag/AgCl reference electrode (RE) and SS as a working electrode (WE) was commonly used for all electrochemical tests. All the electrochemical experiments were carried out using Solartron 1470 electrochemical work-station. Platinum-modified polyaniline electrodes were prepared in two steps: electropolymerization of aniline was followed by electrodeposition of platinum. The electropolymerization of 0.1 M aniline, dissolved in 0.5 M H 2SO 4, was carried out using the cyclic potential sweep at 20 mvs -1 between -0.2 and 1.4 V. The electrodeposition of platinum was carried out in 0.5 M H 2SO 4 containing 3 mm K 2PtCl 6.6H 20 solutions using constant potential step. Corrosion studies were conducted in a 0.5M H 2SO 4 electrolyte containing 2 ppm NaF, at a temperature of 65 C, bubbled with either H 2 or air to simulate the anodic or cathodic environment, respectively which mimics the PEM fuel cell environment. 3 RESULTS AND DISCUSSION 3.1 Electropolymerisation of polyaniline (PANI) Cyclic voltammogram of PANI in Figure 1 shows three cyclic scans, cycle 1, 2, and 3. Each cycle exhibited 3 peaks corresponding to three different forms of PANI. In cycle 3, the oxidation peak at 0.45V revealed a partially oxidized emeraldine state of PANI and the oxidation peak at 1.2V and the reduction peak at 0.2V represent the penigraniline and leucomeraldine states, respectively. 59
. 3.2 Electrodeposition of platinum particles Platinum particles were deposited onto pre-synthesized polyaniline film using 3mM H 2PtCl 6.")
91 Voltage (V) Current (A) Figure 1. Cycles 1, 2 and 3 of cyclic voltammogram of polyaniline deposition from 0.1M aniline in 0.5M H 2SO 4 with a scan rate of 20 mv/s (voltage vs. Ag/Agcl). 3.2 Electrodeposition of platinum particles Platinum particles were deposited onto pre-synthesized polyaniline film using 3mM H 2PtCl 6.6H 2O solution at a constant potential of V for 900 s to enhance the corrosion resistance of the 316L SS metallic bipolar plate.the actual potential of [PtCl 6] 2- reduction(pt 4+ Pt 0 ) in solution was approximately 0.5 V, whereas the cathodic peak current of platinum deposition appears at more negative potentials around V. This may be ascribed to a kinetic hindrance of the [PtCl 6] 2- reduction in the interior of the polyaniline film Material characterisation 1 st cycle 2 nd cycle 3 rd cycle SEM and EDX studies (Model: Hitachi SU1510) were carried out to confirm the deposition and distribution of Pt particles. Figure 2 (a) and (b) shows the images of porous PANI. The bright particulate matter in the back scattered SEM image can be attributed to the Pt particles. Pt particles were encapsulated into the micropores of PANI coated on SS. Also the line spectra and EDX data in Figure 2 (c) and (d) confirmed the Pt deposition over PANI coated on SS. X-ray diffraction (XRD) (Rigaku powdered diffractometer) studies carried out to study the composition, revealed Pt (111) and Pt (311) peak at 2ϴ value of 39.8 and 81.3, which is in accordance with JPCDS card no Figure 2. SEM micrographs for (a and b) Pt- PANI-316L SS and (c and d) are the line spectra and the EDX datas of Pt-PANI hybrid coated 316L SS. 3.4 Electrochemical Corrosion Tests Table 1 presents the potentiodynamic polarization data for uncoated 316L SS, PANI-316L SS and Pt-PANI-316L SS in the simulated cathodic and anodic PEMFC environment. On introduction of PANI, the PANI-316L SS corrosion potential shifted slightly to 0.07V Ag/AgCl in cathodic and 0.05V Ag/AgCl in anodic, but corrosion current density shifted to much more lower value of 6.9 and 2.5 µa/cm 2, which is nearer the DOE requirement (<1.0 µa/cm 2 ) for application of bipolar plates. The potentiodynamic polarization test was also carried out on Pt-PANI-316L SS to inspect the effect of Pt particles on the corrosion resistance and the results obtained for Pt- PANI-316LSS was 0.48V Ag/AgCl and 0.49 V Ag/AgCl in cathodic and anodic environment respectively, which depicts a significant positive shift compared to the corrosion potential of bare 316L SS and PANI-316L SS by 0.42V Ag/AgCl and 0.41V Ag/AgCl respectively. The higher current densities observed with Pt-PANI coating can be associated with the high catalytic activity of Pt nanoparticles. The noble shift in the E corr evinces corrosion protection in this case. Table 1. Corrosion parameters obtained from Tafel polarization curves 4 CONCLUSION Pt -PANI hybrid coatings were successfully prepared by depositing particle amounts of Pt on PANI coated 316L SS surface from extremely low concentration of K 2PtCl 6.6H 2O solution by utilizing a two-step electrochemical coating process. This allowed feasible, efficient, controlled and site selective deposition process to achieve the desired Pt loading. 5 ACKNOWLEDGEMENTS The authors would like to thank the Director, ARCI for his constant support and encouragement. 6 REFERENCES [1] Shirakawa, H., Louis, E. J., MacDiarmid, A. G., Chiang, C. K. and Heeger, A. J. (1977). Journal of the Chemical Society, Chemical Communications, (16), [2] Sathiyanarayanan, S., Devi, S. and Venkatachari, G. (2006),. Progress in organic coatings, 56(2-3), [3] Armelin, E., Meneguzzi, Á., Ferreira, C. A. and Alemán, C. (2009), Surface and Coatings Technology, 203(24), [4] Shanmugham, C. and Rajendran, N. (2015), Progress in Organic Coatings, 89,
92 Effect of Electrodeposition Techniques on the Performance of Platinum Electrocatalyst Towards Methanol Oxidation Bincy George Abraham * and Raghuram Chetty Department of Chemical Engineering, Indian Institute of Technology Madras, Chennai , India *bugz_4u2@yahoo.com Abstract Various electrochemical deposition techniques viz. potentiostatic, galvanostatic, cyclic voltammetry and pulse deposition techniques were employed to prepare platinum (Pt) electrocatalysts on titanium. The effect of electrodeposition techniques on the electrocatalytic activity towards methanol oxidation reaction (MOR) in acidic media was investigated to identify most suitable technique to achieve higher utilization of Pt metal as electrocatalyst. Furthermore, the deposition parameters of each deposition technique are optimized. Among the various deposition techniques, galvanostatic pulse electrodeposition technique showed significantly higher electrocatalytic activity and better stability for oxidation of methanol than other techniques. The enhancement in performance can be explained by higher electrochemically accessible area and easier charge transfer at the electrode/electrolyte interface. Keywords Platinum electrocatalyst, Electrodeposition techniques, Methanol oxidation, Titanium 1 INTRODUCTION Direct methanol fuel cells are one of the promising technologies for portable power sources due to their high efficiency, power density and environmentally friendly operation. One of the main barriers for the commercialization is the high cost and sluggish kinetics of Pt catalyst. Efforts are directed to solve this issue by enhancing the utilization of Pt used as electrocatalyst, which are often dispersed on a support material[1]. There are several techniques used for the preparation of supported Pt catalyst such as thermal oxidation, chemical synthesis, atomic layer deposition etc. Electrochemical deposition is one of the most useful methods because it provides several advantages such as high level of purity and low processing temperature. More importantly, for conductive supports electrodeposition is particularly attractive as it allows nucleation and growth of the nanoparticles on the substrate itself. The size and shape distribution of the electrodeposited nanoparticles can be easily controlled by tuning the electrolyte composition and deposition parameters. Electrochemical methods of producing nanoparticles utilize deposition techniques like potentiostatic deposition, galvanostatic deposition, cyclic voltammetry etc. Alteration of electrodeposition technique and synthesis conditions for preparing nanostructured Pt can significantly change both number and size of the nuclei and their distribution thereby facilitating improvement of the catalytic activity. Therefore, there is a need to study the effect of electrodeposition parameters on the performance of the catalyst towards methanol oxidation. 2 RESEARCH SIGNIFICANCE In this work, the effect of electrodeposition conditions on the electrocatalytic properties of Pt nanoparticles on titanium substrate were investigated for direct methanol fuel cell applications. Pt nanoparticles on titanium substrate were prepared by employing various electrodeposition techniques, optimizing the deposition parameters and thereby comparing performance towards methanol oxidation between deposition techniques and consequently achieving higher utilization of Pt. 3 MATERIALS AND METHODS Synthesis of Pt nanoparticles was carried out on the Ti foil using H 2PtCl 6 as the precursor. Ti foil having a geometric area of 2 cm 2 available to the electrolyte solution, was initially polished mechanically with emery papers of medium roughness. Further, it was sonicated in acetone, washed in millipore water and dried in oven. The deposition was carried out in an inert atmosphere at room temperature using 2mM H 2PtCl 6 in 10 mm H 2SO 4 solution with Ti foil as working electrode. Pt mesh and Ag/AgCl were used as counter and reference electrodes, respectively. For deposition, deposition parameters for each technique were varied to identify the most optimum deposition parameters. Deposition for each technique was performed till deposition charge which corresponds to loading of 0.65 mg cm -2 was achieved. The synthesized electrodes were physically characterized by high resolution SEM (Hitachi S4800). Electrochemical experiments were performed at room temperature on electrochemical workstation (Biologic SP- 150). Active electrochemical surface area (ESA) of the electrodes was determined by cyclic voltammetry in nitrogen saturated 0.5M H 2SO 4 at the sweep rate of 50 mv s -1. The activity towards methanol oxidation was studied in nitrogen saturated 0.5M H 2SO 4 with 1M CH 3OH by 61

93 scanning the potential from 0 to 1.4V. Electrochemical impedence spectroscopy (EIS) of the electrodes was measured in the frequency range of 100 mhz to 100 khz at an applied potential of 0.6V. In order to investigate the stability of the electrocatalysts, chronoamperometry measurement was performed at the potential of 0.9 V in 0.5M H 2SO 4 with 1M CH 3OH for 30 min at room temperature. 4 RESULTS AND DISCUSSION Initially, potentiostatic deposition (PS) was performed to identify suitable (a) deposition voltage. (b) Scanning electron micrographs of these electrodes showed various morphologies of nanoparticles. The morphology of nanoparticles varied from porous globular structure to dendritic structure to lamellar structure as we increased the deposition voltage in the cathodic direction from 0.2V to 0V to -0.2V, respectively. On electrochemical characterization, it was found that globular Pt nanoparticles prepared at 0.2V was found to show higher performance (c) towards methanol oxidation. Similar results were also reported in literature [2]. The average current densities during potentiostatic deposition (PS) were determined and applied for galvanostatic deposition (GS). SEM micrographs show almost same trend in morphology from globular to lamellar as applied current density increases. However, the shapes of nanoparticles are not prominently distinguishable as in case of PS [3]. This clearly demonstrates that PS is more useful for control of deposit morphology. Electrochemical performance characterization showed the maximum performance at an applied current density of ma cm. In both these techniques, we obtained inhomogeneous Pt nanoparticle growth due to significant concentration gradient of metal ions near the substrate. Hence, to reduce the formation of metal ion concentration gradient, cyclic voltammetry deposition (CV) and pulse current deposition (PC) was performed. PC was performed for various duty cycles while maintaining average current density to be same as the optimum current density from GS. SEM images of these deposition techniques showed similar globular structures and showed higher performance towards methanol oxidation when compared to PS and GS. More importantly, in PC, as we moved from 100% to 10 % of duty cycle, performance increased significantly. The enhancement in performance can be explained by higher electrochemically accessible area and easier charge transfer at the electrode/electrolyte interface. Figure 1. (i) Scanning electron microscope images of Pt electrodeposited on Ti during pulse electrodeposition at pulse amplitude of -2.5 ma cm -2 and duty cycle of 10%; Comparison of cyclic voltammograms of the Pt catalyst prepared by deposition technique (a) Galvanostatic (GS) and (b) Pulse Current Deposition (PC) in (ii) 0.5M H2SO4 at 50 mv s -1 and (iii) 0.5M H2SO4 + 1M CH3OH at 50 mv s -1 5 CONCLUSION Potentiostatic deposition is useful technique to achieve various morphologies of nanoparticles. Deposits of galvanostatic deposition can be related to potentiostatic deposition by comparing the current densities used or achieved in these techniques. Cyclic voltammetry and pulse electrodeposition are useful techniques to achieve efficient Pt deposition as they reduce the formation of metal ion concentration gradient during deposition resulting in homogeneous and more active electrocatalysts. A lower duty cycle during pulse electrodeposition was found to be favorable towards methanol oxidation because thus prepared electrodes had higher electrochemically accessible area and easier charge transfer at the electrode/electrolyte interface. 6 ACKNOWLEDGEMENTS We would like to acknowledge the financial support from the Ministry of New and Renewable Energy (MNRE) of the Government of India. 7 REFERENCES 4 (a) ma cm -2 a b 100 (b) -2.5 ma cm -2 10% duty cycle (i) (ii) (iii) 2 b 80 Current Density (ma cm -2 ) (a) ma cm -2 (b) -2.5 ma cm -2 10% duty cycle Potential (V (vs. SHE)) [1] Carrette L., Friedrich K. A. and Stimming U. (2001), Fuel Cells - Fundamentals and Applications, Fuel Cells, Vol. 1, pp [2] Hu J., Lu X., Foord J. S. and Wang Q. (2009), Electrochemical deposition of Pt nanoparticles on diamond substrates, Phys. Status Solidi Appl. Mater. Sci., Vol. 206, pp [3] Paoletti C., Cemmi A., Giorgi L., Giorgi R., Pilloni L., Serra E. and Pasquali M. (2008), Electro-deposition on carbon black and carbon nanotubes of Pt nanostructured catalysts for methanol oxidation, Journal of Power Sources, Vol. 183, pp Current Density (ma cm -2 ) a Potential (V (vs. SHE)) 62
94 High Corrosion Resistance Performance of Graphene- Tio2 Nanocomposite, Synthesized by A Green Route B. Niveditha Reddy 1, V.N. Ruchira 2, K. S. Aneesha 2, V. Sumedha 2, Dr. C. H. Shilpa Chakra 1* 1 Centre for Nano science and technology, Institute of Science and Technology, Jawaharlal Nehru Technological University Hyderabad, Telangana state 2 Department of Metallurgy, Jawaharlal Nehru Technological University Hyderabad, Telangana state *shilpachakra.nano@jntuh.ac.in Abstract Graphene is synthetically inactive material, the system of carbon particles that shape graphene is impermeable to shield a material from erosion and its thickness keeps the chemical properties of the ensured material unaltered. TiO2 acts an anti corrosion material because of its rare physiochemical properties and high chemical stability. A green method for the synthesis of graphene from jaggery as carbon source, a common disaccharide and titanium dioxide nanoparticle s (NP) from coffee bean extract were used. Where the caffeoylquinic acids, chlorogenics acids along with antioxidants present in coffee acts as reducing medium, which were further made into a composite material coated on to the sand resulting into a new composite of graphene-titanium dioxide sand composite (GTSC) by means of a simple immobilization technique without using any other binding material. The synthesized material will be further characterized using X-ray diffraction,uvvisible spectroscopy, Particle size analysis and Fourier Transform Infrared spectroscopic techniqu es. The corrosion stability of the synthesized GTSC com posite material will be determined. Keywords: Graphene, TiO 2, Composite, Corrosion resistance, Green synthesis. 2 INTRODUCTION Environmental and economic impacts of corrosion have become a problem of worldwide significance [1]. Corrosion by definition is the deterioration of a material due to the electrochemical reaction [2] to form a stable compound. To forbid the corrosion, we implement using different protective measures, of which coatings have shown higher change of impact [3]. Of all the metals, titanium is one of the mostly used material as corrosion inhibitor due to a thin film that consists essentially of titanium dioxide which stops the exchange of ions through it [4]. Graphene an allotrope of carbon, has got special attention to the exploration in the field of corrosion resistance, the 2D material is ultra thin transparent film, yet is too dense to resist the passivation of even the smallest helium atom through it being impermeable [5], even though its impermeable, it permeates water times faster than helium, an advantage of graphene in the water purification domain turns out into a blockade for its use in corrosion resistance [6]. 3 RESEARCH SIGNIFICANCE Graphene and titanium dioxide NP are coated on to silica sand to form Graphene-TiO 2 sand composite (GTSC), the limitations of titanium are well treated with the use of graphene having high thermal stability, robust in nature and likewise, the permeation of water through graphene is down streamed using TiO 2 NP, which shows the water contact angle (WCA) increment due to its addition and forms a superhydrophobic coating with high inhibition towards corrosion [7]. 4 MATERIALS AND METHODS 4.1 Synthesis of TiO2 NP: Green route method is opted for the synthesis of TiO 2 NP, raw coffee bean extract is taken as reducing agent. Addition of extraction to the titanium isopropoxide (TTIP) at constant stirring for 3hrs, will be resulting in TiO 2 NP. The resultant material is calcined at temperatures 400 C and 600 C to observe the phase transformation [8]. 4.2 Synthesis of graphene sand composite (GSC)of TiO2 NP: Jaggery(C 6), a common disaccharide is taken to form graphene on sand. Equal weight ratios of sand and C 6 were taken in the Chemical Vapour Deposition (CVD) technique, which deteriorates the carbon source with aid of temperature for graphitization onto sand, mobilizing graphene onto it without any other binding material. The activation of the composite was done by treating it with 1:2 ratio sulphuric acid blend which is maintained undisturbed at 28 C for 30 minutes [9]. 4.3 Synthesis of Graphene-TiO2 sand composite (GTSC) Similar procedure of GSC is implemented for GTSC where the nanocomposite formation is acheived by adding TiO 2 NP (rutile phase) to the sugar (C 6). TiO 2 NP are deposited on the surface of sand along with carbon source, 63

.")
95 successive process of nitrogen atmosphere in CVD will result in Graphene incorporated TiO 2 NP on the surface of sand, it is noted that with the help of CVD technique, phase transformation of TiO 2 NP is attained. 5 RESULTS AND DISCUSSION The GTSC, GSC, TiO 2(R) and TiO 2(A) material s analysis were carried out using various characterization techniques like XRD, PSA, Zeta potential, UV-Vis spectroscopy and FT-IR techniques. The average crystalline size of the materials were calculated as nm, nm, nm and nm using XRD as shown in Figure 1(A).The mean particle size values of the materials are 21.5 nm, 13.1 nm, 50.4 nm and 55.7 nm as shown in Figure 1(D). The absorbance and the band gap energy values were calculated as 3.2 ev, 3.0 ev, 0.5 ev and 0.32 ev are shown in Figure 1(B). The peak observed at 670cm -1 indicates TiO stretching bonds. GSC displays absorptions at cm -1 (C O C stretching vibrations), cm - 1 (O H deformation of the C OH groups), In GSC-TiO 2 (GTSC) NP showed the board peak, which is the combination of vibration at cm -1 shows Ti-O-Ti and Ti-O-C. The Ti-O-C indicates the bonding between TiO 2 and GSC, with the consistent of functional groups and carboxylic acid were residual, which means the surface of hydroxyl groups firmly interacted with of TiO 2 NP as shown in Figure 1(C). Chemical stability of these materials were attained and are shown in Figure 1(E). D A C B E 6 CONCLUSION The synthesized Graphene-TiO 2 sand composite material along with GSC and TiO 2 NP are attained by a green route. The characterization of TiO 2 (A), TiO 2 (R), GTSC and GSC materials were attained resulting in the formation of nanoparticles (NP) with good stability and morphological structures. The UV-Vis spectrum shows good absorbance between nm and the FT-IR results show the bonding between functional groups which confirms the formation of graphene- titanium dioxide sand composite. 7 ACKNOWLEDGEMENTS Centre for Environment for providing the facility of Chemical Vapour Deposition (CVD) Equipment. 8 REFERENCES [1] J.H. Payer et al., June 1980, Mater. Perform., Vol 19 (No. 9), [2] J G N Thomas et al, 1983, The electrochemistry of corrosion, Vol (48), 1-7 [3] Camila G. Dariva and Alexandre F. Galio et al, 2014,Corrosion Inhibitors Principles, Mechanisms and Applications, Vol (16), p [4] Kamika, Harishini, Mastumoto et al, July 2014, Characteristic applications of High corrosion resistant titanium alloys, metal technical Vol(106), [5] Q. Zheng, J.-K. Kim et al, 2015, Graphene for Transparent Conductors, Synthesis, Structure, and Properties of Graphene and Graphene Oxide, Springer Science Business Media New York,, 2-5 [6] R. R. Nair, H. A. Wu, P. N. Jayaram,. V. Grigorieva, A. K. Geim et al, Unimpeded Permeation of Water through Helium-Leak Tight Graphene-Based Membranes, SCIENCE,VOL 335 [7] Md J. Nine, Martin A. Cole, Lucas Johnson, Diana N.H. Tran, and Dusan Losi et al, ACS Applied Materials & Interfaces., 2015, ACSAppl.Mater.InterfacesVol7, [8] K. Ganapathi Rao, Ch. Ashok, K. Venkateswara Rao, Ch. Shilpa Chakra, V. Rajendar et al, 2015 Vol (629), [9] Soujit Sen Gupta et al, 2012, Graphene from Sugar and its Application in Water Purification, ACS Appl. Mater.Interfaces, Vol (4), Figure 1. XRD-1(A), UV Vis-1(B), FT-IR-1(C), PSA- 1(D), Zeta potential-1(e). 64
96 Study and Synthesis of Nanoparticles in Antifouling Coatings for Preventing Microbially Induced Corrosion (MIC) Yaduraj K, M Vivek *, Sruthy C Nair and Shijina TKM College of Engineering, Kollam Kerala *vivekprimeindia@gmail.com Abstract Nanotechnology has found many advantages over the conventional methodologies in every field. The methodology and ease of usage makes nanotechnology a well-adapted way to overcome the most vulnerable situations in technology. We had incorporated nanotechnology in antifouling coatings to increase the antifouling properties and hence reduces the rate of corrosion. Graphene nanoparticles with a metallic oxide and a copolymer has been used for the study and synthesis. The combination of materials is in such a way that it can bind well with the material (the one to be protected from corrosion) and last longer than the conventional type Keywords- Antifouling coatings, Graphene, Nanoparticles, Corrosion prevention 1 INTRODUCTION The prime need while synthesizing antifouling coatings using nanoparticles is of a perfect selection procedure [1]. Graphene is the nanoparticle selected for preparation of the antifouling coatings. Graphene oxide nanoparticle is synthesized by modified Hummer s method [2]. Copolymers are also used [3]. Graphene has anticorrosive properties on low temperature growth of graphene on metallic oxides. 2 RESEARCH SIGNIFICANCE The Hull condition of a ship decides the fuel efficiency of the ship. The lesser the frictional resistance, more will be the efficiency of the ship. With time, marine fouling and sea condition roughens the hull surface of the ship. Thus, antifouling comes into play where it can both make a protective coating to prevent the attachment of marine organisms as well as a friction free surface for smoother efficiency. Imparting nanotechnology is another innovative feature that can extend the lifetime of the coating as well as create a hydrodynamic surface and thus increase the efficiency. Graphene the nanoparticle used has anticorrosive properties on low temperature in situ growth of graphene on metallic oxides. 3 MATERIALS AND METHODS Graphite flakes (acid treated 99%), Potassium permanganate (99%), sodium nitrate (98%), Hydrogen peroxide (40% weight), Sulphuric acid (98%), Hydrochloric acid (98%), copolymer, water as a solvent, sample of coating paint. Graphene oxide(go) was prepared from graphite flakes by using modified Hummer s method [2] which is a universally accepted method. i. 2 g of graphite flakes and 2 g of NaNO 3 and 50 ml of H 2SO 4(98%) were mixed in a 1000 ml volumetric flask kept under ice bath(0-6 C) with stirring continuously. ii. The sample mixture was stirred for 2 hrs. at the same temperature and 6g of potassium permanganate (KMnO 4) was added to the suspension very slowly. The addition rate was controlled carefully to preserve the reaction temperature lower than 14 C. iii. Then the ice bath was removed and the sample mixture was stirred at 30 C till it became pasty brownish and kept under stirring for 2 hrs. For every half an hour, increase the temperature. iv. Then it was weakened with the slow addition of 100ml of water. The reaction temperature was increased quickly to 96 C with effervescence, and the color changes to brown type of color. v. Further, this solution mixture was weakened by the addition of 200ml of water stirred continuously. vi. The solution mixture was finally treated with 8ml H 2O 2 to terminate the reaction by the form of yellow color. vii. For purification, the mixture was washed by centrifugation and rinsing with 8% HCl and then deionized water(di) for various times. viii. After purification and then it dried in hot water oven, the graphene oxide was obtained as powder. We will be synthesizing zinc 3-(allyloxy) propanoate as a new self-polishing monomer to be incorporated with other monomer units like a methyl methacrylate,2 hydroxyethyl methacrylate, and ethyl acrylate in desired copolymers. We are using water as a solvent. 65
97 Taking a sample of paint, we add the graphene oxide nanoparticle along with the polymer and the solvent and stir it well in a centrifuge. 3.1 What are the details that can be included? We are expecting about 85% efficiency. And it will prevent corrosion for a longer period of time compared to the paints used nowadays. Polymer used if sticky will provide better results. 4 RESULTS AND DISCUSSION Characterization is yet to be completed. 5 CONCLUSION The prepared graphene oxide Nano paint is expected to exhibit good corrosion resistant behavior both in acidic and high salt content solutions as will be examined by electrochemical corrosion tests. Results also will show that graphene oxide nano paint inhibited bacterial growth on its surface and in turn fouling is prevented. 6 ACKNOWLEDGEMENTS We are planning to continue our project and make some advancements in the field of corrosion resistance. We would like to work with naval materials research laboratory (DRDO) and look forward for funds for our research and synthesizing the products. 7 REFERENCES [1] Liu C. (2015), Development of Anti-fouling Coating Using in Marine Environment, Int. J. Environ. Monit. Anal., Vol. 3, pp [2] Narasimharao K, Ramana V. G, Sreedhar D, and Vasudevarao V (2016), Synthesis of Graphene Oxide by Modified Hummers Method and Hydrothermal Synthesis of Graphene-NiO Nano Composite for Supercapacitor Application, J. Mater. Sci. Eng., Vol. 5, pp [3] S.-M. Kim, A. Y. Kim, I. Lee, H. Park, and D.-H. Hwang (2016), Synthesis and characterization of self-polishing copolymers containing a new zinc acrylate monomer, J. Nanosci. Nanotechnol., Vol. 16, pp
98 ELECTROCHEMICAL TESTING TECHNIQUES
99
100 Effect of Corrosion on Bond Strength of Reinforced Concrete Element due to Impressed Voltage Sheetal Sahare *, Bilavari Karkare Vishwakarma Institute of Information Technology, Pune, India Abstract Deterioration due to corrosion of steel rebar is one of the strength and durability issues of reinforced concrete (RC) structures. Natural corrosion takes long time before damage to RC structures becomes visually noticeable. To reduce laboratory test duration, normally impressed current technique with high voltages is used to induce corrosion. It is necessary to study whether the high voltages impressed simulate the deterioration of bond between steel rebar and concrete as in natural corrosion or not. In present work, effect of corrosion on bond strength was studied using three different impressed voltages. Singly reinforced concentric concrete cylinders were subjected to accelerated corrosion till appearance of first visible crack on concrete surface and then were tested for bond strength. Specimens subjected to high voltage showed lesser effect on bond strength whereas specimens subjected to low voltage showed deterioration of ribs resulting in significant reduction of bond strength. Keywords - Reinforced concrete, rebar corrosion, impressed voltage, bond strength. 1 INTRODUCTION Adequate bond between steel rebar and concrete is necessary for satisfactory performance of RC element. For deformed bars, bond between rebar and concrete is developed through chemical adhesion, frictional resistance with major contribution of mechanical interlocking [1]. Cracks are inherent in reinforced concrete. Moisture ingress through the existing cracks and pores in concrete, reaches to rebar initiating corrosion. Corrosion reduces cross sectional area of rebar, causes cracking and spalling of concrete cover; reducing strength and service life of RC element. To study effect of corrosion on bond between steel rebar and concrete in laboratory conditions, researchers often use impressed current technique to induced corrosion [2-3] with high impressed voltages to reduce test duration. Use of high impressed current may not simulate the natural corrosion condition and may give misleading results. 2 RESEARCH SIGNIFICANCE Corrosion of steel rebar affects the bond between rebar and concrete subsequently reducing the bond strength. To study effect of corrosion on bond strength in laboratory, high impressed voltages are used to reduce test duration. To avoid misleading results, it is necessary to simulate natural corrosion condition. Present experimental work aims to study the effect of various impressed voltages on bond between rebar and concrete in RC element. 3 MATERIALS AND METHODS 3.1 Materials and test specimens Singly reinforced concentric concrete cylinders of 100mm diameter and 200 mm height using Fe500 (TMT) bars of diameter 20 mm, 16 mm, 12 mm and M30 grade of concrete were cast. Bond length was limited to 8 times bar diameter ( ). Concrete mix was designed as per IS: [4] ( Mix proportion :1:1.67:2.64). The specimens were cured in water for 28 days. 3.2 Test program On 29 th day, the specimens were immersed in 3.5% NaCl solution for 24 hours for full saturation. Impressed current technique was used to accelerate corrosion. Positive terminal of DC source was connected to rebar and negative terminal to stainless steel (SS) sheet. Three different voltages viz. 10 V, 6 V and 4 V were impressed onto the specimens till first distinct crack appeared on surface of the specimens. Control specimens (without corrosion) and corroded specimens were then subjected to pullout test to find bond strength. The test was performed using UTM of capacity 1000 kn with load cell attachment of capacity 200 kn. A uniform load of 2 kn/minute was applied till the specimen failed in bond. 4 RESULTS AND DISCUSSION 4.1 Time for development of first crack on specimen Time (t 1) required to develop first distinct crack on specimen surface was recorded for all specimens (Table 1). It was found that specimens with highest c/d ratio and 67
101 lowest voltage required maximum t 1. Larger concrete cover delayed the propagation of crack to the surface. Lower impressed voltage reduced corrosion rate. Specimens with lowest c/d ratio and highest voltage required minimum t 1. Smaller concrete cover reduced the time for propagation of crack to the surface. Higher impressed voltage increased corrosion rate. 4.2 Type of corrosion All specimens showed localized pitting type of corrosion. Specimens with highest voltage of 10 V showed two or three deep pits resulting into localized corrosion whereas specimens with lowest voltage of 4 V showed shallow and closely spaced pits looking like uniform corrosion. This type of corrosion is normally observed under natural corrosion conditions. 4.3 Bond strength Ultimate bond strength ( bd) was calculated at the failure load (P u) assuming uniform stress distribution along bond length (L d). The bond strength was calculated using Eq. 1. Bond strength of different specimens is summarized in Table 1. Pu bd.. L d Eq. (1) Specimens subjected to higher voltage showed pitting corrosion. Remaining area of rebar along the bond length was unaffected by corrosion resulting in retaining the bond between concrete and rebar, due to which the bond strength did not reduce significantly. For specimens subjected to lower voltage showed near-uniform corrosion with shallow and closely spaced pits on the rebar surface and also resulted in loss of ribs. It eventually affected mechanical interlocking and significantly reduced the bond between steel rebar and concrete resulting into considerable loss of bond strength. Retained bond factor (RBF) was calculated as ratio of ultimate bond strength of corroded specimens and that of non-corroded specimens to get an idea of effect of corrosion on the bond strength. Maximum RBF was found for specimens with highest voltage and highest c/d ratio whereas minimum RBF was obtained for specimens with lowest voltage and lowest c/d ratio. Table1. Test results c/d ratio Impressed voltage (V) Time (t1) in days Ultimate bond strength (MPa) RBF CONCLUSION From the experimental work carried out, it was observed that the time required for development of first crack on surface of specimen reduced with increase in impressed voltage and decrease in c/d ratio. Impressed voltage had significant effect on bond between steel rebar and concrete. Higher impressed voltage did not affect the bond strength considerably and did not simulate the natural corrosion condition. Lower impressed voltage resulted in deterioration of the rebar ribs and hence significant loss of bond between steel rebar and the concrete. This condition was found to be similar to natural corrosion condition. 6 REFERENCES [1] R. Tepfers. (1979), Cracking of concrete cover along anchored deformed reinforcing bars, Mag. Concr. Res. 31 (106), pp [2] A. Kivell, A. Palermo and A. Scott (2011), Effects of Bond Deterioration due to Corrosion in Reinforced Concrete, Proceedings of the Ninth Pacific Conference on Earthquake Engineering Building an Earthquake-Resilient Society, pp [3] Lee C., Bonacci J.F., Thomas M.D.A., Maalej M., Khajehpour S., Hearn N., Pantazopoulou S. & Sheikh S. (2000), Accelerated corrosion and repair of reinforced concrete columns using CFRP sheets. Canadian Journal of Civil Engineering, 27(5), pp [4] IS: , Concrete mix proportioning guidelines, Bureau of Indian Standards, New Delhi,
102 The Effect of Electrochemical Migration of Pb-free Sn 3.0Ag 0.5Cu Solder Reinforced by NiO Nanoparticles Fakhrul Rifdi Omar 1*, Emee Marina Salleh 1, Norinsan Kamil Othman 1, Fakhrozi Che Ani 2, Zambri Samsudin 2 1 School of Applied Physics, Faculty of Science and Technology, Universiti Kebangsaan Malaysia, Bangi, Selangor Darul Ehsan, Malaysia 2 Jabil Circuit Sdn.Bhd., Bayan Lepas Industrial Park, 11900, Penang Malaysia *fakhrulrifdi@gmail.com Abstract The present study investigates the effects of NiO addition on the mechanical properties and microstructure of the Sn-3.0Ag-0.5Cu (SAC305) solder alloy. In this study, three different solder alloy were prepared by reflow soldering. SAC 305 solder alloys were doped with different percentage of Nickel oxide (NiO) nano-particles content; i.e wt%, 0.05 wt%, and 0.15 wt% in producing nanocomposite solder paste. Electrochemical migration of SAC305-NiO nano composites solder pastes was measured using water drop test. Effects of the mean-time-to-failure (MTTF) and the dendrites growth were investigated using optical microscopy. Keywords-SAC305, NiO Nanoparticle, Microstructure, Corrosion, Dendrite. 1 INTRODUCTION Soldering offers important technology on microelectronic packaging industries. It allows electrical current to flow from one point to another and become a supporter of the electrical components. Recently, the lead free Sn-Ag-Cu solder alloy has been commercially used as an alternative to Sn-Pb solder due to the vital issue on hazardous effect [1 4]. This is due to poisonous qualities of lead which is harmful to human health and also to the environment [5]. Tin based solder alloy becomes the replacement for lead solder alloy [4]. Tin containing binary and ternary alloying elements has been most directed towards it [6]. Eutectic tin-silver-copper has a melting point around 216 C, which is 30 C little higher than that of eutectic lead-tin (Tm = 183 C). The addition of silver and copper reduces about 16 C of the melting point of tin (232 C). Tin-silver solders are already used with success in high temperature applications.[7] Others researcher had focus on some lead-free content solders, which may cause high risk in electronic devices due to Electrochemical migration (ECM) failure phenomenon [8]. This phenomenon involves the dendritic growth [11, 12]. It will lead to short circuit to occur in the electronic device issue is related to the susceptibility of Sn-Ag-Cu to corrosion [11]. 2 RESEARCH SIGNIFICANCE According to the previous work, researcher tend to investigate the lead free solder alloys using alkaline solution, acidic solution and saline solution [12]. ECM investigation of the lead-free SAC305 containing NiO nanoparticles solder alloy when it is exposed to Sodium Chloride (NaCl) solution that simulates the seawater [13]. Therefore in this paper, the ECM behaviour of lead-free SAC305 is investigated by using the water drop test (WDT) with NaCl solution as a medium. It was carried out to record the time-to-failure of each sample. The results are then taken to compare its susceptibility to ECM despite using optical microscopy. 3 MATERIALS AND METHODS Water Drop Test (WDT) is carried out by using a standard comb pattern. It was designed according to the IPC-B-24 test board. The SAC305 containing different wt.% of NiO ( SAC305,SAC NiO, SAC NiO and SAC NiO ) was provided by JABIL Circuit SDN BHD. The test board was well-printed with content solder alloy by using DEK NeoHorizon 01 ix, then the test board passed into reflows soldering by using Vitronics XPM2 Reflow Oven. The time-to-failure which indicates the short circuit formation was detected by voltage step measurements on a resistor (R =1 kω) connected in series to the interdigital structure as shown in Figure 1. U shows the power supply, R is the resistor and V is the voltmeter [14]. 3.1 Water drop test During WDT, 15µml sodium chloride (NaCl) solution was dropped by micropipette onto 8 comb patterns and 10V DC was applied to each of the sample. To simulate the seawater or other salty contaminations, a WDT has to be carried out by using deionized water. Based on 69

![The formation of dendrites was monitored visually by an optical microscope AXIOLAB A1[14]. affected the dendritic growth. Therefore, SAC305-0.15NiO has a high corrosion resistance in NaCl medium.](/docs-images/78/76861956/images/103-1.jpg "a b c d Figure 1. Schematic diagram of the test platform of Water Drop Test (WDT) 4 RESULTS AND DISCUSSION WDT has been carried out by using electric and 1.0M NaCl solution with the power voltage.")
 were the average value of the measured failure times. Figure 2 shows the MTTF data acquired for the solders. SAC305 shows the fastest failure process which took 850 s.")
103 investigation by other researchers, the mean-time-tofailure shall not be less than 180 s. If the dendrites grow within 180 s, it shows that the test board use unclean and it cannot be further continue with WDT using the NaCl solution. The formation of dendrites was monitored visually by an optical microscope AXIOLAB A1[14]. affected the dendritic growth. Therefore, SAC NiO has a high corrosion resistance in NaCl medium. a b c d Figure 1. Schematic diagram of the test platform of Water Drop Test (WDT) 4 RESULTS AND DISCUSSION WDT has been carried out by using electric and 1.0M NaCl solution with the power voltage. The droplets volume and the resistance was set constant. The voltage value drops to 0 V and the time-to-failure was recorded. Mean-time-to-failure(MTTF) were the average value of the measured failure times. Figure 2 shows the MTTF data acquired for the solders. SAC305 shows the fastest failure process which took 850 s. Then SAC NiO, SAC NiO and SAC NiO. The MTTF data was longer than compared to the study that had been done by Medgyes et al. [8] Mean Time To Failure (s) Figure 2. MTTF of SAC 305 added with 0.01,0.05,0.15wt% NiO 4.1 Optical Microscope Observation Optical microscopy (OM) had been used to observed the IPC-24 test board after the WDT. The changes occurs observed under OM. Figure 3 exhibits that the entire test board sample had undergo the electrochemical migration. The formation of dendrites leads to the short circuit of the microelectronic board. According to the results the following electrochemical migration can be drawn, SAC305 has the highest susceptibility for ECM. SAC305>SAC NiO>SAC NiO> SAC NiO. 5 CONCLUSION wt% NiO with SAC305 The results show that the MTTF of SAC305 has the fastest mean-time-to-failure. The alloying element Figure 3. Optical microscopy image of SAC305 at 100X (a)sac305 (b) SAC NiO (c) SAC NiO (d) SAC NiO after WDT using 15µml of 1.0 M NaCl solution 6 ACKNOWLEDGEMENTS This work was supported by the Ministry of Higher Education, Malaysia under the Fundamental Research Grant Scheme FRGS/1/2016/STG07/UKM/02/1 and the authors thanks Jabil Circuit Sdn Bhd for their collaboration in this research. 7 REFERENCES [1] E. H. Elektroniikan, NEXT Symposium, Finland, no. September 2015, [2] P. Biocca and C. Rivas, Proc. Int. Symp. Exhib. Adv. Packag. Mater. Process. Prop. Interfaces, pp , [3] W. Loss, A Study of Lead-Free Wave Soldering, Am., 7 8. [4] E. Efzan Mhd Noor and A. Singh, Solder. Surf. Mt. Technol., vol. 26, no. 3, pp , [5] J. Y. Jung, S. B. Lee, H. Y. Lee, Y. C. Joo, and Y. B. Park, J. Electron. Mater., vol. 37, no. 8, pp , [6] I. Ahmad, A. Jalar, B. Y. Majlis, and R. Wagiran vol. 4, no. 1, pp , [7] S. L. Lewis, eutectic alloys Lewis, Sarah Microstructural Evolution in Tin- Eutectic Alloys May 2003, [8] B. Medgyes, B. Illes, and G. Harsanyi, Period. Polytech. Electr. Eng., vol. 57, no. 2, pp , [9] L. T. F. Mendes, V. F. Cardoso, and A. N. R. da Silva, J. Integr. Circuits Syst., vol. 6, no. 2, pp , [10] G. A. Wayman et al., Environ. Health Perspect., vol. 120, no. 7, pp , [11] C. W. See, M. Z. Yahaya, H. Haliman, and A. A. Mohamad, Procedia Chem., vol. 19, no. May, pp , [12] D. Li, P. P. Conway, and C. Liu, Corros. Sci., vol. 50, no. 4, pp , [13] C. D. Zou et al., J. Electron. Mater., vol. 38, no. 2, pp , [14] N. K. Othman, K. Y. Teng, A. Jalar, F. Che Ani, and Z. Samsudin, Mater. Sci. Forum, vol. 846, pp. 3 12,
104 Performance Evaluation of Coated Rebar under Accelerated Corrosion using Electrochemical Techniques Shilpa Patil*, Prafulkumar Yenape, and Bilavari Karkare Vishwakarma Institute of Information Technology, Pune Abstract The objective of this research-work was to provide a comparative assessment of corrosion resistance of three different types of commercially available coatings namely, epoxy, primer and zinc galvanized coatings using electrochemical techniques. As the electrochemical techniques require direct contact with corroding rebar, corrosion assessment of coated rebar becomes difficult. Hence, the work also aimed to check the applicability of electrochemical techniques for performance evaluation of coated rebar. The experimental work consisted of casting singly reinforced cylindrical specimens with fully and partially coated rebars and subjecting to accelerated corrosion. The results indicated superior performance of epoxy coatings compared to primer and zinc galvanized coatings in both fully and partially coated conditions. Having a little contact with steel, half-cell potential technique well identified the corrosion activity in fully as well as partially coated rebar. On the other hand, Tafel extrapolation technique could identify corrosion activity in partially coated rebar only. Keywords - Rebar corrosion, Coatings, Half-cell potential, Tafel extrapolation technique 1 INTRODUCTION Now-a-days corrosion of steel in concrete construction, particularly those construction located in industrial polluted area and marine environment is one of the major problems. To avoid the corrosion of steel, various methods are available like use of high quality of concrete, sufficient thickness of concrete cover, modifying the chemical composition of steel rebar and metallic and organic coating on surface of rebar. Coating of the reinforcement reduces the risk of corrosive attack in concrete [1] and hence the method is popular in commercial application. Varity of coatings ranging from use of cement slurry to application of epoxy on steel surfaces are available in market. Various researchers [2, 3 and 4] have evaluated the performance of different coatings using various non-destructive techniques. To study the effectiveness of different coatings against corrosion, the researchers either scratched the coating or left certain portion uncoated on the steel rebar. In practice, fully coated reinforcing bars are used in RC structures and corrosion evaluation of such rebars using electrochemical technique becomes difficult as instruments require direct contact with steel surface. Hence there is a need to study the applicability of electrochemical techniques for corrosion assessment of coated rebars. 2 RESEARCH SIGNIFICANCE The present work demonstrates the effectiveness of two electrochemical techniques - half-cell potential and Tafel extrapolation, for corrosion assessment of coated rebars along-with comparative assessment of corrosion resistance of three different types of commercially available coatings - zinc galvanized, epoxy and primer, using electrochemical techniques. The findings of this research work may help in selection of appropriate electrochemical technique applicable for corrosion assessment of coated rebars. 3 EXPERIMENTAL PROGRAM 3.1 Materials and specimen preparation Singly reinforced concrete cylinders with 16 mm diameter and 110 mm length concentric steel (TMT Fe 500 grade) with clear bottom cover of 20 mm were cast. M35 grade concrete having proportion 1: with 0.5 watercement ratio (designed as per IS 10262:2009) was used. Before casting, 4 mm diameter groove was drilled at one end of rebar for the purpose of electrical connections. The steel surface was then cleaned with wire brush and coated using epoxy / primer / zinc galvanization either fully or partially (three specimens each). The test matrix for the same is given in Table Accelerated corrosion and measurements Before casting of specimens, weight of every rebar was measured with accuracy of 0.05 gm. All cylindrical specimens were cured for 7 days period. After curing the specimens were immersed in 5% NaCl solution for saturation for one day and from next day the specimens were subjected to accelerated corrosion using impressed current technique. The constant voltage of 10 V and 6 V was applied between reinforcing steel (anode) and stainless steel mesh (cathode) for fully coated rebar and 71
105 partially coated rebar specimens respectively using DC power supply. The half-cell potential (vs Saturated Calomel Electrode (SCE)) and Tafel extrapolation measurements were recorded every day by disconnecting the power supply before half an hour and during the measurements. All the specimens were subjected to accelerated corrosion till appearance of visible crack on the concrete surface due to corrosion. Table 1. Test matrix Notation Efc Pfc Zfc EPc Ppc Coating material Epoxy Primer Zinc galvanized Epoxy Primer Type of coating Full coat Full coat Full coat Partial coat Partial coat 4 RESULTS AND DISCUSSION Length of coating 110 mm 110 mm 110 mm Top 65 mm and bottom 35 mm Top 65 mm and bottom 35 mm Figure 1 shows the variation of half-cell potential (HCP) with time for all specimens. Figure 1. Variation of HCP with time for all specimens From Figure 1 it can be seen that with progress of time, the HCP values decreased continuously indicating continuous increase in active corrosion. Fully epoxy coated rebar showed HCP values less negative than V indicating low risk of corrosion till the end of testing whereas, fully primer coated and zinc galvanized rebars showed increase in corrosion levels from moderate to severe with the progress in corrosion indicating 90% probability of active corrosion. Similar results were obtained for partially epoxy and primer coated rebars. Figure 2 shows variation of corrosion rate with time for specimens with rebars coated partially with primer and epoxy. The corrosion rates were calculated based on Tafel extrapolation measurements. Because of the presence of coat, the electrical contact of fully coated rebars with the instrument could not be achieved and hence the Tafel extrapolation measurements for these bars could not be recorded. Similarly the partial coat of zinc galvanization for the length specified in Table 1 was not possible because of the limitation in process of galvanization. Figure 2. Variation of corrosion rate with time for partially primer and epoxy coated specimens From Figure 2, it can be observed that partially epoxy coated rebars showed lesser corrosion rates, as compared to partially primer coated rebars, indicating better performance under accelerated corrosion. 5 CONCLUSIONS The present paper demonstrates the effectiveness of half-cell potential and Tafel extrapolation techniques for corrosion assessment of coated rebars and the performance of zinc galvanized, epoxy and primer coated rebars under accelerated corrosion. The experimental investigations indicated superior performance of epoxy coatings compared to primer and zinc galvanized coatings in both fully and partially coated conditions. Having a little contact with steel, half-cell potential technique well identified the corrosion activity in fully as well as partially coated rebar. On the other hand, Tafel extrapolation technique could identify corrosion activity in partially coated rebar only. 6 REFERENCES [1] Yeomans S.R. (1999), Transactions Hong Kong Institution of Engineers 2, Hong Kong Inst. Of Engineers, pp [2] Cheng A., Huang R., Wu J.K. and Chen C.H. (2005), Construction and building materials, 19, pp, [3] Singh D. N. and Ghosh R. (2006), Technol. 201, pp, [4] Dong S. G., Zhao B., Lin C. J., Du R. G.(2012), Construction and building materials, 28, pp


106 Effect of Cell Geometry on Electrochemical Measurements of Steel- Cementitious Systems Sripriya Rengaraju 1*, Kokubo Wataru 1, Radhakrishna G.Pillai 1 and Lakshman Neelakantan 2 1 Department of Civil Engineering, Indian Institute of Technology Madras 21 Department of Metallurgical and Materials Engineering, Indian Institute of Technology Madras *raju.sripriya@gmail.com Abstract The size, type and positioning of electrodes play a major role in electrochemical measurement, especially in corrosion measurement of steel embedded in concrete. Limited literature is available on the effect of corrosion cell geometry on corrosion measurement in steel-cementitious systems considering the dielectric nature of concrete, the porous steel- cementitious interface and the passive layer of steel. There is a need for standardizing the corrosion cell set up for steel embedded in concrete, especially for accelerated test methods. The experimental program involves the study of size effect (with respect to Counter Electrode (CE)) and positioning effect (with respect to the Reference electrode (RE) and CE). CE in the form of concentric Nichrome mesh was used. Saturated Calomel Electrode (SCE) with luggin probe was used as RE. Steel rebar embedded in mortar was used as WE. The polarization resistance (RP) of steel was measured using Linear Polarisation Resistance (LPR) and Electrochemical Impedance Spectroscopy (EIS) techniques. The results showed that electrochemical measurements are greatly affected by cell geometry, and there is a need for careful design of the corrosion cell geometry to facilitate the comparison of the electrochemical behaviour of various steel-cementitious systems. Keywords Cell Geometry, Electrochemical measurements. 1 INTRODUCTION The standard 3-electrode corrosion cell is widely used for testing metals in aqueous solutions, where solution resistance is negligible. However, the positioning of electrodes plays a major role when tested with low conductivity electrolyte and the electrochemical (EC) measurements are significantly affected [1,2]. Literature recommends the size of CE to be infinite and 100 times as that of WE [3]. The effect of size of the counter electrode, and positioning of working electrode on electrochemical measurements need to be understood. 2 RESEARCH SIGNIFICANCE The electrochemical measurements in steel-cementitious (S-C) systems depend on the corrosion cell geometry (i.e., the size and positioning of electrodes, the anode/cathode ratio, etc.). Unless the effect of abovementioned factors on the EC measurement is understood, the test results cannot be interpreted correctly. Standardization of corrosion cell is necessary to interpret the data and compare the test results across labs. 3 MATERIALS AND METHODS Three sets of experiments were conducted to assess the cell geometry parameters namely (i) The effect of positioning of RE(ii) Size of CE and (iii) Annular and Planar arrangement. The effect of positioning of RE was tested using AC and DC technique namely EIS and LPR respectively in annular arrangement. EIS parameters include AC amplitude of 10 mv, DC potential at open circuit potential (OCP) and number of points per decade at 7 and the frequency range from 1 MHz to 1 mhz. LPR testing was done with the scan range of -15 mv to + 15 mv from OCP at the scan rate of mv/s.ce size of two, ten and twenty of the WE size were used to assess the size effect of CE on electrochemical measurements using LPR. Figure 2. Annular geometry arrangement of a corrosion cell Annular and planar geometry were taken for this study. Figure1shows the annular geometry where a nichrome mesh in the form of concentric region is used as CE. In planar geometry where CE-WE-RE configuration in the 73
 is placed near to the WE with the help of a luggin. A lollipop specimen with 8 mm steel embedded in mortar was used for the study. 4 RESULTS AND DISCUSSION 4.")
107 Polarisation resistance (ohm.cm 2 ) same plane is adopted, Nichrome mesh was wound in one side and other electrodes were kept in the same position as that of annular geometry. RE (saturated calomel electrode) is placed near to the WE with the help of a luggin. A lollipop specimen with 8 mm steel embedded in mortar was used for the study. 4 RESULTS AND DISCUSSION 4.1 Positioning of RE Figure 3 shows the results of positioning of RE on electrochemical measurements of steel embedded in mortar measured by EIS. The EIS spectra S1 arises due to positioning of RE too close to the working electrode in the annular geometry. The spectra S2 arises when the RE is positioned at two times the distance of the luggin probe tip diameter. Also, the high resistive cementitious cover give rise to negative impedance in S1. DC techniques like LPR is unaffected by the positioning of RE except for ohmic drop, which should be accounted in the data interpretation. Z" Figure 3. EIS spectra for two different positioning of RE 4.2 Size of the Counter electrode CE 8 CE S1 10 CE Figure 4. Effect of CE size on electrochemical measurement The CE size should be chosen such that the reactions at the WE should not be hindered. Figure 4 shows the effect of CE size on LPR measurements measured in four specimens. S1 in the graph represents polarization resistance of specimen 1 tested with CE sizes 2, 8 and 10 times of the surface area of WE. However, quantification Z' Data 1 2 CE 8CE 10 CE 2 CE 8 CE 2 CE 10 CE S1 S2 S3 S4 8 CE 10 CE of effect of CE size could not be established with the obtained results and more results are required. 4.3 Annular and Planar Geometry Figure 5 shows that the polarization resistance measured in planar geometry is greater than that of the annular geometry in most cases. This shows that the current path is different in both the cases and affects the EC measurement. Hence, care should be taken while deciding the corrosion initiation criteria. Polarisation resistance (ohm. cm 2 ) Figure 5. Effect of geometry on electrochemical measurement 5 CONCLUSIONS Cell geometry affects the electrochemical (EC) measurements and the following conclusions were drawn from the observations 1. The positioning of RE affects both LPR and EIS. However, the effect is more pronounced in EIS. 2. The EC measurement is affected by size of CE. However, the effect could not be quantified effectively when CE size of two, ten and twenty of the WE size were used. More tests are required for quantification of CE size. 3. Annular and Planar geometry has different current paths and affects the EC measurement. Planar geometry gives higher polarization resistance than annular geometry. 6 ACKNOWLEDGEMENTS The authors acknowledge the assistance provided by the project associates Sindhu S., Kanchana S., Kiran Ram P.P., and Tayyab Adnan H. at IIT Madras for conducting the experiments. 7 REFERENCES P A P A Data 1 P Planar (P) Annular (A) S1 S2 S3 S4 S5 Specimen [1].Adler, S. (2002). Reference Electrode Placement in Thin Solid Electrolytes. Journal of The Electrochemical Society, 149(5), E166 E172 [2] Winkler, J., Hendriksen, P. V., Bonanos, N., and Mogensen, M. (1998). Geometric Requirements of Solid Electrolyte Cells with a Reference Electrode. Journal of The Electrochemical Society, 145(4), [3] Bard,A.J., Faulkner, L.R., (2001) ELECTROCHEMICAL METHODS Fundamentals and Applications, John Wiley & Sons, Inc.United states of America. A P A P A 74
108 Flow Accelerated Corrosion of API X70 Pipeline Steel in Oilfield Water T. S. Ajmal *, Shashi Bhushan Arya and K. Rajendra Udupa Department of Metallurgical and Materials Engineering, National Institute of Technology Karnataka, Surathkal, Mangalore , India *tsajmal@gmail.com Abstract- The present work explores the effect of turbulent flow on the electrochemical behavior of API X70 steel in a synthetic solution of oilfield water. The electrochemical test was carried out in an in-house loop system which can simulate the flow pattern in a pipeline more realistically. The fluid flow velocity in the loop system was 3 m/s. Multiple electrodes are located at different part of the elbow test section for the Flow Accelerated Corrosion (FAC) study. The FAC results show that corrosion rate is more at the inner wall than at the outer wall of the elbow. Furthermore, the corrosion rate is increasing along the fluid flow direction in the same column. The results vary with respect to the position of the electrodes within the elbow. Also, the electrochemical studies were carried out in a static condition in the same solution. It was compared with the FAC results obtained from electrochemical studies. The SEM analysis was carried out after the FAC study on the metal surface. The EDS analysis was performed to analyze the corrosion products after FAC study. Keywords - Flow Accelerated Corrosion (FAC), Hydrodynamics, API X70 carbon steel elbow, Pipeline Corrosion 1 INTRODUCTION Flow accelerated corrosion (FAC) is a slow piping degradation process that is caused by the synergistic effect of electrochemical reaction and relative movement of fluid over the material surface. It may frequently lead to pipeline failure by damaging or thinning the protective layers during fluid transportation and is costing an enormous amount of money to mitigate and manage the corrosion problems. FAC depends on the shape of the pipe fittings, piping material, and fluid temperature [1]. A pipe elbow is prone to FAC due to its shape that changes the flow direction [2]. HSLA steels like API X70 are suitable for the pipeline application due to its high strength, good weldability, and low cost. But compared to stainless steel they are more corrosive [3]. 2 RESEARCH SIGNIFICANCE In this study loop system was employed to simulate the flow regime in a pipeline more realistically. The effect of hydrodynamic parameters on corrosion was studied with help of array electrode technique. Multiple electrodes are located at a 90º elbow test section to understand the synergetic effect of corrosion and hydrodynamic properties. 3 MATERIALS AND METHODS The test specimen was made up of commercially available API X70 pipeline material. Twenty specimens with exposed area 5 5 mm were polished with emery papers and cleaned with acetone and dried. The electrolyte was a synthetic solution of produced water drawn out from an oil field. It contained g/l NaCl, 0.54 g/l KCl, 0.43 g/l CaCl 2, 0.37 g/l Na 2SO 4, 0.50 g/l MgCl 2 6H 2O, and 3.98 g/l NaHCO 3 [4]. It was made up of analytical grade reagents and deionized water. FAC test was conducted using a loop system as shown in Figure 1. Figure 1. Schematic diagram of FAC loop test system and array electrodes test section A centrifugal pump, pipe, a reservoir, a pressure gage, a flow meter, and array electrodes test section were the major constituents of the test loop. The velocity of fluid was maintained 3 m/s at room temperature and atmospheric pressure. Twenty electrodes were fixed at the inner wall of pipe elbow to conduct electrochemical tests. The internal surface of elbow and sample surfaces were at same level. The straight section upstream of the entrance of elbow was set as 1.2 m and the straight section downstream of the exit of the elbow was set as 0.7 m to ensure a fully developed and stable flow condition at elbow test section. A three-electrode system was used to 75
109 Corrosion Rate (mpy) 5 th CORSYM, Chennai, India, March 2018 conduct electrochemical corrosion tests. The test specimen, a platinum plate, and a saturated calomel electrode (SCE) were used as the working electrode (WE), the counter electrode (CE), and the reference electrode (RE) respectively. The Tafel extrapolations were performed at -250 to +250 mv (SCE) vs. OCP with a scan rate of 0.5 mv/s. 4 RESULTS AND DISCUSSION FAC test of API X70 steel was carried out using the electrochemical potentiodynamic polarization method in the synthetic oil field water at the flow velocity of 3 m/s in a loop system. The corrosion rates of the outer right wall electrodes at the points 1, 2, 3, and 4 are mpy, mpy, mpy, and mpy respectively. The corrosion rates of the outer wall electrodes at the points 5, 6, 7, 8, and 9 are mpy, mpy, mpy, mpy, and mpy respectively. The corrosion rates of the outer left wall electrodes at the points 10, 11, 12, and 13 are mpy, mpy, mpy, and mpy respectively. The corrosion rates of the inner left wall electrodes at the points 14, 15, and 16 are mpy, mpy, and mpy respectively. The corrosion rate of the inner wall electrode at the point 17 is mpy. The corrosion rates of the inner right wall electrodes at the points 18, 19, and 20 are mpy, mpy, and mpy respectively. The polarization curves for representative electrodes 5 and 17 are given in Figure 2. Corrosion kinetics parameters such as corrosion potential (E corr), Tafel s slopes (β c and β a), corrosion current density (i corr) and corrosion rates are listed in Table 1. outer wall. Furthermore, the corrosion rate is increasing along the fluid flow direction in the same column. This is due to the increasing tendency of the flow parameters along the flow direction. The results vary with respect to the position of the electrodes within the elbow. The static condition study reveals that the corrosion rate is very less compared to FAC. SEM images indicate that there are more loose products in the inner wall compared to the outer wall. EDS result reveals that primary elements contained in the corrosion products are O and Fe, with a trace amount of Cl and Mn. It is reasonable to speculate that the corrosion products are composed of iron oxide. Table 1. Fitted parameters and corrosion rates for the polarization curves of electrodes 5 and 17 in FAC Electrode Ecorr (mv) SCE icorr (µa) βc (mv) SCE βa (mv) SCE 5 (Outer) (Inner) CONCLUSION The FAC results indicate that the corrosion rate is varying with respect to the position of the electrode within the elbow. The corrosion rate is more at the inner wall compared to the outer wall and it is increasing along the fluid flow direction in all the columns. It is conceived to be due to higher flow velocity and shear stress at the region of inner wall compared to that at the outer wall. 6 ACKNOWLEDGEMENT One of the authors, Mr. T. S. Ajmal would like to thank the Ministry of Human Resources Development (MHRD), Government of India, for the research fellowship. Figure 2. Polarization curves for electrode 5 and 17 in FAC condition The FAC results show that corrosion rate is more at the inner wall than at the outer wall of the elbow. This is due to the higher hydrodynamic parameters such as flow velocity and shear stress at the inner wall compared to the 7 REFERENCES [1] El-Gammal M., Mazhar H., Cotton J. S., Shefski C., Pietralik J., and Ching C. Y. (2010), Nucl. Eng. Des., Vol. 240(6), pp [2] Ahmed W. H., Bello M. M., Nakla M. El, Sarkhi A. Al, and Badr H. M. (2014), Nucl. Eng. Des., Vol. 267, pp [3] Zeng L., Zhang G. A., and Guo X. P. (2016), Corrosion, Vol. 72(5), pp [4] Zhang G. A., Zeng L., Huang H. L., and Guo X. P. (2013),, Corros. Sci., Vol. 77, pp
110 Corrosion Investigation of Commercially Available Linepipe Steel in CO2 Environment Muhammad Haris, Saeid Kakooei* and Mokhtar Che Ismail Centre for Corrosion Research, Department of Mechanical Engineering, Universiti Teknologi PETRONAS, Seri Iskandar, Perak Darul Ridzuan, Malaysia. Abstract CO2 corrosion has been the most prevalent form of corrosion and is considered as a complex problem in oil and gas production industries. The CO2 in presence of water causes sweet corrosion that is responsible for failure of pipeline during transportation of Oil and Gas. This work study the corrosion behavior of carbon steel in CO2 environment at different temperature but at constant pressure. The effect of CO2 on Carbon Steel (X65, A106) was studied in simulated solution of 3 wt.% NaCl. The specimen was immersed into the CO2 containing solution for 48 hours and corrosion behavior was investigated by using electrochemical test like Linear Polarization Resistance and Tafel plot. The results show that the temperature has an important effect of corrosion rate of Carbon Steel in CO2 environment. Keywords CO 2 corrosion, Carbon steel, Linear polarization resistance, Sweet corrosion 1 INTRODUCTION Oil produced from oil and gas well mostly carries some water and different amount of gases and acid of which most notably are either carbon dioxide or in some cases is hydrogen sulfide. The presence of these affect the service life and integrity of carbon steel [1]. Among these, carbon dioxide corrosion commonly known as Sweet Corrosion has been an area of interest for many researchers who had widely studied this phenomenon since the 70 s in regard to the corrosion resistance of the carbon steel. The degradation of steel due to carbon dioxide corrosion is an important problem with major implications for oil and gas industries [2]. Over the past 30 years, the world production of oil and gas and the consumption of their products had grown significantly, which had increased the use of pipelines for their transport. Similarly, the use of pipelines over long distances have been a solution adopted by many companies. To quench the thirst of ever-growing demand of energy the necessity of finding new methods for discovering oil & gas has pushed operational activities to more rough environment that offer harsher operating conditions. All these factors imposed great challenges to the economics and subsequent operations wherein proper material selection and equipment integrity are becoming vital[3]. Similar grades of carbon steel obtained through different processing techniques had been observed with varying corrosive behaviour when encounter with CO 2 corrosion. Due to its low cost and economic feasibility, carbon steel is widely used as a construction material in transportation of oil and gas over larger distance. However, this being said the susceptibility of carbon steel to CO 2 corrosion cannot be denied and a number of authors have studied various aspects of carbon steel in parallel to the development of carbon steel application Thus far a number of studies indicated the effect of alloying elements including chromium that has the most profound effect on the corrosion resistance of carbon steel in CO 2 environment along with this some other micro addition of alloying elements like Mn, Si, V as well as processing route of which microstructure of steel is dependent upon[1,3]. However, it still need further investigation to analyze the optimum composition of these alloying elements. This study seeks to compare how these factors influence corrosion by using Electrochemical corrosion techniques under CO 2 environment of these alloys and using this opportunity to better understand corrosion resistance of these alloy. 2 RESEARCH SIGNIFICANCE This work seeks to understand better how the carbon steel behaves in simulated CO 2 environment and its corrosion resistance was determined by the electrochemical test including Linear polarization resistance and Tafel polarization at different temperatures. Data on linepipe steel s corrosion behavior exposed to CO 2 corrosion are not widely available or reported. 3 MATERIALS AND METHODS Steels samples of X65 and A106 were used for the investigation of corrosion rate at 1 bar of CO 2 at different temperature. The composition of the steels are shown in Table-1. 77

 with DI water to make 3 wt.% solution.")
111 All the samples were cut in 10 mm x10 mm x3 mm and connected with Copper wire via soldering then embedded with phenolic molding powder with a working surface of 1 cm 2 left. All the samples were subsequently grind with 60 to 600 grit size emery papers, and then rinsed with distilled water, degreased in acetone. Table 1. Chemical composition carbon steel Stee l (s) X65 A10 6 C Cr M n The electrochemical tests were carried out on METROHM AUTOLAB Potentiostat/galvanostat. Test solution i.e. brine was prepared for each experiment by dissolving sodium chloride (non-iodized NaCl) with DI water to make 3 wt.% solution. CO 2 gas was allowed to bubble in the solution at least 2 hours prior to the test to ensure total saturation and was maintained throughout the experiment. ph of the solution was 3.7 at the start of the experiments. The test was done at three different temperatures i.e. 25 C, 50 C and 75 C. Electrochemical test that were conducted for these samples for 48 hours include Linear polarization resistance and Tafel Plot. 4 RESULTS AND DISCUSSION The Potentiodynamic polarization curves of the A106 and X65 steels are illustrated in Figure 2. The scan range was 250 to +250 mv vs. open circuit potential (E oc) and the scan rate was mv/s. The Potentiodynamic curve indicate that the E corr of A106 was relatively more positive than of X65 steel as illustrated in Table 2. Table 2. E corr of Steel Specimen Si Nb V Ti P S Ni Wt.% # Steel Specimen 25 C 50 C 75 C E corr of X65-580mV -645mV -670mV E corr of A mV -655mV -680mV The cathodic curve of X65 and A106 steels show little variations as shown in fig. 2 while the anodic current density depends on the steel grades and its composition. Linear polarization resistance test was conducted by polarizing the both steel specimen to ±10 mv at a scan rate of mv/s. The corrosion rate was calculated by using the following Equation 1: CR = mm Eq. (1) R p A yr Where; R p is the polarization resistance of in.cm 2 A is the area of the sample in cm 2. The corrosion rate of X65 steel under CO 2 environment has been illustrated in figure 2. The samples were tested for 48 hours, a clear acceleration in corrosion rate can be seen as the temperature increases, this phenomenon can be related to the less formation of protective layer as well as the rate of corrosion increase with the immersion time for carbon steel. The lower corrosion rate reported for A106 steel at higher temperature can be attributed to the presence of corrosion resistance alloying element such as Cr in A106 steel that helps in formation of protective layer on the surface of steels. There was slight difference of the corrosion rate of both steels at the end of the experiment which seems to be due to passivation nature of both steels. a) b) c) Figure 6. (a) Schematic of 3-cell electrode glass cell system, Tafel polarization plot of (b) A106 steel, (c) X65 steel at 25 C, 50 C and 75 C a) b) Figure 2. Linear polarization plot of a) A106 steel and b) X65 steel at 25 C, 50 C and 75 C. 5 CONCLUSION Based on the experiment conducted by author it can be concluded that both the steel shown similar corrosion rate (1.5 to 2 mm/yr.) at 25 C in CO 2 environment, but at higher temperature like 50 and 75 C the corrosion rate varies significantly and it is attributed to the different nature of protective layer formed on both steels. A106 steels showed a superior corrosion resistance as compared to A106 steel under the same mentioned condition. 6 ACKNOWLEDGEMENTS The author hereby acknowledges the financial support from Universiti Teknologi PETRONAS (UTP), Malaysia under Graduate Assistance Scheme. 7 REFERENCES [1] A. Kahyarian, M. Achour, and S. Nesic, Trends Oil Gas Corros. Res. Technol, pp , [2] N. Ochoa, C. Vega, N. Pébère, J. Lacaze, and J. L. Brito, Materials Chemistry and Physics, vol. 156, pp , [3] S. Guo, L. Xu, L. Zhang, W. Chang, and M. Lu, Corrosion Science, vol. 63, pp ,
112 Mechanistic Analysis of Ta dissolution in Aqueous HF Ranjith P M and Ramanathan Srinivasan * Indian Institute of Technology-Madras, Chennai , India *pmranjith10@gmail.com Abstract Tantalum is well known for its superior corrosion resistance in most harsh environments. However, Ta is attacked by acidic fluoride media. In the present study, dissolution of Ta in aqueous HF was experimentally investigated using potentiodynamic polarization (PDP) technique. Anodic polarization data was acquired in solution with varying (from 250 to 1000 mm) HF concentrations. Experiments were also performed with addition of H2SO4 and KF to the HF solutions. The results indicated the remaining HF and HF 2 are the key species which influence the dissolution of Ta. The PDP data were subjected to reaction mechanism analysis and a four step mechanism, with the formation of two intermediate adsorbed species, Ta 2+ and Ta 5+, was proposed to describe the Ta anodic dissolution in acidic fluoride media. Keywords - Tantalum, Acidic fluoride media, Potentiodynamic polarization, Reaction mechanism analysis. 1 INTRODUCTION Tantalum is a group V metal which is covered with a tenacious oxide that offers protection from attack by most chemical reagents [1, 2]. Ta oxide (Ta 2O 5) is used as an important material in capacitors and resistive memories [3], and anodic oxidation of Ta has been studied extensively [4]. Although Ta is highly resistant to corrosion, fluoride ions in an acidic environment can dissolve the oxides on its surface and form porous Ta oxides by anodic oxidation [1]. By anodizing Ta in an electrolyte containing concentrated HF and H 2SO 4, at a potential of V, nano-dimpled Ta 2O 5 surface could be obtained [5, 6]. Ta foil immersed in 1 M H 2SO 4 and 2 wt % HF and maintained in the potential range of V yields a nano-porous surface, with pore diameter in the range 2-10 nm [7]. Sapra et al. [8] investigated Ta dissolution in 2.5 M HF at anodic conditions. 2 RESEARCH SIGNIFICANCE Although the anodization and formation of porous oxides of Ta in acidic fluoride media have been widely studied, the actual mechanism and kinetics of the oxidation and dissolution process of Ta in HF solutions are poorly understood. Potentiodynamic polarization data was analyzed in the frame work of mechanistic analysis to obtain insights into the kinetics and to identify the solution species participating in the dissolution process. 3 EXPERIMENTAL DESCRIPTIONS Electrochemical experiments were carried out in a conventional three electrode cell using IVIUMSTAT at room temperature (~26 C). Ta metal disc of 4.75 diameter (polished with 0.3-micron alumina powder) were embedded in Teflon holders exposing only one face to the electrolyte. A rotating disc electrode setup was employed to rotate the working electrode at an angular speed of 900 rpm. A platinum mesh was used as the counter electrode and Ag/AgCl (in saturated KCl) was used as reference electrode. In order to minimize the effect of solution resistance, a supporting electrolyte (Na 2SO 4) at 1 M concentration was used. HF concentration of was varied from 250 to 1000 mm. Potentiodynamic polarization data were acquired by sweeping the potential from open circuit potential (OCP) to 0.9 V above OCP, at a scan rate of 2 mv s RESULTS AND DISCUSSION 4.1 Potentiodynamic polarization (PDP) Anodic polarization data was acquired in solutions with varying (from 250 to 1000 mm) HF concentrations. The OCP of Ta in HF was in the range of -0.4 to V vs. Ag/AgCl, with lower values corresponding to higher concentration. The PDP results are shown in Figure 1. The results show that in all solutions investigated, Ta exhibits an initial increase in current followed by a decrease in the current. The region of positive current potential slope corresponds to active dissolution, where the dissolution rate is much larger than the film formation rate. The region of negative slope corresponds to the increased rate of passive film formation and is termed as passive region. 4.2 Effect of HF concentration The species that are reported to be present in aqueous HF solutions are H +, F, HF 2, H 2 F 3 and remaining HF [9]. The concentrations of HF dissociation products, in the solutions employed in this study, were determined using the equilibrium constants reported in literature [9]. 79
113 In order to identify the species that contributes to the dissolution, KF (which mainly increases the F - concentration) and H 2SO 4 (which mainly increases the H + concentration) were added separately to HF solutions. The peak current increases slightly upon addition of 250 mm H 2SO 4 and it increases by ~ 100% upon addition of 250 mm KF to the 500 mm HF solutions (Figure. 2). chemical dissolution of and Ta 5+ and electrochemical dissolution of Ta 2+ as described below. k1 2 Ta Taads + 2e k 1 Ta Ta Ta 2 k2 5 ads Ta ads + 3 e k 2 Ta 5 k3 5 ads sol Ta + 3 e 2 k4 5 ads sol The pre-exponential factors of dissolution rate constants k 30 and k 40 are expressed as follows k k HF ' 30 30[ ] ' '' 40 k40[ HF2 ] k40[ HF] k The model predicted the active-passive regions clearly for all the concentrations studied. Based on the mechanism, the fractional surface coverage of the intermediates were also predicted (results not shown). Figure 1. Mechanistic model results and the experimental polarisation data of tantalum in different concentrations of HF. Continuous lines with markers are the experimental data and dotted lines are the simulated results Figure 2. Mechanistic model results and the experimental polarisation data of tantalum in mm HF with and without additives. Continuous lines with markers are the experimental data and dotted lines are the simulated results 4.3 Reaction mechanism analysis A four step mechanism of tantalum dissolution in HF was proposed to explain the results. In this mechanism, the dissolution occurs through two pathways, direct 5 CONCLUSION Anodic dissolution of Ta in solutions with varying HF concentrations was studied using polarization. A mechanism with adsorbed intermediates, Ta 2+ and Ta 5+, and two dissolution steps adequately captures the salient features of the polarization. The variation of fractional surface coverage values of the intermediate species and the dissolution rates by two different pathways, were estimated. It is proposed that the chemical dissolution is influenced by the remaining HF and the electrochemical dissolution is influenced by both remaining HF and HF 2. 6 REFERENCES [1] I. V. Sieber and P. Schmuki, Journal of the Electrochemical Society, 152, C639 (2005). [2] C. D'Alkaine, L. De Souza and F. Nart, Corrosion science, 34, 129 (1993). [3] Y. Yang, P. Sheridan and W. Lu, Applied Physics Letters, 100, (2012). [4] J. Sloppy, Z. Lu, E. Dickey and D. Macdonald, Electrochimica Acta, 87, 82 (2013). [5] H. El-Sayed, S. Singh and P. Kruse, Journal of The Electrochemical Society, 154, C728 (2007). [6] N. K. Allam, X. J. Feng and C. A. Grimes, Chemistry of Materials, 20, 6477 (2008). [7] I. Sieber, H. Hildebrand, A. Friedrich and P. Schmuki, Journal of electroceramics, 16, 35 (2006). [8] S. Sapra, H. Li, Z. Wang and I. I. Suni, Journal of The Electrochemical Society, 152, B193 (2005). [9] K. W. Kolasinski, Journal of The Electrochemical Society, 152, J99 (2005). 80
114 A Low Energy Electrochemical Approach for Dual Waste Management Saranya Sriram 1, Raghuram Chetty 1 * and Indumathi Nambi 2 1 Department of Chemical Engineering, IIT Madras 2 Department of Civil Engineering, IIT Madras *raghuc@iitm.ac.in Abstract The present study investigates to identify low cost durable electrode to reduce Cr(VI) contaminated aqueous and soil matrices. Titania nanotubes synthesized by anodization offers more surface area for Cr(VI) reduction than bare titanium. Further the synergism of anode compartment was explored herein for the first time towards accelerated Cr reduction at cathode. Urea, a nitrogenous waste was employed as an anolyte additive for Cr reduction at cathode, which benefits the system of attaining dual waste management at the same time. This strategy was investigated for both Cr contaminated aqueous and soil matrix. Cr removal efficiency of 97.7% at 5 V in 15 min was observed in aqueous matrices with initial Cr of 100 mgl -1 whereas in soil, 98% Cr removal was observed in 4 hr. Thus the dual combination of urea- TNT may be a more prudent approach of handling such chromium contaminated aqueous and soil matrices. Keywords - Electrochemical reduction, Hexavalent chromium, urea oxidation, Titania nanotubes. 1 INTRODUCTION Pallikaranai Marshland is the only surviving wetland ecosystem in Chennai, South India. The unplanned development has disconnected water bodies draining into the marshland. The rapid industrialization and urbanization has led to an aerial shrinkage of the marshland from 5000 hectares to 540 hectares [1]. The leachate run off from the marshland lead to heterogeneous contamination of heavy metals particularly Cr, Cu and Pb. Remediation of such superfund sites becomes challenging asthese heavy metals bioaccumulate in the living biota. Hexavalent chromium, Cr (VI)is one amongst the priority pollutant and is classified a human carcinogenic. The existing insitu treatment technologies (physical, chemical and biological methods) for the remediation of chromium containing wastewater and soil matrices are limited; owing to their limitations of either being expensive or releasing harmful by-products. Herein; we propose to investigate a low energy intensive electrochemical technology (ECT) to handle such carcinogenic metal ion. ECT though is advantageous of being operable at ambient conditions without any supplementary requirement of chemicals [2]; most of the prior study report to use transition metal electrodes which corrode at higher potentials. Thus the present study investigated to identify low cost durable electrode to remediate Cr (VI) from aqueous and soil matrices. Titanium has been reported for the electrochemical reduction for heavy metals (Pb, Ni, Cr) from wastewater. Furthermore, tailored nanoporous TiO 2 can offer larger surface area for reactive sites with nanotubes perpendicular to the metal substrate and be a more proficient electrode for enhancing metal reduction than bare Ti. Additionally to curtail the input energy supplied to the system; a nitrogenous waste (such as urea) was employed as anolyte additive. Urea has been recently gaining immense interest towards its electrooxidation for hydrogen production [3].Thus exploring the synergism of the anode compartment, we attain a simultaneousoxidation of a urea at anode to enhance the Cr reduction at cathode. Thus the present study has demonstrated a sustainable way of dual waste management impeding low energy to Cr contaminated aqueous and soil matrices. 2 RESEARCH SIGNIFICANCE Extensive literatures are available for Cr(VI) reduction; however to the best of our knowledge study pertaining to Cr reduction on TNT cathode and urea as additive has not been reported so far. Hence, the present study had developed a low-energy electrochemical strategy with durable low cost cathode in conjunction with nitrogenous was as anolyte additive; to reduce Cr contaminated wastewater and soil matrices. 3 MATERIALS AND METHODS The electrolysis experiments for both aqueous and soil matrices were carried out in conventional two chambered H cell. Electrodes used for the study were Ti or TNT working electrode and Pt counter electrode. Anodization of Ti substrate wascarried out with ethylene glycol as the supporting electrolyte at 10 V for 1 hour. Ammonium fluoride (0.5% wt. NH 4F) wasadded to provide fluoride ions in the system and 5 wt. % water was added to ensure conductivity. The synthesized nanotubes were characterized using a high resolution SEM. 100 ppm Cr (VI) was prepared from potassium dichromate and employed as catholyte. KOH(1 M) was employed as anolyte and 0.1 M urea was used as an additive. The 81
 was investigated at different phs such as acidic, alkaline and neutral and a constant potential of 2 V was applied throughout the")

115 reduction of Cr (VI) concentration was quantified using UV visible spectrophotometer. 4 RESULTS AND DISCUSSION 4.1 Effect of ph and voltage on Cr reduciton EC reduction of Cr (VI) was investigated at different phs such as acidic, alkaline and neutral and a constant potential of 2 V was applied throughout the studies. The preliminary results revealed acidic ph enhanced Cr (VI) reduction than other ph conditions.in order to study the effect of applied potential, three different potentials viz. 2 V, 5 V and 10 V were chosen and the reduction were performed with 100 ppm Cr. Compared to 2 V and 5 V, reduction at higher potential 10 V dominated and favored Cr removal. Even though the best reduction was obtained at 10 V at 45 minutes, a realistic approach would be to lower the reduction potential and time for practical application. Thus we intended to lower the applied potential further and increase the Cr removal efficiency by cathode surface modification and selective addition of an additive. 4.2 Significance of additive ph and concentration The ph and concentration of additive urea played a vital role in supplying the additional electrons required for the Cr reduction. To optimize the concentration of urea, experiments were performed with 0.05 M, 0.1 M, 0.2 M and 0.3 M urea addition to the anode compartment using cyclic voltammetry (CV). The CV experiments were conducted in three electrode cell set up, with Ti and synthesized TNT as cathode (refer fig 1a). Pt was employed as counter electrode and Ag/AgCl was the reference electrode. Results indicated that 0.1 M urea was optimum for 100 ppm Cr reduction, whereas higher concentrations of urea was leading to over potential losses favoring more energy consumption towards urea oxidation rather than Cr reduction. (a) Current density (ma cm -2 ) Figure 1. (a) SEM of Titania nanotubes(tnt) prepared by anodization (b) CV of acidic and alkaline urea towards 100 ppm Cr reduction. Additionally, experiments were performed with urea in acidic and alkaline ph towards Cr reduction. Results indicated that alkaline urea had higher current density than acidic urea (refer fig 1b) Urea in acidic Urea in alkaline (b) (a) Potential (V) vs Ag/AgCl 4.3 The dual combination towards Cr reduction Experiments with Cr(VI) on both sides gave a reduction efficiency of 78.8% at 5 V in 1 h; in contrast, the addition of urea at the anode showed a higher reduction efficiency of 89.2% on a bare Ti and with urea-tnt, Cr reduction was observed to have 97.7% in 15 min at 5 V. The process has a dual purpose of simultaneously oxidizing a nitrogen rich organic pollutant at the anode and a carcinogenic metal ion at the cathode (c2) (c3) Time (h) Figure 2 Cr reduction at 5 V with 0.1 M as anolyte additive from (a) aqueous matrix comparing over Cr on both side of H cell (c1) and Ti (c2) vs TNT (c3) as cathode (b) 0.5 g soil loaded matrix on TNT cathode 5 CONCLUSION The study has successfully demonstrated Cr(VI) reduction to a non-toxic Cr(III) on TNT cathode in combination with a sustainable anolyte additive urea. Results show that the dual combination enhanced the reduction. The presence of soil acts as a scavenger filtering the pollutants from the aqueous phase. Though the reduction delayed in the presence of soil, still good removal efficiency was observed in 4 hr. The study thus suggests an alternative electrochemical strategy for the Cr contaminated aqueous and soil matrices. 6 ACKNOWLEDGEMENTS The authors would like to thank Department of Science and Technology, India for fellowship to Saranya Sriram under DST INSPIRE programme. 7 REFERENCES Cr +6 B.S 0.1M Urea +1M KOH(Ti) 0.1M Urea in 1M KOH (TNT) (c1) (a) [1] P. Malini, A. Ramachandran, (2012), Analysis of heavy metals in dying wetland, PallikaranaiTamilnadu India J. Environ. Bio, Vol. 33, pp [2] W. Jin, H. Du. S. Zheng, Y. Zhang,(2016), Improved electrochemical Cr(VI) detoxification by integrating the direct and indirect pathways, ElectrochimicaActa, Vol. 191, pp [3] B. Boggs, R. King, G. Botte, (2009), Urea electrolysis: Direct hydrogen production from urine, Chem. Commun., (b) 82
116 CORROSION AND INHIBITORS 5 th CORSYM, Chennai, India, March 2018
117

118 Failure Analysis on Refinery Assets Amirul Haiqal Anif, Azmahani Sadikin and Azzura Ismail * Faculty of Mechanical and Manufacturing Engineering, UniversitiTun Hussein Onn Malaysia, Johor Malaysia *azzura@uthm.edu.my Abstract Corrosion in refinery assets is complex which involve multi factors contribute to damage mechanism. The objective of the present study is to evaluate the damage mechanism which caused the heat exchanger (HEX) to leak in parallel sequence. Failure analysis was concluded HEX was attacked by naphthenic acid corrosion (NAC) due to sharp-edged, crater-like holes to sharp-edged streamlined grooves with corrosion product consist of sulphide (Fig 1). Selection of material need to be upgraded to at least 9% molybdate alloying content. Parallel failure initiate more research in distribution of inhibitor and heat in HEX using computerized fluid dynamics (CFD) software. CFD results reveals the optimum temperature and pressure of heat exchanger to control NAC attack. It likewise incorporates the impact of stream detachment inside the bay to a few tubes which is a stream include not ready to be reproduced with the permeable attachment approach. Keywords Corrosion, Shell and tube heat exchanger, CFD, NAC 1 INTRODUCTION Technology in refining industry has been developing with increasing complexity since its foundation in 1859 and corrosion in refinery assets is very complicated to resolve. Petroleum distillates consist mainly of nonpolar hydrocarbons that are not aggressive towards various alloys under normal conditions. The objective of the present study is to predict the fluid flow and thermal condition in HEX using CFD method. The predicted data from the simulation will support decision in material selection. The crude oil running in the heat exchanger is between C and leak was found during service caused the crude contamination due to naphthenic acid corrosion (NAC). Material selection with at least 9% molybdenum needed to combat NAC and CFD results will reveals the optimum temperature and pressure of heat exchanger to control NAC attack. As the severity of naphthenic acid corrosion increases, the problem starts occurring in the vacuum furnace tubes, the vacuum furnace outlet piping, the vacuum transfer line, as well as the piping circuits handling heavy vacuum gas oil (HVGO) and the overflash in the vacuum tower. 2 EXPERIMENTAL 2.1 CFD simulation The model was created in Solidwork as shown in Figure 2. The cold fluid flows in the shell and it is being heated by a hot fluid flows through the tube. The working fluid is water. The meshing gave a total of 1,167,380, nodes and had 5,529,766 elements that consisted of prisms. The shell and tubes were set to solid surfaces with no slip. Zero gauge pressure is assigned to the outlet nozzle in order to obtain relative pressure drop between inlet and outlet. The inlet velocity profile is assumed to be uniform. The zero heat flux boundary condition is set to the shell outer wall, assuming the shell is perfectly insulated at the outside wall. The tubes were modeled as solid cylinders with the constant wall temperature of 277 K were set to the tube wall. The inlet shell boundary condition was set to a mass flow rate of 30.8 kg/s. The temperature in the shell was set to 303 K. The k-epsilon realizable model was chosen for the turbulence model and the numerical accuracy was set to first order. The SIMPLE is used for the pressure correction method. The simulation was run until the residual of the pressure and velocities were less than Figure 1. Most outer tube found with localized pitting corrosion There are two types of fluids have been used for the studied which is crude oil for the tubes and HVGO for the shell-side. Heavy Vacuum Gas Oil (HVGO) have been set which has density of kg/m 3 with specific heat of 2878 J/kg.K. The thermal conductivity for the HVGO is W/m.K while the viscosity is 1.645x10e


119 Table 1. Model geometries parameter Shell size, Ds = 850 mm Tube outer diameter, d0 = 25.4 mm Inlet and outlet diameter, di = mm Heat exchanger length, L = 6096 mm Baffle cut, Bc = 18% Number of tubes, Nt = 428 surfaces, which is corrosion most likely to be occurred here, and also reducing heat transfer efficiency. The CFD method has a lot of potential in detecting corrosion simultaneously and accurately without requiring the part of the actual object to be removed. The output of the CFD method is a 3D image can be visualized from any direction on the monitor screen. Figure 2. Shell and tube heat exchanger model Table 2. Flow data Fluid Name HVGO Crude Oil Fluid flow rate (kg/h) Inlet temperature ( C) Outlet temperature ( C) Ìnlet pressure (kg/cm 2 ) Maximum pressure drop (kg/cm 2 ) RESULTS AND DISCUSSION Generally, under the higher steam velocity, the droplet collision velocity on the pipe wall is so high to erode the pipe wall materials mechanically. If the parameter of the shell-and-tube heat exchanger is unsuitable therefore the outcome will be more failure. The flow pattern along the flow path with the CFD code is obtain and the corrosive is calculated. Figure 3 shows the velocity path line the fluid flows past the tubes, which was set to no slip at the wall, the fluid decelerates near the baffle surface and creates a thin layer, called the boundary layer, due to viscous effects. The flow is attached to the tube surface until the formation of a wake, evident to the rear of the baffle, where some of the fluid is flowing backward against the main flow. This is where the circulation happens. The flow re-attaches at the front of the baffles. Therefore, the cross flow windows are not well utilized and some recirculation regions form behind the baffles. The recirculation zones provide low shear stress, creating suitable conditions for fouling growth on tubes external Figure 3. Streamline flow of the heavy vacuum gas oil (HVGO) inside the shell-side 4 CONCLUSION In this study, CFD method is suitable to predict the fluid flow and thermal condition at the location of the corrosion failure in shell-and-tube heat exchanger. Furthermore, the location of corrosion is also can be suggested by using this method and the streamline flow can be visualize. Besides that, this method is more affordable compare than traditional method. 5 ACKNOWLEDGEMENTS The authors gratefully acknowledge financial support from the Ministry of Science Technology and Innovation Malaysia. 6 REFERENCES [1] Atienza J. M., Ruiz-Hervias J. and Elices M. (2012), Experimental Mechanics, Vol. 52, pp [2] Aziz M. S. A., Abdullah M. Z., Khor C. Y., Mazlan M., Iqbal A. M., Fairuz Z. M. (2015), International Journal of Numerical Methods for Heat & Fluid Flow, Vol. 25, pp [3] Li S., Xie G., Sunden B. (2015), International Journal of Numerical Methods for Heat & Fluid Flow, Vol. 25, pp
120 Electrochemical Corrosion Studies of Oxides formed on Carbon Steel in Presence of Metal Ions by Hydrothermal Method Sumathi Suresh 1,2, S. Rangarajan 1,2, * and S. Velmurugan 1,2 1 WSCD, BARCF, Kalpakkam, Tamil Nadu, India 2 HBNI, Anushakti Nagar, Mumbai, India *sranga@igcar.gov.in Abstract-The corrosion of carbon steel is reduced by the presence of passive magnetite film. This film was modified by the incorporation of metal ions such as nickel, zinc and magnesium individually in lithiated water at 250 o C by hydrothermal method. This study was carried out to know the extent of improvement in corrosion resistance of carbon steel due to modified film compared to pure magnetite film. These modified films were confirmed by Grazing Incidence X-ray Diffraction studies for its spinel phase. The corrosion properties of these modified films were studied using electrochemical impedance spectroscopy and potentiodynamic anodic polarization methods. The films grown in presence of metal ions exhibited a higher polarization resistance compared to its absence by impedance studies. The results obtained from potentiodynamic anodic polarization showed a similarity in corrosion current densities for the films obtained in the absence and presence of metal ions compared to the carbon steel. Keywords - Carbon Steel, Hydrothermal, Nickel Ferrite, Zinc Ferrite, Magnesium Ferrite 1 INTRODUCTION Carbon Steel (CS) is used as out of core structural material in the primary heat transport system of Indian Pressurized Heavy Water Reactors. During the operation of these reactors some of the corrosion products get neutron activated in the core and become radioactive which subsequently get incorporated in the magnetite (Fe 3O 4) film present on CS causing man-rem problems. Though the corrosion rate of CS is reduced by Fe 3O 4 film, the radioactivity transport problem necessitates further reduction in the metal ion release. Metal ion passivation method is being used to modify the oxide films to control the corrosion of base metal [1-2]. Hence, to know, whether modifying the existing oxide films with the addition of external metal ions such as Ni 2+, Zn 2+ and Mg 2+ would improve the adherence and protectiveness of the interfacial film on CS, this study was carried out. Nickel, zinc and magnesium ferrite coatings on CS were formed in lithiated water (LiOH) in presence of Ni 2+, Zn 2+ and Mg 2+ ions respectively at 250 o C exposed for 96 and 240 hours by hydrothermal method. The films formed were characterized by Grazing Incidence X-Ray Diffraction (GI-XRD) and their corrosion properties were studied in LiOH medium at ambient temperature (28 o C) by electrochemical impedance spectroscopy (EIS) and potentiodynamic anodic polarization (PDAP) techniques and the results obtained are presented in this paper. 2 RESEARCH SIGNIFICANCE This research study has relevance to the man-rem problem that is faced by the operating nuclear power plants. By improving the corrosion resistance of the pure magnetite film by metal ion passivation with externally added metal ions the quantum of corrosion product release rates could be reduced which in turn will minimize the formation of the radionuclides leading to lower man-rem. 3 MATERIALS AND METHODS 3.1 High temperature exposure experiments Polished CS specimens were immersed in an appropriately preconditioned autoclave for 96 and 240 hours in a deaerated solution of LiOH medium (ph RT 10.3 and conductivity 43 µs/cm) at 250 C. For the incorporation of the Ni 2+, Zn 2+ and Mg 2+ ions into the Fe 3O 4 lattice during its formation on CS, 1 ppm of the corresponding metal ions were added to the LiOH solution. 3.2 GI-XRD measurements The films formed were characterized using INEL, Equinox 2000 model with Cu K α as the incident radiation (λ= Å) in the range of 2θ = 10 o 90 o with a step size of o. 3.3 Electrochemical measurement Corrosion experiments were carried out at 28 o C in LiOH medium using an Eco Chemie Autolab, PG STAT 30 system in a conventional three-electrode cell with platinum foil as counter electrode and saturated calomel as reference electrode and the solution was deoxygenated using Argon gas to minimize the dissolved oxygen. The 85
121 uncoated CS was stripped cathodically at -1.0 V potential for 3 minutes to remove any air formed film whereas for the coated specimen this process was not carried out. The open circuit potential (OCP) was monitored for 30 minutes and the impedance spectra was obtained with a perturbation of single sinusoidal voltage of 10 mv in the frequency range of Hz [3]. The impedance spectra were analyzed using the equivalent circuit for the porous model, R s(q 1[(R 2Q 2)R 1]). The PDAP scans were obtained by polarizing the working electrode from -0.4 V to +1.2 V with respect to OCP at a scan rate of 0.5 mv per second. 4 RESULTS AND DISCUSSION Table 1 gives the thickness values calculated by Clarke's method. The thicknesses of the films slightly increased with increase in exposure time. The thickness obtained in presence of Zn 2+ and Mg 2+ ions were less compared to that obtained in presence of Ni 2+ ions and magnetite. Table 1:Calculated film thickness Exposur Thickness ( m) e Time Fe 3O 4 NiFe 2O 4 ZnFe 2O 4 MgFe 2 O hours 240 hours The films formed on CS was analyzed by GI-XRD. The GI-XRD patterns showed cubic spinel ferrite peaks. An additional peak at ~ 45 o was from the base metal. The spinel formed consisted entirely of crystalline NiFe 2O 4, ZnFe 2O 4 and MgFe 2O 4 having preferred orientation along (311), (222) and (311) plane respectively and the peak intensity increased with increase in exposure time. No impurity peaks of Fe 2O 3 or FeO were detected. Figures 1(a) and 1(b) shows the Nyquist and PDAP plots respectively. Low frequency and high frequency capacitive loops were attributed to processes occurring at metal/film and film/solution interface respectively. The polarization resistance (R 2), is a measure of electron transfer across the metal/film interface and is inversely proportional to the corrosion rate. An increasing trend in the R 2 values were observed at 96 and 240 hours indicating a better corrosion resistance in presence of each metal ion. Longer exposure time (240 hours) showed similar polarization resistance values in presence of metal ions (162 to 166 K ), but higher than the value obtained for magnetite (122 K ), indicating that the corrosion protection offered for CS is better in presence of metal ions. The main cathodic and the anodic reaction could be reduction of H 2O and the metal ion release from CS respectively, since the ph of electrolyte was alkaline and deaerated. In all the cases, an active to passive transition was observed due to the formation of ferric hydroxide film at the anodic potentials. The corrosion resistance for Fe 3O 4 film followed the order: 96 hours 240 hours > CS. The current densities for the films formed in presence of Ni 2+, Zn 2+ and Mg 2+ ions exposed to 96 and 240 hours had magnitudes lower than that observed for uncoated CS and the corrosion resistance of CS in presence of Ni 2+, Zn 2+ and Mg 2+ ions followed the order: CS < 96 hours < 240 hours. Though the film formed in presence of Mg 2+ ions in the case of 96 and 240 hours duration showed a lower passive current density compared to the uncoated CS the film was not stable at higher anodic potentials. Initially, though the corrosion rates were different for the different films, longer exposure time showed similar corrosion rate values. Figure 1: (a) Nyquist and (b) PDAP plot of films formed at 240 hours 5 CONCLUSION The thickness of the oxide film formed in 240 hours exposure followed the order: ZnFe 2O 4 MgFe 2O 4 Fe 3O 4 NiFe 2O 4. Spinel phase of nickel ferrite, zinc ferrite and magnesium ferrite films formed on carbon steel in presence of nickel, zinc and magnesium ions respectively were confirmed by GI-XRD. At 240 hours, electrochemical measurements showed that, the corrosion protection offered by these oxide films on carbon steel followed the order: ZnFe 2O 4 MgFe 2O 4 NiFe 2O 4 Fe 3O 4. Hence, it was inferred that the zinc and magnesium ferrites form a more adherent and compact film compared to magnetite and nickel ferrite. 6 REFERENCES [1] C.C. Lin. (2009), Progress Nuclear Energy, Vol. 51, pp [2] S. Velmurugan, S. Padma, S. V. Narasimhan, P. K., Mathur and P. N. Moorthy. (1996), Journal of Nuclear Science and Technology, Vol. 33, No. 8, pp [3] T.S.N. Sankaranarayan, I. Baskaran, K. Krishnaveni and S. Parthiban. (2006), Surface and Coatings Technology, Vol. 200, pp
122 Corrosion Evaluation of Incoloy 800 in Octadecylamine Solutions Subrata Kuilya, Veena Subramanian, S. Rangarajan* and S.Velmurugan Water and Steam Chemistry Division, BARC Facilities, Kalpakkam Abstract The integrity of PHWR steam generator tubing, Incoloy 800, assumes great importance, under both normal operation and shutdown (wet layup), as it forms the primary pressure boundary. The objective of this study was to augment the protection, offered by secondary side ET ph regime of 8.5 to 9.2, using film forming amines (FFAs) like octadecylamine (ODA) and quantify the inhibitive effects. Potentiodynamic polarisation studies at 75 C in a solution containing 6 ppm ETA and 6-20 ppm ODA, showed that alloy corrosion rate marginally decreased when 15 ppm ODA was used. EIS studies indicated formation of a more resistive film on ODA additions and highest oxide resistance was observed for 15 ppm ODA. Keywords Incoloy-800, Octadecylamine, PHWR, EIS. 1 INTRODUCTION In Indian pressurised heavy water reactor (PHWR), Incoloy 800 is being used as the structural material for steam generators. The corrosion of structural materials in secondary water circuit is controlled by maintaining the ph in the range of , by the addition of a very low concentration of all volatile amine such as ethanolamine (ETA) which is known as the all volatile treatment (AVT). In recent years, addition of film forming amines (FFAs) along with the ph controlling amine is gaining popularity [1]. The FFAs are known to further reduce the corrosion of materials to extremely low values and hence, they can be utilized in wet layup procedure wherein, a particular component of the plant will not be in use for a long time. The objective of this investigation is to study and quantify the inhibitive effects of a film forming amine such as octadecylamine (ODA) on Incoloy RESEARCH SIGNIFICANCE ODA has been proved to be very effective for reducing the corrosion of carbon steel, the boiler material on the shell side [2]. However, not enough has been done for the SG materials, especially Incoloy 800 which is used in India. This study is an attempt to understand the influence of ODA on the incoloy under the PHWR secondary side conditions. 3 MATERIALS AND METHODS This study involves electrochemical study of film formation on Inocloy-800 with ETA+ODA solutions at 75 C. Electrochemical impedance spectroscopy (EIS) and potentiodynamic polarisation were performed using AUTOLAB PGSTAT 30 system. The composition of Incoloy-800 used was given in Table 1, as analyzed by X-ray fluorescence (XRF) method. Table 1. Composition of Incoloy-800 by XRF method Elements (wt %) Fe Ni Cr Mn Ti Si Co Mo Studies at 75 C Incoloy 800 was exposed to a solution containing 6 ppm ETA (kept constant in all the experiments) and the concentration of ODA varied from 6 ppm to 20 ppm. The specimens were polished upto 3 µm surface finish and degreased with acetone and washed with ultrapure water before exposure. Solution ph and conductivity values were 8.2 and 8 µs/cm (measured at 44 C) respectively and the values were unchanged with increasing ODA concentration. The solutions were deaerated by purging with Ar. For the polarization method, the scan rate was 0.5 mv/s. For the EIS, the excitation potential was 10 mv and the frequencies were scanned from 10 KHz to 5 mhz. The Impedance spectra were recorded periodically till 3 hours to observe any changes in the film formation and behaviour. 4 RESULTS AND DISCUSSION 4.1 Potentiodynamic polarization studies at 75 C The tafel plots (Figure 1) showed a region of constant current in the anodic side suggesting film formation in all the cases. The calculated corrosion rate from tafel plots were given in Table 2. Probably, 6-12 ppm ODA was slightly inadequate to form a uniform film and hence there was a slight increase in corrosion rate. A marginal decrease in corrosion rate was observed when ODA concentration was increased 15 ppm of ODA. These data suggested that the film formed was not protective. 87
123 R oxide ( ) Potential applied (V) ppm ETA 6 ppm ETA & 6 ppm ODA 6 ppm ETA & 8 ppm ODA 6 ppm ETA & 12 ppm ODA 6 ppm ETA & 15 ppm ODA 6 ppm ETA & 20 ppm ODA are the fitting of the data to the equivalent circuit (EC) as given in Figure 3). Solution Porous film Inner oxide film Metal R S C oxide R oxide R CT C IO R IO log I Figure 3. Physical model and equivalent circuit used for fitting the impedance data Q dl Figure 1. Tafel plots for Incoloy in various ETA, ODA mixtures at 75 C.. Table 2. Results of Tafel plot analysis Serial No Concentration (ppm) Ecorr (Volt) Corrosion Rate (mpy) ETA ODA EIS studies at 75 C The time evolution of the film formation was studied by recording EIS spectra at different time intervals. Figure 2 gives nyquist plots for the experiments done soon after stabilization of open circuit potential (OCP), referred to here as 0 h. Analysis was done by fitting the data to an electrical equivalent circuit corresponding to the physical model as shown in Figure 3. The film formed with ODA had ~10 times higher resistance as compared to that exposed only to ETA. -Z"( /cm 2 ) 35k 30k 25k 20k 15k 10k 5k 6 ppm ODA at 0 h 12 ppm ODA at 0 h 15 ppm ODA at 0 h 20 ppm ODA at 0 h 0 ppm ODA at 0 h Fitted to EC 0 0 5k 10k 15k 20k 25k 30k 35k Z' ( /cm 2 ) Figure 2. Nyquist plots taken soon after stabilization of OCP. (The symbols are experimental data and the lines The detailed analysis suggested that the outer porous film formed in presence of 15 ppm ODA had maximum resistance and water uptake as indicated by the change in impedance spectra as a function of time, was the least in this case (Figure 4). The resistance of the inner oxide film (R IO), on the other hand, was similar irrespective of the ODA concentration. The charge transfer resistance (R CT) also was found to be maximum for 15 ppm ODA Figure 4. Variation of resistance of porous oxide as a function of exposure time. 5 CONCLUSION Corrosion of Incoloy 800 in simulated wet layup condition in secondary side water chemistry was studied. The addition of ODA along with ETA influences the outer film formed on Incoloy. The resistance of the film increased by an order of magnitude with ODA additions shows that it can influence the long term corrosion rate significantly. 6 REFERENCES Time (h) 0 ppm ODA 6 ppm ODA 12 ppm ODA 15 ppm ODA 20 ppm ODA [1] Bursik A. and Hater W. (2015), All volatile treatment with film forming amines A first suggestion for an application guidance, PowerPlant Chemistry, Vol. 17(6), pp [2] Rohani-Rad A., Mofidi J. and Modaress-Tehrani Z. (2003), Corrosion engineering science and technology, Vol. 38(1), pp
124 Evaluation of Corrosion Inhibition of Tetrabutylammonium Bromide for Mild Steel In 3.5% NaCl Medium N.Subasree, J.Arockia Selvi *, and M.Arthanareeswari Department of Chemistry, SRM Institute of Science and Technology, Kattankulathur , TN, India Abstract The corrosion inhibition performance of Tetrabutylammonium bromide (TBAB) for mild steel in 3.5% NaCl solution has been evaluated by weight loss method, Potentiodynamic polarization and electrochemical impedance spectroscopy (EIS). The highest inhibition efficiencies were noticed at concentrations above and below a certain concentration known to be critical micelle concentration.polarization studies showed that the inhibitor behaves as a mixed-type of inhibitor. Electrochemical impedance study showed that a protective layer was formed on the metal surface. Keywords-Corrosion inhibitor, Mild steel, Polarization study, Electrochemical impedance analysis. 1 INTRODUCTION Mild steel does possess some excellent physical and mechanical properties. For heat exchanges, apart from copper, it is carbon steel and stainless steel that are the most commonly used. Chemical corrosion, many factors affects corrosion in metals such as the environment nature and the nature of the metal itself. The use of inhibitor is one of the most important methods to protect the metal from corrosion [1]. Inhibitor is a substance added in small amount to control corrosion rate of the metal. Most of the inhibitors are organic compounds containing heteroatom such as oxygen, nitrogen, phosphorous and sulphur. The inhibition mechanism is based on interaction of metal with inhibitors functional group. These functional groupsare bonded to the metal surface either by chemisorption or physisorption. TBAB contains hetero atoms and halide ions. These groups of TBAB act as effective inhibitor for corrosion. Prathiba B S, has reported that Inhibition of Sulphuric acid corrosion of mild steel by TBAB [2]. The objective of this study was to investigate the effectiveness of TBAB as corrosion inhibitor for mild steel in 3.5% NaCl medium using weight loss and electrochemical measurements also the influence of CMC on the inhibition efficiency of TBAB on mild steel corrosion. 2 RESEARCH SIGNIFICANCE Conductivity method was used to determine the critical micelle concentration (CMC) of TBAB in the corrosive environment of 3.5% NaCl. Inhibition efficiency depends on the CMC, which increases above CMC. The conductance was measured from electronic conductivity meter. The CMC values were determined by plotting concentration versus conductivity of TBAB [3]. 3 MATERIALS AND METHODS The experiments were performed on samples of mild steel with chemical composition of C-0.116%, S-0.007%, P-0.006%, Mn-0.85%, Si-0.05% and Fe-97.57%. Mild steel coupons were polished to mirror finish, degreased with acetone, dried and then kept in desiccator for preventing them from oxidation by atmospheric moisture. 3.1 Weight loss method In this method, previously weighed metals (W1) were immersed in 100ml of 3.5% NaCl solution in the absence and presence of different concentration of TBAB at room temperature 30 o C. After 24 hours of immersion, the metals were taken out washed, dried and weighed (W B). IE% was calculated by following Equation 1, Inhibition Efficiency (%) = W B W I W B 100 Eq Electrochemical studies Potentio dynamic polarization and impedance measurements were carried out using an (Bio-logic SP300 with EC lab software) a three electrode assembly. Polarization curves were recorded at 1mV s -1. Impedance measurements were carried out in a frequency range of Hz to 0.010Hz using amplitude of 10mV peak using AC signal at the open circuit potential. 4 RESULTS AND DISCUSSION 4.1 Weight loss method The corrosion rate and inhibition efficiency as determined by weight loss method of mild steel corrosion in 3.5% NaCl with and without addition of different concentration (50-250ppm) of TBAB for 24 hours are given in Table 1. The result shows that the formulation consisting of 150ppm TBAB has 64.9% IE, in controlling corrosion of mild steel in aqueous medium. Because CMC formed in certain concentration (200ppm) of inhibitor. 89
 CR(mm/y) IE (%) Blank 0.2693-50 0.1903 29.3 100 0.1486 44.8 150 0.0743 72.4 200 0.2414 10.3 250 0.1764 64.9 4.")


125 Table 1. Inhibition efficiency (IE) and Corrosion rate (CR) for mild steel immersed in 3.5%NaCl solution in the absence and presence of inhibitors by weight loss method. Conc. (ppm) CR(mm/y) IE (%) Blank CMC of inhibitor Conductivity increases with increase in concentration of TBAB and attain a break point. That point designates the CMC. CMC is a key factor in the corrosion inhibition by the use of surfactant, below CMC, surfactant adsorption typically in the form of monolayer, and above CMC, surfactant molecules adsorbed in the form of multiple layers. Figure 1 shows the CMC attain to 200ppm. The best efficiency obtained at 150ppm. This is because at concentration less than CMC, the metal surface is increasingly covered by adsorbed TBAB molecules at the monolayer level. Figure 1. CMC for mild steel in 3.5%NaClfor various concentrations of TBAB. 4.3 Potentiodynamic polarization Potentio dynamic polarization curves for mild steel in aqueous medium with and without inhibitor are shown in Figure 2(a). Electrochemical parameters are given in Table 2. The corrosion current densities reduced from 27.08µA/cm 2 to 11.38µA/cm 2 with increase in concentration of the inhibitor. Although, there is no notable difference in the Ecorr range attained in the absence and presence of inhibitor. As it is seen from Table 2 the maximum inhibition efficiency was found to be 58% in 3.5%NaCl at 150ppm inhibitor concentration. The plots shows linear shape at lower current densities due to protective layer formed on the metal surface [4]. and C dl decreases from to 4.74 µf/cm 2 with increase in concentration of TBAB. As a result 63.5% inhibition efficiency was observed at 150 ppm concentration of TBAB. Figure 2. (a) Tafel polarization curve and ( b) Impedance spectra for mild steel in 3.5%NaCl in absence and presence of 150ppmof TBAB Table 2. Corrosion parameters of mild steel in 3.5%NaCl medium in absence and presence of 150ppm of TBAB by electrochemical studies. Conc. (ppm) E corr (mv) 5 CONCLUSION The inhibition efficiency of TBAB about 72.4% at a concentration of 150ppm in 3.5% NaCl medium. CMC of TBAB was determined by conductivity method. Polarization studies showed that TBAB acts as a mixedtype corrosion inhibitor. IE (%) obtained from weight loss measurement was in good agreement with EIS and polarization methods. 6 REFERENCES I corr (µa/cm 2 ) IE (%) R ct (ohm.cm 2 ) C dl (F/cm 2 ) IE (%) Blank [1] Prathipa V. and Sahaya raja A. (2017), 10(4),pp [2] Prathiba B.S. and Kotteswaran P. (2013), 2(4), pp1-10. [3] Kumar G. and Chauhan M.S. (2018), Journal of molecular liquids,249, pp [4] Baymou Y. and Bidi H. (2018), Journal of Bio-and Tribo- Corrosion,4(11). 4.4 Impedance spectra Electrochemical impedance measurements for mild steel corrosion in 3.5% NaCl in the absence and presence of 150ppm concentration of TBAB is represented in Figure 2(b). The semicircle impedance diagram suggested that mild steel corrosion in 3.5% NaCl is mainly controlled by charge transfer process. The impedance parameters are given in Table 2. Rct increases from to Ώ cm 2 90
126 Effect of Leachable Chloride on Pitting Initiation of Austenitic Stainless Steel 304 Under Thermal Insulation:Case Study Prema Sivanathan * Department of Mechanical Engineering, Universiti Teknologi PETRONAS, Bandar Seri Iskandar, Perak, Malaysia *y2ps12@gmail.com Abstract Stress corrosion cracking (SCC) of Austenitic Stainless Steel type 304 under thermal insulation is a classical failure case, but recurrent failures require further analysis of possible mechanisms which lead to the damage particularly on the effect of leachable chloride from thermal insulation. The objective of the research was to investigate the effect of chloride leached from thermal insulation material on pitting initiation of Austenitic Stainless Steel. The study was based on an actual failure case sample whereby proposed parameters such as temperature and chloride concentrations were derived. An experiment was carried out by using ASTM G-30 standard for the U-bend test. The investigation was carried out to simulate (SCC) of Austenitic Stainless Steel 304 under chloride environment. The test parameters used were various chloride concentrations of 200 ppm to ppm at 40, 60, & 85 C temperature. Keywords Stress Corrosion Cracking, Chloride, Temperature, Thermal Insulation 1 INTRODUCTION Corrosion damage is a significant deterioration of a metal which leads to (SCC). Chloride induced stress corrosion cracking (CISCC) of Austenitic Stainless Steel under thermal insulation is a severe problem which causes production downtime. Prevalent (CISCC) mechanism is triggered by initiation of localized pitting or crevice corrosion. This results from breakdown of surface passive film due to the existence of chloride ions which eventually lead to the formation of pits. Pits open up subsequently leading to the initiation of the cracks and the propagation of cracking occurs due to the presence of cyclic temperature and the integrity of the system fail after exposure to longer period of time [1]. One of the important aspects of (CISCC) is the understanding of the accumulated concentration of leachable chloride role in initiation of pitting which then leads to cracking. However, there are many contradicting parameters explaining possible mechanisms leading to cracking case. This is best studied from failure cases whereby real parameters can be investigated and duplicated in a laboratory set-up [2]. 2 RESEARCH SIGNIFICANCE It is generally understood that the primary factor that controls the initiation of cracking is related to damage of passivation due to chloride. A general understanding of (CISCC) leads to higher control of chloride in process stream and tolerance of chloride in insulation material. In order to understand actual factors that lead to cracking case, industrial failure case can be used to scrutinize cracking mechanism. 3 MATERIALS AND METHODS The research focuses on the failed knock out drum which was found leaking during the operation at the site. The work was mainly based on the root cause derived from this leakage case. The purpose of this research is to study the parameters such as chloride ion concentrations, temperature and any other contributing factors for the initiation of cracking. U-bend test as per ASTM G 30 Standard method was used to carry out the experiment for 3 months each set. The laboratory experiment is repeated with the same U-bend specimen, but with different chloride concentrations (200 to ppm) for each set at 40, 60, and 85 C temperature. 3.1 Parameters based on failed pressure vessel case The schematic design of the failed pressure vessel as shown in Figure 1. The design data for the failed pressure vessel as shown in Table 1 below. Data received based on the failure case study from gas processing plant pressure vessels. Figure 1. Schematic design of failed Pressure vessel tank Figure 2. DPT results of U-bend specimens at 40, 60, and 85 C after a total of 9 months (200 to ppm) 91
![Temp C/ Stereo results 40 C [Cl] Mode of ppm Corrosion 15000 General Corrosion 20000 General Corrosion 25000 General Corrosion 30000 General Corrosion 60 C](/docs-images/78/76861956/images/127-0.jpg "15000 Metastable pitting 20000 Metastable pitting 25000 Metastable pitting 30000 Metastable pitting 85 C 10000 Black film formation 15000 Black film")

 Table 1.")
 Design Pressure 350 Psi ( 2413 kpa) Insulation classes Perlite(thickness 50 mm) Vessel Material AISI type 304 Austenitic stainless steel 4")


 were tested at 40, 60, and 85 C temperature, no initiation of")
127 Temp C/ Stereo results 40 C [Cl] Mode of ppm Corrosion General Corrosion General Corrosion General Corrosion General Corrosion 60 C Metastable pitting Metastable pitting Metastable pitting Metastable pitting 85 C Black film formation Black film formation Black film formation Black film formation Black film formation Result of Evaluation No evidence of cracking No evidence of cracking No evidence of cracking No evidence of cracking No evidence of cracking No evidence of cracking No evidence of cracking No evidence of cracking No evidence of cracking No evidence of cracking No evidence of cracking No evidence of cracking No evidence of cracking Visual inspection results NDT results Dye Penetrant Test (DPT) Table 1. Operating parameter of the failed Pressure vessel Parameter Value Operating Temperature -150 C Design Temperature -160/60 C Operating Pressure 90.5 Psi (624 kpa) Design Pressure 350 Psi ( 2413 kpa) Insulation classes Perlite(thickness 50 mm) Vessel Material AISI type 304 Austenitic stainless steel 4 RESULTS AND DISCUSSION The results of these experiments are summarized in Figure 2 above. The indication caused by U-bend specimen surface corrosion groove/pits or defects less than 1mm in length were not considered and U-bend specimens with such minor defects were also noted as No evidence of cracking. Based on the results, general localized corrosion was the major corrosion attack for all the U-bend specimens for 40 C, Metastable pitting corrosion attack for all the U-bend specimens for 60 C and black film formation for all the U-bend specimens for 85 C with different chloride concentrations between 200 ppm to ppm. It was observed that the pitting severity rate were gradually increased with increasing Cl- ion concentration for increasing temperature for each set 3 months of experiments. Both general and pitting corrosion of Austenitic Stainless Steel type 304 is dependent on the passive film breakdown to initiate the (CISCC). 5 CONCLUSION In conclusion condition of chloride level ranges between (200 to ppm) were tested at 40, 60, and 85 C temperature, no initiation of cracking was found in Austenitic Stainless-Steel type 304. In contrast, only severe pitting corrosion significant difference was noted between the high and low temperatures. 6 REFERENCES [1] R. Parrott and H. Pitts, "Chloride stress corrosion cracking in austenitic stainless steel: Assessing susceptibility and structural integrity," UK Health and Safety Executive, [2] N. RP, "The Control of Corrosion Under Thermal Insulation and Fireproofing Materials-A Systems Approach," Houston, Texas, [3] A. G30-97, "Standard Practice for Making and UsingU- Bend Stress-Corrosion Test Specimens,"
128 Zinc Free Pigment for Anti-Corrosive Coating Nithyaa J, Krishnapriya K V, and Nishanth K. G. * Materials Science and Technology Division, CSIR- National Institute for Interdisciplinary Science and Technology (NIIST), Thiruvananthapuram-19, *nishanthkg@niist.res.in Abstract Currently using major anti-corrosive coating contains Chromates and zinc phosphate pigments. Toxicity of chromates and short-term durability of zinc phosphate were major issues. Our intention to replace it by nontoxic and durable rare earth phosphates. Rare earth and phosphate precursors were used to synthesize pigments by solid state and sol gel methods. Pigments were characterized by PXRD, HRTEM and SEM. Commercial epoxy binder was utilized for the incorporation of pigment and coated on the metallic coupons and anticorrosive property of the coating was studied via electrochemical measurements and immersion test. Keywords Zinc free pigment, Anticorrosive pigments, EIS Measurements, Immersion studies. 1 INTRODUCTION The barrier, adhesion, and inhibiting features have an important role in lifetime of coatings. Epoxy resins are utilized for such application due to their excellent anticorrosive properties, chemical resistance and mechanical properties. Considering the regulations to protect the environment against chromate toxicity, the use and application of chromates has been restricted. Later zinc phosphate was recognized as efficient anti-corrosive pigment. To overcome the low durability and environmental issues of the zinc phosphate without losing its efficiency, led to efforts toward finding non-toxic durable inhibitors [1,2]. Phosphate ions can react with many metal ions and form the insoluble phosphorous compounds, which deposits on the surface and inhibits the corrosion of the substrate. Therefore, phosphates chosen as anodic part of inhibitor and rare earth as cathodic part. 2 RESEARCH SIGNIFICANCE The impact Zinc phosphate is an extensively used anticorrosive pigment even though it has some environmental issues. In the light of forgoing, the present work is on rare earth phosphates based as Zinc-free anticorrosive pigments. 3 MATERIALS AND METHODS 3.1 Pigment preparation Rare earth phosphate pigments were prepared through solid state and sol-gel methods. Phosphate and rare earth nitrate precursor were used in sol-gel method. ph of the reaction mixture and rate of stirring was fine tuned to get the desired morphology. Pigment sample was characterized by various physicochemical techniques like XRD using Philips X pert Pro diffractometer, Ni-filtered Cu-Kα (λ= nm) radiation. And morphology was studied by TEM and SEM (SEMJEOL JSM-5600). 3.2 Coating Preparation Rare earth phosphate was well dispersed in n-butanol using sonicator for 10min then followed by the addition of commercial epoxy and respective curing agent. Subsequently, the epoxy-pigment coating was done on a polished metallic substrate by dip coating. Then it was allowed to cure for 24h and stored in a vacuum desiccator till the electrochemical experiment. 3.3 Electrochemical Measurments EIS measurements were performed employing an Autolab instrument with three electrode system including Calomel reference electrode, Pt counter electrode and coated metal specimen as working electrode in 3.5 wt. % NaCl solution. Open Circuit Potential (OCP), Free corrosion potential (Ecorr) and Electrochemical Impedance Spectroscopy (EIS) measurements were done to study the anticorrosive ability of the organic coating under a frequency of 10 mhz and voltage 10mV. 3.4 Immersion Test Corrosion performance of the coated specimens was also evaluated via immersion studies. Crossed specimens were prepared according to ASTM standards by generating a 2 cm cross line on the coated surface using a paper cutter. The scratched specimen was then immersed for 200 h in 3.5 wt. % NaCl solution at room temperature. Specimens were visually inspected and photographed periodically during the test. 93

129 4 RESULTS AND DISCUSSION 4.1 Pigment Characterization Pigment sample was characterized by various physicochemical techniques like XRD, TEM and SEM X-ray powder diffraction Phase purity of the synthesized sample was evident from XRD data, which also observed to be highly crystalline in nature, which is given in Figure 1. Intensity Angle 2 Figure 1. XRD of synthesized Rare earth Phosphate HRTEM Morphology of the pigment was studied using HRTEM. The synthesized pigment has lamellar morphology which increase the path way between corrosive medium and metal speciman. The crystallinity of the sample was evident from the fringes as shown in Figure 2. Figure 2. TEM image of Pigment 4.3 Electrochemical Analysis Electrochemical analyses were done for commercially available zinc phosphate and rare earth phosphate was compared with bare metal. Open Circuit Potential (OCP), Free corrosion potential (Ecorr) and Electrochemical Impedance Spectroscopy (EIS) measurements were done to study the anticorrosive ability of the organic coating and the values are given in Table 1. Table 1. Comparison of electrochemical measurement. Pigments Icorr (A/cm 2 ) ba bc IE (mv/dec) (mv/dec) (%) Bare 8.56E Rp IE (ohm) (%) Zn3PO4 6.72E Rare earth 4.42E phosphate 5 CONCLUSION Lamellar morphology of the rare earth pigment leads to anti corrosive, highly durable, non-toxic anticorrosive coating with good adhesion behavior. Immersion measurements and electrochemical analysis were shows good agreement. 6 ACKNOWLEDGEMENTS Financial support from Science and Engineering Research Board (SERB), DST, Government of India 7 REFERENCES [1] John S. (2001), Challenges of chromate inhibitor pigments replacement in organic coatings, Elsevier, Progress in organic coatings, Vol. 42, pp [2] Naderi R and Attar M M. (2014), Effect of zinc free phosphate based anticorrosion pigment on the cathodic disbondment of epoxy poly amide coating, Elsevier, Progress in organic coatings, Vol 77, pp Coating Characterization FESEM Morphology of the coated substrate was studied using Field Emission Scanning Electron Microscope (SEMJEOL JSM-5600). Thickness of organic coating was found to be 8-9µm Immersion Study Rare earth phosphate and zinc phosphate loaded epoxy coating metal coupon and bare metal were immersed in 3.5% NaCl. Blistering was not found even after 200h in rare earth phosphate loaded coupon. 94
130 Green Silicate-Based Corrosion Inhibitor from Rice Husk Ash as Potential Anti-Corrosion for Carbon Steel Nadzirah Mohamad, Zulhusni Dasuki, Emee Marina Salleh and Norinsan Kamil Othman* 1 School of Applied Physics, Faculty of Science and Technology, Universiti Kebangsaan Malaysia, Bangi, Selangor Darul Ehsan, Malaysia *insan@ukm.edu.my Waste products from mass plantation such as rice husk can act as a corrosion inhibitor for alloys in acidic medium. This corrosion inhibitor can replace harmful conventional corrosion inhibitors such as chromate and nitrite. The silicate corrosion inhibitor was obtained via chemical reaction between 0.2M NaOH and silica extracted from rice husk ash. Presence of corrosion inhibitor in 0.5M HCl reduced weight loss and corrosion rate of carbon steel, besides increased inhibition efficiency up to 21.7%. Tafel polarization study indicated that the addition of inhibitor acted as a mixed type of inhibitor. Therefore, the used of rice husk as corrosion inhibitor has a great potential as an alternative inhibitor that are much safer and efficient in the market. Keywords - Green corrosion inhibitor; rice husk ash; carbon steel; acidic medium 1 INTRODUCTION Inorganic and synthetic chemical-based corrosion inhibitor such as chromate and nitrate-based has been widely used in the industries and has lead into a serious environmental deterioration. Hence, the urgency to develop environmental friendly corrosion inhibitor has been greatly increase the researcher s interest especially in the development of corrosion inhibitor derived from natural sources i.e. paddy husk waste [1]. Generally, corrosion inhibitors based on natural sources are environmentally acceptable, less toxic, inexpensive to process and abundant in nature compared to corrosion inhibitor based on synthetic chemical [2]. In this study, corrosion inhibitor based on nanosilicate derived from rice husk waste would be the best candidate in replacing the harmful synthetic corrosion inhibitor. As past study reported that, silicate are naturally inorganic corrosion inhibitors that have been used in various applications and can be manipulated into a lot of applications and fit into today s high technology advancement [3]. A stabilised formulation of corrosion inhibitor based on silicate from the extract of rice (Oryza sativa L.) husk ash was developed and its corrosion inhibition efficiency on carbon steel sample against acidic environment in 0.5 M HCl was determined. 2 RESEARCH SIGNIFICANCE The silicate-based corrosion inhibitor from rice husk ash has the potential as green corrosion inhibitor and replaces the conventional corrosion inhibitor in the market with safer and less harmful impact to the environment. 3 MATERIALS AND METHODS The rice husk obtained was burned in the furnace at temperature of 600 ºC for 6 hours to obtained the rice husk ash. Then, the ash undergoes silicate extraction process by adding 2.5M NaOH with constant stirring at the temperature of 100 for 4 hours. The silicate solution was filtrated and dried in oven to obtained in powder form. The silicate powder was dissolved in 0.2M NaOH and ready for corrosion inhibition testing. 4 CORROSION MEASUREMENTS The test samples carbon steel (SAE 1045) were hung using nylon string and immersed in untreated and treated solution with silicate-based corrosion inhibitor. The test was immersed for 24 hours in a beaker filled with 0.5M HCl. Based on this test, the weight loss, corrosion rate and inhibition efficiency can be obtained using given equations; Weight loss (mg) = (W i W f ) Eq(1) W i Whereby, W i is weight before immersion and W f is the weight after being immersed. (534 W) Corrosion rate (mpy) = Eq(2) (ρ A T) Whereby, K is factor (534), W: weight loss (mg), ρ is density (g/cm3), A is area (inch2) and T is time exposed (hour). Inhibition Efficiency (%) = ( CR i CR ) 100 Eq(3) CR Whereby, CR i and CR are corrosion rate in the absence and presence of inhibitors, respectively. As for the tafel polarization testing, the potential range selected was in between -250 mv to +250 mv with the scanning rate of 1.0 mv/s by using potentiostat/galvanostat model k47 Gamry. 95
131 5 RESULTS AND DISCUSSION 5.1 Corrosion assesements by weightloss test. By referring to the weight loss data in Figure 1, it can be interpreted into corrosion rate and corrosion inhibition efficiency as shown in Figure 2. The corrosion rate of the carbon steels samples showed decreasing trend from 2449 mpy for samples without the addition of inhibitor to as low as mpy with the addition of inhibitor. The highest inhibition efficiency for the silicate-based inhibitor managed to achieved was at 21.7 %. Figure 1. Weight loss of carbon steel samples in 0.5 M HCl after 24 hours with and without the addition of silicate-based corrosion inhibitor Figure 3 the plot of Tafel polarization of carbon steel with and without the presence of silicate-based inhibitor. 6 CONCLUSION The silicate-based inhibitor formulated from rice husk has its potential in inhibiting the corrosion of carbon steel in 0.5 M HCl. The highest corrosion inhibition efficiency attained by using silicate-based inhibitor is at 21.7 %. Whilst the tafel polarization curved showed that the silicate inhibitor is a mixed type of inhibitor. 7 ACKNOWLEDGEMENTS The acknowledgement is sincerely express to the Ministry of Science, Technology & Innovative Malaysia (MOSTI) for the financial support given through the Science Fund Grants Scheme Figure 2. Graph of corrosion rate and corrosion inhibition efficiency of silicate-based corrosion inhibitor for carbon steel samples in 0.5 M HCl media. The increasing trend of corrosion inhibition with the addition of inhibitor concentration caused by the higher adsorption coverage that covered the carbon steel surface from direct contact with the corrosive environment [4] High inhibitor concentration also leads to a sturdy adsorption layer on carbon steel surface due to the chemical interaction between the inhibitor molecules on the steel surface [5] As for the tafel polarization testing, based on the E corr value acquired in the tafel plot in Figure 3, it showed that the difference between shifted E corr values between carbon steel sample untreated and treated with silicate-based inhibitor were lower than 85 mv. As stated by [6] if the shifted Ecorr value is lower than 85 mv the inhibitor can be categorized as mixed type of inhibitor. 8 REFERENCES [1] Othman N.K., S. Yahya and D.A. Awizar: Anticorrosive properties of nanosilicate from paddy husk in salt medium. Sains Malaysiana. 2016;45(8): [2] Sin H.L.Y.: Aquilaria malaccensis as a green corrosion inhibitor for mild steel in HClsolution. International Journal of Electrochemical Science. 2016;11(9): [3] Hamdy A.S.: Corrosion protection of aluminum composites by silicate/cerate conversion coating. Surface and Coatings Technology. 2006;200(12): [4] Rosliza, R. & Wan Nik, W. B Improvement of corrosion resistance of AA 6061 alloy by tapioca starch in seawater. Current Applied Physics 10: [5] Flores, Eugenio A., Olivares, O., Likhanova, N. V.,. Domínguez-Aguilar, M. A, Nava, N., Guzman-Lucero, D. & Corrales, M Sodium Phthalamates as Corrosion Inhibitors for Carbon Steel in Aqueous Hydrochloric Acid Solution. Corrosion Science 53: [6] Behpour, M., Ghoreishi, S. M., Mohammadi, N., Soltani, N. & Salavati-Niasari, M.,2010. Investigation of some Schiff base compounds containing disulfide bond as HCl corrosion inhibitors for mild steel. Corrosion Science 52,
132 Quantitative Structure-Property Relationships of Heterocyclic Organic Compounds as Corrosion Inhibitors for Steels Abhishek Agarwal *, Pradeep Rathore, Vinay Jain and Beena Rai Tata Research Development and Design Center, Tata Consultancy Services, 54B, Hadapsar Industrial Estate, Pune , India Abstract Corrosion poses a huge challenge to the sustainability of the built infrastructure, including oil and gas industry. A study by NACE International estimates the global cost of corrosion at $2.5 trillion annually. Thus, screening and discovery of novel organic corrosion inhibitors is very crucial for the oil and gas industry from the economic point of view. Artificial Intelligence (AI) has been used for material discovery and has tremendous potential in elucidating the link between electronic, structural and inhibition properties of complex organic molecules. In this work we applied advanced machine learning algorithms to build a single model which can predict the corrosion inhibition efficiencies of different classes of molecules such as pyridines, imidazoles, triazoles, etc. for steel in acidic medium. Keywords Corrosion inhibitors, machine learning, density functional theory 1 INTRODUCTION Corrosion is a major problem in many industries which culminates in huge economic losses. Corrosion inhibitors are preferably used to combat corrosion in these industries. Heterocyclic organic compounds consisting of N, O and S atoms are found to have corrosion inhibition property [1-2]. It has been observed by researchers that inhibition efficiency of organic molecules are linked with electron density of donor atom, functional groups, orbital character of donating electrons, dipole moment etc. [3-5] This has created an intense research interest in the community, especially corrosion science research groups to find effects of molecular structure on its inhibition efficiency and establish quantitative structure-property relationships (QSPR). Recently, theoretical prediction of the efficiencies of corrosion inhibitors using quantum chemical methods has been receiving great attention. Also, Artificial intelligence has successfully been used for material discovery [7] and may possess great capability to explain the link between electronic, structural, and inhibition properties of complex organic molecules. 97 In this work we have built regression models using advanced machine learning algorithms such as Random forest [7], Lasso [8], support vector machine (SVM) [9] etc. to predict the experimental inhibition efficiency using molecular and quantum chemical parameters of organic inhibitors such as pyridines, imidazoles, triazoles, oxadiazoles and thiadiazoles, hydrazides, Schiff bases and their derivatives for steel in acidic medium. 2 RESEARCH SIGNIFICANCE In most of the work done till now, authors have selected the best subset of original features and made the regression models using them. In these cases features which are moderately related or have indirect effect on inhibition efficiency are removed. Many times, a regression model may perform well on test data set even if some of the important variables are not considered for modeling. But these models are prone to failure if the neglected variables are not in the range of the training data set. Hence, inclusion of all the variables which have any significant direct or indirect relationship with output variable becomes important. Also, since the accuracy of the model depends on the underlying structure of the data, it is important to try many different algorithms to find the best suited model for a given data set. Moreover, most of the QSPR studies have been done for one or two classes of corrosion inhibitors, whereas we have tried to build a single model for many different classes of inhibitors. 3 MATERIALS AND METHODS The experimental inhibition efficiencies of corrosion inhibitors for steels in acidic medium were taken from the literature [10-14]. We have taken inhibition efficiency corresponding to maximum concentration of molecule used for testing. We have assumed that beyond the maximum tested concentration, there is no significant change in inhibition efficiency of the molecules.
133 3.1 Computational Procedure Density functional theory (DFT) calculations were performed with NWChem[15] software using the Becke s three parameter hybrid (B3LYP) functional[16] and orbital basis set 6-31+G** to optimize the heterocyclic organic molecules and to calculate descriptors such as dipole moment, ionization potential, electron affinity, electronegativity, electrophilicity, electron donor capacity, electron acceptor capacity, chemical hardness, total negative charge on the molecule, energy of highest occupied molecular orbital (HOMO), energy of lowest unoccupied molecular orbital (LUMO). Molecular volume, molecular area, partition coefficient (log P) of inhibitors were also calculated. Before making a model, we first addressed the problem of multicollinearity. We removed the variables which were highly correlated ( 0.9) based on correlation analysis. After that instead of selecting the subset of the variables, we transformed the data into principal component (PC) space [17] and then reconstructed the original data set. The top PC s were selected such that it would explain at least 90% variance of the initial data. Hence, most of the information contained in the weakly correlated variables having direct or indirect impact on output variable were retained. Then we built several machine learning models using support vector machines, regularized regression like ridge and lasso on training dataset. We also applied tree based models such as random forest. The regression models were developed in R statistical software using various machine learning algorithms [18-20]. 4 RESULTS We have taken data of 85 molecules out of which 72 molecules were taken for training and remaining 13 molecules were taken for test. Table 1 shows statistical parameters such as Rqsuare(R 2 ), Root mean square error (RMSE) and mean absolute error (MAE) corresponding to models obtained using various machine learning algorithms. From table 1 we can observe that the best model is obtained using nonlinear SVM with radial basis kernel. Also, performance of non-linear SVM is better than linear SVM as expected. We have made a single model which can predict the efficiencies of different type of inhibitors. Hence it s possible to develop a single model to predict inhibition efficiencies of different inhibitors. Ridge and lasso regression had a better accuracy or higher R 2 (lower RMSE) as compared to linear regression because they take care of over-fitting using L2 and L1 penalty [21]. This approach can further be used for different kind of inhibitors. The predicted and actual efficiencies of test molecules are shown in Figure 1. The predicted values are capturing the trend of the experimental efficiencies. 5 CONCLUSION In this study, machine learning algorithm-based models were developed which can predict the efficiencies of different kinds of molecules effectively. We also concluded that non-linear and decision-tree based models outperform the linear models. Table 1. Values of R2, Root mean squared error (RMSE) and Mean absolute error (MAE) Algorithms R 2 RMSE MAE Random Forest Linear Ridge Lasso SVM Radial SVM Linear GBM Figure 2: Experimental efficiency Vs Predicted Efficiency 6 ACKNOWLEDGEMENTS We would like to thank High Performance Computing team at TCS Pune for the EKA supercomputing resources. We would also like to thank Dr Venkat Runkana for his guidance and support. The help, support and encouragement received from Mr K. Ananth Krishnan, Chief Technology Officer (CTO), TCS is also gratefully acknowledged. 98
134 Electrochemical and surface investigation of 3-aminomethyl-5-methylhexanoic acid as effective corrosion inhibitor for Copper in 1.0 M HNO3 G. Vengatesh and M. Sundaravadivelu * Department of Chemistry, The Gandhigram Rural Institute-DU, Tamil Nadu, India *msundar_gri@yahoo.com In this study, the effect of pharmaceutically active compound 3-aminomethyl-5-methylhexanoic acid was tested as a corrosion inhibitor for copper in 1 M HNO3 using weight loss, Potentiodynamic polarization, EIS, SEM, EDX and FT-IR spectral techniques. EIS measurements confirmed that the charge transfer resistance was increased with increase of the concentration of inhibitor from ppm. Potentiodynamic polarization measurement showed that the inhibitor controls both anodic and cathodic reactions (mixed type). The surface modification further conformed by SEM, EDX, FT-IR. In addition, the inhibition performance was theoretically evaluated using DFT calculation. Keywords - Copper, HNO 3, EIS, DFT 1 INTRODUCTION Each nation loses 3-5% of its GDP on account of corrosion. The global economic loss due to corrosion is approximately $2.5 trillion estimated by National Association of Corrosion Engineers (NACE) in 2016 [1]. Copper metal find wide applications in various industries, because of its excellent mechanical strength, conductivity etc. However, a variety of environmental factors can easily cause corrosion of copper metal. The formed dust and corrosion products have a negative effect on heat transfer equipment and other materials. That is why periodic cleaning the equipment in acidic pickling solutions is necessary. During this cleaning, the acid is exposed to copper metal and its dissolution occurs. Hence, protection of metal against corrosion is a major industrial problem. Nitric acid is one of the most widely used corrosive media that attracted a great deal of research on copper corrosion. Various methods used to protect metal surface against corrosion (inhibitor, paint, surface modification, electroplating etc.) and among these methods, inhibitor is one of the most useful method in acid corrosion [2]. Most corrosion inhibitors are organic compounds. Their inhibition property relies on their functional groups, electron donating and accepting tendency of the molecule. The higher efficiency of hetero atoms is in the order O<N<S<P and such group containing compounds have been recorded as excellent inhibitors [3]. Most of the synthetic inhibitors are toxic and cause health hazards. Therefore, in the recent years, environmentally acceptable corrosion inhibitors are of great practical interest. It is well documented in the literature that pharmaceutical compounds containing amine and acid group are used as corrosion inhibitors. But very few synthetic compounds and drugs are reported for copper metal in nitric acid medium. In the present work, pregabalin drug (3-Aminomethyl- 5-methylhexanoic acid) have been studied for corrosion inhibitor. The inhibition efficiency (η %) is experimentally examined by weight loss method, electrochemical study and surface analysis. The experimental results further confirmed by quantum chemical study. 2 RESEARCH SIGNIFICANCE This inhibitor contains mainly two electron rich functional groups (amine and acid), and it easily interacts with metal surface to form protective layer. In the literature, limited research articles are available about inhibition of copper corrosion and hence it will be useful to scientific community and industry. In this study, theoretical calculation is used, which is useful to understand the interaction of inhibitor to the metal surface. 3 MATERIALS AND METHODS The high purity copper metal specimens are used in this study. Prior to all measurements, the specimen are pretreated by grinding with emery papers (1/0 to 7/0) and rinsed with distilled water, finally degreased with acetone and dried at room temperature. The acid solution is prepared by dilution of an analytical reagent grade 69 % HNO 3 with doubly distilled water and all measurements are carried out in 100 ml unstirred solutions. The weight loss measurement is carried out at the definite time interval of 3 hours at room temperature. A clean weighed copper electrode (3.5x1.0x0.2 cm) is completely immersed in inhibitor solution. After the exposure time, the specimen was withdrawn, rinsed with double distilled water, dried and weighed. The corrosion rate (CR) and η % are calculated. Electrochemical measurements are carried out in a conventional three-electrode system. A cylindrical copper rod is used as working electrode for electrochemical measurements and it is covered with epoxy resin (1 cm 2 99
135 cross-sectional area). A saturated calomel electrode (SCE) and a platinum foil are used as reference and counter electrodes, respectively. Electrochemical measurements are conducted using CHI760D electrochemical analyzer model. Before starting the electrochemical experiments, the working electrode is immersed in test solution during 1000 sec until a steady state open circuit potential (E OCP) is obtained. Impedance measurements are carried out in the frequency range from 100 khz to 0.01Hz. The polarization curve is recorded by polarization from 300 to 300 mv versus E OCP with a scan rate of 0.1 mv s 1. The SEM and EDX analysis are done with VEGA3TESCAN and bruker model respectively. Quantum chemical calculations are performed using Gaussian 05 software and utilizing the 6-31+G (d,p) basis sets. which indicates that at higher concentration inhibitor is strongly adsorbed on the metal surface. The copper specimen immersed in with and without inhibitor acid solution for 3 hours, are subjected to SEM analysis, which revealed the formation of protective film over the copper surface. The EDX and FT-IR analysis also supported the above result. 4 RESULTS AND DISCUSSION In the weight loss measurement, the corrosion rate of copper decreases sharply from 14.7 to 1.5 mm y -1 and the η increases 62 to 90 %, when the concentration of the inhibitor increases from 50 to 300 ppm. The maximum inhibition efficiency obtained at 300 ppm and with further increase in concentration there is no appreciable change in corrosion rate it is because metal surface is saturated in this concentration. The analysis of adsorption isotherm indicates the nature of the metal inhibitor interaction; the pregabalin is best fitted by Langmuir adsorption isotherm. Nyquist plot of copper in uninhibited and inhibited acidic solution containing various concentration of pregaplin are shown in Figure 1. Analysis of the impedance spectra containing a single capacitive semicircle and the standard Randle circuit is used to fit the impedance data. The Randle circuit composed of solution resistance (R s), charge transfer resistance (R ct) and capacitance (C dl) components. The results showed that the Rct increases from 11 to 126 Ω cm 2, when increasing the concentration of inhibitor. R ct is inversely proportional to C dl and directly proportional to η. The maximum inhibition efficiency is obtained at 300 ppm (91 %). This indicated that pregabalin inhibit the corrosion rate of copper by adsorption mechanism. The electrochemical parameters such as current density (I corr), corrosion potential (E corr), anodic (β a) and cathodic (β c) slopes are derived from Tafel polarization measurements. The Tafel slopes do not orderly displace either cathodic or anodic direction with increasing the inhibitor concentration; these features indicate that pregabalin has effect on both hydrogen evolution and iron dissolution mechanism (mixed type inhibitor). The E corr displayed small variation in blank and 50 ppm inhibited solution 27.6 mv vs SCE and this confirms that studied inhibitor acts as mixed type. The inhibition efficiency value increases with increasing concentration of inhibitor and I corr value decreases in the range of 0.53 to 0.04 ma, Figure 1. Nyquist plot Quantum chemical calculation is used to gain more information about the inhibition mechanism, Quantum chemical calculations are performed by using DFT method and calculation was carried out with the help of optimized structure. The E HOMO and E LUMO is often associated with the electron donating ability and electron accepting ability of a molecule respectively. The smaller value of ΔE and higher value of dipole moment is responsible for the enhancement of inhibition efficiency ev for E HOMO value and -0.3 ev for E LUMO value, confirms donor acceptor interaction occurring on the metal surface and inhibitor molecule. 5 CONCLUSION Polarization measurement indicates that the studied inhibitor acts as a mixed type inhibitor. The adsorption of inhibitor on the copper surface obeys the Langmuir adsorption isotherm. Surface analysis and electrochemical measurements confirm that the mechanism of corrosion inhibition is occurring mainly through adsorption process. The experimental results obtained are in good agreement with the theoretical results. 6 REFERENCES [1] Koch G.H., Thompson N.G., Moghissi O., Payer J.H. and Varney J. (2016), Report No. OAPUS310GKOCH (AP110272) (Houston, TX: NACE International). [2] Obi-Egbedi N.O., Essien K. E. and Obot I. B. (2011), Journal of Computational Methods in Molecular Design, Vol. 1, pp [3] Quraishi M.A. and Shukla S. Kumar, (2009), Poly (anilineformaldehyde): A new and effective corrosion inhibitor for mild steel in hydrochloric acid, Materials Chemistry and Physics, Vol. 113, pp
136 Microwave-Assisted Synthesis of Chitosan Schiff Base as Green Corrosion Inhibitor for Mild Steel in Acid Chloride Medium: Electrochemical, SEM and DFT Studies Jiyaul Haque, Vandana Srivastava, and M A Quraishi* 1 Department of Chemistry, IIT (BHU) Varanasi. *jiyaul55555@gmail.com Abstract Microwave-Assisted synthesis of Chitosan Schiff (CSB)) base has been achieved within 15 minutes in good yield and its corrosion inhibition performance was studied by the electrochemical impedance spectroscopy (EIS) potentiodynamic polarization (PDP) and chemical, spectroscopic methods. The results show that CSB acts as an effective corrosion inhibitor for mild steel in 1M HCl solution. The electrochemical results revealed that the CSB inhibitor is a mixed types inhibitor and exhibit the maximum inhibition of % at a very low concentration of 50 ppm. The inhibitor-adsorption film on the mild steel was confirmed by the scanning electron microscope (SEM) FTIR spectroscopy. Quantum chemical calculations (DFT based) studies further corroborated adsorption and inhibition action of CSB on the steel surface. The synthesized inhibitor can be used as Corrosion inhibitor during industrial acid pickling process Keywords - Mild Steel, Corrosion inhibition, EIS, Quantum chemical calculation, CSB. 1 INTRODUCTION Mild steel has a good tensile strength, malleability and ductility However it has poor resistance to corrosion attacks, especially in acidic media which limits its application in industries. To overcome this problem several additives were added to the acid solution which retards the metal dissolution known as corrosion inhibitor. Chitosan, which is the N-deacetylated product of chitin, It is a natural biopolymer and an attractive material because of its properties such as immunological activity, biocompatibility, low toxicity, and biodegradability [1-2]. Chitosan has been reported as inhibitor against aqueous corrosion due to its hydroxyl and amino groups. Chitosan and its several derivatives are reported as a green inhibitor. But, these are effective at very high concentration [3-4]. The free amino groups of chitosan offer the possibilities of chemical modification in the polymeric chain via Schiff base formation. Schiff bases of chitosan have improved properties for their prospective applications. As far as ecological factors are considered, it would be beneficial to use an environmentally friendly compound for modification of the polymer matrix. In the present work, In the present work, we report microwave-assisted synthesis of Schiff bases of chitosan with benzaldehyde. The synthesized derivative was characterized with FTIR and NMR studies followed by corrosion testing. The results of electrochemical measurements, surface analysis and theoretical calculations are reported in the present work. 2 RESEARCH SIGNIFICANCE In literature, several corrosion inhibitors are reported but these inhibitors are effective at very high concentration and/or causes the adverse effect on the human being as well on the environment. To overcome, this problem, we have synthesized a chitosan Schiff base by green technique (Microwave), Chitosan is a green inhibitor which is effectively inhibits the mild steel dissolution in 1M HCl solution at very low concentration. 3 MATERIALS AND METHODS The corrosion tests were performed on the mild steel having weight percentage composition (wt %) of C; %, Si; %, Mn; 0.556%, P; %, S; % and balance Fe ( %). The mild steel cut in an ASTM standard dimension for electrochemical and surface studies.the test solution of 1M HCl was prepared by dilution of analytical grade hydrochloric acid (HCl. 37% Fisher Scientific) with double distilled water ppm solution of CSB was selected for the corrosion inhibition study of mild steel. The tests were carried out in non-aerated and unstirred solution at 303 ± 2K. 3.1 Structure of investigated inhibitors delete Figure 3. Structure of chitosan Schiff base (CSB). 101

![Quantum chemical calculation of studied CSB compounds is performed by Materials Studio software package (version 6.0) [5] at DFT/GGA level using BOP functional and DNP basis set on all atoms.](/docs-images/78/76861956/images/137-2.jpg "4 RESULTS AND DISCUSSION 4.1 Electrochemical Study The Nyquist plot of mild steel showed that in the presence of inhibitor the dimeter of semicircle loops is increased as compare to blank one (Fig.2).")
137 3.2 Methods The EIS and PDP experiments were performed by using the Gamry Potentiostat/Galvanostat (Model G-300) software for experimental was by reported earlier methods. FTIR study was done by using the Perkin Elmer Version instrument and SEM/EDX by using Ziess Evo 50 XVP instrument model. Quantum chemical calculation of studied CSB compounds is performed by Materials Studio software package (version 6.0) [5] at DFT/GGA level using BOP functional and DNP basis set on all atoms. 4 RESULTS AND DISCUSSION 4.1 Electrochemical Study The Nyquist plot of mild steel showed that in the presence of inhibitor the dimeter of semicircle loops is increased as compare to blank one (Fig.2). Figure 3. (a) SEM images and (IR spectra). Table 1. Comparison of DFT results Parameters E HOMO (ev) Inhibitors E LUMO (ev) E (ev) η (ev) σ (ev) χ (ev) N110 CSB Cmch-but [a] [a] Carboxymethyl chitosan Butyraldehyde Figure 2. (a) Nyquist and (b) Tafel plots. The represent circuit used to analyzed the impedance data Fig (2a). The inhibition efficiency (IE) was calculated from the polarization resistance (R p) by the following equation; Rct R i 0 L Rp, Rp Rp IE(%) 100 (Eq. 1) i Rct RL Rp From the results, it is find that CSB showed the maximum IE 84.8 % at 50 ppm. The Tafel plots showed that in the presence of inhibitor the corrosion current density decreased more significantly cathodic plots than anodic with respect to blank, revealed that CBS suppressed the cathodic reaction more dominantly. 4.2 Surface study (SEM and IR spectra) The SEM image of inhibited MS showed less number of pits and cracks as compare blank (Fig. 3a). The IR spectra of MS-CSB shows all the peaks of CSB and MS, which are slightly shifted, indicated that the CSB is adsorbed on mild steel surface (Fig. 3b). 4.3 Quantum chemical study The DFT results of CBS is compared with a carboxymethyl chitosan Schiff base [4], which is further confirmed that CSB as an effective inhibitor for mild steel. 5 CONCLUSION The electrochemical, SEM and DFT studies suggest that CSB acts as a good corrosion inhibitor for mild steel in 1M HCl. PDP results showed that CSB acts as a predominantly cathodic inhibitor. SEM and IR analyses supported the formation of inhibitor film at metal/solution interface. 6 ACKNOWLEDGEMENTS Haque thankfully acknowledge the Ministry of Human Resource Development (MHRD) and central instrumental facility center (CIFC) IIT (BHU) Varanasi for providing financial and instrumental support, respectively. 7 REFERENCES [1] Solomon M.M., Gerengi H., Kaya T., & Umoren S.A. (2017). 104, [2] Liu, X., Xia, W., Jiang, Q., Yu, P. and Yue, L. (2018), Carbohydrate polymers, 182, [3] Hefni, H.H., Azzam, E.M., Badr, E.A., Hussein, M. and Tawfik, S.M. (2016), International journal of biological macromolecules, 83, pp [4] Alsabagh, A. M., Elsabee, M. Z., Moustafa, Y. M., Elfky, A., & Morsi, R. E. (2014Egyptian Journal of Petroleum, 23(4), [5] Materials Studio, Revision 6.0, Accelrys Inc., San Diego, USA,
138 Characterization of Thin Films Formed by Plasma Electrolytic Oxidation on Zircaloy-2 Sinu Chandran, H. Subramanian, Veena Subramanian, S. Rangarajan *, and S. Velmurugan Water and Steam Chemistry Division, BARC Facilities, Kalpakkam, Tamil Nadu , INDIA Abstract Corrosion and activity build-up on out of core surfaces (especially carbon steel) of water cooled nuclear reactors can be controlled by the addition of metal ions like Mg 2+ to the coolant. It is of importance to know the effect of added Mg 2+ ions on other heat transfer surfaces like zircaloy-2, the fuel clad material. Plasma Electrolytic Oxidation (PEO) technique was used to form films, that mimic the oxide formed on zircaloy-2 under hydrothermal conditions, on a shorter timescale in deaerated borate buffer (ph- 9.8) at 25 C. The oxidized specimens thus obtained were characterized by SEM/EDX and electrochemical techniques. EDX suggested Mg incorporation in the oxide to the tune of ~ 0.18 wt.%. Electrochemical studies showed that film with Mg has higher polarization resistance proving the absence of any detrimental effects. Results were compared with those films formed through hydrothermal route to optimize PEO process parameters. Keywords PEO, Zircaloy, Magnesium, Impedance. 1 INTRODUCTION The deposition of activated corrosion products ( 60 Co, 58 Co etc.) on the out of core surfaces of the primary heat transport (PHT) system of PHWRs results in radiation field build up, which in turn causes undesirable exposure of maintenance personnel. Earlier studies indicated that magnesium ion modified water chemistry, Metal Ion Passivation (MIP), could significantly reduce the corrosion and corrosion release of carbon steel [1,2]. The added metal ions could also interact /modify the oxides on other heat transfer surfaces, like zircaloy-2 clad material and influence their corrosion behavior. As the Indian PHWRs use zircaloy-2 as clad material, the oxide modification on them by these inorganic additives is an important concern, if Mg modified water chemistry is implemented. In this study Plasma Electrolytic Oxidation (PEO) technique [3,4] was used to form oxide film that mimic the oxide formed on zircaloy-2 under hydrothermal conditions, but on a shorter timescale. The main objective of the present study was to explore the ability of PEO formed oxide in mimicking the oxide formed by Hydrothermal Conditioning (HC) route and understand the morphology/ protectiveness of the Mg modified oxide film on zircaloy-2 surface. 2 RESEARCH SIGNIFICANCE Any improvisation of water chemistry regime in nuclear reactors should ensure corrosion compatibility with structural materials. Further, the PEO method provides an avenue to study the effect of modified water chemistry on structural materials on a shorter timescale avoiding need for prolonged tests in recirculating rigs/ autoclaves during the screening stages. 3 MATERIALS AND METHODS 3.1 PEO cell set- up Zircaloy-2 specimens for the studies were cut from a commercially available zircaloy-2 plate (Zr- 96.5%, Sn 1.5%, Ni 0.045%, Cr 0.15%, Fe 0.2%). The specimens were polished up to 1200 grit, washed/rinsed with ultrapure water/acetone. This was used as anode and a cylindrical SS plate as cathode in an electrolytic cell setup. De-aerated borate buffer medium (ph: 9.8) was used as the electrolyte in the presence and absence of 1 ppm Mg +2 ions. Two different DC voltages, viz; 80 V and 200 V were continuously applied for ~ 2 hours using a constant DC voltage source (Biometra standard power pack P 25) in separate experiments. After the formation of oxides, the specimens were immediately removed from the electrolyte, rinsed with ultra-pure water and dried. 3.2 Thin film characterization Thin films thus obtained were further characterized by SEM/EDX (CamScan 3200 &Inca Penta FETX3 (MODEL-7537), Oxford Instruments-England) and electrochemical impedance techniques (Potentiostat/galvanostat instrument, PGSTAT-30with Frequency Response Analyser (FRA), Autolab). A three electrode configuration was used with platinum foil as CE and a saturated calomel electrode (connected through a luggin capillary) as the RE. The oxidized zircaloy-2 surface was the WE. De-aerated borate buffer medium with a ph of 9.8 was used as the electrolyte. A 10 mv (rms) sine wave signal with a frequency range from 10 KHz to 5 mhz was used to record the impedance response. 103

![SEM micrographs [Figure 1(b)] did not show any change in morphology for Mg incorporated oxide for both the potentials studied. But EDX results indicated an incorporation of 0.04 0.](/docs-images/78/76861956/images/139-1.jpg "18 wt % Mg in the oxide. (a) (b) 60.0M 40.0M -Z\"/ 20.0M 0.0 PEO (80 V) PEO (80V) + 1ppm Mg HC HC + 1ppm Mg 0.0 20.0M 40.0M 60.0M Z'/ 2 h 960 h Figure.")
139 4 RESULTS AND DISCUSSION 4.1 Surface characterisation studies Figure 1 (a) shows the image of thin films formed at different applied DC voltages. It can be seen that the change in applied potential resulted in the color variation of the film which may be due to the change in oxide thickness. SEM micrographs [Figure 1(b)] did not show any change in morphology for Mg incorporated oxide for both the potentials studied. But EDX results indicated an incorporation of wt % Mg in the oxide. (a) (b) 60.0M 40.0M -Z"/ 20.0M 0.0 PEO (80 V) PEO (80V) + 1ppm Mg HC HC + 1ppm Mg M 40.0M 60.0M Z'/ 2 h 960 h Figure.2 Comparison between electrochemical impedance response of PEO coatings and HC coatings 80 V Without Mg 80 V With 1 ppm Mg 200V Without Mg 200 V With 1ppm Mg 20µm 5 CONCLUSION The corrosion resistance of the film formed by PEO method is comparable (same order of magnitude ) to the one by hydrothermal route. Mg incorporation was found to increase the resistance of the oxide on Zircaloy-2 indicating the presence of a more protective oxide film. Figure.1 (a) Thin films formed at different DC voltages, (b) SEM micrograph of thin film formed at 80 V 4.2 Electrochemcial characterization Figure 2 shows the comparison between impedance response of PEO coatings and HC coatings. The Impedance spectra obtained in both the cases were fitted to R 1 (Q 1[R 2(R 3Q 2)])-, a porous model equivalent circuit. From the impedance parameters, it was inferred that the surface film could be a double layered oxide film with an inner layer covered with a porous outer layer. R 3 represents the inner oxide resistance and R 2, the pore resistance. The inner oxide resistance values are listed in Table 1. The Mg modified oxides showed higher oxide resistance (R oxide) both in the case of HC coatings obtained in earlier experiments [6] and PEO coatings. The comparable results indicate that PEO method can be effectively used to assess the efficacy of modified water chemistry regimes on structural materials of nuclear reactors. Table 1.Film resistance values evaluated from impedance spectra for various oxides Specimen HC Coating (without Mg) 155 HC coating ( with Mg) 289 PEO- 80V (without Mg) 64 PEO-80V (with Mg) 130 PEO -200V (without Mg) 92 PEO- 200V (with Mg) 128 R oxide(mω) 6 ACKNOWLEDGEMENTS The authors are thankful to Mrs. N Sreevidya (Material Technology Division, Indira Gandhi Centre for Atomic Research, Kalpakkam Tamilnadu, INDIA) for her support in carrying out SEM/EDAX studies. 7 REFERENCES [1] Velmurugan S., Padma S., Narasimhan S.V., Mathur P.K. and Moorthy P.N., The passivation effects of magnesium ion on PHWR primary heat transfer system structural materials, J. Nucl. Sci. Technol. Vol. 33, (1996) pp [2] Subramanian H., Veena S., Chandramohan P., Srinivasan M.P., Rangarajan S., Narasimhan S.V and Velmurugan S., Role of magnesium ions in reducing high temperature aqueous corrosion of carbon steel, Corr. Sci. Vol. 70 (2013) pp [3] Apelfeld.A.V., Betsofen.S.Y., Borisov A.M., Vladimirov B.V, Savushkina.S.V and Knyazev.E.V., Stabilization of the high-temperature phases in ceramic coatings on zirconium alloy produced by plasma electrolytic oxidation, Journal of Physics: Conference Series748(2016) [4] Chen.Y., Matykina.E., Arrabal.R., Skeldon.P., Thompson.G.E., Plasma electrolytic oxidation and corrosion protection of Zircaloy-4, Surf. Coat. Technol., Vol.206 (2012) pp [5] Sinu Chandran, Subramanian.H., Chandramohan.P, Sreevidya.N, Puspalata Rajesh, Rangarajan S., and Velmurugan.S., Characterization of oxide films on Zircaloy -2 in high temperature aqueous solutions containing Magnesium ions,international Conference on Electrochemical Science and Technology 2014 (ICONEST 2014), August 7-9, 2014,IISc, Bengaluru, INDIA. 104
140 Chitosan: A Green Corrosion Inhibitor for Mild Steel in 1m Sulphamic Acid Prathamesh G. Joshi 1*, M. A. Quraishi 1, and V. Srivastava 1 1 Department of Chemistry, IIT (BHU) Varanasi *joshi.pganesh.chy14@itbhu.ac.in Abstract In the present investigation, we have studied the effect of chitosan, a natural polysaccharide on corrosion inhibition of mild steel in 1 M sulfamic acid medium. To improve the efficiency of chitosan and to reduce the cost, synergistic inhibition effect (synergism) is shown as an effective protocol. The study was performed using weight loss method, electrochemical measurements and surface morphology scanning electron microscopy techniques. The maximum efficiency of 74% at 200ppm concentration and in combination with 5 ppm KI efficiency above 90% was exhibited. The inhibitor obeyed Langmuir adsorption isotherm. Keywords - Mild steel, Chitosan, Sulphamic acid, synergism, Langmuir isotherm 1 INTRODUCTION Sulfamic acid is a strong cleaning agent and it can be used on mild steel and stainless steel with no problem of pitting or chloride-induced stress corrosion cracking. It has remarkable properties like it behaves as a strong acid in aqueous solution but its corrosivity is significantly lower in comparison to other acids such as sulfuric acid and hydrochloric acids. The aqueous solutions of sulfamic acid do not emit corrosive fumes but solubilize hard scales [1] and forms soluble compounds with most industrial deposits. Addition of a corrosion inhibitor to sulfamic acid solution is very important to keep the surface of metal intact and decrease its corrosivity during the cleaning and pickling process. Chitosan is a natural polymer extracted from shells of the crustaceans in sea food waste. Chitosan (CH) is produced at an estimated amount of one billion tons per year [2]. Structurally it is the N-deacetylated product of chitin, a polysaccharide, which is composed of b-d glucosamine. The anticorrosive behavior of Chitosan is attributed to the presence of amino and hydroxyl groups. inexpensive, non-toxic and environmentally friendly and biodegradable green corrosion inhibitors. 3 MATERIALS AND METHODS The Mild steel specimens with chemical composition (wt %): C = 0.076, Mn = 0.192, P = 0.012, Si = 0.026, Cr = 0.050, Al = and balance Fe. was used for chemical, electrochemical and surface analysis experiments. The specimen with size 2.5 cm 2 cm cm and 8 cm 1 cm cm was used for weight loss and electrochemical experiments, respectively. The corrodent was 1 M sulfamic acid solution prepared from analytical grade sulfamic acid (Sigma Aldrich) with double distilled water. 3.1 Gravimetric Experiment The weight loss experiments were performed using the standard method described earlier. 3.2 Electrochemical Experiment The electrochemical impedance measurements (EIS) were performed on mild steel specimens in the frequency range of 100 khz to khz under potentio-static conditions using an AC at open circuit potential with amplitude of 10 mv peak to peak. The charge transfer resistance was calculated from Nyquist plot from which corrosion inhibition efficiency was calculated. 3.3 SEM /EDX study The mild steel was immersed in 1M sulfamic solution in absence and presence of 200ppm of the CH alone and in combination of 5ppm of KI for 3h immersion time. Thereafter, the mild steel specimens were taken out, washed with double distilled water, dried and finally analyzed by Scanning Electron Microscopy. The SEM study was carried out using a Ziess Evo 50 XVP instrument.at an accelerating voltage of 5 kv and 500 magnification. 2 RESEARCH SIGNIFICANCE According to the literature reviews [3,4] there have been reported few corrosion inhibitors for mild steel in sulfamic acid medium mostly as non-biodegradable and toxic in nature, which limited their use for industrial applications [5]. In view of increasing environmental awareness corrosion scientists are focusing on developing 4 RESULTS AND DISCUSSION 4.1 Gravimetric Experiment C C R R(i) % 100 C R Eq (1) 105
 between CH and KI. The high values of E a suggest that the inhibitor retards the corrosion process through formation of a protective surface on metal at metal - solution interface.")


141 Eq(2) C R is the corrosion rate and θ is the fractional I.E. CH alone gives 74% I.E. at 200 ppm. In combination with KI (5 ppm) it gives above 90% I.E. thereby showing existence of positive synergism (S.F. = 2.26) between CH and KI. The high values of E a suggest that the inhibitor retards the corrosion process through formation of a protective surface on metal at metal - solution interface. Inhibitor Rct (Ωcm 2 ) I.E.(%) Blank CS CS+KI The EIS studies reveal that combination of chitosan and KI act as good corrosion inhibitor. 4.3 SEM /EDX study The inhibited metal surface is smoother than that without the inhibitor due to adsorption of inhibitor on it. Figure 1: I.E. v/s Inhibitor Concentration Table 1: Temperature variation of I.E. Temperature Inhibition Efficiency (η) (%) (K) Blank CH CH + 5ppm KI Ea (kj mol -1 ) The inhibitor adsorption was best fitted by the Langmuir adsorption isotherm equation. Figure 4: SEM analysis of metal surface (a) W/o inhibitor, (b) CH alone, (c) CH + 5ppm KI 5 CONCLUSION Chitosan acts as a good corrosion inhibitor for mild steel in Sulphamic acid. Chitosan alone gives inhibition efficiency of 74% at 200ppm concentration and in combination with 5 ppm KI it exhibits I.E. above 90%. The value of activation energy indicates that chitosan inhibits mild steel corrosion by increasing the energy barrier for corrosion process. The EIS studies reveal that addition of chitosan inhibits the corrosion by adsorption on metal surface thereby increasing the resistance on the metal surface. Chitosan inhibits the corrosion by adsorbing on the metal surface and follows the Langmuir Adsorption Isotherm. The SEM studies confirm the formation of a film of inhibitor on metal surface at the metal - solution interface. 6 ACKNOWLEDGEMENTS Figure 2: Langmuir isotherm fit for inhibitor adsorption 4.2 Electrochemical Experiment Figure 3: EIS plot of CH and KI in sulphamic acid Table 2: EIS efficiency of CH and KI in sulphamic acid I wish to thank CORSYM 2018 and Department of Chemistry, IIT (BHU) Varanasi for providing me this opportunity. 7 REFERENCES [1] M.S. Morad Journal of Applied Electrochemistry 38 (2008) [2] M.H.M. Hussein, M.F. El-Hady, H.A.H. Shehata, M.A. Hegazy, H.H.H. Hefni, Journal of Surfactants and Detergents 16 (2013) [3] M. Motamedi, A.R. Tehrani-Bagha, M. Mahdavian, Electrochimica Acta 58 (2011) [4] S.S.A. Rehim, H.T.M. Abdel-Fatah, H.E.E. El-Sehiety, Arabian Journal of Chemistry 9 (2016) S388-S
142 CORROSION IN CONCRETE STRUCTURES 5 th CORSYM, Chennai, India, March 2018
143
144 Electrochemical Response and Service Life Estimation of Reinforced Concrete Structures with Fusion-Bonded-Epoxy-Coated Rebars Deepak Kamde and Radhakrishna G. Pillai * IIT Madras, Chennai, India *pillai@iitm.ac.in Abstract Corrosion of Reinforcement is one of the most common deterioration mechanism for Reinforced Concrete structures. Use of coated rebar (especially, Fusion Bonded Epoxy coated (FBEC)) is one of the most commonly adopted technique to delay the corrosion initiation process. However, Poor handling of FBEC rebars (coating damages at site) will result is premature corrosion. To assess the effect of poor handling of FBEC rebars, following macrocell specimens were cast and monitored for one-year i) FBEC (as received), ii) FBEC with damages), iii) FBEC - repaired coating-without fusion bonding, and iv) Uncoated steel. Electrochemical responses using EIS (Electrochemical Impedance Spectroscopy) technique were monitored for a period of 1 year. Also, Total corrosion was calculated as per the guidelines given in ASTM G109. Premature corrosion was observed in case of FBEC - D and FBEC DR specimens. However, it was not reflected in the total corrosion calculation. EIS technique can be used as a reliable technique to assess FBEC specimens. Apparent chloride threshold was found significantly low for FBEC - D specimens. Therefore, Corrosion initiation time was reduced significantly. Keywords Fusion Bonded Epoxy Coated rebar, Corrosion, Chloride. 1 INTRODUCTION The use of Fusion Bonded Epoxy Coated (FBEC) rebars has always been questionable. However, FBEC is the most widely used coated rebars in past two decades. There are of a few bad field experiences with the performance of FBEC including Norwegian coastline bridges (premature corrosion in less than 25 years), Five bridges in Florida experienced severe corrosion problem because rebars were exposed to open chloride-rich atmosphere for more than one year before using it in construction. In India, Similar poor site practices are common. The damaged FBEC rebars cannot provide a full physical barrier to ingress of deleterious matters. Corrosion can initiate in presence of entrapped moisture in the damage and in presence of oxygen. Enrique Vaca C. (1998) reported that the damage of coating can cause crevice or under-film corrosion [1]. On the other hand, Pincheira et. al (2015) report that the defects in FBEC rebar do not influence the corrosion performance of these rebars [4]. Also, IS (2015) allows the mechanical damage of 2 % to the FBEC coating. However, field experiences showed the poor performance of Damaged FBEC coated rebars and therefore added very less or no additional service life to the structures [5] Due to highly dielectric medium, it is challenging to assess the performance of coated rebars using ASTM G 109 method, which is not suggested for testing coated rebars. However, attempts have been made to assess the performance of FBEC steel rebars using the macrocell corrosion and/or half-cell potential [3,4] which may not always be reliable for assessing coated rebars. 2 RESEARCH SIGNIFICANCE Use of FBEC rebars with poor construction practices can result in premature corrosion. The expected service life can reduce significantly. If similar practice continues we will have a large number of structures for repair in near future. Therefore, service life estimation of such structure is needed for industries to be prepared with the repair strategies for the structures with coated rebars. 3 EXPERIMENTAL PROGRAM To assess the effect of damage due to poor site practices, five Macrocell specimens of following type were cast and monitored for one year 1) FBEC (as received), 2) FBEC Damaged (FBEC D), 3) FBEC Repair to damage ((FBEC DR), and 4) Uncoated. 4 MACROCELL SPECIMEN Macrocell specimen similar to ASTM G109 were cast and monitored for approximately one year. The top rebar acts as the anode and the bottom rebars acts as cathode. Anode to Cathode ratio in both cases was maintained as 1:2. Five specimens each type was cast and tested to get electrochemical response and total corrosion as per ASTM G
145 Z'' EIS_ST6_W9.z th CORSYM, Chennai, India, March RESULTS AND DISCUSSION Figure 1 shows the total corrosion calculation and electrochemical response of FBEC, FBEC D and FBEC - DR specimens. The total corrosion for FBEC and FBEC D specimens shows the similar performance. However, when specimen FBEC D5 was autopsied after 100 days of exposure, corrosion initiation was observed (See Figure 1 (a)). Corrosion mechanisms involved in these rebars are presented in [6]. Nyquist plot for FBEC- D (at 150 days) represent the significant under-film Total corrosion (coulombs) FBEC 1 FBEC 2 FBEC 3 FBEC 4 FBEC 5 Cathode No corrosion D - 1 D - 2 D - 3 D - 4 D - 5 Current lines Anode Corrosion DR - 1 DR - 2 DR - 3 DR - 4 DR Exposure period (days) (a) Cathode No corrosion Z // (K Ohm) Z'' FBEC corrosion (See Figure 1 (b) inset). Also, Total corrosion values of FBEC DR specimens show the initiation of corrosion process after 250 days of exposure. However, Nyquist plot at 150 days shows the under-film corrosion (See Figure 1 (c)). Therefore, ASTM G109 should not be used to evaluate the performance of FBEC rebars. Chloride concentration at rebar level was found to be 0.25% and 0.4% by weight of cement for damaged FBEC and uncoated specimens. Therefore, service life was found 35% less than the uncoated steel (see Figure 2). FBEC - D Figure 1 (a) Total Corrosion calculation and electrochemical response for b) FBEC & FBEC D, and (c) FBEC - DR Z // (K Ohm) EIS_S5.2.z EIS_ST6_W9.z FBEC - D Z' Z / (K Ohm) Z' Z / (K Ohm) (b) FBEC Anode Concrete Repair e- (c) EIS_S5.2.z FBEC Cathode Under-film corrosion FBEC - DR Uncoated (Clth = 0.4 %bwoc) FBEC - D (Clth = 0.22 %bwoc) Figure 2 Cumulative distribution function for corrosion initiation time of uncoated and FBEC - D specimens 6 CONCLUSIONS 1. EIS technique can be used to evaluate the performance of FBEC coated rebars. 2. Corrosion cell on same steel was observed in case of specimens with damaged coating. Whereas, under-film corrosion was seen in FBEC -DR type specimen. 3. Chloride threshold of FBEC D and uncoated specimen was found to be 0.25% and 0.4% by weight of cement. Therefore, service life was expected to be 35% less than that of structures with uncoated rebar. 7 ACKNOWLEDGEMENTS (a) Girder D cl (m 2 /s) = LN ( , ) C max (% bwoc) = LN (5.3, 0.03) d (mm) = LN (50,4) m = LN (0.38, 0.05) The authors acknowledge the support from Department of Science & Technology and BTCM Division, Department of Civil Engineering, Indian Institute of Technology Madras, Chennai, India to carry out this research. 8 REFERENCES [1]. Enrique Vaca C. (1998). Corrosion Performance of Epoxy-Coated Reinforcement in Aggressive Environments. Ph.D. Thesis, University of Texas At Austin, (May). [2]. Indian Standard 13620: 1993 (Reaffirmed In 2015). (2015). Fusion Bonded Epoxy Coated Reinforcing Bars- Specification. Bureau of Indian Standards, 1993(February 1993). [3]. Keßler, S., Zintel, M., And Gehlen, C. (2015). Defects in Epoxy-Coated Reinforcement and Their Impact on The Service Life - A Study of Critical Chloride Content and Macro-Cell Corrosion. Structural Concrete, (3), [4]. Pincheira, J. A., Aramayo, A., Fratta, D., And Kim, K.-S. (2015), Journal of Performance of Constructed Facilities, 29(4), [5]. Weyers, R. E., Ryan, M., Mokarem, D. W., Jerzy Zemajtis, Michael M. Sprinkel, And John G. Dillard. (2000). Environmental Engineering, (Final Report). [6]. Kamde, D., Pillai, R. G., (2017), Comparison of Corrosion of Damaged Fusion Bonded Epoxy Coated (FBEC) And Uncoated Rebars, ICSCMS, RILEM, Chennai, India. 108
146 The Inhibition Effect of Several Inhibitors on Rebar in Saturated Calcium Hydroxide with Reduced Alkalinity Rahul Khurana, Ashish Kumar Tiwari * and Shweta Goyal Department of Civil Engineering, Thapar Institute of Engineering and Technology *ashish.tiwari@thapar.edu Abstract Corrosion of reinforcing steel in RC structure forms a huge problem worldwide as it increases the cost of maintenance and affects the serviceability of structure. A possible remedy for this problem is the application of corrosion inhibitors. The corrosion inhibition effect of various dicarboxylic acid based compounds in simulated concrete pore solution with reduced alkalinity was investigated using linear polarization measurement and half-cell potential measurement at different immersion time and different chemical concentration. The test results indicate that both the type of chemicals and their concentration influences effectiveness of corrosion inhibitors. At higher concentration (i.e. at 1%), none of the chemical proved to be effective due to increase in acidity of solutions. From the tested concentration, 0.5% was found to be optimum concentration level for most of the chemicals. Some chemicals shows inhibiting action from early stage, while some of the chemicals shows inhibition action at the later stage of immersion. Keywords-Corrosion, Carbonation induced corrosion, Concrete pore solution, Inhibitors. 1 INTRODUCTION Reinforced concrete is most widely used construction material but its durability issues still exist. Apart from structural design failures, the most significant cause of deterioration and premature failure of RC structure is the corrosion of steel reinforcement. Corrosion of steel reinforcement is generally restricted in an alkaline environment within concrete (ph 13-14) with a chemically stable thin oxide film protecting the steel surface from contact with oxygen and moisture. However, corrosion initiation takes place either when sufficient chloride ions have reached the rebar level or when ph of concrete pore solution drops below 9 due to carbonation. The failure of structures due to corrosion does not necessarily result in total structural collapse but in most of the cases, it is demonstrated by loss of structural serviceability, due to cracking and delamination of concrete [2]. It is estimated that the cost of corrosion related maintenance and repairs for concrete infrastructure in the world is around $100 billion per year [1]. The cost of corrosion in India is estimated to be around $8 billion as published in financial express. [5] 2 RESEARCH SIGNIFICANCE. There are plenty of corrosion inhibitors available commercially. Most of the commercially available corrosion inhibitors are used for chloride induced corrosion being very expansive affects to the total cost of structure. Increasing in pollution will cause raise in carbon concentration within the environment in future thus effectiveness is required to be judged in carbonated environment. Also, the concentration of inhibitor is an important parameter to study because it can play an important role in the inhibition of corrosion [4] and overall economy is affected. 3 MATERIALS AND METHODS Material used in the experimental procedure were HYSD bar, epoxy, chemical compound for preparing pore solution and chemical compounds to be used as corrosion inhibitor. Steel specimens were Fe 500 HYSD steel bar of 12 mm diameter and 60 mm length were used (nominal composition C=0.3%, S=0.055%, P=0.055%, N ppm=120%). 3.1 Simulated concrete pore solution To simulate environment of concrete, a saturated solution of calcium hydroxide was prepared (1g in 1 liter distilled water). The solution was allowed to stand for 24 hours and the precipitates were removed by using a filter paper. Further carbonate front was simulated by bubbling CO 2, in order to reduce the ph of solution to nearly Inhibitors Chemicals used are the organic compounds and derivatives of dicarboxylic acid. Carboxylic acids have polar groups and can act as a proton donor. They form carboxylate anions, which were able to absorb on the steel surface. These chemical compounds were: Tartaric acid, Maleic acid and Adipic acid. Chemicals were added at different concentrations (0.25%, 0.5% and 1% by wt.) to study the effect of dosage rate and corrosion 109


147 monitoring of steel bars was performed at 1, 24, 48, 120 and 240 hours of immersion by linear polarization resistance (LPR) and half-cell potential measurements. Detail of solution used for experiment is listed in Table 1. Table 1. Detail of solution used for experiment S. No. Abbreviation Detail of Solution 1 Sol CH Saturated calcium hydroxide solution 2 Sol Carb Carbonated calcium hydroxide solution 3 Sol TA Tartaric acid 4 Sol MA Maleic acid 5 Sol AA Adipic acid 4 RESULTS AND DISCUSSION Long term LPR technique performed on ACM field machine was used to record I corr at various immersion times. Variation of I corr with respect to immersion time for all the solutions at different concentration is shown in Figure 1-3. Presence of two or more relatively closed carboxylate group improves inhibitive properties [3]. This is the reason solution with tartric acid performs better than other chemicals at 0.25% and 0.50% concentration at all immersion ages. While Sol MA and Sol AA do not perform well in the initial time of immersion, but reduced corrosion current density were observed at the later stage. Figure1. Variation of I corr w.r.t immersion time for all solutions at 0.25% concentration Figure2. Variation of I corr w.r.t immersion time for all solutions at 0.50% concentration At a higher concentration (i.e. at 1.0%) increasing trend is observed in I corr values for all solution throughout the immersion period. Figure 3. Variation of I corr w.r.t immersion time for all solutions at 1.0% concentration 5 CONCLUSION The present research investigated the inhibition of several dicarboxylic acid based chemicals against corrosion of steel. Based on the obtained data and its analysis, it can be concluded that, tartaric acid is very effective in corrosion inhibition of steel bar when added in 0.25% and 0.5% concentration, while maleic acid shows its effectiveness at the later stage of experiment with the same concentration. Adipic acid with 0.5% addition provides satisfactory inhibition to corrosion but unsatisfactory results were obtained in low concentration (i.e. 0.25%). This may be due to molecular structure and less inductive effect (inductive effect changes with electro-negitivity of the groups and raise of carbon chain length) [3] and resonance effect of adipic acid at low concentration. Also the inhibition effects of these chemicals were tested at higher concentration but none of the chemical is effective in such a higher concentration due to increase in the acidity of solution. 6 REFERENCES [1] Li, C.-Q., Zheng, J. J., Lawanwisut, W., & Melchers, R. E. (2007). Concrete delamination caused by steel reinforcement corrosion. Journal of Materials in Civil Engineering, 19(7), [2] Montemor, M. F., Simões, A. M. P., & Ferreira, M. G. S. (2003). Chloride-induced corrosion on reinforcing steel: From the fundamentals to the monitoring techniques. Cement and Concrete Composites, 25(4 5 SPEC), [3] Osial, M. (2016). Organic substances as corrosion inhibitors for steel in concrete an overview. Journal of building chemistry, [4] Verbruggen, H., Terryn, H., & De Graeve, I. (2016). Inhibitor evaluation in different simulated concrete pore solution for the protection of steel rebars. Construction and Building Materials, 124, [5] 110
148 Corrosion properties of high-performance fly ash lightweight aggregate concrete Manu S Nadesan 1* and Dinakar Pasla Indian Institute of Technology Bhubaneswar, India *msn10@iitbbs.ac.in Abstract Concrete industry consumes natural resources in a massive manner. As the demand for concrete is growing, one of the effective ways to minimize the harmful effect of concrete is to improve its structural efficiency and durability performance. In the present study, the possibility of making high performance structural lightweight aggregate concrete using sintered flyash aggregate was investigated. The study also comprises the influence of silica fume and metakaolin on the performance of the lightweight aggregate concrete. The hardened properties, such as compressive strength, surface resistivity, and corrosion rate were investigated. All the developed concretes attain the strength required for high strength concrete. The study reveals that due to the addition of metakaolin and silica fume significant improvement can be observed in the surface resistivity and corrosion resistance of the investigated concretes. It was also noticed that the mechanical and corrosion properties enhanced with age of curing. Keywords - Durability, High strength concrete, Lightweight aggregate concrete, Corrosion. 1 INTRODUCTION In offshore floating structures, great efficiencies are achieved by the adoption of lightweight materials. A reduction of 25% in weight of reinforced concrete will result in a 50% reduction in load when it is under submerged condition [1]. This indicates that the use of high strength lightweight aggregate concrete provides prodigious benefit in the construction of offshore structures. Earlier research in the development of high strength lightweight concrete facilitated lightweight concrete to be used for unique applications where high strength and high durability are desired [2]. Though some standards provide certain guidelines towards the structural application of lightweight aggregate concrete (LWAC), most of the mechanical and durability characteristics are poorly categorized [3]. In this study metakaolin and silica fume were replaced at 10% and 15% by weight of the ordinary portland cement to investigate the relative effectiveness of metakaolin and silica fume on the development and performance of the concretes. 2 RESEARCH SIGNIFICANCE The present investigation is an attempt to assess the performance of high strength lightweight concrete using sintered fly ash aggregate and also to investigate the impact of metakaolin and silica fume on the strength and corrosion properties of the developed concretes. This study will envisage the potential use of sintered flyash aggregate on the development of high-performance concretes for the aggressive environment. 3 MATERIALS AND METHODS Ordinary Portland cement (53 grade) confirming to IS: [4] was used as the primary binding material. Metakaolin and silica fume were used as supplementary cementitious materials (SCMs). Well graded river sand having specific gravity 2.65 was used as fine aggregate. Three different size fractions of sintered fly ash aggregates were used as coarse aggregates. The adopted size fractions 2-4, 4-8 and 8-12 mm possess specific gravities 1.41, 1.42 and 1.44, respectively. The water absorbed during mixing was compensate by adding extra water. Commercially available polycarboxylate ether based super plasticizer is employed to achieve the desired workability. The mix proportion adopted in the present experimental investigation is mentioned in Table 1. The w/b ratio is fixed as 0.25 for all the mixes. Also the dosage of the super plasticizer was determined for 100 mm slump from the trial mixes. The experimental program was formulated in such a way that the corrosion properties such as surface resistivity assessed using Wenner four-probe technique and the corrosion rate was monitored using potentiodynamic polarization technique. Table 1. Mix proportions adopted in the present study Mix ID SCM (%) Cement (kg/m 3 ) Fine aggregate (kg/m 3 ) C M M S S Coarse Aggregate (kg/m 3 ) 111


149 4 RESULTS AND DISCUSSION 4.1 Compressive strength From the strength results it is observed that metakaolin replacements shows a strength increment of 6 and 12 % at the age of 28 and 90 days, whereas silica fume replacements exhibits 13 and 16 % strength improvements at 28 and 90 days, respectively. More precisely addition of silica fume exhibited enhanced strength results over metakaolin. Moreover from Fig. 1 it can be noticed that 10 % replacement level is the optimum in case of silica fume whereas 15% replacement level performs superior in case of metakaolin concretes. 4.3 Corrosion rate From the results, it is clear that the corrosion process stabilized after a long duration only. The trends indicate that the minimum period required to assess the corrosion rate embedded in concrete through electrochemical method may be around one year. The addition of metakaolin and silica fume further reduces the corrosion rate significantly even in the initial ages, and the difference with the control mix is converged at later ages. Figure 3. Corrosion rate of concretes 5 CONCLUSION Figure 1. Variation compressive strength with age 4.2 Surface resistivity The variation of surface resistivity values at different ages were depicted in Figure 2. From the resistivity results it is observed that metakaolin concretes exhibited similar or better performance than silica fume concretes; especially, concrete having 15% metakaolin replacement. Figure 2. Variation of surface resistivity with age From the experimental investigation it can be seen that lightweight aggregate concretes having strengths of80 MPa can be realized. Surface resistivity results show that addition of both metakaolin and silica fume improves the resistivity significantly. Among this silica fume performs superior to metakaolin.the corrosion rate study of the developed concretes reveals that the addition of the SCMs into the concrete matrix facilitates good corrosion resistance even in the aggressive environment also. 6 REFERENCES [1] ACI Committee 213, Guide for Structural Lightweight Aggregate Concrete, American Concrete Institute (ACI 213R-03), Farmington Hills. Mich, [2] Hoff, G. C., 1992, High Strength Lightweight- Aggregate Concrete for Arctic Applications, Structural Lightweight Aggregate Concrete Performance, SP-136, T. A. Holm and A. M. Vaysburd, eds., American Concrete Institute, Farmington Hills, Mich., pp [3] FIB Bulletin 8. Lightweight aggregate concrete: Part1, 2, 3, CEB/FIP 8.1, Lausanne, [4] IS: (1987). Indian Standard: Specification for 53 grade ordinary Portland cement. New Delhi: Bureau of Indian Standards. 112
150 Effect of corrosion inhibitor on corrosion rate of Quenched and Self-Tempered (QST) steel embedded in mortar exposed to chlorides Sharmila P 1*, Rajesh Kannan P 2, Jayachandran Karuppanasamy 2 and Muthupandi V 2 1 Kongu Engineering College, Perundurai, Erode, Tamil Nadu 2 National Institute of Technology, Tiruchirappalli, Tamil Nadu *psharmilashara@gmail.com Abstract: The use of calcium nitrite (CN) based corrosion inhibitors to enhance the corrosion resistance of reinforcement which is exposed to wetdry cycle needs a very detailed investigation. In this present study, the effect of CN based corrosion inhibitor on corrosion rate (CR) of Quenched and Self-Tempered steel (100 mm long, 16 mm diameter) is embedded in 30 mm thick cylindrical mortar (OPC cement: Sand: w/c as 1:3:0.45) specimen is studied. Five specimens each with (i) no corrosion inhibitor, (ii) CN based corrosion inhibitor with dosage of 7.5% by weight of cement exposed to chlorides. Linear Polarization Resistance (LPR) test conducted by applying the potential range from -15 mv to +15 mv Vs OCP at the scan rate of 0.15 mv/s (with ir compensation) to estimate the CR. The QST steel with CN based corrosion inhibitors shows low CR than that of the specimens with no inhibitors in both wet and dry exposure conditions. Keywords corrosion rate, QST/TMT, LPR, calcium nitrite, corrosion inhibitors 1 INTRODUCTION Corrosion is widespread phenomena in construction and which affects the life of the structure throughout the world. The corrosion of the steel is initiated due to presence of oxygen and water [1]. It is resulting that reduction in the cross-section area of the steel bars by formation of the rust. In the real-life conditions, the corrosion of the steel in the concrete is unavoidable in the chloride containing environments. However, there is a chance to delay the corrosion initiation time by using corrosion inhibitors. This corrosion inhibitor caused to formation of the passive file over the steel reinforcement which acts as a protective layer and delays the corrosion initiation. In the present scenario, many types of inhibitors are available like sodium nitrite, potassium chromate, sodium benzoate, and calcium nitrite. Calcium nitrite (CN) is widely used as an inhibitor for its compatibility with concrete properties and its corrosion inhibition effect. Owing to the own merits, it is mostly used as a preferred inhibitor than the sodium nitrite, potassium chromate and sodium benzoate [2,3]. In the chloride contaminated mortar conditions, this CN based corrosion inhibitor significantly reduced the corrosion rate of steel as well as increased the chloride threshold level in the chloride contaminated mortar conditions [2]. Addition of the CN dosage should be optimum. If the dosage level is more than the recommended level, it attributed to increase the setting time of the concrete [3]. The lower dosage level leads to less protection. Thus, an optimal level of corrosion inhibitor should be used to enhance the CN of reinforcement. 2 RESEARCH SIGNIFICANCE The CN based corrosion inhibitors is used to enhance the corrosion resistance of steel in reinforced concrete structures that are exposed to corrosive environment. In this present investigation, the effect of CN based corrosion inhibitor on the CR of the embedded QST steel rebar in the mortar subjected to alternate wetting and drying cycle is studied. The results of this study may help the practicing engineers to create awareness on the need for using corrosion inhibitors. 3 MATERIALS AND METHODS Quenched and Self-Tempered steel (QST) steel samples in the sizes of 100 mm length and 16mm diameter was used for this present study as illustrated in Figure 1. The mortar was prepared with ratio of OPC cement: Sand: w/c as 1:3:0.45. Mortar specimens were cast using the 50 mm diameter cylindrical PVC pipe with QST steel was located in the centre. To measure the corrosion rate, a groove was made and a copper wire was connected, and epoxy coated to avoid corrosion at top end of the bar. Five specimens each (i) with no inhibitor (Calcium Nitrite based corrosion inhibitor with dosage of 7.5% by weight of cement) and (ii) without inhibitor was cast and cured for 28 days. The test specimens were demoulded after 24 hours of casting and all the specimens were cast and cured for 28 days and then subjected to cyclic wet-dry (7 days wet and 7 days dry) exposure in 3.5% NaCl solution and the corrosion rate was estimated as discussed in the next section. 113
 test was conducted at every 7 th day (at the end of the wet and dry cycle).")
 was used as the reference electrode and placed near the surface of mortar cylinder.")
151 3.1 Setup for corrosion rate measurement The specimens were subjected to alternate wet and dry cycle (2 days wet and 5 days dry cycle) to accelerate the diffusion of chloride to the surface of steel. Linear Polarization Resistance (LPR) test was conducted at every 7 th day (at the end of the wet and dry cycle). The uncoated steel rebar embedded inside the mortar is considered as the Working electrode. An Inconel plate (100 mm x 100 mm) was used as the counter electrode. The test specimen was placed at near to the counter electrode. The saturated calomel electrode (SCE) was used as the reference electrode and placed near the surface of mortar cylinder. LPR test was conducted by applying the potential range from -15 mv to +15 mv with respect to the open circuit potential (OCP) at the scan rate of 0.15 mv/s. The drop in applied potential due to the resistance of mortar was nullified by using the ir compensation method. The corrosion rate of steel was calculated from the Tafel s plot. shows that there is a significant decrease in CR of steel upon using the CN inhibitor. On comparing the specimens in wet and dry cycle, CR in dry cycle is higher than that of wet cycle. This may be due to the presence of more oxygen and less moisture, which favours the corrosion. From the results, it is confirmed that the usage of CN inhibitor significantly reduces the corrosion rate of the steel reinforcement. Figure 2. Corrosion rate of steel at the end of each wet cycle Figure 3. Corrosion rate of steel at the end of each dry cycle 5 CONCLUSION From the results, it is confirmed that the usage of CN inhibitor significantly reduces the corrosion rate of the steel reinforcement. The corrosion rate is more in the wet-dry cycle than the completely immersed specimen. Figure 1. (a) Schematic diagram of the test specimen, (b) Cast specimen. 4 RESULTS AND DISCUSSION 4.1 Measurement of corrosion rate The corrosion rate of the test specimens at the end of the cyclic wet (2 days) and dry (5 days) conditions were measured and calculated as shown in Figure 2 and Figure 3, respectively. Figure 2 shows that, during wet cycle, the CR of steel with no inhibitor is approximately 2 times higher than that of the specimens with CN inhibitor. Similarly, Figure 3 shows that, during dry cycle, the CR of steel with no inhibitor is approximately 3 times higher than that of the specimen with CN inhibitor. This 6 ACKNOWLEDGEMENTS The authors acknowledge the technical assistance provided by lab staff in Department of Metallurgical and Materials Engineering, and Department of Civil Engineering, NIT Tiruchirappalli. 7 REFERENCES [1] K.Y. Ann, H.S. Jung, H.S. Kim, S.S. Kim, H.Y. Moon (2006), Effect of calcium nitrite-based corrosion inhibitor in preventing corrosion of embedded steel in concrete, Cement and Concrete Research, Vol.36, pp [2] Neal S. Berke and Arnold Rosenberg, Technical Review of Calcium Nitrite Corrosion Inhibitor in Concrete, Transportation Research Record 1211, pp [3] Payal K. Firodiya, Amlan K. Sengupta, P.E. and Radhakrishna G. Pillai (2015) Evaluation of Corrosion Rates of Reinforcing Bars for Probabilistic Assessment of Existing Road Bridge Girders, Journal of Performance of Constructed Facilities, Vol.29(3). 114
152 Industrial Application of Rubberised Sand Concrete for Corrosion Resistance Rijo C Andrews *, Anaswara, Akhil Raj J, Akhil Raj M and Fazil A Department of Chemical Engineering, TKM College of Engineering, Kollam *rijoandrews@gmail.com Abstract Industrial corrosion is a major source of concern all over the world. Estimates reveal an annual loss of about Rs crore due to corrosion in the Indian industrial sector. Reduction of corrosion is not only an economic issue but also has a health and quality aspect. Designing and production of innovative, eco-friendly, cost effective and energy efficient corrosion inhibiting composites is required to meet industrial needs. Also, our country produces a large amount of rubber wastes in different forms. In order to conserve natural resources and reduce landfill space, waste reduction and recycling is essential. Our study focuses on supplementing the usage of conventional construction composites with rubber crumb - sand mixture in specific ratio to be used as basic building component in concrete structures. Thus we intend to study the corrosion characteristics of reinforced cement concrete made by using rubber-sand mixture using different testing procedures which include compression test, chemical test which brings light to the reaction of the concrete with other chemical reactants and moisture, modulus of elasticity test, splitting strength test etc for its application in HCl storage in Kerala Minerals and Metals Limited for the production of Titanium dioxide where the corrosive issues do have a qualitative, quantitative and economic role to play. Keywords - Waste-management, Rubber-sand, Sulphatecorrosion, Concrete-coating 1 INTRODUCTION In today s fast-growing world, the aftereffects of development are least cared by human population. Used products are dumped out without even thinking about the aftereffects it will cause to the environment. A time has come when we should try and develop new techniques to reconvert these wastes into a reusable form. Surveys estimate that over 200 million waste rubber tyres are produced in India per year. Presently about 55-60% of the above mentioned tyres in India are reused in other forms, only second to China. This percentage should increase in order to reduce rubber disposal. Alternate usage of rubber in other areas has become a matter of social and economical relevance in the present scenario. Rubber composites are currently used in construction sector which provide a better choice for builders than the conventional Portland cement. 2 RESEARCH SIGNIFICANCE The solution for the present issues of concrete corrosion by the action of the major corrosive agents like hydrochloric acid and sulphuric acid which are extensively used in most of the major chemical industries is one the most debated and researched area of study. Various coatings and paints have been developed for the prevention of corrosion in the structures. But the periodic recoating and replacement cost has invoked the need to have innovative methodology to reduce the maintenance cost by having a coating that need not be replaced periodically. This revolutionary concept of usage of rubber sand mixture in place of conventional sand in concrete mixing not only reduces the acid corrosion on the structure but is also a solution to the increasing waste management issues in regards with the disposal of crumb rubber wastes. This also paves the way to future study on the corrosion preventive action of different polymers when mixed with cement concrete in various concentration ratios. 3 MATERIALS AND METHODS The preliminary step included the case study on the industrial corrosion issue faced by Kerala Minerals and Metals Limited, Kollam, India regarding the effect of corrosion in the acid storage and transportation pathways followed in the industry. The conclusions from the visit has invoked different innovations that can be brought out to minimise the corrosive effect of acid on the structures reducing the periodic maintenance cost. The primary step in the analysis of rubber sand mixture in concrete was the size reduction of crumb rubber waste into the required particle size of 1-5mm. This was carried out by the shearing action provided by specialised shear equipment designed specifically for this purpose. The size separation of this mixture was carried out at the laboratory facility available at Department of Chemical Engineering, TKM College of Engineering, Kollam. The rubber sand mixture was prepared at five different ratios and the concrete was made by 115
153 specialised concrete blending equipment available at Department of Civil Engineering, TKM College of Engineering, Kollam. The 15 concrete blocks (3 of the same mixture ratio) were kept for setting for a period of 7 days and the different physical properties were measured. Of the first set of 5 blocks of different mixture ratios, each one was tested with 1N hydrochloric acid solution, the next set with 1N sulphuric acid solution and the third set with 1N Sodium hydroxide solution. To study the characteristic behavior of storage, the setup was kept undisturbed for a period of 5 days and then the chemical properties of the slabs were studied using scanning electron microscopy and transmission electron microscopy. 4 RESULTS AND DISCUSSION Weight loss The weight loss occurring in the concrete slabs has been lowest in all three cases namely for HCl, Sulphuric acid and NaOH tests to reveal the lowest loss in weight for a rubber aggregate concentration of 20%. Table 1. HCl action Table 2. Sulphuric acid action Table 3. NaOH action (All weights given in grams) 5 CONCLUSION The major issues faced in the modern era including the issue of industrial concrete corrosion and the global problem of rubber waste management can be brought to an end by the appropriate use of rubber sand mixture in concrete making. This not only solve the issues of waste management and corrosion, but also adds to an enhanced health and strength of the concrete structure. The optimum usage of rubber aggregates in concrete synthesis can reduce the weight loss occurring in the concrete structures that comes in contact with any sort of acid 6 ACKNOWLEDGEMENTS We acknowledge the help and support from the Department of Chemical Engineering, TKM College of Engineering, Kollam. We also thank the staff and faculty of Department of Civil Engineering, TKM College of Engineering, Kollam. The support from the staff and management of Kerala Minerals and Metals Limited in the industrial analysis of corrosion and collection of industrial data is also commemorated in this occasion. 7 REFERENCES [1] Toutanji H. A. (1996), The use of rubber tire particles in concrete to replace mineral aggregates, Cem. Concr. Compos., Vol. 18, pp [2] Issa C. A. and Salem G. (2013), Utilization of recycled crumb rubber as fine aggregates in concrete mix design, Constr. Build. Mater., Vol. 42, pp [3] Siddique R. andnaik T. R. (2004), Properties of concrete containing scrap-tire rubber - An overview, Waste Manag., Vol. 24, pp
154 Influence of Surface Modification and Surface Configuration of Steel Rebars on Flexural Performance of RCC Beams Ahmed Abdul Ahad 1*, S Raghavendran 2 and M.S. Haji Sheik Mohammed 1 1 Department of Civil Engineering, B.S. Abdur Rahman Crescent Institute of Science & Technology, Chennai 2 Sri Muthukumaran Institute of Technology, Chennai *abdulahadcivilphd2016@bsauniv.ac.in Abstract The present investigation assesses the flexural behavior of RCC Beams reinforced with PSWC (Plain Surface with Wavy Configuration) bars. PSWC bars are prepared from conventional mild steel reinforcements for a desired pitch and deformation levels. Variables involved in the study are deformation levels of 4mm, 6mm, 8mm and 10mm for a constant pitch of 200mm. Size of the beam is 150mmX200mmX1000mm. Based on the experimental test results, it is found that there is a marginal reduction in ultimate load carrying capacity and flexural strength for PSWC bar reinforced beams as compared to control beam. There is an increase in first crack load to ultimate load of the order of 50 63% for PSWC bar reinforced beams which are appreciably higher than control beams. Beams reinforced with PSWC bars with 6mm, 8mm and 10mm offset offers improved first crack load, failure load, enhanced ductility ratio and energy absorption capacity as compared to control beams. Failure pattern of beams revealed that control beam failed due to diagonal shear crack whereas PSWC beams failed due to Y- shaped crack originating from load point in compression side to one end support. Keywords Mild Steel, Flexural Strength, PSWC Bar Corrosion of Steel. 1 INTRODUCTION Reinforced Concrete is one of the most widely used modern building materials in construction industry. The performance of reinforced concrete depends upon the combined action of concrete and reinforcing steel. In an article in ACI Materials Journal in 1991 Papadakis and others observed that the last two decades have seen a disconcerting increase in examples of the unsatisfactory durability of concrete structures, specially reinforced concrete ones [1]. Kar and Haji Sheik Mohammed (2012) studied on different reasons for early corrosion in rebars and proposed an alternative solution of C-Bars, results showed that the use of C-bars, which corrode much less than rebars with surface deformations do and which cost no more than any other bar of the same metallurgy to make, would not lead to any spalling of concrete. Furthermore, greatly enhance their ductility and thus lead to very significant increase in their energy absorbing capacity all at no added cost [2]. Anil K Kar (2012) studied the durability aspects of concrete bridges and suggested that there must be some additional expenditure to improve the chemistry of rebars so that such bars would be less susceptible to early corrosion and another solution would be the use of high strength rebars with a plain surface but a deformed axis that can lessen the propensity of rebars for corrosion and enhance the durability of concrete structures without any added cost [3]. Tests have revealed that the use of PWSC bars in concrete elements can greatly enhance their ductility and thus lead to very significant increase in their energy absorbing capacity; all at no added cost [4]. 2 RESEARCH SIGNIFICANCE PSWC has the potential to replace conventional rebar considering the durability offered at no extra cost. 3 MATERIALS AND METHODS Ordinary Portland Cement 53 grade, locally available river sand, 10mm coarse aggregates and fly ash with specific gravity 2.9, 2.6, 2.7 and 2.24 respectively were used in the production of concrete. Varaplast SP 123 was used as Super Plasticizer. The following categories of beams are studied for comparison purpose, 1. Beam reinforced with PSWC bar with 200 mm pitch and 4 mm deformation B PSWC Beam reinforced with PSWC bar with 200 mm pitch and 6 mm deformation B PSWC Beam reinforced with PSWC bar with 200 mm pitch and 8 mm deformation B PSWC Beam reinforced with PSWC bar with 200 mm pitch and 10 mm deformation B PSWC Beam reinforced with Ordinary Mild Steel Rebar B MS

155 The specimens were cast to a size of 150mm wide, 200mm deep and length of 1000mm. The clear cover of the beam was provided as 30mm. The bottom reinforcement was 3 nos. of 12mm diameter and the top reinforcement was two nos. of 10mm diameter. Two legged vertical stirrups of 8mm diameter were provided at a spacing of 200mm center to center for both conventional rebars and PSWC rebars. Figure 1 shows the reinforcement details and figure 2 shows the flexural strength test setup. and control beam although there is appreciable reduction ultimate load capacity. Figure 3. Load vs. Deflection curve Figure 1. Reinforcement details Figure 2. Flexure test setup 4 RESULTS AND DISCUSSION Figure 3 shows load-deflection behavior of control and PSWC bar reinforced beams. It can be seen that deflection started in control beam at 40kN and gradual increase until reaches ultimate load followed with immediate failure without warning. For B PSWC4 beams although exhibited similar behavior as that of control beam but with reduced ultimate load. B PSWC 6 and B PSWC 10 specimens are found appreciable horizontal plateau of deflection after post peak which reveals improved ductility and energy absorption capacity as compared to control B MSO beams. But B PSWC 8 beams exhibits excellent horizontal plateau after post peak as compared to other tested PSWC bar reinforced beams. It can be concluded that PSWC bar reinforced with PSWC bars exhibits significantly improved ductility ratio and energy absorption as compared to other tested PSWC bar reinforced beams 5 CONCLUSIONS There is a marginal reduction in ultimate load carrying capacity and flexural strength for PSWC bar reinforced beams as compared to control beam. Beams reinforced with PSWC bars with 6mm, 8mm and 10mm offset offers improved first crack load, failure load, more deflection before failure, enhanced ductility ratio and energy capacity as compared to control beams. It can be concluded that PSWC bars (with 8mm offset and 200mm pitch) reinforced beam offers significant increase in ductility ratio, energy absorption capacity and prolonged deflection before failure as compared to conventional control beam. 6 REFERENCES [1] Papadakis, V. G., Vayenas, C. G., and Fardis, M. N., Physical and Chemical Characteristics Affecting the Durability of Concrete, ACI Materials Journal, American Concrete Institute, March - April, [2] Anil K Kar, and M.S. Haji Sheik Mohammed, (2012) Performance of Concrete Flexural Elements Reinforced with C-Bars, The Master Builder, Vol no- 14, pp [3] Anil K Kar, (2012) Durability of Concrete Bridges and Viaducts, The Master builder, Vol no-82, pp [4] Kishan Parmar Harsh Rathod 2012, Comparison of a Rebar with a Plain Surface and a Deformed Axis over HYSD rebars, International Journal of Engineering Research & Technology. [5] Kar, A. K. and Vij, S. K. (2009). Enhancing the life span of concrete bridges. New Building Materials & Construction World, 15(6):
.")
156 Microbial Induced Corrosion in Concrete and its Preventive Measures (An Overview) Mohd Umar*, M.S. Haji Sheik Mohammed, Naheetha Fathima, and S. Hemalatha B. S. Abdur Rahman Crescent Institute of Science and Technology, Chennai * umarcivilphd17@bsauniv.ac.in Abstract - This review integrates the literature on preventive measures involved in the protection of concrete from microbial induced corrosion (MIC). Primarily, MIC is the phenomenon in which specific microorganisms involved in the deterioration of concrete. These microorganisms deteriorate the concrete by producing acids. Biologically produced acids react with the hydration products of cement, causing a change in chemical composition leading to early deterioration and loss of mass and strength. The resulting deterioration can cause leakage and structural failure. Principally, this review specifies the concepts of the MIC in concrete and emphasizes on the preventive measures used for protecting concrete from MIC. Keywords: Microbial Induced Corrosion, Concrete, Preventive measures 1 INTRODUCTION Concrete structures which are exposed to the severe environments, such as sewer pipelines, water treatment plants, agricultural industry, concrete cooling towers, concrete bridges and concrete structure near sea shore are getting corroded by the influence of microorganisms. Carbonatization reduces the surface ph of concrete from 12.5 to 8.5. At this ph, the iron/steel reinforcements may become susceptible to corrosion. Furthermore, Neutrophilic Thiobacilli can grow and will further reduce the surface ph of concrete from 8.5 to as low as 4 allowing the microbes that are capable of producing vast amounts of sulphuric acid to flourish (T. Thiooxidans). This will further reduce the ph to 1 or 2. These biologically produced acids will attack the hydrates of cement in the hardened concrete and will react with calcium hydroxide and calcium silicate hydrate to form gypsum [1].The formation of gypsum causes expansion with an increase in volume by a factor of 1.2 to 2 and softening which under severe and continuous exposure may result in complete deterioration of the hardened concrete. Furthermore, the reaction between gypsum and calcium aluminate hydrate (C 3A) with the Formation of a Tricalcium aluminate forming calcium Sulphoaluminate, known as ettringite causes an even larger volume expansion [2]. The above mechanism is described with the help of figure 1. Figure 1. Typical mechanism of microbial induced corrosion (MIC) in concrete 2 OBJECTIVE In order to overcome the intensifying distress of concrete due to MIC and to make concrete more sustainable in a harsh environment. The intention of this review is to systematically survey earlier research of MIC in concrete in order to explore the existing situation and to summarize the key challenges in preventing the concrete from MIC. 3.2 Need For The Present Study In the USA alone, the Congressional Budget Office projected annual operation and maintenance costs of $25 billion for wastewater systems over the period Strategies to prevent or mitigate MIC have been met with limited success. [3].There is cases where MIC has accelerated the corrosion rate by as much as 10 times the original rate. At this rate, the structure could be left at the unrepairable condition in a very short period of time, leaving costly total replacement as the only viable option [4]. Because of the destructive power and unpredictable nature of MIC, there is a need to identify cost-effective preventive measures. The intention of this review is to systematically survey the preventive measure adopted for the protection of concrete from MIC in order to explore the existing situation and to summarize the key challenges. 3.3 Prevention Of Microbial Induced Corrosion Traditionally, efforts to control deterioration due to microbial attack have been focused on coating the concrete or using plastic liners. Several other techniques currently in use around the world include spraying with 119
157 magnesium hydroxide to raise the concrete surface ph and using antibacterial admixtures inside concrete. In general, there are three major preventative measures for the deterioration due to microbial attack: (1) coatings; (2) sewer treatment; and (3) modification of concrete materials [2]. Protective coatings are employed on the surface of concrete for better resistance against corrosion. There are three factors which will reflect its protection ability against corrosion: chemical resistance of the coating to acid, impermeability of the film and adhesion of the film to the concrete. For a successful coating on concrete, the above three properties must be present in the coating with full measure and should retain them unimpaired over a long period [5]. Several control methods were adopted by the researchers in past to control the corrosion in the sewer system. Islander et al. performed an investigation of the complex microbial ecosystem inside the sewer crowns. In his study, he found that heavy and frequent flushing will be necessary to significantly reduce corrosion rates [6]. Many researchers have used mineral admixtures to enhance the property of concrete. Using type V cement and addition of mineral admixtures like fly ash and silica fume will significantly increase the resistance of concrete against MIC [2]. Using low w/c also effects the resistance of concrete against MIC. In a study, it was found that low w/c ratio concrete was more resistant to the biodegradation of concrete [7]. Incorporation of fly ash in the concrete significantly increase the resistance against MIC. Biofilm characterization studies and microscopic studies show excellent results of FA concrete compared to other concrete in addition to laboratory exposure studies Epifluorescence and scanning electron microscopic studies supported the better performance of the FA specimen [8]. In another similar study, in which fly ash modified concrete is tested using lock-in thermography shows a very little change in the phase angle and amplitude between one-year sea water exposures [9]. A similar study was performed on three different types of Nanophase modified fly ash mortar specimens. Results demonstrated lesser ph reduction and enhanced antibacterial activity on the surface of mortar specimens under the influence of TiO 2 nanoparticles [10]. Rathish et al. [11] incorporated inhibitor along with nanoparticles in concrete and showed highest resistance against microbial degradation. 3 INFERENCES Results show that although surface treatment may prevent further deterioration, most of the treatment is costly and do not provide adequate, long-term protection or control [2]. The method of injection of chemicals inside sewer line is expensive and need to be repeated on a regular basis. Also, the process is not applicable to structures such as bridge columns exposed to open water [2]. Modification in concrete materials can be one of the effective methods in protecting the concrete form MIC. Although most of the test have shown better performance, there is a lag in experimental work that takes into account the conditions existing in the field and then relate to field observations. Moreover, incorporation of inhibitor for the protection of concrete against MIC is not extensively documented. 4 OUTLOOK AND CHALLENGES FOR CURRENT RESEARCH IN MIC From the reviewed literature it is evident that there have been some MIC studies available so far on microbial communities potentially being involved in the deterioration of concrete bridge structures. Due to a lack of complete understanding of the mechanism of concrete degradation due to MIC, methods for field site identification of microbial induced degradation are still very limited [2]. 5 CONCLUSIONS This review summarizes the typical mechanism of the MIC in concrete and its preventive measures adopted by the researchers. There is a need to clearly understand the mechanism of attack of microbes on concrete for better protection. Several preventive measures adopted by different researchers are discussed in detail. It can be said that modification of the concrete material can be a most effective method for the protection of concrete against MIC. Use of mineral and chemical admixture can be incorporated in the concrete for better resistance against MIC. 6 REFERENCES [1] J. L. Davis, D. Nica, K. Shields and D. J. Roberts, International biodeterioration \& biodegradation, vol. 42, pp , [2] J. Hu, D. Hahn, W. Rudzinski, Z. Wang, L. Estrada and others, [3] L. Ding, W. J. Weiss and E. R. Blatchley III, Journal of Environmental Engineering, vol. 143, p , [4] R. A. Forsyth, in Ports 2010: Building on the Past, Respecting the Future, 2010, pp [5] J. H. Rigdon and C. W. Beardsley, Corrosion, vol. 14, pp , [6] R. L. Islander, J. S. Devinny, F. Mansfeld, A. Postyn and H. Shih, Journal of Environmental Engineering, vol. 117, pp , [7] M. G. D. Guti{\'e}rrez-Padilla, A. Bielefeldt, S. Ovtchinnikov, M. Hernandez and J. Silverstein, Cement and Concrete Research, vol. 40, pp , [8] V. Vishwakarma, R. P. George, D. Ramachandran, B. Anandkumar and U. K. Mudali, Environmental Technology, vol. 35, pp , [9] V. Vishwakarma, Concrete Research Letters, vol. 3, [10] V. Vishwakarma, U. Sudha, D. Ramachandran, B. Anandkumar, R. P. George, K. Kumari, R. Preetha, U. K. Mudali and C. S. Pillai, Materials Today: Proceedings, vol. 3, pp , [11] V. R. Rathish, B S Abdur Rahman University, Chennai,
158 Determination of ph threshold of corrosion initiation in cementitous systems with supplementary cementitious materials Sundar Rathnarajan* and Radhakrishna G. Pillai Department of Civil Engineering, Indian Institute of Technology Madras, Chennai Abstract Carbonation induced corrosion believed to be initiated in the cementitious systems once the carbonation front reaches the steel cementitious interface. The determination propagation period for cementitious system with different type of binders is necessary for the accurate service life estimation of the system. In this study corrosion rate (icorr) three different cementitious systems with (OPC, OPC + 30% flyash, LC3) was assessed using open circuit potential and linear polarization resistance technique. The level of ph in the carbonated mortars were measured using ph electrode method to determine the threshold ph at which corrosion initiated in different cementitious systems. The mortar specimens made with OPC showed lesser corrosion rate than other types of binder with respect to carbonation induced corrosion. Keywords Carbonation, Corrosion, Initiation, Propagation, Service life 1 INTRODUCTION Carbonation induced corrosion (CIC) in the cementitious system results in generalized corrosion of embedded steel. The time at which carbonation front reaches the level of steel is said to be corrosion initiation time. The ph level at which the cementitious systems exists during the corrosion initiation time may vary due to the presence of different type of binders The apparent ph at the level of steel cementitious interface in different type of binders could be varying due to the clinker dilution effect in the cementitious system with supplementary cementitious system [1]. Once the corrosion initiated in the cementitious system the formation of rust products result in the loss of integrity of steel rebar. The volume expansion of rust products result in the delamination of cementitious cover and makes it simple for the aggressive ions to enter the steel cementitious interface. Corrosion propagation period for the cementitious system could be varying due to the difference in the corrosion rate (I corr) of embedded steel between different types of binders. The cementitious systems with supplementary cementitious materials showed higher corrosion rate than Ordinary Portland Cement under carbonation induced corrosion [2]. The difference in the corrosion propagation period is primarily due to the replacement level of supplementary cementitious materials to the clinker content. Service life estimation models for carbonation induced corrosion often consider only corrosion initiation phase with an assumed level of initiation ph irrespective of the type of binder [3]. The amount of ph at the time of corrosion initiation is a necessary parameter to determine the initiation time accurately. In addition to the corrosion initiation depending upon the corrosion rate in the different type of binder s propagation period can be calculated based on the loss in cross section of embedded steel. Thus, the sum of corrosion initiation time and propagation time can be termed as the service life of reinforced concrete structures subjected to carbonation. 2 RESEARCH SIGNIFICANCE The determination of ph level at the time of corrosion initiation in the steel-cementitious interface is necessary to reconsider the validity of carbonation depth prediction models. The existing models are primarily based on the phenolphthalein indicator whose working range differentiates the carbonated and non-carbonated zone (above 9 non-carbonated and below 9 carbonated). 3 MATERIALS AND METHODS Mortar lollipop specimens with embedded steel in it were cast with three different types of binder composition OPC, OPC + 30% Flyash (PFA), and LC3. LC3 is a ternary blend binder with calcined clay and limestone blended with cement clinker. The lollipop specimens were demolded and kept in curing for one day. After moist curing of specimens, pre-conditioning for a period of 28 days was carried out and specimens were exposed to the accelerated carbonation environment with 3% CO 2. Mortar specimens without steel embedded in it were also introduced in the accelerated carbonation chamber to monitor the progress of carbonation front. 3.1 Linear Polarization method The specimens were subjected to alternate wet and dry cycle after the carbonation front reaches the level of 121


159 steel. Linear Polarization method was used to determine the corrosion rate in the cementitious system. The open circuit potential and it was used as input for determining the polarization resistance of cementitious mortars using a sweep rate of mv/s. 3.2 Measurement of ph threshold at steelcementitious interface ph of the steel cementitious interface was measured using the ph electrode. The mortar chunks at the steel cementitious interface were carefully removed. The removed mortar chunks were crushed and ground using a mortar pestle. The powder particles passing through 75 μ sieve was collected and diluted in distilled water at a ratio 1:5. The solution was left undisturbed for 30 minutes. The ph electrode was calibrated against the standard buffer solutions with ph 4 and 9. The calibrated ph electrode was immersed in the solution and the ph value of the corresponding sample was noted down once the ph electrode reading got stabilized. 4 RESULTS AND DISCUSSION 4.1 Corrosion rate The carbonated mortar specimens were subjected to open circuit potential and linear polarization resistance test at the end of 48 hours wet cycle. The OCP measurements range between -550 and -670 mv for these binders under consideration over a period of time. This represents the situation of actively corroding rebar [4]. Linear polarization measurements were also taken and the polarization resistance was calculated for each type of binders. Using the Stern-Geary equation the I corr values were calculated and only the lollipop specimens cast with LC3 showed I corr value in the range of active corrosion as shown in Figure 1. But in visual observation of other PFA and OPC specimens showed generalized corrosion in the embedded rebar in them as shown in Figure 2. Thus in addition to linear polarization technique, we need other electrochemical test methods to determine the initiation time in the different mortar systems. Figure 1. Corrosion rate measurement Figure 2. Corroded rebar embedded in mortar specimens 4.2 ph at steel-cementitous interface The ph values at the interface of the steelcementitious system were mentioned in Table 1. This measured ph range is suitable for the formation of rust products [5]. The ph level in the different cementitious system found to be different after complete carbonation. The higher the corrosion rate in the cementitious system when the ph level is low in a particular binder system. Table 1. Measured ph at steel cementitious interface Type of binder 5 CONCLUSION OPC PFA LC The results showed that the ternary blend LC3 subjected to carbonation showed a higher corrosion rate and lesser ph at the interface due to non-availability of calcium hydroxide at an early age itself. The threshold ph at corrosion initiation found to be different in different binder systems. Additional techniques such as Electrical impedance technique need to be used for accurate determination of corrosion initiation in the cementitious system subjected to carbonation. 6 ACKNOWLEDGEMENTS The authors extend their sincere thanks to the funds provided by DST and SDC. The authors acknowledge the technical assistance provided by lab staff in Department of Civil Engineering, IIT Madras. 7 REFERENCES 5 McPolin DO, Basheer PA, Long AE, (2007) New test method to obtain ph profiles due to carbonation of concretes containing supplementary cementitious materials. Journal of Materials in Civil Engineering 19: Andrade C, Bujak R, (2013) Effects of some mineral additions to Portland cement on reinforcement corrosion. Cement Concrete and Research 53: Czarnecki L, Woyciechowski P (2013) Prediction of the reinforced concrete structure durability under the risk of carbonation and chloride aggression. Bulletin of Polish Academy of Science and Technology 61: C. Alonso, C. Andrade (1988) Corrosion of steel reinforcement in carbonated mortar containing chlorides. Advanced Cement Research 1: J.A. Gonzalez, S.Alagaba, C.Andrade, (1980), Corrosion of reinforcing bars in carbonated concrete, British Corrosion Journal., 15:
160 Reinforcement Corrosion Rate Measurement using Linear Polarization Resistance Method Mohamad Zaitoun 1*, Sultan Ahmad 2 and Shamsad Ahmad 1 1 Civil Engineering Department, King Fahd University of Petroleum & Minerals, Dhahran, Saudi Arabia 2 Architectural Engineering Department, King Fahd University of Petroleum & Minerals, Dhahran, Saudi Arabia *s @kfupm.edu.sa Abstract - The coastal parts of Saudi Arabia possess highly aggressive exposure conditions (high temperature and relative humidity and their wide fluctuations, presence of huge amounts of chloride in the environment) that cause corrosion of steel bars embedded in concrete structures. Due to reinforcement corrosion, concrete cracks and losses of bond and steel cross-section occur that lead to shortening of the service life of concrete structures. Reinforcement corrosion rate is essentially required to quantify the corrosion damage and to predict the remaining service life of the corroding members. There are many methods available for measuring reinforcement corrosion rate in terms of corrosion current density. However, linear polarization resistance method is most widely adopted. This paper presents the updated information on the procedure to determine reinforcement corrosion rate using linear polarization method. In addition, a demonstration of measuring corrosion rates of a typical reinforced concrete specimen using a commercially available setup is presented. Keywords - Reinforcement corrosion, Corrosion rate, Linear Polarization Resistance 1 INTRODUCTION Half-cell potential (also termed as open-circuit or corrosion potential, E corr) test is generally conducted to know about the occurrence of reinforcement corrosion, which is supplemented by the resistivity test to make judgment about the risk of reinforcement corrosion qualitatively. Reinforcement corrosion rate gives quantitative information about extent of damage either in terms of corrosion current density (I corr in µa/cm 2 ) or in terms of penetration rate (P r in mm/year) or instantaneous corrosion rate (J r in g/cm 2 /year). I corr values obtained at different points on a member can be plotted to obtain contours showing areas corroding at different rates. Instantaneous corrosion rate, J r, which is the amount of rust being deposited per unit surface area of rebars per unit time, is used to predict time-tocorrosion cracking of cover concrete. Corrosion penetration rate, P r, which is the loss of diameter of rebars per unit time, is used to predict residual load bearing capacity of a concrete structural member subjected to reinforcement corrosion. This information is of great importance as it helps in knowing the extent of corrosion damage and in predicting the remaining service life, which is useful in taking decisions regarding the repairing and rehabilitation works. 2 RESEARCH SIGNIFICANCE The paper is aimed to improve the understanding of corrosion rate measurement using linear polarization method using the relevant information available in literature. The study also included development of skills by measuring the corrosion rate of a typical corroding specimen over a long period using a commercial available setup. 3 LINEAR POLARIZATION RESISTANCE (LPR) METHOD There are several methods used for measuring corrosion rate of rebars, which include linear polarization resistance method, electrochemical noise method, and A.C. impedance method, etc. However, linear polarization resistance method is mostly adopted [1]. The linear polarization resistance (LPR) method is derived from the basic equation for a polarization curve, as follows: i = i corr [exp ( 2.3ε ) exp ( 2.3ε )] β a β c Eq. (1) Where: i = current corresponding to an overpotential (ε) ε = over potential = E E corr E = polarized potential E corr = corrosion potential i corr = corrosion current corresponding to E corr β a and β c = anodic and cathodic Tafel s coefficients Stern and Geary [2] reported that Eq. 1 can take a linear form if polarization is conducted within a range of about ±20 mv (i.e., for ε = ±20 mv). Stern and Geary [2] proposed the following popular equation to calculate corrosion rate in terms of the corrosion current density (I corr) using the linear polarization data: 123
 Recently many researches show limitation to use linear polarization method whether in lab or in-situ [4-6].")
161 I Where: corr B R p Icorr = corrosion current density (A/cm 2 ) B = Stern-Geary constant (V) Rp = polarization resistance (Ω-cm 2 ) Eq. (2) Recently many researches show limitation to use linear polarization method whether in lab or in-situ [4-6]. However, some solutions are recommended to overcome the issue such as installing some electrochemical sensors in the critical area of concrete structure, in this case the area of working electrode must be known. 4 REINFORCEMENT CORROSION MONITORING USING LPR METHOD In the current experimental program, a cylindrical reinforced concrete specimen with a steel rod embedded centrally was typically used. The specimen was exposed to chloride solution having 5% NaCl for allowing the significant corrosion of the embedded steel rod to take place. The half-cell potential monitoring, in accordance with ASTM C [3], and corrosion current density monitoring using a commercially available setup (Gamry), in accordance with the LPR method, were carried out for a period of about two and a half year. The connections of the electrodes to the Galvanostat/Potentiostat are shown in Fig 1. Figure 1. Circuit connection 5 RESULTS AND DISCUSSION 1. Working electrode 2. Reference electrode and 3. Counter electrode, all connected to Gamry Potentiostat/Galvanostat The plot of corrosion potential (E corr) values, measured according to ASTM C [3] using saturated calomel electrode (SCE), is shown in Fig. 2. It can be observed from Fig. 2 that after an exposure period beyond 30 days, the E corr value is more negative than -270 mv (SCE) indicating the occurrence of reinforcement corrosion with high risk. The E corr values more negative than -426 mv (SCE) after about six months indicate the reinforcement corrosion with a severe risk, according to the interpretation criteria mentioned in the literature [3, 5]. I corr values measured over a duration of about two and a half year were plotted as shown in Fig. 3. According to the interpretation criteria reported in the literature [4-5], the corrosion rate was moderate to high up to an exposure period of 30 days since the I corr value is around 0.5 µa/cm 2, as can be seen from Fig. 3. The I corr value was almost constant at a value of slightly above 1 µa/cm 2 (which belongs to a very high corrosion rate) for an exposure duration of 570 days. It can be further noted that like the E corr, the value of I corr also jumps up beyond the exposure duration of 570 days. Figure 2. Plot of E corr and I corr values measured over time The measured value of I corr can be converted into the corrosion penetration rate, P r, and instantaneous corrosion rate, J r, using the following equations [3]: P r (mm/year) = I corr (µa/cm 2 ) Eq. (3) J r (g/cm 2 /year) = I corr (µa/cm 2 ) Eq. (4) 6 CONCLUSION The linear polarization resistance method used for measuring reinforcement corrosion rate is presented in a systematic way that can help in understanding this popular technique. Additionally, the use of a commercial setup to monitor reinforcement corrosion and data interpretation criteria are demonstrated through a typical experimental investigation. 7 ACKNOWLEDGEMENTS The authors acknowledge the supports received from Civil & Environmental Engineering Department, King Fahd University of Petroleum & Minerals, for conducting the study presented in this paper. 8 REFERENCES I corr (μa/cm 2 ) [1] Hao, B. H., Dou, Y. T., Zeng, D., & Zeng, Q. H. (2014). Applied Mechanics and Materials, 526, doi: / www. scientific. net/amm [2] Stern, M. and Geary, A. (1957). Journal of The Electrochemical Society, 104(12), 751. [3] ASTM C876-15, ASTM International, West Conshohocken, PA, 2015, [4] Andrade, C., & Alonso, C. (1996). Construction and Building Materials, 10(5), doi: / (95) [5] Figueira, R. (2017). Applied Sciences, 7(11), doi: /app [6] Feliu, S., Gonzalez, J. A., Andrade, C., & Feliu, V. (1988). Corrosion, 44(10), doi: / Duration (Days) 124
162 Pitting Corrosion Considering Effect of Temperature and Relative Humidity: Numerical Model Aditi Chauhan * and Umesh Kumar Sharma Indian Institute of Technology Roorkee , Uttarakhand,India *chauhan.aditi1@gmail.com Abstract A 2D numerical model was developed to study pit depths distribution around rebar under climatic variations in temperature and relative humidity. The model incorporated the evolution of the anode and cathode zones as affected by variation in the chloride ions around the steel bar. Corrosion rate was found to vary for different locations around the bar. The corrosion rate fluctuated with time depending on variations in temperature and relative humidity inside concrete. The study provides an insight into the effect of variations in local climate on non-uniform corrosion. The work is partly completed and interim results show the variations in corrosion rate. The future work will include determining the distribution of pit depth and rust development around the rebar: both being important parameters in assessing the behavior of structures under non-uniform corrosion influenced by climatic variations. Keywords Corrosion rate, temperature, relative humidity, numerical model. 1 INTRODUCTION In the recent few decades, studies have been carried out considering the non-uniform nature of chloride induced corrosion as opposed to the investigations of past, which considered uniform nature of corrosion. These studies included experimental work, analytical work and numerical work. They were aimed at studying the nonuniform nature of corrosion on steel bars without considering the effect of climate on the material parameters and corrosion mechanism. However, few studies conducted recently show that the climatic parameters, i.e., temperature and humidity have a considerable effect on the corrosion behavior of concrete structures both at initiation phase [1-4] and the propagation phase [5-9]. There are only few numerical models available to account for these parameters for corrosion propagation phase. No model as per author s knowledge has modeled the continued process of corrosion initiation followed by formation of macrocells and micro-cells (determination of corrosion rate, pit depths, rust distribution) under the influence of temperature and relative humidity (referred to as T-RH in the following sections). This study incorporates the variation in T-RH on corrosion initiation and corrosion propagation phase under chloride ingress. A 2D numerical model was developed in MATLAB using PDE Toolbox. 2 RESEARCH SIGNIFICANCE Corrosion rate data as collected from field investigations is observed to show variations, with fluctuations in T-RH in the environment. The problem of pitting corrosion is a concern for many countries across the globe, and each region is characterized by its own local climatic variations. Therefore, it is not possible to collect corrosion data for each and every location. Thus, there is a need to develop models incorporating the variations in the T-RH to study corrosion behavior of concrete structures. 3 MATERIALS AND METHODS Penetration of aggressive agents such as chloride ions through concrete cover results in the destruction of passive film at local areas called anode. The ingress of chloride and subsequent development of macro-cells and micro-cells under climatic temperature and humidity variations was modeled in 2D using MATLAB. 3.1 Model Description The model was divided into two phases: first phase modeled the chloride ingress in a reinforced concrete section along with T-RH flux boundary conditions. Finite element method using PDE Toolbox of MATLAB was used to model chloride ingress, temperature and relative humidity using available Partial differential equations [2]. The second phase modeled the formation of macro-cells and micro-cells depending on the chloride concentration, temperature and humidity profiles around the rebar as obtained in the first phase. Corrosion rate values were obtained in this phase for locations around the bar. It is to be noted here that the model is developed for steady phase of corrosion rate, i.e., the equilibrium between the diffusion process of oxygen from concrete surface to steel surface and the consumption process of oxygen at steel/concrete interface was assumed to be reached. 125
163 4 RESULTS AND DISCUSSION 4.1 Validation The finite element model developed was validated with the available numerical models separately for chloride ingress under temperature - humidity variations and for corrosion rate (Figure 1) under temperature-humidity variations. Figure 1. Comparison of corrosion rate prediction model under climatic variations with natural data [4]. 4.2 Case Study A reference case with concrete section of 300 mm x 300 mm reinforced with four 16 mm dia. bars, and a clear cover of 50 mm is considered here to investigate the influence of climatic variations (T-RH) on the corrosion rate for different locations around the steel bar. Figure 2, clearly suggests that corrosion rate for locations near the exposure face is developed earlier than the locations away from the exposure face, and the value of corrosion rate for locations facing the cover is more than the value for other locations. For every location the corrosion rate follows a sinusoidal variation, attributed to the variations in the climate, with a fluctuation up to 1 µa/cm 2. It follows the same trend as is observed for the temperature variations inside concrete. This finding is important to predict the actual behavior of structures exposed to real environment. The steel corrosion rate fluctuates in all stages without exhibiting a detectable stable state. These fluctuations can have a considerable effect on the development of pits on steel surface and, cracks on the concrete surface. Future investigations should incorporate the development of pit depths for different locations around the steel bar under climatic temperature and humidity variations. Figure 2. Corrosion rate at different locations of the reinforcement. 5 CONCLUSIONS 1. Results show that the macro-cells and microcells are formed along the steel bar after chloride concentration reaches and exceeds the threshold values. Most importantly, this study shows that their formation varies with climatic variations. 2. The developed rate of corrosion on steel bar varies for different locations around the bar depending on the formation of macro-cells and micro-cells. 3. Fluctuation in climate (temperature and humidity) results in variation of corrosion rate for every location around the bar, and a variation of up to 1 µa/cm 2 is observed. 6 REFERENCES [1] de Medeiros-Junior R., de Lima M. and de Medeiros M.F. (2014), Service Life of Concrete Structures Considering the Effects of Temperature and Relative Humidity on Chloride Transport, [J]. Environ. Dev. Sustain, Vol. 17, pp [2] Bastidas-Arteaga E., Chateauneuf A., Sanchez-Silva M., Bressolette P. and Schoefs F. (2011), A comprehensive probabilistic model of chloride ingress in unsaturated concrete, Eng. Struct., Vol. 33, pp [3] Allampllewar S.B. and Srivdya A.(2008), Corrosion initiation time for reinforced concrete members along Indian coast: Effects of temperature and relative humidity - A probabilistic approach, Construction & Building Materials, Vol. 15, pp [4] Muthulingam, S. and Rao, B.N. (2014), Non-uniform time-to-corrosion initiation in steel reinforced concrete under chloride environment,.corrosion Science, Vol. 82, pp [5] Pour-Ghaz M., Isgor O.B. and Ghods P. (2009), The effect of temperature on the corrosion of steel in concrete. Part 1: simulated polarization resistance tests and model development, Corrosion Science, Vol. 51, pp [6] Pour-Ghaz M., Isgor O.B. and Ghods P. (2009), The effect of temperature on the corrosion of steel in concrete. Part 2: model verification and parametric study, Corrosion Science, Vol. 51, pp [7] Jiang J. and Yuan Y.(2013), Development and prediction strategy of steel corrosion rate in concrete under natural climate, Constr. Build. Mater., Vol. 44,pp [8] Yu B., Yang L.F., Wu M. and Li B. (2014), Practical model for predicting corrosion rate of steel reinforcement in concrete structures, Constr. Build. Mater., Vol. 54, pp [9] Yu B., Liu J. and Li B. (2017), Improved numerical model for steel reinforcement corrosion in concrete considering influences of temperature and relative humidity, Constr. Build. Mater., Vol. 142, pp
164 Effects of Corrosion on Seismic Behavior of RC Columns Aditya Singh Rajput* and Umesh Kumar Sharma Indian Institute of Technology, Roorkee Abstract - Reinforcement corrosion is one of the primary modes of RC structural deterioration worldwide. This detrimental phenomenon causes serious threat to mechanical behavior and structural performance of RC members. Toward this end, a detailed experimental study was conducted to examine effects of corrosion on seismic behavior of column. Total of six number of large-scale specimens following the current Indian guidelines were cast in IITR laboratory. These columns were corroded to different degrees of corrosion using a pre-calibrated corrosion setup and tested under a simulated seismic loading setup. The results have concluded severe damage to the seismic performance of RC columns when subjected to corrosion. Both the strength as well as ductility were severely compromised as the corrosion degree was increased. Comparison with the controlled specimensshowedreduction of 55.5% in lateral load strength, 69% in curvature ductility, 53% in displacement ductility and 90% in energy absorption capacity at 15% corrosion level. This study quantifies the structural performance reduction due to corrosion and will help in designing a suitable strategy for rehabilitation and strengthening of these structures. Keywords - Confined Concrete, RC Columns, Corrosion, Seismic Performance. 1 INTRODUCTION The desired deformability of reinforced concrete sectionsis generally achieved through proper confinement of the concrete through transverse reinforcement. Different standards worldwide 1 4 have provided guidelines and strategies for designing this special confining reinforcement in the hinge regions of RC members. Performance of these provisions has been further verified through large-scale testing over pristine structures 5. Corrosion has emerged as one of the primary modesof deterioration of RC structures worldwide 6. These studies suggest significant reduction in the mechanical behavior of RC sections, but a focused investigation on effect of corrosionon seismic behaviorremains unresolved. Recent site visits by IITR team in the seismically active areas (Delhi NCR, Gujarat, North-east, and Dehradun, etc.) of Indian peninsula further emphasise the significant presence of 127 corrosion in important RC structural elements especially columns. Corrosion by its nature reduces the effective area of reinforcement and hence compromises the expected performance of RC elements 7. Corrosion of transverse reinforcement may significantly reduce effective confinement to the core concrete and hence may nullify the ductility being expected from a well-confined column. This apprehension of effects of corrosion on confinement efficiency of RC columns requires detailed investigation to design suitable rehabilitation measures. 2 RESEARCH SIGNIFICANCE Present study examines the confinement efficiency of corroded RC columns. Six large-scale RC columns were cast and corroded using a pre-calibrated corrosion regime. The corroded columns were tested for the seismic efficiency using a state of the art seismic testing setup. The main variable of the study was degree of corrosion. The study quantifies the effects of corrosion using important performance indices such as curvature ductility, deflection ductility, and energy dissipation, etc. The outcome of this studyshall benefit designers and practioners to design a suitable repair strategy. 3 MATERIALS AND METHODS Five of the six specimens in the present study were designedin accordance with the current seismic guidelines, while one specimen was deliberately kept under-confined to enable comparison with corroded RC columns. These columns were of square shape with 300mm size and 1800mm length. The columns were cast with a stub of size 1000x600x550 mm to represent a footing or a beam column joint. The degree of corrosion was chosen to be 10% and 15%. A robust scheme of instrumentation was designed and employed in order to record maximum response parameters of the columns during testing. A total of 31 LVDTs, 20 strain gauges and two load cells were used to record deflections, strains, and load values. A precalibrated corrosion setup was developed to achieve precisetargeted corrosion levels using impressed current techniques. The column specimens in their test length of 700 mm were corroded using accelerated corrosion technique. A current density of 200µA/cm 2 was maintained for the entire corrosion regime. The exposure duration was


165 calculatedusing the modified Faraday s law. After making note of the corrosion induced distress, the columns were tested under the simulated seismic loading. The corroded specimens were then demolished after testingand corroded reinforcement bars were extracted, cleaned and residual weights were recorded to evaluate actual mass loss due to corrosion. 4 RESULTS AND DISCUSSION Hysteresis behavior of corroded columns was evidently inferior than the sound columns. Figure-1 shows the comparison of the load v/s deflection plot of corroded and sound column specimens. The diagram shows approximately 55.5% reduction in lateral load for the column corroded to 15% corrosion. The gravimetric examination also revealed the fact that confinement reinforcement suffered most from the corrosion and hence affected the ductility in most severe manner. The ductility parameters showed reduction of 69% in curvature ductility and 53% in displacement ductility. Moreover, the axial load carrying capacity, stiffness degradation,and energy absorption capability were also significantly compromised due to corrosion. Note: - C %= Corrosion degree, V max=max. Lateral load, M max=max. flexural moment. µδ(0.8)= Displacement ductility factor corresponding to 80% of peak load, and µø(0.8)= Curvature ductility factor corresponding to 80% of peak load. 5 CONCLUSIONS Corrosion of reinforcement in confined concrete columns affects the strength, stiffness and deformability of RC columns. Confining reinforcement was the most affected component witnessing approximately 50% higher corrosion than the average corrosion value of entire hinge length reinforcement cage. The lateral load carrying capacity of corroded confined concrete columns was found to be 27% and 55.5% lower than the sound un-corroded columns for 10% and 15% degree of corrosion respectively. The moment capacities of the columns with 10% and 15% corrosion were found to be 23% and 47.5% lower than in the comparable uncorroded columns respectively. A maximum reduction of 69% in curvature ductility, 53% in displacement ductility and 90% in energy absorption capacity was noted at 15% corrosion level. 6 ACKNOWLEDGEMENTS The authors wish to thank the department of science and technology (DST), Government of India for providing financial support for conducting this investigation. 7 REFERENCES Figure 1. Hysteresis behavior comparison. Figure 2. Backbone comparison of all specimens. Table 1. Summary of Results. Specimen C % V max M max µδ(0.8) µø(0.8) FCD(I) FCD(II) FCUC(II) FCD(II)-10% FCD(II)-15% FCD(I)-15% [1] (CSA)A Design of Concrete Structures (CSA). [2] ACI: Building Code Requirements for Structural Concrete and Commentary. Am Concr Inst. [3] NZS-3101:2006(Part-I). Concrete Structures Standard - The Design of Concrete Structures. Vol 1.; [4] IS-13920:2016. Ductile Design and Detailing of Reinforced Concrete Structures Subjected to Seismic Forces- Code of Practice (First Revision). 2016;(July). [5] Rajput AS, Sharma UK. Seismic Behavior of Under Confined Square Reinforced Concrete Columns. Structures. 2017;13(June 2017): doi: /j.istruc [6] Han S-J, Lee DH, Kim KS, Seo S-Y, Moon J, Monteiro PJM. Degradation of flexural strength in reinforced concrete members caused by steel corrosion. Constr Build Mater. 2014;54: doi: /j.conbuildmat [7] Meda A, Mostosi S, Rinaldi Z, Riva P. Experimental evaluation of the corrosion influence on the cyclic behaviour of RC columns. Eng Struct. 2014;76:
166 Corrosion behavior of OPC, PPC and PSC based concretes in harsh marine environment through electrochemical impedance spectroscopy Sharan Kumar, B B Das * and S B Arya NITK, Surathkal , India * bibhutibhusan@gmail.com Abstract The present investigation aims to find the effectiveness of OPC, PPC and PSC based concretes against corrosion resistance in harsh marine environment by implying electrochemical impedance spectroscopy (EIS) technique. Two immersion periods(30 and 90 days)and two levels of ph (1 and 7) were considered and the experiment was conducted simulating the marine environment. From the studies of electrochemical impedance and corrosion resistance, it is observed thatpsc based concretes were superior to PPC and OPC based concretes. It is also found that the compressive strength gains in OPC based concretes were much faster during initial curing periods, but as the curing period reached 120 days PPC and PSC based concretes also reached comparable strengths to that of OPC based concrete. Keywords Corrosion, impedance, marine environment, ph. 1 INTRODUCTION One of the crucial challenge for civil engineering community in recent years is assessing, monitoring and reducing the deterioration of reinforced concrete structures in aggressive environment such as marine environment [1]. In order to enhance the durability properties of reinforced concrete, research fraternity is at its full pace to find the alternative materials by minimizing the possible use of natural resources to a large extent [2]. One such attractive method is use of blended cements (Portland pozzolana cement-ppc and Portland slag cement-psc) over conventional ordinary Portland cement (OPC). The use of blended cements is increasing day by day, 67% of the total cement production in India is PPC, followed by OPC (25%) and PSC (8%) [3]. A positive trend towards the increasing use of blended cement is noticeable with the share of blended cement increasing to 75%. As the usage trend of blended cement is increasing, it becomes necessary to understand their significance towards the durability enhancement, especially towards the corrosion resistance when exposed to aggressive conditions. The prime objective of the present investigation is to find the effectiveness of OPC, PPC and PSC based concretes against corrosion resistance in harsh marine environment through EIS technique. 2 RESEARCH SIGNIFICANCE The present investigation helps to understand the effectiveness of OPC and blended cements (PPC and PSC) in harsh marine environment against corrosion resistance. The impedance of OPC, PPC and PSC based concretes were accessed through exposure studies (30, 60 and 90 days) by EIS. The compressive strength development of OPC, PPC and PSC concretes were also analyzed. 3 MATERIALS AND METHODS In the present study three types of commercially available cements namely OPC, PPC and PSC were used. M40 grade concrete was designed according to the specifications mentioned in IS: with w/c of 0.4, cement content 380 kg/m 3, sand 817 kg/m 3, coarse aggregates 1105 kg/m 3 and super plasticizer 0.5% of cement content. The sample used for corrosion testing was represented in Figure 1. After 28 days of normal curing, the specimens were immersed in 3.5% NaCl solution maintained with 1pH and 7pH. The exposure periods were set for 30 and 90 days. At the end of each exposure period, their performance was accessed by measuring the impedance and corrosion rate using potentiostat equipped with an impedance analyzer. Figure 1. Schematic representation of sample used for corrosion measurements (rebar diameter 10 mm) 129
167 4 RESULTS AND DISCUSSIONS 4.1 Compressive strength The hydration process in OPC concrete was faster during initial curing period, which reflected in high early compressive strength (refer Table 1). Whereas, at 120 days of normal curing the compressive strength of OPC concrete was only 2.9% and 5% higher than that of PPC and PSC concretes respectively. The pozzolanic reactions in PPC and PSC cements takes little extra time to activate hence can be attributed to low early strength. However, after 56 days of curing the noticeable increments in compressive strength were observed for PPC and PSC concretes. Table 1. Compressive strength of all the samples Sample Curing period (days) OPC PPC PSC Impedance analysis by EIS The Nyquist plots in Figure 2 are the fitted curves in EC-Lab software according to the equivalent electrical circuit as in [4]. Figure 2. Nyquist plots of OPC concrete in 3.5% NaCl + 1pH solution The impedance spectra (Figure 2) clearly indicates that, as the immersion period increased the resistance of OPC concrete tends to reduce because of diffusion of Cl - and H + ions in to the concrete.ph of the solution has a decisive influence on the impedance as well as corrosion rate of all the samples. 3.5% NaCl + 1pH solution, was more aggressive which resulted ingress of harmful ions were much faster, due to which the total impedance of all the samples reduced significantly when compared to 3.5% NaCl + 7pH solution. Table 2 shows the simulation results of impedance spectra with respect to equivalent electrical circuit. The total impedance of OPC concrete (17112ohm cm 2 ) at 30days of immersion in 3.5% NaCl + 7pH was better compared to PSC (16145ohm cm 2 ) and PPC (14528ohm cm 2 ) concrete, which might be due to development of high early strength. However, the impedance of PSC concrete can be better compared to OPC and PPC concrete at 30days of immersion in 3.5% NaCl + 1pH.Among all three cement types, PSC resulted to lower corrosion rate. At 90 days of immersion, the impedance values of all three concretes reduced significantly specially in 3.5% NaCl + 1pH solution, but PSC concrete showed comparatively better resistance/impedance and lower corrosion rates compared to PPC and OPC concrete. Table 2. Total impedance (R t) and corrosion rate of the samples immersed in 3.5% NaCl + 1pH and 3.5% NaCl+ 7pH Sample Total impedance Rt (ohm-cm 2 ) Corrosion rate (mpy) 1pH 7pH 1pH 7pH OPC [30] PPC [30] PSC [30] OPC [90] PPC [90] PSC [90] [30] and [90] - designates 30 days and 90 days immersion 5 CONCLUSION The compressive strength gains in OPC based concretes were much faster during initial curing periods, but as the curing period reached 120 days PPC and PSC based concretes also reached comparable strengths to that of OPC based concrete. At 30 days of immersion in 3.5% NaCl + 7pH solution, OPC concrete showed better impedance and lower corrosion rate. PSC concrete performed better in aggressive solution 3.5% NaCl + 1pH, at all the immersion periods. Overall, PSC concrete proved to have the better impedance and lower corrosion rates in aggressive media, followed by PPC and lastly OPC. 6 REFERENCES [1] Cyr M. (2013), "Influence of supplementary cementitious materials (SCMs) on concrete durability", Eco-Efficient Concrete, pp [2] Mehta P. K. (2002), Greening of the concrete industry for sustainable development, Concrete international, Vol. 24(7), pp [3] 95th Report on Performance of Cement Industry (2011), Department Related Parliamentary Standing Committee On Commerce, Rajya Sabha Secretariat New Delhi, February, Phalguna. [4] Jain J. and NeithalathN. (2011), "Electrical impedance analysis based quantification of microstructural changes in concretes due to nonsteady state chloride migration", Materials Chemistry and Physics, Vol. 129, pp
168 Electrochemical Studies for Establishing A Two-Stage Corrosion Arrest Process for Steel Reinforcement Nikita Rathod 1,2*, Gamini Seneviratne 1, George Sergi 1 and Peter Slater 2 1 Vector Corrosion Technologies 2 University of Birmingham *nikitar@vector-corrosion.com Abstract Electrochemical Treatment of steel reinforced concrete is known to establish a long-term beneficial effect, reducing or eliminating corrosion. Work has been carried out to understand the beneficial effects by applying various charge densities to small steel-mortar specimens with different levels of chloride contaminated mortar. At relatively low charge levels, corrosion was arrested but was sometimes shown to reestablish itself. To avoid eventual re-corrosion, a small level of current density of 0.2-2mA/m 2, levels described in standards as cathodic prevention, could be subsequently maintained. This work provided critical understanding of steel polarisation parameters which allowed a design of a two-stage electrochemical process for the protection of steel reinforcement. Keywords - Electrochemical treatment, Corrosion arrest, Steel reinforcement. 1 INTRODUCTION Electrochemical techniques have established a good reputation since the 1970 s at treating the steel reinforced concrete from corrosion. Treatments such as electrochemical chloride extraction and cathodic protection can eliminate corrosion of the reinforcing steel [1]. Much research has been carried out to understand the fundamentals of these electrochemical techniques, ranging from understanding the effects on the microstructure and the bulk of the steel concrete interface to understanding the essentials of applying electrochemical techniques [2,3]. Earlier research in the group has shown that various charge levels are required to passivate different levels of chloride contamination of steel-mortar specimens. The steel was polarized for a short period, using a current density of 30mA/m 2, and then depolarized for 48 hours. To passivate the steel, the 2% chloride contaminated mortar required 120kC/m 2, whereas the 3% chloride contaminated specimens required 190 kc/m 2. However, it was noted that whilst corrosion was initially arrested, often it was show that corrosion would re-establish itself. This paper describes the work carried out to help understand at a deeper level, the beneficial effects using various charge densities in different environments. 2 RESEARCH SIGNIFICANCE The standards for electrochemical treatments only suggest using a certain range of current densities, usually between 2-20mA/m 2 for cathodic protection and A/m 2 for chloride extraction. This does not take into consideration variable chloride content or the charge level required for steel passivity to be maintained. This research investigated, using a range of chloride contaminated steel-mortar specimens, the different criteria required to obtain and maintain passivity of the steel. This extended knowledge has allowed a design of a two-stage electrochemical process for the long-term protection of steel reinforcement. 3 MATERIALS AND METHODS Several small steel-mortar specimens (Fig. 1) were prepared which contained 2% or 4% chloride by weight of cement. These specimens were subjected to a negative cathodic current of 50mA/m 2 for 5 days after which the steel was allowed to depolarize over the next 2 days. This cycle was repeated weekly. The specimens were monitored to determine the level of charge required for passivity of the steel to occur. When the steel specimens reached passivation, signified by a potential less negative than 150mV (SCE), they were subjected to an anodic current density of 820μA/cm 2 to find out how much charge is required for the passive film on the steel to break down. 4 EXPERIMENTAL PREPARATION Steel plates were embedded in the middle of the mortar; an area of 8.55 cm 2 of steel was exposed in the center and the rest of the area was masked. Titanium mixed metal oxide counter electrodes were used to supply cathodic current to the exposed area of steel, embedded in the mortar above the exposed steel. Portland cement, sand and water were mixed in the ratio of 1:3:0.5; the mixture was cast around the steel plate. A separate chloride containing mortar mix (2%, 3% or 4% of chloride by weight of cement) was cast above a limited area of the exposed steel plate in such a way as to avoid crevice corrosion. 131
 reduces the")


169 Figure 1. Schematic diagram of steel mortar specimens 5 RESULTS AND DISCUSSION The results, Table 1, demonstrate that applying a higher current density to the steel (50mA/m 2 compared to 30mA/m 2 ) reduces the total charge required to passivate the steel for a given chloride level. This relationship is also dependent on chloride content; more charge is required for passivation as the chloride content increases. Table 1. Charge required to passivate steel in various conditions 50 ma/m 2 30 ma/m 2 2% Cl 4% Cl 2% Cl 3% Cl Charge require to passivate steel ( kc/m 2 ) After passivity was achieved an anodic current of 820μA/cm 2 was applied until breakdown of the passive film. The passive film failed in each case at relatively low anodic charges, indicated by a sharp decrease in potential. Another set of specimens containing 3% chloride were subjected to a cathodic current density of 0.5A/m 2 of cathodic current density over a much larger time period representative of the electrochemical chloride extraction process achieving substantial passivation of the steel. These were also subjected to galvanostatic anodic polarization until failure of the passive film. All the results are plotted in Figure2. Although the results exhibit large scatter, generally the larger the cathodic charge applied to steel the more anodic charge was required to subsequently break down the passive film. What was more impressive, a year after the destructive galvanostatic runs the majority of the 3% chloride specimens had reverted back to a passive state. This suggests that apart from re-passivating the steel, a continuous large cathodic charge builds up a strong and resilient passive layer that can resist breakdown. It is known, however, that applying a large cathodic charge to steel can lead to detrimental effects on the bulk concrete or at the steel/concrete interface [2,3]. A small cathodic charge of around kc/m 2 was shown to be sufficient in most cases to passivate the steel short-term but longer-term, corrosion is likely to reestablish itself. What was also shown elsewhere is that a small cathodic prevention current of the order of ma/m 2 can maintain passivity of the steel for as long as the small cathodic current is applied. This points very strongly to the possibility of establishing a twostage corrosion mitigation technique where first, the corrosion of the failing steel reinforcement is arrested by applying a minimum but sharp cathodic charge followed by a second stage of continuous small cathodic current density to maintain the passive state. Figure 2. Relationship between applied cathodic current to passivate the steel and anodic current to break down passive film. 6 CONCLUSION A cathodic charge level of 840 kc/m 2 or greater was shown to substantially arrest corrosion of steel longterm. However, the use of these high charge levels would not be practical as damage can be caused to the steel concrete interface and microstructure [3]. To maintain the effects of the corrosion arrest stage, a smaller initial charge in the range of kC/m 2 at a current density in the region of ma/m 2 is sufficient to obtain passivity of the reinforced steel but it must be followed by a small cathodic prevention current of the order of ma/m 2 in order to prevent corrosion from re-establishing itself. This strongly points to the possibility of a twostage cathodic protection system to eliminate corrosion of reinforced steel in chloride contaminated concrete. 7 ACKNOWLEDGEMENTS The authors would like to acknowledge the support from Vector Corrosion Technologies and University of Birmingham, and their contribution towards the research. 8 REFERENCES [1] Orellan J.C, Escadeillas G, and Arliguie G. (2004),, Cem Concr Res. Vol. 3, pp [2] Koleva DA, Guo Z, Van Breugel K and De Wit JHW. (2010), Mater Corros. Vol. 61, pp [3] Chang JJ, Yeih W and Huang R. (1999, J Mar Sci Technol. Vol. 7, pp
170 Enhancement of biodeterioration resistance on fly ash concrete through nanoparticles inclusion for marine applications Sudha Uthaman 1, Vinita Vishwakarma* 1, D. Ramachandran 1, Rani. P. George 2, M. Premila 3, Rajaraman 3 and U. Kamachi Mudali 4 1 Centre for Nanoscience and Nanotechnology, Sathyabama Institute of Science and Technology, Chennai 2 Corrosion Science and Technology Group, IGCAR, Kalpakkam 3 Materials Science Group, IGCAR, Kalpakkam 4 Heavy Water Board, Mumbai * vinitavishwakarma@sathyabama.ac.in Abstract This present study aims at developing modified fly ash concrete through nanophase inclusion to overcome the flaws associated with conventional fly ash concrete. Four types of concrete mixes, namely, fly ash concrete (FA), fly ash concrete modified with TiO2 (FAT), fly ash concrete modified with CaCO3 (FAC) and fly ash concrete modified with TiO2 and CaCO3 (FATC) were prepared by replacing 2% of ordinary Portland cement by nanophase TiO2, CaCO3 and TiO2:CaCO3 together. After 28 days of curing, specimens were exposed to sea water at Nuclear Desalination Demonstration Plant (NDDP) pump house sump, Kalpakkam and withdrawn periodically. The key durability parameters of concrete were monitored and the results are given in detail. Keywords - Concrete, deterioration, nanophase modification, durability 1 INTRODUCTION Fly ash is used in concrete as a cement replacement to improves the durability and strength by pozzolanic and filler effects [1]. Vinita et al has reported that FA concrete showed superior properties to normal and superplasticizer modified concrete. However, their studies also showed that there are some problems with respect to FA concrete which needs improvement for better performance [2]. In this study, it has been planned to fabricate modified fly ash concrete by the incorporation of nanoparticles. Thus, the main objective of this work is the nanophase modification of fly ash concrete with nanoparticles such as TiO 2, CaCO 3 and equal quantity of TiO 2:CaCO 3 for enhancement of biodeterioration resistance. 2 RESEARCH SIGNIFICANCE Most of the investigations focused on the advantages of fly ash concrete and some of the investigations were on the effect of nanoparticles addition in conventional concrete. There are very few works are reported on the addition of nanoparticles in fly ash concrete. Hence in this study, it was proposed to incorporate nanoparticles in fly ash concrete to obtain the synergistic effect of both the fly ash and nanoparticles. 3 MATERIALS AND METHODS Four different types of concrete mixes were fabricated as per IS 8112:1989 and designated as fly ash concrete (FA), FA with 2% nano-tio 2 (FAT), FA with 2% CaCO 3 (FAC) and FA with 2% TiO 2: CaCO 3 (FATC). 3.4 Specimen preparation and exposure The cube specimens of mm, cylindrical specimens of 35 mm diameter 10 mm thickness and 90mm diameter 15mm thickness were casted. After 24 hours of casting, all specimens were cured for 28 days in freshwater in laboratory atmosphere and exposed to seawater for 365 days. 4 RESULTS AND DISCUSSION 4.1 Enumeration of viable bacteria The total viable bacterial cell count of biofilm scraped from the surface of concrete specimens exposed to seawater is shown in Figure 1. It was observed that the viability of bacteria cells was increased with time. After 365 days of exposure, all the nanophase modified fly ash concrete specimens were observed to have less population of bacteria, compared to FA concrete specimen. Among all the nanophase modified concrete specimens, FAT (5.3x10 7 ) followed by FATC (9.1x10 7 ) concrete specimens showed less viable cells compared to FA (2.7x10 9 ) and FAC (1.5x10 9 ). 4.2 Confocal Laser Scanning Microscopy (CLSM) The tile scan and 3-D images (ZZ) of AO stained bacterial biofilm are given in the Figure 2. It is clearly evident that FAT specimens proved their promising antibacterial resistance. Although the surface of FATC 133


![Figure 4). The presence of partially transformed sulphur particles on FATC concrete specimen confirmed the delayed onset of biofilm on these specimens compared FA concrete specimens [3]. Figure 1.](/docs-images/78/76861956/images/171-3.jpg "TVC of concrete specimens exposed to seawater Figure 4. Raman spectrum of sulphur particle on 365 days sea water exposed surface of FATC concrete Figure 2.")
 The assessment of microbial diversity in the biofilm scraped from the different mixes of concrete surface was performed and the results are shown in")
171 mortar specimens showed more intense fluorescence, the bacterial attachment was not observed on the entire surface. However, the FA and FAC specimens were also observed with fluorescence on all over the surfaces indicating more deterioration than FA specimens. Raman spectra collected at random spots of the seawater exposed concrete samples do not show any major changes as compared to unexposed samples (Figure 4). However, it was interesting to note that after 365 days of sea water exposure, FAC, FAT and FATC specimens revealed white micron sized particulates in clusters on their surfaces (Inset image of Figure 4). The presence of partially transformed sulphur particles on FATC concrete specimen confirmed the delayed onset of biofilm on these specimens compared FA concrete specimens [3]. Figure 1. TVC of concrete specimens exposed to seawater Figure 4. Raman spectrum of sulphur particle on 365 days sea water exposed surface of FATC concrete Figure 2. Confocal microscopic 3D images of bacterial culture exposed, AO stained mortar specimens (a) FA (b) FAT (c) FAC (d) FATC 4.3 Denaturing Gradient Gel Electrophoresis (DGGE) The assessment of microbial diversity in the biofilm scraped from the different mixes of concrete surface was performed and the results are shown in Figure 3. V3 regions in the analysis showed the bacterial community difference in the order of FA>FAC>FAT>FATC confirming the antibacterial activity of FAT and FATC. Figure 3. DGGE electrophoretograph of 16S rrna (V3 region) of mortar specimens exposed to seawater 4.4 Laser Raman Spectroscopic study 5 CONCLUSION An attempt was made to study the effect of enhanced biodeterioration resistance of nanophase modified fly ash concrete with 2 wt% of nano-tio 2 (FAT), 2 wt% of nano-caco 3 (FAC) and 1:1 wt% of both nano-tio 2 and nano-caco 3 compared to fly ash concrete (FA). In all the aspects, nano-tio 2 modified concrete specimen is observed to be more resistant to biodeterioration. Following this, fly ash concrete modified with 1:1 wt% of both TiO 2 and CaCO 3 nanoparticles was more effective than FAC and FA. 6 ACKNOWLEDGEMENTS Financial support from Board of Research in Nuclear Sciences (BRNS), Mumbai (2013/36/33-BRNS/2355) is greatly acknowledged. Sincere thanks to Chancellor Sathyabama Institute of Science and Technology, Chennai and Director, IGCAR, Kalpakkam for guidance, encouragement and motivation. 7 REFERENCES [1] Gengying Li. (2004), Cement and Concrete Research, Vol. 34, pp , (2004). [2] Vinita Vishwakarma, R.P. George, D.Ramachandran, B. Anandkumar and U Kamachi Mudali. (2014), Journal of Environmental Technology, Vol. 35, pp.42 51, (2014). [3] J. V. Garcia-Meza, R. H. Lara, and H. R. Navarro- Contreras. (2012), International Journal of Spectroscopy, Article ID , pp
172 Studies on high performance green mortars with enhanced biofouling resistance by incorporating nanoparticles and inhibitor Manu Harilal 1, 2, Sudha Uthaman 3, R.P. George 2*, B. Anandkumar 2, John Philip 1, 2 and U. Kamachi Mudali 4 1 Homi Bhabha National Institute, Mumbai 2 Corrosion Science and Technology Division, IGCAR, Kalpakkam 3 Centre for Nanoscience and Nanotechnology, Sathyabama Institute of Science & Technology, Chennai 4 Heavy Water Board, Mumbai *rpg1961@gmail.com Abstract - This study attempts to develop a high performance concrete with improved biofouling resistance by using a combination of fly ash, nanoparticles and corrosion inhibiting admixture. Four different mix proportions of mortars were designed and named as Control concrete (CC), concrete with 40 wt.% fly ash (CF), fly ash concrete with addition of 1 wt.% nano-tio2 and 1 wt.% nano-caco3 (CFN) and fly ash concrete with addition of 1:1 nano-tio2 and nano- CaCO3 and admixed with 2 wt.% sodium nitrite based corrosion inhibitor (CFNI). The specimens were then cured in fresh water for 28 days and exposed in seawater for 180 days. The bacterial density analysis indicated the least bacterial count on CFNI specimen surface. The biochemical tests and biomass estimation confirmed the reduced bacterial attachment over CFNI surface as compared to other three specimens, which was further confirmed from Epifluorescence microscopy. Our results confirmed the synergic effect of nanoparticles and inhibitor in enhancing the biofouling resistance of concrete. Keywords: Concrete, biofouling, Epifluorescence 1. INTRODUCTION Biogenic deterioration is a major issue in submerged structures. As a result of microbial activity, sulphuric acid is produced and reacts with components inside concrete to form expansive low-strength products. This is believed to be the underlying mechanism of concrete deterioration that weakens the structural integrity of concrete and thus its life [1]. Vinita et.al [2] has reported that fly ash modified concrete had shown an improved resistance against microbial deterioration when exposed in seawater. Incorporation of nanomaterials into concrete matrix even at small quantities results in improved biodeterioration resistance and increased durability of concrete structures [3]. It was also reported that the addition of corrosion inhibiting admixture to concrete can highly improve the resistance of reinforcing steel against deterioration in aggressive and harsh environments [4]. 1 RESEARCH SIGNIFICANCE Many researchers have reported the effect of fly ash and nanoparticles in improving the biodeterioration resistance of conventional concrete. However, in this study, it is planned to add inhibitor to nanophase modified fly ash concrete to further improve the corrosion resistance of the reinforcements. This research work focuses on a detailed investigation on the synergy between fly ash, nanoparticles and corrosion inhibiting admixture in the development of biodeterioration resistant HPC. 2 MATERIALS AND METHODS Four different mixes of mortar specimens of M45 grade were prepared and designated as control concrete (CC) with 100% OPC, CC replaced with 40 wt. % fly ash (CF), CF with addition of 1 wt. % TiO 2 and 1 wt. % CaCO 3 nanoparticles (CFN) and CFN with addition of 1:1 wt. % TiO 2 and CaCO 3 nanoparticles and admixed with 2 wt. % sodium nitrite based corrosion inhibitor (CFNI). The mix ratio of 1:3 for cement and sand was adopted for casting the mortar specimens. All the specimens were casted, cured and then exposed to seawater for 180 days. 3 RESULTS AND DISCUSSION 3.1 Visualization of surfaces & estimation of biomass The seawater exposure studies have shown that the extent of biofouling over the surface of CFNI specimens is the least among all mixes. Figure 1 shows the biofouling over the surface of the specimens after an exposure period of 180 days. The biomass formed over the surface of the specimens was estimated and reported as biomass values (g. per 100 cm 2 ). The CFNI specimen had the lowest biomass value 135
 and Total Suspended Solids (TSS) present in the biofilm were also calculated and found to be the lowest for CFNI specimens.")


173 (0.155 g/100 cm 2 ) in comparison to other mixes. Total dissolved salts (TDS) and Total Suspended Solids (TSS) present in the biofilm were also calculated and found to be the lowest for CFNI specimens. Table 1 shows the details of biomass and biodensity for all the mixes. viability count in CFN and CF specimens were in between CFNI and CC specimens. 3.3 Epifluorescence microscopic studies The Epifluorescence micrographs of all the specimens are shown in figure 3. The micrographs showed that control specimens had more orange fluorescence indicating more bacterial attachment on the surface compared to modified mortar specimens. The least biofilm formation was observed on CFNI specimens followed by CFN specimens as evident from the presence of more green fluorescence indicating inactive cells. Figure 1. Mortar specimens after 180 days of exposure in seawater Table 1. Details of biomass, TDS & TSS of all mixes Sl. No Type of specime n Biomass value (g/100 cm 2 ) TSS (mg/ cm 2 ) TDS (mg/cm 2 ) 1 CC CF CFN CFNI Quantification of bacterial viability The total bacterial density of the biofilm scrapped from the specimen surfaces was calculated by the determination of Total Viable Count (TVC) with the help of culture techniques using seawater agar (SWA) and Pseudomonas agar (PSA) and is shown in figure 2. Figure 2. TVC of mortar specimens exposed in seawater After 180 days of exposure in seawater, it was observed that among all the mixes, CFNI mix showed the least bacterial count in SWA (5.63 x 10 6 ) and PSA (6.18 x 10 5 ). CC specimens had the highest bacterial count in SWA (4.78x ) and PSA (6.24 x 10 9 ). The bacterial Figure 3. Epifluorescence micrographs of mortar specimens a) CC b) CF C) CFN & d) CFNI 4 CONCLUSION A high performance M45 grade concrete with enhanced biofouling resistance was developed through the incorporation of fly ash, nanoparticles and corrosion inhibitor into conventional concrete. The synergy between the additives in enhancing the concrete properties was established. CFNI mix exhibited superior resistance against microbial attack and biofouling among all mixes. 5 REFERENCES [1] Noeiaghaei, T., Mukherjee, A., Dhami, N., & Chae, S. R. (2017). Construction and Building Materials, 149, [2] Vishwakarma, V., Biofilm Formation and Thermographic evaluation of Fly Ash concrete in sea water Concrete Research Letters, 3(2) [3] A. Peyvandi, P. Soroushian, A.M. Balachandra, K. Sobolev,(2013) Enhancement of the durability characteristics of concrete nanocomposite pipes with modified graphite nanoplatelets, Construction and Building Materials, 47, [4] Ormellese, Marco, Mario Berra, Fabio Bolzoni, and Tommaso Pastore. Corrosion inhibitors for chlorides induced corrosion in reinforced concrete structures. Cement and Concrete structures, 36(3) (2006)
174 Comparative Study on Strength Enhancement of Concrete Using Magnetic and Normal Water P.Sivakumar 1, A. Praveen Frank Tub 2 and D.Usharani 1 1 Oasys Institute of Technology 2 Imayam College of Engineering *kps.siva222@gmail.com Abstract The most important challenge for concrete Technologists are to improve the properties of concrete. In the last two decades, in Russia and China, a new technology, called magnetic water technology, has been used in the concrete industry. In this technology, by passing water through a magnetic field, some of its physical properties tends to change and, as a result of such changes, the number of molecules in the water cluster decreases from 13 to 5 or 6, which causes decrease in the surface tension of water, with an improvement in the workability and strength of concrete. Magnetic treatment of water increases the ion solubility and PH. The influence of magnetic flux changes the mode of calcium carbonate precipitation such that circular disc-shaped particles are formed rather than the dendrite (branching or tree-like) particles observed in non-treated water. This technique is mostly used for the softening of water and, for the first time in this research, it has been adopted by the scientists for the production of concrete with improved strength. Some researchers hypothesize that magnetic treatment affects the nature of hydrogen bonds between water molecules which increases the ph and softens the water. From the referred literature, it has been observed that the concrete made with magnetic water has higher slump values. Also in some cases, the compressive strength of the magnetic concrete samples was higher than that of the control concrete samples (up to18%). The cement content can be reduced by28% in the case of magnetic concrete. Result of our project shows increase in compressive strength of concrete around 20% for non re circulated magnetic water specimen and it ranges 25% in case of re circulated magnetic water specimens. Similarly the test conducted on re circulated magnetic water shows change in ph value from 7.8to 8.7 with increase in recirculation time. The hardness also reduced from 310 to 190 mg/lit due to recirculation of magnetic water concrete to obtain a concrete with desired property. But in most of the cases these admixtures are added to get concrete with increased strength. The chemicals that are required for increasing the strength will be rarely available in rural areas and it will cost more in case of large projects. The usage of magnetic water while mixing concrete will increase compressive strength and also there will be higher workability for the same water cement ratio. Many researchers proved that the scaling property and corrosion phenomenon in magnetic water is greatly reduced if the water is passed through an intense magnetic flux which in turn changes the physical structure of water molecules and softens the hard water. This softening intensity is based on the magnitude of flux induced. To achieve higher intensity and magnetization, water is made to re calculated by designing setup with motor and auto transformer. The initial research and scientific testing regarding the application of a magnetic field to concrete manufacturing were commenced in Russia in1962 for military constructions such as airports and jetties. This research was continued step by step in other institutes, such as the VNLL Jelezobeton Research and Scientific Institute in Russia, and some positive results were found in this regard. Magnetic devices include one or more permanent magnets, which induce changes and effects on ions and molecules. A magnetic field has a considerable effect on clusters of water molecules and causes the decrease of such a decrease of molecules causes more participation of Water molecules in the cement hydration reaction. Also, when water is mixed with cement, cement particles are surrounded by water molecule. 2. RESEARCH SIGNIFICANCE 1. INTRODUCTION In general, adding certain chemicals while mixing concrete is practiced to alter the properties of 137


175 3. MATERIALS AND METHODS When the PERMAG units are fitted on a pipeline, the water flowing through the pipe line is subjected to the intense, focused magnetic field. The strong magnetic field, affects the physical structure of the minerals, thereby altering their shape. There is no chemistry involved, only physics. The minerals continue to remain in the water, but now, the altered physical state prevents the minerals from exhibiting hardness, thus the Water becomes soft. Water is a liquid, chemically called H 2O. If we freeze water, it becomes ice, which is a solid, but it is still Chemically, H 2O. If we boil it, it becomes a vapor, but Chemically it is still H 2O. Water transforms from a liquid to ice, to a vapor (and vice versa), thus exhibiting 3 Distinct physical states, while it is still the same chemical. PERMAG performs in a similar manner, by changing the physical state of the minerals, while maintaining their Chemical state. These structurally changed minerals do not stick to any surface and remain suspended in the water in an inactive state and thus exhibit the soft water nature. 3.1 What are the details that can be included? In this process the water is recalculated for one hour to induce magnetic flux in the water by the action of applied magnetic field. This recalculated water is used for the casting of concrete specimens. The setup to achieve the above mentioned process includes Autotransformer, 0.5HP General purpose Motor, Permag N406. The autotransformer is used to reduce the supply voltage of the motor, this controls the flow of water in the setup. By this process the hardness in the water is reduced, this enhances the resistance to corrosion of steel reinforcement. The recirculating set up shown above consists of a motor (0.5 HP) which performs the action of lifting water from the container and then make the water to flow through the magnetic flux which is fixed around the tube as shown in.this process of lifting water from the container and allowing it to flow through the magnetic flux is repeated for certain period of time. By doing so the effect of flux induction will be more in water so that the harness in water reduces more. It is also illustrated in literature that the flow velocity should be around m/s, so the instrument named auto-transformer is used in the setup to reduce and Maintain the flow velocity within the range specified. 4. RESULTS AND DISCUSSION By conducting various test on the concrete specimens, compressive strength obtained is quite high when compared to normal concrete specimens up to 25%. The increase in strength with the help of re circulated magnetic water is much higher than the magnetic water(without re circulation The ph value gradually increases with increase in recirculation time which reduces the rate of corrosion. Hardness also considerably decreases with increase in recirculation time. 5. REFERENCES [1] K. M., Joshi, and P. V. Kamet, (1966) Effect of Magnetic Field on the Physical Properties of Water Pages ( ). [2] K. J., Kronenberg, (1985) Experimental Evidence for Effects of Magnetic Fields on Moving Water Pages ( ). [3] Coey JM (2000). Magnetic Water Treatment. J. Mag Mater., 209: [4] B. N. Ke and X. La, Magnetization of water, Measurement Press, Beijing, 1982, pp
176 Analysis of Cathodic Protection Design Criteria for Embedded Steel Reinforcement in Prototype Structure Hirudayasamy Dolli*, Andiappan Kavitha, Lily flora and Selvamani Department of chemistry, Veltechmultitech Dr.Rangarajan Dr.Sakunthala Engineering College, Chennai , India Abstract - This paper presents the results of performance of sacrificial protection in preventing the rebar corrosion in chloride contaminated and chloride free concrete. In this present study, the effectiveness of sacrificial protection of embedded steel rebars has been evaluated in prototype structure under chloride contaminated and chloride free concrete slabs using ribbon type Zinc anodes with ion conductive polymer backfill over a period of 250 days of exposure. The results showed that the ribbon type zinc sacrificial anodes with the navel electrochemical interface (Ion conductive polymer backfill) can confer effective corrosion protection of embedded steel in concrete on preventing corrosion initiation in chloride contaminated as well as chloride free concretes structures. The cathodic protection criteria evaluated on concrete unit slab showed that mV is necessary for the effective corrosion protection of steel reinforcements in the atmospheric exposure and mV under alternate wetting & drying conditions. Keywords - Reinforced Concrete, Prototype structure, Sacrificial Protection, Ribbon type Anode, Ion Conductive Polymer Backfill, Sacrificial Anode 139
177
178 SMART, ORGANIC AND INORGANIC COATINGS
179
180 Superior Anticorrosive Properties in Epoxy Coating Through Waste Utilization Aparna Agrawal *, Shweta Amrutkar, Aarti More, Dr. S.T. Mhaske Institute of Chemical Technology, Mumbai Abstract One of the most seen chemistries for anticorrosive coatings is the epoxy-amine system. In this paper, the anticorrosive performance of this system was further enhanced by incorporation of ash of waste fruit seeds like jackfruit (Artocarpus heterophyllus) seed, muskmelon (Cucumis melo) seed and jamun (Syzygium cumini) seed. The ash was synthesized by calcination in a muffle furnace maintaining the temperature at 800 C for 2 hours. Later, the ash was surface treated using aminosilane to introduce amine functionality to its surface. FTIR analysis was used for confirmation of the surface treatment. The coating was synthesized using various concentrations of the ash viz. 1%, 3% and 5% (w/w) of the total binder system. The coatings were subjected to various mechanical tests and the salt spray test for performance evaluation which was found to be superior to the parent epoxy coating. The ash acts as filler which increases the hardness of the coating. The presence of inorganic elements such as Fe2O3, SiO2, MgO, Al2O3 in the ash increases the anticorrosive performance of the coating. Keywords Waste seeds; ash; anticorrosive coating; surface treatment; epoxy INTRODUCTION Epoxy resins are widely used for anticorrosive applications because of their properties like good adhesion, good mechanical properties, good dimensional stability and excellent resistance against various chemical attacks [1, 2]. But highly crosslinked epoxy resins find limitations due to their brittle and hydrophilic nature which can be overcome by adding a thermoplastic or elastomer [3]. Here, we have used ash modified by N-(2-amino ethyl)-3- aminopropyltrimethoxysilane to blend with epoxy which also provides amine functionality. Numerous researches have been carried out till date to improve anti-corrosive properties of epoxy. These researches have made use of inorganic particles like silica which are quite expensive [4]. RESEARCH SIGNIFICANCE The ashes from waste fruit seeds containing inorganic oxides can prove to be innovative fillers for the epoxy coating system. MATERIALS AND METHODS Waste fruit seeds were obtained from the local market and calcinated in a muffle furnace at 800 C for 2 hours and then cooled to room temperature. The obtained ash was surface treated with aminosilane namely N-(2-aminoethyl)-3-aminopropyltrimethoxysilane obtained from Wacker by stirring 10% (w/w) of the aminosilane with a magnetic stirrer at 120 C for 24 hours with Toluene as solvent. ATR-FTIR analysis was performed and the presence of bonds like O-Si-O, MgO and CaO confirmed the surface treatment. Further, the coating was synthesized using epoxy resin as base resin and polyamine as its hardener, both obtained from DOW Chemicals. They were added in the coating system in the ratio of 10:3 by weight. The ash systems were prepared by adding ash into the epoxy resin by varying its concentration as 1%, 3% & 5% (w/w).the ashes were dispersed into the resin by stirring for 1 hour using an overhead stirrer. After stirring, polyamine hardener and the solvent mixture were added. A mixture of xylene and n- butanol was used as solvent media for the coating system. The prepared coating was then applied to the panels. These panels were kept for curing at room temperature. The coatings were subjected to various mechanical, chemical and anticorrosive analyses as listed in the results section. All the tests are performed as per ASTM standards. RESULTS AND DISCUSSION F1 Jackfruit Seed Coating System; F2: Muskmelon Seed Coating System; F3: Jamun Coating System 4.1 Results for Mechanical Analysis The tests carried out were as follows: DFT (µm) [Test 1] Gloss [Test 2] Cross hatch adhesion [Test 3] Pencil Hardness [Test 4] Scratch Hardness (kg) [Test 5] Impact Resistance (kg-cm) [Test 6] Flexibility (mm) [Test 7] The results of all the tests are shown in the table 1 below. It can be observed that the properties of ash systems are superior in mechanical properties than the plain epoxy system. 140


181 Table 1. Results of Mechanical testing Plain Test 1% F3% F1 5% F1% F3% F2 5% F1% F3% F3 5% F Epoxy 1 120±5120±5120±5120±5120±5120±5120±5120±5120±5120± B 5B 5B 5B 5B 5B 5B 5B 5B 5B 4 2H 3H 3H 4H 3H 3H 4H 3H 3H 4H FI BI m m Epoxy F F F 1 F m m 0 mm0 mm0 mm0 mm0 mm0 mm0 mm0 mm 0 0 m m Table 2. Results of the salt spray test for all Coating Systems Plain 1% 3% 5% 1% 3% 5% 1% 3% 5% mm F F F Plain 1%F1 3% F 1 5% F 1 1% F2 3% F2 5% F2 1% F 3 3% F 3 5% F 3 Plain 1%F1 3% F 1 5% F 1 1% F2 3% F2 5% F2 1% F 3 3% F 3 5% F 3 F F Results for Chemical Analysis All the systems (including plain epoxy) were found to have excellent spot reistance for acid (10% HCl) and Alkali (10% NaOH). The value of rub resistance for solvent MEK and Xylene was found to be more than Results for Anticorrosive Analysis The anticorrosive properties are evaluated by salt spray test according to ASTM % NaCl solution was used for spraying. CONCLUSION The ashes were prepared from waste seeds of Jackfruit, Muskmelon and Jamun. The ashes were chemically bound to the epoxy system because of the induced amine functionality. The binder was enough to wet the entire ash present in the coating. Hence it showed good adhesion to the substrate. Also, good adhesion to the substrate is responsible for good hardness value and scratch resistance properties. The chemically bonded ash present in the coating acts as the filler which also results in increased hardness of the coating. These properties get enhanced as the concentration of ash goes on increasing. The ash contains MgO, Fe2O3, ZnO, and CaO which are responsible for increasing the anticorrosive performance of the coating. It acts as a barrier for various corrosive species. REFERENCES [1] Armelin E., Pla R., Liesa F., Ramis X., Iribarren J. I. and Alemán C. (2008), Corrosion protection with polyaniline and polypyrrole as anticorrosive additives for epoxy paint, Corrosion Science, Vol. 50, pp [2] Peng S., Zhao W., Li H., Zeng Z., Xue Q. and Wu X. (2013), The enhancement of benzotriazole on epoxy functionalized silica sol gel coating for copper protection, Applied Surface Science, pp [3] Shon M.Y. and Kwon H.S. (2009), Comparison of surface modification with amino terminated polydimethylsiloxane and amino branched polydimethylsiloxane on the corrosion protection of epoxy coating, Corrosion Science, Vol. 51, pp [4] Azadi M., Bahrololoom M.E. and Heidari F. (2011), Enhancing the mechanical properties of an epoxy coating with rice husk ash, a green product, Journal of Coating Technology and Research, Vol. 8, pp
182 Effect of Silicon Oxide (SiO2) Powder Addition on Adhesion Strength, Corrosion Resistant And Abrasion Resistant of Epoxy Coating Radhovan Zanata, Hilmy Suryadinata, Alif Farrel Nayondra, and Agung Purniawan * Sepuluh Nopember Institute of Technology *agungpur@mat-eng.its.ac.id Abstract - This study investigated the effect of the addition of silica on epoxy paint to adhesion force, corrosion resistance and abrasion resistance, and its morphology after addition of silicon. This research used A516 carbon steel substrate material which was then coated with epoxy paint, by adding silica in coating with different volume percentage (0%, 5%, 7%, and 10%). The application process uses conventional air spray method. The results of this study were then tested with portable adhesive tester (PAT), falling sand abrsive tool, optical microscope and SEM-EDX. From the research, the addition of silica content decreased the adhesion of paint to the substrate, the addition of silica resulted in the reduction of corrosion resistance, but increased the abrasion resistance of epoxy paint with the abrasion resistance of Keywords: Coating, Epoxy, Silica, Volume Percentage, Abrasion. INTRODUCTION One way is to add a coating material with a reinforcing element commonly called organic - inorganic coating. Organic - inorganic paint is a material structure composed of two or more combined and dissolving constituents which consist of a filler and a matrix so it is a composite material. The most widely developed composite is PMC (Polymeric Matrix Composite). This type of composite consists of either Thermoplastic or Thermosetting polymer type. In general, the filler is uses to improve the mechanical properties of the polymer. Epoxy resin is commonly used as an adhesive material and an excellent protective layer because it has high strength and strong adhesion. In addition, epoxy also has good corrosion resistance properties, dielectric properties and insulating properties, low shrinkage, dimensional stability and fatigue resistance as in [1]. RESEARCH SIGNIFICANCE This study was conducted to compare and analyze the effect of variation of silica powder weight increase with content of 5%, 7% and 10% to the adhesion power properties, corrosion resistance and epoxy abrasion resistance applied on the surface of carbon steel. The analysis is done on the morphology and the spread of silica. MATERIALS AND METHODS Materials used in this research are silica powder, coating material and specimens (carbon steel), where the silica powder has different variables (0, 5, 7 and 10% volume). The silica powder added to epoxy paint and then stirred using a mechanical stirrer at 1000 rpm for 15 minutes. The coating material then applied to the specimen using a conventional spray water tool. Wet paint thickness (WFT) μm and dry paint thickness (DFT) μm. Furthermore, various tests were performed. 3.1 Adhesion Test Conducts pull-off test using the Type II Portable Adhesive Tester tool to find out the coating adhesion strength of the coatings against the substrate based on ASTM D-4541 standard. 3.2 Immersion Test Immersion test with 3.5% NaCl solution as immers medium. The specimen was inserted in a 2-week immersion test vessel and a blister evaluation was performed on an immersed specimen with an image contained in ASTM D Abrasive Resistance Test This test is performed to determine the abrasive resistance of the coating material. The falling sand abrasive tool is used according to ASTM D standard. RESULTS AND DISCUSSION Adhesion test or adhesion strength is performed to see how much the ability of the coating layer to adhere to the surface of the substrate. This test is performed at 3 points A, B and C for each sample and then the result is averaged for each sample. Adhesion power test results in the four samples can be seen in Table

183 4. 10 Blister Size No 2 (Few) Table 1. Adhesion test result No Silica (%) Adhesion Strength (Mpa) From table 1, the highest adhesion strength is owned by the sample without the addition of silica while the 10% silica sample has the least adhesion strength. The large decrease in adhesion power occurred sequentially starting from a sample of 0% to 10%. The tafel method was conducted to analyze the corrosion rate of each sample. The results are shown in Table 2 Table 2. Tafel test result No Silica (%) Corrosion Rate (mmpy) Corrosion Rate (mpy) , , , , , , , ,9618 The lowest corrosion rate is owned by specimens with 0% Silica additions, while specimens with the addition of 10% silica have the highest corrosion. This is due to a cavity or axle (void) on the surface of the epoxy coating layer formed due to the presence of silica clumping. While the immers test results for 14 days also showed that the addition of silica decreases corrosion resistance. To determine the extent of damage can be done by measuring the blister level formed and comparing with the standard ASTM D714 "Standard Test Method for Evaluating Degree of Blistering of Paints". The results are shown in Figure 1 and Table 3. Figure 1. Immersion test of (A) 0% silica, (B) 5% silica, (C) 7% silica, (D) 10% silica Table 3. Blister level of each specimen No Silica (%) Blister Level 1. 0 Blister Size No Blister Size No 8 (Few) 3. 7 Blister Size No 4 (Few) From Table 3 it can be seen that the specimen without the addition of silica does not have a blister on its surface and this is proportional to the specimen with the addition of 10% Silica having blister size No. 2 with a small amount of blister.there was a decrease in abrasion thickness along with the increase in the amount of silica on the specimen as shown in Table 4. Table 4. Measurement results of abrasion thickness No Silica (%) Abrasion Thickness (μm) Abrasion resistance can be calculated using the formula: A = V/T Eq 1 Where: A = Abrasion Resistance V = Abrasive Volume used (Liter) T = Thickened Thickness (mils) After performed the calculation, the abrasion resistance result of each specimen as shown in table 5. Table 5 Result of abrasion resistance calculations No Silica (%) Volume (Liter) Abrasion Thickness Abrasion Strength (mils) CONCLUSION Taddition of silica to epoxy paint improves abrasion resistance, but decreases corrosion resistance and adhesion strength. It is recommended in subsequent research to reduce the size of the silica powder to be smaller in order to reduce the void formed on the surface, increase the speed and increase the time of the mixing process so that the paint with the filler can be mixed evenly. REFERENCES [1] Schweitzer, Philip A Paint and Coatings Applications and Corrosion Resistance. New York : Taylor & Francis Group. 143
184 Mcounts 5 th CORSYM, Chennai, India, March 2018 Development of Self-Healing Coating Using Polyurea-Formaldehyde (PUF) Microcapsules Containing Sea Mango Oil As Healing Agent On Carbon Steel Nurul Nadiah Zulbakeriamerudin and Nor Roslina Rosli * Department of Chemical Engineering, Universiti Teknologi MARA, Shah Alam, Selangor, Malaysia. *nurulnadiah723@gmail.com Abstract A preliminary attempt was made to synthesize self-healing coating using PUF microcapsules containing sea mango (Cerbera odollam) oil as healing agent via in-situ polymerization. The sea mango oil was chosen as healing agent due to assumption that it is a drying oil. The sea mango oil, PUF and PUF-sea mango oil microcapsules were characterized by GCMS, FTIR, TGA, PSA and optical microscope. The effects of agitation rates, types of emulsifier and concentration of emulsifier on the synthesized microcapsules were also investigated. Results showed that sea mango oil is semidry oil and a low percentage of encapsulation up to only 20 wt% leads to low healing performance by the selfhealing coating upon being scratched. Keywords - In-situ polymerization, PUF microcapsules, Sea mango oil, Self-healing coating. INTRODUCTION Emerging technology of self-healing coating was discovered to be the remedy for the coating drawbacks [1] as it can restore coating s properties without manual intervention [2]. In order to deliver its healing agents, microencapsulation was used so that healing agents would be release upon microcapsules rupture, thus polymerize and adhere the two cracks faces together [3]. Drying oils can be used as healing agent and these oils are characterized by highly unsaturated fatty acids with two or three double bonds. These bonds can form films which are solid, coherent and adherent as it was spread on a surface [4]. Research by Kansedo and Lee [5] specified that sea mango oil contained 52.82% oleic, 13.65% linoleic and 0.08% linolenic. RESEARCH SIGNIFICANCE This research is intended to extend the service life of metallic materials even after the coating layer has been damaged. The production cost can be reduced as sea mango fruit is poisonous, thus has no competition in using it as raw material. Besides that, the use of drying oil can reduce the requirement of additional catalyst and healant in the production of coating. MATERIALS AND METHODS 3.1 Materials Sea mango oil was extracted from the kernels of sea mango fruits using Soxhlet extraction method and methanol as solvent. The fruits were collected around Morib beach, Malaysia. The microcapsule involved is PUF which was synthesized in the laboratory. Steel coupons of grade S70 were prepared. The steel was abraded up to 800 grid SiC paper prior to being coated. 3.2 Development of self-healing coating PUF microcapsule containing sea mango oil was synthesized through in-situ polymerization of urea and formaldehyde in oil-in-water emulsion. Then, the synthesized microcapsules were embedded into epoxy resin. Homogenized and stabilized epoxy resin was applied to the carbon steel coupons using a brush to form a layer of coating. RESULTS AND DISCUSSION 4.1 GCMS Figure 1 shows gas chromatogram of sea mango oil which clearly indicates the presence of palmatic, oleic and linoleic, however linolenic was not observed. High composition of oleic and linoleic indicate that sea mango oil is most probably a semi-drying oil which is opposite to the assumption stated earlier in this project. Even though this project found that sea mango oil is semi-dry oil, sea mango oil can still be used as healing agent. 4.E+06 3.E+06 2.E+06 1.E+06 0.E+00 Palmatic (28%) Oleic (43%) + Linoleic (49%) RT (min) Figure 1. Fatty acid composition of sea mango oil 144

 Microcapsules PUF Sea Mango Oil varying concentration of PVA emulsifier on the formation of microcapsules.")

185 Weight (%) Transmittance (%) 5 th CORSYM, Chennai, India, March FTIR Figure 2 shows the spectrum of FTIR for sea mango oil, PUF and microcapsules. The FTIR spectra of the synthesized microcapsules showed the characteristic peaks of both sea mango oil and the PUF. Hence, this proves that the sea mango oil was successfully encapsulated in the PUF shell N-H O-H Figure 2. FTIR spectrum of samples C=O C-N Wavenumber (cm-1) Microcapsules PUF Sea Mango Oil varying concentration of PVA emulsifier on the formation of microcapsules. When no emulsifier was applied, the microcapsules surfaces tend to stick to each other and cannot be separated as free flowing microcapsules. As the concentration of emulsifier increased, the agglomeration becomes less and free-flowing microcapsules can be synthesized. Table 2. Effects of emulsifier types Types of Emulsifier Digital Microscope Images of Microcapsules Polyvinyl Alcohol (PVA) Table 3. Effects of emulsifier concentration Emulsifier 1000 µm Emulsifier Concentration Maleic Anhydride (MA) 1000 µm Digital Microscope Images of Microcapsules 4.3 TGA Figure 3 of weight loss curve shows that the sea mango oil started to decompose at 220 C and there were 20 wt% materials left. This indicates that the microcapsules were successfully encapsulated up to 20 wt% of the sea mango oil. Polyvinyl Alcohol (PVA) ml of 5 wt% 1 ml of 5 wt% 1000 µm 1000 µm 1000 µm Figure 3. TGA results of samples 4.4 Effects of agitation rates By referring to Table 1, it can be seen that the mean size of microcapsules decreased from µm to µm when the agitation rate increased from 500 rpm to 800 rpm. Table 1. Effects of agitation rates Agitation Rates (rpm) Mean Diameter of Microcapsules (µm) µm µm Temperature ( C) Sea Mango Extract PUF Microcapsule µm Digital Microscope Images of Microcapsules 1000 µm 1000 µm 1000 µm 4.5 Effects of emulsifier types and concentration As shown in Table 2, PVA results in more stable, freeflow microcapsules than MA which form agglomerated microcapsules. As for Table 3, it shows the effect of 4.6 Self-healing efficiencies of the coating Table 4 shows the efficiencies of self-healing coating on carbon steel. The microcapsules can only encapsulate sea mango oil as high as 20wt% in this project. Table 4. Efficiencies of self-healing coating Self-Healing Coating CONCLUSION Initial Condition After 1 day The chromatogram of the GCMS indicates that the sea mango oil can be categorized as semi-dry oil which can only form partial tack-free film. However, due to the facts that sea mango oil is semi-dry oil and a low percentage of encapsulation, the self-healing coating showed low healing performance upon being scratched. REFERENCES 500 µm 500 µm [1] S. Lang and Q. Zhou, Prog. Org. Coatings, vol. 105, pp , [2] A. Lutz, O. van den Berg, J. Wielant, I. De Graeve, and H. Terryn, Front. Mater., vol. 2, no. January, pp. 1 12, [3] T. C. Mauldin and D. J. Boday, vol. 3 3, no. 15, pp , [4] C. Stenberg, Ind. Crops Prod., pp. 1 39, [5] J. Kansedo and K. T. Lee, Energy Sci. Eng., vol. 2, no. 1, pp ,
186 The Effect of Solvent Addition and Thickness Coating Epoxy on Adhesion Strength and Blistering on the NaCl Environment is Applied in Carbon Steel Arfiansyah 1, Rizki Marcelino Sani 1, Nindio Mahendra Wicaksono 2, Maulana Mufti Muhammad 1 and Dr. Agung Purniawan S.T., M. Eng* 1. 1Departemen of Material Engineering, Institute Technology Sepuluh Nopember, Surabaya, Indonesia 2Departemen of Marine Engineering, Institute Technology Sepuluh Nopember, Surabaya, Indonesia *agungpur@mat-eng.its.ac.id Abstract Organic coating has functions such as providing barrier protection between substrate and environment and its commonly used to protect pipeline. In this research, to evaluate a function of barrier, a different the thickness coating (50, 100, 150, 200, and 250 micron) were used. In addition, to make easier during application process, solvent 0, 10, and 20% were added to paint. Epoxy is used as premier paint to cover substrate material ASTM A36 Grade B in NaCl 3,5% Environment. Conventional spray was used in paint application. Morphology of coating was investigated by SEM. To evaluate the function of the coating, adhesion strength, blistering, and water vapor transmission rate tests were applied. The result indicates that the blister size increase with the increasing thickness coating while the adhesion strength decreases with the increase thickness coating. Additional solvent in paint increase the water vapor transmission rate, consequently the function of coating decrease. Keywords Coating, Adhesion, Blister, Water Vapor Transmission Rate INTRODUCTION Corrosion are one of the major problem in using a carbon steel material in a pipe line. There are multiple ways to prevent corrosion in carbon steel pipe line such as coating. Coating is a method that separate the surface of the metal with the corrosive environment. There are also different kind of coating as in [1] that this kind of method is most wildly use because this method is easy to work with. One of the coating type for usage are organic coating. Organic coating works as any other coating works being an intermediary between metal surface with corrosive environment. But, every kind of organic coating are permeable to water and air. Composition of coating consist of solute that dissolved in a solvent and also there s solvent active that dissolved with diluent. Solvent play a big role determining the optimal viscosity a coating for mixing, grinding, application, and etc. as in [1]. RESEARCH SIGNIFICANCE This research gives a reverence for application of an organic coating from its thickness and especially solvent addition in organic coating. With this research also gives the extent of blistering within the organic coating in 3,5% NaCl environment. MATERIALS AND METHODS On this research will be conducted with research methods, namely the study of literature and experimental. There are several experiments conducted in this study are testing immersing, salt spray, water vapor permeability, adhesion, and SEM. This research used the material low carbon steel ASTM A36 Grade B, electrolytes, and material coating. 3.1 Type of testing conducted On this research, there are several procedures that must be performed there are, substrate preparation, preparation of an electrolyte ( an electrolyte used is 3.5% NaCl ), testing immerse ( to know the quality of the coating against electrolyte ), the salt spray testing ( to know the nature of the corrosion resistance of the layers of paint ), water vapor transmission rate testing ( to know the propagation of water vapor that passes through the layers of paint ), SEM testing ( to know the shape of the pore and its spread in the coating). RESULTS AND DISCUSSION There are several tests conducted for this research all of it using (0%,10%, and 20%) added solvent with thickness of the coating ranging from 50, 100, 150, 200, and 250 microns 4.1 Adhesion The standard in use for this test is ASTM D-4541, and from the data shows that with thickness of 50 microns and 0% solvent have the best adhesion and the worst adhesion came from specimen with thickness of 250 microns and 146

![The test show that adding more solvent into the epoxy primer can cause blistering, blistering can occur because there is a decreasing of cohesion between the coating and interface as in [6].](/docs-images/78/76861956/images/187-1.jpg "as for the blistering the test using ASTM D714 as standard.")
187 20% solvent. Adding more solvent into the epoxy primer can cause pores to occur and adding more layer increase the number of pores in the coating. 4.2 Adhesion and blistering with immersion in 3.5% NaCl The adhesion of the coating after being immersed in 3,5% NaCl for 14 days with thickness of 100 microns. The test show that adding more solvent into the epoxy primer can cause blistering, blistering can occur because there is a decreasing of cohesion between the coating and interface as in [6]. as for the blistering the test using ASTM D714 as standard. With the adhesion test result show that increasing the amount of solvent can cause blistering but increasing the thickness can counter the blistering effect because in 250 microns the level of blistering drop in any percentage of solvent. 4.3 SEM For SEM the test only focusses on the effect of pores with a specific amount of solvent. And with the magnification of 1000x and 4000x shows that the addition of solvent can cause more and bigger pores to form as shown in Figure 1 and Figure 2. Figure 1. Specimen with 0% solvent at 1000x and 4000x Figure 2. Specimen with 20% solvent at 1000x and 4000x 4.4 Salt spray Salt spray testing measure the widening of scratch in the primer coating. There are rating that can be used for this test using ASTM D-1654 as standard that 10 are the highest rating with low change in scratch dimension and with increasing change the lower the rating. The result shows that all specimen have equal rating that is 9 with the biggest widening in thickness 50 microns and 20% solvent. 4.5 Water vapor transmission rate Result of this test follows ASTM D-1653 standard with solvent variations of 0%, 10%, and 20%. The increasing of weight respectively are 0,7223 g, g, and 1,5561 g. The results show that the addition of 20% solvent has the highest moisture propagation as described in 4.3 SEM test shows that there are pores that make the vapor propagation faster, whereas the 0% solvent addition composition has the lowest speed value followed by addition of solvent 10% composition. CONCLUSION After the analysis of test results, it can be taken a conclusion from this study. Here are the conclusions: From the adherence test available variations without solvents 0% or without additional solvents with thickness of 50 microns have the highest adhesion resistance. And the lowest adherence resistance to the 20% solvent with a thickness of 250 microns. This leads to a very great and many cohesive fall. From the blistering level test, the thickness of 250 micron with variation without the addition of solvent was obtained by the highest blistering level or the most difficult for blistering damage. Since the propagation of water vapor passes through the coating on the variation without the addition of solvent or 0% solvent has the lowest value. From the morphological test using SEM it is found that the pores formed due to variation of solvent addition of 20% have larger pores and spread evenly than 10% and 0%. This results in moisture propagation proportional to the magnitude of the addition of solvent. ACKNOWLEDGEMENTS We wish to express our sincere gratitude to Dr. Agung Purniawan S.T., M. Eng. as Faculty Advisor for their guidance and encouragement in carrying out this project paper. We sincerely thank you to National Association Corrosion Engineer (NACE) ITS. For the information about this paper competition. REFERENCES [1] Drisko, Richard W and James F Jenkins. (2006), Principles of Corrosion Engineering and Corrosion Control. California: Elsevier Science and Technology Books [2] Bryan Ellis. (1993), Chemistry and Technology of Epoxy Resins. Netherlands: Springer. [3] Haylik. (2007), J. Phys. Chem. Solids, 68: [4] A. S. Khana. (2005), Indian: Indian Institute of Technology Bombay. [5] Louis D. Vincent. (2010), The Protecive Coating User s Handbook. Texas: NACE International [6] Bao Sheng Liu. (2014), Blistering failure analysis of organic coatings on AZ91D. Engineering Failure Analysis (Elsevier)

188 Synthesis, Characterization and Anticorrosion Studies of EPI/CuO Composites Coating Jeetendra Malav 1*, Ramesh C. Rathod 1 and Suresh S. Umare 2 1 Department of Metallurgical and Materials Engineering, VNIT, Nagpur 2 Department of Chemistry, VNIT, Nagpur *jeetendramalav16@gmail.com Abstract - One of the effective methods to enhance the corrosion resistance of metallic structure was applied organic coatings. In this study, electroactive polyimide (EPI)/CuO (5, 10 and 15 wt%) composites were prepared by in-situ oxidative coupling polymerization. Synthesized composites were characterized for structural and thermal using FT-IR, XRD, FE-SEM and TGA techniques. Prepared coatings containing EPI/CuO composites were coated on 316 L stainless steel and electrochemical tests were performed to evaluate the anticorrosion performance in 5% NaCl solution. The results showed that the increased content of CuO on composites could improve the anticorrosion performance of coating. The aim of this study was to develop a facile method of fillers having better dispersing properties for coating having superior corrosion protective properties in aggressive medium. Keywords Copper Oxide Nanoparticles, Composites, Coatings, Corrosion Protection INTRODUCTION It has been estimated that corrosion protection using paint/ coating the major part of this coating is ascribed to organic coatings which are employed to protect structural materials against corrosive environment. It is well accepted that the organic coating has strong physical shielding effect for the penetration of corrosive medium and delay the time to reaching the substrate, the inorganic fillers in the organic coating were regarded as inhibitor they further hindered the path and reduce the corrosion of metal. In general fillers in nano size delivers remarkable ability for constructing hybrid coatings was further alter protective performance. Researchers conclude that the corrosion protection was improved by the addition of nano sized materials in electroactive polymers matrix in corrosive medium [1]. Copper oxide-nanostructures materials, an important semiconductor possesses a narrow band-gap of ev have attracted considerable attention due to their fundamental importance and potential future applications. In this study our focus to protective behavior of electroactive polyimide and its composite with CuO particles with different weight ratio. The homogenous mixture of coating solution was coated on steel substrate and potentiodynamic polarization test were perform in aggressive environment. Figure 1. Synthesis route of EPI and composites. RESEARCH SIGNIFICANCE It could be observed that, the formation of corrosion on the steels surface was need to sufficient oxidative ions and charge transport. When, any of this process is shifted due to the coatings, the corrosion could be minimized and the coating may be considered to be effective for corrosion protection. MATERIALS AND METHODS 4,4 - (4,4 -isopropylidenediphenoxy)-bis(phthalic anhydride), 1,4-phenylenediamine, N-Phenyl-p phenylenediamine, ammonium persulfate, N-methyl-2- pyrrolidone, cupperic chloride, ethylene glycol, hydrochloric acid, liquid ammonia, Acetone, PU base binder, 256S dopent, xylene and butanol. All chemicals used as received without further purification. In addition, the following instrument were used: FT-IR spectrophotometer (Perkin-Elmer Spectrometer One), X Pert PRO PANanalytical X-ray diffractrometer, and corrosion performance test were performed on electrochemical work station (BioLogic VMP 300). 3.1 Synthesis of EPI/CuO composites and coating For synthesis of EPI/CuO composites (figure 1), imidic oligoaniline was prepared from BSAA and N-phenyle-pphenylenediamine with a molar ratio (1:3). Then EPI/CuO composites was prepared with different weght ratio using imidic oligoaniline (1.78 g), 1,4-phenylenediamine (0.108 g) and calculated amount of synthesized CuO ( by hydrothermal method), finally Product was thermally heated at 180 ºC for 2 h to complete the imidization. 148
 by spin coating method (thickness 80 ± 2μm) and dried at 50 ºC for 5 h.")
189 The coating mixture was prepared using polyurethane (5 ml), hardener 256 S DuPont (2ml) and 0.1 g of polymer composites and xylene and butanol mixture was added to the mixture to control viscosity. The prepared coating mixture was spread on the surface of samples (1 cm 2 ) by spin coating method (thickness 80 ± 2μm) and dried at 50 ºC for 5 h. RESULTS AND DISCUSSION Characterization of synthesized EPI and composites by FTIR (figure 2a) and XRD (figure 2b), in FT-IR, the peak at 1848 cm -1, 1774 cm -1 and 1711cm -1 ascribed to C=O stretching, 1598 cm -1 and 1496 cm 1 quinoid and benzenoid ring respectively [2], the spectra of CuO show the peak at 3420 cm -1 due to OH stretching, at 596 cm -1 starching of monoclinic CuO. In EPI/CuO composites, show shift in the vibration streching and change intensity, the most prominent changes to quinoid and benzenoid ring got weakened in the composites. In XRD, EPI broad peak in the 2θ =15º to 25º was characteristic of amorphous nature of polymer. In CuO diffraction plane (110), (002), (111), (202), (113) and (311) appeared, indicate monoclinic cubic structure of CuO particles (JCPDS ) [3]. Composites show decreased intensity of amorphous peak with increased the CuO with all diffraction planes. Figure 2. (a) FT-IR spectra and (b) XRD pattern for EPI, CuO and EPI/CuO composites shift in Ecorr value from mv to mv for bare 316L steel to composites, considerable shift toward anodic side. The value of icorr decreased from μa/cm 2 to μa/cm 2 for bare 316L SS to EPI respectively, whereas the icorr value of composites coating was further decreased with addition of CuO in EPI polymer matrix (Table 1). Corrosion protection by composites provide the redox catalytic property to help the formation of passive layer on metal surface and dispersion of CuO further increased the barrier for the corrosive ions to penetrate into the metal oxide film. studied indicated the corrosion protection ability was increased in the polymer matrix on addition of CuO particles. Table 1. Potentiodynamic polarization parameter of bare and EPI/CuO composites coated samples in 5% NaCl Specimen Ecorr icorr Corrosion rate (mv) (μa/cm 2 ) (μm/year) L SS EPI E/CuO E/CuO E/CuO CONCLUSION The Potentiodynamic polarization test show the corrosion protection on electrode (316L SS) in a 5 wt. % NaCl solution was found that the EPI/CuO composites coating exhibits better corrosion protection as compared to that of pure EPI coating. The improvement in the corrosion protection of EPI/ CuO composites coating on electrodes may be attributed to the redox catalytic properties to form the passive metal oxide layer and the barrier properties of well dispersed CuO particles in composite thus hindering the process of flow of electrons or ions across the film. These all factors of composites may lead to better corrosion protection. REFERENCES Figure 3. Potentiodynamic polarization curve of bare 316L steel, EPI and EPI/CuO composites coated samples. Tafel plot (figure 3) of EPI and composites coating on 316L steel, immersion in 5% NaCl solution show positive [1] Jui-Ming Y., Chang-Jian W. etal. (2010), Advanced anticorrosive coatings prepared from electroactive polyimide TiO2 hybrid nanocomposite materials, Electrochimica Acta, Vol. 55, pp [2] Jui-Ming Y., Tsao-Cheng H. etal. (2011), Electrochemical studies on aniline-pentamer-based electroactive polyimide coating: Corrosion protection and electrochromic properties, Electrochimica Acta, Vol. 56, pp [3] Cavalcante L.S., Volanti D.P. etal. (2008), Synthesis and characterization of CuO flower-nanostructure processing by a domestic hydrothermal microwave, Journal of Alloys and Compounds vol. 459, pp
190 Amino Acid-Functionalized Graphene Material as Corrosion Inhibitor on Mild Steel in 1m Sulphuric Acid N. Palaniappan 1, C.Lal 1, Balasubramaniuam 2, I. S. Cole 3, and F. Caballero-Briones 4 1 Central University of Gujarat, School of Chemical Sciences India 2 Defence Institute Advanvced Technology-India 3 RMIT University Australia 4 Instituto Politécnico Nacional, GESMAT, CICATA Altamira, México *palaniappancecri@rediffmail.com Abstract Mild steel is widely used in construction and oil industry, but is easily affected by open and acidic environment and several but non-definitive solutions for steel corrosion have been studied during the past decades. Reports show that organic compounds and metal oxide coatings are used as corrosion inhibitors but they do not withstand long term exposure to corrosive conditions.on the other hand, graphene-related materials show high adsorption on metals, withstand high temperatures, are not environmentally harmfu, and are economically favoured with respect to other alternative treatments. In the present work, amino acid-functionalized graphene oxide is proposed as anti-corrosion coating material. The materials are characterized by FESEM,. Raman, UV, FTIR. The corrosion inhibition efficiency is studied by electrochemical methods. Improved corrosion inhibition with respect to traditional barrier protection is observed. Keywords - graphene-r coatings, mild steel, microscopy, spectroscopy, electrochemical methods. INTRODUCTION Mild steel is one of most used materials in oil well industry and construction, although is prone to form oxide on metal surface and eventually suffer from corrosion. In the past ten decades corrosion inhibition has been done by coating, or by conventional electroplating methods (galvanoplasty). These methods are failed to prolong corrosion inhibition in harsh medium. Recently carbon based functional materials have been emerging as promising alternatives for corrosion inhibition in strong medium. In the present work, adenine-modified graphene oxide as corrosion barrier layer in strong acids is studied. Experimental and theoretical results on corrosion inhibition efficiency have been obtained. MATERIALS AND METHODS GO was synthesized by modified Hummers method. In brief, 1 gram of graphite powder was introduced into a round bottom flask (RB). The RB was keep in an ice container, while H2SO4, and 50 ml H2PO4 and 3 gram of KMnO4 were added to the flask; following the mixture was kept at 60 C and refluxed during 12h; afterwards, 1 liter of ice water and 10 ml H2O2 were added to the reaction mixture to stop it. The amino acid functionalization was done by adding 100 mg of graphene oxide and 30 mg of adenine into RB flask sonicated continuously by 1 h; then, the mixture was kept 24 h under refluxat 60 C. The final treatment was to wash 5 times with ethanol and dry at 60 C in a vaccum oven. 2.1 Spectroscopy study The material was characterized by UV -VIS optical absorption in an Analytical 600 model. The FTIR has been used to study the functional groups in aspectrum 65 device. Raman spectroscopy was used to study the graphitic carbon disorder in a Wintech spectrometer with a laser excitation source of 530 nm. 2.2 Material charerization X-ray diffraction (XRD) was used to study the crystalline nature of the adenine-go composite in a Bruker D8 diffractometer with Cu Kα radiation (λ= Å). Field emission electron microscopy (FESEM) was used to observe morphology of GO and GO-AD in a Carl Zeiss microscope. Corrosion inhibition was studied in a three electrode system CHI 920 D model SCEM. Mild steel was polished with emery paper from 600 to 1200 grit. The GO- AD material was studied by DFT calculation using Gaussian 03 programme package 613 basis set solvent phase methods and the quantum parameters were calculated by common formalism. RESULTS AND DISCUSSION 3.1 Spectroscopic study Optical absorption is shown in Fig.1. The absorption at 200 nm to 250 nm in GO solution is observed, corresponding to the well known GO transitions. Correspondingly, GO-AD spectrum display a single absorption peak at 370 nm. FTIR spectra show characteristic functional groups in the graphene oxide sheet, i.e the C-OH bond stretching frequency at 3419 cm - 1, aromatic C=C at 1632 cm -1, the phenol carbonyl at
 and FTIR (R) spectra of GO and GO-AD 3.")
 plane from adjacent GO layers as well as a broad wave centered at 26º, related with amorphous carbon.")


191 cm -1 and C-O-C at 1227cm -1 vibrations, new bands appear in GO-AD at 3400 cm -1 due to secondary amine N-H stretch, at 1740 cm -1 due to C=O stretch in carboxyl groups togheter with a broad band around cm -1 due to carboxylic acid C-OH stretch. UV and IR spectra suggest extensive adenine grafting to the GO matrix. Figure 1. UV (L) and FTIR (R) spectra of GO and GO-AD 3.2 Structural Characterization XRD of the GO sample displays a reflection at 11.6º related with the (002) plane from adjacent GO layers as well as a broad wave centered at 26º, related with amorphous carbon. The GO-AD diffractogram display several crystalline peaks, related with spread adenine functionalities within the GO matrix. Phase indexing would have to consider possibly mixed phase effects. Figure 3. Electrochemical data and QC models Figure 2. XRD and Raman of GO and GO-AD The GO Raman spectrum display the characteristic D and G bands as well as the 2D band; the GO-AD spectrum shows a reduction in the overall intensity possibly due to a lack of ordering caused by the adenine grafting. 3.3 Electrochemical & Quantum chemical method The epoxy Ecorr value decreased and I corr value increase and GO+ AD corrosion values are decreased, DFT value suggest electron donation from adenine, accepted by the mild steel vacant d orbital, the quantum chemical values suggest that GO+ AD inhibition increases, but protection against media is not complete as shown in Fig.4. Table 1.Corrosion and QC parameters Figure 4. FESEM micrographs GO (C ) GO-AD (D), mild steel protected with the GO-AD epoxy coating (A) and after 3 days of immersion in the corrosion media (B) CONCLUSIONS Adenine-grafted graphene oxide was obtained and tested as corrosion protection additive for mild steel in acid media. The results indicate increased corrosion protection compared with GO addition. ACKNOLEDGMENTS The author thankfull to Non NET fellowship, CUG CIF, UGC NRC UOH at School of Chemistry. Partial financial support from SIP-IPN Mexico is granted. REFERENCE [1] N.Palaniappan, L. R. Chowhan, S. Jothi, I. G. Bosco, I. S. Cole. Surfaces and Interfaces 0 0 0,2016,1,10 151
192 The Analysis of Effectiveness of Polyethylene and Polypropylene as the Top Coat on Three Layer Coating Method Against Corrosion Resistance of B-Grade Api 5l Steel Deni Rizky Febrisal, Yoseph Lintong J Samosir, Alif Azizia Putri, Yosafat Sondang Marcellinus Siahaan and Agung Purniawan * Institut Teknologi Sepuluh Nopember *agungpur@mat-eng.its.ac.id Abstract - This research was conducted to analyze the effectiveness of polyethylene and polypropylene as top coat in the three-layered coating method towards corrosion resistance in iron steel pipe API 5L grade B by applying salt spray test. This research also analyzed the effect of coating thickness against adhesion strength, corrosion resistance, and morphologies condition of polyethylene and polypropylene coating. Based on the salt spray test, all three coatings had good corrosion resistance, where each of the coatings got the rating of 9. Polypropylene had the best scratch widening compared to epoxy and polyethylene, with the average of mm. Based on the pull-off test result, the thickness of the coating did affect the adhesion power. From the visual analysis, the substrate s surface of each sample had a fine surface roughness that was able to develop mechanical interlocking that increased the bonding power of the interface area. Keywords Coating, Polypropylene, Polyethylene, Epoxy INTRODUCTION Steel is a material that is widely applied in the oil and gas industry. However, the quality of steel may decrease due to corrosion. One of the method to prevent the occurrence of corrosion, especially on the external part of the pipe is the application of multi-layer coating. Multilayer coatings that are commonly used in the oil and gas industry are three-layer polyethylene coating (3LPE) and three-layer polypropylene coating (3LPP), which consists of 3 types of layers: epoxy as the primary layer, adhesive as the intermediate layer, and polyethylene or polypropylene as the top coat. The conduction of this research was to analyze the effectiveness of polyethylene and polypropylene as the top coat on three-layer coating method to corrosion resistance on steel pipe API 5L Grade B. offer an overview of the effectiveness of coating method application by using organic coating in the oil and gas industry. MATERIALS AND METHODS The experiment in this paper included the salt spray, pull-off, heat-resistant, and also the morphology test of the polyethylene and polypropylene in 3LPE & 3LPP method. Two inch-diameter iron steel API 5L grade B was cut with the dimension of 30 x 50 mm for 25 samples. Then, the iron was cleaned and coated, with the first layer using the conventional spray method, the second layer with the hand lay-up method, and the third layer by the melted pellets. The salt spray test was conducted with 3.5% NaCl for 96 hours. And the widening scratch method was done by using tool steel with the width of the scratch of +1 mm and it was compared to the corrosion resistance based on the ASTM D1654. The pull-off test was conducted based on the ASTM D454. The heat-resistance test, was conducted in a 150 C temperature for 15 minutes. And the morphological analyzation was conducted to find out about the bonding of each layer of coat from the two samples. RESULTS AND DISCUSSION 4.1 Measurement of Layer Thickness Table 1 shows the data of organic layer thickness which was obtained by the dry film thickness measurement. Table 1. Measurement result of layer thickness RESEARCH SIGNIFICANCE In the future, the result of this research is expected to be one of the reference in controlling corrosion and able to 152


193 Based on the data, it was obtained the values of the overall coating thickness with polyethylene and polypropylene as the top coat. Differences in the size of polyethylene pellets and polypropylene, causing a thickness value of the two are also different 4.2 Adhesion Test The adhesion test was conducted by using the pull-off adhesion test, where the dolly would be given a pull-off load which will cause the layer detached from its substrate. Based on the obtained test results with the pull-off adhesion test, there were three failure categories namely: adhesive, cohesive, and glue failure. In the epoxy as the primary coating, it was known that from the three samples with the thickness variation, all of the coatings were categorized to have adhesive failure. From the result, it was known that the thickness of a layer did affect the adhesion power of the coatings. 4.3 Salt Spray Test The salt spray test was conducted inside the salt spray chamber by spraying NaCl 3.5% that has the number of ph 7 for 96 hours. The data that can be obtained from this test is the widening of the scratch area on the coating. Based on the salt spray test, all three coatings have good corrosion resistance, where each of the coatings got the rating of Morphological Analyzation of (3LPE & 3LPP) Coating In this analyzation, the sample was cut with the 10 x 10 mm dimension to be visually analyzed. The part that was being analyzed, was the cross-sectional area. From the figure 1 which was obtained from stereo microscope with 20x magnification, we could clearly see the visualization of each coating layer of 3LPE & 3LPP method. If we look closely at the (a), the epoxy layer as the primary coating visually had good bonding with the substrate. The same result was also shown by (b), where the epoxy on the substrate s surface seemed to bond the substrate well. Figure 1. Visualization of the 3LPE & 3LPP coating. (a) Polyethylene, (b) Polypropylene A different result was obtained from the adhesive layer. If we look on the image (a) from Figure 2, the red circle shows us that the adhesive doesn t bond the polyethylene well. It may be caused by the low adhesion strength of polyethylene. Otherwise, the image (b) look good visually because it has a well-bonded layer of the epoxy and polypropylene. Figure 2. Surface of (a) Polyethylene, (b) Polypropylene CONCLUSION Based on the salt spray test, all three coatings have good corrosion resistance, where each of the coatings got the rating of 9. On the pull-off test, the increasing thickness of the coating causes a smaller adhesion point. From the visual analysis, the substrate s surface of each sample has a fine surface roughness that is able to develop mechanical interlocking that increases the bonding power of the interface area. ACKNOWLEDGEMENTS We would like to express our highest gratitude to Dr. Agung Purniawan S.T., M.Eng as the Faculty Advisor of NACE SC ITS for his guidance and encouragement in carrying out this paper. We also sincerely would like to thank NACE SC ITS for the information about this paper competition and all the related parties for the supports. REFERENCES [1] G.P. Guidetti, G. R. (1996), [2] Gonzalez, S. (2001), Spain: Elsevier Inc. [3] Liu, H. (2005). Boca Raton: Lewis Publishers CRC Press Company. [4] Wicks, Z. W. (2007).New York: John Wiley & Sons [5] ASTM-D714.(2009).Pennsylvania:ASTM International. [6] NACE Standard RP0775. (2005).Houston: NACE International. 153
194 Effect of Heavy Percentage in Al203, on Corrosion Resistance of Al Layers of Composite, on Magnesium by Powder Flame Spray Method Ellysda Aulya Santy, Agung Purniawan S.T, Fikra Muhammad Iqbal, *Aldi Megantara Arifin and Muhamad Rizqy Jafa Institute of Technology Sepuluh Nopember * Aldimegaan28@gmail.com Abstract - Coating is one of efficient to protect magnesium from corrosion with giving delimiter between metal and environment. Adding ceramic particles in layer will increase the mechanical character. The technique that for matrix composite aluminium coating in metal surface is thermal spraying. We have an attention from this trial is mixing composite powder which is considered as homogen. impurities element and environmet effects are not considered. The parameters of the procedure of powder flames spray are considered constant and equal in each layer. Purpose of research is to analyze effect composition of AI2O3 against resistance of composite Al/Al2O3 layer corrosion in Magnesium. Coating performed with Powder flames spray method to Magensium substrat with composite layer Al/Al2O3. Independet variable used is weight percent of Al/Al2O3 in composite. There are tests needed on this research which is ; SEMEDX observation, Pull-Off test, Immersion test, Potentiodynamic Polarization Test. Material used is Pure Magnesium. Almunium powder with 98% purity and 10 mm size. Almunium Oxside powder average size 100 mm. Beside that we can use tools like Digital Analytics Balance sheet, Magnetic stirrer, Sand blast tool, Pull Off test tool, plastic container, table test tool. After the test,the result from SEM that powder composition to obtained the best Al/Al2O3 coating is 80% Al and 20% Al2O3. After that, obtained from sticky test that Al2O3 powder increase layer attachment on substrate yet increase of Al2O3 powder not effect stickiness. and the based on table test obtained that lowest corrosion velocity there in weight percent of 20% Al2O3 which is mm size/ year with efficiency 77%. But the lowest there in weight percent of 40% Al2O3, which is mm size / year with efficiency 61%. it proved weight percent of Al2O3 optimum to produce good corrosion resistance is 20% Al2O3. Keywords - Coating 154
195
196 WELDING AND HOT CORROSION 5 th CORSYM, Chennai, India, March 2018
197

198 Effect of Welding Processes on the Intergranular Corrosion of Ultra Low Nickel Chromium Manganese Austenitic Stainless Steel Atul V. Tidke 1*, Sachin P. Ambade 1, Awanikumar P. Patil 2 and Yogesh M. Puri 3 1 Department of Mechanical Engineering, Yeshwantrao Chavan College of Engineering, Nagpur 2 Department of Metallurgical and Material Engineering, Visvesvaraya National Institute of Technology 3 Department of Mechanical Engineering, Visvesvaraya National Institute of Technology, Nagpur *atidke7@gmail.com Abstract Austenitic stainless steels (ASS) are widely used in household products, automobile parts and food industries due to ductility, strength and corrosion resistance. The increase in Nickel price drawn interest towards Low Nickel and Ultra low Nickel Austenitic stainless steel in which Nickel is substitute by Manganese. Ultra Low Nickel Chromium Manganese Austenitic Stainless Steel (ULNASS) material of 4 mm plate thickness procured form local market. Single V butt joint was prepared for welding and single pass welding was applied. In the present investigation, Shielded Metal arc Welding (SMAW) and Gas Metal Arc Welding (GMAW) are used with three different welding speed low, medium and high. The % degree of Sensitization is determined using double loop electrochemical potentiokinetic reactivation (DLEPR) test shows the Intergranular corrosion susceptibility. The results reveal that SMAW and GMAW welded joint are susceptible to Intergranular corrosion of welded joints. Chromium Carbide precipitate along the grain boundaries leads to depletion of chromium beside the grain boundary increases sensitization. From this investigation it is found that intergranular corrosion attack after welding compared to base metal. Keywords ULNASS, SMAW, GMAW, Intergranular corrosion, DLEPR 1 INTRODUCTION Austenitic stainless steels (ASS) are widely used in household products, automobile parts and food industries due to ductility, strength and corrosion resistance [1]. The increase in Nickel price drawn interest towards Low Nickel and Ultra low Nickel Austenitic stainless steel in which Nickel is substitute by Manganese. The solubility of nitrogen in molten and solid steels is increased by manganese. Addition of manganese leads to increase in nitrogen which is strong Austenitic stabilizer [2]. The resistance to intergranular, pitting, crevice and stress corrosion cracking is improved by nitrogen in austenitic stainless steel [3]. Ultra low nickel Austenitic Stainless Steel (ULNASS) constitute of very low nickel content but high manganese content. 2 RESEARCH SIGNIFICANCE The welded joints of ASS are susceptible to Intergranular corrosion (IGC) due to chromium carbide precipitation at grain boundaries [4]. In the present investigation, the welding of ULNASS by Shielded Metal Arc Welding (SMAW) and Gas Metal Arc Welding (GMAW) was studied to determine intergranular corrosion susceptibility of weld joint at three different welding speeds low, medium and high. The welding speeds are 3mm/s, 4.5mm/s and 6mm/s for both SMAW and GMAW. 3 MATERIALS AND METHODS Ultra-low nickel Austenitic Stainless Steel (ULNASS) material of 4mm thickness was procured from local market. The consumables electrodes are E- 308L-16 of 3.2 mm diameter in SMAW and ER308L filler wire of 1.2 mm in GMAW is used. Composition of base material and filler consumable are shown in Table 1 and Table 2 respectively. The welding parameters for SMAW are shown in Table 3. Table 1. Composition of base material Table 2. Composition of filler consumable Table 3. Welding parameters for SMAW Single V butt joint was prepared by considering single pass. The parameters for GMAW are show in 155
 test was carried out using potentiostat (Solartron-1285). The solution used was 0.5M H 2SO 4 +0.01 M NH 4HCN.")
199 Table 4. The shielding gas used was 99% Argon +1% oxygen at flow rate of 14L/min. Table 4. Parameters for GMAW EDM wire cut was used to cut samples of 10 mm 10 mm 4 mm. Double loop Electrochemical Potentiokinetic Reactivation (DLEPR) test was carried out using potentiostat (Solartron-1285). The solution used was 0.5M H 2SO M NH 4HCN. 4 RESULTS AND DISCUSSION The obtained results are shown in Figures 1 & 2. Figure 1. DLEPR curves of SMAW at 3 mm/s, 4.5 mm/s and 6mm/s. Figure 2. DLEPR curves of GMAW at 3mm/s, 4.5mm/s, 6mm/s and BM Percentage Degree of sensitization is determined by Ir/Ia, where Ir is peak reactivation current density and Ia is peak activation current density as shown in Table 5. The results reveal that SMAW and GMAW welded joint are susceptible to Intergranular corrosion of welded joints. Due to the Chromium Carbide precipitate along the grain boundaries leads to depletion of chromium beside the grain boundary increases sensitization. % Degree of sensitization in BM is less as compared to SMAW and GMAW. % DOS in GMAW is greater than SMAW and decreases with increase in welding speed. Table 5. Summary of test results Sample ULNASS BM GMAW 3mm/s GMAW 4.5mm/s GMAW 6mm/s SMAW 3mm/s SMAW 4.5mm/s SMAW 6mm/s 5 CONCLUSION Current density (Ir) Current density (Ia) Degree of sensitization % Welding of Ultra low nickel Cr-Mn Austenitic stainless steel (ULNASS) with GMAW is more susceptible to intergranular corrosion attack as compared to SMAW increase with welding speed. However, both SMAW and GMAW are more susceptible to IGC compared to BM. 6 REFERENCES [1] Harza M., Rao K.S. and Reddy G.M. (2014), Material research and technology, Vol. 3, pp [2] Coetzee M. and Pistorius P.G.H. (1996), The welding of experimental low nickel Cr-Mn-N stainless steel containing copper, south afreican institute of mining and metallurgy, ISSN : X/3. [3] Mohammed R., Reddy G.M. Rao S.K. (2017), Defence technology, Vol 13, pp [4] Taiwade R.V., Patre S.J. and Patil A.P. (2011), Trans Indian Inst Met, 64(6):
200 Influence of Process Parameter for Joining Highly Stable AISI 409M FSS by Resistance Spot Welding S. J. Hariharan 1*, S. T. Selvamani 2, K.Shanmugam 3, V.Balasubramanian 3 1 Department of Mechanical Engineering, Institute of Road & Transport Technology, Erode, Tamilnadu. 2 Department of Mechanical Engineering, Vel Tech Multi Tech Engineering College, Avadi, Tamilnadu 3 Department of Manufacturing Engineering, Annamalai University, Chidambaram, Tamilnadu *harijosun@gmail.com Abstract In recent years, the trend in automotive industries have been changed globally by using a light weight structures which resulted in replacement of thick plates to thin sheets by the manufacturers. Hence the fabricators are meet out the increasing demand to develop a material with appropriate joining technique to address the current scenario. Therefore, in this research work, a highly versatile Resistance Spot Welding (RSW) have been utilized to join the highly stable AISI 409M Ferritic Stainless Steel (FSS) and also the influence of the process parameters on the Microstructure, Mechanical and Corrosion properties of the joints have been studied. Finally, the metallurgical nature of the joints have been characterized by using advanced facilities to understand the influence of process parameters on the joint efficiency. Keywords - Resistance Spot Welding (RSW); AISI 409M Ferritic Stainless Steel (FSS); Mechanical properties; Metallurgical nature; Joint efficiency 1 INTRODUCTION The development of AISI 409M grade Ferritic stainless steel sheets for use in the automotive industry represents new challenges to the resistance welding of these steels. These steel are often used in supporting parts of the car and in parts that are designed to absorb the impact of a crash and corrosion attach. Resistance spot welding is getting significant importance in car, bus and railway bodies etc due to automatic and fast process. The major factors controlling this process are Electrode force, Current, Time, Contact resistance, Surface condition, Property of electrode material and Sheet materials etc. Hamed Pashazadeh.et al.[1] investigated on AISI 1008 commercial steel sheets and the result shows that range of 591 to 615 spot welds can be done for tip dressing operation in studied welding operation. Arvinder Singh.et al.[2] investigated on tensile strength of austenitic stainless steel AISI 316L.They found maximum tensile strength of N/mm 2 at pressure 3.1KN,welding time 4ms and current 15KA. Pandey et al. [3] investigated carbon cold rolled 0.9mm thick mild steel sheets to find the effect of parameters on shear tensile strength and the optimum result was found for which the joints fabricated by Pressure 0.79KPa, Current 6.8KA, and the Holding time of 5 sec. Therefore, in this research work, the advanced resistance welding technique has been utilized to join the AISI 409M grade FSS and the influence of process on the mechanical properties and the corrosion rate have been determined to understand the integrity of the joints. 2 RESEARCH SIGNIFICANCE In the automotive sectors, the fabrication works are highly concentrated for utilizing the thin sheets instead of thick plates in order to increase the production rate and to achieve lighter weights in the vehicles with greater endurance. Therefore, in this research work, the advanced resistance spot welding have been utilized for processing the thin sheets and also the suitable working constraints have been estimated to develop the joint with good mechanical and metallurgical properties subjected to dynamic conditions. 3 MATERIALS AND METHODS The AISI 409M grade Ferritic stainless steel sheets with a thickness of 1.2 mm sheet metal has been taken to carry out this research work. The sheets were cut into required size by shear off machine.the chemical composition of the base metals were obtained using a vacuum spectrometer (Make: ARL USA; Model: 3460). Sparks are ignited at various locations of the base metal sample and their spectrum is analyzed for the estimation of alloying elements which is shown in the Table 1. Table 1. Chemical composition of the base metal Alloy Cr Ni Fe Mn (%) (%) (%) (%) SS 409M


201 Figure 1. The ERSW Joint 4 RESULTS AND DISCUSSION The spot welding process parameters play an important role for the strength of the welding joint. If one of the parameter changes, it may affect the strength of the joint so the combination of suitable parameters are very important to get a high strength welding joint. The process parameters affect as an increase in weld current, weld time and electrode force results in an increase in weld nugget diameter and width. An increase in weld current, weld time and electrode force results in an increase in electrode indentation. So the parameters used should provide the high strength. During the joining of AISI 409m ferritic stain less steel by ERSW process, when the process parameter power is bring down to 50 watts then the joint is not properly bonded due to less heat generation and insufficient pressure bimetallic joints respectively. Also the power is increased more than watts then the metal underwent large deformation due to high heat generation and excessive pressure for bimetallic joints respectively. If the pressure is lower than 3.26 Kgf, deformation of the material is low, and the joints are weakly bonded for all the bimetallic joints respectively. If the time is more than 2.84 sec, then it resulted in extensive deformation for all the bimetallic joints respectively. If the time lower than 1.16 sec, the frictional heat generation is too low and hence the bonding is improper for all the bimetallic joints respectively. If the pressure is greater than 3.94 Kgf, the frictional heat generation is too high and hence, excessive flash formation occurred for all the bimetallic joints respectively. Finally, the maximum TSFL was obtained 12 KN through the joints welded by at a 1.5 sec, 55 W, 4 KgF under the Electrical resistance spot welding process. From the results, it was found that the corrosion rate was minimized in the optimized condition. Figure 2. Macrostructure of the weld zone Figure 3. Microstructure of the Weld zone 5 CONCLUSION The joints are fabricated successfully without defects The maximum TSFL was obtained as 12 KN The micro and macro structure of the joints shows the fine and elongated grains due to application of pressure and heat during the welding The welding time shows the most influencing parameter The corrosion rate have been increased to 25% from its base metal 6 ACKNOWLEDGEMENTS The authors wish to thank the CEMAJOR Laboratory, Department of Manufacturing Engineering, Annamalai University, India for extending the facilities of Metal Joining and Material Testing lab to carry out this investigation. 7 REFERENCES [1] Hamed Pashazadeh,Yousof Gheisari, Mohsen Hamedi, Statistical modeling and optimization of resistance spot welding process parameters using neural networks and multiobjective genetic algorithm Received: 7 January 2014 / Accepted: 24 February 2014 Springer Science+Business Media New York 2014, J IntellManuf DOI /s [2] Arvinder Singh, Vanraj, Kant Suman, Suri N.M, International Journal of Scientific & Engineering Research, Volume 4, Issue 7, July-2013, ISSN [3] A.K.Pandey, M.I.Khan, K.M.Moeed, International journal of engineering science and technology, Vol. 5,
202 Mechanical Behavior of the Advanced CMT welded AA7075-T651 Grade Aluminum Alloy for Automotive Application S.T. Selvamani 1*, P. Govintarajan 2, K.Ajaymohan 3, S. J. Hariharan 3 and M.Vigneshwar 1,4 1 Department of Mechanical Engineering, Vel tech Multitech Engineering College, Chennai 62, 2 Department of Mechanical Engineering, Sri Sai Ram Institute of Technology, Chennai Department of Mechanical Engineering, Institute of Road and Transport Technology, Erode 16 4 Department of Metallurgy and Materials Science Engineering, Vel Tech Dr. RR Dr.SR R&D Institute of Science and Technology, Avadi, Chennai 62 * selva_balu@rediffmail.com Abstract The Al-Zn-Cu series aluminum alloys were the most widely used aluminum alloys in the automotive, aerospace and defense industries due to high strength with improved corrosion and fatigue behavior. Now-a-days, the manufacturing industries are utilizing thin sheets for fabrication of their product. Hence a suitable joining technique with high performance and zero emissions are specifically required. Therefore, in this research work, the AA7075-T651 (3mm) grade aluminum alloy was joined using an Advanced Cold Metal Transfer (CMT) welding machine with an aim to compete with the global market. The tensile and microhardness behavior of the joint were identified and the microstructural variation during the process were studied and reported in detail. Finally, the joint interface was characterized to determine the nature of the joint efficiency. Keywords - AA 7075-T651 Aluminum alloy; CMT Welding; Mechanical Properties; Joint efficiency 1 INTRODUCTION Aluminium alloys are widely used in the automobile sector due to the high specific strength, good corrosion resistance and better electrical and thermal conductivity properties.the fusion welding of aluminium alloys are considered to be challenging for certain apparent reasons like presence of tenacious and insulating oxide layer, high thermal conductivity, and high coefficient of thermal expansion [1]. Also, fusion welds of aluminium alloys always pose certain issues to welding engineers such as gas porosity, solidification cracking, and post weld distortions [2]. In 2004, FRONIUS found a fusion welding technique known as Cold Metal Transfer (CMT) welding machine which uses a controlled heat input under an innovative wire feed mechanism. It was found that this welding produces a limited heat input during welding and can overcome the defects faced during fusion welding processes [3-4]. Therefore, in this research work, an advanced TPS 400i CMT welding machine has been used to join the AA 7075 aluminum alloy and its mechanical properties such as hardness and tensile strength have been evaluated and presented in detail. 2 RESEARCH SIGNIFICANCE The CMT welding technique is one of the key findings in the welding research with an innovative wire feed droplet detachment mechanism which can join alloys of any configurations and overcome the problems faced by the other fusion welding techniques. An advanced TPS 400i CMT welding machine has been utilized to join the aluminum alloys which are found to enhance the mechanical properties drastically. 3 MATERIALS AND METHODS The AA7075-T651 grade aluminum alloy (Zn-5.1, Mg-2.3, Cu-1.54, Fe 0.57, Cr-0.072, Al ) was used as the base metal. The metal was joined using the cold metal transfer welding process and the corresponding process parameters were given in Table 1. Table 1. Process Parameters Material AA7075 T651 Voltage Welding Speed Current (V) (mm/min) (A) The fabricated joints were subjected to microhardness and tensile tests and the corresponding results were noted. The specimens were prepared as per ASTM standards. 159

203 4 RESULTS AND DISCUSSION The microhardness survey was carried out with the help of Vicker s microhardness tester and the readings were recorded. It was found that the hardness was minimum in the weld zone but it is found to suddenly increase in the heat affected zone and the corresponding base metal. This is because, due to continuous filler deposition in the traverse direction during welding, the grains get oriented and forms a boundary at the offset of weld zone which subsequently increases the hardness of the heat affected zone. The Electromechanically controlled universal tensile tests reveal that the failure occurs in the heat affected zone. Also the weld zone shows strength of 433.6MPa which is only a 20% reduction compared to the base metal and the corresponding tensile graph was displayed in Figure. 1. It can be attained only due to the low input produced because of the innovative wire feed mechanism during arc initiation and the corresponding short circuit transfer during welding 5 CONCLUSION 1. The advanced CMT welding was successfully carried out on the AA7075 aluminum alloys under the conditions of 11(V) voltage, 280 (mm/min) welding speed and 90 (A) current. 2. The tensile strength was found to be MPa which is only a reduction of 20% from the base metal 3. The microhardness was found to be decreased in the weld zone and subsequently increased in the heat affected zone 6 ACKNOWLEDGEMENTS The authors are grateful for the DST-SERB for providing funding under EEQ (F.No.EEQ/2016/000114) and also wish to thank the Chairman, Col. R. Rangarajan, Vel Tech Institutions for providing support and we wish to express our gratitude to Dr. V. Balasubramanian, Director (CEMAJOR), for providing testing facilities to carry out this investigation. 7 REFERENCES Figure1.The Tensile Test Graph (Computerized) [1] Totten G.E, Mackenzie S. (2003), Handbook of aluminum vol 1. Physical metallurgy and processes, Marcel Dekker Inc: USA. [2] Olson D.L.,Siewert T.A., Liu S., Edwards G.R.(1993), ASM Handbook Volume 6: Welding, Brazing, and Soldering, ASM International, ISBN: [3] Yang, X.R.(2006), CMT: Cold Metal Transfer MIG/MAG dip-transfer process for auto- mated applications, Arc Welding Machine vol.36, pp.5 7. [4] Amin S. (2015), A heat source model for cold metal transfer (CMT) welding, Journal of Thermal Analysis and Calorimetry, Vol.122, pp
204 Comparison of Mechanical Properties of Friction Stir Welded and Advanced CMT Welded AA 7075 Aluminum Alloy S. T. Selvamani 1*, P.Govintarajan 2, K.Ajaymohan 2, S.J.Hariharan 3 and M.Vigneshwar 1,5 1 Department of Mechanical Engineering, Veltech Multitech Engineering College, Chennai Department of Mechanical Engineering, Sri Sai Ram Institute of Technology, Chennai Department of Mechanical Engineering, Institute of Road and Transport Technology, Erode Department of Metallurgy and Materials Science Engineering, Vel Tech Dr.RR Dr.SR R&D Institute of Science and Technology, Avadi, Chennai * selva_balu@rediffmail.com Abstract The need for effective joint efficiency is dayby-day increasing due to progressive development in the manufacturing sectors. In global scenario, the effective joining technology for the commercially used aluminum alloys are many. Therefore, in this research work, with an aim to depict the novel joining technique, high strength armor grade AA 7075 Al alloy was joined by a solid state Friction Stir Welding (FSW) technique and a fusion state Advanced Cold Metal Transfer - TPS 400i (ACMT) welding technique which were considered as the best in the industries. Then, the mechanical properties such as strength and microhardness were measured using advanced facilities to determine the corresponding properties. Finally, the joint efficiency of both the weldments were analyzed to determine the suitable welding technique suitable for the welding industries. Keywords - AA 7075 Al alloy, FSW, ACMT; Mechanical properties; Joint efficiency. 1 INTRODUCTION The aluminum alloys are widely used in various industries due to its high strength to weight ratio. The Aluminum alloys are processed into various components depending upon the requirements out of which joining plays a key role. The effective joining of aluminum alloys are of great significant to overcome the failures [1-3]. There are many techniques such as fusion and solid state welding techniques existing in the global market. During friction stir welding, the defects such as porosities were avoided and the joint strength is found to be better than the fusion state processes [4]. The cold metal transfer welding technology revolutionized the fusion technology by providing low heat input while joining with low spatter and zero distortion [5]. Though the solid state friction stir welding process was found to provide good strength but it produces tunnel holes, cracks and other metallurgical based defects during welding which can be overcome by using the fusion state advanced cold metal transfer process. Hence, in this research work, the AA7075 aluminum alloy was joined using FSW and CMT welding process and their mechanical properties with metallurgical characteristics were analyzed to understand the joint efficiency of the respective welding processes. 2 RESEARCH SIGNIFICANCE There are many problems faced by the manufacturers while fabricating a component into a reliable product where a sound joint plays a significant role for providing better life of the joints. Hence a suitable joining technique is mandatory for which two of the industrial best friction stir welding and cold metal transfer welding has been utilized to join the aluminum alloys and their individual properties have been analyzed to identify a better welding process for the production sectors comparatively. 3 MATERIALS AND METHODS In this research work, AA 7075-T651 aluminum alloy was used due to its high strength, versatility and availability. The chemical composition and the mechanical properties of the base metal was provided in Table 1 and Table 2 respectively. Table 1. Chemical Composition of the Base Metal Cr Cu Fe Mg Zn Al Bal Table 2. Mechanical properties of the Base Metal Yield Strength (MPa) Tensile Strength (MPa) Fatigue Strength (MPa) Hardness (Hv) Elongation (%)


205 It was found that no defects were formed in both the weldments. The uniform grains were observed in the CMT welding process with fine grains but FSW joints is found to exhibit an average fine grains due to the upward and downward flow of the metal. Also compared to FSW, the CMT welded joints were found to exhibit a narrow HAZwhich is the principle reason for this process to be considered as better welding process compared to friction stir welding technique. Figure 1. The friction stir welding machine The Friction Stir Welding (FSW) was carried out at a Downward force of 25 MPa, Transverse speed of 1 mm/sec and a Rotational speed of 900 rpm (Optimized condition). The CMT welding was carried at a voltage of 10.5 V,welding speed 275 mm/min and a current 85A. The FSW and CMT welding apparatus were shown in Fig. 1 and Fig.2 respectively. The joints were subjected to mechanical testing such as hardness and tensile testing and was characterized using advanced optical microscope to understand the homogeneity of the grains for the corresponding welding processes. Figure 2. The CMT welding machine 4 RESULTS AND DISCUSSION The microhardness survey was taken for the friction stir welded and cold metal transfer welded joints and the average results were taken. It was found that the hardness has been increased in the weld zone (WZ) compared to Heat Affected Zone (HAZ) and the base metal for the friction stir welded joints. In case of CMT welding, the hardness was decreased in the weld zone compared to the heat affected zone and the corresponding base metal. 5 CONCLUSION The AA7075 grade aluminum alloys were successfully joined using both friction stir welding and cold metal transfer welding processes. The maximum hardness was obtained in the weld zone of the friction stir welding process compared to HAZ whereas in CMT welding process, minimum hardness was obtained in the weld zone compared to HAZ. The grains were found to be very fine and uniform grain boundaries were observed in the CMT welding process. 6 ACKNOWLEDGEMENTS The authors are grateful for the DST-SERB for providing funding under EEQ (F.No.EEQ/2016/000114) and also wish to thank the Chairman, Col.R.Rangarajan, Vel Tech Institutions for providing support and we wish to express our gratitude to Dr.V.Balasubramanian, Director (CEMAJOR), for providing testing facilities to carry out this investigation. 7 REFERENCES [1] Warner T. (2006), Recently developed solutions for aerospace applications, Materials Science Forum, Vol , pp [2] Mathers G 2002 The welding of aluminium and its alloys.cambridge (UK Woodhead, publishing Limited). [3] Srinivasa Rao K. (2004), Studies on friction stir welded AA7075Aluminium Alloy, Vol 57, pp [4] Su J.Q., Nelson T.W., Mishra R., Mahoney M. (2003), Microstructural investigation of friction stir welded 7050-T651 aluminium. Acta Mater, Vol.51,pp [5] Elrefaey A. (2013), Effectiveness of cold metal transfer process for welding 7075 aluminium alloys, Science and Technology of Welding and Joining, Vol.20, pp

206 A Study on Corrosion Sensitivity of Friction Stir Spot Welded Dissimilar Al/Cu Joints S. Siddharth 1*, T. Senthilkumar 2 1 Department of Mechanical Engineering, University College of Engineering, BIT Campus, Anna University Tiruchirappalli, Ph University College of Engineering, BIT Campus, Anna University Tiruchirappalli * sksmsiddharth1@yahoo.in Abstract In this investigation, friction stir spot welding of dissimilar combinations (1.5 mm thick) of aluminium and copper such as Al5052/C10100, Al5083/C10100 and Al5086/C10100 were conducted by keeping the important process parameters such as tool rotational speed, plunge depth and dwell time as constant. The welded joints were subjected to corrosion analysis. Using electro-chemical system, polarization tests were conducted. Further, the corrosion behavior of the joints was studied using salt spray method and immersion tests in 5% NaCl solution. It was observed that the weld joints of Al5083/C10100 were more resistant to corrosion as it exhibited more positive potential of Epit value of mv during polarization tests. The loss of material loss during salt spray tests and immersion tests for Al5083/C10100 joints were lesser than the other two combinations. XRD analysis indicated presence of intermetallics in Al5052/C10100 and Al5086/C10100 combinations, which increased the corrosion behavior. Keywords - Friction stir spot welding, corrosion, aluminium, copper. 1 INTRODUCTION Friction stir spot welding (FSSW) is a new modified linear variation of the patented Friction stir welding process, by The Welding Institute [1]. This is a three-step procedure involving plunging, stirring and withdrawal. The FSSW process involves joining of dissimilar metals by plunging a high speed rotating non-consumable tool into lap configuration [2]. Manickam S et al conducted FSSW experiments on dissimilar combination of Al6061 aluminium and Copper alloy and optimized the process parameters for achieving higher tensile properties [3]. S.G. Arul et al conducted FSSW experiments using Al 5754 plates and observed the failure criteria like necking and shearing [4]. 2 RESEARCH SIGNIFICANCE From the study of previous investigations, it could be inferred that the research on corrosion aspects of dissimilar Al/Cu welded joints were not found. Thus, in this current investigation, the corrosion behavior of dissimilar friction stir spot welded joints of Aluminium and Copper such as Al5052/C10100, Al5083/C10100 and Al5086/C10100 were conducted by using electrochemical polarization testing method, salt spray testing and immersion testing. 3 MATERIALS AND METHODS The base materials that were used for this investigation were 1.5 mm thick rolled sheets of 5 series aluminium alloy such as Al5052, Al5083 and Al5086 and 1.5 mm thick copper C10100 plates. The specimens were sized to 100 mm length and 30 mm breadth, with an overlap of 30 mm for joints. The chemical composition and mechanical properties of the base materials are indicated in Table 1. The three sets of dissimilar friction stir spot welding (FSSW) joints were done using a modified heavy type computer numerically controlled vertical milling machine. The equipment is shown in Fig 1 (a). The cutting tool of the milling machine was replaced with a non-consumable FSSW tool made up of H13 material. The FSSW tool was made with cylindrical straight geometry, having a cylindrical shoulder diameter of 16 mm, cylindrical pin diameter of 6 mm and pin height of 1.5 mm. The FSSW tool is shown in Fig 1 (b) with its dimensions. (a) (b) All dimensions are in mm Figure 1. (a) Friction stir spot welding equipment; (b) FSSW Tool From previous literatures and through experimental trials, the FSSW process parameters were set as tool rotational speed of 1150 rpm, dwell time of 11 seconds, 1.8 mm plunge depth, axial spindle feed at 18 mm/min and an axial force of 1000 N, joints were fabricated. 163


207 Using a software based electro-chemical system (Gill AC type), polarization tests were conducted by incorporating the potentio-dynamic method, for evaluating the pitting corrosion aspects of the welds. Using salt fogging testing equipment, the corrosion aspects of the welded zone of the joints were studied. The equipment comprises of a closed chamber made up of glass and contains square shaped rods made up of plastic for the specimens to be tied and arranged. Immersion test was conducted, by immersing the specimens in 5% NaCl solution for 15 days. 4 RESULTS AND DISCUSSION For electrochemical corrosion testing, the corrosion specimens were placed in the flat cell by using a shoe assembly and 250 ml of the testing solution was poured into the flat cell and with the help of the leads from the cell, the three electrodes were joined to the corrosion equipment. The joints that tends to exhibit positive potential or low negative potential values were termed to have a higher pitting resistance. The potentio-dynamic curves are indicated in Fig 2. Figure 2. Potentio-dynamic polarization curves It was observed that the weld interface of Al5083/C10100 possessed better corrosion properties as it had a more positive Epit value of mv than the other two welds of dissimilar Al/Cu combination. The micrographs after pitting corrosion test for the welds are indicated in Fig 3. Pit density of the weld region of Al5086/C10100 and Al5052/C10100 combinations were found to be higher than the pit densities of Al5083/C10100 welds, which was found to be in agreement with the obtained ranges. In salt spray test, it was observed that the rate of corrosion of welded Al5052/C10100 and Al5086/C10100 samples were higher than Al5083/C10100 joints, throughout the testing duration. From immersion testing, it was observed that Al5083/C10100 joints exhibited higher resistance to corrosion than the other two combinations which was similar to the observations obtained from the potentio-dynamic polarization studies. XRD analysis at weld regions of Al5052/C10100 joints indicates presence of Al 2Cu, Al 2O 3, Mg 2Si and MgO, shown in Fig 4. (a) (b) (c) Figure 3. Joint microstructures after pitting corrosion (a) Al5052/C10100, (b) Al5083/C10100 and (c) Al5086/C10100 Figure 4. XRD at Al5052/C10100 weld interface 5 CONCLUSION Thus, friction stir spot welded joints of dissimilar Al/Cu joints such as Al5052/C10100, Al5083/C10100 and Al5086/C10100 were fabricated and their corrosion behavior were studied. Potentio-dynamic polarization studies revealed that the corrosion of Al5083/C10100 was lesser than the other two combinations with a more positive pitting potential of mv. Microstructural evaluation of the corroded samples revealed higher pitting density of Al5052/C10100 and Al5086/C10100 joints and this was attributed to the formation of more intermetallics such as of Al2Cu and Al4Cu9 at the joint zone. 6 ACKNOWLEDGEMENTS The authors would like to thank Mr. Murali Lakshminarayanan MD/Omega Teckniks Chennai for joints fabrication. 7 REFERENCES [1] Thomas W. M., Nicholas E. D., Needham J. C., Murch M. G., Temple smith P. and Dawas C.J. (1995, International Patent Application No. PCT/GB92/ [2] Harsha Badarinarayan. (2009), Ph D Thesis, Missouri University, USA. [3] Manickam. S and Balasubramanian V. (2015), Journal of Manufacturing Engineering, Vol. 10, pp [4] Arul S. G., Pan T., Lin P. C., Pan J., Feng Z. and Santella M. L. (2005), Proceeding of 2005 SAE World Congress - Detroit, MI, United States. 164
208 Welding and Corrosion Study of Ferritic Stainless Steel Weld Joint Prateek Shendre 1*, Ravindra V. Taiwade 1, Jagesvar Verma 2 1 Department of Metallurgical and Materials Engineering, V.N.I.T., Nagpur , India 2 School of Mechanical Engineering, Lovely Professional University, Punjab, *prateekshendre@students.vnit.ac.in Abstract In this work, examination of joint properties of ferritic stainless steel weld was carried out by using ferritic E430 electrode. Since to weld ferritic stainless steel is very difficult due to pronounced grain growth which may causes to solididfication cracking. However, an attempt has been made to join ferritic stainless steel with similar composition filler. The optical microscopy results of weld showed dualphase microstructure of ferrite and martensite. The martensite present in the intergranular side of ferrite matrix. The modified Strauss test indicated intergranular corrosion attack in the weld zone. Higher pitting was observed in the weld compared to ferritic base metal. ferritic stainless steel electrode, to provide cost effectiveness solution and also check the sound weld of FSSs. 2 MATERIAL AND METHODS AISI 430 FSS base metals and electrodes composition are given in Table 1. The samples with dimension of 100 (length) 100 (width) 3 (thickness) [mm] were cut and BM and 850 ºC at 1 h for AISI 430 FSS BM. Table 1. composition of base metal and electrode Keywords - Ferritic stainless steel, Strauss test, Intergranular. Materi al Si M n P S Cr Ni Mo C 1 INTRODUCTION The price of the nickel (Ni) is relatively high on the market, which breaching the backbone of austenitic producer and end users, to resolve this problem, market is looking an substitute [1]. Ferritic stainless steels (FSSs) may bridge the gap of this high cost alloying element. Ferritic stainless steels are low-cost alternative of austenitic stainless steels (ASSs) and exhibit high resistance to stress corrosion cracking (SCC) and pitting corrosion [2], it is also distinguished by higher thermal conductivity and smaller linear expansion [2]. Both FSS and ASS are preferably applied in certain environments such as chemical tankers, ocean engineering, pressure vessels and heat exchanger pipes [3,4]. Ferritic stainless steel may be also one of the choices, where Ni-free stainless steels are required, one such application is a TiCl4 reduction retort with Mg, where Mg has the propensity to leach away Ni from the ASS and degrading the mechanical properties [5]. However, joint is a very important consideration for the safe service life of the parts. Shielded metal arc welding (SMAW) is prevalently employed joining process in most of the industrial domains due to economic flexibility and portability [6]. However, many researchers had carried out the joining of FSSs with other popular alloys. Sara Aguilar et al. [7] carried out the SMAW process of AISI 316L ASS with AISI 430 FSS by using two different electrodes namely austenitic AWS E309L and AWS E2209 DSS with a single pass welding by employing a low heat input ( J/mm range). Authors concluded that the size of the HAZ and the average size of the ferrite grain in the zone of coarse grain, completely depends on the heat input and also stated that the morphological features and the amount of delta (δ) ferrite are a function of the chemical composition of the filler metal. The aim of this paper is to weld the ferritic stainless steel by SMAW by using 430 FSS E430 electro de Square butt welding (1.2 mm gap, with DCEN polarity) was performed by considering parameters such as current; 120 A, voltage; 25 V and welding speed; 4.7 mm/s, heat input was calculated; J/mm, assuming 75% efficiency [5]. Metallographic samples were prepared (in transverse section of welded region) as per ASTM E3-95 [5]. Microstructures of different zones (WM and HAZ) were observed using an optical microscope (Zeiss AxioLab A1) Modified Strauss test was also conducted to detect the intergranular corrosion (IGC) attack, if any, in the weldment according to ASTM A 262 practice-e. Potentiodynamic polarization test (for pitting corrosion) were performed in 3.5 wt% NaCl solution by using an electrochemical analyzer. The range of the potential was set to -300 mv (EOCP) to 1400 mv and the scanning speed to 0.5 V/s for pitting corrosion. 3 RESULTS AND DISCUSSION The examination of welds was performed from BM across the HAZ to WM. Fig.1(a) and Fig.1(b) illustrate the optical macrographs of both the welds, sound welded joints without any defects were observed. The AISI 430 weld showed ferrite matrix with intergranular martensite and it was observed that more amount of martensite 165

![It was reported [7] that the microstructure of HAZ was mainly influenced by welding heat source and physical properties of the materials, whereas WM microstructure can be controlled by both chemical](/docs-images/78/76861956/images/209-2.jpg "composition of electrodes and welding parameters.")

209 Figure 1. Optical micrograph formed in the weld as compared to BM, however, coarse martensite was observed in the weld compared to BM. large grains of ferrite were observed along with martensite in AISI 430 FSS side HAZ. It was reported [7] that the microstructure of HAZ was mainly influenced by welding heat source and physical properties of the materials, whereas WM microstructure can be controlled by both chemical composition of electrodes and welding parameters. Pitting corrosion represents the localized small hole, which causes of catastrophic failure of the materials Weld showed heavy pits and higher pitting compared to AISI 430 FSS BM. Weld showed V Epit and BM showed V Epit. Chloride ions easily accumulate in the pits, changing the micro-environment. Heavy pits were observed in martensite phase than ferrite phase as it is shown in Fig. 2(a,b) Figure 2. pits (a) BM (b) weld Strauss test was carried out to check the susceptibility of weldments to intergranular corrosion attack. Tensile specimens were experienced in the Strauss medium (Cu-CuSO4-16% H2SO4), boiling at 100 ºC for 15 h and then followed by the tensile test, the fracture occurred from AISI 430 FSS side HAZ in indicated the intergranular attack in the HAZ compared to BM and weld metal. Fig. 3(a,b) revealed the intergranular attack in both the cases. Figure 3. Strauss test (a) BM, (b) weld 4 CONCLUSION 1. Sound weld joint was produced 2. No solidification cracking was evident 3. Microstructure was observed ferrite with intragranular martensite 4. More pits was observed in weld 5. Strauss test revealed the heat affected zone sensitization of AISI 430 ferritic side in both the weld cases. 5 REFERENCES [1] Oshima T, Habara Y. and K. Kuroda (2007), Efforts to save nickel in austenitic stainless steels, ISIJ Int. 47, 359. [2] G. Mallaiah, A. Kumar, P.R. Reddy and G.M. Reddy (2012), Influence of grain refining elements on mechanical properties of AISI 430 ferritic stainless steel weldments, Taguchi approach, Mater. Des. 36, 443. [3] K.R Gadelrab, G. Li, M. Chiesa and T. Souier (2012), Local characterization of austenite and ferrite phases in duplex stainless steel using MFM and nanoindentation, J. Mater. Res. 27, [4] R. Kaçar and M. Acarer (2003), Microstructureproperty relationship in explosively welded duplex stainless steel-steel, Mater. Sci. Eng. A 363, 290. [5] J. Verma and R.V. Taiwade (2016), Effect of austenitic and austeno-ferritic electrodes on 2205 duplex and 316L austenitic stainless steel dissimilar welds, J. Mater. Eng. Perform. 25, [6] K.D. Ramkumar, A. Chandrasekhar, A.K. Singh, S. Ahuja and N. Arivazhagan (2015), Effect of filler metals on the structure-property relationships of continuous and pulsed current GTA welds of AISI 430 and AISI 904L, Metallogr. Microstruct. Anal. 4, 525. [7] F. Mas, G. Martin, P. Lhuissier, Y. Bréchet, C. Tassin, F. Roch, P. Todeschini and A. Simar (2016), Heterogeneities in local plastic flow behavior in a dissimilar weld between low-alloy steel and stainless steel, Mater. Sci. Eng. A 667,
210 CORSYM, Chennai, India, March 2018 Oxidation and Corrosion Behaviour of Ni-based Amorphous Alloy in Nitric Acid Environment Chiranjit Poddar 1, 2, J. Jayaraj 2 and S. Ningshen 2* 1 Homi Bhabha National Institute, Mumbai , India 2 Corrosion Science and Technology Division, IGCAR, Kalpakkam , India * ning@igcar.gov.in Abstract Air-oxidation below the crystallization temperature is proposed as a technique to improve the corrosion resistance of Ni60Nb40 amorphous alloy in nitric acid environment. In the present work, airoxidation behaviors of Ni60Nb40 amorphous alloy have been investigated below its crystallization temperature (665 o C) open to the air-environment. The oxidation kinetics follows parabolic rate law and the rate constant increases with the increasing oxidation temperature. The surface of oxide film at 450 o C was predominantly composed of Nb-oxide, with traces of Ni-oxide. Similarly, at 550 C the outward diffusion of Ni-cation results into cubic NiO on the surface. The electrochemical impedance spectroscopy experiment show the film formed at 450 C exhibits highly protective and high corrosion resistance to 11.5 M HNO3 environment, when compared to the film at 550 C. Keywords Amorphous alloy, Oxidation, XPS, Corrosion 1 INTRODUCTION Owing to the high corrosion resistance, the metallic glasses (MG) are considered for service in nitric acid environment [1]. The reason for the excellent oxidation resistance of metallic glasses is the formation of uniform protective oxide films [2]. Poddar et al. reported that the inverse oxidation behavior of Ni 65Nb 30Ta 10 metallic glass [3]. At 450 C, the Nb and Ta-oxide formed on the surface. However, at 550 C, Ni-oxide has formed on the surface. Jayaraj et. al. reported that the corrosion resistance of the Ni 60Nb 40 amorphous alloy in nitric acid medium was attributed due to the Nb-oxide formed on the surface [4]. The desired oxide layer on the surface of the metallic glass based on the oxidation temperature could be tailored. These oxide layers can also be used to enhance the catalytic or corrosion resistance properties. In this work, the oxidation kinetics of Ni 60Nb 40 amorphous ribbon was investigated using therm-ogravimetric analysis (TGA). The X-ray diffraction and X-ray photoelectron spectroscopy (XPS) techniques were employed to evaluate the structure, and the nature of oxide film formed on the Ni 60Nb 40 amorphous alloy. The electrochemical impedance spectroscopy (EIS) experiment was carried on the as-spun and air-oxidized Ni 60Nb 40 amorphous ribbon sample in 11.5 M HNO 3 environment. 2 RESEARCH SIGNIFICANCE The air-oxidation behavior of the Ni 60Nb 40 amorphous alloy bellow the crystallization temperature has not been reported yet. Therefore, understanding the oxidation and its corrosion behavior are highly important as it is decided the performance of the amorphous alloy in service for nitric acid environment. 3 MATERIALS AND METHODS Good quality Ni 60Nb 40 ribbon sample of 40 µm thicknesses was prepared by melt spinning [5]. To establish the oxidation kinetics of Ni 60Nb 40 amorphous alloy, the isothermal thermogravimetric analysis (TGA) was carried out at 450 and 550 C in dry oxygen-argon gas (20 % O2) at the flow rate of 20 ml/min for 5 h. 3.1 Surface characterization For analysis of the phase formation on as-spun and airoxidized ribbons, the XRD patterns were recorded. The XPS was used to characterize the oxide film on the surface of the air-oxidized ribbon. The EIS is performed in 11.5 M HNO 3 to characterize the protective nature of the air-oxidized film. 4 RESULTS AND DISCUSSION 4.1 Oxidation kinetics and phase analysis Figure 1. Isothermal TGA of the as-spun Ni 60Nb 40 ribbon at 450 and 550 C temperature 167
211 CORSYM, Chennai, India, March 2018 To establish the oxidation kinetics of Ni 60Nb 40 ribbon, the mass gain data with respect to time at 450 and 550 C temperatures are plotted and shown in Fig. 1. The oxidation kinetics at both the temperatures obeyed two stage parabolic rate laws. Parabolic rate constant (k p) value obtained from the linear least-square fitting of the data which is governed by the equation. i.e ( m/a) 2 = k p t+c. The rate of oxidation at 550 C is higher than at 450 C oxidation. The oxidation kinetics follow parabolic law is indicated that the diffusion of oxygen or cation is the rate controlling step. and most of the Ni is accumulated beneath of the surface oxide layer. At 550 C, the Ni is diffused to the surface and oxidized to the NiO [3]. The XPS analyses indicated that the inverse oxidation operated at 450 and 550 C. 4.3 Electrochemical impedance spectroscopy Figure 2. XRD plot for as-spun and oxidized ribbon The XRD pattern of the as-spun and air-oxidized Ni 60Nb 40 ribbons at 450 C revealed a broad halo peak, which is characteristic of the amorphous nature of the sample, as shown in Fig.2. The XRD peak for 550 C is corresponding to the nano-crystalline NiO [3] that is superimposed on the amorphous halo peak. 4.2 XPS analysis of the surface of the air-oxidized ribbon Figure 4. Electrochemical impedance spectroscopy of the as-spun and air-oxidized ribbon The electrochemical impedance spectroscopy tests for the air-oxidized and as-spun ribbon were carried out at OCP in 11.5 M HNO 3 environment, and as shown in Fig. 4. For 450 C oxidized ribbon, the high R p value compared to the as-spun and 550 C oxidized ribbon was indicative that the high corrosion resistance of the enriched Nboxide film. The low R p for 550 C oxidized ribbon indicated that the surface Ni-oxide film is inferior. 5 CONCLUSIONS The oxidation kinetics of the Ni 60Nb 40 amorphous ribbon for the temperatures studied followed the parabolic rate law. The electrochemical impedance spectroscopy showed the oxidized film at 450 C enriched with Nboxide exhibits high corrosion resistance to the 11.5 M HNO 3 environment. At 550 C, the Ni-oxide film exhibited low corrosion resistance. 6 REFERENCE Figure 3. (a) XPS survey scan of air-oxidized surface The XPS survey scan obtained from the surface of 450 C oxidized sample contains week Ni2p and strong Nb3d spectra as shown in Fig 3a. However, at 550 C oxidized sample, only strong Ni2p peak observed on the surface, interestingly, the Nb3d spectra is completely absent. At 450 C, the Nb is preferentially oxidized at the surface [1] C. Qin, K. Asami, H. Kimura, W. Zhang, A. Inoue, Electrochemistry Communications. 10 (2008) [2] P.F. Gostin, S. Oswald, L. Schultz, A. Gebert, Corrosion Science 62 (2012) 112. [3] C. Poddar, J. Jayaraj, C. Mallika, U. Kamachi Mudali, Journal of Alloys and Compounds 728 (2017) [4] J. Jayaraj, D. Nanda Gopala Krishna, C. Mallika, U. Kamachi Mudali, Materials Chemistry and Physics. 151 (2015) 318. [5] M. Lee, B. Donghyun, W. Kim, D.H. Kim, Mater. Trans. 10 (2003)


 - standard 6-WIRE")


212 PARSTAT 4000A potentiostat/galvanostat New user selectable stability modes to further expand compatability with the most Market leading native current range (40 pa - 4 A) Unmatched compliance voltage for the most challenging corrosion research (48 V) 10 MHz EIS Frequency Range for electrochemical studies of high-end materials analysis PARSTAT 3000A potentiostat/galvanostat Now with dual voltage ranges providing both resolution and accuracy (6 V ) and capability (30 V) - standard 6-WIRE function combines with 30 V Range for single cell analysis during Stack Testing and with 6 V Range for Anode/Cathode tests Unmatched 7 MHz EIS Frequency range Small form factor for space conscious laboratories *New features also available on the multi-channel PMC-2000 channel AMETEK Instruments India Pvt. Ltd, 306, Delta Wing, Third Floor, Raheja Towers, Anna Salai, Chennai , kumar.saravana@ametek.com, Tel : ,
213

 +91")


214 Canada United States United Kingdom INDIA Representative Mr. Dhruvesh Shah Consultant (Civil/Structural Repair) INDIA Distributor Radhe Structorepair Pvt. Ltd., Ahmedabad, Gujarat (Consultant/Contractor for Structural Repair Work) Reg. Office: SF/12-13 Yogeshwar complex, Gulab Tower Road Corner, Below Sola Overbridge, Thaltej, Ahmedabad, Gujarat Admn. Office: 409, Shreerang Heights, Nr. Raysan Petrol Pump, Koba Highway, Gandhinagar, Gujarat Ph: ; yhu_ces@yahoo.co.in; radhestructo@yahoo.co.in
215


216 EVERGREEN TECHNOLOGIES (INDIA) PRIVATE LIMITED Admin Office M TH Cross Street, Thiruvalluvar Nagar, Thiruvanmayur, Chennai , Tamil Nadu, India Regd Office No.17/5 4 th Street, Mosque Colony, Rajakilpakkam, Chennai , Tamil Nadu, India , Sales@egtechindia.com Website : Srinivasaka Enterprises 122, Velachery main road, Rajakilpakkam Chennai, TN, India , , MOON CONSTRUCTION ADDITIVES No. 1/88, First Street, Indira Nagar, Vengaivasal, Chennai, Tamil Nadu, India, Pin mooncadd@hotmail.com Manufacturer & Suppliers CORROCON CPAC TM Cement Polymer anticorrosive coating MOONCRETE CI TM Corrosion Inhibiting Admixture POLYPRO 786 Cement Waterproofing Admixture POLYPRO WP TM Polymer Cementitious Waterproofing Coating
217
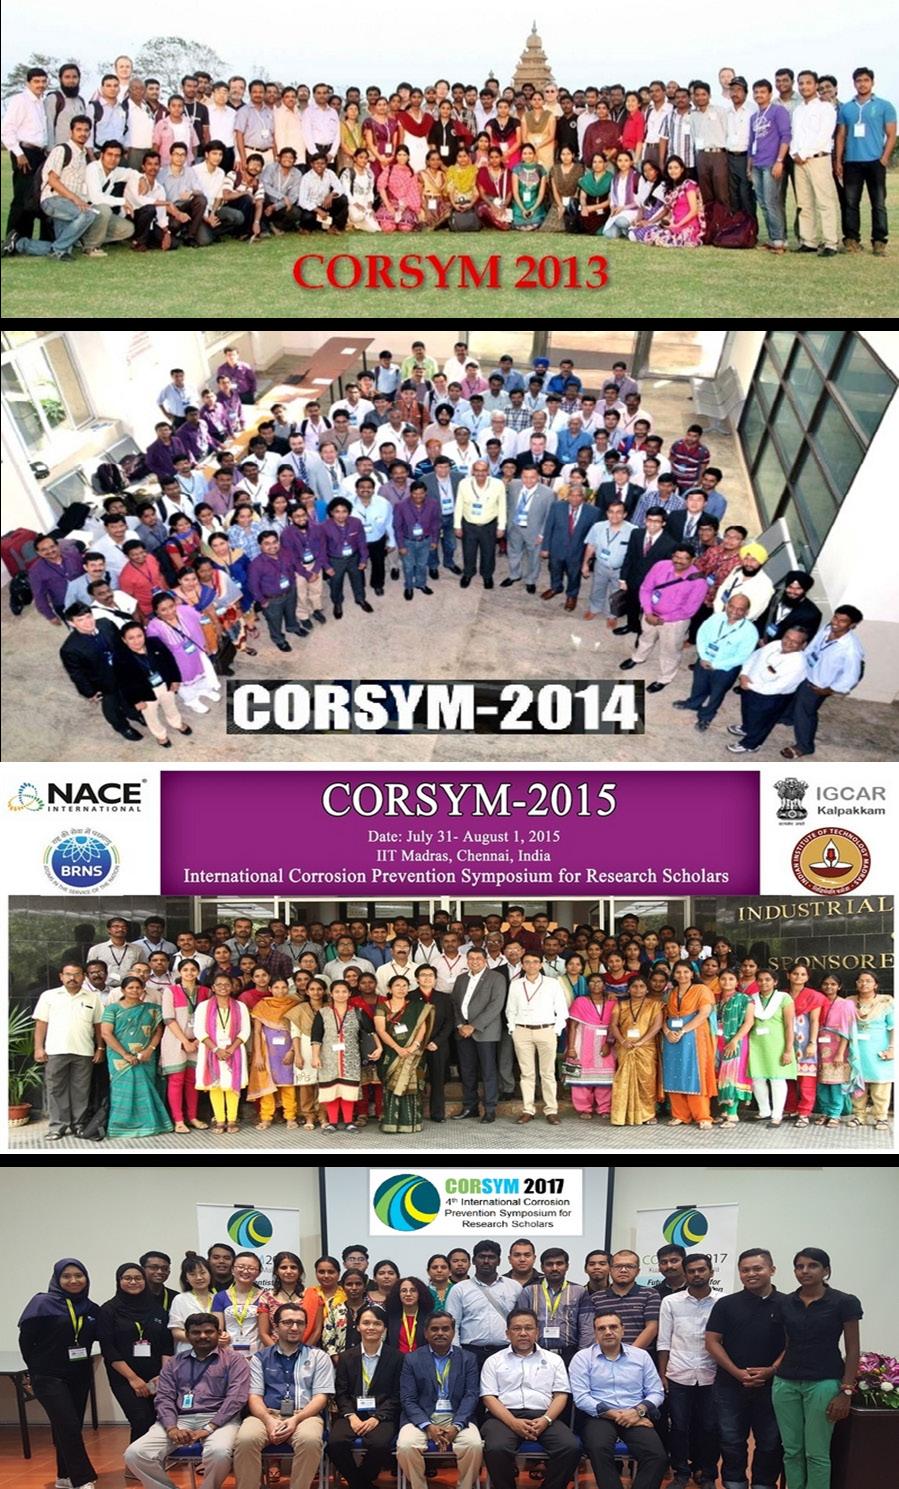
218
219
CORSYM Extended abstract ID
 CORSYM 2018- Extended abstract ID Advanced Materials and Coatings (AMC) The Corrosion Behavior of MgAZ91D+SIC Nano Composite in Canola Oil Biodiesel P Hariprasath, S Premkumar, S T Selvaman, M Vigneshwar
CORSYM LIST OF ACCEPTED ABSTRACTS
 ABSTRACT ID EXTENDED ABSTRACT ID TITLE AUTHORS INSTITUTE COUNTRY COR141 AMC-1 The Corrosion Behavior of MgAZ91D+SIC Nano Composite in Canola Oil Biodiesel S.T Selvamani, P Hariprasath, M Vigneshwar, S
Prevention Strategies Design and Coatings
 Lecture 14 Prevention Strategies Design and Coatings Keywords: Corrosion Prevention, Designs, Protective Coatings. There are a number of methods to control corrosion. The choice of any one control technique
Metallurgy, Alloys, and Applications p. 1 Introduction and Overview p. 3 Major Groups of Copper and Copper Alloys p. 3 Properties of Importance p.
 Preface p. vii Metallurgy, Alloys, and Applications p. 1 Introduction and Overview p. 3 Major Groups of Copper and Copper Alloys p. 3 Properties of Importance p. 3 Fabrication Characteristics p. 5 Alloy
CORROSION AND CORROSION CONTROL An Introduction to Corrosion Science and Engineering
 CORROSION AND CORROSION CONTROL An Introduction to Corrosion Science and Engineering FOURTH EDITION R. Winston Revie Senior Research Scientist CANMET Materials Technology Laboratory Natural Resources Canada
PIPELINE CORROSION Organised by
 NIGIS EDUCATIONAL TRAINING PROGRAMME PIPELINE CORROSION Organised by COURSE OBJECTIVE Pipeline are the most reliable, efficient, safe and economic mode of transport for oil, gas, hydrocarbons and water.
Laboratory Experiments in Corrosion Engineering II
 Lecture - 40 Laboratory Experiments in Corrosion Engineering II Keywords: Polarization Experiments, Pitting Potentials, Microbial Corrosion. A. Electrochemical tests in a given environment Polarization
EVALUATION OF MECHANICAL PROPERTIES OF AL6061 METAL MATRIX COMPOSITE REINFORCED WITH FUSED ZIRCONIA ALUMINA
 EVALUATION OF MECHANICAL PROPERTIES OF AL6061 METAL MATRIX COMPOSITE REINFORCED WITH FUSED ZIRCONIA ALUMINA *P.V.Rajesh, **S.Roseline, *** V.Paramasivam *P.G Scholar: Department of Mechanical Engineering,
Sensitization & Corrosion Behaviour of Austenitic Stainless Steel 304 & 316
 Sensitization & Corrosion Behaviour of Austenitic Stainless Steel 304 & 316 Manish Kumar Verma Mechanical, Columbia Institute of Engineering & Technology, Raipur (India) ABSTRACT Austenitic Stainless steels
Global Journal of Engineering Science and Research Management
 DIFFUSION BONDING OF AL ALLOY USING DIFFERENT IINTERLAYERS Assist. Prof. Dr. Ahmed A. Akbar*, Samer K. Khaleel * Asst. Prof. Dr. at University of Technology, Production Engineering and Metallurgy, Iraq
Methods of Corrosion Control. Corrosion Control or Corrosion Management?
 Corrosion Control or Corrosion Management? Corrosion control is a process aimed at reducing the corrosion rate to a tolerable level (or predictable limits) Corrosion control focuses mainly on (i) materials
Corrosion and fouling in offshore
 Corrosion and fouling in offshore Overview Offshore components and devices have serious technical and economic problems as a result of aggressive phenomena of fouling and corrosion. The traditional solutions
Selection criteria for Biomaterials
 Selection criteria for Biomaterials Biomaterials and biomedical devices are used throughout the human body. 2 important aspects: Functional performance Biocompatibility Hip joint prosthesis 1 Functional
family of stainless steels can be divided into five (5) categories:
 categories:") Welcome to the fifth issue of Tech Talk. This newsletter covers a range of topics on various welding products, applications, metallurgy, techniques, and economics. Previous issues are archived at www.unibraze.com.
Welcome to the fifth issue of Tech Talk. This newsletter covers a range of topics on various welding products, applications, metallurgy, techniques, and economics. Previous issues are archived at www.unibraze.com.
A Study of Performance of Aluminium Anode by Addition of Zinc in Sea Water
 A Study of Performance of Aluminium Anode by Addition of Zinc in Sea Water G.M.Pradeep 1, R.M.Ravindran 2, A.Gokulram 3, R.Rajesh 4, B.YogeshEswaran 5, L. Samson Joshua 6 1 Assistant professor, Dept of
Engineering Materials
 Engineering Materials Lecture 2 MEL120: Manufacturing Practices 1 Selection of Material A particular material is selected is on the basis of following considerations 1. Properties of material 1. Properties
EFFECT OF SACRIFICIAL ZINC ANODES ON CURRENT DENSITY FOR EFFECTIVE CATHODIC PROTECTION OF RCC
 EFFECT OF SACRIFICIAL ZINC ANODES ON CURRENT DENSITY FOR EFFECTIVE CATHODIC PROTECTION OF RCC Krishna Shinde 1, R. K. Shrivastava 2 and R. D. Angal 3 1 Department of Mechanical Engineering, Govt. College
METHODS OF COATING FABRICATION
 METHODS OF COATING FABRICATION Zbigniew Grzesik http://home.agh.edu.pl/~grzesik Department of Physical Chemistry and Modelling DEFINITION The coating is the thin outer layer of the object, which physiochemical
Resume. Course Educational Institution Class Year of Passing Ph. D. Provisional Registration Anna University, Chennai Ceramic Technology
 Resume Name Designation : Srinivasulu K : Teaching Fellow Date of Birth : 15.06.1988 Permanent Contact Address : No: 2/168, Chittoor Road, K. G. Kandigai Village and Post Tirutani Taluk, Thiruvallur Dist
CONTENTS. Preface to the 3rd Edition Acknowledgments
 CONTENTS Preface to the 3rd Edition Acknowledgments vii ix CHAPTER 1 INTRODUCTION 1 1.1 Definition of materials degradation 1 1.2 Definition and significance of surface engineering 4 1.3 Classification
ISSN: ISO 9001:2008 Certified International Journal of Engineering and Innovative Technology (IJEIT) Volume 3, Issue 7, January 2014
 Volume 3, Issue 7, January 2014") ISSN: 2277-3754 Finite Element Analysis of a Weld Assembly J. P. Singh 1, A. Agarwal 2 1(Mechanical Engineering Department, AIT, Rampur, U. P., India, jitenderpal2007@gmail.com) 2(Mechanical Engineering
ISSN: 2277-3754 Finite Element Analysis of a Weld Assembly J. P. Singh 1, A. Agarwal 2 1(Mechanical Engineering Department, AIT, Rampur, U. P., India, jitenderpal2007@gmail.com) 2(Mechanical Engineering
CORROSION & ITS CONTROL -Content. Introduction Classification Galvanic series Factors affecting Protection methods Summary
 CORROSION & ITS CONTROL -Content Introduction Classification Galvanic series Factors affecting Protection methods Summary 3 Learning Objectives At the end of the chapter the learner will be able to; 1.
Material development for emerging energy technologies
 Material development for emerging energy technologies Need and Approach Need Sustainable power generation is needed for the mitigation of global warming caused by greenhouse gas emissions. Advanced materials
1. CORROSION OF REINFORCEMENT
 MAB 1033 Structural Assessment and Repair 1. CORROSION OF REINFORCEMENT Professor Dr. Mohammad bin Ismail C09-313 Learning Outcome At the end of the course students should be able to understand Mechanism
Plasma-Based Surface Modification and Corrosion in High Temperature Environments
 Plasma-Based Surface Modification and Corrosion in High Temperature Environments Kumar Sridharan University of Wisconsin, Madison Department of Engineering Physics Co-authors: Todd Allen and Lizhen Tan
Biomaterials in Medical device design
 Biomaterials in Medical device design 1 Dr Joseph Buhagiar B. E n g ( H o n s. ) P h D ( B h a m ) D e p a r t m e n t o f M e t a l l u r g y a n d M a t e r i a l s E n g i n e e r i n g U n i v e r
Investigation on the Corrosion Performance of Nickel Electrodeposited Tempered Steel Substrate
 Journal of Science and Technology Volume 1 No. 8, August, 212 Investigation on the Corrosion Performance of Nickel Electrodeposited Tempered Steel Substrate *Momoh I.M., *Olateju O.O., **Oloruntoba D.T.
A Study of Tribological properties and Corrosion Behavior of Short E Glass Fiber and Fly Ash Reinforced with Aluminum 7075 Composite
 A Study of Tribological properties and Corrosion Behavior of Short E Glass Fiber and Fly Ash Reinforced with Aluminum 775 Composite Nandini M C 1, Balakrishna.G 2, Praveen Kumar B C 3, Veena Dinesh 4 1,2,3,4
Surface Treatments and Coatings (Lightweight Materials)
") Surface Treatments and Coatings (Lightweight Materials) Surender Maddela Ph.D., Lightweight Materials Processing, GM Research and Development Center, Warren, MI- USA Materials Research Center, Missouri
Surface Treatments and Coatings (Lightweight Materials) Surender Maddela Ph.D., Lightweight Materials Processing, GM Research and Development Center, Warren, MI- USA Materials Research Center, Missouri
Corrosion Effects of Cr and Ni in Thermo-Mechanical Treated Steel Bar in Marine Environments
 Corrosion Effects of Cr and Ni in Thermo-Mechanical Treated Steel Bar in Marine Environments Sunil Kumar Durgam 1, Ghanshyam Das 2, Anjani Kumar Singh 3 1M.Tech, Department of Materials & Metallurgical
Galvanic Corrosion Prevention Guide for Water Cooling Systems
 WATER COOLED DEVICES Galvanic Corrosion Prevention Guide for Water Cooling Systems November 2017 White Paper Created by Helen E. Kane, Advanced Energy Industries, Inc. Water Cooled Devices Abstract This
A review on Tensile strength and Hardness using Aluminium as Matrix Material and E-glass, Rice Husk Ash, and Fly ash as Reinforcement
 A review on Tensile strength and Hardness using Aluminium as Matrix Material and E-glass, Rice Husk Ash, and Fly ash as Reinforcement Vishal¹, Dr. J Satheesh² ¹M.Tech student, Machine Design, Mechanical
Schedule of Accreditation issued by United Kingdom Accreditation Service 2 Pine Trees, Chertsey Lane, Staines-upon-Thames, TW18 3HR, UK
 2 Pine Trees, Chertsey Lane, Staines-upon-Thames, TW18 3HR, UK 6 Finchwell Close Contact: Mr M Collier Handsworth Tel: +44 (0)114-2437271 Sheffield Fax: +44 (0)114-2437288 South Yorkshire E-Mail: office@metalstechnology.co.uk
Development of New Generation Of Coatings with Strength-Ductility Relationship, Wear, Corrosion and Hydrogen Embrittlement Resistance Beyond the
 Development of New Generation Of Coatings with Strength-Ductility Relationship, Wear, Corrosion and Hydrogen Embrittlement Resistance Beyond the Current Materials Accomplishments till date As the structural
Corrosion and Wear Characteristics of A356.0-SIC-RHA Hybrid Composite
 Corrosion and Wear Characteristics of A356.0-SIC-RHA Hybrid Composite Sanket P. Gaikwad 1, Pradeep T. Kale 2,Dr.Subhash L. Gadhave 3 1 Assistant Professor, Mechanical Department, Bhivrabai Sawant Polytechnic,
EFFECTS OF CURRENT DENSITY ON SIZE AND SURFACE MORPHOLOGY OF HIGH SPEED DIRECT NANO-CRYSTALLINE NICKEL PLATING ON TITANIUM SURFACE
 EFFECTS OF CURRENT DENSITY ON SIZE AND SURFACE MORPHOLOGY OF HIGH SPEED DIRECT NANO-CRYSTALLINE NICKEL PLATING ON TITANIUM SURFACE Noor Zaimah 1, Azieyanti Nurain 1 and Sakhawat Hussain 2 1 Department
Anticorrosive Coatings
 Anticorrosive Coatings Joerg Sander 1 Introduction 1.1 Why corrosion-protective coatings 1.2 Literature 2 Corrosion protection coatings 2.1 Principles of function 2.1.1 Electrochemistry of corrosion inhibition
STUDIES ON MECHANICAL PROPERTIES OF Al - BASED CAST COMPOSITES
 International Journal of Computer Science and Management Studies, Vol. 11, Issue 02, Aug 2011 104 STUDIES ON MECHANICAL PROPERTIES OF Al - BASED CAST COMPOSITES Rakesh Kumar Yadav 1, Nabi Hasan 2, Ashu
MICROSTRUCTURE AND WELDABILITY EVALUATION OF DISSIMAILAR METAL JOINT USING PASTE TECHNIQUE FOR BUTTERING LAYERS
 MICROSTRUCTURE AND WELDABILITY EVALUATION OF DISSIMAILAR METAL JOINT USING PASTE TECHNIQUE FOR BUTTERING LAYERS Dinesh Rathod 1, Hariom Choudhary 2, Sunil Pandey 3 1. Research Scholar, Department of Mechanical
Looking into the Past for Materials of the Future; Professor R. Balasubramaniam
 Seite 1 von 5 Looking into the Past for Materials of the Future Professor R. Balasubramaniam Department of Materials & Metallurgical Engineering email: bala@iitk.ac http://home.iitk.ac.in/~bala/ IITK -
Characteristic Analysis of Nickel Alloy using Plasma Nitriding
 Volume 119 No. 15 2018, 1921-1927 ISSN: 1314-3395 (on-line version) url: http://www.acadpubl.eu/hub/ http://www.acadpubl.eu/hub/ Characteristic Analysis of Nickel Alloy using Plasma Nitriding 1 Arunkumar
STUDY OF PROCESS PARAMETERS IN FRICTION STIR WELDING OF DISSIMILAR ALUMINIUM ALLOYS
 Proceedings of the 2011 International Conference on Industrial Engineering and Operations Management Kuala Lumpur, Malaysia, January 22 24, 2011 STUDY OF PROCESS PARAMETERS IN FRICTION STIR WELDING OF
Effect of cryogenic treatment on corrosion resistance of hybrid Aluminium metal matrix composites
 Effect of cryogenic treatment on corrosion resistance of hybrid Aluminium- 7075 metal matrix composites Arun C Dixit U 1 1 Assistant Professor, Department of Mechanical Engineering, Vidyavardhaka College
Properties and Applications of Metals and Alloys
 ENGINEERING MATERIALS Properties and Applications of Metals and Alloys C.P. Sharma ENGINEERING MATERIALS Properties and Applications of Metals and Alloys C.P. SHARMA Department of Metallurgical Engineering
EVALUATION OF HARDNESS AND TENSILE PROPERTIES OF Al 7075 BASED COMPOSITE
 EVALUATION OF HARDNESS AND TENSILE PROPERTIES OF Al 7075 BED COMPOSITE *M. Sreenivasa Reddy, #Dr. Soma V. Chetty, $Dr. Sudheer Premkumar *Research Scholar, JNTU, Hyderabad e-mail:sreenivasa_m123@rediffmail.com
1. INTRODUCTION. Further exploitation of the technology led to coatings which offer huge
 1. INTRODUCTION 1.1. GENERAL Surface engineering deals with modification of the surface properties of engineering components as majority of failures originate from the surface. Wear and corrosion are the
PRESTRESSED CONCRETE DESIGN
 PRESTRESSED CONCRETE DESIGN A01_Prestressed Concrete Design_FM.indd i 4/29/2013 4:00:08 PM A01_Prestressed Concrete Design_FM.indd ii PRESTRESSED CONCRETE DESIGN Praveen Nagarajan Department of Civil Engineering
SPECIALIZED PROFESSIONAL COMPETENCE:
 ARUN KUMAR, Ph.D. PRESIDENT SEAL Laboratories 250 N. Nash Street El Segundo, CA 90245 Phone: 310-322-2011; FAX: 310-322-2243 e-mail: akumar@seallabs.com SPECIALIZED PROFESSIONAL COMPETENCE: Failure analysis
ADVANCES in NATURAL and APPLIED SCIENCES
 ADVANCES in NATURAL and APPLIED SCIENCES ISSN: 1995-0772 Published BYAENSI Publication EISSN: 1998-1090 http://www.aensiweb.com/anas 2017 April 11(4): pages 551-556 Open Access Journal Study And Analysis
Microstructure and Mechanical Behaviour of A356/SiC/MoS 2 Hybrid Composites for an IC Engine Block Application
 Volume-6, Issue-5, September-October 2016 International Journal of Engineering and Management Research Page Number: 257-261 Microstructure and Mechanical Behaviour of A356/SiC/MoS 2 Hybrid Composites for
CORROSION OF STEELS IN WATER AND HYDROGEN SULPHIDE
 Review of Industrial Engineering Letters 214 Vol. 1, No. 2, pp. 8-88 ISSN(e): 248-9427 ISSN(p): 249-2169 DOI: 1.18488/journal.71/214.1.2/71.2.8.88 214 Conscientia Beam. All Rights Reserved. CORROSION OF
Correlation between Neutral Salt Spray (NSS) Test and Potentiostat Dynamic Test for Corrosion on Zinc Plated Steel
 Test and Potentiostat Dynamic Test for Corrosion on Zinc Plated Steel") Correlation between Neutral Salt Spray (NSS) Test and Potentiostat Dynamic Test for Corrosion on Zinc Plated Steel Prithiviraj D [1], Rajendran R [2], Venugopal [3] Department of Mechanical Engineering,
Correlation between Neutral Salt Spray (NSS) Test and Potentiostat Dynamic Test for Corrosion on Zinc Plated Steel Prithiviraj D [1], Rajendran R [2], Venugopal [3] Department of Mechanical Engineering,
Stainless Steel & Stainless Steel Fasteners Chemical, Physical and Mechanical Properties
 Stainless Steel & Stainless Steel Fasteners Chemical, Physical and Mechanical Properties Stainless steel describes a family of steels highly resistant to tarnishing and rusting that contain at least two
Curriculum Vitae INTRODUCTION. Curriculum Vitae SYARIF JUNAIDI September 2018 FIELD OF SPECIALIZATION EDUCATION AND ACADEMIC QUALIFICATION
 Curriculum Vitae INTRODUCTION Name : SYARIF JUNAIDI Date of Birth : 21 June 1974 Place of Birth : Ujung Pandang, Indonesia Gender : Male Nationality : Indonesia Present Position : Associate Professor in
Effect of Ageing on the Tribological Behavior of Inconel 690 Using Taguchi s Method
 American Journal of Materials Science 2016, 6(4A): 25-30 DOI: 10.5923/c.materials.201601.05 Effect of Ageing on the Tribological Behavior of Inconel 690 Using Taguchi s Method Joel Immanuel Concessao 1,*,
EXPERIMENTAL STUDIES ON MECHANICAL PROPERTIES OF E- GLASS SHORT FIBRES & FLY ASH REINFORCED AL 7075 HYBRID METAL MATRIX COMPOSITES
 EXPERIMENTAL STUDIES ON MECHANICAL PROPERTIES OF E- GLASS SHORT FIBRES & FLY ASH REINFORCED AL 7075 HYBRID METAL MATRIX COMPOSITES PRABHAKAR KAMMER 1*, DR. H.K.SHIVANAND 2, SANTHOSH KUMAR.S 3 1* professor,
Corrosion Mechanisms, Monitoring, and Service Life Enhancement of Reinforced Concrete Structures
 Corrosion Mechanisms, Monitoring, and Service Life Enhancement of Reinforced Concrete Structures Radhakrishna G. Pillai Concrete Materials Research Group (Building Technology & Construction Management
Analysis and Experimental Investigation of Surface Modification in EN8 Steel by Using Thermal Spray Technique
 Analysis and Experimental Investigation of Surface Modification in EN8 Steel by Using Thermal Spray Technique Manikandan.D [1], Thirumalvalavan.S [2] P.G Student, Department of Mechanical Engineering,
Identification. Type Analysis
 Page 1 of 12 Unit Display: English Print Now Custom 455 Stainless E-Mail Datasheet Add to My Materials UNS Number S45500 Identification Type Analysis Carbon 0.05 % Manganese 0.50 % Phosphorus 0.040 % Sulfur
Schedule of Accreditation issued by United Kingdom Accreditation Service 2 Pine Trees, Chertsey Lane, Staines-upon-Thames, TW18 3HR, UK
 2 Pine Trees, Chertsey Lane, Staines-upon-Thames, TW18 3HR, UK 6 Finchwell Close Contact: Mr M Collier Handsworth Tel: +44 (0)114-2437271 Sheffield Fax: +44 (0)114-2437288 South Yorkshire E-Mail: office@metalstechnology.co.uk
Materials of Engineering ENGR 151 CORROSION ELECTRICAL PROPERTIES
 Materials of Engineering ENGR 151 CORROSION ELECTRICAL PROPERTIES more anodic (active) more cathodic (inert) GALVANIC SERIES Ranking of the reactivity of metals/alloys in seawater Platinum Gold Graphite
Mechanical Behavior of Silicon Carbide Reinforced Friction Stir Welded Joint of Aluminium Alloy 6061
 Mechanical Behavior of Silicon Carbide Reinforced Friction Stir Welded Joint of Aluminium Alloy 661 Md. Aleem Pasha *1, Ph. D Scholar, Mechanical Engineering Department, Osmania University, Hyderabad,
Process Parameter Investigation Of TIG Welding On SS316L Using RSM
 Process Parameter Investigation Of TIG Welding On SS316L Using RSM B.Sudharsan 1, P.Suganth 2, A.Ranjith 3, B.Vishnuvarthan 4, N.Karthikeyan 5, N.Ganesh 6 1,2,3,4 Mechanical Engineering (B.E Student),
Evaluation of Mechanical Properties of Aluminium Metal Matrix Reinforced with Silicon
 SSRG International Journal of Mechanical Engineering (SSRG - IJME) Volume Issue 1 January 2018 Evaluation of Mechanical Properties of Aluminium Metal Matrix Reinforced with Silicon V.Naga Malleswari #1
CORROSION RESISTANCE OF PLASMA NITRIDED AND NITROCARBURIZED AISI 316L AUSTENITIC STAINLESS STEEL
 CORROSION RESISTANCE OF PLASMA NITRIDED AND NITROCARBURIZED AISI 316L AUSTENITIC STAINLESS STEEL F.A.P. Fernandes 1*, J. Gallego 2, G.E. Totten 3, C.A. Picon 2, L.C. Casteletti 1 1 Department of Materials
Schedule of Accreditation issued by United Kingdom Accreditation Service 2 Pine Trees, Chertsey Lane, Staines-upon-Thames, TW18 3HR, UK
 2 Pine Trees, Chertsey Lane, Staines-upon-Thames, TW18 3HR, UK Eden House Watling Street Industrial Estate Leadgate Consett County Durham DH8 6TA Contact: Mr R L Hannant Tel: +44 (0)1207 599260 Fax: +44
Steels Processing, Structure, and Performance, Second Edition Copyright 2015 ASM International G. Krauss All rights reserved asminternational.
 Steels Processing, Structure, and Performance, Second Edition Copyright 2015 ASM International G. Krauss All rights reserved asminternational.org Contents Preface to the Second Edition of Steels: Processing,
A REVIEW ON WEAR BEHAVIOUR OF Al-FLY ASH-WC-Mg HYBRID NANO COMPOSITE MATERIAL
 A REVIEW ON WEAR BEHAVIOUR OF Al-FLY ASH-WC-Mg HYBRID NANO COMPOSITE MATERIAL 1,* B.Gnanasundara Jayaraja Professor, SRM Valliammai Engineering College, Chennai, Tamilnadu, India E-mail : bgjeyaraja@yahoo.com
Metal and ceramic matrices: new composite materials
 Metal and ceramic matrices: new composite materials Introduction In the case of materials subjected to mechanical loads, the use of composite materials has improved the properties by using substances that
INFLUENCE OF FRICTION STIR WELDING ON CORROSION PROPERTIES OF AW-7020M ALLOY IN SEA WATER
 DOI: 10.1515/adms-2015-0002 K. Dudzik 1, W. Jurczak 2 1 Gdynia Maritime University, Faculty of Marine Engineering, Marine Maintenance Department, Gdynia, Poland 2 Polish Naval Academy, Mechanical Electrical
Effect of Corrosion Inhibitor in Mild Steel Bar
 Effect of Corrosion Inhibitor in Mild Steel Bar K. Kavya 1, V. Kavyadharshini 2, M. Keerthana 3, S. Karthika 4, S. Suresh 5 U.G. Student, Department of Civil Engineering, Sona College of Technology, Salem,
Mechanical Properties and Microstructure of Al-7075-BA Hybrid Composites
 Mechanical Properties and Microstructure of Al-7075-BA Hybrid Composites Mohammed Imran 1, Dr. A.R Anwar Khan 2 1Research scholar, Department of Mechanical Engineering, Ghousia College of Enginnering-Ramanagaram-
2.3.3 Plasma Sulphurizing Restriction of Plasma Nitriding Development of Plasma Nitriding in China References...
 Contents 1 Introduction... 1 1.1 Engineering Materials and Its Surface.... 1 1.2 Surface Engineering and Its Classification... 2 1.2.1 Concept of Surface Engineering... 2 1.2.2 Surface Hardening Technology...
PROCESS CONTROL OF THERMAL BARRIER COATING SYSTEM BY CURRENT VARIANT CHANGES TO ALTER THE MICROSTRUCTURAL AND MECHANICAL CHARACTERISTICS
 Volume XI, Issue I, June 2015, Page 129 135 PROCESS CONTROL OF THERMAL BARRIER COATING SYSTEM BY CURRENT VARIANT CHANGES TO ALTER THE MICROSTRUCTURAL AND MECHANICAL CHARACTERISTICS A. Imran 1, S. Alam
CHAPTER INTRODUCTION
 1 CHAPTER-1 1.0 INTRODUCTION Contents 1.0 Introduction 1 1.1 Aluminium alloys 2 1.2 Aluminium alloy classification 2 1.2.1 Aluminium alloys (Wrought) 3 1.2.2 Heat treatable alloys (Wrought). 3 1.2.3 Aluminum
ATI FLAT ROLLED PRODUCTS Brackenridge, PA for technical competence in the field of
 A2LA has accredited Brackenridge, PA for technical competence in the field of Mechanical Testing This laboratory is accredited in accordance with the recognized International Standard ISO/IEC 17025:2005
SCOPE OF ACCREDITATION TO ISO/IEC 17025:2005
 SCOPE OF ACCREDITATION TO ISO/IEC 17025:2005 4155 Lisa Drive Tipp City, OH 45371 Craig Riviello Phone: 937 669 4500 MECHANICAL Valid To: December 31, 2017 Certificate Number: 2633.01 In recognition of
SCOPE OF ACCREDITATION TO ISO/IEC 17025:2005
 SCOPE OF ACCREDITATION TO ISO/IEC 17025:2005 4155 Lisa Drive Tipp City, OH 45371 Craig Riviello Phone: 937 669 4500 CHEMICAL Valid To: November 30, 2017 Certificate Number: 2633.02 In recognition of the
NANOSCIENCE AND NANOTECHNOLOGIES - Asia Nanoscience And Nanotechnology Development - Chunli Bai
 ASIA NANOSCIENCE AND NANOTECHNOLOGY DEVELOPMENT Chunli Bai Chinese Academy of Sciences, China Keywords: Nano, Asia, Brief History, Administration and Implementation Sectors, Policies Characteristics Contents
These elements are in carbon steels in minimal amounts, usually less than 1%.
 Alloy Steels Weld Tech News VOL 1. NO. 11 WELD TECH NEWS is a newsletter for welders working primarily in maintenance and repair. Each issue contains useful information on materials (cast irons, steels,
Effects of Corrosion on Reinforced Concrete Beams with Silica Fume and Polypropylene Fibre
 Effects of Corrosion on Reinforced Concrete Beams with Silica Fume and Polypropylene Fibre S.Shanmugam, V.G. Srisanthi, and S.Ramachandran Abstract Reinforced concrete has good durability and excellent
Jānis Grabis. Plasma chemical synthesis of multicomponent nanopowders, their characteristics, and processing
 Jānis Grabis Plasma chemical synthesis of multicomponent nanopowders, their characteristics, and processing Outline Introduction nanoparticles, their preparation methods Experimental synthesis of multicomponent
About. l Surface of steel structural is blasted by compressed air pressure. l Additional sealant provides barrier protection to the surface.
 About Mythri Metallizing (P) Ltd. is India s Leading Engineering contractor in the field of Surface Preparation by Abrasive blasting (Sand, Grit, Shot, Copper slag, Aliminium oxide blasting, etc) & Thermal
An Investigation on Metallic Bipolar Plate Corrosion in Simulated Anode and Cathode Environments of PEM Fuel Cells using Potential-pH Diagrams
 Int. J. Electrochem. Sci., 1(2006)447-455 www.electrochemsci.org An Investigation on Metallic Bipolar Plate Corrosion in Simulated Anode and Cathode Environments of PEM Fuel Cells using Potential-pH Diagrams
NICKEL CHROMIUM ALLOYS
 NICKEL CHROMIUM AND NICKEL THORIA ALLOYS 1 NICKEL CHROMIUM ALLOYS Two distinct groups of nickel chromium alloys for high temperature uses are as follow. The first group, which includes cast alloys containing
CURRICULUM VITAE OF M.D. MATHEW
 PERSONAL DETAILS CURRICULUM VITAE OF M.D. MATHEW Name Designation-1 Institution Designation-2 Institution Address (residence) Dr.M.D.Mathew Scientific Officer H+ (Joint Secretary rank) Head, Mechanical
Surface engineering for new industrial applications - bio application
 Surface engineering for new industrial applications - bio application Dr. Yangchun Dong Bsc. Msc. PhD Tel.: +420541143323 Mobile: +420776395588 30/10/2013, Brno Introduction 1. A few questions to answer:
Electrochemical studies of Aluminium 6061 / Titanium Diboride Metal matrix Composites
 Electrochemical studies of Aluminium 6061 / Titanium Diboride Metal matrix Composites V.Latha 1, Dr.H.R.Radha 2, Dr.P.V.Krupakara 3, R.Lakshmi 1 1 Research Scholar, Bharathiyaar University, Coimbatore
Effect of Pulse Parameters on Bead Geometry of Aluminium Alloy AA6063 using Pulse TIG Welding
 Effect of Pulse Parameters on Bead Geometry of Aluminium Alloy AA6063 using Pulse TIG Welding Digraj 1, Kulwant Singh 2, Sumit Kumar 3 1, 2, 3 Department of Mechanical Engineering, SLIET Longowal, Punjab,
Tribological behaviour of AA 5083/Micron and Nano SiC composites fabricated by ultrasonic assisted stir casting process
 International Journal of Scientific and Research Publications, Volume, Issue 9, September 0 Tribological behaviour of AA 508/Micron and Nano SiC composites fabricated by ultrasonic assisted stir casting
COOPERATIVE PATENT CLASSIFICATION
 CPC C COOPERATIVE PATENT CLASSIFICATION CHEMISTRY; METALLURGY (S omitted) METALLURGY C22 METALLURGY (of iron C21); FERROUS OR NON-FERROUS ALLOYS; TREATMENT OF ALLOYS OR NON-FERROUS METALS (production of
The Influence of Carbon Contents on the Corrosion Resistance of Plain-Carbon Steels in the Water Environments
 - - The Influence of Carbon Contents on the Corrosion Resistance of Plain-Carbon Steels in the Water Environments SobhiIIbrahim YasirAAbdullah Ass Prof Engineer Mech Eng Dept / College of Engineering /
COMPARATIVE STUDIES ON MECHANICAL CHARACTERISTICS OF GRANULATED BLAST FURNACE SLAG AND FLY ASH REINFORCED ALUMINIUM COMPOSITES
 International Journal of Mechanical Engineering and Technology (IJMET) Volume 8, Issue 11, November 2017, pp. 277 284, Article ID: IJMET_08_11_030 Available online at http://www.iaeme.com/ijmet/issues.asp?jtype=ijmet&vtype=8&itype=11
Surface Engineering, Biomaterials, Corrosion, Laser Materials Processing
 Dr. Renu Kumari Assistant Professor Department of Metallurgical & Materials Engineering Email: renu.met@nitjsr.ac.in, renumetalbit@gmail.com Areas of Speciallization/Interest: Surface Engineering, Biomaterials,
M.N.Singh, D.K.Basu, A.K.Bhattmishra and S. K.Narang CORROSION RESISTANT ELECRODEPOSITED ZINC COATING FROM ZINC DROSS
 ..:: CORCON 2UU2 ::.. SPEAKERS (Basic Corrosion) 04 TECHNICAL A SPEAKERS A ABOUT NA( M.N.Singh, D.K.Basu, A.K.Bhattmishra and S. K.Narang M. N. Singh, D. K. Basu, A. K. Bhattmishra and S. K. Narang National
Morphology of Cadmium Sulfide/Poly(ethylene)Oxide Nanocomposites
Oxide Nanocomposites") ISSN: 2319-7706 Volume 3 Number 9 (2014) pp. 469-473 http://www.ijcmas.com Original Research Article Morphology of Cadmium Sulfide/Poly(ethylene)Oxide Nanocomposites V.S.Sangawar and R.N.Bhagat* Polymer/Nanomaterials
ISSN: 2319-7706 Volume 3 Number 9 (2014) pp. 469-473 http://www.ijcmas.com Original Research Article Morphology of Cadmium Sulfide/Poly(ethylene)Oxide Nanocomposites V.S.Sangawar and R.N.Bhagat* Polymer/Nanomaterials
Connexion Developments Ltd + Solenoid Valves (UK) Ltd Unit 3, Rainbow Court, Armstrong Way, Great Western Business Park, Yate, Bristol, BS37 5NG,
 Ltd Unit 3, Rainbow Court, Armstrong Way, Great Western Business Park, Yate, Bristol, BS37 5NG,") 1 2 3 4 5 6 7 8 9 10 11 12 13 14 15 16 17 18 19 20 21 22 23 24 THERMOPLASTICS & ELASTOMERS ABS Acrylonitrile Butadiene Styrene Class 32222 conforming to ASTM D3965 is a time-proven material. The smooth
1 2 3 4 5 6 7 8 9 10 11 12 13 14 15 16 17 18 19 20 21 22 23 24 THERMOPLASTICS & ELASTOMERS ABS Acrylonitrile Butadiene Styrene Class 32222 conforming to ASTM D3965 is a time-proven material. The smooth
Microstructural Analysis of Selected Corroded Materials from Nigeria Oil and Gas Industry
 American Journal of Materials Science: 2011; 1(2): 108-112 DOI: 10.5923/j.materials.20110102.18 Microstructural Analysis of Selected Corroded Materials from Nigeria Oil and Gas Industry Ajide *, Makinde,
Alloy Steels. Engineering Materials. Introduction : Msc. Shaymaa Mahmood
 Alloy Steels Introduction : Steels are, essentially, alloys of iron and carbon, containing up to 1.5 % of carbon. Steel is made by oxidizing away the impurities that are present in the iron produced in
CHAPTER-4 EXPERIMENTAL DETAILS. 4.1 SELECTION OF MATERIAL FOR CC GTAW & PC GTAW OF 90/10 & 70/30 Cu-Ni ALLOY WELDS
 CHAPTER-4 EXPERIMENTAL DETAILS 4.1 SELECTION OF MATERIAL FOR CC GTAW & PC GTAW OF 90/10 & 70/30 Cu-Ni ALLOY WELDS Hot rolled plates of 90/10 and 70/30 Cu-Ni alloys of 5 mm thickness were selected as test