PINELLAS COUNTY, FLORIDA 2014 WASTE CHARACTERIZATION STUDY
|
|
|
- Annis Willis
- 5 years ago
- Views:
Transcription


1 PINELLAS COUNTY, FLORIDA 2014 WASTE CHARACTERIZATION STUDY January 2015 Prepared for: Submitted by: Pinellas County Solid Waste Department th Avenue North St. Petersburg, FL Kessler Consulting, Inc. innovative waste solutions N. Nebraska Ave., Bldg. D Tampa, FL printed on recycled paper


2 This report has been prepared for the use and benefit of the client for the specific purposes identified in the report. The conclusions, observations, and recommendations contained herein attributed to Kessler Consulting, Inc. constitute the opinions of Kessler Consulting. The services provided by Kessler Consulting and this report are not intended for the benefit of any third party and shall not be relied upon by any third party. To the extent that statements, information, and opinions provided by other third parties have been used in the preparation of this report, Kessler Consulting has relied upon the same to be accurate, and for which no assurances are intended and no representations or warranties are made. Kessler Consulting makes no certification and gives no assurances except as explicitly set forth in this report. Copyright 2015, Kessler Consulting, Inc. All rights reserved. Kessler Consulting, Inc. is a member of, or was awarded, the following
3 Table of Contents Executive Summary... ES-1 Section 1 Introduction Purpose Background... 1 Section 2 Methodology Class I Methodology... 3 Generator Sectors... 3 Material Categories... 3 Sampling and Sorting Protocol... 3 Analytical Procedures Bulky Waste Methodology... 6 Section 3 Results and Findings Introduction to Results Single-Family Residential Waste Multi-Family Residential Waste Commercial Waste Aggregate Waste Stream Comparison with 2007 Study Results Bulky Waste Section 4 Summary and Diversion Opportunities Opportunities to Enhance Materials Recovery Opportunities for Bulky Waste Diversion Use of Study Results in State Reporting WCS Report Final i
4 Table of Contents Tables Table ES.1: Characterization of Class I Waste Disposed... ES-2 Table ES.2: Characterization of Bulky Waste... ES-9 Table ES.3: Heat Values for Bulky Waste... ES-10 Table 2.1: Class I WCS Sampling Schedule... 4 Table 3.1: Composition of Single-Family Residential Waste Disposed Table 3.2: Composition in Areas with and without Carted Single Stream Recycling Table 3.3: Composition of Multi-Family Residential Waste Disposed Table 3.4: Composition of Commercial Waste Disposed Table 3.5: Composition of Large Organic Waste Generator Waste Disposed Table 3.6: Composition of Aggregate Waste Stream, by Generator Sector Table 3.7: Comparison of 2014 and 2007 Waste Composition Results Table 3.8: Composition of Bulky Waste Disposed Table 3.9: Conversion of Volumetric Percentages to Weight Percentages for Bulky Waste Table 4.1: Potentially Recyclable or Compostable Materials Table 4.2: Heat Values for Bulky Waste Figures Figure ES.1: Potentially Recyclable or Compostable Materials... ES-3 Figure ES.2: Material Percentages in Areas with and without Carted Single Stream Recycling... ES-5 Figure ES.3: Composition of Large Organic Waste Generator Waste Disposed... ES-6 Figure ES.4: Composition of Waste Disposed by Supermarkets, Restaurants and Institutions... ES-7 Figure ES.5: Potentially Combustible and Non-Combustible Materials in Bulky Waste... ES-11 Figure 3.1: Composition of Single-Family Residential Waste Disposed Figure 3.2: Material Percentages in Areas with and without Carted Single Stream Recycling Figure 3.3: Composition of Multi-Family Residential Waste Disposed Figure 3.4: Composition of Commercial Waste Disposed Figure 3.5: Composition of Large Organic Waste Generator Waste Disposed Figure 3.6: Composition of Waste Disposed by Supermarkets, Restaurants and Institutions Figure 3.7: Composition of Aggregate Waste Stream Disposed Figure 4.1: Potentially Recyclable or Compostable Materials Figure 4.2: Potentially Combustible and Non-Combustible Materials in Bulky Waste Appendices Appendix A Waste Characterization Study Material Categories Appendix B Visual Audit Form Appendix C Single-Family Residential Sample Results Appendix D Multi-Family Residential Sample Results Appendix E Commercial Sample Results Appendix F Large Organic Waste Generator Sample Results Appendix G Bulky Waste Audit Results Appendix H Bulky Waste Photographs Appendix I Instructions to Calculate Waste Generation WCS Report Final ii
5 Executive Summary Pinellas County Solid Waste (County) contracted Kessler Consulting, Inc. (KCI) to conduct a Waste Characterization Study (WCS) of the municipal solid waste delivered to the County s Bridgeway Acres facility. The purpose of the WCS is to assist the County in developing future solid waste programs and, more specifically, to meet the following objectives: To characterize the Class I waste and overall materials received by the County at Bridgeway Acres. To compare the waste streams of municipalities with universal, carted single stream recycling to those without it. To determine the amount of organics in the waste stream, in particular the commercial waste stream, to evaluate the feasibility of an organics recycling program. To characterize the non-processable (bulky) waste that is landfilled in order to determine if any components of it could be processed and utilized as fuel in the waste-to-energy (WTE) plant. The goal is to maximize the life of the landfill and enhance WTE energy production. KCI conducted a 10-day sampling and sorting event at Bridgeway Acres from August and August 25-29, Representative samples from 80 loads of waste were collected and sorted into 34 defined material categories. An additional 54 loads of bulky waste were visually audited. Table ES.1 and Figure ES.1 provide the composition of the waste disposed by the three main waste generator sectors included in the WCS (single-family residential, multi-family residential, and commercial), as well as the combined composition of the three sectors (Aggregate Waste Stream). The table is organized by the potential for the various material types to be diverted from disposal for recycling or composting. Key findings of the WCS are as follows: Nearly one-third of residential and commercial waste currently disposed consists of recyclable fiber and containers. These recyclables make up 26 percent of single-family residential waste, 37 percent of multi-family residential waste, and 35 percent of commercial waste that is disposed. Other types of potentially recyclable materials comprise an additional 5 percent of the waste stream. Yard waste, which could potentially be composted or mulched, constitutes 8.5 percent of the Aggregate Waste Stream. The highest percentage is found in the single-family residential waste stream, where yard waste comprises nearly 22 percent of the waste disposed. Food waste, which also has the potential to be composted, contributes more than 16 percent to the Aggregate Waste Stream. It contributes 12.2 percent to single-family waste, 16.5 percent to multi-family waste, and 18.5 percent to commercial waste that is disposed. WCS Report Final ES-1
6 Executive Summary Table ES.1: Characterization of Class I Waste Disposed (% by weight) Material Category Single- Family Residential Multi- Family Residential Commercial Aggregate 1 Newspaper 2.0% 3.0% 2.2% 2.3% 2 Corrugated Containers 5.0% 5.9% 10.5% 8.1% 3 Office Paper 0.8% 0.8% 1.1% 1.0% 4 Other Recyclable Paper 9.3% 11.8% 11.3% 10.8% 6 Aseptic Containers 0.3% 0.6% 0.4% 0.4% RECYCLABLE FIBER 17.3% 22.1% 25.5% 22.5% 7 PET Bottles 1.4% 2.4% 1.5% 1.6% 8 HDPE Bottles 0.7% 1.4% 0.8% 0.9% 9 Non-Bottle Plastics #1 and #2 0.8% 1.2% 0.9% 0.9% 10 Other Plastic Containers (#3-#7) 0.8% 1.0% 1.0% 0.9% 15 Tin/Steel Cans 1.0% 1.4% 1.0% 1.1% 18 Aluminum Cans 0.7% 1.1% 0.7% 0.8% 20 Glass Containers 3.4% 6.3% 3.7% 4.0% RECYCLABLE CONTAINERS 8.7% 14.8% 9.5% 10.2% 11 Bulky Rigid Plastics 1.9% 1.7% 1.6% 1.7% 16 White Goods/Small Appliances 0.0% 0.0% 0.0% 0.0% 17 Other Ferrous 0.9% 1.0% 1.3% 1.2% 19 Other Non-Ferrous 0.3% 0.4% 0.3% 0.3% 24 Electronics 2.0% 1.8% 1.6% 1.7% OTHER POTENTIALLY RECYCLABLE MATERIALS 5.1% 4.9% 4.8% 4.9% 5 Low Grade Paper 5.2% 5.2% 6.9% 6.1% 26 Clean Wood Waste 1.0% 0.2% 3.5% 2.2% 30 Yard Waste 21.7% 2.2% 3.3% 8.5% 31 Food Waste 12.2% 16.5% 18.5% 16.3% POTENTIALLY COMPOSTABLE MATERIALS 40.1% 24.2% 32.3% 33.2% 12 Non-Rigid Plastic Film 4.3% 5.1% 6.2% 5.5% 13 Expanded Polystyrene 1.0% 0.8% 1.0% 0.9% 14 All Other Plastics 0.5% 0.9% 0.7% 0.7% 21 Other Glass 0.2% 0.2% 0.3% 0.3% 22 Textiles 5.4% 4.5% 2.3% 3.6% 23 Special Wastes 0.4% 0.1% 0.1% 0.2% 25 Household Batteries 0.1% 0.1% 0.1% 0.1% 27 Treated Wood Waste 3.5% 0.5% 2.8% 2.6% 28 C&D Debris 2.1% 5.7% 4.2% 3.8% 29 Tires and Rubber 1.2% 0.3% 0.5% 0.7% 32 All Other Garbage 9.5% 14.2% 7.8% 9.4% 33 Liquids 0.6% 1.4% 1.2% 1.0% 34 Grit 0.1% 0.2% 0.6% 0.4% ALL OTHER MATERIALS 28.7% 34.0% 27.9% 29.2% TOTALS 100.0% 100.0% 100.0% 100.0% PERCENTAGE OF WASTE STREAM 29.5% 17.1% 53.4% 100.0% ES-2 WCS Report Final
 Single-Family Residential Multi-Family Residential All Other Waste, 28.")


7 Executive Summary Figure ES.1: Potentially Recyclable or Compostable Materials (% by weight) Single-Family Residential Multi-Family Residential All Other Waste, 28.7% Other Compostable Materials, 18.4% Recyclable Fiber & Containers, 26.1% Yard Waste, 21.7% Other Recyclables, 5.1% All Other Waste, 34.0% Other Compostable Materials, 22.0% Recyclable Fiber & Containers, 36.9% Other Recyclables, 4.9% Yard Waste, 2.2% Commercial Aggregate Waste Stream All Other Waste, 27.9% Recyclable Fiber & Containers, 35.0% All Other Waste, 29.2% Recyclable Fiber & Containers, 32.7% Other Compostable Materials, 29.0% Other Recyclables, 4.8% Yard Waste, 3.3% Other Compostable Materials, 24.7% Other Recyclables, 4.9% Yard Waste, 8.5% Note: For the purpose of these charts, the following material categories have been combined: Recyclable Fiber includes Newspaper, Corrugated Containers, Office Paper, Other Recyclable Paper, and Aseptic Containers. Recyclable Containers include PET, HDPE, Non-Bottle Plastics #1 and #2, Other Plastic Containers (#3-#7), Tin/Steel Cans, Aluminum Cans, and Glass Containers. Other Recyclables includes Bulky Rigid Plastics, White Goods/Small Appliances, Other Ferrous, Other Non- Ferrous, and Electronics. Other Compostable Materials includes Low Grade Paper, Clean Wood Waste, and Food Waste. All Other Waste includes Non-Rigid Plastic Film, Expanded Polystyrene, All Other Plastics, Other Glass, Textiles, Special Wastes, Household Batteries, Treated Wood Waste, C&D Debris, Tires and Rubber, All Other Garbage, Liquids, and Grit. WCS Report Final ES-3
8 Executive Summary Figure ES.2 provides a comparison of the average amount of eight commonly recycled material types found in waste disposed by single-family residents without and with universal carted collection of single stream recyclables. It provides both the weighted average and the 90 percent confidence intervals for the following material types: newspaper (ONP), corrugated cardboard (OCC), other mixed paper (OMP), PET bottles (PET), HDPE bottles (HDPE), aluminum cans (AL), steel/tin cans (Tin), and glass containers (Glass). Key findings of this comparison are as follows: For seven of the eight types of recyclables, the weighted average was lower in waste from areas with carted single stream recycling. The exception to this is mixed paper, which has a higher weighted average in the carted single stream areas. Mixed paper typically includes junk mail, magazines, paperboard boxes, chipboard, file folders, etc. Most single stream programs likely include this type of material in the program; however, residents might not be aware that it is accepted. Most of the confidence intervals overlap at least somewhat, with the interval for communities with carted single stream recycling shifting somewhat lower than those without, with the exception of mixed paper as noted above. The confidence intervals for steel/tin cans and glass containers do not overlap, with those for communities with carted single stream recycling being lower. This suggests that carted single stream programs are diverting more recyclables from disposal, most notably glass containers and steel/tin cans. It should be noted that this is a very preliminary comparison. Because of the relatively small sample size (seven samples) for areas with carted single stream recycling, the resulting analysis shows fairly wide confidence intervals for some of the materials categories. In addition, the effectiveness of any recycling program depends in large part on the education and outreach efforts by the local government, the maturity of the program, the types of materials accepted, and other factors. The results demonstrate that opportunities exist to divert more recyclables from disposal in communities with and without carted single stream recycling programs. WCS Report Final ES-4
9 Executive Summary Figure ES.2: Material Percentages in Areas without and with Carted Single Stream Recycling (% by weight; 90% confidence interval) 16.0% 14.0% 12.0% 10.0% 8.0% 6.0% 4.0% 2.0% 0.0% ONP = Newspaper OCC = Corrugated Cardboard OMP = Other Mixed Paper 5.0% 4.5% 4.0% 3.5% 3.0% 2.5% 2.0% 1.5% 1.0% 0.5% 0.0% PET = PET Bottles AL = Aluminum Cans HDPE = HDPE Bottles Tin = Steel/Tin Cans ES-5 WCS Report Final
10 Executive Summary Figure ES.3 depicts the aggregate composition of the Large Organic Waste Generator samples that were collected. Figure ES.4 depicts the composition results for these three individual subsets of this sector: supermarkets, restaurants, and institutions. Key findings for the Large Organic Waste Generator sector are as follows: Food waste comprised approximately 31 percent of the Large Organic Waste Generator samples. On average, the supermarket and restaurant samples contained 38 percent food waste, whereas the institutional samples contained only 10.7 percent. Because of the relatively small sample size for the three subset business types, additional research is warranted to further explore whether some institutions might generate a larger percentage of food waste. Recyclable fiber makes up more than 27 percent of the waste disposed. On average, it comprised 24 percent of the restaurant samples, 25 percent of the supermarket samples, and 36 percent of the institutional waste samples. Recyclable containers contributed 10 percent to the Large Organic Waste Generator waste stream. As anticipated, the percentage of recyclables containers was greater in restaurants (14 percent) and institutions (11 percent) than in supermarkets (5 percent). Figure ES.3: Composition of Large Organic Waste Generator Waste Disposed (% by weight) All C&D Debris, 1.2% Yard Waste, 1.5% All Other Waste, 9.2% Textiles, 1.7% Newspaper, 2.0% Corrugated Cardboard, 10.3% All Other Recyclable Paper, 15.3% Food Waste, 31.1% Low Grade Paper, 6.6% Metals, 0.9% Non-Rigid Plastic Film, Other Plastics, 1.2% 7.6% Metal Cans, 1.2% Glass Containers, 3.9% Plastic Containers, 5.1% Bulky Rigid Plastics, 1.1% ES-6 WCS Report Final
11 Executive Summary Figure ES.4: Composition of Waste Disposed by Supermarkets, Restaurants and Institutions (% by weight) Supermarkets Other Compostables, 7.7% Other Waste, 20.3% Reyclable Fiber, 25.5% Food Waste, 38.0% Recyclable Containers, 5.4% Other Recyclables, 3.1% Restaurants Institutions Other Compostables, 7.0% Other Waste, 15.9% Food Waste, 38.3% Reyclable Fiber, 23.9% Recyclable Containers, 14.0% Other Recyclables, 0.8% Other Compostables, 10.9% Other Waste, 27.3% Food Waste, 10.7% Reyclable Fiber, 36.1% Recyclable Containers, 11.1% Other Recyclables, 3.9% Note: For the purpose of these charts, the following material categories have been combined: Recyclable Fiber includes Newspaper, Corrugated Containers, Office Paper, Other Recyclable Paper, and Aseptic Containers. Recyclable Containers include PET, HDPE, Non-Bottle Plastics #1 and #2, Other Plastic Containers (#3-#7), Tin/Steel Cans, Aluminum Cans, and Glass Containers. Other Recyclables includes Bulky Rigid Plastics, White Goods/Small Appliances, Other Ferrous, Other Non- Ferrous, and Electronics. Other Compostables includes Low Grade Paper, Clean Wood Waste, and Yard Waste. Other Waste includes Non-Rigid Plastic Film, Expanded Polystyrene, All Other Plastics, Other Glass, Textiles, Special Wastes, Household Batteries, Treated Wood Waste, C&D Debris, Tires and Rubber, All Other Garbage, Liquids, and Grit. WCS Report Final ES-7
12 Executive Summary Table ES.2 presents the results, as a percentage by volume, of the bulky waste visual audit, as well as the conversion to percentage by weight using industry-accepted conversion factors. Table ES.3 provides the heat value, expressed in British Thermal Units (BTUs) per ton, for each material category and also estimates the potential annual tonnage for each material category based on the quantity of bulky waste received at Bridgeway Acres in FY Figure ES.5 depicts both the percentage by volume and by weight of the potentially combustible and non-combustible materials in the bulky waste stream. Based on this analysis of bulky waste, observations during the visual audit, and additional research, the following potential diversion options were identified: Potentially combustible materials comprised approximately 49 percent by weight and 75 percent by volume of the loads that were audited. Materials identified as most viable for incineration based on heat value and potential to be size-reduced are Treated and Untreated Wood, Yard Waste, Rubber, and Rigid Plastics. In addition, Other Paper, Corrugated Cardboard, Carpet and Padding, Polystyrene/Insulation, Plastic Film, and Roofing Shingles could be separated for incineration. Fiberglass boats, if reduced in size, also have the potential to be incinerated; however, the resulting ash may contain pollutants requiring further processing before landfilling and the small glass fiber spares may cause problems to the dust filter devices. The County should further assess their system to ensure the ability to process this material. Yard waste could be diverted for energy conversion, or alternatively composted. Bulky waste also contains a substantial amount of non-combustible materials that could potentially be diverted for beneficial use. o o o o o Rock and gravel could potentially be used as construction aggregate. Sod and dirt could potentially be added to compost or used as fill material. Crushed concrete and concrete aggregates could be used for road base, ready mix concrete, asphalt pavements, soil stabilization, pipe bedding, and landscape materials. Drywall, when incinerated, produces sulfur dioxide gas, which in high quantities may limit alkaline scrubbers in incinerators and reduce their ability to remove other acidic gases. However, the County s current WTE facility operator, Convanta, has indicated that small quantities of drywall mixed with other municipal solid waste is acceptable. To our knowledge, no recyclers in Florida are currently accepting postconsumer drywall for recycling. The County could explore the feasibility of incorporating drywall into its composting operations. The additional gypsum would result in a calcium- and sulfur-rich compost that is beneficial to some crops. Ferrous and non-ferrous metals are readily recycled if extracted from other bulky waste. To divert bulky waste materials for incineration or other beneficial use would require some form of sorting and processing system. Some of the material would need little more than a loader and operator to separate materials for incineration. Items larger than four feet in size would need to be mechanically processed for size-reduction to accommodate the WTE infeed. Commercial equipment capable of shredding bulky waste such as boats, mattresses, railroad ties, and carpet is available. Due to the capital investment required for a bulky waste processing system, a more detailed financial analysis is warranted to further evaluate the economic and operational feasibility. WCS Report Final ES-8
13 Executive Summary Table ES.2: Characterization of Bulky Waste Material Category Weighted Average (% by volume) Estimated Volume (cy) Average Density (lbs/cy) Estimated Weight (lbs) Weighted Average (% by weight) Corrugated Cardboard 1.6% % Other Paper 1.3% , % Other Non-Ferrous 0.8% , % Other Ferrous 0.6% % Plastic Film 1.0% % Polystyrene/Insulation 1.4% % Rigid Plastics 11.4% , % Yard Waste 19.5% , % Treated Wood 14.0% , % Untreated Wood 15.5% , % Carpet and Padding 0.9% % Drywall 7.3% , % Roofing Shingles 0.4% , % Rock/Gravel/Grit 6.5% , % Tile 0.6% , % Concrete 4.2% , % Sod 3.6% , % Furniture 0.6% % C&D Debris Bagged Waste 0.5% % Glass 0.2% % Other Glass 0.0% Textiles 0.1% % Rubber 1.4% , % Dirt 0.3% , % Porcelain 0.2% , % Fiberglass 0.8% % MSW 2.0% , % Boats a 3.5% , % 100.0% 381, % Note: Columns might not appear to add correctly due to rounding. a The density of a boat can vary greatly. The density used is based on the actual weights of boats or boat forms disposed during the week of the visual audit. WCS Report Final ES-9
14 Executive Summary Table ES.3: Heat Values for Bulky Waste Material Categories Heat Value (million BTU/ton) a Waste Composition (% by weight) Estimated Annual Tonnage Calculated Annual Heat Value (million BTUs) Plastic Film % Rigid Plastics % ,400 Polystyrene/Insulation % Rubber % 1,240 33,400 Corrugated Cardboard % 60 1,000 Carpet and Padding % Textiles % Roofing Shingles % 190 2,300 Treated Wood % 3,760 37,600 Untreated Wood % 4,160 41,600 MSW % 310 3,100 Boats b % 980 8,428 Fiberglass c % Other Paper % 310 2,100 Yard Waste % 3,930 23,600 Other Non-Ferrous % 80 0 Other Ferrous % 60 0 Sod % 1,600 0 Glass % 60 0 Other Glass % 0 0 Dirt % Porcelain % 90 0 Furniture Varies 0.2% 60 Varies C&D Debris Bagged Waste Varies 0.2% 50 Varies Drywall d NA 9.8% 2,950 NA Rock/Gravel/Grit NA 21.9% 6,570 NA Tile NA 1.6% 480 NA Concrete NA 8.0% 2,410 NA TOTALS 100.0% 30, ,014 NA = Not Available a Sources: Energy Information Administration, Methodology for Allocating Municipal Solid Waste to Biogenic and Non-Biogenic Energy, March 2007, pages Nikolas J. Themelis and Charles Mussche, 2014 Energy and Economic Value of Municipal Solid Waste Currently Landfilled in the Fifty States, Earth Engineering Center, Columbia University. b Per M. Davalio, et. al. ("Mechanical Properties of Unsaturated Polyester Resin"), boat composition determined to be unsaturated polyester resin. Per "Developments in the Science and Technology of Composite Materials" (ECCM4), material has estimated heating value of 8.6 BTU/ton. c Category consisted primarily of jet skis and fiberglass molds; therefore, same BTU value as for boats is used for estimation purposes. d Drywall, when combusted, produces sulfur dioxide gas, which in high quantities may limit alkaline scrubbers in WTE facilities and reduce their ability to remove other acidic gases. Therefore, for purposes of this analysis, recovery of drywall for incineration is not recommended. WCS Report Final ES-10
15 Executive Summary Figure ES.5: Potentially Combustible and Non-Combustible Materials in Bulky Waste Percent by Volume 25% Non- Combustible Metals, 1.4% Drywall, 7.3% Other Non- Combustibles, 2.0% Concrete, 4.2% Sod & Dirt, 3.8% Plastics, 13.8% Rubber, 1.4% Paper, 2.9% Rock/Gravel/Grit, 6.5% Other Combustibles, 3.4% Boats & Fiberglass, 4.3% Yard Waste, 19.5% Treated Wood, 14.0% Untreated Wood, 15.5% 75% Potentially Combustible Other Non- Combustibles, 2.5% Metals, 0.5% Drywall, 9.8% Concrete, 8.0% Percent by Weight Plastics, 1.4% Rubber, 4.1% Paper, 1.2% Untreated Wood, 13.9% 49% Potentially Combustible Sod & Dirt, 5.9% 51% Non- Combustible Other Combustibles, 1.8% Rock/Gravel/Grit, 21.9% Yard Waste, 13.1% Treated Wood, 12.5% Boats & Fiberglass, 3.3% Additional details regarding the 2014 WCS are provided in the full study report. Results of the study are intended to assist the County in developing future solid waste programs, including focused and costeffective resource recovery initiatives. ES-11 WCS Report Final
16 Executive Summary This page intentionally left blank. ES-12 WCS Report Final
17 Section 1 Introduction 1.1 Purpose Pinellas County Solid Waste Department (County) contracted Kessler Consulting, Inc. (KCI) to conduct a Waste Characterization Study (WCS) of the municipal solid waste delivered to the Pinellas County Bridgeway Acres facility. The County s previous waste characterization study was completed in A number of changes have occurred since that time that have the potential to impact the composition of the waste stream, including implementation of carted single stream recycling by a number of municipalities and a decrease in tonnage received at Bridgeway Acres that began in 2007 as a result of the recessionary economy. In addition, the previous study focused solely on Class I waste. The purpose of the 2014 WCS is to assist the County in developing future solid waste programs. Specifically, the County s objectives include the following: To characterize the Class I waste and overall materials received by the County at Bridgeway Acres. To compare the waste streams of municipalities with universal, carted single stream recycling to those without it. To determine the amount of organics in the waste stream, in particular the commercial waste stream, to evaluate the feasibility of an organics recycling program. To characterize the non-processable (bulky) waste that is landfilled in order to determine if any components of it could be processed and utilized as fuel in the waste-to-energy (WTE) plant. The goal is to maximize the life of the landfill and enhance WTE energy production. 1.2 Background The County has a population of approximately 926,610 living within 274 square miles, making it Florida s most densely populated county. 1 About 29 percent of residents live in the unincorporated county, 27 percent in the City of St. Petersburg, and 44 percent in the other 23 municipalities within the County. Located on a peninsula, with the Gulf of Mexico to the west and Tampa Bay to the south and east, more than 5.4 million people visited the County in More than 40,000 businesses are located in the County. The top business sectors are health services, tourism services, 1 Florida Bureau of Economic and Business Research, University of Florida. 2 Research Data Services, Inc. ( 1
18 Section 1: Introduction manufacturing, and financial services. 3 All of these factors have the potential to influence the composition of the County s solid waste. Current waste diversion efforts also influence the waste stream composition. Since the 2007 study, the private sector has invested in recyclables processing capacity in the Tampa Bay area, including two single stream processing facilities. Several cities, including Clearwater, Largo, and Dunedin have initiated universal collection of single stream recyclables in roll carts. In addition, some of the private sector haulers operating in the unincorporated county s open market system now offer carted single stream recycling. All 24 municipalities operate or contract for some form of curbside collection of recyclables, and more than 60 drop-off sites operated by local governments also accept recyclables. Class I waste generated within the County is delivered to the Bridgeway Acres facility for disposal. The facility also receives bulky waste, yard waste, and construction and demolition debris, although these materials can also be delivered to private facilities for processing and disposal. 3 WCS Report Final 2
19 Section 2 Methodology 2.1 Class I Methodology Generator Sectors The Class I WCS focused on residential and commercial waste delivered to the Bridgeway Acres facility. The three main generator sectors evaluated during the Class I WCS included: Single-family residential Multi-family residential Commercial/institutional One objective of the WCS was to evaluate organics in the commercial waste stream that might feasibly be recovered for processing; therefore, a subset of the commercial/institutional sector was also included. This subset consisted of the following types of commercial/institutional entities that might be expected to generate a significant amount of organic waste (Large Organic Waste Generators): Restaurants Supermarkets Institutions Material Categories KCI worked with County staff to develop a list of 34 material categories into which waste would be sorted (see Appendix A). To develop and define these material categories, KCI reviewed the following information: Previous County studies, to ensure that comparisons can be made between the results of each study. Several city recycling guidelines, to ensure that materials aligned with recyclables accepted in these programs. FDEP Annual Solid Waste Management Report, to ensure that all of the material categories used in the WCS can be correlated to those required by FDEP in the annual reporting by counties. Sampling and Sorting Protocol Field work was conducted from August and August 25, 2014 at the Bridgeway Acres facility. KCI provided all sorting equipment, safety gear, a scale calibrated to 0.02 pounds (and backup scale calibrated to 0.05 pounds), and two staff people to oversee all sampling, sorting, weighing, and data recording during the two-week event. The County provided a loader and operator to gather samples and to remove waste upon completion of sorting activities. All sort labor was provided by KCI. 3
20 Section 2: Methodology KCI prepared and the County reviewed and approved a site safety plan that was followed throughout the sorting event. KCI worked closely with the County staff to coordinate and set up a sort location that would ensure worker safety. Each morning of the event, sorters were given thorough safety instructions by one of KCI s Supervisors to ensure safety and proper sorting. Sample selection was organized by generator sector to ensure a sufficient number of samples would be sorted for each generator sector to achieve statistically valid results. KCI reviewed tonnage data and worked with the haulers to develop the sampling schedule. Table 2.1 provides the total number and geographic distribution of samples pulled and sorted for each generator. A total of 80 representative samples were sorted during the 10-day study. Table 2.1: Class I WCS Sampling Schedule Municipality Geographic Area and Number of Samples Single-Family Residential Multi- Family Residential % of Res. Waste Commercial Organic Waste Generators TOTAL % of Com. Waste Clearwater 16.9% 3 2.0% 2 5 Belleair 0.5% 0 Dunedin 2.4% % Gulfport 1.5% 1 1 Indian Rocks 0.8% 0 Largo 3.6% % 5 8 Madeira 0.5% 0 Safety Harbor 1.3% 1.9% 1 1 St. Petersburg 22.6% % Treasure Island 1.4% 0 WMI Residential Franchise Areas 11.3% 3 3 Progressive Residential Franchise Areas 3.1% 1 1 Republic Residential Franchise Area 1.6% 1 1 Unincorporated 32.5% 8 n/a American Hauler 0.2% 0.1% 0 County Sanitation 9.5% 1 3.3% 1 2 DisposAll 3.0% 1 1.1% 1 Solar Sanitation 7.6% 1 2.7% 1 WMI 23.0% % Waste Pro 6.9% 2.4% 0 Progressive 39.2% % Republic 10.6% 2 3.7% 1 3 TOTALS SAMPLES 100.0% % WCS Report Final
21 Section 2: Methodology KCI worked with each hauler to identify specific single-family residential and commercial routes that represent a cross-section of each hauler s service area. For the multi-family residential and commercial Large Organic Waste Generators, KCI requested that each hauler identify roll-off compactors to ensure that all waste was generated by the targeted generator sector. All pre-selected routes were provided placards for easy identification by the scalehouse and sorting crews. In addition to the preselected routes, some vehicles were randomly selected onsite by KCI s Study Supervisor for inclusion in the study. KCI s Study Supervisor interviewed incoming drivers to confirm the generator sector and origin of the waste. Once a load was selected for sampling, the Study Supervisor noted the following information on the data recording form: the recorder s name, hauler name and area of County, date and time, type of vehicle, sample number, and any visual observations about the load. The vehicle driver was then directed to the sampling area to tip. The load was visually divided into six sections and, based on a die roll, one of the six sections were selected. A representative sample of at least 200 pounds was pulled, placed on a tarp, labeled, and stored until sorted. Selected samples were placed on KCI s customized sorting table and sorted into the previously defined material categories. After the entire sample was sorted, the Sorting Supervisor weighed and recorded the net weight of each material category on a data recording form. Analytical Procedures After field work was completed, KCI calculated the weighted average of each material category for each generator sector. Data analysis followed industry-accepted standards for statistical sampling, as outlined in the ASTM Standard Test Method for Determination of the Composition of Unprocessed Municipal Solid Waste (D ; reapproved 2008). Where appropriate, 90 percent confidence intervals were calculated, using a standard statistical t- test, for each material category. The following additional procedures were followed during the data analysis: At the request and expense of the City of Largo, extra samples of the city s single-family residential waste were sorted during the two-week sorting event. Based on the sampling schedule developed for the County, only one sample was targeted from the City of Largo; therefore, KCI calculated the weighted average of the city s seven samples for each material category and utilized the resulting weighted averages as the single city sample in the County WCS data analysis. In the case of Large Organic Waste Generators, four supermarket samples, four restaurants samples, and three academic institution samples were sorted. So as not to unfairly weight the contribution of these Large Organic Waste Generators to the overall composition of commercial/institutional waste, KCI calculated the weighted average of each material category for the three generator subsets and utilized the resulting data sets in the overall commercial/institutional analysis to represent a single sample for each of the three subsets (supermarkets, restaurants, academic institutions). To obtain the combined composition of waste received at Bridgeway Acres for disposal, the three waste generator sectors (single-family residential, multi-family residential, and commercial) were combined based on the amount of waste each generator sector WCS Report Final 5
22 Section 2: Methodology contributes to the overall waste stream. To estimate the percentage that each contributes, KCI utilized the County s 2013 Annual Report submitted to the FDEP. Single-family residential 29.5 percent Multi-family residential 17.1 percent Commercial 53.4 percent 2.2 Bulky Waste Methodology Because of the heavy, unwieldy, and highly irregular nature of the bulky waste stream, manual sorting is not feasible; therefore, visual audits were performed. A five-day visual audit of bulky waste was conducted from August 25 through August 29, 2014 at the South Landfill. KCI provided a single staff person trained in visual waste auditing. The same person was assigned during the five-day period to ensure continuity of results. Visual characterizations were made of as many loads of incoming bulky waste as possible without interfering with landfill operations. As each vehicle entered the working face of the South Landfill, KCI staff conducted the following procedures: 1. Recorded the following information on the data form: a) Recorder s name b) Date and time c) Sample number d) Vehicle Type and Origin of Waste e) Any initial visual observations about the load 2. Recorded the size of the roll-off container or vehicle and determined the volume of waste present within. 3. Directed the driver to tip the load of waste in a specified area, if applicable. 4. Inspected the load to determine which material types were present in the load. If necessary, directed the loader operator to broaden load for easier identification of materials. 5. Visually dissected the load and recorded the percent by volume of the material classes present on the visual audit data form provided in Appendix B. 6. Visually estimated the volume of material types in each material class. When applicable and allowable, KCI opened bagged waste to determine contents. 7. Ensured each material class estimates and the sum of all material classes totaled 100%. Ninety-one loads were audited; however, after discussion with County staff, 37 loads were eliminated from the analysis because they consisted of excavated material from Toytown Landfill (which was undergoing drainage work), street sweepings, filter cake, or other items considered to be special waste by the County. In total, 54 visual audits were included in the bulky waste analysis, which represented approximately 46 percent of the bulky waste loads and 49 percent of the bulky waste tonnage received at the facility that week. The data was then analyzed to calculate the volumetric weighted average of each material category, as well as the confidence interval using a standard statistical t-test. The percent by WCS Report Final 6
23 Section 2: Methodology volume of each material type present in the samples was then converted to percent by weight using industry-accepted conversion factors. Once the percent by weight was estimated, the heat values of each material (expressed as million BTUs per ton) were identified and attributed to identify the materials that offer the greatest value for processing at the County s WTE plant. WCS Report Final 7
24 Section 2: Methodology This page intentionally left blank. 8 WCS Report Final
25 Section 3 Results and Findings 3.1 Introduction to Results Unless otherwise stated, all results presented in this section are expressed in percentage by weight. The percentages included in the tables and figures are the mean values for each material category. Where appropriate, the tables also provide the 90 percent confidence intervals for each material category. The confidence interval indicates that, with a 90 percent level of confidence, the actual arithmetic mean is within the upper and lower limits shown. 4 This provides an understanding of how much variation occurred in the quantity of that material category found in the samples sorted. Generally, the more homogeneous the waste stream and the greater the number of samples sorted, the higher the level of accuracy achieved and the narrower the margin between the upper and lower bounds of the confidence interval. The percentages in the tables and figures are rounded to the nearest tenth of a percent; therefore, when added together, they might not appear to total correctly. 3.2 Single-Family Residential Waste Figure 3.1 depicts the composition of waste disposed by single-family residents within the County and Table 3.1 provides a more detailed breakdown by material category and the 90 percent confidence intervals. Individual sample data for the Single-Family Residential sector can be found in Appendix C. Key findings of the Single-Family Residential sector are as follows: Recyclable fiber represents 17.3 percent of single-family residential waste disposed, with Other Recyclable Paper contributing the greatest quantity (9.3 percent). Recyclable containers contribute 8.7 percent to the single-family residential waste stream, with plastic and glass containers contributing the greatest percentage. Yard waste comprises 21.7 percent of single-family residential waste disposed. This is a high percentage compared to other recent WCSs conducted by KCI, but fairly normal for a county that utilizes WTE. 5 Because yard waste is not banned from WTE facilities in Florida, separate collection of yard waste generally does not appear to be as high of a priority in counties that utilize WTE than in those that landfill waste. Food waste contributes 12.2 percent to the single-family residential waste stream. 4 Because this is a statistical analysis, the lower end of the confidence interval may be a negative number. 5 In the 10 WCSs conducted by KCI for Florida jurisdictions in the last 5 years, the single-family waste stream was comprised of 2.4 to 27.4 percent yard waste (2.4 to 15.2 percent in counties that landfill waste and 9.7 to 27.4 percent in counties that utilize WTE). WCS Report Final 9
26 Section 3: Results and Findings Figure 3.1: Composition of Single-Family Residential Waste Disposed (% by weight) All Other Waste, 14.0% Newspaper, 2.0% Corrugated Cardboard, 5.0% All Other Recyclable Paper, 10.4% Textiles, 5.4% All C&D Debris, 6.5% Low Grade Paper, 5.2% Metal Cans, 1.7% Glass Containers, 3.4% Yard Waste, 21.7% Plastic Containers, 3.7% Bulky Rigid Plastics, 1.9% Non-Rigid Plastic Film, 4.3% Other Plastics, 1.5% Food Waste, 12.2% Metals, 1.3% Note: For the purpose of this chart, the following material categories have been combined: All Other Recyclable Paper includes Office Paper, Other Recyclable Paper, and Aseptic Containers. Metal Cans includes Tin/Steel Cans and Aluminum Cans. Plastic Containers includes PET, HDPE, Non-Bottle Plastics, and Other Plastic Containers (#3-#7). Other Plastics includes Expanded Polystyrene and All Other Plastics. Metals include Other Ferrous, Other Non-Ferrous, and White Goods/Small Appliances. All C&D Debris includes C&D Debris, Clean Wood Waste, and Treated Wood Waste. All Other Waste includes Other Glass, Special Wastes, Electronics, Household Batteries, Tires and Rubber, All Other Garbage, Liquids, and Grit. WCS Report Final 10
27 Section 3: Results and Findings Table 3.1: Composition of Single-Family Residential Waste Disposed (% by weight) Material Category Weighted Average 90% Confidence Interval Lower Bounds Upper Bounds 1 Newspaper 2.0% 1.6% 2.5% 2 Corrugated Containers 5.0% 3.1% 6.9% 3 Office Paper 0.8% 0.4% 1.2% 4 Other Recyclable Paper 9.3% 8.2% 10.4% 5 Low Grade Paper 5.2% 4.4% 6.0% 6 Aseptic Containers 0.3% 0.1% 0.4% 7 PET Bottles 1.4% 1.1% 1.6% 8 HDPE Bottles 0.7% 0.5% 0.9% 9 Other Non-Bottle Plastics #1 and #2 0.8% 0.6% 0.9% 10 Other Plastic Containers (#3-#7) 0.8% 0.7% 1.0% 11 Bulky Rigid Plastics 1.9% 1.4% 2.3% 12 Non-Rigid Plastic Film 4.3% 3.8% 4.7% 13 Expanded Polystyrene 1.0% 0.5% 1.4% 14 All Other Plastics 0.5% 0.4% 0.6% 15 Tin/Steel Cans 1.0% 0.9% 1.1% 16 White Goods/Small Appliances 0.0% 0.0% 0.0% 17 Other Ferrous 0.9% 0.6% 1.3% 18 Aluminum Cans 0.7% 0.6% 0.9% 19 Other Non-Ferrous 0.3% 0.2% 0.4% 20 Glass Containers 3.4% 2.7% 4.0% 21 Other Glass 0.2% 0.1% 0.3% 22 Textiles 5.4% 3.7% 7.1% 23 Special Wastes 0.4% -0.2% 0.9% 24 Electronics 2.0% 1.1% 2.8% 25 Household Batteries 0.1% 0.0% 0.1% 26 Clean Wood Waste 1.0% 0.5% 1.6% 27 Treated Wood Waste 3.5% 1.4% 5.5% 28 C&D Debris 2.1% 0.9% 3.2% 29 Tires and Rubber 1.2% -0.3% 2.6% 30 Yard Waste 21.7% 17.1% 26.3% 31 Food Waste 12.2% 10.3% 14.1% 32 All Other Garbage 9.5% 8.0% 11.0% 33 Liquids 0.6% 0.4% 0.8% 34 Grit 0.1% 0.0% 0.3% TOTALS 100.0% Note: Columns might not appear to add correctly due to rounding. In addition, the confidence interval is a statistical calculation; therefore, the lower bounds may be a negative number. 11 WCS Report Final
28 Section 3: Results and Findings One objective of the WCS was to evaluate the composition of waste disposed by single-family residents in areas with and without universal, carted single stream recycling. Municipalities with such a program included Belleair, Clearwater, Dunedin, Largo, Oldsmar, Safety Harbor, Seminole, and Treasure Island. While other municipalities have implemented single stream recycling programs, they continue to use recycling bins rather than the larger roll carts that have had demonstrated results in increasing participation and recycling tonnage. Seven samples were identified as coming from areas with carted single stream recycling; the other 18 single-family residential samples came from areas without single stream recycling carts. Table 3.2 provides a comparison of waste disposed by single-family residents without and with universal carted collection of single stream recyclables. Figure 3.2 compares the 90 percent confidence intervals between the two data sets for eight material types that are commonly included in recycling programs: newspaper (ONP), corrugated cardboard (OCC), other mixed paper (OMP), PET bottles (PET), HDPE bottles (HDPE), aluminum cans (AL), steel/tin cans (Tin), and glass containers (Glass). Key findings of this comparison are as follows: For seven of the eight types of recyclables, the weighted average was lower in waste from areas with carted single stream recycling. The exception to this is mixed paper, which has a higher weighted average in the carted single stream areas. Mixed paper typically includes junk mail, magazines, paperboard boxes, chipboard, file folders, etc. Most single stream programs likely include this type of material in the program; however, residents might not be aware that it is accepted. Most of the confidence intervals overlap at least somewhat, with the interval for communities with carted single stream recycling shifting somewhat lower than those without, with the exception of mixed paper as noted above. The confidence intervals for steel/tin cans and glass containers do not overlap, with those for communities with carted single stream recycling being lower. This suggests that carted single stream programs are diverting more recyclables from disposal, most notably glass containers and steel/tin cans. It should be noted that this is a very preliminary comparison. Because of the relatively small sample size (seven samples) for areas with carted single stream recycling, the resulting analysis shows fairly wide confidence intervals for some of the materials categories. In addition, the effectiveness of any recycling program depends in large part on the education and outreach efforts by the local government, the maturity of the program, the types of materials accepted, and other factors. The results demonstrate that opportunities exist to divert more recyclables from disposal in communities with and without carted single stream recycling programs. WCS Report Final 12
29 Section 3: Results and Findings Table 3.2: Composition in Areas without and with Carted Single Stream Recycling (% by weight) Material Category Without Universal Carted Single Stream Recycling 90% Confidence Interval Weighted Average Lower Bounds Upper Bounds With Universal Carted Single Stream Recycling 90% Confidence Interval Weighted Average Lower Bounds Upper Bounds % Difference 1 Newspaper 2.3% 1.9% 2.8% 1.2% 0.5% 2.0% -47.0% 2 Corrugated Containers 5.4% 2.7% 8.1% 3.8% 2.4% 5.2% -30.0% 3 Office Paper 0.5% 0.2% 0.9% 1.5% 0.2% 2.7% 178.8% 4 Other Recyclable Paper 8.5% 7.3% 9.7% 11.2% 8.3% 14.0% 30.9% 5 Low Grade Paper 4.6% 3.7% 5.6% 6.4% 5.0% 7.9% 38.2% 6 Aseptic Containers 0.2% 0.1% 0.3% 0.3% -0.1% 0.8% 61.3% 7 PET Bottles 1.5% 1.1% 1.8% 1.2% 0.7% 1.6% -18.9% 8 HDPE Bottles 0.7% 0.5% 0.9% 0.7% 0.1% 1.2% -7.0% 9 Other Non-Bottle Plastics #1 and #2 0.8% 0.6% 1.0% 0.7% 0.4% 1.0% -11.8% 10 Other Plastic Containers (#3-#7) 0.7% 0.6% 0.8% 1.1% 0.6% 1.6% 52.8% 11 Bulky Rigid Plastics 1.5% 1.2% 1.8% 2.9% 1.4% 4.3% 92.8% 12 Non-Rigid Plastic Film 4.0% 3.6% 4.4% 5.1% 3.8% 6.4% 28.3% 13 Expanded Polystyrene 1.1% 0.5% 1.7% 0.7% 0.3% 1.2% -35.3% 14 All Other Plastics 0.4% 0.3% 0.5% 0.7% 0.2% 1.2% 61.0% 15 Tin/Steel Cans 1.0% 0.9% 1.2% 0.8% 0.7% 0.9% -24.5% 16 White Goods/Small Appliances 0.0% 0.0% 0.0% 0.0% 0.0% 0.0% 0.0% 17 Other Ferrous 1.0% 0.5% 1.5% 0.8% 0.3% 1.2% -25.9% 18 Aluminum Cans 0.8% 0.6% 1.0% 0.6% 0.3% 0.8% -29.2% 19 Other Non-Ferrous 0.3% 0.2% 0.3% 0.5% 0.1% 0.8% 73.0% 20 Glass Containers 4.0% 3.3% 4.7% 1.8% 1.1% 2.6% -54.3% 21 Other Glass 0.1% 0.0% 0.2% 0.3% 0.0% 0.6% 174.4% 22 Textiles 5.2% 3.2% 7.2% 5.8% 1.5% 10.2% 11.7% 23 Special Wastes 0.5% -0.3% 1.2% 0.1% 0.0% 0.1% -86.7% 24 Electronics 1.7% 0.7% 2.6% 2.7% 0.3% 5.1% 63.6% 25 Household Batteries 0.1% 0.0% 0.1% 0.1% 0.0% 0.2% 57.0% 26 Clean Wood Waste 1.1% 0.4% 1.9% 0.7% -0.1% 1.5% -37.5% 27 Treated Wood Waste 4.1% 1.2% 7.0% 1.9% 0.4% 3.4% -54.2% 28 C&D Debris 2.5% 0.8% 4.2% 1.0% 0.0% 2.0% -60.2% 29 Tires and Rubber 1.4% -0.7% 3.5% 0.7% 0.0% 1.3% -52.7% 30 Yard Waste 21.9% 16.2% 27.6% 21.3% 11.2% 31.4% -2.8% 31 Food Waste 11.9% 10.0% 13.9% 12.9% 7.0% 18.8% 7.9% 32 All Other Garbage 9.3% 7.4% 11.2% 10.0% 7.1% 12.9% 7.6% 33 Liquids 0.5% 0.4% 0.7% 0.8% 0.4% 1.1% 41.8% 34 Grit 0.2% 0.0% 0.4% 0.0% 0.0% 0.0% -96.7% TOTALS 100.0% 100.0% Note: Columns might not appear to add correctly due to rounding. In addition, the confidence interval is a statistical calculation; therefore, the lower bounds may be a negative number. 13 WCS Report Final
30 Section 3: Results and Findings Figure 3.2: Material Percentages in Areas with and without Carted Single Stream Recycling (% by weight; 90% confidence interval) 16.0% 14.0% 12.0% 10.0% 8.0% 6.0% 4.0% 2.0% 0.0% ONP = Newspaper OCC = Corrugated Cardboard OMP = Other Mixed Paper 5.0% 4.5% 4.0% 3.5% 3.0% 2.5% 2.0% 1.5% 1.0% 0.5% 0.0% PET = PET Bottles AL = Aluminum Cans HDPE = HDPE Bottles Tin = Steel/Tin Cans 14 WCS Report Final
31 Section 3: Results and Findings 3.3 Multi-Family Residential Waste Figure 3.3 depicts the composition of waste disposed of by multi-family residents and Table 3.3 provides additional details and the 90 percent confidence intervals for each material category. Individual sample data for the Multi-Family Residential sector can be found in Appendix D. As expected, multi-family residential waste contained a larger percentage of recyclable materials than the single-family waste stream. Establishing effective recycling programs at multi-family complexes can be challenging; whereas, curbside recycling for single-family residents is more the norm. Key findings of the Multi-Family Residential sector are as follows: Recyclable fiber makes up 22.1 percent of multi-family waste that is disposed. About half of this is Other Recyclable Paper (11.8 percent). Recyclable containers comprise 14.8 percent of multi-family waste, with plastic and glass containers having the highest percentage. Very little yard waste (2.2 percent) is disposed in multi-family waste. Many complexes either generate very little yard waste or manage it through a landscape contractor. Food waste comprises 16.5 percent of the multi-family residential waste stream that is disposed. WCS Report Final 15
32 Section 3: Results and Findings Figure 3.3: Composition of Multi-Family Residential Waste Disposed (% by weight) All Other Waste, 18.3% Newspaper, 3.0% Corrugated Cardboard, 5.9% All Other Recyclable Paper, 13.2% Textiles, 4.5% All C&D Debris, 6.5% Low Grade Paper, 5.2% Metal Cans, 2.4% Yard Waste, 2.2% Glass Containers, 6.3% Food Waste, 16.5% Plastic Containers, 6.1% Bulky Rigid Plastics, Non-Rigid Plastic Metals, 1.4% 1.7% Film, 5.1% Other Plastics, 1.7% Note: For the purpose of this chart, the following material categories have been combined: All Other Recyclable Paper includes Office Paper, Other Recyclable Paper, and Aseptic Containers. Metal Cans includes Tin/Steel Cans and Aluminum Cans. Plastic Containers includes PET, HDPE, Non-Bottle Plastics, and Other Plastic Containers (#3-#7). Other Plastics includes Expanded Polystyrene and All Other Plastics. Metals include Other Ferrous, Other Non-Ferrous, and White Goods/Small Appliances. All C&D Debris includes C&D Debris, Clean Wood Waste, and Treated Wood Waste. All Other Waste includes Other Glass, Special Wastes, Electronics, Household Batteries, Tires and Rubber, All Other Garbage, Liquids, and Grit. WCS Report Final 16
33 Section 3: Results and Findings Table 3.3: Composition of Multi-Family Residential Waste Disposed (% by weight) 90% Confidence Interval Material Category Weighted Average Lower Bounds Upper Bounds 1 Newspaper 3.0% 1.8% 4.2% 2 Corrugated Containers 5.9% 3.9% 8.0% 3 Office Paper 0.8% 0.4% 1.3% 4 Other Recyclable Paper 11.8% 10.3% 13.2% 5 Low Grade Paper 5.2% 3.9% 6.5% 6 Aseptic Containers 0.6% 0.3% 0.9% 7 PET Bottles 2.4% 2.1% 2.6% 8 HDPE Bottles 1.4% 1.0% 1.8% 9 Non-Bottle Plastics #1 and #2 1.2% 1.0% 1.5% 10 Other Plastic Containers (#3-#7) 1.0% 0.9% 1.2% 11 Bulky Rigid Plastics 1.7% 1.1% 2.4% 12 Non-Rigid Plastic Film 5.1% 4.4% 5.8% 13 Expanded Polystyrene 0.8% 0.6% 1.0% 14 All Other Plastics 0.9% 0.4% 1.4% 15 Tin/Steel Cans 1.4% 1.0% 1.7% 16 White Goods/Small Appliances 0.0% 0.0% 0.0% 17 Other Ferrous 1.0% 0.5% 1.4% 18 Aluminum Cans 1.1% 0.7% 1.4% 19 Other Non-Ferrous 0.4% 0.2% 0.6% 20 Glass Containers 6.3% 4.3% 8.3% 21 Other Glass 0.2% 0.0% 0.3% 22 Textiles 4.5% 2.7% 6.2% 23 Special Wastes 0.1% 0.0% 0.2% 24 Electronics 1.8% 0.6% 3.1% 25 Household Batteries 0.1% 0.0% 0.3% 26 Clean Wood Waste 0.2% 0.0% 0.5% 27 Treated Wood Waste 0.5% 0.1% 0.9% 28 C&D Debris 5.7% 1.8% 9.6% 29 Tires and Rubber 0.3% 0.0% 0.5% 30 Yard Waste 2.2% 1.1% 3.2% 31 Food Waste 16.5% 13.8% 19.3% 32 All Other Garbage 14.2% 10.9% 17.4% 33 Liquids 1.4% 1.0% 1.7% 34 Grit 0.2% -0.1% 0.5% TOTAL 100.0% Note: Columns might not appear to add correctly due to rounding. In addition, the confidence interval is a statistical calculation; therefore, the lower bounds may be a negative number. WCS Report Final 17
34 Section 3: Results and Findings 3.4 Commercial Waste Figure 3.4 depicts the composition of commercial waste delivered to Bridgeway Acres for disposal and Table 3.4 provides additional details and the 90 percent confidence intervals for each material category. Individual sample data for the Commercial sector can be found in Appendix E. Key findings for the Commercial sector are as follows: Recyclable fiber comprises more than a quarter (25.5 percent) of waste disposed by businesses and institutions. Recyclable containers contribute an additional 9.5 percent to commercial waste. Yard waste contributes only 3.3 percent to commercial waste, likely for the same reasons that it contributes a small amount to the multi-family waste stream. Food waste makes up 18.5 percent of the commercial waste that is disposed. Another objective of the WCS was to evaluate the percentage of food waste in the commercial Large Organic Waste Generator sector. Figure 3.5 depicts the aggregate composition of the Large Organic Waste Generator samples that were collected. Table 3.5 provides additional details and the 90 percent confidence intervals of this aggregate composition, as well as the weighted average of the supermarket, restaurant, and academic institution samples. In addition, Figure 3.6 depicts the composition results for these three individual subsets of this sector. Individual sample data for the Large Organic Waste Generator sector can be found in Appendix F. Key findings for the Large Organic Waste Generator sector are as follows: Food waste comprised approximately 31 percent of the Large Organic Waste Generator samples. On average, the supermarket and restaurant samples contained 38 percent food waste, whereas the institutional samples contained only 10.7 percent. Because of the relatively small sample size for the three subset business types, additional research is warranted to further explore whether some institutions might generate a larger percentage of food waste. Other waste diversion opportunities also exist in this Large Organic Waste Generator sector. Recyclable fiber makes up more than 27 percent of the waste disposed. On average, it comprised 24 percent of the restaurant samples, 25 percent of the supermarket samples, and 36 percent of the institutional waste samples. Recyclable containers contributed 10 percent to the Large Organic Waste Generator waste stream. As anticipated, the percentage of recyclables containers was greater in restaurants (14 percent) and institutions (11 percent) than in supermarkets (5 percent). WCS Report Final 18
35 Section 3: Results and Findings Figure 3.4: Composition of Commercial Waste Disposed (% by weight) All Other Waste, 12.2% Newspaper, 2.2% Corrugated Cardboard, 10.5% Textiles, 2.3% All C&D Debris, 10.5% All Other Recyclable Paper, 12.8% Yard Waste, 3.3% Low Grade Paper, 6.9% Metal Cans, 1.7% Food Waste, 18.5% Glass Containers, 3.7% Plastic Containers, 4.1% Bulky Rigid Plastics, Metals, 1.6% Non-Rigid Plastic 1.6% Film, 6.2% Other Plastics, 1.7% Note: For the purpose of this chart, the following material categories have been combined: All Other Recyclable Paper includes Office Paper, Other Recyclable Paper, and Aseptic Containers. Metal Cans includes Tin/Steel Cans and Aluminum Cans. Plastic Containers includes PET, HDPE, Non-Bottle Plastics, and Other Plastic Containers (#3-#7). Other Plastics includes Expanded Polystyrene and All Other Plastics. Metals include Other Ferrous, Other Non-Ferrous, and White Goods/Small Appliances. All C&D Debris includes C&D Debris, Clean Wood Waste, and Treated Wood Waste. All Other Waste includes Other Glass, Special Wastes, Electronics, Household Batteries, Tires and Rubber, All Other Garbage, Liquids, and Grit. WCS Report Final 19
36 Section 3: Results and Findings Table 3.4: Composition of Commercial Waste Disposed (% by weight) Material Category Weighted Average 90% Confidence Interval Lower Bounds Upper Bounds 1 Newspaper 2.2% 1.6% 2.8% 2 Corrugated Containers 10.5% 8.5% 12.5% 3 Office Paper 1.1% 0.6% 1.7% 4 Other Recyclable Paper 11.3% 9.5% 13.2% 5 Low Grade Paper 6.9% 5.8% 8.1% 6 Aseptic Containers 0.4% 0.2% 0.6% 7 PET Bottles 1.5% 1.2% 1.8% 8 HDPE Bottles 0.8% 0.6% 0.9% 9 Other Non-Bottle Plastics #1 and #2 0.9% 0.8% 1.1% 10 Other Plastic Containers (#3-#7) 1.0% 0.8% 1.1% 11 Bulky Rigid Plastics 1.6% 1.1% 2.0% 12 Non-Rigid Plastic Film 6.2% 5.3% 7.2% 13 Expanded Polystyrene 1.0% 0.7% 1.2% 14 All Other Plastics 0.7% 0.5% 1.0% 15 Tin/Steel Cans 1.0% 0.8% 1.2% 16 White Goods/Small Appliances 0.0% 0.0% 0.1% 17 Other Ferrous 1.3% 0.7% 2.0% 18 Aluminum Cans 0.7% 0.6% 0.8% 19 Other Non-Ferrous 0.3% 0.2% 0.3% 20 Glass Containers 3.7% 2.5% 4.8% 21 Other Glass 0.3% 0.1% 0.5% 22 Textiles 2.3% 1.7% 3.0% 23 Special Wastes 0.1% 0.0% 0.3% 24 Electronics 1.6% 0.8% 2.4% 25 Household Batteries 0.1% 0.0% 0.1% 26 Clean Wood Waste 3.5% 1.5% 5.6% 27 Treated Wood Waste 2.8% 1.0% 4.6% 28 C&D Debris 4.2% 2.2% 6.1% 29 Tires and Rubber 0.5% 0.1% 1.0% 30 Yard Waste 3.3% 1.8% 4.8% 31 Food Waste 18.5% 15.4% 21.6% 32 All Other Garbage 7.8% 5.9% 9.6% 33 Liquids 1.2% 0.7% 1.6% 34 Grit 0.6% 0.3% 1.0% TOTALS 100.0% Note: Columns might not appear to add correctly due to rounding. WCS Report Final 20
37 Section 3: Results and Findings Figure 3.5: Composition of Large Organic Waste Generator Waste Disposed (% by weight) All C&D Debris, 1.2% Yard Waste, 1.5% Textiles, 1.7% All Other Waste, 9.2% Newspaper, 2.0% Corrugated Cardboard, 10.3% All Other Recyclable Paper, 15.3% Food Waste, 31.1% Low Grade Paper, 6.6% Metals, 0.9% Other Plastics, 1.2% Non-Rigid Plastic Film, 7.6% Metal Cans, 1.2% Glass Containers, 3.9% Plastic Containers, 5.1% Bulky Rigid Plastics, 1.1% Note: For the purpose of this chart, the following material categories have been combined: All Other Recyclable Paper includes Office Paper, Other Recyclable Paper, and Aseptic Containers. Metal Cans includes Tin/Steel Cans and Aluminum Cans. Plastic Containers includes PET, HDPE, Non-Bottle Plastics, and Other Plastic Containers (#3-#7). Other Plastics includes Expanded Polystyrene and All Other Plastics. Metals include Other Ferrous, Other Non-Ferrous, and White Goods/Small Appliances. All C&D Debris includes C&D Debris, Clean Wood Waste, and Treated Wood Waste. All Other Waste includes Other Glass, Special Wastes, Electronics, Household Batteries, Tires and Rubber, All Other Garbage, Liquids, and Grit. WCS Report Final 21
38 Section 3: Results and Findings Table 3.5: Composition of Large Organic Waste Generator Waste Disposed (% by weight) Material Category Weighted Average Super Markets Restaurants Institutions Aggregate Weighted Average 90% Confidence Interval Lower Bounds Upper Bounds 1 Newspaper 1.9% 1.1% 3.7% 2.0% 0.6% 3.5% 2 Corrugated Containers 9.5% 13.2% 6.9% 10.3% 6.6% 13.9% 3 Office Paper 9.1% 0.5% 5.4% 4.8% 0.0% 9.6% 4 Other Recyclable Paper 4.9% 8.9% 19.6% 10.3% 6.0% 14.5% 5 Low Grade Paper 5.9% 5.6% 9.0% 6.6% 4.4% 8.8% 6 Aseptic Containers 0.1% 0.2% 0.6% 0.3% 0.1% 0.5% 7 PET Bottles 1.0% 1.3% 4.1% 1.9% 0.9% 2.9% 8 HDPE Bottles 0.4% 0.5% 0.8% 0.6% 0.2% 0.9% 9 Other Non-Bottle Plastics #1 and #2 1.0% 0.6% 1.8% 1.0% 0.6% 1.5% 10 Other Plastic Containers (#3-#7) 1.1% 2.3% 1.2% 1.6% 0.9% 2.3% 11 Bulky Rigid Plastics 0.9% 0.5% 2.3% 1.1% 0.4% 1.8% 12 Non-Rigid Plastic Film 7.9% 5.2% 10.8% 7.6% 6.2% 9.0% 13 Expanded Polystyrene 0.4% 0.8% 1.4% 0.8% 0.4% 1.2% 14 All Other Plastics 0.3% 0.5% 0.4% 0.4% 0.3% 0.5% 15 Tin/Steel Cans 0.1% 0.7% 0.6% 0.5% 0.2% 0.8% 16 White Goods/Small Appliances 0.0% 0.0% 0.0% 0.0% 0.0% 0.0% 17 Other Ferrous 0.7% 0.1% 0.7% 0.5% -0.1% 1.0% 18 Aluminum Cans 0.1% 1.0% 1.0% 0.7% 0.3% 1.1% 19 Other Non-Ferrous 0.8% 0.2% 0.4% 0.5% -0.1% 1.0% 20 Glass Containers 1.7% 7.5% 1.5% 3.9% 1.8% 6.0% 21 Other Glass 0.1% 0.2% 0.0% 0.1% 0.0% 0.2% 22 Textiles 2.2% 1.0% 2.0% 1.7% 0.7% 2.7% 23 Special Wastes 0.1% 0.2% 0.0% 0.1% 0.0% 0.2% 24 Electronics 0.7% 0.0% 0.5% 0.4% -0.2% 1.0% 25 Household Batteries 0.0% 0.0% 0.0% 0.0% 0.0% 0.0% 26 Clean Wood Waste 0.2% 0.2% 0.0% 0.1% 0.0% 0.3% 27 Treated Wood Waste 0.6% 0.3% 0.9% 0.6% 0.0% 1.2% 28 C&D Debris 1.0% 0.3% 0.1% 0.5% -0.1% 1.1% 29 Tires and Rubber 0.1% 0.4% 0.3% 0.3% 0.1% 0.5% 30 Yard Waste 1.6% 1.2% 1.9% 1.5% 0.4% 2.7% 31 Food Waste 38.0% 38.3% 10.7% 31.1% 23.4% 38.8% 32 All Other Garbage 5.9% 5.5% 8.6% 6.5% 4.3% 8.6% 33 Liquids 1.5% 1.5% 2.6% 1.8% 0.6% 2.9% 34 Grit 0.2% 0.0% 0.0% 0.1% -0.1% 0.2% TOTALS 100.0% 100.0% 100.0% 100.0% Note: Columns might not appear to add correctly due to rounding. In addition, the confidence interval is a statistical calculation; therefore, the lower bounds may be a negative number. 22 WCS Report Final
39 Section 3: Results and Findings Figure 3.6: Composition of Waste Disposed by Supermarkets, Restaurants and Institutions (% by weight) Supermarkets Other Compostables, 7.7% Other Waste, 20.3% Reyclable Fiber, 25.5% Food Waste, 38.0% Recyclable Containers, 5.4% Other Recyclables, 3.1% Restaurants Institutions Other Compostables, 7.0% Other Waste, 15.9% Food Waste, 38.3% Reyclable Fiber, 23.9% Recyclable Containers, 14.0% Other Recyclables, 0.8% Other Compostables, 10.9% Other Waste, 27.3% Food Waste, 10.7% Reyclable Fiber, 36.1% Recyclable Containers, 11.1% Other Recyclables, 3.9% Note: For the purpose of these charts, the following material categories have been combined: Recyclable Fiber includes Newspaper, Corrugated Containers, Office Paper, Other Recyclable Paper, and Aseptic Containers. Recyclable Containers include PET, HDPE, Non-Bottle Plastics #1 and #2, Other Plastic Containers (#3-#7), Tin/Steel Cans, Aluminum Cans, and Glass Containers. Other Recyclables includes Bulky Rigid Plastics, White Goods/Small Appliances, Other Ferrous, Other Non- Ferrous, and Electronics. Other Compostables includes Low Grade Paper, Clean Wood Waste, and Yard Waste. Other Waste includes Non-Rigid Plastic Film, Expanded Polystyrene, All Other Plastics, Other Glass, Textiles, Special Wastes, Household Batteries, Treated Wood Waste, C&D Debris, Tires and Rubber, All Other Garbage, Liquids, and Grit. WCS Report Final 23
40 Section 3: Results and Findings 3.5 Aggregate Waste Stream Data for the three waste generator sectors (single-family residential, multi-family residential, and commercial) were combined to calculate the combined composition of processable waste delivered to Bridgeway Acres. This is collectively referred to as the Aggregate Waste Stream. Figure 3.7 depicts the composition of the Aggregate Waste Stream and Table 3.6 presents the contribution of the three generator sectors to this composition. Key findings of the Aggregate Waste Stream are as follows: Recyclable fiber comprises 22.5 percent of the Aggregate Waste Stream, a substantial portion of which consists of Other Recyclable Paper (10.8 percent) and Corrugated Cardboard (8.1 percent). Recyclable containers comprise 10.2 percent of the Aggregate Waste disposed, with various types of plastics containers and glass containers contributing the greatest quantities. Yard waste comprises 8.5 percent of the Aggregate Waste Stream, the overwhelming majority coming from single-family residences. Food waste contributes 16.3 percent of the Aggregate Waste Stream. WCS Report Final 24
41 Section 3: Results and Findings Figure 3.7: Composition of Aggregate Waste Stream Disposed (% by weight) All Other Waste, 13.8% Newspaper, 2.3% Corrugaed Cardboard, 8.1% Textiles, 3.6% All Other Recyclable Paper, 12.2% All C&D Debris, 8.6% Low Grade Paper, 6.1% Yard Waste, 8.5% Food Waste, 16.3% Metals, 1.5% Metal Cans, 1.8% Glass Containers, 4.0% Plastic Containers, 4.3% Bulky Rigid Plastics, 1.7% Non-Rigid Plastic Film, 5.5% Other Plastics, 1.6% Note: For the purpose of this chart, the following material categories have been combined: All Other Recyclable Paper includes Office Paper, Other Recyclable Paper, and Aseptic Containers. Metal Cans includes Tin/Steel Cans and Aluminum Cans. Plastic Containers includes PET, HDPE, Non-Bottle Plastics, and Other Plastic Containers (#3-#7). Other Plastics includes Expanded Polystyrene and All Other Plastics. Metals include Other Ferrous, Other Non-Ferrous, and White Goods/Small Appliances. All C&D Debris includes C&D Debris, Clean Wood Waste, and Treated Wood Waste. All Other Waste includes Other Glass, Special Wastes, Electronics, Household Batteries, Tires and Rubber, All Other Garbage, Liquids, and Grit. WCS Report Final 25
42 Section 3: Results and Findings Table 3.6: Composition of Aggregate Waste Stream, by Generator Sector (% by weight) Material Category Single- Family Residential Multi- Family Residential Commercial Aggregate 1 Newspaper 2.0% 3.0% 2.2% 2.3% 2 Corrugated Containers 5.0% 5.9% 10.5% 8.1% 3 Office Paper 0.8% 0.8% 1.1% 1.0% 4 Other Recyclable Paper 9.3% 11.8% 11.3% 10.8% 5 Low Grade Paper 5.2% 5.2% 6.9% 6.1% 6 Aseptic Containers 0.3% 0.6% 0.4% 0.4% 7 PET Bottles 1.4% 2.4% 1.5% 1.6% 8 HDPE Bottles 0.7% 1.4% 0.8% 0.9% 9 Non-Bottle Plastics #1 and #2 0.8% 1.2% 0.9% 0.9% 10 Other Plastic Containers (#3-#7) 0.8% 1.0% 1.0% 0.9% 11 Bulky Rigid Plastics 1.9% 1.7% 1.6% 1.7% 12 Non-Rigid Plastic Film 4.3% 5.1% 6.2% 5.5% 13 Expanded Polystyrene 1.0% 0.8% 1.0% 0.9% 14 All Other Plastics 0.5% 0.9% 0.7% 0.7% 15 Tin/Steel Cans 1.0% 1.4% 1.0% 1.1% 16 White Goods/Small Appliances 0.0% 0.0% 0.0% 0.0% 17 Other Ferrous 0.9% 1.0% 1.3% 1.2% 18 Aluminum Cans 0.7% 1.1% 0.7% 0.8% 19 Other Non-Ferrous 0.3% 0.4% 0.3% 0.3% 20 Glass Containers 3.4% 6.3% 3.7% 4.0% 21 Other Glass 0.2% 0.2% 0.4% 0.3% 22 Textiles 5.4% 4.5% 2.3% 3.6% 23 Special Wastes 0.4% 0.1% 0.1% 0.2% 24 Electronics 2.0% 1.8% 1.6% 1.7% 25 Household Batteries 0.1% 0.1% 0.1% 0.1% 26 Clean Wood Waste 1.0% 0.2% 3.5% 2.2% 27 Treated Wood Waste 3.5% 0.5% 2.8% 2.6% 28 C&D Debris 2.1% 5.7% 4.2% 3.8% 29 Tires and Rubber 1.2% 0.3% 0.5% 0.7% 30 Yard Waste 21.7% 2.2% 3.3% 8.5% 31 Food Waste 12.2% 16.5% 18.5% 16.3% 32 All Other Garbage 9.5% 14.2% 7.8% 9.4% 33 Liquids 0.6% 1.4% 1.2% 1.0% 34 Grit 0.1% 0.2% 0.6% 0.4% TOTALS 100.0% 100.0% 100.0% 100.0% PERCENTAGE OF WASTE STREAM 29.5% 17.1% 53.4% 100.0% Note: Columns might not appear to add correctly due to rounding. 26 WCS Report Final
43 Section 3: Results and Findings 3.6 Comparison with 2007 Study Results Table 3.7 compares the results of the 2014 WCS with the 2007 study data. This table provides a side-by-side comparison of the two studies for the three main generator types and the aggregate waste composition. The material categories included in the 2014 study were adjusted to break out additional material types with the potential to be recycled or composted; therefore, some materials are combined for comparison purposes. The following changes in waste composition between the two studies are worth noting: The percentage of newspaper has dropped substantially in all sectors. This is expected due to the trend toward electronic news media and the commensurate downsizing of many printed newspapers. It also reflects recycling efforts within the County. Most people recognize newspaper as recyclable; therefore, individuals who participate in recycling likely recycle their newspaper. The percentage of office paper also experienced a substantial decline across all sectors. Again, this is likely due to increased use of electronic communications and information management systems. The percentage of corrugated cardboard increased in all sectors, most notably in the Single- Family Residential sector. This may be due to the trend in online shopping, which results in substantial amounts of cardboard packaging. This material also represents a significant opportunity to increase recycling. Minor changes were seen in the percentages of most plastic categories, with the exception of Other Plastic Containers (#3-#7), which especially increased in the Commercial sector. The trend in product packaging and consumer preferences over the past decade has been toward lighter-weight plastic containers or film packaging; however, this may be offset by the expansion of plastic types (beyond just #1 PET and #2 HDPE bottles) that are now typically accepted for recycling. Consistent with the trend toward plastic packaging is the decline in the percentage of glass containers across all sectors. This may also be a result of increased recycling efforts; some communities added glass to their recycling programs since the last study in The percentage of electronics and special wastes also declined in all sectors, possibly in part due to the County s active Household Electronics and Chemical Collection Center (HEC3) program. The percentage of yard waste increased substantially in both the Single-Family Residential and Multi-Family Residential sectors. Because yard waste may be burned in WTE facilities in Florida, separate collection of this material might not be a priority for some communities. WCS Report Final 27
 Note: Columns might not")
44 Section 3: Results and Findings Table 3.7: Comparison of 2014 and 2007 Waste Composition Results (% by weight) Note: Columns might not appear to total to 100% due to rounding. 28 WCS Report Final
45 Section 3: Results and Findings 3.7 Bulky Waste Table 3.8 presents the results, as a percentage by volume, of the bulky waste visual audit, as well as the 90 percent confidence intervals. Because of the wide variety in the types and quantities of items received as part of this waste stream, the confidence intervals are very wide. Table 3.9 converts these volumetric percentages to percentage by weight based on industry-accepted conversion factors. Individual sample data for the bulky waste sector can be found in Appendix G; photographs of a number of loads are provided in Appendix H. Table 3.8: Composition of Bulky Waste Disposed (% by volume) Material Category Weighted Average (% by volume) Lower Bounds Upper Bounds Corrugated Cardboard 1.6% -2.2% 5.5% Other Paper 1.3% -4.0% 6.6% Other Non-Ferrous 0.8% -1.8% 3.4% Other Ferrous 0.6% -2.1% 3.3% Plastic Film 1.0% -4.4% 6.3% Polystyrene/Insulation 1.4% -4.7% 7.5% Rigid Plastics 11.4% -14.9% 37.7% Other Plastics 0.0% -0.5% 0.6% Yard Waste 19.5% -18.5% 57.4% Treated Wood 14.0% -19.6% 47.5% Untreated Wood 15.5% -14.4% 45.3% Carpet and Padding 0.9% -3.8% 5.6% Drywall 7.3% -14.4% 29.0% Roofing Shingles 0.4% -6.9% 7.6% Rock/Gravel/Grit 6.5% -10.9% 23.9% Tile 0.6% -9.9% 11.0% Concrete 4.2% -23.5% 31.8% Sod 3.6% -33.2% 40.3% Furniture 0.6% -2.0% 3.2% C&D Debris Bagged Waste 0.5% -1.7% 2.7% Glass 0.2% -0.7% 1.0% Textiles 0.1% -0.8% 0.9% Rubber 1.4% -7.4% 10.1% Dirt 0.3% -3.6% 4.1% Porcelain 0.2% -1.5% 1.8% Fiberglass 0.8% -7.4% 9.1% MSW 2.0% -8.6% 12.7% Boats 3.5% -20.9% 28.0% Total 100.0% Note: Columns might not appear to add correctly due to rounding. In addition, the confidence interval is a statistical calculation; therefore, the lower bounds may be a negative number. 29 WCS Report Final
46 Table 3.9: Conversion of Volumetric Percentages to Weight Percentages for Bulky Waste Material Category Weighted Average (% by volume) Estimated Volume (cy) Average Density (lbs/cy) Estimated Weight (lbs) Weighted Average (% by weight) Corrugated Cardboard 1.6% % Other Paper 1.3% , % Other Non-Ferrous 0.8% , % Other Ferrous 0.6% % Plastic Film 1.0% % Polystyrene/Insulation 1.4% % Rigid Plastics 11.4% , % Yard Waste 19.5% , % Treated Wood 14.0% , % Untreated Wood 15.5% , % Carpet and Padding 0.9% % Drywall 7.3% , % Roofing Shingles 0.4% , % Rock/Gravel/Grit 6.5% , % Tile 0.6% , % Concrete 4.2% , % Sod 3.6% , % Furniture 0.6% % C&D Debris Bagged Waste 0.5% % Glass 0.2% % Other Glass 0.0% Textiles 0.1% % Rubber 1.4% , % Dirt 0.3% , % Porcelain 0.2% , % Fiberglass 0.8% % MSW 2.0% , % Boats a 3.5% , % 100.0% 381, % Note: Columns might not appear to add correctly due to rounding. a The density of a boat can vary greatly. The density used is based on the actual weights of boats or boat forms disposed during the week of the visual audit. WCS Report Final 30

 Single-Family Residential Multi-Family Residential All Other Waste, 28.7% Other Compostable Materials, 18.")

47 Section 4 Summary and Diversion Opportunities 4.1 Opportunities to Enhance Materials Recovery The results of this WCS offer insight into the potential for additional waste diversion. Figure 4.1 and Table 4.1 identify the materials found in the processable waste received at Bridgeway Acres, by generator sector and aggregated, that offer the greatest potential for recycling or composting. Figure 4.1: Potentially Recyclable or Compostable Materials (% by weight) Single-Family Residential Multi-Family Residential All Other Waste, 28.7% Other Compostable Materials, 18.4% Recyclable Fiber & Containers, 26.1% Yard Waste, 21.7% Other Recyclables, 5.1% All Other Waste, 34.0% Other Compostable Materials, 22.0% Recyclable Fiber & Containers, 36.9% Other Recyclables, 4.9% Yard Waste 2.2% Commercial Aggregate Waste Stream All Other Waste, 27.9% Recyclable Fiber & Containers, 35.0% All Other Waste, 29.2% Recyclable Fiber & Containers, 32.7% Other Compostable Materials, 29.0% Other Recyclables, 4.8% Yard Waste, 3.3% Other Compostable Materials, 24.7% Other Recyclables, 4.9% Yard Waste, 8.5% 31 WCS Report Final
48 Section 4: Summary and Diversion Opportunities Table 4.1: Potentially Recyclable or Compostable Materials (% by weight) Material Category Single- Family Residential Multi- Family Residential Commercial Aggregate 1 Newspaper 2.0% 3.0% 2.2% 2.3% 2 Corrugated Containers 5.0% 5.9% 10.5% 8.1% 3 Office Paper 0.8% 0.8% 1.1% 1.0% 4 Other Recyclable Paper 9.3% 11.8% 11.3% 10.8% 6 Aseptic Containers 0.3% 0.6% 0.4% 0.4% RECYCLABLE FIBER 17.3% 22.1% 25.5% 22.5% 7 PET Bottles 1.4% 2.4% 1.5% 1.6% 8 HDPE Bottles 0.7% 1.4% 0.8% 0.9% 9 Non-Bottle Plastics #1 and #2 0.8% 1.2% 0.9% 0.9% 10 Other Plastic Containers (#3-#7) 0.8% 1.0% 1.0% 0.9% 15 Tin/Steel Cans 1.0% 1.4% 1.0% 1.1% 18 Aluminum Cans 0.7% 1.1% 0.7% 0.8% 20 Glass Containers 3.4% 6.3% 3.7% 4.0% RECYCLABLE CONTAINERS 8.7% 14.8% 9.5% 10.2% 11 Bulky Rigid Plastics 1.9% 1.7% 1.6% 1.7% 16 White Goods/Small Appliances 0.0% 0.0% 0.0% 0.0% 17 Other Ferrous 0.9% 1.0% 1.3% 1.2% 19 Other Non-Ferrous 0.3% 0.4% 0.3% 0.3% 24 Electronics 2.0% 1.8% 1.6% 1.7% OTHER POTENTIALLY RECYCLABLE MATERIALS 5.1% 4.9% 4.8% 4.9% 5 Low Grade Paper 5.2% 5.2% 6.9% 6.1% 26 Clean Wood Waste 1.0% 0.2% 3.5% 2.2% 30 Yard Waste 21.7% 2.2% 3.3% 8.5% 31 Food Waste 12.2% 16.5% 18.5% 16.3% POTENTIALLY COMPOSTABLE MATERIALS 40.1% 24.2% 32.3% 33.2% 12 Non-Rigid Plastic Film 4.3% 5.1% 6.2% 5.5% 13 Expanded Polystyrene 1.0% 0.8% 1.0% 0.9% 14 All Other Plastics 0.5% 0.9% 0.7% 0.7% 21 Other Glass 0.2% 0.2% 0.3% 0.3% 22 Textiles 5.4% 4.5% 2.3% 3.6% 23 Special Wastes 0.4% 0.1% 0.1% 0.2% 25 Household Batteries 0.1% 0.1% 0.1% 0.1% 27 Treated Wood Waste 3.5% 0.5% 2.8% 2.6% 28 C&D Debris 2.1% 5.7% 4.2% 3.8% 29 Tires and Rubber 1.2% 0.3% 0.5% 0.7% 32 All Other Garbage 9.5% 14.2% 7.8% 9.4% 33 Liquids 0.6% 1.4% 1.2% 1.0% 34 Grit 0.1% 0.2% 0.6% 0.4% ALL OTHER MATERIALS 28.7% 34.0% 27.9% 29.2% TOTALS 100.0% 100.0% 100.0% 100.0% PERCENTAGE OF WASTE STREAM 29.5% 17.1% 53.4% 100.0% 32 WCS Report Final
49 Section 4: Summary and Diversion Opportunities Paper and containers, which are commonly included in recycling programs, comprise nearly 33 percent of the waste disposed in the County, ranging from percent depending on the generator sector. Yard waste makes up 8.5 percent of the waste disposed, with the highest percentage (nearly 22 percent) found in the single-family residential waste stream. Other material types that could potentially be composted (Food Waste, Other Non-Recyclable Paper, and Wood Waste) contribute an additional 25 percent. Recovery of organics other than yard waste is not common in Florida, although programs for source separating organics prior to collection or separating them after collection through mixed waste processing have been implemented in a number of communities in the United States. Provided below are opportunities, based on the study results, to increase the County s materials recovery efforts. These opportunities would need to be balanced with maintaining the operational efficiency and financial viability of the County s WTE facility and other programs; however, such analysis was beyond the scope of this project. Therefore, these opportunities are offered for the County s consideration. Comprehensive and Consistent Curbside Recycling Program: The County s existing open market collection program makes it challenging to implement a comprehensive and consistent curbside recycling program within the unincorporated county. Program consistency within the entire county is further impeded by the existence of 24 municipal entities. While most have curbside recycling programs, they may differ in the types of materials collected and how they are collected. Requiring collection service providers in the unincorporated county to offer a standard level of curbside recycling service, for example through licensing requirements or a service contract, would help alleviate this issue. In addition, working with municipal partners to develop consistent recycling programs (e.g., materials accepted and collection method) would provide a more cohesive effort. Outreach and Education: Consistent curbside recycling programs throughout the County would enable the County and municipalities to jointly launch a cohesive public outreach and education campaign. It would also enable all parties to consistently brand the program to increase public recognition and participation. Multi-Family and Commercial Technical Assistance: Multi-family residences and commercial businesses both offer opportunities for increased materials recovery, but programs to capture recyclables from these generator sectors require a different approach than single-family curbside recycling. Direct technical assistance can help educate owners or operators of multi-family complexes and commercial businesses about the availability of recycling services, how to set up a program, and the benefits to the complex or business. The largest businesses or complexes, or those that generate the greatest quantities of recyclables, should be targeted first. For example, during the sorting events, some loads of commercial waste were found to contain as much as 46 percent recyclable paper (sample 22, City of Dunedin). Yard Waste Collection and Processing: Substantial opportunity exists for diverting additional yard waste from disposal, especially in the single-family residential sector. If the County wishes to divert more yard waste to composting, a lower yard waste tipping fee could provide an incentive for segregating this material or collection service providers could WCS Report Final 33
50 Section 4: Summary and Diversion Opportunities be required to collect segregated yard waste (e.g., through licensing requirements or service contract). Food Waste Diversion: Because of its moisture content, food waste is generally not high in heat content and, therefore, would be a likely candidate to divert from the WTE facility. As demonstrated by the study, supermarket and restaurant waste can consist of approximately 38 percent food waste. To divert this material from the WTE facility, a commercial food waste recovery program and the infrastructure to process this material would need to be developed. Mixed Waste Processing: The opportunities outlined above all involve some form of source separation of materials prior to collection. Another option would be to process, through some form of mixed waste processing facility, the waste received at Bridgeway Acres to recover recyclable materials prior to combustion. The feasibility of this option would need to be further evaluated. 4.2 Opportunities for Bulky Waste Diversion An objective of the WCS was to characterize the bulky waste that is landfilled at Bridgeway Acres in order to determine if any materials could be processed and utilized as fuel in the WTE plant. Table 4.2 provides the heat value, expressed in British Thermal Units (BTUs) per ton, for each material category. As noted below, approximately 30,000 tons of bulky waste was disposed at Bridgeway Acres in fiscal year (FY) This figure was derived by obtaining from County staff the total quantity of waste disposed in South Landfill during that year, and then deleting Special Waste and street sweeping tonnage, the latter of which was estimated by annualizing the amount received during the week of the visual audit. Bulky waste received in FY 2014 a 40,568 tons Less Special Waste b -4,882 tons Less est. street sweepings c (106 tons/week x 52 weeks) -5,500 tons Est. bulky waste received in FY ,186 tons a Class III waste from October 01, 2013 through September 30, 2014 reported by the County included 240-Special Waste, 300-Commercial, and 310-Residential. b Class III 240-Special Waste as reported by the County for FY2014. c Street sweepings identified during the Waste Composition Study, August 25-29, Table 4.2 estimates the potential annual tonnage of each material type by applying the estimated percentage by weight to the 30,000 tons of bulky waste disposed in FY Figure 4.2 depicts both the percentage by volume and by weight of the potentially combustible and non-combustible materials in bulky waste. WCS Report Final 34
51 Section 4: Summary and Diversion Opportunities Table 4.2: Heat Values for Bulky Waste Material Categories Heat Value (million BTU/ton) a Waste Composition (% by weight) Estimated Annual Tonnage Calculated Annual Heat Value (million BTUs) Plastic Film % Rigid Plastics % ,400 Polystyrene/Insulation % Rubber % 1,240 33,400 Corrugated Cardboard % 60 1,000 Carpet and Padding % Textiles % Roofing Shingles % 190 2,300 Treated Wood % 3,760 37,600 Untreated Wood % 4,160 41,600 MSW % 310 3,100 Boats b % 980 8,428 Fiberglass c % Other Paper % 310 2,100 Yard Waste % 3,930 23,600 Other Non-Ferrous % 80 0 Other Ferrous % 60 0 Sod % 1,600 0 Glass % 60 0 Other Glass % 0 0 Dirt % Porcelain % 90 0 Furniture Varies 0.2% 60 Varies C&D Debris Bagged Waste Varies 0.2% 50 Varies Drywall d NA 9.8% 2,950 NA Rock/Gravel/Grit NA 21.9% 6,570 NA Tile NA 1.6% 480 NA Concrete NA 8.0% 2,410 NA TOTALS 100.0% 30, ,014 NA = Not Available a Sources: Energy Information Administration, Methodology for Allocating Municipal Solid Waste to Biogenic and Non-Biogenic Energy, March 2007, pages Nikolas J. Themelis and Charles Mussche, 2014 Energy and Economic Value of Municipal Solid Waste Currently Landfilled in the Fifty States, Earth Engineering Center, Columbia University. b Per M. Davalio, et. al. ("Mechanical Properties of Unsaturated Polyester Resin"), boat composition determined to be unsaturated polyester resin. Per "Developments in the Science and Technology of Composite Materials" (ECCM4), material has estimated heating value of 8.6 BTU/ton. c Category consisted primarily of jet skis and fiberglass molds; therefore, same BTU value as for boats is used estimation purposes. d Drywall, when combusted, produces sulfur dioxide gas, which in high quantities may limit alkaline scrubbers in WTE facilities and reduce their ability to remove other acidic gases. Therefore, for purposes of this analysis, recovery of drywall for incineration is not recommended. WCS Report Final 35
52 Section 4: Summary and Diversion Opportunities Figure 4.2: Potentially Combustible and Non-Combustible Materials in Bulky Waste 25% Non- Combustible Percent by Volume Metals, 1.4% Drywall, 7.3% Other Non- Combustibles, 2.0% Concrete, 4.2% Sod & Dirt, 3.8% Plastics, 13.8% Rubber, 1.4% Paper, 2.9% Rock/Gravel/Grit, 6.5% Other Combustibles, 3.4% Boats & Fiberglass, 4.3% Yard Waste, 19.5% Treated Wood, 14.0% Untreated Wood, 15.5% 75% Potentially Combustible Other Non- Combustibles, 2.5% Metals, 0.5% Drywall, 9.8% Concrete, 8.0% Percent by Weight Plastics, 1.4% Rubber, 4.1% Paper, 1.2% Untreated Wood, 13.9% 49% Potentially Combustible Sod & Dirt, 5.9% 51% Non- Combustible Other Combustibles, 1.8% Rock/Gravel/Grit, 21.9% Yard Waste, 13.1% Treated Wood, 12.5% Boats & Fiberglass, 3.3% 36 WCS Report Final
53 Section 4: Summary and Diversion Opportunities Based on this analysis of bulky waste, observations during the visual audit, and additional research, the following potential diversion opportunities were identified: Potentially combustible materials comprised approximately 49 percent by weight and 75 percent by volume of the loads that were audited. Materials identified as most viable for incineration based on heat value and potential to be size-reduced are Treated and Untreated Wood, Yard Waste, Rubber, and Rigid Plastics. In addition, Other Paper, Corrugated Cardboard, Carpet and Padding, Polystyrene/Insulation, Plastic Film, and Roofing Shingles could be separated for incineration. Fiberglass boats, if reduced in size, also have the potential to be incinerated; however, about 60 percent of the composite waste will remain as ash due to the high percentage of inorganic materials. In addition, the resulting ash may contain pollutants requiring further processing before landfilling. Combustion of fiberglass may also lead to the emission of hazardous flue gasses, in that the small glass fiber spares may cause problems to the dust filter devices. 6 Trials have shown mixing up to 10 percent fiberglass waste with municipal solid waste may be a practical solution to prevent clogging of dust filter devices. 7 The County should further assess their system to ensure the ability to process this material. Yard waste could be diverted for energy conversion, or alternatively composted. Bulky waste also contains a substantial amount of non-combustible materials that could potentially be diverted for beneficial use. o o o o Rock and gravel could potentially be used as construction aggregate. Sod and dirt could potentially be added to compost or used as fill material. Crushed concrete and concrete aggregates could be used for road base, ready mix concrete, asphalt pavements, soil stabilization, pipe bedding, and landscape materials. Drywall, when incinerated, produces sulfur dioxide gas, which in high quantities may limit alkaline scrubbers in incinerators and reduce their ability to remove other acidic gases. 8 However, the County s current WTE facility operator, Covanta, has indicated that small quantities of drywall mixed with other municipal solid waste is acceptable. 9 Alternatively, drywall can be processed to produce new drywall, used as a concrete additive, or used as a composting additive. To our knowledge, no recyclers in Florida are currently accepting post-consumer drywall for recycling. 10 The County could explore the feasibility of incorporating drywall into its 6 Reinforced Plastics.com, 7 European Confederation of Nautical Industries, Nautical Activities: What Impact on the Environment? A Life Cycle Approach for Clear Blue Boating, June 2009 Second Edition. 8 J.W. Mustakas, University of Florida Gypsum Board Waste: An Analysis of Current Trends and a Proposal for Future Diversion (Graduate thesis, University of Florida, 2009), from Joseph Treshler, Senior Vice President, Business Management/Development & Community Affairs, Covanta Energy Corporation, to Kelsi Oswald, Director, Pinellas County Department of Solid Waste, 12 January Personal communication with Gene Jones, CEO of Southern Waste Information exchange, Inc. (SWIX), 14 January WCS Report Final 37
54 Section 4: Summary and Diversion Opportunities o composting operations. The additional gypsum would result in a calcium- and sulfur-rich compost that is beneficial to some crops. 11,12 Ferrous and non-ferrous metals are readily recycled if extracted from other bulky waste. To divert materials for incineration or other beneficial use would require some form of sorting and processing system. For incineration, size-reduction would be needed for larger items so they would meet the four foot limit of the WTE infeed. Provided below is a preliminary discussion of system needs; a more detailed operational and economic analysis would be needed to determine the viability. Designated loader and operator: Some of the material entering the landfill would need little more than a loader and operator to separate materials for incineration. A loader with a grapple bucket could easily pull materials that are less than four feet in size, such as yard waste, wood, carpet, plastics, and paper, from incoming loads and deposit them in a roll-off container for transport to the WTE plant. The operator could also segregate other materials such as concrete, rock, sod and dirt for reuse in other areas of the facility. Mechanical size-reduction: Items larger than four feet in size would need to be mechanically processed before being sent to the WTE plant for energy recovery. Based on visual observation, at least one-third of the materials are greater than four feet by four feet in size. These materials include dimensional lumber, large utility poles and railroad ties, boats and jet skis, sheets of plywood, large stumps and branches, and boats. Commercial equipment is available that is capable of shredding bulky waste such as boats, mattresses, railroad ties, carpet, etc. 13 Due to the capital investment required for a bulky waste processing system, a more detailed financial analysis is warranted to further evaluate the economic and operational feasibility. 4.3 Use of Study Results in State Reporting The results of this study can be utilized by the County when calculating the composition of waste generated within the County for annual state reporting purposes. The WCS results estimate the composition of processable residential and commercial solid waste received at Bridgeway Acres for disposal. The results do not include materials diverted for recycling or composting or bulky or other types of waste received at the County or private facilities for processing or disposal. To determine the composition of waste generated within the entire County, these materials need to be added to the study results. Appendix I provides instructions, as well as a form, for County staff to utilize when determining the composition of all waste generated within the County. KCI will also provide County staff with an electronic version of this form for use when compiling future annual solid waste reports for the State. 11 Construction & Demolition Recycling Association, accessed 15 January Construction & Demolition Recycling Association, accessed 15 January SSI Shredding System, Inc., WCS Report Final 38
55 Appendix A: Waste Characterization Study Material Categories
56 This page intentionally left blank.
57 Appendix A Appendix A: Waste Characterization Study Material Categories # Material Categories Description of Categories 1 Newspaper Newspaper (loose, tied, or shredded) including other paper normally distributed inside newspaper such as ads, flyers, etc. 2 Corrugated Cardboard (OCC) Uncoated brown "cardboard" boxes with a wavy core (no plastic liners, waxy coatings). 3 Office Paper Printed or unprinted paper typically generated in an office environment including white, colored, coated and uncoated papers, and manila and pastel colored file folders. 4 Other Recyclable Paper All magazines, catalogs, paperboard, chipboard, brown paper bags, telephone books, and other printed material on glossy and non-glossy paper. 5 Low Grade Paper All remaining paper not categorized in other paper categories, including waxy cardboard and contaminated paper (i.e., napkins, pizza boxes, paper towels, fast-food wrappers, etc.). 6 Aseptic Containers Gable top milk cartons, juice boxes, and other similar containers. 7 Polyethylene Terephthalate (PET) Bottles (SPI #1) 8 High-density Polyethylene (HDPE) Bottles (SPI #2) Clear and colored bottles or containers coded PET #1 such as soda bottles, water bottles, etc. Clear/natural and pigmented bottles or containers coded HDPE #2 such as milk jugs, detergent bottles, etc. 9 Other Non-Bottle Plastics #1 and #2 Clear and colored plastic items labeled PET #1 such as clamshell containers, frozen food trays, disposable cups, and other items labeled PET #1. Also includes wide-mouthed tubs and containers labeled HDPE #2 including lids. Examples include yogurt cups, margarine tubs, Cool Whip tubs, and other nonbottle HDPE items. 10 Other Recyclable Plastic Containers (SPI #3-#7) Plastic containers coded #3-#7, with the triangle label symbol. 11 Bulky Rigid Plastics Consists of non-container rigid plastic items such as plastic drums, crates, buckets, baskets, toys, refuse totes, lawn furniture, flower pots, laundry baskets, and other large plastic items. Does not include electronic toys. 12 Non-Rigid Plastic Film Grocery bags, garbage bags, plastic sheeting, Saran wrap, visqueen, etc. 13 Expanded Polystyrene Foam (EPS) (Styrofoam ) Disposable coffee cups, coolers, or packaging material, which are typically white and are made of expanded polystyrene beads. Also includes food service trays and egg cartons. 14 All Other Plastics Any plastic materials not categorized above, such as deodorant cases, toothpaste tubes, tooth brushes, broom heads, etc. 15 Tin/Steel Cans Tin-plated steel cans, usually food containers, and aerosol cans. 16 White Goods/Small Appliances Household appliances such as refrigerators, stoves, toasters, vacuums, and salvageable items such as machinery.
58 Appendix A Appendix A: Waste Characterization Study Material Categories (continued) # Material Categories Description of Categories 17 Other Ferrous Steel, clothes hangers, sheet metal products, pipes, miscellaneous metal scraps, and other magnetic metal items. 18 Aluminum Cans Aluminum soft drink, beverage, and some food cans. 19 Other Non-Ferrous Scrap aluminum, aluminum foil, and catering trays, and other non-magnetic metal, copper wiring and tubing, and brass fixtures. 20 Glass Containers Clear, Brown, and Green glass bottles and containers. 21 Other Glass Window panes, mirrors, ceramics, and drinking glasses. 22 Textiles Clothing apparel, rags, leather, blankets, curtains, shoes, wallets, purses, belts, and scrap leather. 23 Special Wastes Cleaners, oil, pool chemicals, fluorescent lights, medical waste, solvents, etc., that are considered household hazardous waste. 24 Electronics (E-waste) Electronic devices such as televisions, computers, cell phones, cordless telephones, PDA, handheld devices, rechargeable batteries, etc. 25 Household Batteries Household batteries including AA, AAA, C, D, 9-volt, and button types. 26 Clean Wood Waste Untreated and unpainted lumber, pallets and dimensional lumber. Also includes untreated/unpainted wood furniture including chairs, cabinets, dressers, etc. 27 Treated Wood Waste Treated and painted lumber, pallets, and dimensional lumber. Also includes treated/painted wood furniture including chairs, cabinets, dressers, etc. 28 C&D Debris Construction and demolition debris that includes concrete, carpet, drywall, insulation, and roofing materials. 29 Tires and Rubber Small and large tires and other items made of rubber. 30 Yard Waste Shrub and brush prunings, household bedding plants, weeds, leaves, grass clippings, and other landscaping and gardening wastes. 31 Food Waste Meat and vegetable waste (includes coffee grinds and tea bags). 32 All Other Garbage All other wastes not included in the above categories, including diapers and products that are composite of materials such as frozen juice cans, binders, Pringle s can, chip bags, etc. 33 Liquids All liquids found in containers will be emptied here. 34 Grit Indistinguishable items less than 1-inch in diameter.
59 Appendix B: Visual Audit Form
60 This page intentionally left blank.
61 Appendix B Appendix B

62 Appendix B
63 Appendix C: Single-Family Residential Sample Results
64 This page intentionally left blank.
65 Appendix C Appendix C: Single-Family Residential Sample Results (% by weight) Hauler/Location Belleair Beach Waste Mgmt Material Categories sample # Newspaper 0.3% 2.2% 0.7% 4.7% 2.7% 0.2% 2 Corrugated Cardboard 7.2% 9.1% 5.4% 3.6% 3.7% 2.6% 3 Office Paper 0.0% 0.6% 1.0% 0.1% 2.6% 0.1% 4 Other Recyclable Paper 12.3% 8.2% 6.7% 9.5% 7.6% 10.7% 5 Low Grade Paper 5.3% 3.5% 5.0% 2.6% 6.7% 9.2% 6 Aseptic Containers 0.0% 0.1% 0.1% 0.1% 0.1% 0.1% 7 PET Bottles 0.7% 2.7% 1.0% 1.0% 0.5% 1.8% 8 HDPE Bottles 0.1% 0.8% 0.2% 0.7% 0.8% 0.2% 9 Other Non-Bottle Plastics #1 and #2 0.6% 1.0% 0.3% 0.2% 0.7% 1.2% 10 Other Plastic Containers (#3-#7) 0.3% 0.6% 1.9% 0.4% 0.2% 1.7% 11 Bulky Rigid Plastics 6.8% 1.5% 3.6% 2.8% 1.4% 1.1% 12 Non-Rigid Plastic Film 3.0% 5.6% 7.0% 4.6% 4.6% 5.3% 13 Expanded Polystyrene 0.4% 2.5% 1.0% 0.4% 0.2% 1.9% 14 All Other Plastics 0.3% 0.7% 0.7% 1.1% 2.1% 0.6% 15 Tin/Steel Cans 0.8% 1.3% 0.5% 0.6% 0.9% 0.8% 16 White Goods/Small Appliances 0.0% 0.0% 0.0% 0.0% 0.0% 0.0% 17 Other Ferrous 0.2% 0.7% 0.5% 0.4% 1.6% 0.9% 18 Aluminum Cans 0.3% 0.8% 0.6% 0.5% 0.5% 0.4% 19 Other Non-Ferrous 0.3% 0.4% 0.2% 0.2% 0.2% 1.6% 20 Glass Containers 1.5% 3.0% 0.4% 3.5% 1.8% 3.8% 21 Other Glass 0.3% 0.0% 0.1% 0.0% 0.0% 0.0% 22 Textiles 0.6% 4.8% 5.7% 2.8% 4.5% 1.2% 23 Special Wastes 0.0% 0.1% 0.3% 0.0% 0.0% 0.0% 24 Electronics 0.0% 2.2% 0.8% 0.6% 0.7% 0.1% 25 Household Batteries 0.1% 0.1% 0.0% 0.0% 0.1% 0.3% 26 Clean Wood Waste 0.0% 3.7% 0.8% 0.6% 2.9% 0.1% 27 Treated Wood Waste 3.5% 10.6% 0.9% 1.1% 5.3% 0.0% 28 C&D Debris 0.7% 0.2% 1.7% 8.5% 0.7% 0.4% 29 Tires and Rubber 1.0% 0.0% 2.6% 0.1% 0.2% 0.0% 30 Yard Waste 38.5% 2.6% 30.1% 26.8% 33.5% 5.7% 31 Food Waste 5.5% 18.3% 12.0% 7.4% 8.7% 30.3% 32 All Other Garbage 9.0% 8.3% 7.6% 14.8% 3.9% 16.1% 33 Liquids 0.3% 1.9% 0.7% 0.4% 0.3% 1.8% 34 Grit 0.0% 2.1% 0.0% 0.0% 0.0% 0.0% Dunedin TOTALS 100.0% 100.0% 100.0% 100.0% 100.0% 100.0% Unincorp Clearwater Clearwater
66 Appendix C Appendix C: Single-Family Residential Sample Results (continued) Hauler/Location Clearwater Waste Mgmt Material Categories sample # Newspaper 0.5% 1.3% 2.4% 1.6% 1.5% 1.4% 2 Corrugated Cardboard 2.4% 5.1% 28.8% 2.2% 0.2% 4.0% 3 Office Paper 1.7% 0.1% 1.6% 1.6% 0.0% 0.1% 4 Other Recyclable Paper 18.2% 15.5% 8.2% 10.7% 7.4% 9.6% 5 Low Grade Paper 4.6% 4.8% 3.0% 11.1% 7.8% 4.1% 6 Aseptic Containers 0.2% 0.8% 0.3% 0.3% 0.3% 0.2% 7 PET Bottles 1.2% 1.6% 0.1% 1.8% 1.7% 1.0% 8 HDPE Bottles 0.5% 0.7% 0.2% 1.1% 1.0% 0.3% 9 Other Non-Bottle Plastics #1 and #2 0.3% 0.6% 0.3% 1.8% 1.1% 1.2% 10 Other Plastic Containers (#3-#7) 1.7% 0.8% 0.3% 1.4% 1.1% 0.8% 11 Bulky Rigid Plastics 1.6% 1.7% 1.6% 1.2% 0.5% 0.8% 12 Non-Rigid Plastic Film 4.1% 4.1% 3.8% 4.9% 4.9% 3.1% 13 Expanded Polystyrene 0.4% 0.6% 0.1% 0.7% 0.5% 0.2% 14 All Other Plastics 0.2% 0.4% 0.7% 0.5% 0.8% 0.5% 15 Tin/Steel Cans 0.8% 1.5% 0.3% 1.0% 1.1% 1.0% 16 White Goods/Small Appliances 0.0% 0.0% 0.0% 0.0% 0.0% 0.0% 17 Other Ferrous 0.0% 0.2% 0.2% 0.5% 0.1% 0.0% 18 Aluminum Cans 1.1% 0.6% 0.1% 1.7% 1.3% 0.9% 19 Other Non-Ferrous 0.1% 0.3% 0.2% 0.2% 0.3% 0.1% 20 Glass Containers 1.5% 3.8% 3.7% 5.0% 4.6% 7.5% 21 Other Glass 0.0% 0.0% 0.0% 0.7% 0.1% 0.0% 22 Textiles 17.9% 15.1% 1.8% 3.6% 2.6% 5.9% 23 Special Wastes 0.0% 0.0% 0.0% 7.7% 0.2% 0.2% 24 Electronics 7.9% 0.2% 2.2% 3.0% 1.1% 0.4% 25 Household Batteries 0.0% 0.1% 0.1% 0.1% 0.1% 0.0% 26 Clean Wood Waste 0.0% 2.3% 0.0% 0.0% 0.0% 0.0% 27 Treated Wood Waste 0.0% 5.2% 0.0% 1.9% 28.3% 0.1% 28 C&D Debris 0.1% 2.5% 1.2% 0.0% 0.0% 0.2% 29 Tires and Rubber 0.0% 0.1% 0.0% 0.2% 0.1% 1.0% 30 Yard Waste 8.0% 11.4% 19.9% 9.2% 9.9% 27.6% 31 Food Waste 11.8% 9.8% 7.7% 14.3% 13.6% 12.7% 32 All Other Garbage 12.6% 8.2% 10.9% 9.2% 6.9% 14.8% 33 Liquids 0.6% 0.4% 0.0% 0.9% 0.8% 0.3% 34 Grit 0.0% 0.0% 0.0% 0.0% 0.0% 0.0% Unincorp TOTALS 100.0% 100.0% 100.0% 100.0% 100.0% Unincorp Unincorp Gulfport
67 Appendix C Appendix C: Single-Family Residential Sample Results (continued) Hauler/Location St. Petersburg St. Petersburg Seminole St. Petersburg St. Petersburg Material Categories sample # Newspaper 4.6% 1.6% 3.6% 1.7% 0.6% 2.8% 2 Corrugated Cardboard 0.2% 6.3% 1.6% 2.3% 8.1% 1.0% 3 Office Paper 0.1% 0.0% 0.0% 3.5% 0.1% 0.0% 4 Other Recyclable Paper 6.0% 4.3% 7.2% 12.1% 6.4% 7.2% 5 Low Grade Paper 4.2% 2.5% 7.0% 2.6% 2.4% 4.1% 6 Aseptic Containers 0.2% 0.0% 0.2% 0.1% 0.0% 0.0% 7 PET Bottles 0.5% 0.7% 0.8% 1.1% 2.3% 1.4% 8 HDPE Bottles 0.5% 0.4% 0.2% 0.8% 1.9% 0.5% 9 Other Non-Bottle Plastics #1 and #2 0.7% 0.8% 0.7% 0.4% 0.5% 0.8% 10 Other Plastic Containers (#3-#7) 0.2% 0.3% 0.7% 0.6% 0.9% 0.8% 11 Bulky Rigid Plastics 0.6% 2.7% 1.3% 0.8% 1.1% 1.1% 12 Non-Rigid Plastic Film 2.6% 2.6% 2.4% 2.9% 3.5% 3.2% 13 Expanded Polystyrene 0.6% 0.5% 0.5% 0.4% 1.3% 0.4% 14 All Other Plastics 0.1% 0.2% 0.2% 0.5% 0.2% 0.4% 15 Tin/Steel Cans 0.9% 0.8% 0.6% 1.1% 1.5% 1.1% 16 White Goods/Small Appliances 0.0% 0.0% 0.0% 0.0% 0.0% 0.0% 17 Other Ferrous 0.1% 3.6% 0.8% 2.2% 2.4% 3.2% 18 Aluminum Cans 0.6% 0.8% 0.4% 0.6% 0.5% 1.0% 19 Other Non-Ferrous 0.3% 0.2% 0.0% 0.1% 0.4% 0.1% 20 Glass Containers 3.6% 0.3% 6.8% 1.2% 2.9% 5.3% 21 Other Glass 0.0% 0.1% 0.2% 0.0% 0.0% 0.4% 22 Textiles 0.2% 0.8% 0.7% 3.4% 13.6% 13.6% 23 Special Wastes 0.0% 0.0% 0.0% 0.1% 0.1% 0.2% 24 Electronics 0.1% 0.0% 0.0% 2.7% 0.1% 9.3% 25 Household Batteries 0.0% 0.0% 0.0% 0.0% 0.0% 0.2% 26 Clean Wood Waste 0.0% 0.0% 0.0% 1.5% 3.8% 0.1% 27 Treated Wood Waste 0.1% 0.8% 1.9% 0.3% 8.5% 0.8% 28 C&D Debris 15.2% 7.0% 2.4% 0.8% 0.3% 0.7% 29 Tires and Rubber 0.0% 0.0% 0.5% 0.0% 0.9% 21.3% 30 Yard Waste 41.8% 48.5% 25.4% 42.3% 15.5% 7.5% 31 Food Waste 8.9% 9.2% 13.7% 8.2% 9.4% 11.0% 32 All Other Garbage 6.6% 4.7% 19.9% 5.6% 10.6% 0.5% 33 Liquids 0.5% 0.4% 0.2% 0.2% 0.4% 0.0% 34 Grit 0.0% 0.0% 0.0% 0.0% 0.0% 0.0% TOTALS 100.0% 100.0% 100.0% 100.0% 100.0% 100.0% Unincorp
68 Appendix C Appendix C: Single-Family Residential Sample Results (continued) Hauler/Location Republic Unincorp St. Petersburg St. Petersburg Material Categories sample # Unincorp St. Pete Beach 1 Newspaper 2.4% 1.3% 3.6% 1.1% 2.7% 3.4% 2 Corrugated Cardboard 2.3% 2.6% 3.8% 5.0% 7.9% 6.1% 3 Office Paper 4.6% 0.1% 0.9% 0.4% 0.2% 0.0% 4 Other Recyclable Paper 12.9% 12.4% 7.0% 4.4% 9.9% 8.8% 5 Low Grade Paper 9.1% 4.6% 7.1% 2.5% 4.5% 6.4% 6 Aseptic Containers 1.6% 0.3% 0.3% 0.1% 0.2% 0.5% 7 PET Bottles 2.3% 1.1% 3.5% 1.4% 1.4% 1.6% 8 HDPE Bottles 2.2% 0.9% 1.0% 1.0% 0.2% 0.5% 9 Other Non-Bottle Plastics #1 and #2 1.0% 1.2% 1.0% 0.4% 0.9% 0.6% 10 Other Plastic Containers (#3-#7) 1.1% 0.8% 0.7% 0.4% 0.8% 1.1% 11 Bulky Rigid Plastics 3.3% 1.8% 1.4% 2.9% 0.7% 2.2% 12 Non-Rigid Plastic Film 7.8% 4.9% 4.6% 3.2% 3.7% 5.0% 13 Expanded Polystyrene 0.3% 6.6% 1.0% 0.8% 1.2% 0.6% 14 All Other Plastics 0.4% 0.2% 0.2% 0.1% 0.2% 0.2% 15 Tin/Steel Cans 0.8% 1.5% 0.6% 1.7% 1.0% 1.2% 16 White Goods/Small Appliances 0.0% 0.0% 0.0% 0.0% 0.0% 0.0% 17 Other Ferrous 1.6% 0.0% 0.9% 2.1% 0.0% 0.8% 18 Aluminum Cans 0.3% 1.5% 1.3% 0.8% 0.4% 0.4% 19 Other Non-Ferrous 0.6% 0.4% 0.3% 0.3% 0.3% 0.7% 20 Glass Containers 1.8% 4.4% 4.9% 5.3% 5.1% 2.6% 21 Other Glass 0.8% 0.3% 0.0% 0.1% 0.0% 0.0% 22 Textiles 2.8% 4.8% 9.2% 9.3% 0.6% 2.5% 23 Special Wastes 0.0% 0.0% 0.1% 0.0% 0.2% 0.2% 24 Electronics 6.3% 0.7% 4.1% 0.2% 0.0% 1.6% 25 Household Batteries 0.1% 0.1% 0.1% 0.0% 0.2% 0.1% 26 Clean Wood Waste 0.1% 0.0% 0.3% 6.3% 0.2% 0.0% 27 Treated Wood Waste 3.0% 0.0% 2.9% 0.7% 0.0% 2.9% 28 C&D Debris 0.0% 0.3% 1.0% 3.3% 0.0% 1.1% 29 Tires and Rubber 0.2% 0.0% 0.2% 0.2% 0.1% 0.1% 30 Yard Waste 8.0% 19.0% 6.0% 34.1% 30.4% 27.7% 31 Food Waste 12.1% 18.9% 23.1% 4.0% 11.3% 10.4% 32 All Other Garbage 9.3% 8.7% 8.2% 7.6% 15.7% 10.3% 33 Liquids 1.0% 0.7% 0.8% 0.5% 0.0% 0.4% 34 Grit 0.0% 0.0% 0.0% 0.0% 0.0% 0.0% TOTALS 100.0% 100.0% 100.0% 100.0% 100.0% 100.0%
69 Appendix C Appendix C: Single-Family Residential Sample Results (continued) Hauler/Location Material Categories sample # Average Weighted Avg 1 Newspaper 1.9% 2.0% 2 Corrugated Cardboard 2.9% 5.0% 3 Office Paper 0.2% 0.8% 4 Other Recyclable Paper 8.9% 9.3% 5 Low Grade Paper 5.1% 5.2% 6 Aseptic Containers 0.2% 0.3% 7 PET Bottles 1.0% 1.4% 8 HDPE Bottles 0.6% 0.7% 9 Other Non-Bottle Plastics #1 and #2 0.8% 0.8% 10 Other Plastic Containers (#3-#7) 0.6% 0.8% 11 Bulky Rigid Plastics 2.3% 1.9% 12 Non-Rigid Plastic Film 3.8% 4.3% 13 Expanded Polystyrene 0.8% 1.0% 14 All Other Plastics 0.4% 0.5% 15 Tin/Steel Cans 1.1% 1.0% 16 White Goods/Small Appliances 0.0% 0.0% 17 Other Ferrous 0.4% 0.9% 18 Aluminum Cans 0.8% 0.7% 19 Other Non-Ferrous 0.2% 0.3% 20 Glass Containers 2.0% 3.4% 21 Other Glass 1.0% 0.2% 22 Textiles 7.6% 5.4% 23 Special Wastes 0.1% 0.4% 24 Electronics 2.9% 2.0% 25 Household Batteries 0.1% 0.1% 26 Clean Wood Waste 1.2% 1.0% 27 Treated Wood Waste 0.4% 3.5% 28 C&D Debris 3.8% 2.1% 29 Tires and Rubber 0.8% 1.2% 30 Yard Waste 25.9% 21.7% 31 Food Waste 9.9% 12.2% 32 All Other Garbage 11.9% 9.5% 33 Liquids 0.6% 0.6% 34 Grit 0.0% 0.1% TOTALS 100.0% 100.0% LARGO
70 Appendix C This page intentionally left blank.
71 Appendix D: Multi-Family Residential Sample Results
72 This page intentionally left blank.
73 Appendix D Appendix D: Multi-Family Residential Sample Results (% by weight) Sawgrass Apts Hauler/Location Material Categories sample # Newspaper 2.7% 3.4% 3.5% 6.3% 9.9% 1.6% 2 Corrugated Cardboard 4.1% 3.1% 12.8% 9.3% 3.7% 5.7% 3 Office Paper 0.9% 3.3% 1.7% 0.9% 1.1% 1.0% 4 Other Recyclable Paper 14.8% 10.4% 6.9% 6.1% 11.4% 14.8% 5 Low Grade Paper 7.4% 8.5% 12.2% 4.6% 6.5% 4.6% 6 Aseptic Containers 0.2% 0.3% 0.5% 0.3% 0.3% 1.4% 7 PET Bottles 2.4% 1.3% 2.3% 2.5% 2.2% 2.6% 8 HDPE Bottles 1.0% 1.7% 1.4% 0.8% 0.7% 3.4% 9 Other Non-Bottle Plastics #1 and #2 0.6% 0.9% 0.7% 0.6% 0.6% 1.6% 10 Other Plastic Containers (#3-#7) 1.0% 1.4% 1.1% 0.4% 1.3% 1.0% 11 Bulky Rigid Plastics 2.2% 0.7% 1.0% 0.7% 1.2% 2.4% 12 Non-Rigid Plastic Film 3.3% 7.0% 4.9% 4.6% 3.9% 6.4% 13 Expanded Polystyrene 0.5% 0.9% 0.6% 0.7% 0.5% 0.7% 14 All Other Plastics 1.1% 0.7% 0.4% 0.5% 0.2% 4.0% 15 Tin/Steel Cans 0.8% 1.6% 1.0% 2.3% 0.7% 2.2% 16 White Goods/Small Appliances 0.0% 0.0% 0.0% 0.0% 0.0% 0.0% 17 Other Ferrous 1.3% 0.5% 0.9% 0.0% 0.3% 0.1% 18 Aluminum Cans 0.4% 1.3% 1.3% 0.7% 1.0% 0.6% 19 Other Non-Ferrous 0.3% 0.4% 0.7% 0.3% 0.1% 0.4% 20 Glass Containers 5.1% 5.7% 6.8% 5.8% 4.4% 4.9% 21 Other Glass 0.5% 0.0% 0.0% 0.0% 0.0% 0.0% 22 Textiles 0.3% 6.3% 2.8% 4.3% 2.4% 1.6% 23 Special Wastes 0.0% 0.7% 0.0% 0.0% 0.0% 0.1% 24 Electronics 3.4% 0.3% 9.9% 0.0% 0.5% 0.0% 25 Household Batteries 0.0% 0.1% 0.0% 0.1% 0.0% 0.0% 26 Clean Wood Waste 0.0% 1.2% 1.5% 0.0% 0.0% 0.1% 27 Treated Wood Waste 0.0% 0.0% 0.0% 0.0% 0.4% 0.0% 28 C&D Debris 0.0% 0.0% 0.0% 0.0% 21.8% 0.0% 29 Tires and Rubber 0.2% 0.2% 0.0% 0.0% 0.2% 0.1% 30 Yard Waste 0.0% 4.6% 0.0% 0.0% 0.0% 0.0% 31 Food Waste 27.8% 22.8% 16.5% 22.0% 9.0% 19.9% 32 All Other Garbage 16.3% 8.0% 6.4% 25.2% 14.3% 17.2% 33 Liquids 1.6% 0.6% 2.1% 1.2% 1.4% 1.5% 34 Grit 0.0% 2.3% 0.0% 0.0% 0.0% 0.0% Largo Largo TOTALS 100.0% 100.0% 100.0% 100.0% 100.0% 100.0% Harbor Cay Progressive Republic
74 Appendix D Appendix D: Multi-Family Residential Sample Results (continued) Republic Hauler/Location Material Categories sample # Dunedin Waste Mgmt Waste Mgmt St. Petersburg St. Petersburg 1 Newspaper 0.7% 1.1% 2.5% 1.6% 1.4% 0.2% 2 Corrugated Cardboard 4.8% 3.2% 4.7% 7.0% 16.9% 3.6% 3 Office Paper 0.8% 0.1% 0.0% 0.1% 1.6% 0.1% 4 Other Recyclable Paper 11.9% 10.6% 9.7% 15.1% 16.3% 13.6% 5 Low Grade Paper 4.9% 2.7% 5.7% 1.4% 3.0% 4.4% 6 Aseptic Containers 0.5% 0.7% 2.2% 0.5% 0.1% 0.5% 7 PET Bottles 3.0% 2.4% 3.1% 3.0% 2.2% 1.6% 8 HDPE Bottles 1.2% 0.9% 2.3% 1.3% 2.7% 0.3% 9 Other Non-Bottle Plastics #1 and #2 1.5% 1.0% 2.8% 1.0% 1.1% 1.6% 10 Other Plastic Containers (#3-#7) 0.7% 0.6% 1.4% 1.2% 1.5% 0.7% 11 Bulky Rigid Plastics 1.3% 1.4% 2.5% 5.5% 1.6% 0.2% 12 Non-Rigid Plastic Film 4.4% 5.9% 8.0% 5.5% 5.7% 3.6% 13 Expanded Polystyrene 1.0% 0.3% 1.9% 1.0% 0.9% 0.5% 14 All Other Plastics 0.7% 0.8% 2.2% 0.7% 0.2% 0.3% 15 Tin/Steel Cans 2.1% 0.7% 2.7% 1.2% 0.9% 0.3% 16 White Goods/Small Appliances 0.0% 0.0% 0.0% 0.0% 0.0% 0.0% 17 Other Ferrous 1.0% 0.2% 2.7% 0.7% 0.8% 2.2% 18 Aluminum Cans 0.5% 0.6% 2.9% 1.5% 0.3% 1.5% 19 Other Non-Ferrous 0.2% 0.3% 1.5% 0.2% 0.2% 0.1% 20 Glass Containers 6.7% 4.3% 7.1% 4.7% 1.5% 20.1% 21 Other Glass 0.0% 0.0% 0.0% 0.7% 0.0% 0.0% 22 Textiles 3.3% 5.6% 2.8% 11.1% 2.1% 3.0% 23 Special Wastes 0.0% 0.0% 0.0% 0.3% 0.0% 0.1% 24 Electronics 1.1% 0.4% 4.5% 0.9% 1.7% 0.2% 25 Household Batteries 0.0% 0.1% 0.0% 0.1% 0.0% 0.2% 26 Clean Wood Waste 0.0% 0.0% 0.0% 0.0% 0.0% 0.3% 27 Treated Wood Waste 0.1% 0.3% 2.1% 2.3% 0.0% 0.3% 28 C&D Debris 0.4% 12.6% 0.0% 1.8% 16.0% 0.0% 29 Tires and Rubber 0.2% 0.1% 2.0% 0.2% 0.2% 0.0% 30 Yard Waste 5.3% 3.3% 1.9% 4.4% 0.0% 5.2% 31 Food Waste 18.1% 15.0% 9.2% 12.9% 9.8% 20.7% 32 All Other Garbage 22.5% 24.2% 9.3% 10.6% 10.2% 11.5% 33 Liquids 1.0% 0.6% 2.1% 1.3% 1.2% 3.0% 34 Grit 0.0% 0.0% 0.4% 0.0% 0.0% 0.0% TOTALS 100.0% 100.0% 100.0% 100.0% 100.0% 100.0%
75 Appendix D Appendix D: Multi-Family Residential Sample Results (continued) St. Petersburg St. Petersburg Hauler/Location Material Categories sample # Weighted Avg 1 Newspaper 4.0% 2.5% 3.0% 2 Corrugated Cardboard 0.8% 3.2% 5.9% 3 Office Paper 0.0% 0.0% 0.8% 4 Other Recyclable Paper 11.4% 13.1% 11.8% 5 Low Grade Paper 3.4% 4.2% 5.2% 6 Aseptic Containers 0.7% 0.2% 0.6% 7 PET Bottles 2.9% 1.6% 2.4% 8 HDPE Bottles 1.6% 0.5% 1.4% 9 Other Non-Bottle Plastics #1 and #2 1.8% 1.4% 1.2% 10 Other Plastic Containers (#3-#7) 1.0% 1.0% 1.0% 11 Bulky Rigid Plastics 0.8% 2.7% 1.7% 12 Non-Rigid Plastic Film 4.3% 2.8% 5.1% 13 Expanded Polystyrene 1.1% 0.3% 0.8% 14 All Other Plastics 0.1% 0.4% 0.9% 15 Tin/Steel Cans 1.5% 0.6% 1.4% 16 White Goods/Small Appliances 0.0% 0.0% 0.0% 17 Other Ferrous 0.1% 2.4% 1.0% 18 Aluminum Cans 1.3% 0.6% 1.1% 19 Other Non-Ferrous 0.3% 0.9% 0.4% 20 Glass Containers 7.2% 3.6% 6.3% 21 Other Glass 0.0% 1.2% 0.2% 22 Textiles 3.3% 13.3% 4.5% 23 Special Wastes 0.1% 0.3% 0.1% 24 Electronics 1.0% 2.3% 1.8% 25 Household Batteries 0.0% 1.5% 0.1% 26 Clean Wood Waste 0.0% 0.2% 0.2% 27 Treated Wood Waste 0.0% 1.8% 0.5% 28 C&D Debris 9.0% 19.3% 5.7% 29 Tires and Rubber 0.2% 0.0% 0.3% 30 Yard Waste 1.6% 3.3% 2.2% 31 Food Waste 20.1% 10.4% 16.5% 32 All Other Garbage 20.3% 3.3% 14.2% 33 Liquids 0.3% 1.0% 1.4% 34 Grit 0.0% 0.0% 0.2% TOTALS 100.0% 100.0% 100.0%
76 Appendix D This page intentionally left blank.
77 Appendix E: Commercial Sample Results
78 This page intentionally left blank.
79 Appendix E Appendix E: Commercial Sample Results (% by weight) Hauler/Location Waste Mgmt Material Categories sample # Newspaper 0.6% 2.1% 3.4% 0.3% 3.9% 6.0% 3.5% 2 Corrugated Cardboard 8.9% 10.1% 4.0% 16.0% 27.8% 6.5% 24.8% 3 Office Paper 0.4% 0.7% 1.0% 0.2% 1.4% 0.8% 1.1% 4 Other Recyclable Paper 6.7% 6.7% 15.8% 9.4% 7.2% 7.8% 7.5% 5 Low Grade Paper 1.3% 4.3% 5.3% 5.6% 16.1% 10.2% 3.5% 6 Aseptic Containers 0.1% 0.1% 0.1% 0.3% 0.0% 0.6% 0.2% 7 PET Bottles 0.4% 1.4% 0.9% 3.0% 0.9% 2.1% 0.4% 8 HDPE Bottles 0.1% 1.3% 1.0% 0.2% 0.9% 1.5% 0.9% 9 Other Non-Bottle Plastics #1 and #2 0.1% 0.7% 1.7% 1.7% 0.4% 1.1% 0.3% 10 Other Plastic Containers (#3-#7) 0.4% 0.6% 1.3% 0.7% 1.1% 1.8% 0.5% 11 Bulky Rigid Plastics 2.7% 0.4% 1.9% 0.3% 1.2% 2.3% 2.7% 12 Non-Rigid Plastic Film 2.4% 13.8% 4.8% 11.0% 5.5% 8.4% 2.4% 13 Expanded Polystyrene 0.1% 0.9% 0.8% 1.0% 0.7% 0.8% 1.5% 14 All Other Plastics 0.2% 0.5% 0.7% 2.1% 1.3% 1.0% 0.2% 15 Tin/Steel Cans 0.2% 0.5% 0.9% 1.2% 1.2% 1.7% 0.3% 16 White Goods/Small Appliances 0.0% 0.0% 0.0% 0.0% 0.0% 0.7% 0.0% 17 Other Ferrous 2.8% 1.6% 0.8% 2.4% 1.7% 0.5% 0.4% 18 Aluminum Cans 0.1% 0.7% 0.7% 1.9% 0.9% 0.9% 0.5% 19 Other Non-Ferrous 0.0% 0.4% 0.3% 0.6% 0.3% 0.5% 0.0% 20 Glass Containers 0.6% 16.8% 1.8% 0.3% 2.5% 8.9% 1.1% 21 Other Glass 0.0% 0.1% 0.8% 1.5% 0.0% 0.0% 0.0% 22 Textiles 1.5% 2.8% 6.6% 4.0% 0.6% 4.0% 0.3% 23 Special Wastes 0.0% 0.0% 0.1% 0.0% 0.0% 0.0% 0.0% 24 Electronics 0.0% 0.0% 1.5% 1.1% 4.0% 0.0% 6.7% 25 Household Batteries 0.0% 0.1% 0.6% 0.1% 0.0% 0.0% 0.0% 26 Clean Wood Waste 24.5% 1.1% 1.0% 1.9% 0.0% 0.6% 6.9% 27 Treated Wood Waste 34.9% 1.9% 0.0% 0.0% 0.0% 1.5% 2.2% 28 C&D Debris 5.9% 4.4% 9.9% 1.7% 2.6% 1.4% 24.1% 29 Tires and Rubber 0.0% 0.0% 0.3% 0.5% 1.7% 0.3% 0.4% 30 Yard Waste 0.0% 0.0% 9.0% 1.2% 0.0% 6.6% 0.0% 31 Food Waste 0.4% 15.5% 16.1% 9.2% 11.5% 17.5% 4.4% 32 All Other Garbage 0.8% 5.1% 5.5% 12.0% 3.2% 2.9% 2.8% 33 Liquids 0.3% 1.4% 0.3% 8.8% 1.4% 0.2% 0.2% 34 Grit 3.6% 4.0% 1.0% 0.0% 0.0% 1.0% 0.0% Largo Largo TOTALS 100.0% 100.0% 100.0% 100.0% 100.0% 100.0% 100.0% Dunedin Largo Unincorp Clearwater
80 Appendix E Appendix E: Commercial Sample Results (continued) Hauler/Location Clearwater Largo Largo Waste Mgmt County Sanitation Safety Harbor Material Categories sample # Newspaper 3.2% 2.8% 2.8% 3.3% 1.2% 0.6% 0.6% 2 Corrugated Cardboard 8.5% 11.7% 16.3% 8.0% 7.1% 0.4% 9.7% 3 Office Paper 2.9% 2.5% 0.6% 1.8% 0.7% 0.7% 0.3% 4 Other Recyclable Paper 13.6% 7.2% 9.6% 16.3% 2.4% 9.1% 35.9% 5 Low Grade Paper 8.9% 8.2% 6.3% 6.7% 3.3% 12.8% 6.5% 6 Aseptic Containers 0.5% 0.0% 0.0% 0.2% 0.3% 0.0% 0.9% 7 PET Bottles 2.8% 1.2% 2.8% 1.5% 1.1% 0.5% 0.9% 8 HDPE Bottles 1.9% 0.5% 1.3% 0.7% 0.6% 0.2% 0.6% 9 Other Non-Bottle Plastics #1 and #2 1.2% 0.6% 0.9% 0.8% 0.4% 0.8% 0.7% 10 Other Plastic Containers (#3-#7) 0.6% 0.9% 0.6% 0.6% 0.9% 0.6% 1.2% 11 Bulky Rigid Plastics 0.0% 1.6% 0.0% 4.3% 1.6% 1.0% 1.5% 12 Non-Rigid Plastic Film 13.7% 3.7% 5.3% 3.7% 5.3% 4.2% 3.3% 13 Expanded Polystyrene 0.7% 0.6% 0.9% 0.5% 1.0% 0.4% 0.5% 14 All Other Plastics 1.1% 0.6% 3.9% 2.1% 0.7% 0.3% 0.9% 15 Tin/Steel Cans 2.7% 0.4% 1.5% 0.6% 0.8% 0.0% 0.2% 16 White Goods/Small Appliances 0.0% 0.0% 0.0% 0.0% 0.0% 0.0% 0.0% 17 Other Ferrous 0.0% 0.2% 13.0% 1.0% 2.0% 0.0% 1.6% 18 Aluminum Cans 0.7% 0.2% 0.6% 0.4% 1.2% 1.3% 0.3% 19 Other Non-Ferrous 0.4% 0.1% 0.2% 0.1% 0.4% 0.3% 0.0% 20 Glass Containers 3.4% 1.6% 1.1% 7.5% 1.4% 0.0% 3.9% 21 Other Glass 0.1% 0.0% 0.7% 0.2% 0.1% 0.0% 0.0% 22 Textiles 9.1% 1.0% 5.7% 5.2% 1.6% 0.0% 1.4% 23 Special Wastes 0.2% 2.3% 0.1% 0.0% 0.2% 0.0% 0.0% 24 Electronics 1.2% 0.0% 0.4% 1.0% 3.1% 9.3% 0.0% 25 Household Batteries 0.1% 0.0% 0.5% 0.0% 0.3% 0.0% 0.0% 26 Clean Wood Waste 0.2% 28.3% 0.0% 0.5% 4.6% 0.0% 0.0% 27 Treated Wood Waste 0.0% 0.0% 0.4% 0.1% 8.2% 0.9% 0.0% 28 C&D Debris 1.1% 1.4% 0.0% 6.2% 13.6% 26.4% 0.7% 29 Tires and Rubber 0.1% 0.3% 0.0% 0.1% 1.5% 0.6% 0.1% 30 Yard Waste 8.9% 9.4% 0.0% 0.5% 19.1% 0.0% 0.6% 31 Food Waste 11.0% 4.6% 12.8% 13.9% 9.5% 24.6% 21.4% 32 All Other Garbage 1.1% 5.4% 9.9% 10.9% 4.5% 4.3% 5.5% 33 Liquids 0.1% 1.2% 2.0% 0.4% 1.2% 0.7% 0.8% 34 Grit 0.0% 1.4% 0.0% 1.3% 0.0% 0.0% 0.0% TOTALS 100.0% 100.0% 100.0% 100.0% 100.0% 100.0% 100.0% Dunedin
81 Appendix E Appendix E: Commercial Sample Results (continued) Hauler/Location Waste Mgmt Republic Clearwater Clearwater St. Petersburg St. Petersburg Material Categories sample # St. Petersburg 1 Newspaper 0.0% 0.5% 7.2% 1.6% 0.0% 0.0% 1.1% 2 Corrugated Cardboard 25.9% 5.5% 8.7% 13.8% 7.6% 2.7% 3.2% 3 Office Paper 0.0% 0.1% 3.4% 1.0% 0.0% 0.0% 0.6% 4 Other Recyclable Paper 2.0% 16.1% 15.3% 15.6% 10.7% 9.4% 11.9% 5 Low Grade Paper 1.6% 5.0% 8.0% 13.8% 5.5% 11.2% 4.9% 6 Aseptic Containers 0.0% 0.0% 0.3% 0.2% 0.0% 1.4% 0.1% 7 PET Bottles 0.1% 0.6% 1.2% 1.6% 0.8% 1.5% 2.9% 8 HDPE Bottles 1.5% 0.6% 1.0% 1.1% 1.0% 0.3% 0.4% 9 Other Non-Bottle Plastics #1 and #2 0.1% 0.8% 0.8% 1.3% 2.1% 0.8% 1.0% 10 Other Plastic Containers (#3-#7) 0.3% 0.9% 1.0% 0.8% 0.6% 0.6% 1.7% 11 Bulky Rigid Plastics 0.7% 0.8% 0.7% 2.0% 7.4% 0.8% 1.7% 12 Non-Rigid Plastic Film 6.5% 5.6% 5.2% 6.6% 4.2% 14.3% 6.4% 13 Expanded Polystyrene 0.7% 0.4% 0.4% 0.7% 1.1% 3.3% 1.3% 14 All Other Plastics 0.6% 0.5% 1.9% 0.9% 0.7% 0.4% 0.4% 15 Tin/Steel Cans 0.7% 2.7% 0.8% 0.8% 1.4% 0.2% 0.9% 16 White Goods/Small Appliances 0.0% 0.0% 0.0% 0.0% 0.0% 0.0% 0.0% 17 Other Ferrous 0.0% 0.2% 0.3% 0.7% 0.7% 0.4% 0.2% 18 Aluminum Cans 0.0% 0.7% 0.6% 0.7% 0.3% 0.8% 0.8% 19 Other Non-Ferrous 0.0% 0.2% 0.1% 0.2% 0.3% 0.1% 0.6% 20 Glass Containers 0.4% 0.0% 3.3% 0.5% 12.5% 0.3% 8.2% 21 Other Glass 0.0% 0.3% 0.6% 1.0% 3.7% 0.0% 0.6% 22 Textiles 0.4% 0.2% 1.5% 3.5% 3.1% 1.7% 6.5% 23 Special Wastes 0.0% 0.0% 0.0% 0.4% 0.1% 0.0% 0.1% 24 Electronics 0.0% 0.7% 0.7% 1.0% 1.5% 0.1% 0.3% 25 Household Batteries 0.0% 0.0% 0.0% 0.6% 0.0% 0.0% 0.0% 26 Clean Wood Waste 11.4% 1.7% 0.0% 2.0% 0.0% 0.0% 0.0% 27 Treated Wood Waste 0.0% 1.4% 4.9% 0.0% 0.0% 1.9% 6.5% 28 C&D Debris 8.5% 0.0% 0.7% 0.1% 0.0% 0.0% 0.0% 29 Tires and Rubber 0.0% 0.7% 0.1% 0.5% 0.5% 9.0% 0.1% 30 Yard Waste 6.1% 2.5% 5.8% 0.0% 1.6% 0.7% 0.0% 31 Food Waste 28.7% 32.9% 16.2% 13.1% 26.1% 19.6% 23.6% 32 All Other Garbage 3.8% 17.8% 4.8% 12.0% 5.7% 17.6% 12.9% 33 Liquids 0.0% 0.4% 0.5% 1.8% 1.0% 1.2% 1.3% 34 Grit 0.0% 0.0% 4.0% 0.0% 0.0% 0.0% 0.0% TOTALS 100.0% 100.0% 100.0% 100.0% 100.0% 100.0% 100.0%
82 Appendix E Appendix E: Commercial Sample Results (continued) Hauler/Location St. Petersburg St. Petersburg St. Petersburg St. Petersburg St. Petersburg St. Petersburg Material Categories sample # St. Petersburg 1 Newspaper 6.0% 1.6% 1.1% 0.9% 2.9% 1.6% 0.4% 2 Corrugated Cardboard 10.8% 7.8% 4.7% 8.5% 13.8% 0.4% 7.1% 3 Office Paper 0.3% 0.2% 0.1% 1.6% 0.1% 0.0% 0.2% 4 Other Recyclable Paper 14.4% 13.2% 18.1% 14.2% 10.8% 6.2% 14.2% 5 Low Grade Paper 5.5% 13.1% 12.2% 9.1% 1.2% 4.7% 3.3% 6 Aseptic Containers 0.8% 0.0% 0.1% 0.4% 0.1% 0.4% 3.1% 7 PET Bottles 3.3% 0.6% 2.7% 1.3% 1.7% 1.3% 2.0% 8 HDPE Bottles 1.4% 1.1% 0.2% 1.1% 0.9% 0.6% 0.2% 9 Other Non-Bottle Plastics #1 and #2 1.8% 0.2% 1.1% 1.0% 0.8% 0.4% 1.6% 10 Other Plastic Containers (#3-#7) 1.6% 0.2% 0.8% 1.3% 1.7% 0.9% 1.0% 11 Bulky Rigid Plastics 2.4% 3.3% 0.9% 0.9% 1.9% 0.0% 0.0% 12 Non-Rigid Plastic Film 4.4% 4.2% 7.5% 3.7% 5.5% 3.2% 5.0% 13 Expanded Polystyrene 1.2% 0.2% 0.8% 0.5% 1.9% 1.6% 1.0% 14 All Other Plastics 0.7% 0.8% 0.3% 0.5% 0.1% 0.2% 0.3% 15 Tin/Steel Cans 2.8% 1.0% 1.3% 0.4% 0.4% 1.2% 0.5% 16 White Goods/Small Appliances 0.0% 0.0% 0.0% 0.0% 0.0% 0.0% 0.0% 17 Other Ferrous 0.7% 2.2% 1.0% 0.6% 4.5% 0.0% 0.1% 18 Aluminum Cans 1.1% 0.2% 1.2% 0.6% 1.0% 0.4% 0.7% 19 Other Non-Ferrous 0.4% 1.1% 0.1% 0.1% 0.0% 0.3% 0.2% 20 Glass Containers 4.7% 4.3% 1.0% 3.7% 1.6% 5.3% 0.2% 21 Other Glass 0.0% 0.3% 0.0% 0.7% 0.0% 0.0% 0.0% 22 Textiles 2.9% 4.0% 0.8% 0.7% 2.5% 1.2% 0.8% 23 Special Wastes 0.4% 0.0% 0.0% 0.5% 0.4% 0.0% 0.0% 24 Electronics 0.0% 0.1% 3.5% 11.1% 1.9% 0.1% 0.0% 25 Household Batteries 0.0% 0.0% 0.0% 0.1% 0.2% 0.0% 0.0% 26 Clean Wood Waste 0.1% 0.0% 0.0% 0.9% 16.5% 0.0% 0.0% 27 Treated Wood Waste 0.0% 0.0% 2.2% 0.5% 2.9% 0.0% 0.0% 28 C&D Debris 0.0% 6.0% 0.0% 0.3% 4.8% 0.0% 0.0% 29 Tires and Rubber 0.1% 0.0% 0.4% 0.0% 0.0% 0.0% 0.0% 30 Yard Waste 3.5% 0.0% 1.8% 0.0% 4.6% 20.2% 3.7% 31 Food Waste 18.8% 27.5% 16.0% 28.6% 5.7% 18.2% 46.7% 32 All Other Garbage 8.1% 3.2% 19.2% 5.7% 9.0% 31.1% 3.1% 33 Liquids 1.8% 0.6% 1.0% 0.9% 0.6% 0.5% 4.5% 34 Grit 0.0% 3.0% 0.0% 0.0% 0.0% 0.0% 0.0% TOTALS 100.0% 100.0% 100.0% 100.0% 100.0% 100.0% 100.0%
83 Appendix E Appendix E: Commercial Sample Results (continued) Hauler/Location St. Petersburg St. Petersburg Material Categories sample # Organics Organics Organics Weighted Avg 1 Newspaper 0.9% 7.4% 1.9% 1.1% 3.7% 2.2% 2 Corrugated Cardboard 20.1% 11.5% 9.5% 13.2% 6.9% 10.5% 3 Office Paper 0.0% 0.7% 9.1% 0.5% 5.4% 0.8% 4 Other Recyclable Paper 6.0% 14.5% 4.9% 8.9% 19.6% 11.4% 5 Low Grade Paper 10.0% 8.1% 5.9% 5.6% 9.0% 7.0% 6 Aseptic Containers 1.4% 0.2% 0.1% 0.2% 0.6% 0.4% 7 PET Bottles 2.1% 1.3% 1.0% 1.3% 4.1% 1.4% 8 HDPE Bottles 0.0% 1.0% 0.4% 0.5% 0.8% 0.8% 9 Other Non-Bottle Plastics #1 and #2 1.7% 1.1% 1.0% 0.6% 1.8% 0.9% 10 Other Plastic Containers (#3-#7) 1.2% 1.2% 1.1% 2.3% 1.2% 0.9% 11 Bulky Rigid Plastics 0.0% 1.1% 0.9% 0.5% 2.3% 1.6% 12 Non-Rigid Plastic Film 8.7% 7.1% 7.9% 5.2% 10.8% 6.1% 13 Expanded Polystyrene 3.1% 0.4% 0.4% 0.8% 1.4% 1.0% 14 All Other Plastics 0.4% 0.3% 0.3% 0.5% 0.4% 0.8% 15 Tin/Steel Cans 2.8% 2.0% 0.1% 0.7% 0.6% 1.0% 16 White Goods/Small Appliances 0.0% 0.0% 0.0% 0.0% 0.0% 0.0% 17 Other Ferrous 2.9% 1.0% 0.7% 0.1% 0.7% 1.4% 18 Aluminum Cans 0.6% 1.4% 0.1% 1.0% 1.0% 0.7% 19 Other Non-Ferrous 0.4% 0.3% 0.8% 0.2% 0.4% 0.2% 20 Glass Containers 2.1% 7.9% 1.7% 7.5% 1.5% 3.7% 21 Other Glass 0.0% 0.3% 0.1% 0.2% 0.0% 0.4% 22 Textiles 1.2% 1.3% 2.2% 1.0% 2.0% 2.4% 23 Special Wastes 0.0% 0.1% 0.1% 0.2% 0.0% 0.1% 24 Electronics 0.2% 0.6% 0.7% 0.0% 0.5% 1.7% 25 Household Batteries 0.0% 0.0% 0.0% 0.0% 0.0% 0.1% 26 Clean Wood Waste 2.7% 0.0% 0.2% 0.2% 0.0% 3.9% 27 Treated Wood Waste 1.0% 1.1% 0.6% 0.3% 0.9% 3.0% 28 C&D Debris 2.0% 2.0% 1.0% 0.3% 0.1% 4.5% 29 Tires and Rubber 0.0% 0.1% 0.1% 0.4% 0.3% 0.6% 30 Yard Waste 0.0% 0.1% 1.6% 1.2% 1.9% 3.5% 31 Food Waste 18.0% 20.7% 38.0% 38.3% 10.7% 17.5% 32 All Other Garbage 9.6% 4.7% 5.9% 5.5% 8.6% 7.9% 33 Liquids 1.1% 0.5% 1.5% 1.5% 2.6% 1.1% 34 Grit 0.0% 0.0% 0.2% 0.0% 0.0% 0.7% TOTALS 100.0% 100.0% 100.0% 100.0% 100.0% 100.0% Supermkts Restaurant Institution
84 Appendix E This page intentionally left blank.
85 Appendix F: Large Organic Waste Generator Sample Results
86 This page intentionally left blank.
87 Appendix F Appendix F: Large Organic Waste Generator Sample Results (% by weight) Hauler/Location Wal-Mart Publix GF Foods Guy Harvey Hotel Material Categories sample # Eckerd College 1 Newspaper 2.5% 1.2% 0.0% 3.4% 0.3% 2 Corrugated Cardboard 6.5% 2.4% 7.1% 10.6% 10.5% 3 Office Paper 0.2% 0.6% 29.0% 2.2% 3.1% 4 Other Recyclable Paper 9.3% 1.9% 5.3% 3.9% 9.3% 5 Low Grade Paper 4.7% 14.0% 0.2% 5.1% 9.5% 6 Aseptic Containers 0.4% 0.0% 0.0% 0.8% 0.4% 7 PET Bottles 3.0% 0.8% 0.1% 2.4% 6.0% 8 HDPE Bottles 1.1% 0.2% 0.0% 0.4% 2.3% 9 Other Non-Bottle Plastics #1 and #2 0.7% 0.5% 1.4% 0.8% 3.4% 10 Other Plastic Containers (#3-#7) 1.5% 0.4% 1.2% 3.0% 0.7% 11 Bulky Rigid Plastics 1.1% 1.4% 0.1% 1.2% 4.8% 12 Non-Rigid Plastic Film 8.0% 7.5% 8.8% 5.8% 12.9% 13 Expanded Polystyrene 0.3% 0.6% 0.3% 0.4% 0.6% 14 All Other Plastics 0.7% 0.4% 0.0% 0.2% 0.5% 15 Tin/Steel Cans 0.2% 0.0% 0.2% 0.9% 0.3% 16 White Goods/Small Appliances 0.0% 0.0% 0.0% 0.0% 0.0% 17 Other Ferrous 2.9% 0.0% 0.0% 0.4% 0.0% 18 Aluminum Cans 0.3% 0.2% 0.0% 0.9% 1.9% 19 Other Non-Ferrous 0.0% 0.4% 0.0% 0.1% 0.3% 20 Glass Containers 6.1% 0.6% 0.0% 5.0% 3.0% 21 Other Glass 0.5% 0.1% 0.0% 0.2% 0.0% 22 Textiles 0.2% 1.3% 5.7% 1.5% 4.5% 23 Special Wastes 0.3% 0.0% 0.0% 0.0% 0.0% 24 Electronics 3.4% 0.0% 0.0% 0.0% 0.0% 25 Household Batteries 0.0% 0.0% 0.0% 0.1% 0.0% 26 Clean Wood Waste 0.8% 0.0% 0.0% 0.8% 0.0% 27 Treated Wood Waste 3.0% 0.0% 0.0% 1.3% 0.0% 28 C&D Debris 3.5% 0.3% 0.5% 1.3% 0.2% 29 Tires and Rubber 0.0% 0.0% 0.2% 0.8% 0.4% 30 Yard Waste 0.4% 5.6% 0.0% 0.8% 5.4% 31 Food Waste 23.1% 46.2% 39.8% 40.8% 11.3% 32 All Other Garbage 8.0% 13.0% 0.1% 2.4% 6.1% 33 Liquids 6.4% 0.4% 0.1% 2.5% 2.1% 34 Grit 1.0% 0.0% 0.0% 0.0% 0.0% TOTALS 100.0% 100.0% 100.0% 100.0% 100.0%
88 Appendix F Appendix F: Large Organic Waste Generator Sample Results (continued) Hauler/Location Ferg's Sports Bar Leroy Selmon's St. Pete College Fresh Market Material Categories sample # Newspaper 0.1% 0.0% 8.8% 5.0% 1.2% 2 Corrugated Cardboard 17.9% 10.8% 3.2% 25.7% 13.0% 3 Office Paper 0.0% 0.0% 1.4% 0.0% 0.0% 4 Other Recyclable Paper 5.4% 12.1% 22.8% 3.6% 14.7% 5 Low Grade Paper 4.8% 5.7% 13.0% 4.9% 7.1% 6 Aseptic Containers 0.0% 0.1% 0.2% 0.0% 0.0% 7 PET Bottles 0.6% 0.4% 2.8% 0.3% 2.0% 8 HDPE Bottles 0.6% 0.8% 0.5% 0.6% 0.2% 9 Other Non-Bottle Plastics #1 and #2 0.6% 0.1% 0.9% 1.4% 0.9% 10 Other Plastic Containers (#3-#7) 4.6% 0.1% 1.0% 1.2% 1.6% 11 Bulky Rigid Plastics 0.0% 0.0% 1.4% 1.4% 1.0% 12 Non-Rigid Plastic Film 3.4% 5.4% 9.2% 7.1% 6.8% 13 Expanded Polystyrene 0.3% 0.3% 2.0% 0.5% 2.3% 14 All Other Plastics 0.5% 0.3% 0.5% 0.2% 0.9% 15 Tin/Steel Cans 0.0% 1.9% 0.1% 0.1% 0.1% 16 White Goods/Small Appliances 0.0% 0.0% 0.0% 0.0% 0.0% 17 Other Ferrous 0.0% 0.0% 1.5% 0.2% 0.0% 18 Aluminum Cans 2.1% 0.1% 0.6% 0.1% 0.7% 19 Other Non-Ferrous 0.0% 0.2% 0.8% 3.4% 0.6% 20 Glass Containers 12.5% 8.1% 1.7% 0.9% 3.4% 21 Other Glass 0.0% 0.4% 0.0% 0.0% 0.0% 22 Textiles 0.8% 0.2% 0.6% 0.3% 1.7% 23 Special Wastes 0.0% 0.6% 0.0% 0.0% 0.0% 24 Electronics 0.0% 0.0% 1.2% 0.0% 0.0% 25 Household Batteries 0.0% 0.1% 0.0% 0.0% 0.0% 26 Clean Wood Waste 0.0% 0.0% 0.0% 0.0% 0.0% 27 Treated Wood Waste 0.0% 0.1% 0.0% 0.0% 0.0% 28 C&D Debris 0.0% 0.0% 0.0% 0.0% 0.0% 29 Tires and Rubber 0.8% 0.1% 0.6% 0.1% 0.0% 30 Yard Waste 1.7% 0.0% 0.9% 0.0% 2.4% 31 Food Waste 33.1% 44.7% 10.5% 40.0% 34.4% 32 All Other Garbage 8.4% 7.6% 8.8% 2.8% 2.9% 33 Liquids 1.7% 0.1% 5.2% 0.0% 1.8% 34 Grit 0.0% 0.0% 0.0% 0.0% 0.0% TOTALS 100.0% 100.0% 100.0% 100.0% 100.0% Hooters
89 Appendix F Appendix F: Large Organic Waste Generator Sample Results (continued) Hauler/Location Dunedin High Sch. Material Categories sample # 84 Weighted Avg 1 Newspaper 2.2% 2.0% 2 Corrugated Cardboard 7.0% 10.3% 3 Office Paper 10.3% 4.8% 4 Other Recyclable Paper 25.1% 10.3% 5 Low Grade Paper 5.3% 6.6% 6 Aseptic Containers 1.2% 0.3% 7 PET Bottles 3.7% 1.9% 8 HDPE Bottles 0.0% 0.6% 9 Other Non-Bottle Plastics #1 and #2 1.3% 1.0% 10 Other Plastic Containers (#3-#7) 1.7% 1.6% 11 Bulky Rigid Plastics 1.1% 1.1% 12 Non-Rigid Plastic Film 10.5% 7.6% 13 Expanded Polystyrene 1.7% 0.8% 14 All Other Plastics 0.4% 0.4% 15 Tin/Steel Cans 1.2% 0.5% 16 White Goods/Small Appliances 0.0% 0.0% 17 Other Ferrous 0.6% 0.5% 18 Aluminum Cans 0.8% 0.7% 19 Other Non-Ferrous 0.0% 0.5% 20 Glass Containers 0.2% 3.9% 21 Other Glass 0.1% 0.1% 22 Textiles 1.4% 1.7% 23 Special Wastes 0.0% 0.1% 24 Electronics 0.4% 0.4% 25 Household Batteries 0.0% 0.0% 26 Clean Wood Waste 0.0% 0.1% 27 Treated Wood Waste 2.2% 0.6% 28 C&D Debris 0.0% 0.5% 29 Tires and Rubber 0.0% 0.3% 30 Yard Waste 0.0% 1.5% 31 Food Waste 10.4% 31.1% 32 All Other Garbage 10.5% 6.5% 33 Liquids 0.9% 1.8% 34 Grit 0.0% 0.1% TOTALS 100.0% 100.0%
90 Appendix F This page intentionally left blank.
91 Appendix G: Bulky Waste Audit Results
92 This page intentionally left blank.
93 Appendix G Appendix G: Bulky Waste Audit Results (% by volume) Material Categories sample # Corrugated Cardboard 0.0% 0.0% 0.0% 0.0% 5.0% 2.0% 0.0% Other Paper 0.0% 0.0% 0.0% 0.0% 0.0% 0.0% 0.0% Major Appliances 0.0% 0.0% 0.0% 0.0% 0.0% 0.0% 0.0% HVAC Ducting 0.0% 0.0% 0.0% 0.0% 0.0% 0.0% 0.0% Other Non-Ferrous 0.0% 0.0% 0.0% 0.0% 0.0% 0.0% 0.0% Other Ferrous 0.0% 0.0% 0.0% 0.0% 0.0% 0.0% 0.0% Other Metal 0.0% 0.0% 0.0% 0.0% 0.0% 0.0% 0.0% Plastic Film 0.0% 0.0% 2.0% 0.0% 5.0% 1.0% 0.0% Polystyrene/Insulation 5.0% 0.0% 0.0% 0.0% 0.0% 0.0% 0.0% Rigid Plastics 5.0% 0.0% 3.0% 10.0% 0.0% 0.0% 0.0% Other Plastics 0.0% 0.0% 0.0% 0.0% 0.0% 0.0% 0.0% Yard Waste 50.0% 10.0% 0.0% 0.0% 0.0% 0.0% 0.0% Treated Wood 7.0% 22.5% 0.0% 48.0% 0.0% 47.5% 0.0% Untreated Wood 17.5% 22.5% 0.0% 0.0% 48.0% 0.0% 0.0% Carpet and Padding 0.0% 0.0% 0.0% 0.0% 0.0% 0.0% 0.0% Drywall 0.0% 0.0% 0.0% 16.0% 16.0% 0.0% 0.0% Roofing Shingles 0.0% 40.5% 0.0% 0.0% 0.0% 0.0% 0.0% Rock/Gravel/Grit 0.0% 4.5% 0.0% 0.0% 8.0% 47.5% 0.0% Tile 10.5% 0.0% 0.0% 8.0% 0.0% 0.0% 0.0% Concrete 0.0% 0.0% 0.0% 8.0% 0.0% 0.0% 0.0% Sod 0.0% 0.0% 85.0% 0.0% 0.0% 0.0% 100.0% Furniture 5.0% 0.0% 0.0% 10.0% 0.0% 0.0% 0.0% Mattresses 0.0% 0.0% 0.0% 0.0% 0.0% 0.0% 0.0% Other Furniture 0.0% 0.0% 0.0% 0.0% 0.0% 0.0% 0.0% Household Bagged Waste 0.0% 0.0% 0.0% 0.0% 0.0% 0.0% 0.0% C&D Debris Bagged Waste 0.0% 0.0% 0.0% 0.0% 0.0% 0.0% 0.0% Other Bagged Waste 0.0% 0.0% 0.0% 0.0% 0.0% 0.0% 0.0% Glass 0.0% 0.0% 0.0% 0.0% 0.0% 0.0% 0.0% Other Glass 0.0% 0.0% 0.0% 0.0% 0.0% 0.0% 0.0% Computers 0.0% 0.0% 0.0% 0.0% 0.0% 0.0% 0.0% Televisions 0.0% 0.0% 0.0% 0.0% 0.0% 0.0% 0.0% Other E-Waste 0.0% 0.0% 0.0% 0.0% 0.0% 0.0% 0.0% HHW 0.0% 0.0% 0.0% 0.0% 0.0% 0.0% 0.0% Tires 0.0% 0.0% 0.0% 0.0% 0.0% 0.0% 0.0% Textiles 0.0% 0.0% 0.0% 0.0% 0.0% 0.0% 0.0% Rubber 0.0% 0.0% 0.0% 0.0% 0.0% 0.0% 0.0% Dirt 0.0% 0.0% 10.0% 0.0% 0.0% 0.0% 0.0% Porcelain 0.0% 0.0% 0.0% 0.0% 8.0% 2.0% 0.0% Fiberglass 0.0% 0.0% 0.0% 0.0% 0.0% 0.0% 0.0% MSW 0.0% 0.0% 0.0% 0.0% 10.0% 0.0% 0.0% Boats 0.0% 0.0% 0.0% 0.0% 0.0% 0.0% 0.0% TOTALS 100.0% 100.0% 100.0% 100.0% 100.0% 100.0% 100.0%
94 Appendix G Appendix G: Bulky Waste Audit Results (continued) Material Categories sample # Corrugated Cardboard 0.0% 0.0% 0.0% 0.0% 0.0% 0.0% 0.0% Other Paper 0.0% 0.0% 0.0% 0.0% 0.0% 0.0% 0.0% Major Appliances 0.0% 0.0% 0.0% 0.0% 0.0% 0.0% 0.0% HVAC Ducting 0.0% 0.0% 0.0% 0.0% 0.0% 0.0% 0.0% Other Non-Ferrous 0.0% 0.0% 0.0% 0.0% 0.0% 10.0% 0.0% Other Ferrous 0.0% 0.0% 0.0% 0.0% 0.0% 0.0% 0.0% Other Metal 0.0% 0.0% 0.0% 0.0% 0.0% 0.0% 0.0% Plastic Film 0.0% 0.0% 2.5% 0.0% 0.0% 0.0% 0.0% Polystyrene/Insulation 0.0% 0.0% 2.5% 0.0% 0.0% 5.0% 0.0% Rigid Plastics 0.0% 0.0% 0.0% 0.0% 10.0% 0.0% 0.0% Other Plastics 0.0% 0.0% 0.0% 0.0% 0.0% 0.0% 1.0% Yard Waste 0.0% 0.0% 60.0% 0.0% 50.0% 0.0% 60.0% Treated Wood 0.0% 0.0% 12.0% 100.0% 16.0% 21.3% 0.0% Untreated Wood 50.0% 0.0% 12.0% 0.0% 0.0% 29.8% 23.4% Carpet and Padding 0.0% 0.0% 0.0% 0.0% 0.0% 17.0% 0.0% Drywall 0.0% 0.0% 6.0% 0.0% 0.0% 17.0% 0.0% Roofing Shingles 0.0% 0.0% 0.0% 0.0% 0.0% 0.0% 0.0% Rock/Gravel/Grit 50.0% 0.0% 0.0% 0.0% 16.0% 0.0% 15.6% Tile 0.0% 0.0% 0.0% 0.0% 0.0% 0.0% 0.0% Concrete 0.0% 0.0% 0.0% 0.0% 8.0% 0.0% 0.0% Sod 0.0% 0.0% 0.0% 0.0% 0.0% 0.0% 0.0% Furniture 0.0% 0.0% 0.0% 0.0% 0.0% 0.0% 0.0% Mattresses 0.0% 0.0% 0.0% 0.0% 0.0% 0.0% 0.0% Other Furniture 0.0% 0.0% 0.0% 0.0% 0.0% 0.0% 0.0% Household Bagged Waste 0.0% 0.0% 0.0% 0.0% 0.0% 0.0% 0.0% C&D Debris Bagged Waste 0.0% 0.0% 0.0% 0.0% 0.0% 0.0% 0.0% Other Bagged Waste 0.0% 0.0% 0.0% 0.0% 0.0% 0.0% 0.0% Glass 0.0% 0.0% 0.0% 0.0% 0.0% 0.0% 0.0% Other Glass 0.0% 0.0% 0.0% 0.0% 0.0% 0.0% 0.0% Computers 0.0% 0.0% 0.0% 0.0% 0.0% 0.0% 0.0% Televisions 0.0% 0.0% 0.0% 0.0% 0.0% 0.0% 0.0% Other E-Waste 0.0% 0.0% 0.0% 0.0% 0.0% 0.0% 0.0% HHW 0.0% 0.0% 0.0% 0.0% 0.0% 0.0% 0.0% Tires 0.0% 0.0% 0.0% 0.0% 0.0% 0.0% 0.0% Textiles 0.0% 0.0% 0.0% 0.0% 0.0% 0.0% 0.0% Rubber 0.0% 0.0% 0.0% 0.0% 0.0% 0.0% 0.0% Dirt 0.0% 0.0% 0.0% 0.0% 0.0% 0.0% 0.0% Porcelain 0.0% 0.0% 0.0% 0.0% 0.0% 0.0% 0.0% Fiberglass 0.0% 0.0% 0.0% 0.0% 0.0% 0.0% 0.0% MSW 0.0% 0.0% 5.0% 0.0% 0.0% 0.0% 0.0% Boats 0.0% 100.0% 0.0% 0.0% 0.0% 0.0% 0.0% TOTALS 100.0% 100.0% 100.0% 100.0% 100.0% 100.0% 100.0%
95 Appendix G Appendix G: Bulky Waste Audit Results (continued) Material Categories sample # Corrugated Cardboard 0.0% 5.0% 2.0% 2.5% 0.0% 0.0% 1.0% Other Paper 0.0% 0.0% 0.0% 2.5% 0.0% 0.0% 0.0% Major Appliances 0.0% 0.0% 0.0% 0.0% 0.0% 0.0% 0.0% HVAC Ducting 0.0% 0.0% 0.0% 0.0% 0.0% 0.0% 0.0% Other Non-Ferrous 0.0% 0.0% 0.0% 0.0% 0.0% 0.0% 0.0% Other Ferrous 1.0% 0.0% 0.0% 0.0% 0.0% 0.0% 0.0% Other Metal 0.0% 0.0% 0.0% 0.0% 0.0% 0.0% 0.0% Plastic Film 0.0% 0.0% 0.0% 2.5% 0.0% 0.0% 1.0% Polystyrene/Insulation 4.5% 0.0% 0.0% 0.0% 0.0% 0.0% 0.0% Rigid Plastics 85.5% 0.0% 0.0% 2.5% 0.0% 0.0% 1.0% Other Plastics 0.0% 0.0% 3.0% 0.0% 0.0% 0.0% 0.0% Yard Waste 0.0% 0.0% 80.0% 0.0% 0.0% 95.0% 0.0% Treated Wood 4.0% 9.4% 0.0% 0.0% 0.0% 0.0% 9.2% Untreated Wood 0.0% 37.6% 15.0% 17.8% 0.0% 0.0% 55.2% Carpet and Padding 0.0% 18.8% 0.0% 0.0% 0.0% 0.0% 0.0% Drywall 0.0% 18.8% 0.0% 17.8% 0.0% 0.0% 18.4% Roofing Shingles 0.0% 0.0% 0.0% 0.0% 0.0% 0.0% 0.0% Rock/Gravel/Grit 0.0% 0.0% 0.0% 0.0% 0.0% 0.0% 9.2% Tile 0.0% 0.0% 0.0% 0.0% 0.0% 0.0% 0.0% Concrete 0.0% 9.4% 0.0% 53.4% 100.0% 0.0% 0.0% Sod 0.0% 0.0% 0.0% 0.0% 0.0% 0.0% 0.0% Furniture 0.0% 0.0% 0.0% 0.0% 0.0% 1.0% 0.0% Mattresses 0.0% 0.0% 0.0% 0.0% 0.0% 0.0% 0.0% Other Furniture 0.0% 0.0% 0.0% 0.0% 0.0% 0.0% 0.0% Household Bagged Waste 0.0% 0.0% 0.0% 0.0% 0.0% 0.0% 0.0% C&D Debris Bagged Waste 0.0% 0.0% 0.0% 0.0% 0.0% 0.0% 5.0% Other Bagged Waste 0.0% 0.0% 0.0% 0.0% 0.0% 0.0% 0.0% Glass 0.0% 0.0% 0.0% 0.0% 0.0% 0.0% 0.0% Other Glass 0.0% 0.0% 0.0% 0.0% 0.0% 0.0% 0.0% Computers 0.0% 0.0% 0.0% 0.0% 0.0% 0.0% 0.0% Televisions 0.0% 0.0% 0.0% 0.0% 0.0% 0.0% 0.0% Other E-Waste 0.0% 0.0% 0.0% 0.0% 0.0% 0.0% 0.0% HHW 0.0% 0.0% 0.0% 0.0% 0.0% 0.0% 0.0% Tires 0.0% 0.0% 0.0% 0.0% 0.0% 0.0% 0.0% Textiles 5.0% 0.0% 0.0% 0.0% 0.0% 0.0% 0.0% Rubber 0.0% 0.0% 0.0% 0.0% 0.0% 0.0% 0.0% Dirt 0.0% 0.0% 0.0% 0.0% 0.0% 0.0% 0.0% Porcelain 0.0% 0.0% 0.0% 0.0% 0.0% 0.0% 0.0% Fiberglass 0.0% 0.0% 0.0% 0.0% 0.0% 0.0% 0.0% MSW 0.0% 1.0% 0.0% 1.0% 0.0% 4.0% 0.0% Boats 0.0% 0.0% 0.0% 0.0% 0.0% 0.0% 0.0% TOTALS 100.0% 100.0% 100.0% 100.0% 100.0% 100.0% 100.0%
96 Appendix G Appendix G: Bulky Waste Audit Results (continued) Material Categories sample # Corrugated Cardboard 1.0% 0.0% 0.0% 0.0% 0.0% 0.0% 0.0% Other Paper 0.0% 30.0% 0.0% 0.0% 0.0% 0.0% 0.0% Major Appliances 0.0% 0.0% 0.0% 0.0% 0.0% 0.0% 0.0% HVAC Ducting 0.0% 0.0% 0.0% 0.0% 0.0% 0.0% 0.0% Other Non-Ferrous 1.0% 0.0% 0.0% 0.0% 0.0% 5.0% 0.0% Other Ferrous 0.0% 0.0% 0.0% 0.0% 0.0% 5.0% 0.0% Other Metal 0.0% 0.0% 0.0% 0.0% 0.0% 0.0% 0.0% Plastic Film 0.0% 0.0% 0.0% 0.0% 0.0% 1.5% 0.0% Polystyrene/Insulation 0.0% 0.0% 0.0% 0.0% 0.0% 10.5% 0.0% Rigid Plastics 2.0% 20.0% 0.0% 0.0% 0.0% 3.0% 0.0% Other Plastics 0.0% 0.0% 0.0% 0.0% 0.0% 0.0% 0.0% Yard Waste 10.0% 0.0% 2.0% 0.0% 90.0% 0.0% 80.0% Treated Wood 0.0% 12.0% 9.6% 0.0% 2.0% 18.8% 0.0% Untreated Wood 51.0% 12.0% 86.4% 100.0% 0.0% 18.8% 0.0% Carpet and Padding 0.0% 0.0% 0.0% 0.0% 0.0% 0.0% 0.0% Drywall 0.0% 12.0% 0.0% 0.0% 0.0% 0.0% 0.0% Roofing Shingles 0.0% 0.0% 0.0% 0.0% 0.0% 0.0% 0.0% Rock/Gravel/Grit 34.0% 4.0% 0.0% 0.0% 8.0% 37.5% 20.0% Tile 0.0% 0.0% 0.0% 0.0% 0.0% 0.0% 0.0% Concrete 0.0% 0.0% 0.0% 0.0% 0.0% 0.0% 0.0% Sod 0.0% 0.0% 0.0% 0.0% 0.0% 0.0% 0.0% Furniture 0.0% 10.0% 0.0% 0.0% 0.0% 0.0% 0.0% Mattresses 0.0% 0.0% 0.0% 0.0% 0.0% 0.0% 0.0% Other Furniture 0.0% 0.0% 0.0% 0.0% 0.0% 0.0% 0.0% Household Bagged Waste 0.0% 0.0% 0.0% 0.0% 0.0% 0.0% 0.0% C&D Debris Bagged Waste 0.0% 0.0% 0.0% 0.0% 0.0% 0.0% 0.0% Other Bagged Waste 0.0% 0.0% 0.0% 0.0% 0.0% 0.0% 0.0% Glass 0.0% 0.0% 0.0% 0.0% 0.0% 0.0% 0.0% Other Glass 0.0% 0.0% 0.0% 0.0% 0.0% 0.0% 0.0% Computers 0.0% 0.0% 0.0% 0.0% 0.0% 0.0% 0.0% Televisions 0.0% 0.0% 0.0% 0.0% 0.0% 0.0% 0.0% Other E-Waste 0.0% 0.0% 0.0% 0.0% 0.0% 0.0% 0.0% HHW 0.0% 0.0% 0.0% 0.0% 0.0% 0.0% 0.0% Tires 0.0% 0.0% 0.0% 0.0% 0.0% 0.0% 0.0% Textiles 0.0% 0.0% 0.0% 0.0% 0.0% 0.0% 0.0% Rubber 0.0% 0.0% 0.0% 0.0% 0.0% 0.0% 0.0% Dirt 0.0% 0.0% 0.0% 0.0% 0.0% 0.0% 0.0% Porcelain 0.0% 0.0% 0.0% 0.0% 0.0% 0.0% 0.0% Fiberglass 0.0% 0.0% 0.0% 0.0% 0.0% 0.0% 0.0% MSW 1.0% 0.0% 2.0% 0.0% 0.0% 0.0% 0.0% Boats 0.0% 0.0% 0.0% 0.0% 0.0% 0.0% 0.0% TOTALS 100.0% 100.0% 100.0% 100.0% 100.0% 100.0% 100.0%
97 Appendix G Appendix G: Bulky Waste Audit Results (continued) Material Categories sample # Corrugated Cardboard 0.0% 0.0% 0.0% 0.0% 1.0% 0.0% 0.0% Other Paper 0.0% 0.0% 0.0% 0.0% 0.0% 0.0% 0.0% Major Appliances 0.0% 0.0% 0.0% 0.0% 0.0% 0.0% 0.0% HVAC Ducting 0.0% 0.0% 0.0% 0.0% 0.0% 0.0% 0.0% Other Non-Ferrous 0.0% 0.0% 0.0% 0.0% 0.0% 0.0% 0.0% Other Ferrous 0.0% 2.0% 0.0% 0.0% 1.0% 0.0% 0.0% Other Metal 0.0% 0.0% 0.0% 0.0% 0.0% 0.0% 0.0% Plastic Film 0.0% 0.2% 0.0% 0.0% 0.5% 0.0% 0.0% Polystyrene/Insulation 0.0% 0.0% 0.0% 0.0% 0.0% 0.0% 0.0% Rigid Plastics 2.0% 0.8% 1.0% 0.0% 0.5% 0.0% 0.0% Other Plastics 0.0% 0.0% 0.0% 0.0% 0.0% 0.0% 0.0% Yard Waste 60.0% 0.0% 0.0% 100.0% 3.0% 0.0% 0.0% Treated Wood 0.0% 9.7% 79.2% 0.0% 14.1% 0.0% 99.0% Untreated Wood 17.5% 19.4% 19.8% 0.0% 9.4% 0.0% 1.0% Carpet and Padding 0.0% 0.0% 0.0% 0.0% 0.0% 0.0% 0.0% Drywall 0.0% 0.0% 0.0% 0.0% 65.8% 0.0% 0.0% Roofing Shingles 0.0% 9.7% 0.0% 0.0% 0.0% 0.0% 0.0% Rock/Gravel/Grit 17.5% 0.0% 0.0% 0.0% 4.7% 0.0% 0.0% Tile 0.0% 58.2% 0.0% 0.0% 0.0% 0.0% 0.0% Concrete 0.0% 0.0% 0.0% 0.0% 0.0% 0.0% 0.0% Sod 0.0% 0.0% 0.0% 0.0% 0.0% 100.0% 0.0% Furniture 0.0% 0.0% 0.0% 0.0% 0.0% 0.0% 0.0% Mattresses 0.0% 0.0% 0.0% 0.0% 0.0% 0.0% 0.0% Other Furniture 0.0% 0.0% 0.0% 0.0% 0.0% 0.0% 0.0% Household Bagged Waste 0.0% 0.0% 0.0% 0.0% 0.0% 0.0% 0.0% C&D Debris Bagged Waste 0.0% 0.0% 0.0% 0.0% 0.0% 0.0% 0.0% Other Bagged Waste 0.0% 0.0% 0.0% 0.0% 0.0% 0.0% 0.0% Glass 0.0% 0.0% 0.0% 0.0% 0.0% 0.0% 0.0% Other Glass 0.0% 0.0% 0.0% 0.0% 0.0% 0.0% 0.0% Computers 0.0% 0.0% 0.0% 0.0% 0.0% 0.0% 0.0% Televisions 0.0% 0.0% 0.0% 0.0% 0.0% 0.0% 0.0% Other E-Waste 0.0% 0.0% 0.0% 0.0% 0.0% 0.0% 0.0% HHW 0.0% 0.0% 0.0% 0.0% 0.0% 0.0% 0.0% Tires 0.0% 0.0% 0.0% 0.0% 0.0% 0.0% 0.0% Textiles 0.0% 0.0% 0.0% 0.0% 0.0% 0.0% 0.0% Rubber 0.0% 0.0% 0.0% 0.0% 0.0% 0.0% 0.0% Dirt 0.0% 0.0% 0.0% 0.0% 0.0% 0.0% 0.0% Porcelain 0.0% 0.0% 0.0% 0.0% 0.0% 0.0% 0.0% Fiberglass 2.0% 0.0% 0.0% 0.0% 0.0% 0.0% 0.0% MSW 1.0% 0.0% 0.0% 0.0% 0.0% 0.0% 0.0% Boats 0.0% 0.0% 0.0% 0.0% 0.0% 0.0% 0.0% TOTALS 100.0% 100.0% 100.0% 100.0% 100.0% 100.0% 100.0%
98 Appendix G Appendix G: Bulky Waste Audit Results (continued) Material Categories sample # Corrugated Cardboard 10.0% 1.0% 0.0% 0.0% 0.0% 0.0% 5.0% Other Paper 0.0% 0.0% 0.0% 0.0% 0.0% 0.0% 5.0% Major Appliances 0.0% 0.0% 0.0% 0.0% 0.0% 0.0% 0.0% HVAC Ducting 0.0% 0.0% 0.0% 0.0% 0.0% 0.0% 0.0% Other Non-Ferrous 0.0% 0.0% 0.0% 0.0% 0.0% 0.0% 0.0% Other Ferrous 10.0% 0.0% 0.0% 0.0% 0.0% 5.0% 0.0% Other Metal 0.0% 0.0% 0.0% 0.0% 0.0% 0.0% 0.0% Plastic Film 0.0% 0.0% 0.0% 0.0% 0.0% 0.0% 0.5% Polystyrene/Insulation 0.0% 0.0% 0.0% 0.0% 0.0% 25.0% 0.0% Rigid Plastics 10.0% 0.0% 0.0% 0.0% 100.0% 0.0% 4.5% Other Plastics 0.0% 0.0% 0.0% 0.0% 0.0% 0.0% 0.0% Yard Waste 0.0% 0.0% 5.0% 0.0% 0.0% 0.0% 0.0% Treated Wood 5.0% 9.9% 47.5% 0.0% 0.0% 0.0% 21.6% Untreated Wood 5.0% 9.9% 0.0% 0.0% 0.0% 0.0% 10.8% Carpet and Padding 0.0% 0.0% 0.0% 0.0% 0.0% 0.0% 0.0% Drywall 0.0% 69.3% 0.0% 0.0% 0.0% 70.0% 10.8% Roofing Shingles 0.0% 0.0% 0.0% 0.0% 0.0% 0.0% 0.0% Rock/Gravel/Grit 0.0% 0.0% 47.5% 0.0% 0.0% 0.0% 30.4% Tile 0.0% 9.9% 0.0% 0.0% 0.0% 0.0% 0.0% Concrete 0.0% 0.0% 0.0% 100.0% 0.0% 0.0% 0.0% Sod 0.0% 0.0% 0.0% 0.0% 0.0% 0.0% 0.0% Furniture 0.0% 0.0% 0.0% 0.0% 0.0% 0.0% 0.0% Mattresses 0.0% 0.0% 0.0% 0.0% 0.0% 0.0% 0.0% Other Furniture 0.0% 0.0% 0.0% 0.0% 0.0% 0.0% 0.0% Household Bagged Waste 0.0% 0.0% 0.0% 0.0% 0.0% 0.0% 0.0% C&D Debris Bagged Waste 0.0% 0.0% 0.0% 0.0% 0.0% 0.0% 6.4% Other Bagged Waste 0.0% 0.0% 0.0% 0.0% 0.0% 0.0% 0.0% Glass 0.0% 0.0% 0.0% 0.0% 0.0% 0.0% 0.0% Other Glass 0.0% 0.0% 0.0% 0.0% 0.0% 0.0% 0.0% Computers 0.0% 0.0% 0.0% 0.0% 0.0% 0.0% 0.0% Televisions 0.0% 0.0% 0.0% 0.0% 0.0% 0.0% 0.0% Other E-Waste 0.0% 0.0% 0.0% 0.0% 0.0% 0.0% 0.0% HHW 0.0% 0.0% 0.0% 0.0% 0.0% 0.0% 0.0% Tires 0.0% 0.0% 0.0% 0.0% 0.0% 0.0% 0.0% Textiles 0.0% 0.0% 0.0% 0.0% 0.0% 0.0% 0.0% Rubber 50.0% 0.0% 0.0% 0.0% 0.0% 0.0% 5.0% Dirt 0.0% 0.0% 0.0% 0.0% 0.0% 0.0% 0.0% Porcelain 0.0% 0.0% 0.0% 0.0% 0.0% 0.0% 0.0% Fiberglass 0.0% 0.0% 0.0% 0.0% 0.0% 0.0% 0.0% MSW 10.0% 0.0% 0.0% 0.0% 0.0% 0.0% 0.0% Boats 0.0% 0.0% 0.0% 0.0% 0.0% 0.0% 0.0% TOTALS 100.0% 100.0% 100.0% 100.0% 100.0% 100.0% 100.0%
99 Appendix G Appendix G: Bulky Waste Audit Results (continued) Material Categories sample # 72b Corrugated Cardboard 0.0% 10.0% 0.0% 0.0% 10.0% 0.0% 0.0% Other Paper 0.0% 0.0% 0.0% 0.0% 0.0% 0.0% 0.0% Major Appliances 0.0% 0.0% 0.0% 0.0% 0.0% 0.0% 0.0% HVAC Ducting 0.0% 0.0% 0.0% 0.0% 0.0% 0.0% 0.0% Other Non-Ferrous 2.5% 0.0% 0.0% 0.0% 10.0% 0.0% 0.0% Other Ferrous 2.5% 0.0% 0.0% 0.0% 0.0% 0.0% 0.0% Other Metal 0.0% 0.0% 0.0% 0.0% 0.0% 0.0% 0.0% Plastic Film 0.0% 30.0% 0.0% 0.0% 5.0% 0.0% 0.0% Polystyrene/Insulation 0.0% 0.0% 10.0% 0.0% 5.0% 0.0% 0.0% Rigid Plastics 50.0% 0.0% 0.0% 65.0% 10.0% 0.0% 0.0% Other Plastics 0.0% 0.0% 0.0% 0.0% 0.0% 0.0% 0.0% Yard Waste 0.0% 0.0% 0.0% 0.0% 0.0% 0.0% 10.0% Treated Wood 0.0% 0.0% 20.0% 0.0% 0.0% 0.0% 0.0% Untreated Wood 0.0% 0.0% 0.0% 0.0% 30.0% 0.0% 59.3% Carpet and Padding 0.0% 0.0% 0.0% 0.0% 0.0% 0.0% 0.0% Drywall 0.0% 0.0% 0.0% 0.0% 0.0% 0.0% 0.0% Roofing Shingles 0.0% 0.0% 0.0% 0.0% 0.0% 0.0% 0.0% Rock/Gravel/Grit 0.0% 0.0% 0.0% 0.0% 20.0% 0.0% 9.7% Tile 0.0% 0.0% 0.0% 0.0% 0.0% 0.0% 0.0% Concrete 0.0% 0.0% 60.0% 0.0% 0.0% 0.0% 0.0% Sod 0.0% 0.0% 0.0% 35.0% 0.0% 100.0% 0.0% Furniture 0.0% 0.0% 0.0% 0.0% 0.0% 0.0% 0.0% Mattresses 0.0% 0.0% 0.0% 0.0% 0.0% 0.0% 0.0% Other Furniture 0.0% 0.0% 0.0% 0.0% 0.0% 0.0% 0.0% Household Bagged Waste 0.0% 0.0% 0.0% 0.0% 0.0% 0.0% 0.0% C&D Debris Bagged Waste 0.0% 0.0% 0.0% 0.0% 0.0% 0.0% 0.0% Other Bagged Waste 0.0% 0.0% 0.0% 0.0% 0.0% 0.0% 0.0% Glass 0.0% 0.0% 0.0% 0.0% 5.0% 0.0% 0.0% Other Glass 0.0% 0.0% 5.0% 0.0% 0.0% 0.0% 0.0% Computers 0.0% 0.0% 0.0% 0.0% 0.0% 0.0% 0.0% Televisions 0.0% 0.0% 0.0% 0.0% 0.0% 0.0% 0.0% Other E-Waste 0.0% 0.0% 0.0% 0.0% 0.0% 0.0% 0.0% HHW 0.0% 0.0% 0.0% 0.0% 0.0% 0.0% 0.0% Tires 0.0% 0.0% 0.0% 0.0% 0.0% 0.0% 0.0% Textiles 0.0% 0.0% 0.0% 0.0% 0.0% 0.0% 0.0% Rubber 0.0% 0.0% 0.0% 0.0% 0.0% 0.0% 0.0% Dirt 0.0% 0.0% 0.0% 0.0% 0.0% 0.0% 20.0% Porcelain 0.0% 0.0% 5.0% 0.0% 0.0% 0.0% 0.0% Fiberglass 45.0% 0.0% 0.0% 0.0% 0.0% 0.0% 0.0% MSW 0.0% 60.0% 0.0% 0.0% 5.0% 0.0% 1.0% Boats 0.0% 0.0% 0.0% 0.0% 0.0% 0.0% 0.0% TOTALS 100.0% 100.0% 100.0% 100.0% 100.0% 100.0% 100.0%
100 Appendix G Appendix G: Bulky Waste Audit Results (continued) Material Categories sample # Weighted Average (% by weight) Corrugated Cardboard 0.0% 1.0% 9.0% 0.0% 10.0% 0.0% 1.6% Other Paper 0.0% 0.0% 0.0% 0.0% 0.0% 0.0% 1.3% Major Appliances 0.0% 0.0% 0.0% 0.0% 0.0% 0.0% 0.0% HVAC Ducting 0.0% 0.0% 0.0% 0.0% 0.0% 0.0% 0.0% Other Non-Ferrous 0.0% 0.0% 0.0% 0.0% 0.0% 0.0% 0.8% Other Ferrous 0.0% 0.0% 10.0% 0.0% 0.0% 0.0% 0.6% Other Metal 0.0% 0.0% 0.0% 0.0% 0.0% 0.0% 0.0% Plastic Film 0.0% 0.0% 0.0% 0.0% 3.0% 0.0% 1.0% Polystyrene/Insulation 0.0% 0.0% 20.0% 0.0% 0.0% 0.0% 1.4% Rigid Plastics 0.0% 20.0% 0.0% 0.0% 0.0% 0.0% 11.4% Other Plastics 0.0% 0.0% 0.0% 0.0% 0.0% 0.0% 0.0% Yard Waste 0.0% 49.0% 0.0% 0.0% 0.0% 0.0% 19.5% Treated Wood 0.0% 4.2% 9.9% 0.0% 34.0% 100.0% 14.0% Untreated Wood 0.0% 0.0% 0.0% 0.0% 51.0% 0.0% 15.5% Carpet and Padding 0.0% 9.8% 0.0% 0.0% 0.0% 0.0% 0.9% Drywall 0.0% 0.0% 40.2% 0.0% 0.0% 0.0% 7.3% Roofing Shingles 0.0% 0.0% 0.0% 0.0% 0.0% 0.0% 0.4% Rock/Gravel/Grit 0.0% 0.0% 0.0% 0.0% 0.0% 0.0% 6.5% Tile 0.0% 0.0% 0.0% 0.0% 0.0% 0.0% 0.6% Concrete 0.0% 0.0% 0.0% 0.0% 0.0% 0.0% 4.2% Sod 100.0% 0.0% 0.0% 0.0% 0.0% 0.0% 3.6% Furniture 0.0% 0.0% 0.0% 0.0% 0.0% 0.0% 0.6% Mattresses 0.0% 0.0% 0.0% 0.0% 0.0% 0.0% 0.0% Other Furniture 0.0% 0.0% 0.0% 0.0% 0.0% 0.0% 0.0% Household Bagged Waste 0.0% 0.0% 0.0% 0.0% 0.0% 0.0% 0.0% C&D Debris Bagged Waste 0.0% 0.0% 9.9% 0.0% 0.0% 0.0% 0.5% Other Bagged Waste 0.0% 0.0% 0.0% 0.0% 0.0% 0.0% 0.0% Glass 0.0% 0.0% 0.0% 0.0% 0.0% 0.0% 0.2% Other Glass 0.0% 0.0% 0.0% 0.0% 0.0% 0.0% 0.0% Computers 0.0% 0.0% 0.0% 0.0% 0.0% 0.0% 0.0% Televisions 0.0% 0.0% 0.0% 0.0% 0.0% 0.0% 0.0% Other E-Waste 0.0% 0.0% 0.0% 0.0% 0.0% 0.0% 0.0% HHW 0.0% 0.0% 0.0% 0.0% 0.0% 0.0% 0.0% Tires 0.0% 0.0% 0.0% 0.0% 0.0% 0.0% 0.0% Textiles 0.0% 0.0% 0.0% 0.0% 0.0% 0.0% 0.1% Rubber 0.0% 0.0% 0.0% 0.0% 0.0% 0.0% 1.4% Dirt 0.0% 0.0% 0.0% 0.0% 0.0% 0.0% 0.3% Porcelain 0.0% 0.0% 0.0% 0.0% 0.0% 0.0% 0.2% Fiberglass 0.0% 15.0% 0.0% 0.0% 0.0% 0.0% 0.8% MSW 0.0% 1.0% 1.0% 0.0% 2.0% 0.0% 2.0% Boats 0.0% 0.0% 0.0% 100.0% 0.0% 0.0% 3.5% TOTALS 100.0% 100.0% 100.0% 100.0% 100.0% 100.0% 100.0%
101 Appendix H: Bulky Waste Photographs
102 This page intentionally left blank.


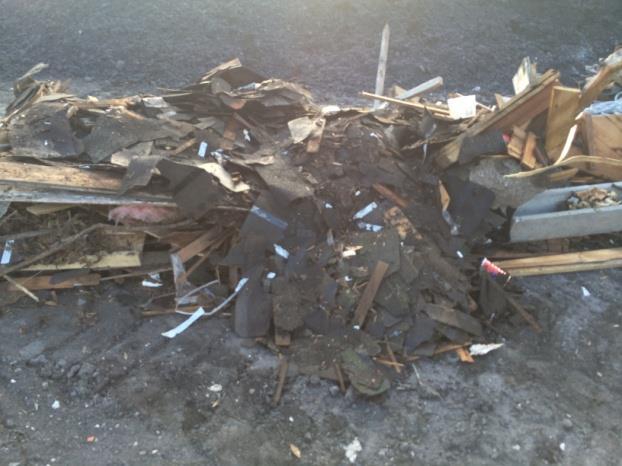
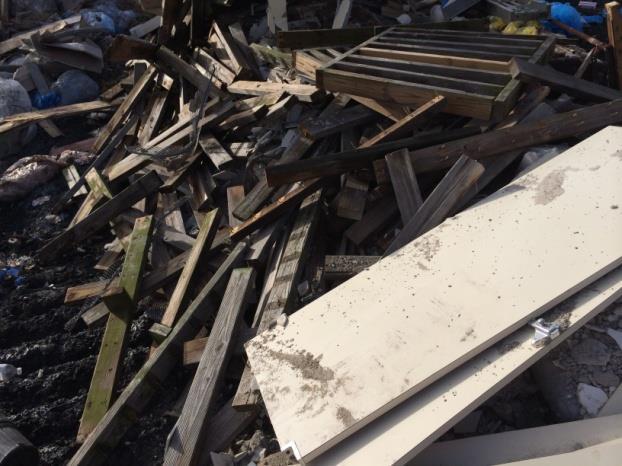
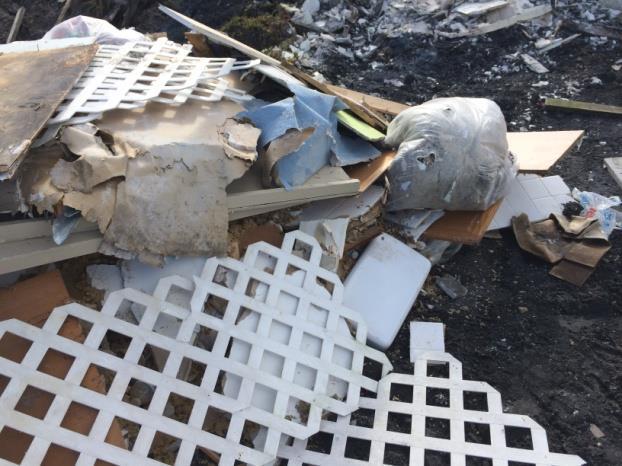
103 Appendix H Table H: Bulky Waste Photographs Sample Number 2 Sample Number 6 Sample Number 7


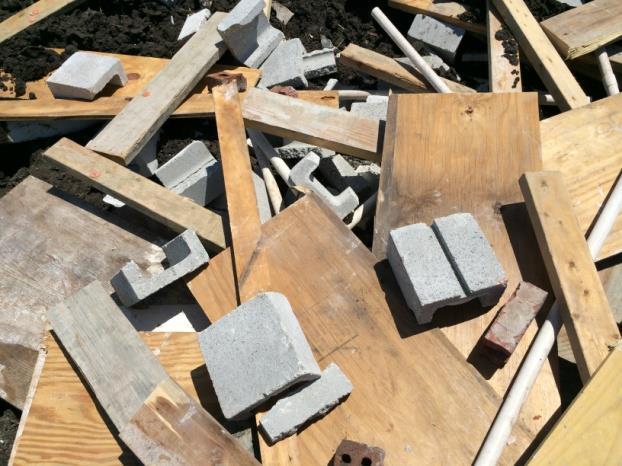
104 Appendix H Table H: Bulky Waste Photographs (continued) Sample Number 10 Sample Number 12 Sample Number 16


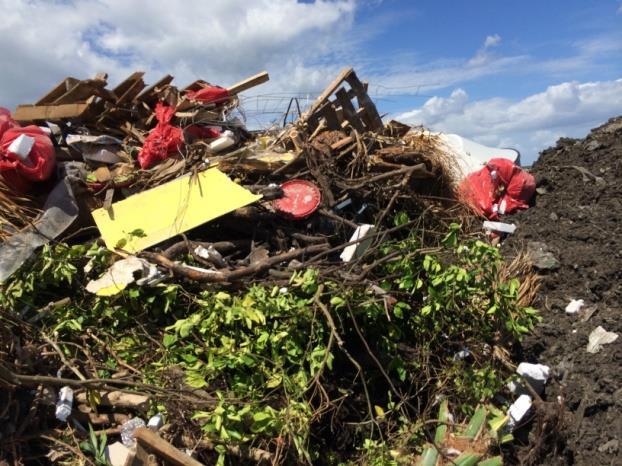
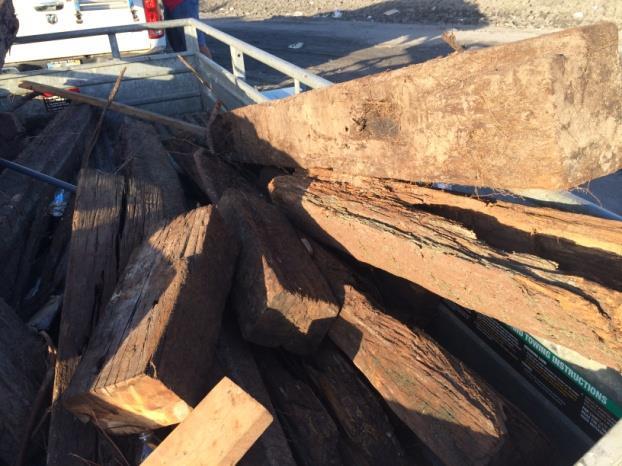
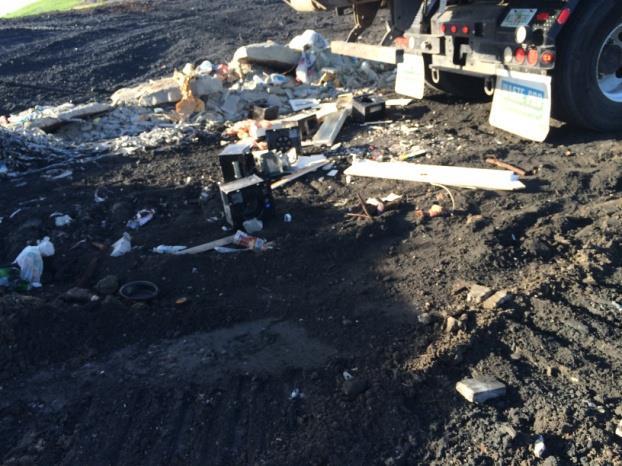
105 Appendix H Table H: Bulky Waste Photographs (continued) Sample Number 22 Sample Number 23 Sample Number 27


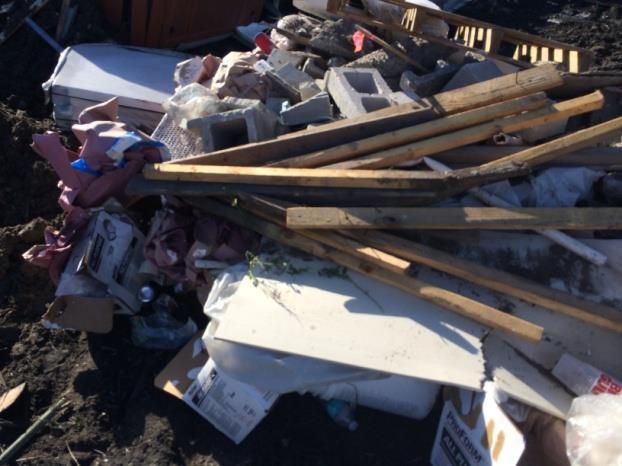
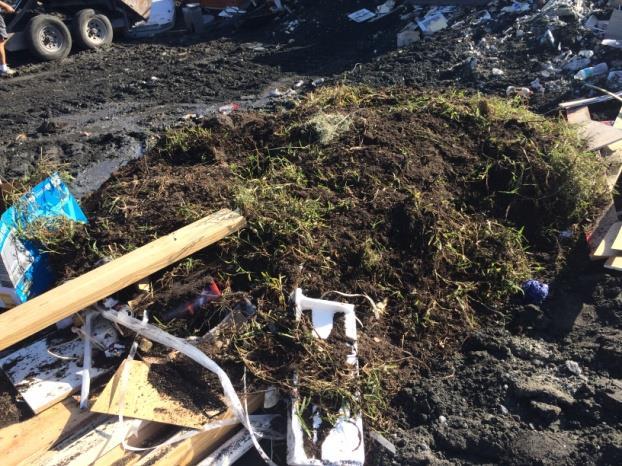

106 Appendix H Table H: Bulky Waste Photographs (continued) Sample Number 29 Sample Number 31 Sample Number 33


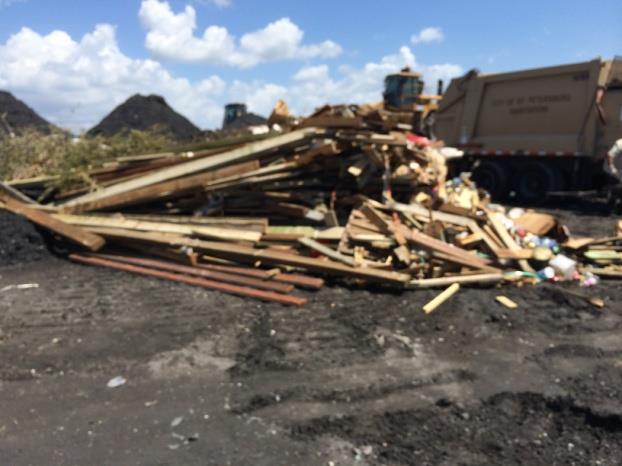


107 Appendix H Table H: Bulky Waste Photographs (continued) Sample Number 40 Sample Number 46 Sample Number 48


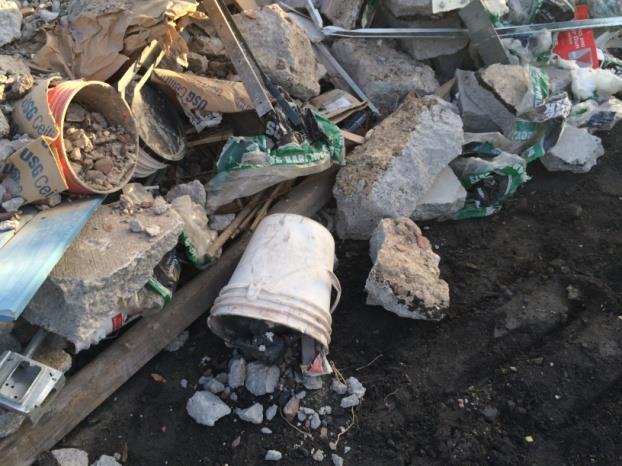

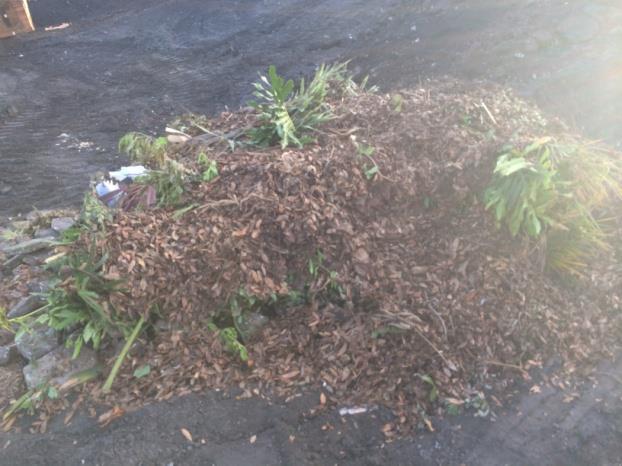

108 Appendix H Table H: Bulky Waste Photographs (continued) Sample Number 49 Sample Number 50 Sample Number 51


109 Appendix H Table H: Bulky Waste Photographs (continued) Sample Number 55 Sample Number 60 Sample Number 61


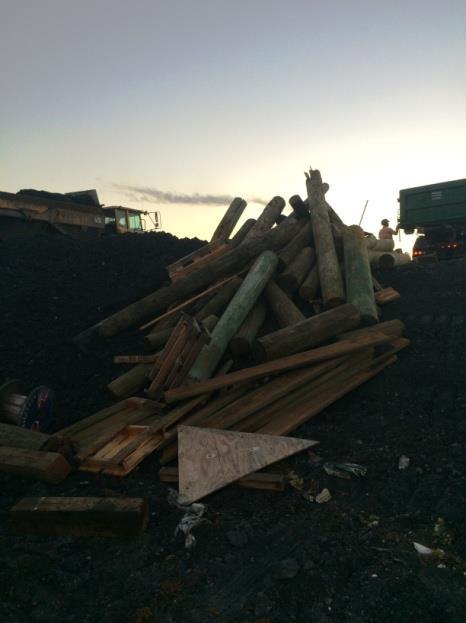
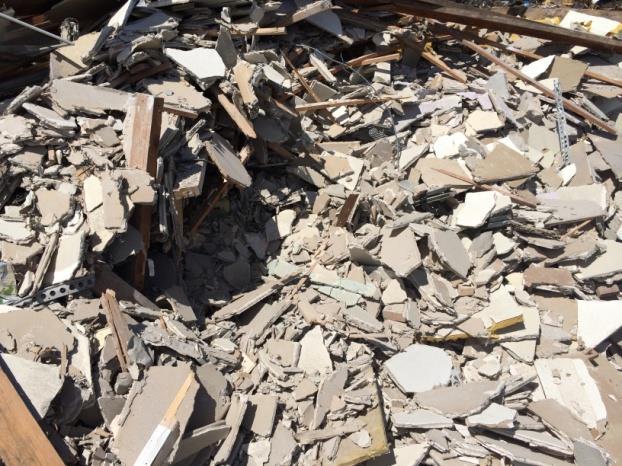

110 Appendix H Table H: Bulky Waste Photographs (continued) Sample Number 62 Sample Number 63 Sample Number 64


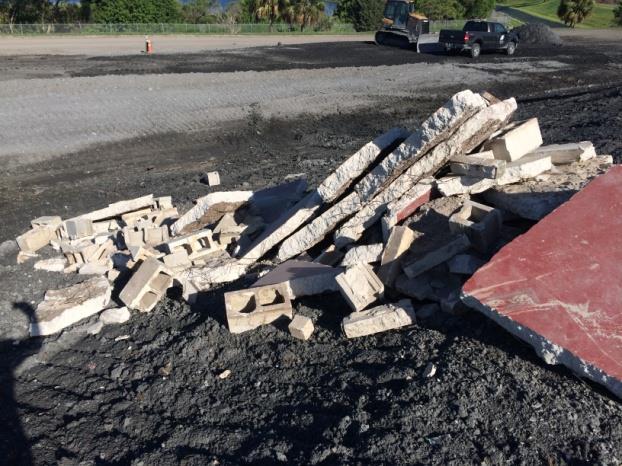
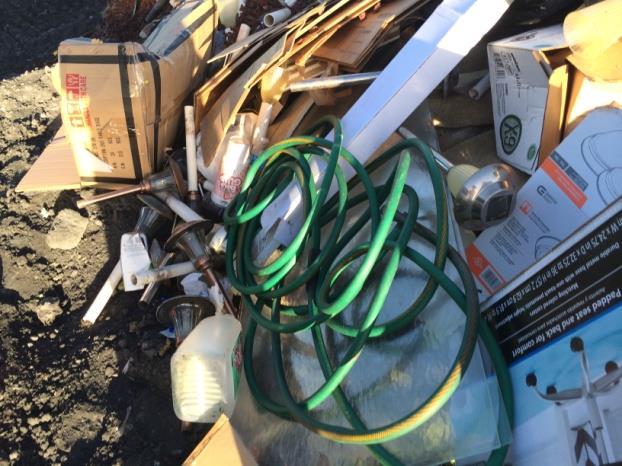

111 Appendix H Table H: Bulky Waste Photographs (continued) Sample Number 65 Sample Number 68 Sample Number 69


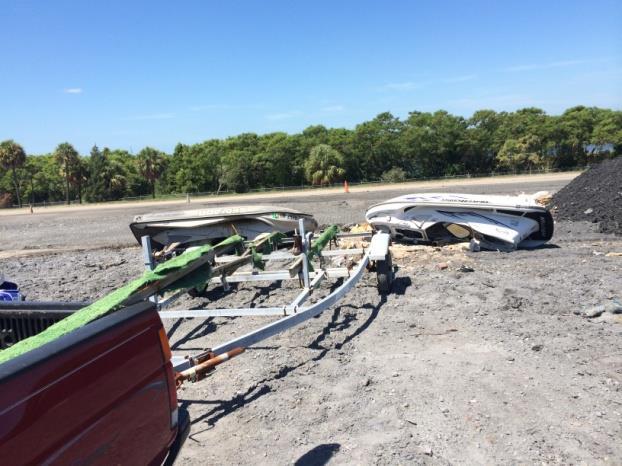

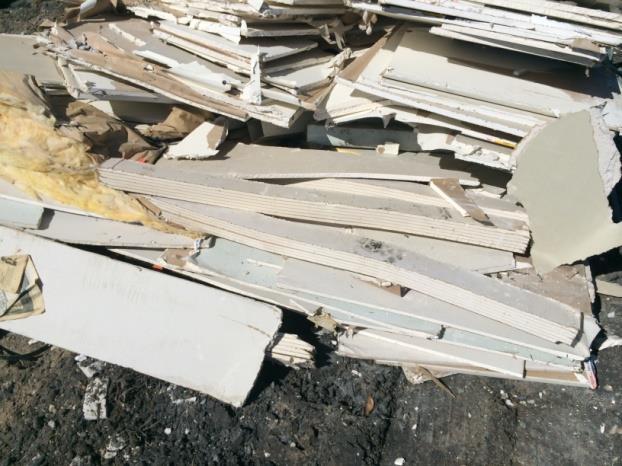

112 Appendix H Table H: Bulky Waste Photographs (continued) Sample Number 70 Sample Number 71 Sample Number 72b

")

113 Appendix H Table H: Bulky Waste Photographs (continued) Sample Number 75 Sample Number 77 Sample Number 83


114 Appendix H Table H: Bulky Waste Photographs (continued) Sample Number 88 Sample Number 90