Upgrade and simulation of the subcritical assembly at Missouri University of Science and Technology
|
|
|
- Arabella York
- 5 years ago
- Views:
Transcription

. Masters Theses. 4979. http://sholarsmine.mst.edu/masters_theses/4979 This Thesis - Open Aess is brought to you for free and open aess by Sholars' Mine.")
1 Sholars' Mine Masters Theses Student Researh & Creative Works Summer 2011 Upgrade and simulation of the subritial assembly at Missouri University of Siene and Tehnology Luas Powelson Tuker Follow this and additional works at: Part of the Nulear Engineering Commons Department: Reommended Citation Tuker, Luas Powelson, "Upgrade and simulation of the subritial assembly at Missouri University of Siene and Tehnology" (2011). Masters Theses This Thesis - Open Aess is brought to you for free and open aess by Sholars' Mine. It has been aepted for inlusion in Masters Theses by an authorized administrator of Sholars' Mine. This work is proteted by U. S. Copyright Law. Unauthorized use inluding reprodution for redistribution requires the permission of the opyright holder. For more information, please ontat sholarsmine@mst.edu.
2
3 UPGRADE AND SIMULATION OF THE SUBCRITICAL ASSEMBLY AT MISSOURI UNIVERSITY OF SCIENCE AND TECHNOLOGY by LUCAS POWELSON TUCKER A THESIS Presented to the Faulty of the Graduate Shool of the MISSOURI UNIVERSITY OF SCIENCE AND TECHNOLOGY In Partial Fulfillment of the Requirements of the Degree MASTER OF SCIENCE IN NUCLEAR ENGINEERING 2011 Approved by Shoaib Usman, Advisor Arvind Kumar Carlos H. Castaño Hyoung Lee
4
5 iii PUBLICATION THESIS OPTION This thesis onsists of the journal artile that will be submitted for publiation to Nulear Engineering & Design Journal. Pages 1-22 of this thesis have been prepared in the style utilized by the Nulear Engineering & Design Journal.
6 iv ABSTRACT The Missouri University of Siene and Tehnology Subritial Assembly (S&TSub) was brought bak into servie and upgraded with a new neutron detetion system and internet aess. Before the upgrade neutron ounting was only possible in one loation. Using a movable detetion system housed in aryli tubes measurements an now be taken in any empty fuel loation and at any height within the tube, making three dimensional flux mapping a possibility. By onneting the new detetion system to a Canberra Lynx Digital Signal Analyzer, remote users an have limited data olleting apabilities. To further enhane the potential of the faility, an MCNP model of the S&TSub was reated, and validated by omparing its simulated preditions to experiments onduted at the faility. An approah to ritiality experiment using the 1/M approximation showed that the MCNP model aurately predits k eff if the detetors are plae between 27 m and 36 m from the neutron soure. The results of an axial flux measurement experiment differed from the MCNP simulated results by an average of 12%. Finally, the validated MCNP model was used to show the effet of removing the faility s fixed detetor tube and redistributing its fuel. MCNP simulation predits that the new onfiguration would inrease the multipliation fator from ±8.080E-05 to ±4.610E-05 and inrease the flux magnitude by 36%.
7 v ACKNOWLEDGEMENTS I ould not have ompleted this projet without the tremendous support I reeived from faulty, staff, friends, and family. My advisor, Dr. Shoaib Usman, guided me through the proess of hoosing a projet, exeuting it, and writing about it. His help was invaluable. I also need to thank Dr. Ayodeji Alajo, whose insight added depth and breadth to my results. I would also like to thank my thesis ommittee members, Dr. Hyoung Lee and Carlos H. Castaño, for their interest; and Dr. Arvind Kumar, the nulear engineering department hair, for his support of my projet. I also reeived a great deal of help from the Missouri University of Siene and Tehnology Reator staff. Bill Bonzer, the reator manager, was willing to put in extra hours to help me omplete my projet, and Craig Reisner helped me load literally tons of uranium into the subritial assembly. My friends and family have also ontributed a great deal. I have shared many late nights and pots of offee with Edwin Grant and Chrystian Posada, and I appreiated their enouragement, assistane, and opinions. Hiral Patel s experiene with the S&TSub was also partiularly helpful. Last, and far from least, I thank my family. My mom, Stephanie Powelson, and my dad, Tim Tuker, have supported me in every endeavor I have undertaken throughout my life, and I would have aomplished very little without them.
8 vi TABLE OF CONTENTS Page PUBLICATION THESIS OPTION... iii ABSTRACT... iv ACKNOWLEDGEMENTS... v LIST OF ILLUSTRATIONS... viii LIST OF TABLES... x PAPER Upgrade and Simulation of the Subritial Assembly at Missouri University of Siene and Tehnology... 1 Abstrat Introdution S&TSub Charateristis Pu-Be Neutron Soure Charateristis Pu-Be Neutron Soure Ativity Pu-Be Neutron Soure Energy Spetrum S&TSub Improvements He Neutron Detetor Void Tube Internet Aessibility MCNP Model Development and Validation Approah to Critiality Axial Flux Profile Void Effet Future Work: Removing the Fixed Detetor Tube Five Potential Load Patterns without the Fixed Detetor Tube Advantages of Removing the Fixed Detetor Tube Conlusions Referenes... 22
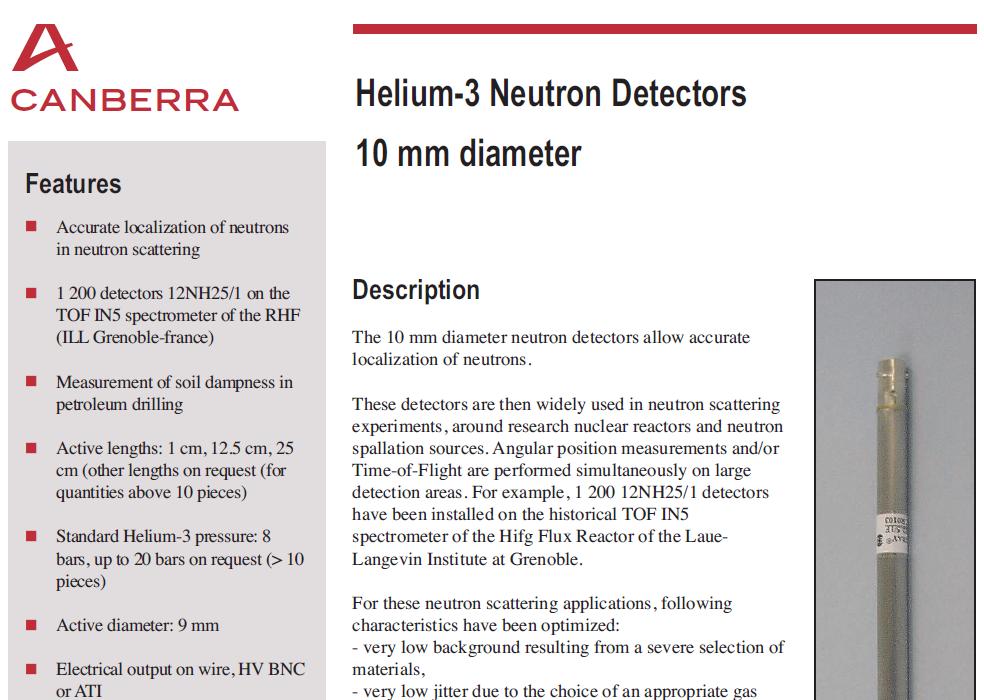
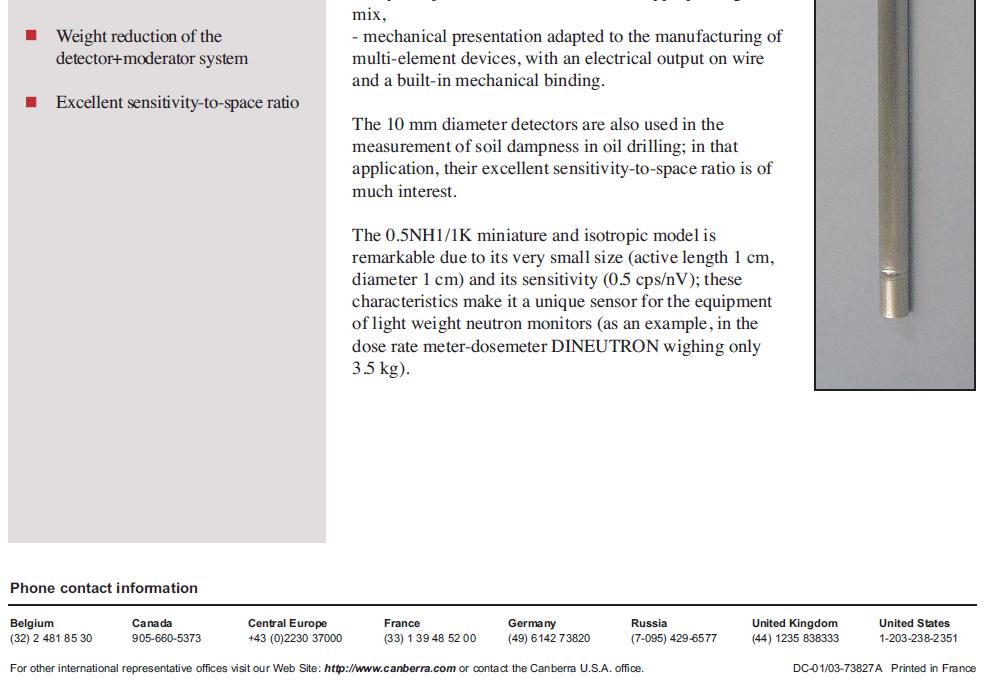
9 vii SECTION APPENDICES VITA 34 A. S&TSUB MCNP MODEL INPUT DECK B. CANBERRA MODEL 0.5NH1/1K 3 HE NEUTRON DETECTOR DATA SHEET... 31
10 viii LIST OF ILLUSTRATIONS Figure Page 1. S&TSub geometry. A. Axial ross setion of S&TSub through its enter. B. Axial ross setion of a fuel slug and its guide tube. C. Axial ross setion of the Pu-Be neutron soure. D. Image of fully loaded S&TSub from above. E. Radial ross setion Expeted neutron energy spetrum of the Pu-Be soure adapted from Kumar and Nagarajan (1977) Movable detetor tube assembly. A. Cap detetor is suspended from. B. Preset suspension loations. C. 3 He neutron detetor. D. Lead weights. E. Aryli stopper S&TSub faility experimental setup. A different model high voltage power supply (HVPS) is used for eah detetor, though the other omponents are idential He detetor pulse height spetrum, demonstrating the wall effet. A. 3 H esapes. B. Proton esapes. C. Neither produt esapes A. Void tube ready for use in the S&TSub. B. Detail of void S&TSub power ramp aquired with Lynx Digital Signal Analyzer (inset) demonstrating the Lynx user interfae A. Fully loaded S&TSub with eah movable detetor tube indiated by a red irle and the neutron soure irled in green. B. Radial ross setion of MCNP model through the top grid plate (27.5 m from the tank bottom) C. Axial ross setion of MCNP model through the enter of the neutron soure and the fixed detetor tube Comparison of results for k eff. 1/M approximation from measured values, 1/M approximation from MCNP tallies, MCNP KCODE results. Radial (R) and axial (H) loation is inluded with the distane from the detetor to the neutron soure (D) Differene between KCODE and simulated and measured 1/M approximations for k eff by loation and detetor for the fully loaded S&TSub Relevant geometry for the axial flux profile experiment. A. Movable detetor tube. B. Pu-Be neutron soure. C. Fixed detetor tube Measured and simulated axial flux profiles Relevant geometry for the void tube experiment. A. Movable detetor tube. B. Void tube. C. Neutron soure. D. Fixed detetor tube Relative flux with void ( ) and without void ( ). A. Experimentally measured values. B. MCNP Simulated values. The solid vertial line denotes the loation of the void. The dotted vertile line denotes the soure loation Perent hange in flux after the void was added for measured and simulated flux... 16
11 ix 16. S&TSub ore onfigurations. A. Current onfiguration, with fixed detetor tube. B. through F. Without-fixed-detetor-tube onfigurations 1-5, respetively. Colors are assigned as follows: Fuel, Empty, Movable detetor tube, Neutron soure Neutron flux distribution (n m -2 sp -1 ) m from the tank bottom for the urrent ore onfiguration. Detetors are irled in blue. Soure is irled in green Neutron flux distribution (n m -2 sp -1 ) m from the tank bottom for reommended onfiguration 1. Detetors are irled in blue. Soure is irled in green... 19
12 x LIST OF TABLES Table Page 1. Seleted dimensions from S&TSub Pu-Be Neutron Soure Ativity from Fuel Burnup S&TSub operating harateristis Predited k eff for the urrent onfiguration and five potential onfigurations... 18
13 Upgrade and Simulation of the Subritial Assembly at Missouri University of Siene and Tehnology Luas P. Tuker, Shoaib Usman 1, Ayodeji Alajo Nulear Engineering, Missouri University of Siene and Tehnology, 203 Fulton Hall, 300W. 13th St., Rolla, MO-65409, United States Abstrat The Missouri University of Siene and Tehnology Subritial Assembly (S&TSub) was brought bak into servie and upgraded with a new neutron detetion system and internet aess. Before the upgrade neutron ounting was only possible in one loation. Using a movable detetion system housed in aryli tubes measurements an now be taken in any empty fuel loation and at any height within the tube, making three dimensional flux mapping a possibility. By onneting the new detetion system to a Canberra Lynx Digital Signal Analyzer, remote users an have limited data olleting apabilities. To further enhane the potential of the faility, an MCNP model of the S&TSub was reated, and validated by omparing its simulated preditions to experiments onduted at the faility. An approah to ritiality experiment using the 1/M approximation showed that the MCNP model aurately predits k eff if the detetors are plae between 27 m and 36 m from the neutron soure. The results of an axial flux measurement experiment differed from the MCNP simulated results by an average of 12%. Finally, the validated MCNP model was used to show the effet of removing the faility s fixed detetor tube and redistributing its fuel. MCNP simulation predits that the new onfiguration would inrease the multipliation fator from ±8.080E-05 to ±4.610E-05 and inrease the flux magnitude by 36%. Key Words: Subritial Assembly, Internet aessible, 3 He neutron detetor, MCNP 1 Corresponding Author. Tel.: ; fax: address: usmans@mst.edu (S. Usman).
14 2 1. Introdution A subritial assembly (SCA) is a nulear pile that is generally fueled with natural uranium and moderated with light water making it inapable of maintaining a selfsustaining fission hain reation without a supplementary neutron soure. Though an SCA annot be used for power generation, it is a useful teahing tool for nulear engineering students. It an be used to demonstrate a reator s neutron flux distribution and the impat of positive and negative reativity insertion. The Missouri University of Siene and Tehnology Subritial Assembly (S&TSub) was purhased for the Nulear Engineering Department in 1958 along with the requisite fuel and neutron soure. The faility was installed in Fulton Hall for ease of aess and remained there until 2007 when it was reloated to the Missouri S&T Reator (MSTR) building. The faility has seen sporadi use lately. The purpose of the work desribed here was to return the S&TSub to full operational status, upgrade the faility with an internet aessible neutron detetion system, model it with Monte Carlo N-Partile transport ode (MCNP), validate the model experimentally, and use the validated model to assess potential adjustments to the faility. 2. S&TSub Charateristis S&TSub was produed by the Nulear Chiago Corporation. Figure 1A shows an axial ross setion through the enter of the faility with the major omponents labeled, while Table 1 lists some of its important dimensions. The ore is housed in a 470 gallon tank made of stainless steel 316. The tank divides into two piees aross the mid-plane to make transportation easier, and a lead gasket is bolted between the two halves for water proofing. A stainless steel tube positioned on the lower half of the tank protrudes radially into the tank aross the enter, allowing detetor aess to the assembly. Two stainless steel grid plates allow fuel rods to be loaded in a regular hexagonal array. Eah fuel rod is omposed of five annular fuel slugs loaded into an aluminum guide tube. Eah slug ontains 1.8 kg of natural uranium metal and is lad in aluminum as seen in Figure 1B. The ore an be loaded with up to 279 fuel rods.


15 3 2.1 Pu-Be Neutron Soure Charateristis During operation, a plutonium-beryllium neutron soure is inserted into the pile. It is plaed in a speial guide tube at the enter-most grid position that is not obstruted by the fixed detetor tube. The neutron soure is lad in tantalum and stainless steel and is mounted on the end of an aryli rod to redue exposure during its insertion and removal. Figure 1C shows the arrangement of the soure, its ladding, its aryli handle, and the soure guide tube. B A C D D E Fig. 1. S&TSub geometry. A. Axial ross setion of S&TSub through its enter. B. Axial ross setion of a fuel slug and its guide tube. C. Axial ross setion of the Pu-Be neutron soure. D. Image of fully loaded S&TSub from above. E. Radial ross setion
16 4 Table 1. Seleted dimensions from S&TSub Tank inner diameter m Guide tube height m Tank wall thikness 0.3 m Fuel height above tank bottom 19.8 m Tank height m Fuel lad outer diameter 3.0 m Fixed detetor tube enterline height 68.6 m Fuel lad inner diameter 1.2 m Fixed detetor tube inner diameter 10.2 m Fuel lad length 21.4 m Fixed detetor tube wall thikness 0.6 m Fuel lad thikness 0.2 m Bottom grid plate height 2.5 m Neutron soure height 69.3 m Top grid plate height 27.3 m Neutron soure diameter 2.8 m Pith of hexagonal fuel array 2.5 m Neutron soure length 6.4 m Guide tube diameter 3.5 m Tantalum soure lad thikness 0.1 m Guide tube thikness 0.1 m Stainless steel soure lad thikness 0.1 m 2.2 Pu-Be Neutron Soure Ativity In a Pu-Be soure neutrons are produed by the 9 Be(α,n) 12 C reation, so the number of neutrons produed depends on the strength of the alpha soure (Runnals and Bouher, 1956). There are five important isotopes of plutonium present in spent nulear fuel and subsequently a Pu-Be soure but eah isotope s relative abundane depends on the initial enrihment of the fuel and its final burnup (Gunnink et al., 1974). Gunnink et al. reported the isotopi abundane of plutonium for several burnup values (1974). The primary deay mode for all of these nulides exept 241 Pu is alpha deay (Baum et al, 2002). 241 Pu deays by β emission to 241 Am, whih is primarily an alpha emitter with a half-life of years (Baum et al, 2002). As 241 Pu deays to 241 Am the alpha emission rate inreases and the neutron emission rate inreases onurrently. Tate and Coffinberry developed equation 1 to predit the inreased neutron ount rate (1958). A(t) = A 1 + Γ 1 e / (1) Where t is the time in years from the start of 241 Am aumulation A(t) is the neutron emission rate at time t A 0 is the soure ativity before any 241 Am has aumulated τ is the mean lifetime of 241 Pu Γ =..
17 5 Where a is the relative abundane and T is the half-life in years. The fator 1.27 orrets for the inreased probability of neutron emission from the higher energy alpha partiles emitted by 241 Am and 238 Pu. Missouri S&T s neutron soure was purhased at the same time as S&TSub in At that time, the soure was omposed of g of beryllium and g of plutonium, and it emitted 5.94*10 6 n s -1. However, the initial plutonium isotopi abundanes are unknown. Table 2 reports several predited soure ativities based Tate and Coffinberry s equation and the isotopi abundanes measured at various values of fuel burnup by Gunnink et al. Table 2. Pu-Be Neutron Soure Ativity from Fuel Burnup Isotopi abundane (%) aording to burnup b Nulide a T 1/2 Alpha Energy a (years) (MeV) GWd/t GWd/t GWd/t GWd/t 238 Pu 8.77E Pu 2.41E Pu 6.56E Pu 1.44E+01 β deay Pu 3.75E Ativity (n s -1 ) 1.45E E E E+08 a (Baum et al., 2002) b (Gunnink et al., 1974) 2.3 Pu-Be Neutron Soure Energy Spetrum Measuring the neutron energy spetrum of the soure was beyond the sope of this projet, so a spetrum adapted from the work of Kumar and Nagarajan was used (1977). The spetrum is plotted in figure 2. Kumar and Nagarajan used ross-setion values, material properties, and alpha deay energies and rates to alulate the neutron emission spetrum from a Pu-Be soure with an assumed 239 Pu enrihment of 100%. The hange in the neutron energy spetrum due to the deay of 241 Pu disussed above was ignored.
18 Emission Probability Neutron Energy (MeV) Fig. 2. Expeted neutron energy spetrum of the Pu-Be soure adapted from Kumar and Nagarajan (1977) 3. S&TSub Improvements The S&TSub s fixed detetor tube does not allow a wide variety of experiments to be performed. Detetor position an only be adjusted radially with respet to the ore. To enhane the experimental apability of the S&TSub a new detetion system was reated. Two m long aryli tubes were fabriated with aryli stoppers at the bottom to make them water proof and loaded with lead weights to ounterat their buoyany. A small 3 He neutron detetor was outfitted with radial spaers to keep it entered while suspended by its data able in eah tube. Sine the aryli tubes have the same outer diameter as a fuel guide tube, and sine the detetors an be positioned at any axial loation within the tube, three dimensional neutron flux measurements of the S&TSub are now possible. Figure 3 shows a fully prepared movable detetor tube ready for insertion into the S&TSub. Fig. 3. Movable detetor tube assembly. A. Cap detetor is suspended from. B. Preset suspension loations. C. 3 He neutron detetor. D. Lead weights. E. Aryli stopper.
19 7 Table 3. S&TSub operating harateristis Detetor Operating Voltage LLD (V) Window (ΔE) V V Fig. 4. S&TSub faility experimental setup. A different model high voltage power supply (HVPS) is used for eah detetor, though the other omponents are idential B C Counts A Channel Fig He detetor pulse height spetrum, demonstrating the wall effet. A. 3 H esapes. B. Proton esapes. C. Neither produt esapes He Neutron Detetor The new detetion system uses Canberra model 0.5NH1/1K 3 He neutron detetor. This detetor was hosen beause of its high neutron sensitivity (0.5 s -1 per n m -2 s -1 ) low gamma sensitivity and small ative volume (1 m long and 0.9 m diameter) providing high spatial auray, ideal for flux mapping. Figure 4 shows the experimental
 3 H reation ours.")
20 8 setup and Table 3 lists the system operating harateristis used for all of the experiments performed for this projet. Beause neutrons are indiretly ionizing radiation they must reate harged partiles to be deteted. In a 3 He detetor thermal neutrons are ounted after the 3 He(n,p) 3 H reation ours. The amount of energy deposited in the detetor depends on where this reation ours. If a neutron is absorbed near the detetor wall it is possible for one of the reation produts to esape the detetor without depositing any energy (Leake, 2005). This effet an be seen in Figure 5, whih is pulse height spetrum olleted using the new S&TSub detetion system. Peak A orresponds to the esape of the proton, meaning only the triton deposits its energy in the detetor. Peak B orresponds to the esape of the triton, meaning only the proton deposits its energy in the detetor. Peak C is produed when neither the proton nor the triton esapes the detetor. 3.2 Void Tube The experimental setup for a void oeffiient experiment was also reated. 41 holes 0.6 m in diameter were drilled 2.5 m apart into a m aryli tube starting 16 m from the bottom of the tube. The holes are large enough for a balloon to be inserted and inflated, allowing a void to be deployed anywhere along the fuel length, and sine the aryli tube has the same outer diameter as the fuel guide tube a void an be inserted into any empty fuel position. Figure 6 shows the void tube with an inflated balloon. A. B. Fig. 6. A. Void tube ready for use in the S&TSub. B. Detail of void
.")
21 9 3.3 Internet Aessibility A Canberra Lynx Counting System provides limited internet aess to the S&TSub for remote users. The Lynx system was installed as part of the Missouri S&T Internet Aessible Hot Cell Faility (Grant et al., 2011). Through the Lynx interfae a detetor an be turned on and off, ounting an be started and stopped, and several settings an be adjusted suh as oarse gain, fine gain, ounting time, and applied voltage (Lynx, 2011). However, remote users an not adjust axial or radial detetor loation, void loation, or fuel arrangement without assistane from reator personnel. Figure 7 shows a measurement of the S&TSub power ramp as the neutron soure was removed and reinserted. This data was aquired with the Lynx system. Fig. 7. S&TSub power ramp aquired with Lynx Digital Signal Analyzer (inset) demonstrating the Lynx user interfae


22 10 4. MCNP Model Development and Validation Monte Carlo N-Partile transport ode is a useful tool for preisely modeling a reator s geometry and simulating the paths neutrons will travel through and interat with materials. MCNP an ompute data about the number of partiles rossing a surfae or absorbed by a material. It an also proess this information to predit reator harateristis suh as the multipliation fator. An MCNP model of the S&TSub was reated for this projet to understand the urrent onfiguration of the faility and predit the effet of any hanges to the onfiguration. The movable detetor tubes and the void tube were also modeled so that the results of the simulation ould be ompared to experimental results for model validation. Eah simulation was performed with fifty million partile histories so that no tally had more than 10% relative error. Figure 8A shows an overhead view of the S&TSub faility, while Figure 8B is a radial ross setion from the MCNP model taken through the top grid plate and Figure 8C shows an axial ross setion of the MCNP model taken through the enter of the neutron soure. b a A. B. C. Fig. 8. A. Fully loaded S&TSub with eah movable detetor tube indiated by a red irle and the neutron soure irled in green. B. Radial ross setion of MCNP model through the top grid plate (27.5 m from the tank bottom) C. Axial ross setion of MCNP model through the enter of the neutron soure and the fixed detetor tube.
23 Approah to Critiality Though a subritial assembly will never beome ritial, when a neutron soure is present it will have a steady population of neutrons quantified by the multipliation rate (M) (Valente, 1963). M is determined by dividing the ombined neutron flux from the soure and fission by the flux from the soure alone (Valente, 1963). Equation 2 shows a geometri series by neutron generation that an be used to alulate the multipliation rate based on the soure ativity (Q) and k eff (Valente, 1963). M = As the number of neutron generations beomes very large and k eff is less than unity, M simplifies to equation 3 (Valente, 1963). M = 1 1 k eff (3) To determine k eff experimentally, the multipliation rate an be approximated as the ratio of neutron ount rates after a ertain amount of fuel is loaded (R ) and before any fuel was present (R 0 ) as seen in equation 4 (Valente, 1963). M = An equation to determine k eff an be developed by ombining equations 3 and 4. (2) (4) k = 1 (5) The 1/M approximation, as the above method is known, was used to determine k eff for the S&TSub. To aomplish this, the movable detetor tubes were plaed in the positions where they are seen in Figure 8A. Fuel was loaded in onentri rings around the soure, whih was plaed in the position nearest to the enter of the assembly irled in green in Figure 8A. Eleven loads were required to add all the S&TSub fuel rods to the ore. Neutron ount rate measurements were taken as fuel was loaded into the S&TSub. For eah measurement, ounts were taken with both detetors in five axial loations suh that the ative volume of the detetor was in line with the enter of eah fuel slug. This experiment was simulated using MCNP. Rather than running a different simulation for eah axial detetor loation, all five detetor loations were ombined into one tube and simulated simultaneously. Sine the distane between detetor loations is large ompared to their ative length, the tally results for a partiular detetor were
24 12 unaffeted by the presene of additional simulated detetors in the tube. An F4 tally, whih alulates fluene normalized per soure partile (n m -2 sp -1 ), was applied to the ative volume of eah simulated detetor, generating R 0 and R for the 1/M approximation. MCNP has a more diret method of alulating the k eff, the KCODE ommand. Using the KCODE ommand, MCNP approximates k eff by estimating the number of fission neutrons produed per fission neutron started for a given generation. By repeating this proess for thousands of generations MCNP arrives at a good approximation of a pile s multipliation fator (X-5 Monte Carlo Team, 2005). The KCODE ommand was also applied for every fuel load to provide an additional data point for omparison with experimental results. In Figure 9 the results of the approah to ritiality equations for the experimental measurements and for the MCNP tallies are plotted with the results of the KCODE simulation for both detetor tubes and eah detetor loation within the tube. The height of eah detetor loation from the bottom of the tank (H) and the radial distane from the soure tube to the movable detetor tube (R) were measured. Also, the straight-line distane from the neutron soure to the detetor entroid (D) was alulated. This information is inluded with eah plot in Figure 9. It is lear from Figure 9 that detetor loation has an important effet on how losely the results from MCNP math experimental results and how losely the 1/M approximation for k eff mathes the KCODE results. The ability of the 1/M approximation to aurately predit k eff depends on the ratio of soure neutrons to fission neutrons. When the detetor is far away from the soure and most of the neutrons it reads are from fission, the 1/M approximation over-predits k eff. Conversely, when the detetor is too lose to the soure and reads too many soure neutrons the 1/M approximation underpredits k eff. However, when the right ratio of soure and fission neutrons is read by the detetor the 1/M approximation provides a good estimate of k eff. This relationship is illustrated in Figure10, whih ompares the measured and simulated 1/M results from eah detetor to the KCODE results. This figure shows that detetor loations a4, b3, and b4, whih are between 27 and 36 m from the neutron soure deviate from KCODE by less than 10% whether simulated or measured.
25 13 k eff k eff k eff k eff k eff Mass of Fuel (kg) 1.0 a a Mass of Fuel (kg) a Mass of Fuel (kg) a Mass of Fuel (kg) a5 R = 15.2 m H = 31.5 m D = 44.5 m R = 15.2 m H = 52.9 m D = 25.5 m D = 15.2 m R = 15.2 m H = 74.3 m R = 15.2 m H = 95.7 m D = 27.1 m R = 15.2 m H = m D = 46.3 m k eff k eff k eff k eff k eff Mass of Fuel (kg) Mass of Fuel (kg) Fig. 9. Comparison of results for k eff. 1/M approximation from measured values, 1/M approximation from MCNP tallies, MCNP KCODE results. Radial (R) and axial (H) loation is inluded with the distane from the detetor to the neutron soure (D) Mass of Fuel (kg) 1.0 b b1 R = 29.9 m H = 31.5 m D = 51.4 m R = 29.9 m H = 52.9 m D = 36.2 m Mass of Fuel (kg) b3 R = 29.9 m H = 74.3 m D = 29.9 m Mass of Fuel (kg) b4 R = 29.9 m H = 95.7 m D = 37.3 m Mass of Fuel (kg) b5 R = 15.2 m H = m D = 53.0 m
 Fig. 10. Differene between KCODE and simulated and measured 1/M approximations for k eff by loation and detetor for the fully loaded S&TSub 4.")
26 14 Diffene from KCODE Predition 40% 30% 20% 10% 0% -10% -20% -30% -40% -50% -60% Detetor a Measured Detetor b Measured Detetor a Simulated Detetor b Simulated Distane from Soure to Detetor (m) Fig. 10. Differene between KCODE and simulated and measured 1/M approximations for k eff by loation and detetor for the fully loaded S&TSub 4.2 Axial Flux Profile The next validation experiment performed was an axial flux measurement. One of the movable detetor tubes was onfigured to take measurements at 21 different axial loations, and a orresponding model was built in MCNP. All detetor loations were simulated simultaneously. The neutron fluene per soure partile was tallied at eah simulated detetor loation. Figure 11 shows the relevant geometry and Figure 12 shows a omparison of the measured and simulated data using this arrangement. The differene between the two urves is likely due to loation measurement error. Fig. 11. Relevant geometry for the axial flux profile experiment. A. Movable detetor tube. B. Pu-Be neutron soure. C. Fixed detetor tube

27 15 Flux Relative to Peak Flux Measured Simulated Soure Loation Distane from Fuel Bottom (m) Fig. 12. Measured and simulated axial flux profiles 4.3 Void Effet One final omparison was made between the MCNP model and the experimental results olleted from the S&TSub. The void tube disussed in setion 3.2 was prepared and inserted into the S&TSub aording to the geometry depited in Figure 13. Neutron ount rate measurements were taken at the same 21 detetor loations. The void was removed, though the aryli tube remained in plae, and the axial flux profile was measured again. The flux relative to the peak flux with the void in plae was alulated for both data sets, and the results were plotted in Figure 14A. This experiment was simulated with MCNP and the relative flux tally results are plotted in Figure 14B. Fig. 13. Relevant geometry for the void tube experiment. A. Movable detetor tube. B. Void tube. C. Neutron soure. D. Fixed detetor tube.
28 16 Flux Relative to Peak Flux A. 1.0 B. 0.8 Flux Relative to Peak Flux Distane above Fuel Bottom (m) Distane above Fuel Bottom (m) Fig. 14. Relative flux with void ( ) and without void ( ). A. Experimentally measured values. B. MCNP Simulated values. The solid vertial line denotes the loation of the void. The dotted vertial line denotes the soure loation Though it is possible to see the differene in flux between the measurements with the void and without the void, the differene is small, and the simulated results are indistinguishable. To better represent the hange in the S&TSub flux harateristis in the presene of a void, the perent hange after the void was added is plotted in Figure 15 for experimentally measured and simulated flux values. The MCNP model does not aurately predit the hange that ourred in the experiment, but this ould be due to the negligible impat the void had. Also, the void shrank in the old water of the S&TSub meaning that the modeled void was larger than the atual void. This experiment should be repeated with a larger void that does not hange size. 30% 20% Measured Simulated Void Loation Soure Loation 10% 0% -10% Distane from Fuel Bottom (m) Fig. 15. Perent hange in flux after the void was added for measured and simulated flux
29 17 5. Future Work: Removing the Fixed Detetor Tube The urrent design of S&TSub inludes a fixed detetor tube, whih overs 31 lattie positions inluding the enter position. This arrangement makes the S&TSub more diffiult to use. First, the symmetry is redued. There is only one axis of symmetry, as seen in Figure 8, whih means that to reate a 3D flux map measurements must be taken in half of the fuel positions. Greater fuel symmetry would redue the amount of time required for flux mapping by reduing the number of positions where flux needs to be measured. Another major problem with the fixed detetor tube is that it extends beyond the enter of the assembly. This hanges the shape of the flux profile. The 31 empty lattie loations that are obstruted by the fixed detetor tube dramatially inrease neutron leakage from the ore, reduing the magnitude of the neutron flux. Not only does the fixed detetor tube detrimentally impat the flux harateristis of the S&TSub it is also diffiult to use for neutron measurements. There is very little flexibility in detetor loation, and though the detetor an be plaed in the enter of the assembly radially, it is not possible to enter it axially beause the fixed detetor tube does not ross the axial mid-plane of the S&TSub. Also, the neutron soure must be plaed as lose to the detetor tube as possible to maximize flux and optimize the flux profile, but the neutrons from the soure mask the neutrons generated by fission, reduing the auray of the results. If the fixed detetor tube were removed and the ore were rearranged all of these issues ould be eliminated. 5.1 Five Potential Load Patterns without the Fixed Detetor Tube To analyze the effet of removing the fixed detetor tube, the MCNP model of the S&TSub was modified to remove the tube and five potential ore loading patterns were onsidered. For eah onfiguration the fuel was rearranged to maximize symmetry. The load patterns were ompared to eah other and the urrent load pattern based on the multipliation fator predited by the KCODE ommand in MCNP. Figure 16 displays the urrent load pattern and the five potential load patterns that were analyzed, while the results of the simulations an be seen in Table 4.


30 18 A. B. C. D. E. F. Fig. 16. S&TSub ore onfigurations. A. Current onfiguration, with fixed detetor tube. B. through F. Without-fixed-detetor-tube onfigurations 1-5, respetively. Colors are assigned as follows: Fuel, Empty, Movable detetor tube, Neutron soure. Table 4. Predited k eff for the urrent onfiguration and five potential onfigurations Current k eff SD 8.080E E E E E E Advantages of Removing the Fixed Detetor Tube Table 4 shows that by removing the fixed detetor tube, entralizing the soure, and redistributing the fuel symmetrially the multipliation fator an be inreased from ±8.080E-05 to ±4.610E-05 if onfiguration 1 is applied. We an also onlude the fuel distribution in the outermost ring of fuel does not affet the improvement muh. Furthermore, removing the fixed detetor tube and reonfiguring the fuel would improve the magnitude and symmetry of the flux distribution. Evidene of
 51.64 m from the tank bottom for reommended onfiguration 1. Detetors are irled in blue.")
31 19 Fig. 17. Neutron flux distribution (n m -2 sp -1 ) m from the tank bottom for the urrent ore onfiguration. Detetors are irled in blue. Soure is irled in green. Fig. 18. Neutron flux distribution (n m -2 sp -1 ) m from the tank bottom for reommended onfiguration 1. Detetors are irled in blue. Soure is irled in green.
32 20 this is shown in Figures 17 and 18, whih show the radial flux distribution m from the tank bottom for the urrent ore onfiguration and onfiguration 1 respetively. The more uniform flux distribution provided by redistributing the ore aording to onfiguration 1 would allow faster mapping of the ore by making it easier to extrapolate measurements aross the ore. Another benefit of removing the fixed detetor tube and redistributing the ore would be an inrease in neutron flux. MCNP predits a 36% inrease in peak neutron flux on this plane from n m -2 s -1 to n m -2 s Conlusions The Missouri University of Siene and Tehnology Subritial Assembly is one again fully loaded with fuel and operational. It has been upgraded with two movable detetor tubes that allow several new experiments to be performed. These experiments inlude 3D flux mapping, void effets, and approah to ritiality. With the help of a Lynx Digital Signal Analyzer limited internet aessible apabilities are available to distane users. An MCNP model of the S&TSub was reated to simulate the results of experiments and predit the effets of hanges to the faility. The MCNP model was validated by omparing its results to a series of experimentally olleted values. First an approah to ritiality experiment to alulate k eff was performed using the 1/M approximation. Measured and simulated values for k eff from the 1/M approximation agreed very well, with a maximum differene of 10%. The 1/M approximation also agreed well with the KCODE preditions for detetor loations between 27 m and 36 m from the neutron soure. An axial flux profile measurement was also performed and simulated. With an average relative error of 12%, the MCNP model aurately predits the experimentally measured results. Finally, a void effet experiment was performed and simulated. This simulation did not aurately predit the experimental results, probably beause of the small impat of the void on neutron flux. The experiment should be redesigned and redone. Using the validated MCNP model, preditions were made about the effet of removing the fixed detetor tube from the S&TSub. The fixed detetor tube is diffiult to use and detrimental to the neutron flux harateristis. Based on MCNP simulations the
33 21 k eff of the S&TSub would inrease from ±8.080E-05 to ±4.61E-05 if onfiguration 1 were applied. Also, moving the neutron soure into the enter of the assembly would inrease the neutron flux by 36% and distribute it more evenly allowing better extrapolation of measurements aross the ore. Future work should fous on removing the fixed detetor tube, optimizing ore loading, and verifying the MCNP model preditions.
34 22 Referenes Baum, E.M., Knox, H.D., Miller, T.R., Chart of the Nulides, sixteenth ed. Knoll s Atomi Power Laboratory, In. Grant, E.J., Mueller, G.E., Castaño, C., Kumar, A.S., Usman, S., Internet aessible hot ell with gamma spetrosopy at the Missouri S&T nulear reator. Nulear Engineering and Design. In press. Gunnink, R., Niday, J.B., Siemens, P.D., A system for plutonium analysis by gamma ray spetrometry part 1: tehniques for analysis of solutions. Lawrene Livermore Laboratory Report UCRL , Part 1. Kumar, A., Nagarajan, P.S., Neutron spetra of 239 Pu-Be Soures. Nulear Instruments and Methods. 140, Leake, J.W., Croft, S., MElroy, R.D., Lambert, K.P., Annual meeting of the INMM. < Aessed 29 Marh Lynx Digital Signal Analyzer Data Sheet. < lynx-ss.pdf>. Aessed 29 Marh Maldonado, G.I., Xoubi, N., Zhongxiang, Z., Enhanement of a subritial experimental faility via MCNP simulations. Annals of Nulear Energy. 35, Runnals, O.J.C., Bouher, R.R., Neutron yields from atinide-beryllium soures. Canadian J. Phys. 34, Tate R.E., Coffinberry A.S., Plutonium-beryllium neutron soures, their fabriation and neutron yield. Seond United Nations International Conferene on the Peaeful Uses of Atomi Energy. Valente, F.A., A Manual of Experiments in Reator Physis. Mamillan, New York. X-5 Monte Carlo Team, MCNP A General Monte Carlo N-Partile Transport Code, Version 5. LA-UR Los Alamos National Laboratory.
35 22 APPENDIX A S&TSUB MCNP MODEL INPUT DECK
36 ontinue Subritial Assembly - Water at or above guide tube **************************************************************************** **************************************************************************** Stainless Steel Tank with Lead Gasket imp:n=1 $ Top Flange imp:n=1 $ Top Tank Wall imp:n=1 $ Top Middle Flange imp:n=1 $ Lead Gasket imp:n=1 $ Bottom Middle Flange #22 imp:n=1 $ Bottom Tank Wall imp:n=1 $ Tank Bottom imp:n=1 $ Air above tank and outside lattie Inside Stainless Steel Tank but Outside Lattie imp:n=1 $ Air above water and below tank top #20 #21 #22 imp:n=1 $ Outside lattie below air imp:n=1 $ Below lattie Tank Detetor Tube imp:n=1 $ Cylinder imp:n=1 $ Front imp:n=1 $ Air Inside Universe 1 - Water and grid plate without hole u=1 imp:n=1 $ Air above water u=1 imp:n=1 $ Water above grid plate u=1 imp:n=1 $ Top grid plate (no hole) u=1 imp:n=1 $ Water between grid plates u=1 imp:n=1 $ Bottom grid plate (no hole) Universe 2 - Water and grid plate with hole 201 like 101 but u=2 $ Air above water 202 like 102 but u=2 $ Water above top grid plate u=2 imp:n=1 $ Top grid plate (w/ hole) u=2 imp:n=1 $ Water in top grid plate hole 205 like 104 but u=2 $ Water between grid plates u=2 imp:n=1 $ Bottom grid plate (w/ hole) u=2 imp:n=1 $ Water in bottom grid plate hole Universe 3 - Fuel 301 like 101 but u=3 $ Air above water u=3 imp:n=1 $ Water above guide tube u=3 imp:n=1 $ Outside tube above grid plate u=3 imp:n=1 $ Outside tube btwn grid plates u=3 imp:n=1 $ Inside guide tube above fuel u=3 imp:n=1 $ Inside guide tube outside fuel u=3 imp:n=1 $ Inside fuel slugs u=3 imp:n=1 $ Inside guide tube below fuel u=3 imp:n=1 $ Guide tube 311 like 203 but u=3 $ Top grid plate (w/ hole) 312 like 206 but u=3 $ Bottom grid plate (w/ hole) u=3 imp:n=1 $ Clad top ap u=3 imp:n=1 $ Clad outer wall u=3 imp:n=1 $ Clad inner wall u=3 imp:n=1 $ Clad bottom ap u=3 imp:n=1 $ Fuel Slug like 320 but trl=10 $ Clad top ap like 321 but trl=10 $ Clad outer wall like 322 but trl=10 $ Clad inner wall like 323 but trl=10 $ Clad bottom ap like 324 but trl=10 $ Fuel Slug like 320 but trl=11 $ Clad top ap like 321 but trl=11 $ Clad outer wall like 322 but trl=11 $ Clad inner wall like 323 but trl=11 $ Clad bottom ap 3 23
37 344 like 324 but trl=11 $ Fuel Slug like 320 but trl=12 $ Clad top ap like 321 but trl=12 $ Clad outer wall like 322 but trl=12 $ Clad inner wall like 323 but trl=12 $ Clad bottom ap like 324 but trl=12 $ Fuel Slug like 320 but trl=13 $ Clad top ap like 321 but trl=13 $ Clad outer wall like 322 but trl=13 $ Clad inner wall like 323 but trl=13 $ Clad bottom ap like 324 but trl=13 $ Fuel Slug 5 Universe 4 - Detetor Tube u=4 imp:n=1 $ Air above water outside tube u=4 imp:n=1 $ Water above grid outside tube 403 like 203 but u=4 $ Top grid plate w/ hole 404 like 304 but u=4 $ Water between grid plates 405 like 206 but u=4 $ Bottom grid plate w/ hole u=4 imp:n=1 $ Aryli tube u=4 imp:n=1 $ Aryli stopper at bottom of tube u=4 imp:n=1 $ Water inside grid outside stopper u=4 imp:n=1 $ Air above top detetor postion u=4 imp:n=1 $ Air between detetor wall and tube u=4 imp:n=1 $ Air below detetor above Pb/air mix E u=4 imp:n=1 $ Pb/air mix above stopper u=4 imp:n=1 $ Monel Detetor Wall u=4 imp:n=1 $ Monel Detetor Top u=4 imp:n=1 $ Monel Detetor Bottom u=4 imp:n=1 $ Air above Detetor Gas E u=4 imp:n=1 $ Detetor Gas u=4 imp:n=1 $ Air below Detetor Gas u=4 imp:n=1 $ Air between Detetors 1&2 431 like 421 but trl=42 $ Monel Detetor Wall like 422 but trl=42 $ Monel Detetor Top like 423 but trl=42 $ Monel Detetor Bottom like 424 but trl=42 $ Air above Detetor Gas like 425 but trl=42 $ Detetor Gas like 426 but trl=42 $ Air below Detetor Gas like 427 but trl=42 $ Air between Detetors 2&3 441 like 421 but trl=43 $ Monel Detetor Wall like 422 but trl=43 $ Monel Detetor Top like 423 but trl=43 $ Monel Detetor Bottom like 424 but trl=43 $ Air above Detetor Gas like 425 but trl=43 $ Detetor Gas like 426 but trl=43 $ Air below Detetor Gas like 427 but trl=43 $ Air between Detetors 3&4 451 like 421 but trl=44 $ Monel Detetor Wall like 422 but trl=44 $ Monel Detetor Top like 423 but trl=44 $ Monel Detetor Bottom like 424 but trl=44 $ Air above Detetor Gas like 425 but trl=44 $ Detetor Gas like 426 but trl=44 $ Air below Detetor Gas like 427 but trl=44 $ Air between Detetors 4&5 461 like 421 but trl=45 $ Monel Detetor Wall like 422 but trl=45 $ Monel Detetor Top like 423 but trl=45 $ Monel Detetor Bottom like 424 but trl=45 $ Air above Detetor Gas like 425 but trl=45 $ Detetor Gas like 426 but trl=45 $ Air below Detetor Gas 5 Universe 5 - Soure and Soure Holder 500 like 101 but u=5 $ Air above water u=5 imp:n=1 $ Below air, above holder u=5 imp:n=1 $ Outside holder, above grid plate 503 like 203 but u=5 $ Top grid plate 504 like 304 but u=5 $ Water between grid plates 505 like 206 but u=5 $ Bottom grid plate 24
38 u=5 imp:n=1 $ Aryli soure holder rod u=5 imp:n=1 $ Aluminum guide tube u=5 imp:n=1 $ Bottom of soure holder up u=5 imp:n=1 $ Water below soure holder up u=5 imp:n=1 $ Top of SS lad u=5 imp:n=1 $ Wall of SS lad u=5 imp:n=1 $ Bottom of SS lad u=5 imp:n=1 $ Top of Tantalum lad u=5 imp:n=1 $ Wall of Tantalum lad u=5 imp:n=1 $ Bottom of Tantalum lad u=5 imp:n=1 $ PuBe Universe 6 - Detetor Tube u=6 imp:n=1 $ Air above water outside tube u=6 imp:n=1 $ Water above grid outside tube 603 like 203 but u=6 $ Top grid plate w/ hole 604 like 304 but u=6 $ Water between grid plates 605 like 206 but u=6 $ Bottom grid plate w/ hole u=6 imp:n=1 $ Aryli tube u=6 imp:n=1 $ Aryli stopper at bottom of tube u=6 imp:n=1 $ Water inside grid outside stopper u=6 imp:n=1 $ Air above Detetor u=6 imp:n=1 $ Air between detetor wall and tube u=6 imp:n=1 $ Air below detetors above Pb/air E u=6 imp:n=1 $ Pb/air mix above stopper u=6 imp:n=1 $ Monel Detetor Wall u=6 imp:n=1 $ Monel Detetor Top u=6 imp:n=1 $ Monel Detetor Bottom u=6 imp:n=1 $ Air above Detetor Gas E u=6 imp:n=1 $ Detetor Gas u=6 imp:n=1 $ Air below Detetor Gas u=6 imp:n=1 $ Air between Detetors 1&2 631 like 621 but trl=42 $ Monel Detetor Wall like 622 but trl=42 $ Monel Detetor Top like 623 but trl=42 $ Monel Detetor Bottom like 624 but trl=42 $ Air above Detetor Gas like 625 but trl=42 $ Detetor Gas like 626 but trl=42 $ Air below Detetor Gas like 627 but trl=42 $ Air between Detetors 2&3 641 like 621 but trl=43 $ Monel Detetor Wall like 622 but trl=43 $ Monel Detetor Top like 623 but trl=43 $ Monel Detetor Bottom like 624 but trl=43 $ Air above Detetor Gas like 625 but trl=43 $ Detetor Gas like 626 but trl=43 $ Air below Detetor Gas like 627 but trl=43 $ Air between Detetors 3&4 651 like 621 but trl=44 $ Monel Detetor Wall like 622 but trl=44 $ Monel Detetor Top like 623 but trl=44 $ Monel Detetor Bottom like 624 but trl=44 $ Air above Detetor Gas like 625 but trl=44 $ Detetor Gas like 626 but trl=44 $ Air below Detetor Gas like 627 but trl=44 $ Air between Detetors 4&5 661 like 621 but trl=45 $ Monel Detetor Wall like 622 but trl=45 $ Monel Detetor Top like 623 but trl=45 $ Monel Detetor Bottom like 624 but trl=45 $ Air above Detetor Gas like 625 but trl=45 $ Detetor Gas like 626 but trl=45 $ Air below Detetor Gas 5 Universe 9 - Lattie lat=2 u=9 imp:n=1 fill=-12:12-12:12 0:
39 $ det tube $ det tube $ det tube S C S=soure C=Center #20 #21 #22 fill=9 imp:n=1 Void :(1-9 10):( ):( ):( ):( ):-17 imp:n=0 **************************************************************************** **************************************************************************** Tank Surfaes 1 z $ Top Flange Radius 2 z $ Middle Flange/Lead Gasket Radius 3 z $ Tank OR 4 z $ Tank IR 9 pz $ Top of air above tank 10 pz $ Top of Tank 11 pz $ Bottom of Top Flange 12 pz $ Top of Middle Flange 13 pz $ Top of Lead Gasket 14 pz 76.2 $ Bottom of Lead Gasket 15 pz $ Bottom of Middle Flange 16 pz 0 $ Bottom of Inside of Tank 17 pz $ Bottom of Outside of Tank Tank Detetor Tube Surfaes 20 /y $ OD 21 /y $ ID 22 py $ Outside of front 23 py $ Inside of front Lattie Definitions 30 z 50.8 $ Outside of Lattie Region (Grid Plate Radius) 31 z $ Grid Plate Hole Radius 32 1 pz $ Top of water (shift up with tr1) 33 pz $ Top of Top Grid Plate 34 pz $ Bottom of Top Grid Plate 35 pz $ Top of Bottom Grid Plate (S36=0) 36 pz 2.54 $ Bottom of Lattie (Bottom of Bottom Grid Plate) 37 rhp $ Hexagonal prism lattie element Bottom Fuel Slug Surfaes Use transforms to generate other slugs 40 z $ Clad OR 41 z $ Fuel OR
40 27 42 z $ Fuel IR 43 z $ Clad IR 44 pz $ Clad Top 45 pz $ Fuel Top 46 pz $ Fuel Bottom 47 pz $ Clad Bottom 48 pz $ Clad Top on 5th fuel slug from bottom Guide Tube Surfaes Guide tube OR is equal to grid plate hole radius (surfae 31) Bottom plane of guide tube is bottom of bottom grid plate (surfae 35) 50 z $ Guide tube IR 51 pz $ Guide tube height Detetor and Aryli Tube Surfaes Aryli tube OR is equal to grid plate hole radius (surfae 31) Top plane of aryli tube is top of air above tank (surfae 9) Bottom plane of aryli tube is top of bottom grid plate (surfae 35) 60 z $ Aryli tube IR 61 z 0.5 $ Detetor Wall OR 62 z 0.45 $ Detetor Wall IR 63 pz $ Detetor 4.1 Wall Bottom outside 64 pz $ Detetor 4.1 Wall Bottom inside 65 pz $ Detetor 4.1 Bottom of He3 Detetor Gas 66 pz $ Detetor 4.1 Top of He3 Gas 67 pz $ Detetor 4.1 Wall Top inside 68 pz $ Detetor 4.1 Wall Top outside 69 pz $ Top of air between Detetors 4.1 and pz $ Bottom of air above Detetor pz $ Top of aryli stopper inside aryli rod 4 72 pz $ Top of Pb/air mix in bottom of aryli tube 4 91 pz $ Detetor 6.1 Wall Bottom outside 92 pz $ Detetor 6.1 Wall Bottom inside 93 pz $ Detetor 6.1 Bottom of He3 Detetor Gas 94 pz $ Detetor 6.1 Top of He3 Gas 95 pz $ Detetor 6.1 Wall Top inside 96 pz $ Detetor 6.1 Wall Top outside 97 pz $ Top of air between Detetors 6.1 and pz $ Bottom of air above Detetor pz $ Top of aryli stopper inside aryli rod pz $ Top of Pb/air mix in bottom of aryli tube 6 Soure Surfaes Soure guide tube OR is equal to grid plate hole radius (surfae 31) 80 z $ PuBe OR 81 z $ Tantanlum lad OR 82 z 1.64 $ SS lad OR 83 pz $ Top of SS lad 84 pz $ Top of Tantalum Clad 85 pz $ Top of PuBe 86 pz $ Bottom of PuBe 87 pz $ Bottom of Tantalum lad 88 pz $ Bottom of SS lad 89 pz $ Bottom of up soure rests in 90 pz $ Top of aryli soure holder rod **************************************************************************** **************************************************************************** Transforms tr $ Shift top of water above guide tube (surfae 32) tr $ 2nd fuel slug from bottom tr $ 3rd fuel slug from bottom tr $ 4th fuel slug from bottom
41 28 tr $ 5th fuel slug from bottom tr $ detetor position 2 tr $ detetor position 3 tr $ detetor position 4 tr $ detetor position 5 Materials m $ water $ 1.0 g/ mt1 lwtr.01t m $ SS $ 7.92 g/ m $ natural uranium $ 19.1 g/ m $ Aluminum $ g/ m $ PuBe $ 2.9 g/ m $ Tantalum g/ m $ Air $ g/ m $ Pb $ g/ m $ Aryli $ 1.18 g/ m $ Monel $ 8.84 g/
42 m $ Detetor fill gas (He3 & Kr) $ m E-01 $ Lead/air mix E-01 $ E E E E-07 soure definition kode tme 840 nps 15E6 Tally Definitions F44:n F64:n Mesh Tallies fmesh14:n origin= imesh=50.8 iints=100 jmesh=50.8 jints=100 kmesh=30.74 kints= 1 fmesh24:n origin= imesh=50.8 iints=100 jmesh=50.8 jints=100 kmesh=52.14 kints= 1 fmesh34:n origin= imesh=50.8 iints=100 jmesh=50.8 jints=100 kmesh=73.54 kints= 1 fmesh44:n origin= imesh=50.8 iints=100 jmesh=50.8 jints=100 kmesh=94.94 kints= 1 fmesh54:n origin= imesh=50.8 iints=100 jmesh=50.8 jints=100 kmesh= kints= 1 weight ard used for neutron dose alulation sdef erg=d1 pos= axs=0 0 1 rad=d2 ext=d3 erg based neutron energy spetrum of PuBe soure si1 h
43 sp si sp2 0 1 si sp
44 31 APPENDIX B CANBERRA MODEL 0.5NH1/1K 3 HE NEUTRON DETECTOR DATA SHEET
45 32