Particle Characterization using Acoustics and Electro Acoustics
|
|
|
- Joleen Simon
- 5 years ago
- Views:
Transcription


1 Particle Characterization using Acoustics and Electro Acoustics Mark Bumiller 2009 HORIBA, Ltd. All rights reserved.


2 Outline Introduce concepts of colloidal stability Acoustic theory/modeling Electro acoustic theory Hardware configurations Applications
3 Colloids A colloid is a type of mechanical mixture where one substance is dispersed evenly throughout another. Because of this dispersal, some colloids have the appearance of solutions. A colloidal system consists of two separate phases: a dispersed phase (or internal phase) and a continuous phase (or dispersion medium). A colloidal system may be solid, liquid, or gaseous. Size range 1 nm 1 micron. (particles) (suspension) (solvent) Colloid. An entity phase dispersed to such a degree that the surface forces become an important factor in determining its properties.


4 Stability Want stable dispersion Either suspensions or emulsions Suspensions sediment & flocculate Emulsions phase separate, creaming or coalescence good good bad bad


5 Steric stabilization: coat surface with polymers Particles can t touch so they don t interact Electrostatic stabilization: alter surface chemistry to put charge on particle surface Repel like magnets Stabilization
6 Electrostatic Stabilization No charge = collide & aggregate Charged particles repel each other
 at slipping plane Zeta")
7 If surface has + charge, then - ions attracted to surface + ions attracted to ions, builds electric double layer Slipping plane: distance from particle surface where ions move with particle ZP = potential (mv) at slipping plane Zeta Potential
8 Zeta Potential & Stability* Stability Extreme to very good stability Reasonable stability Moderate stability Threshold of light dispersion Threshold of agglomeration Strong agglomeration & precipitation Average Zeta Potential (mv) 100 to 60 mv 60 to 40 mv 40 to 30 mv 30 to 15 mv 15 to 10 mv 5 to +5 mv *Stability of Solution-Zeta Potential from "A Control of Colloidal Stability" by Thomas Riddick

9 Size Measurement Hardware sample
10 transmitter Acoustic Attenuation L receiver I in I out Attenuation [db/cm/mhz] diameter 1 micron diameter 0.5 micron Shifts right w/decreasing size Frequency [MHz] Attenuation [db/cm/mhz] α = V 10 log f [ MHz ] L[ cm] Sound speed [cm/sec] = Lcm [ ] t[sec] I I in out
11 Acoustic Attenuation Adsorption conversion to heat Scattering - energy redirection micron 0.5 micron 1 micron 5 micron 10 micron attenuation [db/cm/mhz] ka
12 Particle Size Measurement Real-world Colloid 1) Measure Measured Spectrum + Model Colloid Recipe Material PSD 4) Predict Predicted Spectrum _ Compare 2) Depict 3) Define Optional 1. Measure - the attenuation spectrum over a wide range of ultrasound frequencies 2. Depict - as a model colloid making assumptions & defining a recipe w/ name & amount of disperse phase and the suspending media. 5) Search 3. Define - the relevant physical properties of these named materials 4. Predict - the sound attenuation spectrum considering all loss mechanisms for any size distribution and properties 5. Search - for particle size distribution that provides the best match between the predicted attenuation spectrum for the model colloid and the measured.
13 Loss Mechanisms Intrinsic: results from the energy dissipated in the flexing of its molecular structure as the sound wave passes through the material Viscous: sound wave causes a relative motion between the particle and the surrounding fluid and some of the energy in the sound wave is converted to heat by virtue of the viscous drag Scatter: When the size of the particle becomes comparable to the wavelength of the sound wave, we experience a significant contribution from scattering

14 Loss Mechanisms Thermal: additional energy loss if the thermal properties of the particles differ from the thermal properties of the medium Droplet is more easily compressed than H2O as sound wave passes by. Increases temp, heat flows from particle to H2O Structural: example; particles in polymer, the polymer establishes links between particles. As particles move polymer linkages are periodically stretched and relaxed causing some additional energy dissipation in the linkages.


15 Intrinsic Attenuation Intrinsic loss of water at 25C Intrinsic loss of methanol at 25C Relative change in intrinsic loss for water vs. temperature Intrinsic loss of corn oil
16 Viscous loss: 0.3 μm Alumina size broader 0.3 micron 5 vol% alumina dispersion in water
17 Viscous loss: 0.1 mm Alumina Shift in frequency changes with the square of particle size shift 0.1 micron 5 vol% alumina dispersion in water
18 Viscous loss: 0.03 μm Alumina off scale 0.03 micron 5 vol% alumina dispersion in water

19 Viscous loss: 1.0 μm Alumina Shifts to lower frequencies 1.0 micron 5 vol% alumina dispersion in water
20 Viscous loss: 3.0 μm Alumina Off scale, scattering appears 3.0 micron 5 vol% alumina dispersion in water
21 Scatter loss: 10 μm Alumina Viscous, scattering & intrinsic must all play role, must be understood scatter dominant viscous dominant 10 micron 5 vol% alumina dispersion in water
22 Scatter loss: 30 μm Alumina scatter dominant 30 micron 5 vol% alumina dispersion in water

23 Scatter loss: 100 μm Alumina scatter dominant Amplitude: scatter factor 100 micron 5 vol% alumina dispersion in water

24 Thermal loss: 1.0 μm Droplet 1.0 micron droplets in 20 wt% corn oil in water emulsion

25 Thermal loss: 3.0 μm Droplet 3.0 micron droplets in 20 wt% corn oil in water emulsion

26 Thermal loss: 10 μm Droplet Scattering more dominant 10 micron droplets in 20 wt% corn oil in water emulsion
27 Structural loss: no Links 0.3 micron particles without any structural links between particles

28 Structural loss: with Links 0.3 micron particles with structural links between particles
29 Relevant Properties for Loss Mechanisms
30 What do I Need to Know? Must know concentration wt% (>1-2%) What is the dispersed & continuous phase Relevant properties for loss mechanisms Many particles & liquids in software library Solid, sub micron particles need density Large solid particles determine scatter factor Emulsions, soft particles some thermal properties
 ( ) (.")
31 Piezo crystal Electrodes A ColloidVibrationCurrent CVI C P p m m d = ρ ρ ρ ϕμ m s m p s m s p o m d K K ρ ρ ρ ρ ρ ρ η ς ε ε μ ) ( ) (..Mobility Dynamic = Zeta Potential Probe Electroacoustics Zeta Potential
32 Hardware Configurations Size Conductivity Zeta Titration burettes
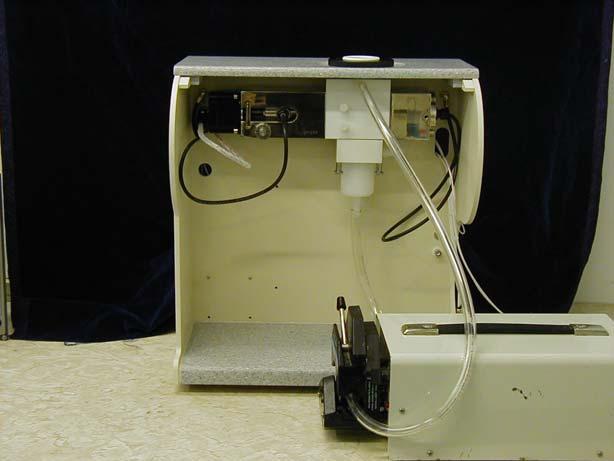


33 Hardware Configurations External peristaltic pump Separate size & zeta potential


34 Additional Sensors Temperature Conductivity Dielectric permittivity ph


35 ph vs. Zeta Potential Titrations Configure hardware: zeta potential probe can be in acoustic size chamber or simply placed in a beaker with the ph probe Fill chemical bottle 1 w/ 1N HCl & chemical bottle 2 w/ 1 N KOH Define material Double click on Titration, Under Type select ph ramp, define titration Click on CVI for zeta potential and Run

36 Flow Through Do basic lab characterizations first
37 Titania in Water ph = 4, 10 DT-1200, Attenuation Spectra Attenuation [db/cm/mhz] :57:42, 10% titania, CR828 in :08:12, 10% titania, CR828 in :19:15, 10% titania, CR828 in :05:10, 10% titania, CR828 in :14:10, 10% titania, CR828 in :22:51, 10% titania, CR828 in Frequency [MHz]

38 Titania, ph = 4
39 Titania, ph = 10
40 Titania in Water ph = 4, 10 DT-1200, Particle Size Distribution :57:42, 10% titania, CR828 in water, ph :08:12, 10% titania, CR828 in water :19:15, 10% titania, CR828 in water :22:51, 10% titania, CR828 in water, ph 1.2 PSD, weight basis Diameter [um]


41 Titania, ph = 3, in Corn Starch First measure Intrinsic attenuation Of corn starch
42 ph Titration of Rutile 7%vl & Alumina 4%vl Many application notes available on web site stable zeta potential [mv] IEP alumina ph unstable stable rutile -50
43 ph Titration of Rutile 7%vl & Alumina 4%vl 85 nm 300 nm PSD IEP aggregates form


44 CMP Chemical Mechanical Polishing fluid
45 CMP Size Data Raw Data Particle Size Distribution
46 CMP Addition Test: Raw Data SS25 with various additions of silica Geltech 0.5
47 CMP Addition Test: Size Results Proves ability to detect small amounts of second population
48 CVI & z-potential for silica CMP 200 continuous measurements 18 50%wt CVI*10E %wt time [minutes] zeta [mv] Precision of the z-potential characterization is about 0.2 mv with no special requirements for temperature control. 10%wt 50%wt
49 Nanoparticles: Zinc Oxide POWDER Name, Median size, Cum % of nanoparticles Manufacturer microns <100 nm Zinc oxide, 99.5+% by Acros 0.273± ±1.4 Organics Zinc oxide, reagent ACS by Acros Organics 0.430± ±0.5 Z USP powder 0.561± ±0.39 packaged by Fisher Scientific Z USP powder 0.660± ±0.4 packaged by Fisher Scientific S80249 by Fisher Scientific ± ±0.2 Zinc oxide ACS reagent grade by MO Biomedicals, LLC 0.349± ±2.1 Zinc oxide Polystormor by 0.223± ±1.8 Mallinckrodt Chemicals Zinc oxide Nanopowder by 0.631± ±2.5 American Elements Base Dopant
50 Nanoparticles: Zinc Oxide < 100nm Attenuation [db/cm/mhz] zinc oxide A in solvent zinc oxide B in water PSD, weight basis nano-particles range zinc oxide A zinc oxide B Frequency [MHz] Diameter [um]
51 Nanoparticles Zinc oxide, reagent ACS by Acros Organics Zinc oxide, 99.5+% Acros Organics Z USP Z USP S80249 by Fisher Scientific Zinc oxide 99.99% by Alfa Aesar Zinc oxide ACS MO Biomedicals, LLC PolystormorTM by Mallinckrodt Chemicals Nanopowder America Elements PSD, weight basis Diameter [um]
52 Nanoparticles Detection 7 6 Add 223 nm ZnO (dope) to 660 nm ZnO (base) % nano-particles, measured % nano-particles, estimated Plot estimated (x) vs. measured (y) % nanoparticles (<100nm) Observed deviation ~ 1% Conclusion: acoustics can detect small amount of nanoparticles, even as smaller second population
53 Milling: Simple QC Measurement weight basis :15:03, :19:07, :24:49, :31:30, :36:41; :42:35; :48:04, :52:22, :56:04, :02:26, :08:02, :13:07, :17:16, wt% Alumina Starting size >20 microns particle size [micron] :15:03, :17:16, weight basis particle size [micron]


54 Zeta Potential of Proteins Zeta Potential Zeta Potential vs ph: BSA IEP ph ph CVI Zeta STD , , , , , , , , , , , , ,
55 Conclusions Particle size without dilution for concentrated (> 1wt %) dispersions Zeta potential without dilution for concentrated (> 1wt %) dispersions Automatic titration of ph, surfactant conc., etc. Micro rheology Colloids, nanoparticles, emulsions, dispersion stability