Study of foam in Fractures and Porous media for EOR process
|
|
|
- Gilbert Holt
- 5 years ago
- Views:
Transcription


1 Study of foam in Fractures and Porous media for EOR process Jose Luis Lopez Maura Puerto Clarence Miller George Hirasaki Experimental work: Angelica Garcia Andres Novoa Aaron Rondina Ramsey Padilla Jesus Duran 1
2 Objective: Study of foaming properties for a surfactant blend with potential to produce ultralow IFT 2
3 Introduction: After preliminary tests of aqueous stability, phase behavior and IFT measurements, the performance of a potential formulation was qualitatively tested. Sand was treated to be oil wet, then immersed and aged with synthetic live oil and finally contacted either seawater or Surfactant solution in seawater. Silica sand grains were treated to be oil-wet Using Dichloro octamethyl tetrasiloxane Si O Si Cl Si O Si O Si O Si Cl O Si CH O 3 Si Hydrophilic OH OH OH OH OH OH Si Si Si O O O O O O Si Si Si Si Silica sand lipophilic O O OH OH OH Si Si Si O O O O O O Si Si Si Si O OH Si 3 2 HCl


4 Grains of sand covered with synthetic live oil 70 C Surfactant formulation with ultralow IFT 80 C After 1 h no oil recovered 80 C After 3 h no oil recovered 1 mm Seawater 80 C After 10 min 70 C After 2 min 80 C Oil being recovered Surfactant in Seawater Silica sand was treated with 1,7-Dichloro-octamethyl tetra siloxane, then contacted with synthetic live oil 4
5 Volume Filtered (ml) y = x R² = DIW Filterability test. y = x R² = % A+0.5% B+0.12%E 0.5% A+0.5% B Filtration Ratio = [t 200 ml -t 180 ml ]/[t 80 ml -t 60 ml ] Solution Filtration Ratio DIW 1 0.5% A+0.5%B +0.12E 1 0.5% A+0.5%B Time (s) Filterability Test After verifying the potential to recover oil, a filterability test was conducted. Criterion FR> 1.5 unacceptable Castor 1981 UT Austin FR>1.2 for polymer using 0.45 mm James Sheng 2010, Modern Chemical EOR 5
6 Foam experiments Experiments were conducted to study: Foam in porous media (unconsolidated sand pack) Shear thinning properties Effect of permeability Temperature dependence Effect of quality Effect of oil Effect of surfactant concentration Fit parameters of a foam model (MRF Approach) Foam in parallel plates as a representation of fractures 6
7 Pressure drop (psi) Gas flowrate (sccm) Foam : Co-injection of 0.5% A + 0.5%B+ 0.12% E In Seawater at 94 C 80% Foam Quality, OTTAWA Sand K = 45D Overall pressure drop First tap Second tap PV (Gas) Sieve Mesh 200 Sieve Mesh Rubber stopper Rubber stopper 5 1/2 Second Tap Silica sand Mesh First Tap Rubber stopper 5 1/2 Rubber stopper Sand pack Internal-Tap Locations 7
8 Apparent viscosity (cp) Foam : Co-injection of 0.5% A + 0.5%B+ 0.12% E In Seawater at 94 C Shear thinning effect Experimental data 80% quality ft/day Model fit n = Total flow rate (cm 3 /min) 8
9 Apparent viscosity [=] cp Pa-s Effect of permeability B-A 3 (SW, 94C) G = darcy 0.5 A+0.5B E (94C) G = darcy B+A 3 G = darcy A 3 (60C) G = darcy B-A 3 (60C) G = darcy 1% Surfactant (25C) G= darcy (Parlar, 1995) F u g / k s epv Shear rate [=] 1/s 9
10 Apparent viscosity (cp) Effect of foam Quality 800 Foam : Co-injection of 0.5% A + 0.5% B % E In Seawater at 94 C Model fit Total flow rate 1.9 cm 3 /min u = 22.2 ft/day Experimental data Foam Quality 10

11 Parameters for the model D 2.29 cm L cm k 44 darcy 0.36 DL cm epdry 100 fmdry 0.15 fmmob epv U ref (m/s) 1.00E-05 S cw 0.1 S rg 0.05 nw 5 ng 2 k o w 1 k o g 1 Porous media and fluids properties m w 0.3 cp m g 0.02 cp Parameters for the model after fitting F arctan epdry S w fmdry k rw k f rg k 0 rw Sw 1 S F 4 S rg k rg cw S cw 6 1 fmmob Fi 11 u u g gref epv nw 11
12 Apparent viscosity (cp) Parameters for the model : observation comparison and suggestion Comparison of Foam strength at same shear rate with previous recommended formulation: B+A 2 2:1 Shown as continuous black line ft/day Foam quality 80% Total flow rate (cm3/min) F 4 epv u / k g Fits to all values of 1.53s 1 permeability studied 100, 44, 8 and 2 darcy Apparent shear rate (Carreau, 1997) 12ug / 75k 1.385ug / F u g / k s epv 12 k
13 Pressure drop (psi) Gas flow rate (sccm) Effect of Oil on Foam Strength at 70% quality tap 1 tap 2 Oil injection Injection of 5% PV of oil during co injection Oil BT Two transient tests PV (Gas) Flow increased at 0.1 PV of gas from 0.12 cm3/min to 1.87 cm3/min foam recovered its strength in less than 1PV of gas oil injection at 2.27 PV of gas, took close to 0.1 PV of gas injection to see the oil BT
14 Apparent viscosity (cp) Effect of surfactant concentration on shear thinning effect Foam quality 75-80% % 0.28% 1.12% 1.12% 0.56% 0.28% 0.14% 1 ft/day 0.56 % Total flow rate (cm3/min) The surfactant concentration In the range from 0.14% m/v to 1.12 % has no effect on the foam strength at steady state for quality between 75% and 80%. 14
15 Apparent Viscosity (cp) Effect of surfactant concentration % 0.28% 0.14% Total flow rate 1.9 cm 3 /min V = 22.2 ft/day 0.56% Foam Quality The dependence of foam strength with surfactant concentration is stronger when the quality is less than 80%. 1.12% 0.56% 0.28% 0.14% 15
16 Foam in fractures 16


17 Safe Relief Diagram of Experimental Set Up Mass Flow Controller Pump Frit FOAM Ports N 2 Transducer - + Parallel Plates 3psi Closed Surfactant solution Not at scale by MCPUERTO 12/8/


18 Picture of Experimental Set Up for Foam Testing Frit Model encased for mitigating glass glare in videos /pictures 18
19 Experimental variables Flow, cm 3 /min 19.2 Ultra low IFT between Oil and aqueous phase ( 604 ft/day ) % Quality B/A Ratio 100/0 75/25 0/100 50/ % E L H L = 25 cm, H = 15 cm, b=0.025 cm b 19
20 Pressure drop (psi) Effect of frit size to pre-generate foam Foam in 250 mm aperture parallel plates 25 C 7.5B: 2.5 A 60 mm_ Solid line_ closed circles 90 mm _Dashed line_ open circles Foam Quality 88% 71% 52% cm 3 /s 20
21 250 Apparent viscosity ~100 ft/day 7.5 B : 2.5 A 200 Apparent viscosity, cp Foam Quality 88% 70% 52% cm 3 /s μ = k A p q k = b2 12 b = fracture thickness = 250 mm k = 5260 Darcy 21
22 Pressure drop (psi) Comparison of Surfactants (1) Pre-generated foam (60 mm frit) B : 2.5 A BLEND: Open circles Red 88% A : Closed circles Red 88% Purple 71% Blue 52% cm 3 /s B : open diamonds Red 88% Purple 71% Blue 52% 22


23 Flow cm 3 /min 1% B Quality 50 % 70% 90% 23


24 Flow cm 3 /min % A Quality 50 % 70% 90% 24


25 Flow cm 3 /min % 7.5 B/2.5 A Quality 50 % 70% 90% 25


26 Flow cm 3 /min % 5 B/ 5 A % E Quality 50 % 70% 90% 26
27 Remarks: N 2 Foam of blended B:A is stronger than B or A B creates weaker foam, more segregation than A. A creates stronger foam than B but weaker than blend 1% 5/5 B/A % E - of ultra low tension- creates strong foam, and no segregation under studied conditions. The sizes of frit studied produced practically insignificant differences among test results 27
28 Porous media vs parallel plate According to Falls et al. (1989) four components of viscosity can be listed: (1) Newtonian viscosity of any liquid slugs between gas bubbles (2) Resistance of interface deformation, viscous resistance of liquid between the foam bubbles and capillary wall (3) Surface traction from surface tension gradient in surfactant concentration (4) Pore constrictions resistance Zhang et al. (2009) Suggested the most important terms are (2) and (4) Test results from Foam Generation in parallel plates and sand packs are consistent with work done by Falls et al.: The contribution of pore constrictions to the viscosity of foam was observed when Porous media and Parallel plate test results were compared 28
29 Porous media vs parallel plate : Sand pack and glass plates Viscosity (cp) Sand pack n=-0.81 n=-0.45 Apparent shear rate in sand pack 12 u / 75 k SP Silica sand: 44 darcy Foam quality 80% By Andres Parallel plates Shear rate (1/s) Shear thinning including pore constriction -1 < n=-0.81 <-1/3 Falls et al. (1989) Shear thinning without pore constriction -2/3 < n=-0.45 <-1/3 Apparent shear rate in parallel plates PM 6 u / Dx Parallel plates: Aperture 250 mm Frit: 90 mm Foam quality 88% By Angelica 29
30 Conclusions Surfactant with potential to recover oil produced strong foams in sand packs at reservoir temperature. The formulation is robust in concentrations from 0.14 to 1.12% in seawater. Foam strength is recovered after recovering all the crude oil. Parameters of a foam model were fitted using experimental data in a wide range fractional flows, permeabilities and flow rates The foam is strong not only in porous media, but fractures represented by parallel plates. Future studies Foam in parallel plates should be evaluated in presence of oil, different temperatures and concentrations. The modeling of foam in porous media and fracture should be combined to simulate the performance of foam in the field. 30
31 Acknowledgements : PEMEX End of Presentation 31
32 Sandpack Internal-Tap Locations Sieve Mesh Rubber stopper Rubber stopper 5 1/2 Internal Taps 6 6 Second Tap Silica sand Mesh First Tap Sieve Mesh Rubber stopper 5 1/2 Rubber stopper 32
33 k f rg k 0 rg Sw 1 1 S S gr wc S wc ng 33
34 Apparent viscosity (cp) Parameters for the model (observation comparison and suggestion) Foam strength comparison with previous formulation (B+A 1 2:1) Shown as continuous black line Foam quality 80% ft/day Previous formulation at the same shear rate Total flow rate (cm 3 /min) F 4 u g / k s See Appendix A epv This function fits to all the values of permeability studied 100 darcy, 44 darcy, 8 darcy and 2 darcy Apparent shear rate (Carreau, 1997) 12 ug / 75 k ug / k F u g / k s epv 34
35 Apparent viscosity (cp) Foam quality 80% ft/day 0.5% B + 0.5% A % E Previous recommended formulation Total flow rate (cm 3 /min) 35
36 Shear thinning including pore constriction Shear thinning without pore constriction -1 < n-=-0.81 <-1/3-2/3 < n-=-0.45 <-1/3 Falls et al. (1989) 36

37 Sample I II III IV V VI VII VIII IX X XI SS in SW FB Surfactant solution in seawater Formation Brine 37
38 Abstract: A formulation to obtain ultralow IFT for EOR application is evaluated to be transported as a foam in a fractured porous media. The evaluation process includes tests from room up to reservoir temperature 120ºC in sandpacks, rubblized porous media and parallel plates. Surfactant solutions used were prepared in seawater. Experimental results were used to fit parameters of a mathematical model to describe the foam using the mobility reduction factor approach. The experimental study includes, shear thinning effect, dependence on quality, temperature, permeability, presence of oil and surfactant concentration. 38
39 Sand was treated to be oil wet, then equilibrated with synthetic live oil for couple of days and then contacted either formation brine or Surfactant solution in sea water Silica sand grains were treated to be oil-wet Using Dichloro octamethyl tetrasiloxane Cl Si O Si O Si O Si Cl Si O Si O Si Si Hydrophilic OH OH OH OH OH Si Si Si OH O O OH O Si Si Si O O Si O O O O O O O O O O O O O Si Si Si Si Si Si Si Si 2 HCl 39
40 Glass micro channels were treated to be oil-wet Dichlorodimethylsilane Si Si Cl Cl Cl Cl OH OH OH OH OH OH Hydrophilic Si Si Si O O O O O O Si Si Si Si 6 HCl Hydrophobic Si Si Si O O O O O O Si Si Si Si O O O O O O O Si Si Si Si 40
41 Screening of Surfactants for foam applications Surfactant blend should be tolerant to divalent ions. Should be stable in the range of Temperature of interest (25 C-120 C) In tests of front dilution should not precipitate. Filterability test must demonstrate unplugging. 41


42 IFT of formulations with added N and L { surface active} 500 mm 7.5B/ 2.5 A 0.15% S61 7.5B/ 2.5 A 0.04% N58 5 B/ 5 A 0.04% N58 5 B/ 5 A 0.11% N58 5B/ 5 A % N58 *IFT in Dynes/cm in Seawater at 100 C 5 B/ A % C16 ** 5 B/ 5 A 0.12% L38 4.3E-1 3E-1 2E-3 2E-2 3E-2 2.2E-2 1E-3 42
43 Transient experiments (qualitative) %Gas Saturation Pressure Drop (psi) cm3/min upward flow PV (Gas) Apparent Viscosity (cp) PV (Gas)
44 Apparent Viscosity (cp) Effect of Oil on Foam Strength at 70% quality, 94 C_Part 2 of 3 Total flow rate 1.87 cm 3 /min (ca 19.4 ft/day) Injection of 5% PV of oil during co injection Tap 1 Tap PV (Gas) 44
45 Apparent viscosity (cp) Effect of Oil on Foam Strenght at 75% quality, 94 C _Part 1 of 3 Total flow rate 0.78 cm 3 /min (ca 8 ft/day) Injection of 5% PV Oil during Co injection Tap 1 TAP Pore Volumes (Gas) 45

46 Foam experimental set up for high temperature 46
47 Apparent viscosity (cp) Foam Strength Shear thinning effect C AOS LB+C AOS (2:1) 1000 LB+C 14 AOS+BTC (13:2:1) 1 ft/day CTAB+NapTS (1:1) LB+C AOS+BTC (13:2:1) flow rate cm 3 /min Comparison of foam strength for different surfactants at 94 C and 1% total surfactant concentration in a sand pack, using qualities between 60-70%. Straight lines are for power law fit ( n ca - 0.8) 47
48 Apparent Viscosity (cp) Minimum velocity to foam F 5 F 6 k 1 u u ref 1 epcapepn 1 u ref u epn Assumption: epcap = epn. using a value for epcap= LB+AOS 1000 LB+AOS+TAB 100 CTAB+NapTS 10 ft/day Total flow (cm 3 /min) Results are consistent with observation done by Cheng et al (2000), where he establish a relationship with the shear thinning exponent and the parameter epcap 1 1 epcap Simulation of the foam viscosity using the mobility reduction factor approach. The symbols are experimental data at gas quality close to used in the simulation of 70%. 48
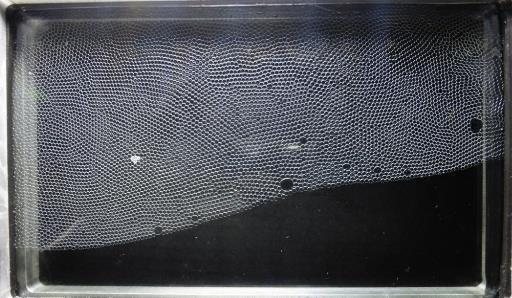
49 1000 m Frames from inlet section during horizontal flow 100 m ~30 Sec time interval 10 Sec Foam Surfactant solution Oil 49


50 2-D Model* Mimicking a Fracture for Study of Foam 50 50
51 Pressure Drop (psi) % Gas saturation Pressure Drop (psi) % Gas saturation 9.4 cm3/min Downward flow 70 Transient experiments (upward vs downward) PV (Gas) cm 3 /min PV (Gas)
52 DP (Psi) Effect of Quality Foam in 250 mm aperture parallel plates 25 C 60 um Frit B : 2.5 A Foam Quality 88% 71% 52% cm 3 /s 52
53 For More Information See: José Luis López-Salinas (Thesis, 2013) Transport of Components and Phases in a Surfactant/Foam EOR Process for a Giant Carbonate Reservoir. Estimation of Parameters for the Simulation of Foam Flow through Porous Media. Part 1: The Dry-Out Effect Kun Ma, Jose L. Lopez-Salinas, Maura C. Puerto, Clarence A. Miller, Sibani Lisa Biswal, and George J. Hirasaki* Energy Fuels, 2013, 27 (5), pp DOI: /ef302036s Publication Date (Web): May 3, 2013 Copyright 2013 American Chemical Society Non-uniqueness, Numerical Artifacts, and Parameter Sensitivity in Simulating Steady-State and Transient Foam Flow Through Porous Media Kun Ma Rouhi Farajzadeh Jose L. Lopez-Salinas Clarence A. Miller Sibani Lisa Biswal George J. Hirasaki Transp Porous Med (2014) 102: DOI /s SPE SPE MS 53