NDT Deflection Measurement Devices: Benkelman Beam (BB) Sri Atmaja P. Rosyidi, Ph.D., P.E. Associate Professor
|
|
|
- Betty Sanders
- 5 years ago
- Views:
Transcription
 Sri Atmaja P. Rosyidi, Ph.D., P.E.")
1 NDT Deflection Measurement Devices: Benkelman Beam (BB) Sri Atmaja P. Rosyidi, Ph.D., P.E. Associate Professor
2 NDT Deflection Measurement Devices on Pavement Structure NDT measurement of pavement surface deflections provides information that can be used for the structural evaluation of new or in service pavements. These deflection measurements may be used to determine the following pavement characteristics: Modulus of each layer. Overall stiffness of the pavement system. Load transfer efficiency of PCC pavement joints. Modulus of subgrade reaction. Effective thickness, structural number, or soil support value. Bearing capacity or load carrying capacity of a pavement.
3 NDT Deflection Measurement Devices: Non continuous Static Device, Semi continuous Static Device, Steady State Dynamic Device, Impulse Device.
4 Concept of Deflection Measurement and related Engineering Properties Keyword = Deflection Measurement What is the deflection? And its implementation on pavement investigation (assessment)?
5 Questions to Think About Deflection? Stiffness? Elastic Modulus? How do these parameters correlate each other?
6 Questions to Think About Stress and strain: What are they and why are they used instead of load and deformation? Elastic behavior: When loads are small, how much deformation occurs? What materials deform least? Plastic behavior: At what point do dislocations cause permanent deformation? What materials are most resistant to permanent deformation? Toughness and ductility: What are they and how do we measure them? 6
")

7 Spring Stiffness Δx Compression spring Tension spring F = k (Δx) where k = spring constant Δ x = spring stretch F = applied force F F 7
8 Stiffness (Spring) Deflection is proportional to load, F = k ( x) Load (N or lb) slope, k Deflection (mm or in.) k load deflection Slope of Load Deflection curve: The Stiffness
9 Stiffness (Solid Bar) Stiffness in tension and compression Applied Forces F, length L, cross sectional area, A, and material property, E (Young s modulus) F F L F A End view F k F FL AE L k δ AE L Stiffness for components in tension compression E is constant for a given material E (steel) = 30 x 10 6 psi E (Al) = 10 x 10 6 psi E (concrete) = 3.4 x 10 3 psi E (Kevlar, plastic) = 19 x 10 3 psi E (rubber) = 100 psi
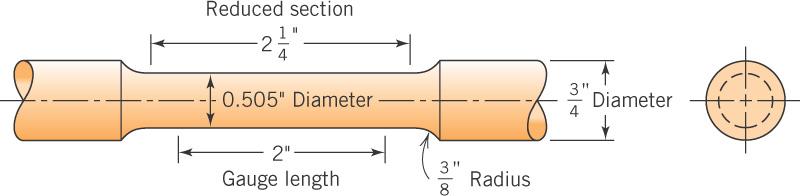
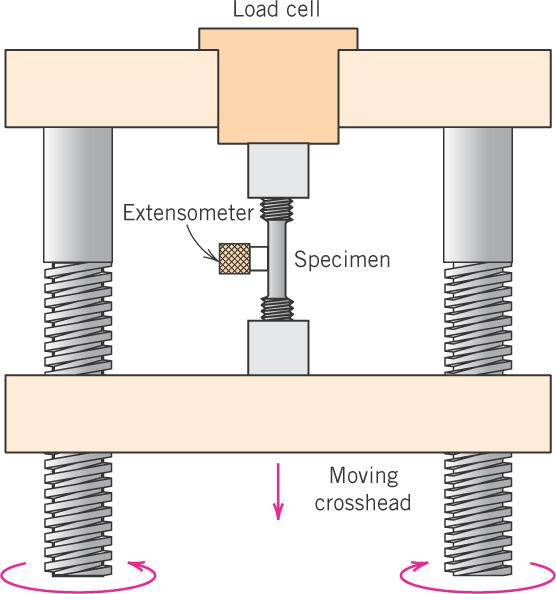
10 Stress-Strain Test specimen machine 10

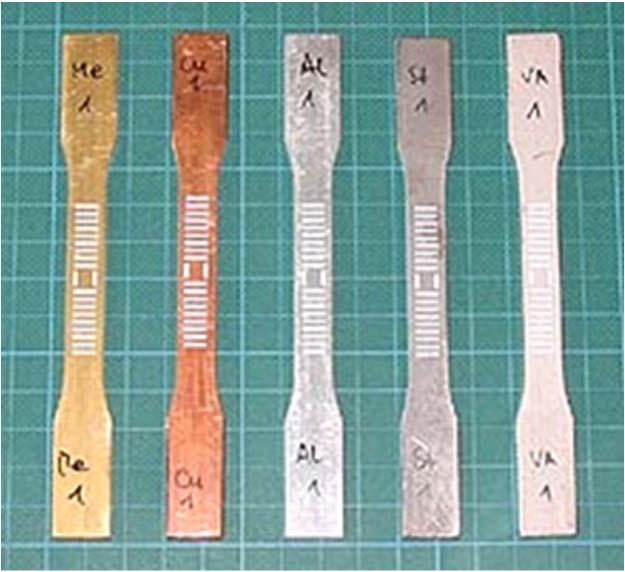
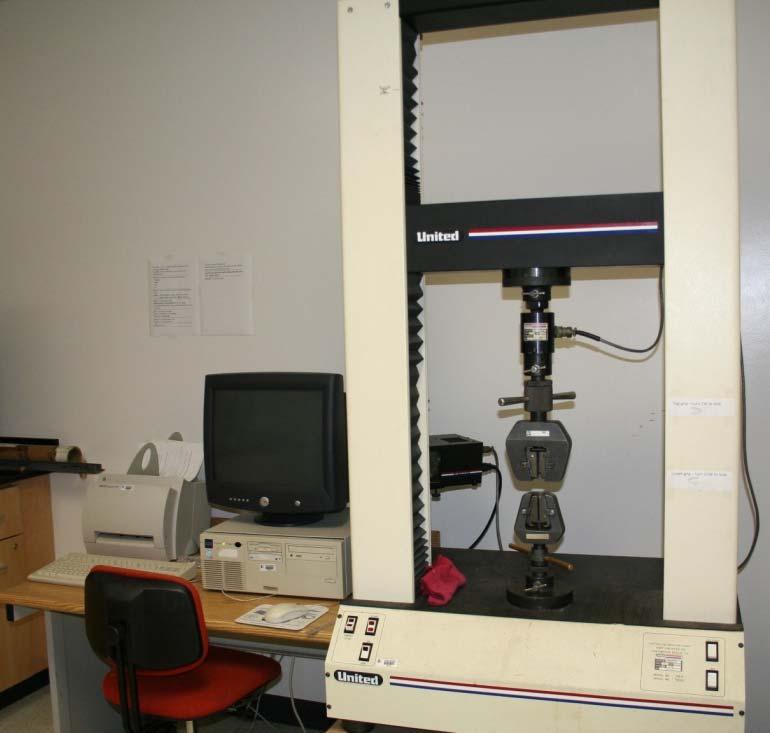
11 Tensile Test 11
12 Important Mechanical Properties from a Tensile Test Young's Modulus: This is the slope of the linear portion of the stress-strain curve, it is usually specific to each material; a constant, known value. Yield Strength: This is the value of stress at the yield point, calculated by plotting young's modulus at a specified percent of offset (usually offset = 0.2%). Ultimate Tensile Strength: This is the highest value of stress on the stress-strain curve. Percent Elongation: This is the change in gauge length divided by the original gauge length. 12
13 Terminology Load - The force applied to a material during testing. Strain gage or Extensometer - A device used for measuring change in length (strain). Engineering stress - The applied load, or force, divided by the original cross-sectional area of the material. Engineering strain - The amount that a material deforms per unit length in a tensile test.
14 Elastic Deformation 1. Initial 2. Small load 3. Unload bonds stretch return to initial F F Linearelastic Elastic means reversible. Non-Linearelastic 14
15 Plastic Deformation (Metals) 1. Initial 2. Small load 3. Unload bonds stretch & planes shear planes still sheared elastic + plastic plastic F F Plastic means permanent. linear elastic plastic linear elastic 15
16 Plastic Deformation (permanent) From an atomic perspective, plastic deformation corresponds to the breaking of bonds with original atom neighbors and then reforming bonds with new neighbors. After removal of the stress, the large number of atoms that have relocated, do not return to original position. Yield strength is a measure of resistance to plastic deformation. 16
17 17
18 Permanent Deformation Permanent deformation for metals is accomplished by means of a process called slip, which involves the motion of dislocations. Most structures are designed to ensure that only elastic deformation results when stress is applied. A structure that has plastically deformed, or experienced a permanent change in shape, may not be capable of functioning as intended. 18
19 Yield Strength, y tensile stress, Elastic+Plastic at larger stress y tensile stress, Elastic initially permanent (plastic) after load is removed p engineering strain, plastic strain p = engineering strain, 19
20 ultimate tensile strength UTS Stress-Strain Diagram 3 necking yield strength σ y E E ε σ ε 1 2 E ε Plastic Region Elastic Region 2 σ y ε 1 4 Strain Hardening Strain ( ) ( L/Lo) Fracture Elastic region slope =Young s (elastic) modulus yield strength Plastic region ultimate tensile strength strain hardening fracture 5
21 Stress-Strain Diagram (cont) Elastic Region (Point 1 2) The material will return to its original shape after the material is unloaded( like a rubber band). The stress is linearly proportional to the strain in this region. σ E ε σ : Stress(psi) E : Elastic modulus (Young s Modulus) (psi) : Strain (in/in) ε or E Point 2 : Yield Strength : a point where permanent deformation occurs. ( If it is passed, the material will no longer return to its original length.) σ ε
22 Stress-Strain Diagram (cont) Strain Hardening If the material is loaded again from Point 4, the curve will follow back to Point 3 with the same Elastic Modulus (slope). The material now has a higher yield strength of Point 4. Raising the yield strength by permanently straining the material is called Strain Hardening.
23 Stress-Strain Diagram (cont) Tensile Strength (Point 3) The largest value of stress on the diagram is called Tensile Strength(TS) or Ultimate Tensile Strength (UTS) It is the maximum stress which the material can support without breaking. Fracture (Point 5) If the material is stretched beyond Point 3, the stress decreases as necking and non uniform deformation occur. Fracture will finally occur at Point 5.
2003 Brooks/Cole, a division of Thomson Learning, Inc.")
24 The stress-strain curve for an aluminum alloy. (c)2003 Brooks/Cole, a division of Thomson Learning, Inc. Thomson Learning is a trademark used herein under license.
25 Tensile Strength, TS After yielding, the stress necessary to continue plastic deformation in metals increases to a maximum point (M) and then decreases to the eventual fracture point (F). All deformation up to the maximum stress is uniform throughout the tensile sample. However, at max stress, a small constriction or neck begins to form. Subsequent deformation will be confined to this neck area. Fracture strength corresponds to the stress at fracture. Region between M and F: Metals: occurs when noticeable necking starts. Ceramics: occurs when crack propagation starts. Polymers: occurs when polymer backbones are aligned and about to break. 25
26 Engineering Stress Tensile stress, : Shear stress, : Ft Ft F Area, A Area, A Fs Ft F t A o original area before loading F s A o Fs F Ft Stress has units: N/m 2 or lb/in 2 26
27 Example 1 Tensile Testing of Aluminum Alloy Convert the change in length data in the table to engineering stress and strain and plot a stress-strain curve.


28 Example 1 SOLUTION
29 Ductility, %EL Ductility is a measure of the plastic deformation that has been sustained at fracture: l lo % EL x100 l f o Engineering tensile stress, A material that suffers very little plastic deformation is brittle. smaller %EL (brittle if %EL<5%) larger %EL (ductile if %EL>5%) Engineering tensile strain, Another ductility measure: % AR x100 Ductility may be expressed as either percent elongation (% plastic strain at fracture) or percent reduction in area. %AR > %EL is possible if internal voids form in neck. Lo Ao A A f o A o A f Lf 29

30 Toughness is the ability to absorb energy up to fracture (energy per unit volume of material). Toughness Lower toughness: ceramics Higher toughness: metals A tough material has strength and ductility. Approximated by the area under the stress-strain curve. 30
31 Toughness Energy to break a unit volume of material Approximate by the area under the stress-strain curve. Engineering tensile stress, smaller toughness (ceramics) larger toughness (metals, PMCs) smaller toughnessunreinforced polymers Engineering tensile strain, 21
32 Linear Elastic Properties F Hooke's Law: = E Poisson's ratio: metals: ~ 0.33 ceramics: ~0.25 polymers: ~0.40 x y F simple tension test E 1 Linearelastic Modulus of Elasticity, E: (Young's modulus) Units: E: [GPa] or [psi] : dimensionless 32
33 Engineering Strain Strain is dimensionless. 33
34 Axial (z) elongation (positive strain) and lateral (x and y) contractions (negative strains) in response to an imposed tensile stress. 34
.")
35 True Stress and True Strain True stress The load divided by the actual cross-sectional area of the specimen at that load. True strain The strain calculated using actual and not original dimensions, given by ε t ln(l/l 0 ). The relation between the true stresstrue strain diagram and engineering stress-engineering strain diagram. The curves are identical to the yield point.
36 Stress-Strain Results for Steel Sample 36
37 Example 2: Young s Modulus - Aluminum Alloy From the data in Example 1, calculate the modulus of elasticity of the aluminum alloy.

38 Example 2: Young s Modulus - Aluminum Alloy - continued Use the modulus to determine the length after deformation of a bar of initial length of 50 in. Assume that a level of stress of 30,000 psi is applied.
39 Young s Moduli: Comparison Diamond 800 Eceramics 600 Si carbide 400 Tungsten Al oxide Carbon fibers only Molybdenum Si nitride E(GPa) Steel, Ni CFRE( fibers)* 200 Tantalum <111> Platinum Si crystal Cu alloys <100> Aramid fibers only 100 Zinc, Ti 80 Silver, Gold Aluminum Glass-soda AFRE( fibers)* 60 Glass fibers only Magnesium, 40 Tin GFRE( fibers)* Concrete 20 GFRE* 10 9 Pa Composite data based on CFRE* Graphite GFRE( fibers)* 10 8 CFRE( fibers)* 6 AFRE( fibers)* Polyester 4 PET PS PC Epoxy only Metals Alloys Graphite Ceramics Semicond Polymers PP HDPE PTFE Composites /fibers Wood( grain) > Emetals >> Epolymers reinforced epoxy with 60 vol% of aligned carbon (CFRE), aramid (AFRE), or glass (GFRE) fibers. 0.2 LDPE 39
 the maximum load. The diameter at maximum load is 0.497 in. and at fracture is 0.398 in. Example 3 SOLUTION")
40 Example 3: True Stress and True Strain Calculation Compare engineering stress and strain with true stress and strain for the aluminum alloy in Example 1 at (a) the maximum load. The diameter at maximum load is in. and at fracture is in. Example 3 SOLUTION
41 Strain Hardening An increase in y due to plastic deformation. y 1 y 0 large hardening small hardening unload reload T C T n true stress (F/A) hardening exponent: n=0.15 (some steels) to n=0.5 (some copper) true strain: ln(l/lo)
42 Strain Hardening (n, K or C values) T C T n true stress (F/A) hardening exponent: n=0.15 (some steels) to n=0.5 (some copper) true strain: ln(l/lo) 42
43
44
45 02. Benkelman Beam Reference: ASTM D AASHTO T SNI 2416: 2011 Introduction: History of Benkelman Beam Concept on Pavement Measurement Equipment and Field Procedure Data Analysis

46 History of Benkelman Beam Alvin Carlton Benkelman, Sr. A.C.Benkelman devised the simple deflection beam in 1953 for measurement of pavement surface deflection. It is widely used all over the world evaluation of the requirements of strengthening of flexible pavements. This method is done to lay down a uniform procedure for the design of flexible overlays or per I R C: here a tentative guideline was published by the Indian road congress under the title Tentative Guidelines for strengthening of flexible road pavements using Benkelman beam Deflection technique.
47 Theoretical Concept of BB Due to traffic or repetition of load wearing course of the pavement surface gets deteriorated. In order to overcome this problem performance analysis of the pavements surface is chosen for assessing the pavement quality. Performance of flexible pavements is closely related to the elastic deformation of pavement under the wheel loads. The deformation or elastic deflection of pavement under a given load depends upon sub grade soil type, its moisture content and compaction, the thickness and quality of the pavement course, drainage conditions pavement surface temperature etc.

48 BB Field Measurement
49 BB Field Measurement