Crystalline Silicon PV Technology
|
|
|
- Eric Ferguson
- 5 years ago
- Views:
Transcription
1 Crystalline Silicon PV Technology April 4, 2013 Principles and Varieties of Solar Energy (PHYS 4400) The University of Toledo, Department of Physics and Astronomy
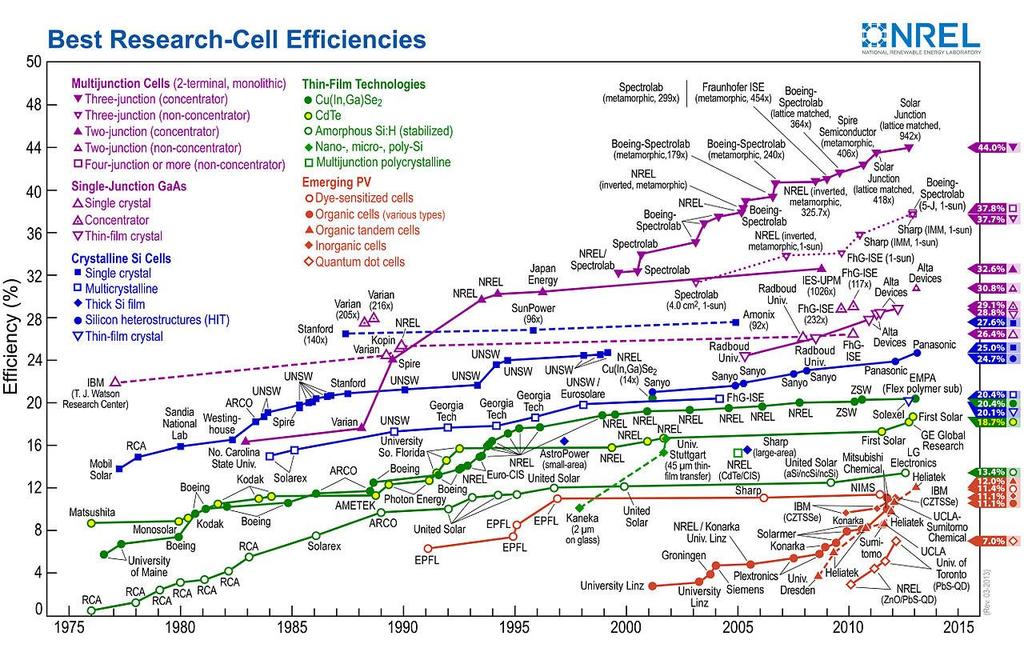
2 Crystalline/Polycrystalline Silicon PV Technology (some facts) Crystalline silicon PV cells are used in the largest quantity of all types of panels on the market, representing about 85% of the world total PV cell production in The highest energy conversion efficiency reported so far for a research-scale crystalline silicon PV cell is 25%. Standard industrial cells are limited to (polycrystalline Si) ~16% with the exception of certain high-efficiency cells based on monocrystalline Si capable of efficiencies > 20%. High-efficiency research PV cells have advantages in performance but may be unsuitable for low-cost production due to their complex structures and the lengthy manufacturing processes required for fabrication. World annual production of PV cells reached more than 7.9 GWp in 2008, 10.6 GWp in 2009, 18.6 GWp in 2010, 28 GWp in 2011, and 30 GWp in Average annual growth rate in PV cell production/installation over the last decade has been ~40% (CAGR). Cumulative installed capacity is ~ 101 GW. Electrical power generated by all PV systems around the world is ~0.1% of the total world electricity generation so the penetration of PV remains low.
3 Aside: what is Wp? The use of units Wp, which stands for Watt-peak, is commonplace in reference to the power generating capacity of a PV system. Wattpeak refers to the power generated by a PV module or system under standard illumination conditions of 1000 W/m 2. Actual illumination (insolation) levels vary widely, of course, depending on latitude, time of day, and weather conditions. Although the cost per Watt or cost per Watt-peak is a common assignment of cost for a module or system, one must determine the predicted and/or actual energy generated by a system to properly assess the economics of a specific system.
4 Typical mono- and polycrystalline silicon solar cells (upper), and simplified crosssection of a commercial monocrystalline silicon solar cell (lower) ( 2010 Sharp). T. Saga, NPG Asia Mater. 2(3) (2010)
5 Production of Standard Silicon PV Cells Standard cells are produced using monocrystalline and polycrystalline boron-doped (p-type) silicon substrates. Cells are now commonly 156 mm (6 inches) square, respectively. Monocrystalline solar cells are typically produced from (single-crystal) pseudo-square silicon wafer substrates cut from column ingots grown by the Czochralski (CZ) process. Polycrystalline cells, on the other hand, are made from square silicon substrates cut from polycrystalline ingots grown in quartz crucibles. The front surface of the cell is covered with micrometer-sized pyramid structures (textured surface) to reduce reflection loss of incident light. An anti-reflection coating (ARC) of silicon nitride (SiN x ) or titanium oxide (TiO x ) is overlayed on the textured silicon surface to further reduce reflection loss. A highly phosphorous doped n+ region is produced on the front surface of boron-doped p-type substrates to form p n junctions. T. Saga, NPG Asia Mater. 2(3) (2010)
6 The value chain for crystalline silicon solar cells and modules is longer than that for thin-film solar cells: There are generally three industries related to crystalline silicon solar cell and module production: 1. metallurgical and chemical plants for raw material silicon production; 2. monocrystalline and polycrystalline ingot fabrication and wafer fabrication by multi-wire saw; 3. solar cell and module production. The cost of PV production is divided roughly in half between solar cell module production and balance-of-system fabrication, which includes the inverter, cables and installation. The fabrication cost for solar cell modules includes the cost of the silicon substrate (50%), cell processing (20%) and module processing (30%). The cost share is therefore strongly affected by the market price for poly-silicon feedstock, and reducing the cost of the silicon substrate remains a critical issue for the PV industry. T. Saga, NPG Asia Mater. 2(3) (2010)

7 Production of metallurgical grade Si From Wikipedia


8 Purification by Physical Methods 400 kgs From Wikipedia
9 From Wikipedia


10 Purification by Gas Phase Chemical Methods From Wikipedia
11 From quartz rock to hyper-pure poly Si ( %) Hemlock Semiconductor Group (HSC) manufactures highpurity poly Si feedstock for the manufacture of solar and semiconductor products. HSC s manufacturing uses trichlorosilane, which is converted to polysilicon in a chemical vapor deposition (CVD) reactor employing a U-rod. All chemicals are captured and recycled. Impurities are 1 part in 10 11, intrinsic (i.e. impurity) dopant concentration of ~10 12 cc -1, or 1 ppt (i.e. 1 part per trillion)
, and Mitsubishi Materials Corporation (12.")

12 Hemlock Semiconductor Group Owned by Dow Corning Corporation (63.25%), Shin-Etsu Handotai (24.5%), and Mitsubishi Materials Corporation (12.25%) Began operation in 1961 in Hemlock, Michigan Leading world supplier of high purity polycrystalline silicon to the semiconductor and solar industries Currently completing several major expansions in Michigan and Tennessee 36,000 metric ton capacity by

13 Poly Si shortage in mid 2000s.module prices way down now (2013), ~< $1/Wp US net exporter in PV in 2010 (+1.9 B$); $2.5 billion was polysilicon.


14 From Raw Silica (SiO 2 ) to Final Cell T. Saga, NPG Asia Mater. 2(3) (2010)


15 Comparison of Manufacturing Sequence For X-Si and Thin Film Courtesy of Brian Keyes, NREL Crystalline Silicon Modules Thin Film Modules 45-60% yield of Si Ref: Overview and Challenges of Thin Film Solar Electric Technologies, Harin S. Ullal, Ph.D., NREL 2008
16 Thin film PV uses less semiconductor material Courtesy of Brian Keyes, NREL Amount of material needed for 1 kw output (more area for less efficiency).
 ( 2010 Sharp). T. Saga, NPG Asia Mater.")
17 Standard Silicon PV Cells Typical mono- and polycrystalline silicon solar cells (upper), and simplified crosssection of a commercial monocrystalline silicon solar cell (lower) ( 2010 Sharp). T. Saga, NPG Asia Mater. 2(3) (2010)
18 Standard Silicon PV Cells (cont.) Back-surface p+ field (BSF) regions are formed on the back surface to suppress recombination of minority carriers. The BSF regions are usually formed by firing screen-printed aluminum paste in a belt furnace. The minority carriers (electrons) generated in the silicon bulk and diffusion layers are collected by silver contacts (electrodes) formed as gridlines connected by a bus bar to form a comb-shaped structure. The back contact is usually an aluminum layer which is connected the adjacent cell via soldered copper or printer silver interconnects. The front contact is formed using screen-printed silver paste applied on top of the ARC layer, with fire through technology, which also produces the BSF The screen-printed front silver contact prepared by firing to penetrate the ARC is one of the most important techniques for large-volume fabrication of modern xstal Si cells. T. Saga, NPG Asia Mater. 2(3) (2010)


 on the top surface.")
19 BSF in Silicon PV Cells Surface recombination can have a major impact both on the short-circuit current and on the open-circuit voltage. High recombination rates at the top surface particularly impact J SC since the top surface generates a high concentration of carriers. Lowering the top surface recombination is typically accomplished by reducing the number of dangling silicon bonds at the top surface by growing a "passivating" layer (usually silicon dioxide) on the top surface. Recombination at the back surface become inreasingly important for thin cells with long minority carrier lifetimes. animation BSF
20 Standard Silicon PV Cells The industrial goal for PV power is to reduce the electricity generation cost to the equivalent of that for commercial grid electricity. The energy conversion efficiency of solar cells is another important issue because the efficiency influences the entire value-chain cost of the PV system, from material production to system installation. The solar cell efficiency is limited by the three loss mechanisms: photon losses due to surface reflection, transmission through c-si, and back contact absorption; minority carrier (electrons in the p-region and holes in the n-region) loss due to recombination in the silicon bulk and at the surface; and heating joule loss due to series resistance in the gridlines and busbars, at the interface between the contact and silicon, and in the silicon bulk and diffusion region. In the design of solar cells, these losses are minimized without lowering the productivity of the solar cells. T. Saga, NPG Asia Mater. 2(3) (2010)
21 Standard Silicon PV Cells The basic cell structure used in current industrial crystalline solar cells were developed for space and terrestrial use in the 1970s: lightly doped n+ layer ( μm) for better blue-wavelength response a BSF formed by a p/p+ low/high junction on the rear side of the cell a random pyramid-structured light-trapping surface an ARC optimized with respect to the refractive index of the glue used to adhere to it. The efficiency of monocrystalline cells for space use is in the range of 14 16% under 1 sun AM0 test conditions, equivalent to 15 17% at AM1.5. These standard structures for crystalline silicon cells are still used in standard industrial crystalline cells, which offer efficiencies in the range of 14 17%. T. Saga, NPG Asia Mater. 2(3) (2010)
. T. Saga, NPG Asia Mater.")
22 Key technologies needed to realize efficiencies > 20% were developed in the 1980s and 90s, and the latest high-efficiency crystalline silicon cells possess most of these features (Table 1). T. Saga, NPG Asia Mater. 2(3) (2010)

 96")
23 T. Saga, NPG Asia Mater. 2(3) (2010)

24 Passivated Emitter Rear Localized (PERL) cell: A research cell Front and rear surface passivation, inverted-pyramid light-trapping surface, a rear localized p+ layer (BSF), a double-layer ARC, p-type float zone monocrystalline substrate. The bulk minority carrier lifetime > 1 ms. V oc = 706 mv, J SC = 42.7 ma cm 2, FF = and η = 25.0% for a 4 cm 2 cell [4]. J SC is close to limit for absorption/collection in the emitter and base. η= 24.7% was reported almost 10 years ago, and record of 25.0% (University of New South Wales - UNSW) in 2009 was from remeasurement of the same cell. Full PERL design is not easy to apply to low-cost industrial production because of the necessity for multiple photolithography steps. Expensive silicon PV cells for space applications have a similar structure to the PERL cell. T. Saga, NPG Asia Mater. 2(3) (2010)
25

26 Heterojunction with intrinsic thin layer (HIT) cell: Developed for manufacturing; has thin amorphous p- and n- layers and intrinsic amorphous layers on the front and rear surfaces of a CZ n-type monocrystalline-silicon substrate. Best output parameters are V oc = 729 mv, J SC =39.5 ma-cm 2, FF = 0.800, and η = 23.0% for a large cm 2 cell. Voc is improved by large bandgap of the front amorphous silicon layer and the high interface quality between the a-si and x-si substrate. Low temperature coefficient of 0.30% K 1 at P max is advantage (~0.45% K 1 for other x-si cells). TCO ARC reduces sheet resistivity of front a-si layers. Lower Jsc in comparison to other high-efficiency Si cells due to weaker blue response. Generation/collection in the front a-si layers and bulk Si is lower due by the effects of the lower transparency of the TCO layer compared to other ARCs and/or the lower internal quantum efficiency of the amorphous layers. T. Saga, NPG Asia Mater. 2(3) (2010)
 cell developed for space PV in late 1970s.")
27 Back Contact Back Junction (BC-BJ) cell: Interdigitated n- and p-doped regions and n and p contacts on the back surface. Original BC-BJ cell, called the FSF cell or interdigitated back contact (IBC) cell developed for space PV in late 1970s. The BC-BJ-structured point contact (PC) cell developed by Stanford University in the 1980s had η > than 20%. SunPower made BC-BJ cells for unmanned aircraft and solar race cars in the 1990s, followed by large-scale PV plants in 2000s. Best efficiency for a large-area industrial BC-BJ cell is 23.4%. The BC-BJ cell has front and rear surface passivation layers, a random-pyramid light-trapping surface, FSF, interdigitated n- and p-doped regions on the back surface, n and p contact gridlines on n- and p-doped regions, a single-layer ARC and CZ n-type single-crystalline silicon substrate with a minority carrier lifetime > 1 ms. Of all silicon PV modules on market at this time, only those based on BC-BJ cells provide the possibility of module efficiencies exceeding 20%. BC-BJ cells have no gridlines or busbars shading, a front surface with good passivation and improved asthetics due to the absence of front electrodes, which permits freedom in the design of back contacts. T. Saga, NPG Asia Mater. 2(3) (2010)


28 57 K panels, 100 acres, 10 MW, largest in the world when completed in 2004 Freedom in design of back contact also provides advantages in module assembly, allowing the simultaneous interconnection of all cells on a flexible printed circuit. The low series resistance of interconnection formed by this type of surface-mount technology results in a high FF of 0.80, compared with around 0.75 for standard silicon PV cell modules.
. (b) EWT. Adapted from Ref. 25 ( 2008 IEEE). All figures reproduced with permission. T. Saga, NPG Asia Mater.")
29 Emitter Wrap Though and Metal Wrap Through Cells Schematics of back-contact solar cell structures. (a) MWT. Adapted from Ref. 26 ( 2008 WIP Munich). (b) EWT. Adapted from Ref. 25 ( 2008 IEEE). All figures reproduced with permission. T. Saga, NPG Asia Mater. 2(3) (2010)
30 Reducing the amount of Si in the cell, by reducing the silicon wafer thickness ( 2010 Sharp)
31


32

33
34 Example c-si modules SunPower 240: df&blobheadername3=content- Disposition&blobheadervalue3=attachment%3B+filename%3Dsp_e19_240ewh_ds_en_l tr_p_366.pdf&blobkey=id&blobtable=mungoblobs&blobwhere= &ssbina ry=true SunPower X21-345: Type&blobheadername2=Content- Disposition&blobheadervalue1=application%2Fpdf&blobheadervalue2=inline%3B+filena me%3dspr-x21-335%2bspr-x21-345%2bdatasheet.pdf&blobkey=id&blobtable=mungoblobs&blobwhere= &ssbinary=true Isofoton ISF-250: 2.pdf