RESEARCH PROJECT No. 46. Optimizing Structure-Property Relationships In Ductile Iron
|
|
|
- Juliet Paulina Carroll
- 5 years ago
- Views:
Transcription
1 Ductile Iron Society RESEARCH PROJECT No. 46 Optimizing Structure-Property Relationships In Ductile Iron Dr. John M. Tartaglia Element Materials Technology, Wixom, MI USA Richard B. Gundlach Element Materials Technology, Wixom, MI USA George M. Goodrich Element Materials Technology, Wixom, MI USA DUCTILE IRON SOCIETY Issued by the Ductile Iron Society for the use of its Member Companies Not for General Distribution DUCTILE IRON SOCIETY Pearl Road, Suite 234 Strongsville, Ohio (440) AUGUST 2012
2 DIS RESEARCH PROJECT NO. 46 OPTIMIZING STRUCTURE-PROPERTY RELATIONSHIPS IN DUCTILE IRON By Dr. John M. Tartaglia, Richard B. Gundlach, and George M. Goodrich Element Materials Technology, Wixom, MI, USA August 2012 Keywords: Ductile iron, ferrite, pearlite, heat treatment, microstructure, strength, ductility ABSTRACT The purpose of this research study was to identify ways to achieve a higher combination of strength and ductility, by characterizing the relationships between the graphite-metal matrix, alloy content, and tensile properties in ductile iron. The characterization utilized standard physical metallurgical tools including tensile properties, optical microscopy and automated image analysis to measure ferrite content, grain size, nodule count, nodule size and nodularity. In addition to applying standard statistical parameters such as mean and standard deviation, the study employed Pearson correlation coefficient analysis, transmission electron microscopy, and x-ray diffraction. The overall objectives of the research were to: Identify chemical and matrix characteristics that might be used to optimize the relationship between graphite morphology, matrix, and mechanical properties. Optimize the control needed to produce the desired graphite and metal matrix relationships in a given section size to produce the desired mechanical properties. Improve the control and reduce the variation between mechanical properties measured in thin and heavy sections. The principal investigators initially analyzed representative sample data for grades and of ductile iron; the compositions and tensile properties were measured and supplied by ten commercial foundries. From the original 10 foundries, the investigators received samples of the two grades from four foundries and an additional source, so that all the samples could be analyzed in a consistent manner. A total of 53 samples were subjected to hardness and mechanical testing. A total of 26 samples were subjected to further testing for composition, microstructure, and strain hardening behavior. The results of the testing showed that the mechanical properties varied as expected with ferrite content. The strength increased as ferrite content decreased and ductility increased as ferrite content increased, and ferrite grains almost always touched graphite nodules. Manual and automated image analysis measurements of ferrite content showed excellent agreement. In addition, final work on selected samples from this study showed that the substructure of ductile iron ferrite grains as determined with x-ray diffraction or transmission electron microscopy does not appear to influence ductile iron mechanical properties. 1
3 This study also determined that the combination of high strength (>80 ksi ultimate and >55 ksi yield) and high elongation (>12%) occurred when ferrite content was between 35 and 60%, and the ferrite colonies were discontinuous. Furthermore, the study also correlated the mechanical properties and microstructures to copper, manganese, silicon, and copper + manganese contents. Subsequently, the authors investigated the desired alloy content relationship for developing these high strength-high elongation properties. An additional key objective was to investigate post solidification heat treatments to further optimize these composition-structure-property relationships. To characterize the relationships between the graphite-metal matrix, alloy content, and tensile properties in ductile iron, the study utilized statistical tools to compute mean and standard deviation, Pearson correlation coefficient analysis, Student t-testing, and design of experiments (DOE) methodology. The investigators conducted a DOE methodology where the following 5 key variables were investigated: section size (1-inch versus 3-inch) inoculation (ladle versus ladle plus in-stream) silicon content (nominally 2.2 versus 2.7 wt-%) manganese contents (0.2 versus 0.45 wt-%) copper content (0.3 versus 0.6 wt-%) All mechanical properties, including both strength and ductility, were lower in the 3 section size versus the 1 section size. Various statistical testing and DOE analysis showed that increasing Cu and/or Mn increased strength and hardness while decreasing ductility and toughness (UT) in both the 1 and 3 section sizes. In contrast, increasing Si decreased strength and increased ductility. However, varying Mn or Si was less effective than Cu in affecting the properties in the 1 section size. The authors recognize that all of these observations are consistent with the inherent knowledge that has developed during the lifetime of ductile iron. However, in this study the authors were able to begin the process of confirming and quantifying the relationships in a well-controlled dataset. Based on the results of this study, the principal investigators chose to validate the DOE by casting 1 Y-blocks of one of the DOE heats, which contained 2.6%Si, 0.3%Mn and 0.6%Cu. The results were almost precisely duplicated with equivalent compositions, microstructures, strengths and ductilities. The Principal Investigators also investigated post solidification heat treatments to further optimize these composition-structure-property relationships. Heat treatment trials were conducted by intercritically austenitizing and subjecting the samples to various cooling rates such as still air cool, forced air cool, and oil quenching, with the latter followed by tempering. The most promising results were obtained with a starting microstructure of 50% ferrite and 50% pearlite. After heat treatment, the measured mechanical properties far exceeded some of the study goals of >55 ksi YS, >80 ksi UTS and >12 % elongation. 2
4 Even though 12% minimum elongation was not achieved through heat treatment, the quench and temper heat treatments produced much higher strength and equivalent ductility than many of the standard as-cast grades with equivalent ductility. Mechanical properties obtained after intercritical austenitizing followed by either air cooling or quench and temper heat treatment were as follows: 65 to 85 ksi YS, 110 to 130 ksi UTS, and 8 to 9% elongation. INTRODUCTION Researchers have devoted a significant amount of work to understand the relationship between solidification cooling rate and mechanical properties of ductile iron 1-3. Significant work has also been conducted to relate some aspects of graphite morphology and mechanical properties 4. The factors that remain elusive are processing variables that influence mechanical property variations that occur in the matrix when the graphite morphology seemingly remains unchanged. ASTM A536 gives examples of the yield strength, tensile strength and elongation relationships expected in ductile cast iron. Table 1 below provides the information. Table 1: ASTM A536-84(2009) Tensile Requirements, minimum values Property Grade Grade Grade Grade Grade Tensile strength psi 60,000 65,000 80, , ,000 MPa Yield strength psi 40,000 45,000 55,000 70,000 90,000 MPa Elongation in 2 in. or 50 mm % Frequently, both castings and separately cast test bars will exhibit mechanical properties that are significantly better than the required minimum values shown in Table 1. One example is the information generated from testing a ferritic ductile iron casting expected to have mechanical properties that would be consistent with Grade in Table 1 above. The properties measured by the authors, shown in Table 2, 5,6 reveal that Grade properties were achieved. Table 2: Mechanical Properties and Microstructure for a Commercial Casting Ultimate Tensile Strength Yield Strength, 0.2% Offset % Elongation MPa ksi MPa ksi % % Pearlite % Ferrite % Nodularity The structure for this material is shown on the following page in Figure 1 5,6. 3


5 Figure 1. Etched microstructure for the iron with the properties in Table 2. To the knowledge of the authors, no comprehensive research work has been conducted to determine what is required to consistently achieve properties with this high amount of ferrite. The extraordinary properties shown in Table 2 were a prime motivation for extensively surveying the literature. A global review of the cast iron literature from 1900 and ductile iron literature from 1948 to the present was conducted. The focus was on discerning published mechanisms related to grain size and impurity content that also produced enhanced strength and ductility. Of the 38 papers that fit the search criteria, 9 were read in detail and common aspects identified. The Hall-Petch relationship 7-10 was confirmed in ferritic and austempered ductile iron. In both microstructures, examples were found where strength and ductility increased with smaller grain size. In addition, higher purity alloys and anisotropic dendritic structures were shown to enhance both strength and ductility. The literature review showed that it was difficult to compare the results in the various papers because the alloys, processes, and metrics differed. Table 3 contains a comparison of the strengths and ductilities reported in the seven articles with the minimum values of two ASTM A536 grades. Interested individuals are referred to Reference 11 for more details about the literature review. 4
6 Table 3: Comparison of Elongation Values in the Literature versus Minimum 12% Requirement for Two ASTM A536 ductile iron grades Ref. # UTS (MPa) YS (MPa) El (%) Multiplier times ASTM minimum ductility Comments on experimental value Grade ( ); minimum ductility = 12% d = 22 µm and =119 µm Perpendicular to dendrites C & Si levels and inoculation Grade ( ); minimum ductility = 6% Parallel to dendrites Unknown process/composition Vanadium and grain size at 20 to 50% higher strength As-cast condition with Sn added at 50 to 80% higher strength Normalized condition with Sn added THE COMMERCIAL FOUNDRY DATA SURVEY Motivation The objective of the first phase of this study was to survey the properties in commercial castings from several foundries. A key thrust was to investigate the chemistry and microstructural parameters that produced combinations of high strength and elongation. Sample Procurement To obtain the information required for this investigation, the researchers estimated that a minimum of 50 ductile iron samples would be required. It was desired to have some of these samples reflect production castings with moderately high strength (>55 ksi yield strength) and high elongation (>12%) to compare with more traditional properties for the and grades. Initially, samples were collected from ten foundries. Among those, the products from four foundries were selected for further study. The criteria used to select the four foundries related to the ability of the foundry to be consistent, their ability to produce the desired property range, and the evidence they provided regarding their quality control capabilities. Several foundries that submitted sample data fit these criteria and the decision was difficult. However, in the end, the selected four foundries provided 53 samples that served as the basis for this research. The principal investigators labeled these four foundries E, G, H, and J. The submitted 53 samples were obtained from 1 Keel Blocks, 3 Y-Blocks, and sections from actual castings. Three additional casting samples were included by the authors. These additional samples were from a foundry customer that had indicated the material had performed exceptionally well in their application and that the material had the type of properties they were seeking for their ductile iron application. Interested parties can refer to Reference 11 for a comprehensive comparison of the processing parameters and an assessment of properties. 5
7 Mechanical Testing The investigators tested a total of 56 samples to determine tensile properties in accordance with ASTM E8 and Brinell hardness in accordance with ASTM E10. Brinell Hardness was measured on 56 samples using 3000kg load and a 10 mm diameter tungsten carbide ball. All tensile samples utilized a standard diameter by 2 gauge length tensile bar, except for those obtained from the actual castings. Due to their small size, the castings were mostly tested with 0.35 and 1.4 gauge diameter and length, respectively; a couple of casting samples were tested with 0.25 and 1 gauge diameter and length, respectively. Table 4 shows the descriptive statistics for all the mechanical testing conducted on the 56 commercial foundry samples. Reference 11 also contains a compilation of all the test data from these 56 samples. Table 4: Descriptive Statistics for Measured Mechanical Properties on 53 Samples Statistic Brinell Hardness UTS (ksi) YS (ksi) % Elong. %El (at Fracture) %RA Uniform Elongation (%) Mean Standard Error Median Mode 182 #N/A #N/A #N/A #N/A #N/A Standard Deviation Sample Variance Kurtosis Skewness Range Minimum Maximum Sum Count Confidence Level(95.0%) After considering the mechanical property results from all 56 samples, 26 samples were selected for both qualitative and quantitative metallographic analysis as well as determination of monotonic strength coefficient and strain hardening exponent in accordance with ASTM E646. Table 5 shows the results for this parameter testing, as well as some less traditional variables that were calculated. 6
8 Table 5: Descriptive Statistics for Calculated Mechanical Properties (some on 53 and some on 24 samples) Statistic (UTS-YS)/ YS (%) Toughness, UT (ksi-in/in) Strain Hardening Exponent,n Section Modulus, In. (V/SA) Statistic Mean Mean Standard Error Standard Error Median Median Mode #N/A #N/A Mode Standard Deviation Standard Deviation Sample Variance Sample Variance Kurtosis Kurtosis Skewness Skewness Range Range Minimum Minimum Maximum Maximum Sum Sum Count Count Confidence Level(95.0%) Confidence Level(95.0%) Perhaps terminology definitions 7 are needed for some of the more nontraditional variables, especially those that were calculated in Table 5. UTS is the ultimate tensile strength measured on the engineering stress-strain curve. YS is the yield strength measured at 0.2% offset strain on the engineering stress-strain curve. Percent elongation was measured on the test samples after failure. %El at fracture (by Extensometer) was the total elongation determined with an extensometer during the tensile test, which is sometimes abbreviated e f. Percent RA is the original area measured on the test specimen minus the fractured area on the test specimen, and the subtraction result is divided by the original area. Uniform elongation is the engineering strain to the point of the maximum load in an engineering stress-strain curve. The (UTS-YS) and SH = 100 * (UTS YS)/YS (1) are methods of characterizing the strengthening in the plastic strain range, 18 normalizing the data for comparison purposes. Toughness U T (ksi-in/in) is related to the area under the stressstrain curve, as approximated 7 for a ductile material by the following formula: U T = ½ * (YS+UTS) * e f (2) The strain hardening exponent (n) is the slope of log true stress versus log true strain line in the plastic strain regime, and the monotonic strength coefficient (K) is the true stress at a true strain of unity. 7
9 One reason that the investigators determined the n-value was the initial hypothesis that decreasing slope of the stress-strain curve would allow ductile iron producers to achieve more elongation at a given strength value. Accordingly, this would maximize the likelihood of achieving the goal of this research, namely high strength ductile iron with high elongation. Metallography and Chemical Analysis Transverse metallographic samples were obtained from the shoulders of all 26 tensile samples selected for more intensive metallographic analysis. In selected cases, longitudinal samples were sectioned and these included the entire gauge section and fracture surface. All samples were mounted, polished, and etched in accordance with ASTM E3. Ferrite content, nodule count and nodularity were determined by image analysis in accordance with ASTM A247 and E1245. Grain size was determined manually by the comparison method in accordance with ASTM E112. Chemical analysis was conducted on the samples in such a way that all of the heats cast were analyzed, i.e., at least 2 samples per each grade and foundry. The carbon and sulfur contents were determined combustometrically and glow discharge spectroscopy was used to determine all other elemental contents. The compositions are shown in Table 6. The quantitative metallographic analysis results are presented in Tables 7 and 8 for the graphite and matrix characterization, respectively. Table 6: Compositions representing 56 selected samples, wt% Overall Sample # Foundry Grade Cast Section Size C S P Si Mn Cr Ni Mo V Al Cu Mg Ti Sb Ce Sn Carbon Equivalent (CE) 0A AA " Wall cylinder < < B AA " Wall cylinder < < C AA small piece < < < E " keel blocks < < < E " keel blocks < < < E " keel blocks < < < E " keel blocks < < < G " Y-blocks < < G " Y-blocks < < H Casting 3.44 < < < < H " Casting 3.53 < < < < J " keel blocks 3.63 < < < < J " keel blocks 3.68 < < < < J " keel blocks 3.66 < < < < J " keel blocks 3.66 < < < <
10 Table 7: Quantitative Metallographic Results for Graphite on 26 selected Samples Automated Image Analysis b Manual Measurements Overall Sample # Foundry Grade Cast Section Size Nodularity Nodule Count # of Class a Maximum Nodule Size Graphite Volume Fraction (%) (mm -2 ) (%) (µm) (%) 0A 1" Wall cylinder AA B 1" Wall cylinder " Duplex nodules E 13 keel blocks " Y-blocks G Other observations Some Type IV graphite & low graphite count " Y-blocks " Casting Duplex nodules 25 Casting " Casting Duplex nodules " Casting " Casting Duplex nodules H " Casting Casting Dirty " Casting " Casting Large pores " Casting Intercellular carbides J 1" keel blocks a No class 3 or larger nodules were detected b All automated image analysis was conducted on 25 fields for a total analyzed area of 17.6 mm 3. Table 8: Quantitative Metallographic Results for Matrix on 26 selected samples Cast Overall Sample # Foundry Grade Section Size Automated Image Analysis c Mean Ferrite Volume Fraction Std Dev Ferrite Volume Fraction Ferrite Grain Size Ferrite Volume Fraction Manual Measurements Pearlite Volume Fraction Near- Matrix Surface Core Surface Core Nodules ASTM # Other observations (%) (%) (%) (%) (%) (%) 0A 1" Wall cylinder b AA B 1" Wall cylinder b Trace nitrides to 7 Trace nitrides Trace nitrides, intercellular carbides 11 1" Duplex nodules, porosity E 13 keel blocks Trace nitrides Trace nitrides, porosity " Y-blocks Trace nitrides, intercellular carbides, porosity 23 G Trace nitrides, intercellular carbides, " Y-blocks microporosity at surface " Casting Dirty 25 Casting " Casting " Casting " Casting Intercellular carbides, microporosity H " Casting Casting Dirty " Casting " Casting Large pores " Casting Intercellular carbides Trace nitrides, secondary carbides J 1" keel blocks Trace nitrides, minor porosity Trace nitrides Trace nitrides a No class 3 or larger nodules were detected b All grain sizes were estimated at 200X, except for these two acicular samples which were measured at 500X. Measured grain size number was converted to 100X per mathematical relationship in ASTM 9E112. c All automated image analysis was conducted on 25 fields for a total analyzed area of 17.6 mm 3.
11 Correlation Analysis Microsoft Office Excel was used to conduct Pearson Correlation Analyses. Correlation is a measure of the relation between two or more variables. Tables 9, 10, 11, and 12 provide the Pearson correlation matrix for all of the variables that were measured or calculated. These four tables are respectively organized by groupings of measured mechanical test results, calculated mechanical properties, compositions and quantitative metallographic results. Table 9: Correlation Matrix for Measured Mechanical Properties (some on 53 and some on 24 samples) %El (at Fracture by Extensom eter) Uniform Elongation (%) Brinell Hardness UTS (ksi) YS (ksi) % Elong. %RA Brinell Hardness 1.00 UTS (ksi) YS (ksi) % Elong %El(at Fracture by Extensometer) %RA Uniform Elongation (%) SH (%) Toughness, U T (ksi-in/in) Nodularity (%) Nodule Count (mm-2) # of Class 7 (%) # of Class 6 (%) # of Class 5 (%) # of Class 4 (%) Maximum Nodule Size (µm) Graphite Volume Fraction (%) Mean Ferrite Volume Fraction (%) Std Dev Ferrite Volume Fraction (%) Near-Nodules Average Grain Diameter (um) Matrix Average Grain Diameter (um) Strain Hardening Exponent, n Monotonic Strength Coefficient, K (ksi) C S P Si Mn Cr Ni Mo V Al Cu Mg Ti Sb Ce Sn Carbon Equivalent (CE) Section Modulus, In. (V/SA) Cu+Mn
12 Table 10: Correlation Matrix for Calculated Mechanical Properties (some on 53 and some on 24 samples) SH (%) Toughness, U T (ksi-in/in) Strain Hardening Exponent, n Monotonic Strength Coefficient, K (ksi) Section Modulus, In. (V/SA) Brinell Hardness UTS (ksi) YS (ksi) % Elong. %El(at Fracture by Extensometer) %RA Uniform Elongation (%) SH (%) 1.00 Toughness, U T (ksi-in/in) Nodularity (%) Nodule Count (mm-2) # of Class 7 (%) # of Class 6 (%) # of Class 5 (%) # of Class 4 (%) Maximum Nodule Size (µm) Graphite Volume Fraction (%) Mean Ferrite Volume Fraction (%) Std Dev Ferrite Volume Fraction (%) Near-Nodules Average Grain Diameter (um) Matrix Average Grain Diameter (um) Strain Hardening Exponent, n Monotonic Strength Coefficient, K (ksi) C S P Si Mn Cr Ni Mo V Al Cu Mg Ti Sb Ce Sn Carbon Equivalent (CE) Section Modulus, In. (V/SA) Cu+Mn
13 Table 11: Correlation Matrix for Composition representing 53 samples %El (at Fracture by Extensom eter) Uniform Elongation (%) Toughness, U T (ksi-in/in) Strain Hardening Exponent, n Monotonic Strength Coefficient, K (ksi) Brinell Hardness UTS (ksi) YS (ksi) % Elong. %RA SH (%) C S P Si Mn Cr Ni Mo V Al Cu Mg Ti Sb Ce Sn Carbon Equivalent (CE) Section Modulus, In. (V/SA) Cu+Mn Nodule Count (mm-2) # of Class 7 (%) # of Class 6 (%) # of Class 5 (%) # of Class 4 (%) Maximum Nodule Size (µm) Graphite Volume Fraction (%) Mean Ferrite Volume Fraction (%) Std Dev Ferrite Volume Fraction (%) Near- Nodules Average Grain Diameter (um) Matrix Average Grain Diameter (um) Nodularity (%) C S P Si Mn Cr Ni Mo V Al Cu Mg Ti Sb Ce Sn Carbon Equivalent (CE) Section Modulus, In. (V/SA) Cu+Mn
14 Table 12: Correlation Matrix for Quantitative Microstructural Analysis on 24 selected samples %El (at Fracture by Extensom eter) Uniform Elongation (%) Toughness, U T (ksi-in/in) Strain Hardening Exponent, n Monotonic Strength Coefficient, K (ksi) Brinell Hardness UTS (ksi) YS (ksi) % Elong. %RA SH (%) Brinell Hardness 1.00 UTS (ksi) YS (ksi) % Elong %El(at Fracture by Extensometer) %RA Uniform Elongation (%) SH (%) Toughness, U T (ksi-in/in) Nodularity (%) Nodule Count (mm-2) # of Class 7 (%) # of Class 6 (%) # of Class 5 (%) # of Class 4 (%) Maximum Nodule Size (µm) Graphite Volume Fraction (%) Mean Ferrite Volume Fraction (%) Std Dev Ferrite Volume Fraction (%) Near-Nodules Average Grain Diameter (um) Matrix Average Grain Diameter (um) Strain Hardening Exponent, n Monotonic Strength Coefficient, K (ksi) Section Modulus, In. (V/SA) Section Modulus, In. (V/SA) Nodule Count (mm-2) # of Class 7 (%) # of Class 6 (%) # of Class 5 (%) 13 # of Class 4 (%) Maximum Nodule Size (µm) Graphite Volume Fraction (%) Mean Ferrite Volume Fraction (%) Std Dev Ferrite Volume Fraction (%) Near-Nodules Average Grain Diameter (um) Matrix Average Grain Diameter (um) Nodularity (%) Nodularity (%) 1.00 Nodule Count (mm-2) # of Class 7 (%) # of Class 6 (%) # of Class 5 (%) # of Class 4 (%) Maximum Nodule Size (µm) Graphite Volume Fraction (%) Mean Ferrite Volume Fraction (%) Std Dev Ferrite Volume Fraction (%) Near-Nodules Average Grain Diameter (um) Matrix Average Grain Diameter (um) Strain Hardening Exponent, n Monotonic Strength Coefficient, K (ksi) C S P Si Mn Cr Ni Mo V Al Cu Mg Ti Sb Ce Sn Carbon Equivalent (CE) Cu+Mn
15 Correlation is a measure of the relation between two or more variables. The measurement scales used should be at least interval scales, but other correlation coefficients are available to handle other types of data. Correlation coefficients can range from to The value of represents a perfect negative correlation while a value of represents a perfect positive correlation. A value of 0.00 represents a lack of correlation. A few comments are important. The correlation coefficient is affected by the underlying data set. The correlation coefficient has greater significance the more populated each variable is with differing values. If you have only two x values or two y values, then you will get a nearly perfect correlation. If you have only one x or one y value, you will have a N/A value. Otherwise, when the magnitude of the coefficient is 0.4 or greater, the correlation is believed to be strong. A negative value for a correlation coefficient (red numbers) means a negative correlation and positive values (blue numbers) mean positive correlations. When the magnitude of the coefficient is 0.7 or greater, the correlation is believed to be extremely strong. Finally, the high correlation coefficients must be evaluated (qualified) even further based on the range of the data variables and practical experience. DISCUSSION OF COMMERCIAL FOUNDRY DATA SURVEY Mechanical Testing and Microstructural Analysis The authors compiled all of the data into a single Excel workbook and subjected the results to copious statistical evaluations. The initial step was to construct a correlation matrix (see Tables 9 to 12). The variables used for the correlation matrix included all of the measured properties; the calculated properties for the 56 samples; the microstructures for the 26 samples; and the final composition as determined at the research facilities. The microstructure variables included all of the matrix features measured with image analysis, ferrite content, pearlite content, and carbide; the ferrite content determined manually; the ferrite grain size determined manually; and the graphite features measured with image analysis, including graphite nodule count, nodularity, and nodule size. Much of the information to be presented in this report involves use of automated image analysis (IA). In some cases, comparisons are made with manual measurements where IA was not used. Therefore, a comparison was made between visual estimation of ferrite content and IA analysis of ferrite content, which is the only parameter that was measured by both methods. The results are shown in Figure 2 on the following page. The correlation was outstanding in that high linearity was observed, as represented by a coefficient of determination (R 2 ) of nearly 0.9, and a slope of 1.09, which was nearly unity. 14
16 Manual %f= (IA %F) x R 2 = Manual Estimate of Ferrite Content, % Foundry E - MG Samples Foundry G - MG Samples Foundry H - MG Samples Foundry J - MG Samples Full Agreement All Data (Regression) Linear (All Data (Regression)) Ferrite Content by Element Automated Image Analyzer, % Figure 2. Comparison of Automated Image Analysis v. Manual Ferrite Content Determinations All of the mechanical properties behaved in accordance with expectations based on ferrite content. Namely, as ferrite content increased, ductility increased, ultimate tensile strength decreased, and yield strength decreased. Figures 3 through 5 document these relationships. (Note that these figures only have 24 samples because quantitative metallographic measurements for ferrite content were unavailable from 2 of the 26 samples summarized in Table 8.) 120 Ultimate Tensile Strength, ksi Foundry E - MG Samples Foundry G - MG Samples Foundry H - MG Samples Foundry J - MG Samples Ferrite, % Figure 3. Ultimate Strength v. Ferrite Content for 24 Selected Samples 15
17 80 Yield Strength, ksi Foundry E - MG Samples Foundry G - MG Samples Foundry H - MG Samples Foundry J - MG Samples Ferrite, % Figure 4. Yield Strength v. Ferrite Content for 24 Selected Samples Elongation, % Foundry E - MG Samples Foundry G - MG Samples Foundry H - MG Samples Foundry J - MG Samples Ferrite, % Figure 5. Elongation v. Ferrite Content for 24 Selected Samples Previous investigators 1-3 have demonstrated that section size (cooling rate) had an influence over these properties as well. Although in the initial part of this current study, section size was
18 not determined to be a factor, the reader should keep in mind that the evaluated samples did not allow the assessment of a section size effect. This aspect is important and should be a factor that is studied in the second phase of this project. Considering that the two Foundry G samples (the gray boxes on Figures 3 to 5) had the least amount of ferrite, they did not display the highest ultimate strength or yield strength. Figures 6 to 8 show that reasonable correlations were obtained between strength, ductility and hardness, regardless of microstructure in the 53 samples from the foundries that formally participated in the study, i.e., the 3 samples from the commercial foundry that were labeled Foundry AA in Tables 6 to 8 were excluded from the figures. 130 UTS = (HB) R 2 = UTS, ksi Foundry E Foundry G Foundry H Foundry J Linear (Regression Line for All Data) Brinell Hardness, HBW3000 Figure 6. Ultimate Tensile Strength v. Brinell Hardness for the Entire 53 Foundry Sample Set YS = * (%El) R 2 = Foundry E Foundry G Foundry H Foundry J Linear (All Data for Regression Line) YS, ksi % Elongation Figure 7. Yield Strength v. Brinell hardness for the Entire 53 Foundry Sample Set 17
19 YS = * (%El) R 2 = YS, ksi Foundry E - MG Samples Foundry G - MG Samples Foundry H - MG Samples Foundry J - MG Samples Foundry E - All Data Foundry G - All Data Foundry H - All Data Foundry J - All Data Linear (All Data for Regression Line) % Elongation Figure 8. Yield Strength v. Elongation for the Entire 53 Foundry Sample Set Although the two Foundry G samples have, by far, the highest pearlite content of the 53 foundry samples, their HB hardness values were not the highest, indicating that section size (cooling rate) has an influence. Because of the limited range of sections studied, the section size effect was not determined in this phase of the investigation. Figures 8 and 9 show that elongation generally decreased with increasing hardness and strength, there was significant data scatter at lower elongation values (below 12%). This scatter indicates that microstructure may play a greater role in determining elongation than in determining strength. HB = * (%El) R 2 = Brinell Hardness, HBW Foundry E Foundry G Foundry H Foundry J Linear (Regression Line for All Data) % Elongation Figure 9. Elongation v. Brinell hardness for the Entire 53 Foundry Sample Set 18
20 Figure 10 shows that the ferrite grain size was generally finer next to the graphite nodules versus those in the matrix interior for any given value of yield strength. Average Grain Diameter, µm Near Nodules Foundry E - MG Samples Near Nodules Foundry G - MG Samples Near Nodules Foundry H - MG Samples Near Nodules Foundry J - MG Samples Matrix Foundry E - MG Samples Matrix Foundry H - MG Samples Matrix Foundry J - MG Samples Matrix Foundry G - MG Samples Yield Strength, ksi Figure 10. Ferrite Grain Size v. Yield Strength for 24 Selected Samples Figures 3 to 5 showed that strength and ductility varied with one microstructural parameter (ferrite content). Although the literature suggested that there might be a Hall-Petch ferrite grain size effect and the initial author study suggested it might be present, Figure 10 shows that yield strength did not vary with grain size for the commercial foundry sampling, and similarly insignificant variation was found when correlating UTS v. grain size as well as Elongation v. grain size. For all the standard tensile properties v. grain size, linear regression analysis produced low coefficients of determination ( 0.1) for all six correlations. (There were six correlations because investigators separately considered UTS, YS, and Elongation versus grain size, which was measured both adjacent to nodules and in the matrix.) Furthermore, plotting the strength data in the standard d -½ Hall-Petch format would lead to the same conclusion because the grain size varied so little in this study. It is possible that this limited ferrite grain size versus Hall-Petch variation is truly representative of ductile iron overall. One reason may be that factors such as the presence of graphite nodules may be of greater influence, or at least disguise a Hall-Petch grain size trend in ductile iron. Alloy Content Considerations Additional evaluations were conducted with the data to determine the effects of composition. The relationship between certain elements and ferrite content was of specific interest, particularly since the ductile iron industry uses copper, manganese, and tin to control the 19
21 pearlite content of the matrix. As shown in Table 6, none of the foundries in this investigation used tin. As expected, based on over 60 years of experience with casting ductile iron, the correlation matrix (see Table 11) indicated that silicon has a positive correlation with ferrite content. Furthermore, in decreasing order, copper, manganese, titanium, molybdenum, and antimony are elements that exhibit a negative correlation with the occurrence of ferrite content. The combined copper and manganese contents had the strongest negative correlation. However, Table 6 shows that there were only two molybdenum content and two antimony content levels. The Principal Investigators of this study, recognize that the correlations with the elements stated above are restricted to the ranges that were studied in this investigation and that the number of data points are inconsistent with the guidelines expected for acceptable statistical analysis. However, the foundry data survey phase of this investigation was intended to identify trends that could be more stringently pursued subsequently in the investigation. With this understanding, the Figures 11 to 18 show the relationships between mechanical properties and the contents of elements that exhibited high correlation coefficients with yield strength and elongation. 30 Foundry E - All with comps filled Foundry G - All with comps filled 25 Foundry H - All with comps filled Foundry J - All with comps filled Elongation, % Silicon Content, % Figure 11. Elongation v. Silicon Content for the 53 Samples 20
22 30 25 Foundry E - All with comps filled Foundry G - All with comps filled Foundry H - All with comps filled Foundry J - All with comps filled Elongation, % Manganese + Copper Content, % Figure 12. Elongation v. Copper + Manganese Content for the 53 Samples 30 Elongation, % Foundry E - All with comps filled Foundry G - All with comps filled Foundry H - All with comps filled Foundry J - All with comps filled Copper Content, % Figure 13. Elongation v. Copper Content for the 53 Samples 21
23 30 Foundry E - All with comps filled 25 Foundry G - All with comps filled Foundry H - All with comps filled Foundry J - All with comps filled Elongation, % Manganese Content, % Figure 14. Elongation v. Manganese Content for the 53 Samples 80 Yield Strength, ksi Foundry E - All with comps filled Foundry G - All with comps filled Foundry H - All with comps filled Foundry J - All with comps filled Silicon Content, % Figure 15. Yield Strength v. Silicon Content for the 53 Samples 22
24 80 Yield Strength, ksi Foundry E - All with comps filled Foundry G - All with comps filled Foundry H - All with comps filled Foundry J - All with comps filled Manganese + Copper Content, % Figure 16. Yield Strength v. Copper + Manganese Contents for the 53 Samples Yield Strength, ksi Foundry E - All with comps filled Foundry G - All with comps filled Foundry H - All with comps filled Foundry J - All with comps filled Copper Content, % Figure 17. Yield Strength v. Copper Content for the 53 Samples 23
25 80 Yield Strength, ksi Foundry E - All with comps filled Foundry G - All with comps filled Foundry H - All with comps filled Foundry J - All with comps filled Manganese Content, % Figure 18. Yield Strength v. Manganese Content for the 53 Samples This analysis indicates that the combination of the desired yield strength (~55 ksi) and elongation (> 12%) combination, one of the goals of this investigation, requires the following conditions: final silicon content of 2.48 to 2.68%; copper content of 0.40 to 0.48%; manganese content of 0.28 to 0.33%; and the copper + manganese contents of 0.7% to 0.8%. The plots also indicate that when lowering the copper to 0.3% (while maintaining Cu+Mn equal to 0.7 to 0.8%), the elongation increases above 15% but the yield strength falls to below 50 ksi. Using the 3 dimensional plotting capability and viewing the relationships via the bubble presentation, permits further assessment of strength and ductility data with respect to ferrite content. This three-variable correlation is shown on the following page in Figure 19. Essentially, Figure 19 shows that the ideal ferrite content ranged from 40 to 60% for achieving the combination of 55 ksi yield strength and 10% elongation. Silicon and carbon equivalent also positively influence toughness. However, some of the elements that contribute to increasing the strength and strain hardening exponent seem to detract from toughness, namely (in decreasing order) manganese, manganese + copper, and copper. This observation stands to reason since these elements are also known to increase pearlite and strength
26 Foundry E - Ferrite Content, % Foundry G - Ferrite Content, % Yield Strength, ksi Foundry H - Ferrite Content, % Foundry J - Ferrite Content, % Elongation, % Figure 19. Three dimensional plot showing elongation, yield strength and ferrite content (shown in the plot legend and next to the plotted points). The diameter of the circular bubble is proportional to the ferrite content. The points inside the red square indicate the ideal ferrite content of about 40 to 60% for achieving the target combination of 55 ksi yield strength and 10% elongation. Fracture Path Considerations Additional observations are in order, particularly because of the differences that were observed for samples that seemingly had the same microstructure and yet had significantly different properties. Table 13 shows data for four samples that meet the strength requirements for Grade but had significantly different ferrite contents, and different but relatively high elongation. Table 13: Specific Structure-Property Information for Four Selected Samples Sample ID Nodularity (%) Nodule Count (mm -2 ) Pearlite Content (%) Yield Strength (ksi) Tensile Strength (ksi) Elongation (%) D5506 Not Specified


27 The Principal Investigators anticipated that the amount and distribution of the ferrite and pearlite constituents might provide some insight as to the microstructural characteristics that enhance the mechanical properties. The four castings contained levels of pearlite ranging from 38% to 68%, and yet all four met the specified properties of this grade of iron. The microstructures of these four castings are shown in Figures 20 to 23. Figure 20. Optical micrograph showing the matrix structure for sample 11 Figure 21. Optical micrograph showing the matrix structure for sample 15 26


28 Figure 22. Optical micrograph showing the matrix structure for sample 52 Figure 23. Optical micrograph showing the matrix structure for sample 13 27
29 Some of the properties reported in Table 13 are as expected. The higher the pearlite content the higher the tensile strength and yield strength. However, it was unexpected that a casting (#13) with only 38% pearlite would produce sufficient yield strength and tensile strength for this grade of ductile iron. The difference in the properties of castings #15 and #52 were somewhat surprising. The two castings have essentially the same pearlite content; however, casting #15 has both higher strength and ductility. When comparing the microstructures of these two castings, some differences are apparent. In particular, the ferrite colonies in casting #15 are less continuous than in casting #52, where the ferrite extended from nodule to nodule. Multiple red lines have been superimposed on the micrograph in Figure 22 to illustrate the continuity of the ferrite colonies in casting #52. These lines pass through many graphite nodules without crossing into a pearlite region. As shown by the single red line in Figure 23 for casting #15, the ferrite colonies are more discrete with pearlite displaying more continuity than the ferrite phase. The differences in nodule count may have contributed to this characteristic, causing a greater continuity in the ferrite phase due to the shorter mean-free path between nodules. Tendencies for nodule alignment might also favor this ferrite distribution. Certainly, as the ferrite content is diminished, the continuity of the ferrite phase will be reduced. This is readily apparent in the microstructure of casting #11, see Figure 20, where the somewhat lower ferrite content resulted in many more discrete ferrite colonies most colonies contain only one or two nodules. The Principal Investigators believe that the differences in yield strength and tensile strength, shown in Table 15 between castings #15 and #52, are related to differences in the continuity of the ferrite phase; namely, when the ferrite is continuous, as in casting #52, the continuity decreases the strength and elongation. When compared to casting #52, the ferrite is more randomly distributed and there is greater continuity of the pearlite in casting #15. The opposite is true for casting #52. These observations are very similar to those of earlier investigators, 7,20 who found that 0.2% offset yield strength decreased linearly with the log of the mean free ferrite path in hypoeutectoid, eutectoid, spheroidized steels. The Principal Investigators believe that the microstructural differences are responsible for the differences in mechanical properties. Further work to determine the cause for ferrite colony formation to further maximize mechanical properties is worthy of consideration. Other less obvious issues are important in this discussion of results, particularly as they influence strain hardening and toughness. Figure 24 shows the effect of ferrite content on the strain-hardening exponent. Figures 25 and 26 show the effects of the strain hardening exponent on toughness and tensile strength, respectively. 28
30 0.35 Linear: n = * %f R 2 = Polynomial: n = 1E-05 * %f * %f R 2 = Foundry E - MG Samples Foundry G - MG Samples Strain Hardening Exponent, n Foundry H - MG Samples Foundry J - MG Samples Linear (All data for regression line) Poly. (All data for regression line) Ferrite, % Figure 24. Strain hardening exponent v. ferrite content. The data show a strong linear correlation and even stronger quadratic correlation, based on the coefficients of determination (R 2 ) values. 20 U T = 1/2 (YS+UTS)*e f Foundry E - Mg Samples Only Foundry G - MG Samples Only 15 Foundry H - MG Samples Only Foundry J - MG Samples Only Toughness, U T (ksi-in/in) Strain Hardening Exponent, n Figure 25. Toughness v. strain hardening exponent 29
31 Ultimate Tensile Strength minus Yield Strength, ksi Foundry E - Mg Samples Only Foundry G - MG Samples Only Foundry H - MG Samples Only Foundry J - MG Samples Only Strain Hardening Exponent, n Figure 26. Increase in strength beyond the yield stress as a function of strain hardening exponent. The Principal Investigators believe that increasing the strain hardening exponent (n) and toughness, as measured by either the area under the stress-strain curve (U T ) or the further increase in strength beyond the onset of yielding (see Figure 26), are two properties that can serve as metrics for examining the optimization of strength and ductility. Optimizing ferrite content and reducing the continuity of ferrite colonies, as well as decreasing the n-value may prove useful for employing ductile iron in new applications that require high toughness. Lower nodule count and avoiding nodule alignment will most likely produce less connection of ferrite grains. Raising the strength of ferritic ductile iron while maintaining ductility and low temperature impact toughness is specifically required for wind energy castings. Even with a high yield strength, with a significant amount of ferrite there is still opportunity to get high ductility. For the elements that were evaluated at sufficiently different levels, the correlation matrix indicates that the strain hardening exponent (n) is strongly and negatively influenced by increasing silicon content (and increasing carbon equivalent). The n-value is strongly and positively influenced by increasing contents of the following elements in decreasing order: copper + manganese, copper, and manganese. Correlations Between Literature, Substructure, and Mechanical Properties The authors of reference 13 found that both the tensile strength and the ductility increased when the tensile loading was parallel to dendrites. This was explained by the presence of higher measured solute concentrations in the interdendritic region and the fact that ferrite formed in bands along the austenite dendrite center. This observation is somewhat consistent with the 30
32 authors observation that ferrite colony continuity reduced the strength and ductility of samples with nominally the same ferrite content. Although the reviewed literature found that grain size reduction increased the strength of some irons, the effect was not pronounced unless heat treatment 17 was involved. The authors of this paper also found that the ferrite grain size did not influence the strength-ductility balance (e.g., see Figure 10) in the as-cast condition. PROCEDURES AND RESULTS FOR EXPERIMENTAL CASTINGS RESEARCH Motivation Based on the results of the commercial foundry data survey, the Principal Investigators initiated subsequent research to study castings that were poured at a single experimental foundry and with a Design of Experiments (DOE) methodology. The intent of this research was to more explicitly identify the relationship between yield strength above 55 ksi and elongation above 12%, with the elements copper, manganese, and silicon than was conducted initially. Other variables in the DOE program included inoculation and section size, and one selected condition was cast at a different commercial foundry for verification purposes. Finally, post solidification heat treatment trials were conducted to study the effect of heat treatment on the strengthductility balance. Casting Procedures The Principal Investigators worked with a sponsor foundry to develop a design of experiments (DOE) for this second phase. This sponsor also agreed to conduct the melting, molding, and pouring that was required. A total of 9 heats of iron were cast, varying the Cu, Mn, and Si contents as shown in Table 14. Section size (1 versus 3 ) and Ladle versus Ladle+In-Stream inoculation were additional DOE variables. Table 14: Nominal Elemental Content Variation in the Design of Experiments (Each heat also had a section size and inoculation variation.) DOE Condition # Heat # Copper (wt%) Manganese (wt%) Silicon (wt%) Cu Mn Si (repeat)

33 All casting procedures were designed and monitored such that the metal in each test casting was produced as identically as possible. Figure 27 shows the 1 and 3 Y-block molds. Figures 28 and 29 show examples of the pouring arrangement and basin. A common pouring basin was designed so that three Y-Blocks could be poured at one time. The Y-block dimensions are shown in Figures 30 and


34 Figure 29. Photograph of the pouring basin used for the stream inoculation. Note the pinch of inoculant in the catsup cup in each downsprue. 33


35 The participating foundry cut each Y-block to obtain 1" by 1" bars for the 1 Y-blocks and 1 by 3 slabs for the 3 Y-blocks prior to shipment to the Principal Investigators. The heats were magnesium treated using the sandwich technique. Once treated the iron was transferred to a pouring ladle, inoculated, and the slag removed. Tapping and pouring temperatures were similar and recorded for each heat; these temperatures respectively averaged 1524 and 1380 C (2776 and 2516 F). The shakeout time for all molds was overnight to eliminate any shakeout time variation. Note in Figure 29 that a catsup cup holds a pinch of inoculant to initiate the in-stream inoculant requirement. Figure 32 shows the pouring. 34
36 Each heat poured two molds with three 1 Y-block cavities and two molds with three 3 Y-block cavities. Three of the 1 Y-blocks and three of the 3 Y-blocks were poured with ladle inoculation alone. The other three 1 Y-blocks and three 3 Y-blocks were poured with ladle plus stream inoculation. Each heat represented one of the DOE composition variations. This process yielded three Y-blocks of each section size for each DOE condition. The reader is directed to Reference 21 for more details on the casting procedures. Design of Experiments Methodology The design of Experiments (DOE) required eight individual heats of iron covering all the chemistry combinations shown in Table 14. The elemental contents are actually measured values in that table, but with low precision rounding to foster easier comparison of the low and high values for each DOE alloying element variable. The low and high levels of each of the DOE alloying element levels are indicated with minus (-) and plus (+) signs, respectively. In some respects, some of the compositions were slightly off target, as indicated in red, but the DOE methodology and results were not significantly affected. One additional heat of the high copper, manganese, and silicon contents was poured for a repeatability check. Metallography and Chemical Analysis Chemical analysis was conducted on the samples in such a way that all of the heats cast were analyzed in multiples. At least four compositions per heat and at least two compositions for each inoculation method and section size were analyzed. For Heats 1 and 2, significantly more compositions were determined. The carbon and sulfur contents were determined combustometrically (LECO or ASTM E1019) and glow discharge optical emission spectroscopy (GD-OES) was used to determine all other elemental contents. Table 15 shows the chemical analyses measured by the authors. Multiple transverse metallographic samples were obtained from tensile blanks for each heat. At least four samples were tested for each heat and at least two metallographic samples were analyzed for each inoculation method and section size. For Heats 1 and 2, significantly more metallographic samples were analyzed. All samples were mounted, polished, and etched in accordance with ASTM E3. Ferrite content, nodule count and nodularity were determined by image analysis in accordance with ASTM A247 and E1245. Mechanical Testing The Principal Investigators tested triplicate samples from various positions in selected Y-block locations for Heats 1 and 2. For the other heats, duplicate samples were tensile tested for each combination of section size and inoculation method. Tensile properties were determined in accordance with ASTM E8 and Brinell hardness was determined in accordance with ASTM E10. Brinell hardness was measured on 56 samples using a 3000 kg load and a 10 mm diameter tungsten carbide ball. All tensile samples utilized a standard diameter by 2 gauge length 35
37 tensile bar. The same tensile properties that were measured in the earlier foundry data assessment, as discussed earlier in this paper, were measured in this section of the study. Test Bar Location Test bar location was determined by testing samples from multiple locations in one of the 1 Y- Blocks and in one of the 3 Y-Blocks from Heat #2, which were poured with ladle inoculation only. These bars were mechanically tested and metallographic samples from the test bars were evaluated. The purpose for this testing was to compare the properties from the different locations in the Y-Blocks. Since it was anticipated that properties might vary with test bar location, this information was required to determine where to take the test bars for the DOE comparison for the rest of the study. The bottom location was selected for the 1 Y-Blocks and the middle-middle location was selected for the 3 Y-Blocks. Data Sets Tables 15, 16 and 17 show the results obtained for all the DOE conditions. Each mechanical property result in Table 16 represents the average of three tests for each DOE condition for Heats 1 and 2, and the average of two tests for all the other heats. The compositions and metallographic results in Tables 15 and 17 are not averages. The ranges of duplicate and triplicate values were relatively tight in the multiple measurements; therefore, the statistical analyses were conducted without requiring the complexity of missing data routines in the statistical analyses. The individual test results are contained in Reference
38 Table 15 Chemical Analysis of Experimental Castings, wt% Overall Sample # Cast Section Size DOE Heat Condition # # Mold Inoculation C S P Si Mn Cr Ni Mo V Al Cu Mg Ti Sb Ce Sn 1 1" In-Ladle Only < < < " 2 In-Ladle & In-Stream < < < " 3 In-Ladle Only < < < " 4 In-Ladle & In-Stream < < < " In-Ladle Only < < < " 2 In-Ladle & In-Stream < < < " 3 In-Ladle Only < < < " 4 In-Ladle & In-Stream < < < " In-Ladle Only 3.64 < < < < " 2 In-Ladle & In-Stream 3.63 < < < < " 3 In-Ladle Only 3.61 < < < < " 4 In-Ladle & In-Stream 3.57 < < < < " In-Ladle Only < < < " 2 In-Ladle & In-Stream < < < " 3 In-Ladle Only 3.55 < < < < " 4 In-Ladle & In-Stream 3.50 < < < < " In-Ladle Only 3.54 < < < < " 2 In-Ladle & In-Stream < < < " 3 In-Ladle Only 3.54 < < < < " 4 In-Ladle & In-Stream 3.51 < < < < " In-Ladle & In-Stream 3.52 < < < < " 2 In-Ladle Only 3.49 < < < < " 3 In-Ladle & In-Stream 3.45 < < < < " 4 In-Ladle Only 3.47 < < < < " In-Ladle & In-Stream 3.51 < < < < " 2 In-Ladle Only 3.52 < < < < " 3 In-Ladle & In-Stream 3.51 < < < < " 4 In-Ladle Only 3.47 < < < < " In-Ladle & In-Stream < < < " 2 In-Ladle Only < < < " 3 In-Ladle & In-Stream < < < " 4 In-Ladle Only < < < " In-Ladle & In-Stream < < < " 2 In-Ladle Only < < < " 3 In-Ladle & In-Stream < < < " 4 In-Ladle Only < < <
39 Table 16 Average Mechanical Property Results Obtained for all the DOE Conditions Average Sample No. DOE Condition # Heat # Cast Section Size Mold Inoculation Brinell Hardness UTS (ksi) YS (ksi) %El at Fracture %RA % Elong. Uniform Elongation (%) Strain Hardening (SH), (%) Toughness, UT (ksiin/in) " 1 In-Ladle Only " 2 In-Ladle & In-Stream " 3 In-Ladle Only " 4 In-Ladle & In-Stream " 1 In-Ladle Only " 2 In-Ladle & In-Stream " 3 In-Ladle Only " 4 In-Ladle & In-Stream " 1 In-Ladle Only " 2 In-Ladle & In-Stream " 3 In-Ladle Only " 4 In-Ladle & In-Stream " 1 In-Ladle Only " 2 In-Ladle & In-Stream " 3 In-Ladle Only " 4 In-Ladle & In-Stream " 1 In-Ladle Only " 2 In-Ladle & In-Stream " 3 In-Ladle Only " 4 In-Ladle & In-Stream " 1 In-Ladle & In-Stream " 2 In-Ladle Only " 3 In-Ladle & In-Stream " 4 In-Ladle Only " 1 In-Ladle & In-Stream " 2 In-Ladle Only " 3 In-Ladle & In-Stream " 4 In-Ladle Only " 1 In-Ladle & In-Stream " 2 In-Ladle Only " 3 In-Ladle & In-Stream " 4 In-Ladle Only " 1 In-Ladle & In-Stream " 2 In-Ladle Only " 3 In-Ladle & In-Stream " 4 In-Ladle Only
40 Table 17 Average Microstructural Image Analysis Results Obtained for all the DOE Conditions Average Sample No. DOE Condition # Heat # Cast Section Size Mold Inoculation Nodularity (%) Nodule Count (mm - 2 ) # of Class 7 (%) # of Class 6 (%) # of Class 5 (%) # of Class 4 (%) Maximum Nodule Size (µm) Graphite Volume Fraction (%) Mean Ferrite Volume Fraction (%) " 1 In-Ladle Only " 2 In-Ladle & In-Stream " 3 In-Ladle Only " 4 In-Ladle & In-Stream " 1 In-Ladle Only " 2 In-Ladle & In-Stream " 3 In-Ladle Only " 4 In-Ladle & In-Stream " 1 In-Ladle Only " 2 In-Ladle & In-Stream " 3 In-Ladle Only " 4 In-Ladle & In-Stream " 1 In-Ladle Only " 2 In-Ladle & In-Stream " 3 In-Ladle Only " 4 In-Ladle & In-Stream " 1 In-Ladle Only " 2 In-Ladle & In-Stream " 3 In-Ladle Only " 4 In-Ladle & In-Stream " 1 In-Ladle & In-Stream " 2 In-Ladle Only " 3 In-Ladle & In-Stream " 4 In-Ladle Only " 1 In-Ladle & In-Stream " 2 In-Ladle Only " 3 In-Ladle & In-Stream " 4 In-Ladle Only " 1 In-Ladle & In-Stream " 2 In-Ladle Only " 3 In-Ladle & In-Stream " 4 In-Ladle Only " 1 In-Ladle & In-Stream " 2 In-Ladle Only " 3 In-Ladle & In-Stream " 4 In-Ladle Only Std Dev Ferrite Volume Fraction (%) Comparison of Commercial Foundry Data with Experimental Castings Results Figure 33 shows selected results from this Experimental Castings study, which are plotted versus the results for different foundries from the Commercial Foundry Data Survey. Generally good agreement was obtained between the Experimental Castings results and those from the Commercial Foundries. Heats 4, 5, 6, 7 and 11 from the Experimental Castings Study exhibited properties approaching the desired properties in Grade D5506, i.e., yield strength approaching 55 ksi, % elongation over 12% and ultimate tensile strength over 85 ksi, which is close to optimum in the Commercial Foundry survey. 39
41 80 70 Heat 1 from Phase 2 Heat 2 from Phase 2 Heat 3 from Phase 2 Heat 4 from Phase 2 Heat 5 from Phase 2 Heat 6 from Phase 2 Heat 7 from Phase 2 Heat 11 from Phase 2 All Foundries from Phase 1 MINIMUM TARGET Linear (All Foundries from Phase 1) YS, ksi YS = *%El % Elongation Figure 33. Yield strength versus elongation for Phase 2 DOE results and Phase 1 results from commercial foundries. The shaded region shows the target properties. Figures 34 to 37 plot some of the key mechanical property parameters versus ferrite content. As was found in the Commercial Foundry Data Survey, Figure 37 shows that the percent strain hardening increases with decreasing ferrite content; however, the percent strain hardening reaches a plateau such that there are no further increases in percent strain hardening with ferrite contents below 40% Heat 1 from Phase 2 Heat 2 from Phase 2 Heat 3 from Phase 2 Heat 4 from Phase 2 Heat 5 from Phase 2 Heat 6 from Phase 2 Heat 7 from Phase 2 Heat 11 from Phase 2 MINIMUM TARGET YS, ksi % Ferrite Figure 34. Yield strength versus ferrite content for Phase 2 DOE results 40
42 Elongation, % Heat 1 from Phase 2 Heat 2 from Phase 2 Heat 3 from Phase 2 Heat 4 from Phase 2 Heat 5 from Phase 2 Heat 6 from Phase 2 Heat 7 from Phase 2 Heat 11 from Phase 2 MINIMUM TARGET % Ferrite Figure 35. Elongation versus ferrite content for Phase 2 DOE results Toughness (U T ), ksi-in/in Heat 1 from Phase 2 Heat 2 from Phase 2 Heat 3 from Phase 2 Heat 4 from Phase 2 Heat 5 from Phase 2 Heat 6 from Phase 2 Heat 7 from Phase 2 Heat 11 from Phase % Ferrite Figure 36. Toughness versus ferrite content for Phase 2 DOE results 41
43 Strain Hardening, % Heat 1 from Phase 2 Heat 2 from Phase 2 Heat 3 from Phase 2 Heat 4 from Phase 2 Heat 5 from Phase 2 Heat 6 from Phase 2 Heat 7 from Phase 2 Heat 11 from Phase % Ferrite Figure 37. Strain hardening versus ferrite content for Phase 2 DOE results Data Repeatability Through visual comparison of the duplicate and triplicate values, excellent mechanical property repeatability within each heat and the DOE test condition were obtained. One additional heat of the high copper and high manganese with high silicon condition was poured for a repeatability check. Table 16 also shows that the mechanical properties for Heats 11 and 12 were very similar too, although the strengths of Heat 12 were slightly lower than those of Heat 11, perhaps due to the lower Mn content of Heat 12 (see Tables 14 and 15). Hereafter, only the results from Heat 11 were used in the statistical analyses. Analysis of Section Size Effect The results in Tables 16 and 18 show that some of the properties for the 1 Y-blocks have more desirable values than the properties for the 3 Y-blocks. 42
44 Past research on ductile iron has shown that it can exhibit section sensitivity That is, thin section castings with rapid solidification rates will display higher strength and hardness than heavier section castings. The differences are primarily related to (a) coarser cast structures (larger nodules), (b) a larger degree of alloy segregation to the cell boundaries (interdendritic regions) due to longer freezing distances, and (c) higher ferrite contents and coarser pearlite lamellar spacing due to slower cooling rates through the eutectoid transformation region. With this in mind, the mechanical properties of the 1-inch and 3-inch Y-blocks were compared. The difference in mean hardness between the 1-inch and 3-inch Y-blocks was significant (218 versus 205 HB, respectively). The decrease in average hardness (13 HB units) is relatively small when compared with the full range in hardness (158 to 253 HB) for the variations in alloy content and matrix microstructures in the 1-inch Y-blocks of all 9 heats and inoculation conditions. Similarly, the difference in mean yield strength between the 1-inch and 3-inch Y- blocks was relatively small (56 versus 51 ksi, respectively). The decrease in average yield strength (5 ksi) is relatively small when compared with the range in yield strength (45 to 65 ksi) for the variations in alloy content and matrix microstructures in the 1-inch Y-blocks. When comparing the tensile strength and % elongation in the 1-inch and 3-inch Y-blocks, the reduction in properties was much greater. The reduction in average tensile strength was 13% (97 ksi versus 84 ksi). The reduction in % elongation was 25% (12% versus 9%), and even more substantial. The Principal Investigators surmise that the reduction in % elongation is directly related to the coarser cast structure and greater alloy segregation in the 3-inch Y-blocks, and the lower UTS values are consistent with a reduction in ductility. The calculation of % strain hardening reflects the same loss in ductility with increasing section size, and this value decreased from 73% to 63%, respectively. The above analysis suggests that the section size effects are more related to a limitation in ductility with increasing section size, as opposed to a reduction in hardness and strength. They 43
45 also suggest that the effects of section size, as studied in this investigation, are not nearly as pronounced as the effects of alloy content and microstructure. In order to determine the effect of the section size variation statistically, the Principal Investigators performed two statistical tests on the average data in Table 16. The first test was a Pearson correlation matrix analysis and the second test was an unpaired and two-sided Student s t-test. Correlation Analyses Microsoft Office Excel was used to conduct Pearson Correlation Analyses as discussed in the Commercial Foundry Data Survey portion of this paper. Table 19 shows the r-values obtained for the average mechanical properties, key composition variables, and microstructural parameters as a function of section size shown in Table 16. For the purposes of the correlation analysis, all Ladle-Only inoculation values were assigned the value of 1 and all Ladle plus In- Stream inoculation values were assigned the value of 10. A negative value for a correlation coefficient (red numbers) means a negative correlation and positive values (blue numbers) mean positive correlations for r-values with magnitude greater than 0.4. When the magnitude of the r-value is 0.7 or greater, the correlation is believed to be extremely strong. Table 18 shows that the ultimate tensile strength, nodule count, and fine nodule size (% of Class 7 nodules) are strongly and negatively correlated with increasing section size from 1 to 3. Furthermore, all mechanical properties (strength, ductility, toughness, and strain hardening) decreased with increasing section size. Table 19 Pearson Correlation r-values for the DOE Section Size Effect Cast Section Size Dependent Variable 0.01 Inoculation Magnitude Brinell Hardness UTS (ksi) YS (ksi) %El at Fracture %RA % Elong Uniform Elongation (%) (UTS-YS)/YS (%) Toughness, UT (ksi-in/in) Nodularity (%) Nodule Count (mm-2) # of Class 7 (%) # of Class 6 (%) 0.72 # of Class 5 (%) 0.69 # of Class 4 (%) 0.79 Maximum Nodule Size (µm) 0.06 Graphite Volume Fraction (%) Mean Ferrite Volume Fraction (%) 0.41 Std Dev Ferrite Volume Fraction (%) C 0.12 P 0.07 Si Mn Cu CE Cu+Mn 44
46 Student s t-testing Minitab 15 was used to conduct Student s t-testing. A 2-sample and two-tailed t-test is a hypothesis test for two population means to determine whether they are significantly different. This test essentially determines whether or not there are significant differences between two sets of data. In this case, the two sets of data in Table 16 were separated, i.e., the collection of average mechanical properties for the 1 section size was one dataset and the collection of average mechanical properties for the 3 section size was the second dataset. The means and standard deviations were calculated for these two sets of data. This procedure uses the null hypothesis that the difference between two population means (µ) is equal to a hypothesized (H) value (H0: µ1-µ2 = 0 or µ1 = µ2) and tests it against an alternative hypothesis (H1: µ1 µ2). One result of the t-test is the value P. The rejection probability (P), also called alpha ( ) was measured for each of the dependent variables versus section size in the t-tests. P ranges from 0 to 1. The smaller the P-value, the smaller the probability that rejecting the null hypothesis is a mistake. The P-value is calculated from the observed sample and represents the probability of incorrectly rejecting the null hypothesis when it is actually true (Type I error). In other words, it is the probability of obtaining a difference at least as large as the one between the observed value and the hypothesized value through random error alone. After multiplying the P-value by 100 to convert it to a percentage, 100 minus the P% gives the percent confidence about stating that the 1 section size property differs significantly from the 3 section size property. If the test s P-value is less than some chosen level (usually 0.05 or 5%), then H0 should be rejected and H1 accepted. Figures 38 and 39 show Box Plots for the t-testing of two key mechanical properties (hardness and tensile strength) for the two section sizes; similar trends were found in yield strength and elongation. Figure 38 is annotated to show the values that are being plotted inside and outside the boxes, and the captions for all four figures contain the rejection probabilities (P-values) in percentage. Maximum value Line inside box is the median value; 50% of data are less than or equal to this value Top line of the box is the bottom of the fourth quartile. 25% of the data are greater than or equal to this value. Circle is the mean (average) Minimum value Box is the middle 50% of the data Bottom line of the box is the top of the first quartile. 25% of the data are less than or equal to this value. Figure 38. Student t-test for Brinell hardness as a function of section size with a 35.9% rejection probability (P-value). 45

47 Figure 39. Student t-test for Ultimate Tensile Strength (UTS) as a function of section size with a 2.8% rejection probability. The t-tests showed that all the hardness and tensile properties drop in value as the section size is increased. The decreases in tensile properties are significant with greater than 90% confidence, i.e., P < 10%. The difference in hardness is barely significant, with only 64% confidence, i.e., P 36%. Both the Correlation Analysis and the Student s t-testing showed that section size gives different mechanical property results and the data should be analyzed further by statistical analysis. All trends in composition, microstructure, and mechanical properties were thus analyzed separately for the 1 section size and for the 3 section size. DOE Results Correlation Analyses The individual data for the 1 section size and for the 3 section size were treated separately in Pearson Correlation analyses that were performed in the same manner as previously stated. Again, the authors assigned a value of 1 to In-Ladle Only and a value of 10 to In-Ladle & In- Stream to maximize the chance of revealing a correlation. The authors performed correlation analysis between all variables for each section size, and also eliminated all composition variables from the analysis to only study the elements that were intentionally varied in the DOE, plus a few major alloying elements. Tables 20 and 21 show the mechanical property, composition, and microstructural results for the 1 section size; similar results were obtained for the 3 section size. As before, a negative value for a correlation coefficient (red numbers) means a negative correlation and positive values (blue numbers) mean positive correlations for r-values with magnitude greater than 0.4. When the magnitude of the r-value is 0.7 or greater, the correlation is believed to be extremely strong. 46

48 Table 20 Pearson Correlation Analysis for Mechanical Properties in DOE 1 Section Size Table 21 Pearson Correlation Analysis for Composition and Microstructure in DOE 1 Section Size 47

 or factors.")
49 Main Effects Analyses Minitab 15 was used to conduct Effects Analyses from the Design of Experiments (DOE) matrix for both the 1 and 3 section sizes. Figures 40 to 46 contain Main Effects Plots for the key dependent mechanical property variables (responses) measured in this study for the 1 section size versus the independent DOE variables (stimuli) or factors. Figure 40 is annotated to help explain the various characteristics of a main effect plot. The Main Effect Plots obtained for the 3 section size were similar. 48

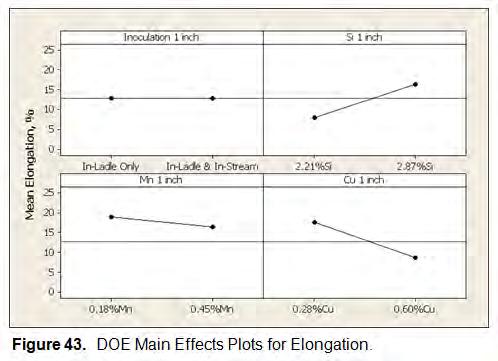
50 49


51 50
.")
52 The key mechanical property response variables are as follows: Brinell hardness, ultimate tensile strength, yield strength, elongation, reduction of area, toughness and strain hardening. A main effects plot is a plot of the means of the key mechanical property variables at each level of a factor. In this study, there were four factors (independent variables or stimuli). The four factors were Inoculation method, Silicon content, Manganese content and Copper content, each varied at two levels, for each of the section sizes (1 and 3 ). The main effects plots utilized the raw response data, and plotted points for the means at each level of the factor and connected them with a line. The horizontal line in each plot is a reference line at the grand mean of the response data. Minitab also draws a separate plot for each factorresponse combination. A main effect occurs when the mean response changes across the levels of a factor, and you can use main effects plots to compare the relative strength of the effects across factors. Factorial Fit Analyses Although the main effects plots of the analyses show the magnitude of the effects for the various variable combinations, these plots contain no statistical significance information. Minitab 15 was used to conduct factorial fit analyses for the Main and Interaction Effects. For the 1 section size, Table 22 shows the rejection probabilities for each of the effects on the key dependent variables as discussed earlier. Similar rejection probability results were obtained for the 3 section size but are not shown in this paper. 51
 Si 0.002 0 0.001 0.004 0.004 0.03 0 Mn 0 0 0 0.114 0.051 0.881 0.284 Cu 0 0 0 0 0 0 0 Inoculation*Si 0.43 0.56 0.593 0.082 0.128 0.025 0.453 Inoculation*Mn 0.174 0.894 0.508 0.006 0.")
53 Table 22 Rejection Probabilities (P-Values) for All of the DOE Factors in the 1 Section Size Interaction Effect HB UTS YS El RA U T SH Inoculation Main (none) Si Mn Cu Inoculation*Si Inoculation*Mn way Inoculation*Cu Si*Mn Si*Cu Mn*Cu Inoculation*Si*Mn way Inoculation*Si*Cu Inoculation*Mn*Cu Si*Mn*Cu way Inoculation*Si*Mn*Cu The rejection probabilities (P-values) are as defined earlier, wherein the smaller the P-value, the smaller the probability that rejecting the null hypothesis is a mistake. In this instance, the null hypothesis is that the factor is significant. Therefore, the main and interaction effects are significant for all the P-values colored red in Table 22. The red-colored P-values are all less than 0.05 or 5%. Pareto Charts of the Effects Minitab 15 was used to conduct Pareto analyses for the Main and Interaction Effects. Figures 47 to 52 contain Pareto Plots for selected key dependent mechanical property variables (responses) measured in this study versus the independent DOE variables (stimuli) or factors for the 1 section size. Similar Pareto Plots were obtained for the 3 section size. Figure 47 is annotated to help explain the various characteristics of a Pareto chart. 52


54 53


55 54

56 A Pareto chart of the effects is used to determine the magnitude and the importance of an effect. The chart displays the Student s t-value of each main or interaction effect. Minitab draws a reference line on the chart. Any effect that extends past this reference line is potentially important. Minitab uses Lenth's method 25 to draw the line. The reference line corresponds to a rejection probability of P or α equal to 0.05 or 5%. Summary of the Statistical Analyses Recall that the key mechanical property response variables are as follows: Brinell hardness, ultimate tensile strength, yield strength, elongation, reduction of area, toughness and strain hardening, and that there were four factors (independent variables or stimuli) as follows: Inoculation type, Silicon content, Manganese content and Copper content, each varied at two levels, for each of the section sizes (1 and 3 ). For the 1 section size, Table 23 shows the key mechanical properties as a function of the three statistical parameters and the four DOE variables. Similar summary results were obtained for the 3 section size but are not shown in this paper. An X signifies that the stimulus had a significant effect on the response, and a plus (+) or minus (-) sign indicates the direction of the effect. 55
57 Table 23 Summary of all DOE Statistical Test Results for 1 Section Size Inoculation HB UTS YS El RA U T SH Main Effect Plot Rejection Probability Table X Pareto Chart Si HB UTS YS El RA U T SH Main Effect Plot Rejection Probability Table X X X X X X X Pareto Chart X X X X X Mn HB UTS YS El RA U T SH Main Effect Plot Rejection Probability Table X X X Pareto Chart X X X X Cu HB UTS YS El RA U T SH Main Effect Plot Rejection Probability Table X X X X X X X Pareto Chart X X X X X X X For both section sizes, the following trends were noted: Increasing Cu and/or Mn contents increased strength and hardness. Increasing Cu and/or Mn contents decreased ductility and toughness (UT) Increasing Si content generally decreased strength and increased ductility In all (but one minor case), Inoculation had no effect on mechanical properties Somewhat different trends were noted for the two section sizes as follows: Varying Mn was more effective than Cu in affecting the properties in the 3 section size Varying Si was less effective in the 3 section size versus the 1 section size Both strength and ductility were higher in the 1 versus the 3 section size (also see Table 18) Tables 18 and 19 demonstrate that all the mechanical properties (both strength and ductility) were higher in the 1 section size versus the 3 section size. Since the properties were so much lower in the 3 section size, the alloying effects were less potent in the 3 section size. This aspect is consistent with earlier section sensitivity work
58 For the most part, the addition of in-stream inoculation did not significantly increase any silicon content, microstructural, or mechanical property as compared to utilizing ladle inoculation by itself. Late stream inoculation is a proven method to improve nodularity and nodule count. The absence of such improvements in this study could mean that the ladle inoculation technique and pouring sequence had already maximized the inoculation effect, or it could mean that the technique selected for this study was neither effective nor ineffective. In any event, the study results should not detract from the known fact that late stream inoculation is an effective means of maximizing nodularity and nodule count. As discussed above, the three alloying variables all contributed to the variation in mechanical properties, although changing the copper content had the most potent main effect on mechanical properties. A main effect means that there is a relationship between any mechanical property (dependent variable) and a single elemental content (independent) variable. Tables 22 and 23 and the Pareto plots in Figures 47 to 52 show that a few 2-way and 3-way interactive effects in the composition variables had some selected effect, but there were no consistently effective interaction alloy terms. From a practical standpoint, the copper addition effects of increasing strength and decreasing elongation are consistent with existing theory and practice. It should be noted that the authors performed an evaluation of the various microstructural parameters (e.g., nodule count) as a function of changes in the DOE variables. However, the trends in the data were not visually apparent in simple X-Y plots of the data and the trends were not statistically significant. Therefore, no such results are presented in this paper. The Pearson Correlation Analysis and various statistical routines conducted in the Design of Experiments (DOE) showed that excellent variables and variable levels were selected for the DOE. Major effects and their magnitudes were clearly identified, or they were absent so that strong conclusions could be drawn. Alloying Trends Examination of the data in Figures 33 and 34, and in Table 21, as well as in the DOE Main Effects plots in Figures 40 to 46 from this study, show the following effects of the alloying elements: Table 21 shows that Copper is more effective than Manganese in increasing Pearlite content, i.e., there is a more negative correlation coefficient in the relationship between Copper and Ferrite contents versus Manganese and Ferrite contents. Table 21 shows that Copper is also more effective than Manganese in increasing strength. Figure 33 shows that the high-cu Experimental Casting alloys #5 and #6 have higher yield strength and elongation combinations than the trend line from the Commercial Foundry Data Survey. In contrast, the high-mn Experimental Casting alloys #3 and #4 have lower yield strength and elongation combinations than the trend line from the Commercial Foundry Data Survey. Selection of a Heat for Validation The Principal Investigators selected a heat to confirm the results from the foundry that cast the DOE heats. It was important that one of the 8 DOE heat compositions was selected to ensure 57
59 that an uncontrolled variable did not enter into the study. However, a secondary hope was that the verification heat might have the best opportunity to achieve the simultaneously high strength and ductility targets. Foundry E from the Commercial Foundry Data Survey was chosen for casting the verification heat. Based on the results of this study, particularly in Table 14 and Figure 33, the Principal Investigators chose to validate by casting 1 Y-blocks of Heat 6 which contained 3.7% nominal carbon content. The three main elements in the study were Si, Mn, and Cu. Nominal aim for the verification heat with these 3 elements was as follows: 2.6% Si, 0.3% Mn, and 0.6% Cu. Other details of the casting operation are contained in Reference 21. The verification results are shown in Table 24. The results of the new repeat heat essentially duplicated those of DOE Heat 6 with equivalent composition, microstructure, strength and ductility. Table 24 Results from Verification Heat V vs. Heat 6 (in red) from DOE Study Overall Sample # Cast Section Size 1" Y block Heat # 6 6 V V V V Replicate A B Ave A B C Ave. Mold Inoculation Position Bottom In-Ladle Bottom Bottom Bottom Bottom Brinell Hardness UTS (ksi) YS (ksi) %El(at Fracture by Extensometer) %RA % Elong Uniform Elongation (%) (UTS-YS)/YS (%) Toughness, UT (ksi-in/in) Nodularity (%) Nodule Count (mm -2 ) # of Class 7 (%) # of Class 6 (%) # of Class 5 (%) # of Class 4 (%) Maximum Nodule Size (µm) Graphite Volume Fraction (%) Mean Ferrite Volume Fraction (%) Std Dev Ferrite Volume Fraction (%) C S <0.005 < P Si Mn Cr Ni Mo <0.01 < V Al Cu Mg Ti Sb <0.005 <0.005 <0.005 <0.005 <0.005 <0.005 Ce Sn <0.005 <0.005 <0.005 <0.005 <0.006 <0.006 Carbon Equivalent (CE)


60 Heat Treatment Effect A few unconventional heat treatments were employed on selected alloys from the Experimental Castings Research portion of this study in an attempt to produce fine-grained microstructures, which might exhibit improved combinations of mechanical properties. The inspiration for this study was provided by an earlier study 26 wherein heat treatment in the intercritical region produced a microstructure consisting of fine-grained acicular austenite in proeutectoid ferrite. When quenched from the intercritical temperature, the acicular austenite transformed to martensite, and the as-quenched microstructure displayed a significant amount of grain refinement over the as-cast structure. It was also anticipated that, with slower cooling conditions, air-cooling from the intercritical temperature will produce a similar fine-grained structure consisting of acicular pearlite in ferrite. Indeed, one of the sponsors submitted a commercial casting with such a microstructure, as shown in Figures 53 and 54. This commercial casting displayed mechanical properties of 225 HB, 66 ksi YS, 105 ksi UTS, and 10% elongation. The theory behind the intercritical heat treatment is, while heating in the intercritical region, the metallic matrix is partially austenitized by recarburization of the ferritic-pearlitic matrix. Recarburization occurs by the dissolution of graphite and diffusion of carbon along the ferrite grain boundaries that intersect the graphite nodule. Subsequently, carbon migrates from the grain boundaries into the ferrite matrix along intercrystalline planes to produce lenticular grains of austenite within the ferrite grain. Once equilibrium is achieved, the resultant microstructure Note that a grain signifies one crystallographic orientation. Therefore, a pearlite grain is never a proper usage since there are two sets of crystallographic orientations in pearlite, i.e., one crystallographic orientation in the ferrite phase and the other orientation in the cementite phase. The acicular terminology is used herein to describe a single set of crystallographic orientations in the cooperative growth of ferrite and cementite, which forms a single microstructural unit of pearlite. In one textbook, 27 a pearlite nodule combines with one or more other pearlite nodules to form a colony, i.e., a pearlite nodule is a subset of a colony. In another literature source, 28 which reviews multiple references of pearlite formation, a pearlite colony is a subset of a pearlite nodule. In any case, the smaller unit that is equivalent to a grain of proeutectoid ferrite is under discussion herein. 59
61 consists of numerous acicular austenite grains surrounded by the parent ferrite grains which, at the intercritical temperature, are stable and in equilibrium with the austenite phase. When quenched in oil from the intercritical temperature, the austenite transforms to martensite, producing a relatively high-strength material with modest ductility. On tempering, the martensite becomes tempered and ductility improves. Depending upon the tempering temperature, the extent of martensite tempering varies and the balance between strength and ductility changes. Alternatively, with air-cooling, the fine-grained austenite that formed at the intercritical temperature will transform to pearlite colonies with an acicular morphology, resulting in a finegrained ferrite-pearlite structure. The proportion of ferrite and pearlite is somewhat dependent on the cooling rate. It is anticipated that with slower cooling some austenite will decompose to ferrite and graphite prior to reaching the pearlite nose. Consequently, the fine-grained structure developed during intercritical heating may become somewhat degraded on air-cooling. It is not possible to inhibit austenite from forming ferrite, except by rapid quenching in oil or by forced-air cooling. (Alloying with copper and tin may also cause the austenite to be more stable, but here we are studying heat treatment alone.) The proportion of ferrite and acicular austenite that develops is a function of the intercritical temperature and chemical composition. As demonstrated earlier, 26 chemical composition has a significant effect on the upper and lower critical temperatures in ductile iron. The optimum amount of austenite (and the proper intercritical temperature) required to achieve the best mechanical properties must be determined by experiment. For this investigation, Conditions #20, #44 and #52 (see Table 15) were selected for the heat treatment study. These three samples represented equivalent section size (1 ) and inoculation (In-Ladle & In-Stream) of three different heats, i.e., Heats 2, 4, and 5 in Table 15, respectively. These three heats represent alloys having as-cast microstructures consisting of predominantly ferrite, an equal mixture of ferrite and pearlite, and predominantly pearlite, respectively. Three heat treatment trials were conducted. For the sake of brevity, Reference 21 contains the mechanical properties and microstructures for the first two trials although the descriptions are included in this paper. First Heat Treatment Trial The first heat treatment study was conducted with 5/8" by 1" by 1" samples with variations in heat treatment temperature and cooling rate. All the conditions involved heating for 1 hour at the intercritical heat treatment temperature, followed by still-air cooling, forced-air cooling or oilquenching, where quenching was performed. When tempering was performed, the samples were tempered for 2 hours at the tempering temperature. The same intercritical temperatures were chosen between the upper and lower critical temperatures that were calculated from the earlier work 26 ; the upper and lower critical temperatures varied slightly for the three heats 2, 4 and 5. The microstructures of the heat treated samples were generally refined as compared to the ascast samples, which is consistent with the significant increase in hardness of the small samples 60
62 versus the as-cast condition. Upon examination of the microstructures, the results showed that the best starting microstructure prior to heat treatment is a fully ferritic material. Furthermore, the microstructures of the heat treated samples were very similar to those that the investigators examined at the outset of this study for the commercial castings that were shown in Figures 53 and 54. Second Heat Treatment Trial Subsequently, in a second series of heat treatment experiments, Y-block legs were heat-treated to selected heat treatment cycles quite similar to those of the first heat-treatment trial. The tensile properties and hardness of these heat-treated Y-block legs were determined. In all cases, the hardness increased with heat treatment of the small samples, but the trend was less pronounced when full tensile sections were heat treated. Although the heat treatments were designed to produce microstructural manipulations to search for trends, only the heat treatment of sample 4 showed some promise versus its as-cast condition, wherein the strengths remained constant but the reduction in area increased. Although the second heat treatment trial samples showed general structural refinement as compared to the as-cast samples, section size during heat treatment strongly affected the hardness and microstructure balance. Much less structural refinement was observed in the heat treated tensile blanks as compared to the small samples. Third and Final Heat Treatment Trial The previous experiments with intercritical (IC) heat treatment indicated that at the IC temperature the microstructure consists of acicular austenite grains in ferrite. The acicular austenite grains had limited stability on cooling from the intercritical temperature to below the lower critical temperature (A 1 ). With small test samples, the desired microstructure was achieved. However, with air-cooling of the 1 by 1 by 6 Y-block leg, the austenite partially decomposed to ferrite and graphite, the hardness and tensile properties decreased, and the ferrite content increased. For the third and final heat treatment experiments, the heat treatment temperatures and cooling rates were adjusted. Only Y-block legs from Heats 2 and 4 were chosen for heat treatment. The following three different approaches were investigated. 1. Forced-air cooling of the Y-block leg should help to inhibit decomposition of the austenite to ferrite before reaching the pearlite nose. 2. With still air-cooling, it was anticipated that excess austenite decomposition will occur. Therefore, still-air cooling from a higher intercritical temperature was attempted. In this manner, the final pearlite content will remain relatively high. 3. Oil-quenching was repeated and two lower tempering temperatures were applied to try and develop a fine-grained acicular martensite in ferrite, having a higher hardness and strength. 61
63 The following experiments were performed: Experiment #1: (Y-Block legs from Heats #2 and #4) o Heat treat from similar intercritical temperatures (see Table 25) as the second heat treatment trial and apply forced-air cooling o Conduct hardness, tensile testing and metallography (including determination of % Ferrite) Experiment #2: (Y-Block legs from Heats #2 and #4) o Heat treat from a higher intercritical temperature (see Table 25) versus the second heat treatment trial and apply still-air cooling. o Conduct hardness, tensile testing and metallography (including determination of % Ferrite) Experiment #3: (Y-Block legs from Heats #2 and #4) o Heat treat from similar intercritical temperature (see Table 25) as the second heat treatment trial and oil quench o Then, temper for 2 hours at two different temperatures (between 500F and 900F) to vary the hardness and mechanical properties o Conduct hardness, tensile testing and metallography (including determination of % Ferrite) Tables 25 and 26 show the results. The most promising conditions to meet the >55 ksi YS, >80 ksi UTS, and >12% Elongation goals are shown in red in Table 26. Sample ID Heat No. Table 25 Results of Third Heat Treatment Trials Starting Microstructure Intercritical Heat Treatment Temperature & Subsequent Condition Brinell Hardness Ferrite Content #20 As-Cast (No Heat Treatment) A-FAC 1525F + Forced Air Cool B-AC 2 92%F-8%P 1545F + Air Cool C-Q&T-L 1525F Q&T at 800F D-Q&T-H 1525F Q&T at 925F #44 As-Cast (No Heat Treatment) A-FAC 1525F + Forced Air Cool B-AC 4 51%F-49%P 1545F + Air Cool C-Q&T-L 1525F Q&T at 800F D-Q&T-H 1525F Q&T at 925F
64 Sample ID Table 26 Mechanical Properties Resulting from Third Heat Treatment Trial Heat Condition Hardness UTS, YS, ksi HBW3000 ksi %El %RA 1 2 2A-FAC B-AC C-Q&T-L D-Q&T-H A-FAC B-AC C-Q&T-L D-Q&T-H Ferrite % All of the third trial heat treatment data are also plotted in Figure 55 for comparison with the ascast properties of the materials from both Phase 1 and Phase 2, as well as the yield strength and elongation specifications for the standard grades 40-18, 45-12, 55-06, 70-03, and Figure 55 shows that the Quench & Temper heat treatments exhibit much higher strength at equivalent ductility than the Normalized heat treatments, the Phase 1 trend line, and the specifications for the standard grades. Several conditions exceeded the goals of this study. Although the 12% elongation minimum was not quite achieved, the Q&T produced higher strengths at equivalent ductilities for many of 63


65 the lower strength grades in the as-cast grades. The most promising results were obtained by quenching and tempering the heat with a starting 50:50 ferrite pearlite ratio. For the still-air cooled and forced-air cooled samples, the ferrite content decreased significantly over those of heat treatment Trial 2, and the combinations of strength and ductility were promising. Figures 56 to 59 show typical micrographs for the conditions colored in red in Table 26. Selected phases are labeled in Figures 57 and 59. These heat treated samples exhibit significant structural refinement as compared to the corresponding micrograph for the as-cast condition from Heat #4, which is shown in Figure


66 65

67 It is interesting to note that, when plotted against ferrite content, the yield strengths of the heattreated test bars are generally higher than those of the as-cast materials of this study, see Figure 61. The elevated ferrite content in the heat-treated alloys is expected to provide improved machinability when compared to as-cast materials produced to the same strength level. YS, ksi Heat-Treated YS = *%Ferrite R 2 = rd Heat Treatment Trial Heat 1 from Phase 2 Heat 2 from Phase 2 Heat 3 from Phase 2 Heat 4 from Phase 2 Heat 5 from Phase 2 Heat 6 from Phase 2 Heat 7 from Phase 2 Heat 11 from Phase 2 Linear (3rd Heat Treatment Trial) Linear (All Heats) As-Cast YS = %Ferrite R 2 = % Ferrite Figure 61. Results of the Third Heat Treatment Trials with the as-cast data from Phase 2. Note that the heat treated samples (red) have higher ferrite contents than the as-cast samples. 66