Revitalizing Agriculture Sector in Andhra Pradesh: Role of Agriculture Diversification and Agro-Processing
|
|
|
- Candice Hines
- 6 years ago
- Views:
Transcription
1 Markets, Policy and Impacts ICRISAT Progress Report 134 Revitalizing Agriculture Sector in Andhra Pradesh: Role of Agriculture Diversification and Agro-Processing P Parthasarathy Rao, P.K. Joshi, Shravan Kumar and Dhrmendra Kar ICRISAT International Crops Research Institute For the Semi- Arid Tropics In collaboration with International Food Policy Research Institute December 2005
2 About the authors P.Parthasarathy Rao Senior Scientist (Market, Policy and Impact), ICRISAT, Patancheru , Andhra Pradesh, India. P.K.Joshi Senior Research Fellow and Coordinator for South Asia, IFPRI, South Asia Office, New Delhi, India. Shravan Kumar Scientific Officer (Market, Policy and Impact), ICRISAT, Patancheru , Andhra Pradesh, India. Dharmendra Kar Scientific Officer (Market, Policy and Impact), ICRISAT, Patancheru , Andhra Pradesh, India.
3 Acknowledgements This paper is based on a joint IFPRI-ICRISAT collaborative project on Agricultural Diversification in India. Financial assistance for covering operational cost of the project from IFPRI is acknowledged. The authors would like to thank colleagues from IFPRI, ICRISAT, NCAP, and PAU for their valuable comments on this study at a Review Meeting held in New Delhi and seminars in IFPRI office at Delhi and Washington, where the preliminary findings of this study were presented. We acknowledge and thank Dr. B. Shifaraw, Economist, ICRISAT for providing household level data on costs and returns for selected watershed villages in Andhra Pradesh. Our thanks to all the Government Departments and officials who spared their time to provided all the data and information required for this study. Finally, our special thanks to Ms. Gloria Christina for her excellent support in data processing, data analysis and graphics.
4 Contents Introduction Background Change in consumption pattern Objectives and hypotheses Organization Data and Methodology Defining agricultural diversification Approaches and data Mapping of Agricultural Diversification Sector wise share and growth of agriculture in Andhra Pradesh Delineation of high value commodity zones Characterization of diversification zones Composition of value of agricultural production and sources of diversification Spatial analysis of high value commodities Factors Influencing Diversification Towards High Value Commodities Background of urbanization and rising incomes Urbanization and HVCs Composition of production by urbanization Per capita income and HVCs Supply side factors Model selection, description and quantification of factors Implications of Agricultural Diversification Economics of crop production in Andhra Pradesh Microeconomics of agricultural diversification: implications on income Implications on employment Implications for small farmers Implications on sustainable use of natural resources: water saving /maintenance of soil health Environmental issues relating to fisheries Policy initiatives required for promoting diversification Constraints to Agricultural Diversification Credit Marketing Post- harvest infrastructure Impact of SPS measures on exports of high value commodities Constraints facing the food processing industry
5 Vertical Coordination in High Value Commodities Need for vertical coordination Contract farming initiatives and models Case studies of vertical coordination / contract farming in Andhra Pradesh Documentation of government initiatives promoting vertical coordination Reforms in agricultural marketing Food Processing Industry Food Processing Industry: The emerging Sector Structure of food processing industry: Andhra Pradesh Innovations in export marketing: Agri-Export Zones (AEZ s) Policy changes initiated to promote food processing industries: All-India and Andhra Pradesh Road Map for Agricultural Diversification References Tables Graphs Maps Appendices Appendix 1: Changes in cropping pattern and value shares: 1970 to 2000 Appendix 2: Marketing of horticulture crops Appendix 3: Contract farming - Perception on contract farming Appendix 4: Model Marketing Act Appendix 5: Agri-Export Zones (AEZs ) Appendix 6: Fisheries sector draft policy paper and on-going schemes in Andhra Pradesh Appendix tables
6 Citation: Parthasarathy Rao P, Joshi P.K, Shravan Kumar and Dharmendra Kar Revitalizing Agriculture Sector in Andhra Pradesh: Role of Agricultural Diversification and Agro-Processing. Progress Report no International Crops Research Institute for the Semi-Arid Tropics, Patancheru , Andhra Pradesh, India: 133 pp. Abstract This study was undertaken to document how the production portfolio of the agriculture sector in Andhra Pradesh state is responding to the changing demand scenario in favour of High Value Commodities (HVCs) like fruits, vegetables, milk, meat, fisheries etc. and address a few key research questions. For example, what are the key policy and institutional impediments in promoting HVCs in the state? How effectively are producers linked with the markets and agro-processing sector? Are smallholders participating in this transformation from cereal-based production system to high-value agriculture? Although the HVC sector has performed well in the state during the last decade (measured in terms of annual growth) compared to the traditional crop sector, there are a number of critical areas that directly or indirectly effect HVCs production. These include availability of credit, post harvest infrastructure and marketing, cold chain, quality-testing labs, vertical coordination for niche commodities, food processing industry, etc. Policies to promote investments in these areas would help in speeding up diversification of the agricultural sector towards HVCs and thus revitalize the agricultural sector.
7 CHAPTER I INTRODUCTION Background Andhra Pradesh state was in the limelight during the late 1990s for taking bold initiatives towards economic reforms to improve quality of governance and accelerate economic growth. The state also became one of the front-runners in the field of Information Technology in India. During the same period, the state also had the dubious distinction of highest number of farmers suicides, large-scale out-migration from rural to urban areas, increase in share of agricultural laborers compared to cultivators and highest incidence of child labor 1. Such a paradox was mainly due to slowing down of agricultural growth and deteriorating health of the agricultural sector. The main concern was declining investment and rising input subsidies in agriculture, fatigue in technological change, deceleration in the productivity growth of major crops, and fall in the total factor productivity (Hanumantha Rao and Mahendra Dev 2003). Agriculture sector is the principal source of livelihood for over 70 percent of total population in Andhra Pradesh. It contributes about one-third of the State s Gross State Domestic Product. The state has attained the status of food surplus state in India but still 21.6 percent of total population (approximately 16 million) is below poverty line in 2000 (World Bank 2005a). The agricultural sector is dominated by small and marginal farmers. Their share in total holdings increased from 65 percent in the 1970s to 81 percent in the 1990s, which makes these holdings unviable for domestic and global competitiveness 2. Agricultural sector of the state is under serious crises. A host of problems such as growing farmers suicides, rising costs of production, declining farm profits, deteriorating quality of soil & water resources and growing smallholders are obvious reasons for revitalizing agricultural sector. Therefore, it is important to explore alternative options to accelerate agricultural growth, reduce disparities and improve the quality of life in the state. In this direction, the state prepared a document, Andhra Pradesh- Vision 2020, and through this embarked on a road map to make Andhra Pradesh the foremost state in the country in terms of growth, equity and quality of life. It envisioned Andhra Pradesh a strong and vibrant agriculture sector by achieving an average annual growth rate of 6 percent over the next 25 years from 2.6 percent during (GOAP 1999). To accomplish the uphill task, high potential sectors were identified: dairy, fruits & vegetables, poultry, fisheries and agro-processing. These are often characterized as 1 During the 5 year period between 1997 and 2002 a total of 877 suicides by farmers were reported in the state. 73% of these were reported in Telangana region (Nirmala 2003). Regarding child labor in the state 25.1 % of the children of rural areas in the age group of are workers as against 9.3 % of all India. In urban areas 7.1 % of age group10-14 are workers compared to 4.3% at the all-india level (NSS 2000). 2 The average size of holding has declined from 2 ha in 1982 to 1.4 ha in 2000 The area operated by small and marginal farmers increased from 30 percent in 1982 to 43 percent in 2000 (GOAP 2003). 1
8 high-value commodities (HVCs), and are potential sources for augmenting income, generating employment opportunities, and promoting export. Incidentally, the demand for these commodities is increasing in the state as well as at the national and global levels. Change in consumption pattern At the all-india level, while the per capita consumption of fine and coarse cereals has remained stagnant or declined, the consumption of HVCs increased significantly between 1977 to 1999 (Table 1). The growth in demand for HVCs is not confined in urban areas alone but is also visible for rural consumers (Mahendra Dev 2004). Similar trends are observed when we look at the proportion of food expenditure on different food groups both at all-india and state level. (Table 2). For instance, in Andhra Pradesh between and 2003 the share of HVCs in total food expenditure increased from 20.3% to 30.4% for rural consumers and from 26.6% to 35.7% for urban consumers. The changing consumption pattern clearly reveals that food security is no longer restricted to availability of cereals but includes a diversified basket that includes milk, meat, fruits & vegetables, fish and processed commodities (Hanumantha Rao 2000a). There are predictions that the domestic and export demand for the HVCs will continue to be robust in the near future with rising population, increasing incomes, growing urbanization, and changing tastes and preferences (Kumar et al 2003). This has opened opportunities for least developed countries to enter agri-food exports in a big way. For example in 1998 LDCs accounted for about 35% of world export of fruits and vegetables compared to less than 15% for cereals and products (Bonilla and Reca 2000). In India too, while the value of agricultural exports to total exports has declined the share of HVCs in agricultural exports has increased between 1990 and Within the HVCs, animal products, fruits and vegetables dominate exports (in value terms) (D.G. C.I.S., Ministry of Commerce, Kolkata). Under this changing scenario it is to be seen how the production portfolio in the state is responding to changing demands of HVCs. What are the key policy and institutional impediments in promoting HVCs in the state? How producers are linked with the markets and agro-processing sector? Are smallholders participating in this transformation from cereal-based production system to high-value agriculture? These are some of the research questions that are addressed in this study. Objectives and Hypothesis The overall goal of the study is to map the changing production portfolio in Andhra Pradesh, understand the underlying factors promoting (and/or retarding) agricultural diversification towards HVCs, analyze opportunities and constraints to agricultural diversification, and document evolution of innovative institutions that link farmers with the markets. More specifically the objectives of the study are: (i) document current trends in agricultural diversification towards HVCs; (ii) identify and quantify major factors driving agricultural diversification, (iii) analyze present policies and prevailing institutions promoting or impeding agricultural diversification, (iv) assess the role of innovative institutions in promoting HVCs; and (v) suggest strategies and policies for 2
9 revitalizing the agricultural sector through the production of high-value and processed commodities. The study postulated three hypothesis: (i) agricultural sector in Andhra Pradesh is gradually diversifying towards HVCs and benefiting smallholders; (ii) demand side factors are driving production of HVCs, while lack of adequate markets and high-risk in production and marketing (including prices) often impede their supply; and (iii) current policies and institutions are constraining the investments for creating required infrastructure and promoting agro-processing sector. Organization After the introductory chapter, we clarify the concept of agricultural diversification in the context of this study. This is followed by an overview of the agriculture sector in Andhra Pradesh highlighting temporal and spatial patterns of agricultural diversification. In Chapter 4 we discuss and quantify the drivers of agricultural diversification, which is followed by a Chapter on the income and employment effects of agricultural diversification. In Chapter 6, we analyze and discuss the current scenario related to marketing, credit and processing in the context of diversification and the role of innovative institutions in promoting agricultural diversification. Finally, we propose a road map for agricultural diversification towards HVCs in Andhra Pradesh. 3
10 CHAPTER II DATA AND METHODOLOGY Defining Agricultural Diversification Diversification of agriculture is a process that has several dimensions. It can be viewed, narrowly, as a larger-mix of activities within agriculture involving crop substitution. Agricultural diversification is also referred as shift of resources from one crop activity (or livestock) to a different set of crops and livestock activities keeping in view the varying nature of risks and expected returns from each crop/livestock activity, and adjusting in such a way that it leads to an optimum income portfolio (Joshi et al. 2003). In a broadest sense, it is a dynamic optimal mixture of farm production alternatives capitalizing on, between-farm heterogeneity in terms of resource availability and qualities (Barghouti et al. 2004). It is however, important to note that diversification of agriculture is a process accompanying economic growth, characterized by a gradual movement out of subsistence food crops to a diversified market-oriented production system, triggered by improved rural infrastructure, rapid technological change in agricultural production, particularly food staple production, and changing food demand patterns (Rosegrant and Hazell 1999). Diversification of agriculture, therefore, involves more than merely growing crops other than food grains. It is linked to the overall structural transformation of the economy leading to a decline in the share of agriculture in GDP. In the new context, agricultural diversification involves not only production processes but also new marketing and agribusiness based industrial activities that expand the income sources of rural households and affect the overall rural economy. Thus, in our context, agricultural diversification encompasses change in production portfolio from low-value to high-value commodities that further stimulates supply chain and expands farm and non-farm sources of income. This process is likely to accelerate agricultural growth and usher new ear of rural entrepreneurship to generate employment opportunities. Experiences from most of the Southeast Asian countries and some scattered examples from the South Asian countries revealed that agricultural diversification towards high-value commodities was responsible for developing innovative supply chains and opened new vistas for augmenting income, generating employment and promoting export (Shanmugasundaram 2004; Barghouti et al 2004; Pingali 2004; Deshingkar et al 2003; Pokharel 2003; Wickramasinghe et al 2003; Goletti 1999) It was further observed that food and income security improved in regions where agricultural diversion took place in favor of horticulture activities, animal husbandry, and aquaculture (Shanmugasundaram 2004; Barghouti et al 2003; Dorjee et al 2002) There appears immense scope for agricultural diversification towards high-value commodities in South Asian countries as more than 80 percent cropped area by smallholders is still occupied by cereals (FAO 2003). For this study, agricultural diversification is viewed as a shift in production portfolio toward high-value commodities like fruits, vegetables, milk, meat, eggs, fish and spices. All these commodities are perishable; their post-harvest management, marketing and processing would be different than food grains. The share of fruits & 4
11 vegetables, milk, meat, fish in total value of agricultural output was used as a proxy for agricultural diversification. A region is assumed to be more diversified if the share of high-value commodities (namely fruits, vegetables, milk, meat, poultry and fisheries) in the total value of agricultural output is higher compared to other regions / locations. Approaches and Data District level data: We have used the district-level database for India, available with International Crops Research Institute for the Semi-Arid Tropics (ICRISAT) from 1980 to 1998, updated till 2002 for all the districts in Andhra Pradesh and expanded to include more variables relevant to this study 3. The database included more than 200 variables on crops, livestock population and products, land use, technology, inputs, infrastructure, agro-climatic, socioeconomic and demographic indicators for 23 districts in Andhra Pradesh. But the analysis is confined to 20 districts. It is because the data for three recently carved districts, namely Prakasam, Vizianagaram, and Rangareddy, were amalgamated with their parent districts to maintain continuity in the database over time. Nature and Speed of Agricultural Diversification Nature and pattern of agricultural diversification in Andhra Pradesh was understood by computing the shares of different commodities in the value of agricultural output. It was corroborated by analyzing changes in production and area (in case of crops) and numbers (in case of animals). The speed of agricultural diversification was examined by computing annual compound growth rates of share of different commodities in the value of agricultural commodities over time, at constant prices. Annual compound growth rates of area (and number for animals), production and productivity were also computed to assess the performance of different commodities. This was further corroborated by estimating sources of change in gross value of agricultural output over time. The analysis was carried out for all the districts and district groups / regions in Andhra Pradesh. The spatial pattern of nature and extent of agricultural diversification was mapped using digitized maps with Arc view. The analysis covers two decades from to Drivers of agricultural diversification Simple correlation and multivariate regression analysis was carried out for quantifying the drivers of agricultural diversification. Separate models were estimated for fruits, vegetables, milk, and meat. One combined model for all HVCs was also estimated. OLS and Seemingly Unrelated Regression Estimates (SURE) techniques were tried to arrive at the best estimates. The problems related to multicoliniarity and hetroscedasticity were corrected. District-level cross-section data for was used for this analysis. Implications of Diversification on Farm Income and Employment Cost and returns of different commodities in Andhra Pradesh were compared to identify high-profit and low-cost commodities. The costs and returns of important commodities in Andhra Pradesh were also compared with other states. The comparison of costs and 3 While data related to the crop sector, land use, inputs, and infrastructure was readily available from secondary sources, data on livestock outputs at the district level were not available. State level data on value of livestock products by species were collected from Central Statistical Organization (CSO) and the state value was apportioned to the districts based on proportion of livestock population /production of milk, meat etc in each district. 5
12 returns is based on the commercial cost of production (C2), which includes paid-out costs and imputed costs. The paid-out costs include hired labor (human, bullock and machinery charges); maintenance expenses on owned animals and machinery; expenses on inputs such as seed, fertilizer, manure, pesticide and irrigation; depreciation on implements and farm buildings; land revenue; and rent paid for leased-in land. Imputed costs include value of family labor, rent of owned land and interest on owned fixed capital. Net returns were computed by subtracting gross returns (quantity of produce multiplied by prices received) from the commercial cost of production. Data for this section came from both published sources and farm surveys. For major food grains and oilseed crops, data published by the Government of India (compiled under Comprehensive Cost of Cultivation Scheme), were used. The Comprehensive Cost of Cultivation Scheme of the Government of India does not collect information related to horticultural and other high-value commodities (potato and onion are exception). Therefore, for comparing costs and returns of horticultural crops, the analysis relied on data collected under the baseline 4 surveys of sample households in 8 selected benchmark watershed villages located in 4 districts of Andhra Pradesh for the cropping year The households in the baseline surveys were randomly selected using stratified random sampling techniques. More details of sampling and data information are discussed in Chapter V. Costs and returns related to the dairy, poultry and fisheries sector are collected through surveys and interviews of key players. Supply Chain and Vertical Coordination Supply chain analysis of important fruits and vegetables has been done to evaluate the marketing costs and margins under different institutional arrangements. Data for this analysis was compiled from major fruit and vegetable markets in Hyderabad. These were Compared with the costs and returns under the innovative Raythu Bazaar 5 and direct marketing models. Few case studies of innovative production and marketing arrangements were carried out for gherkins (a species of cucumber), oil palm and grapes in selected districts of Andhra Pradesh. Data for the case studies on supply chain and vertical coordination were collected from the households participating in the supply chain and innovative institutional arrangements for production and marketing. The data was also supplemented by interviewing the key stakeholders in the supply chain including traders, processors/ exporters, policy documents of central and state government related to agricultural marketing, contract farming, processing, credit, and extension. Literature review further enriched the above sources. 4 Baseline surveys in selected watershed villages in 3 districts under the Andhra Pradesh Rural Livelihood Project (APRLP) and 1 district under an ADB project were carried out prior to interventions under the project. The surveys covered major socioeconomic and biophysical constraints to sustainable production. The socioeconomic aspects covered household and demographic characteristics, land ownership, land use, livestock and other assets, cropping pattern, yields, profitability and markets and infrastructure etc. 5 Rythu Bazar is a designated piece of land with necessary market infrastructure set up by the Government of Andhra Pradesh to facilitate the direct marketing of fruits and vegetables by farmers from nearby villages to urban consumers. A unique feature of this market is the elimination of middlemen between the farmer and the consumer, thus reducing transaction costs and ensuring higher returns to farmers. 6
13 CHAPTER III MAPPING OF AGRICULTURAL DIVERSIFICATION Sector wise share and growth of agriculture in Andhra Pradesh Consistent with the theory of economic development the share of agriculture and allied sectors in the state GSDP has declined from more than 40 percent in early eighties to around 25 percent in In contrast, the share of the service sector increased from around 32 percent to 50 percent during the same period (Figure 1). Not only has the share of agriculture declined, but also several changes have been taking place within the sector. Historically, the agriculture sector in Andhra Pradesh has gone through various facets of development during the last 40 years or so, i.e., pre-green revolution phase, first and second phase of green revolution and finally the post liberalization phase or the decade of 90ies. The growth in the agriculture sector (crops) was significant in the first (1970s) and second phase (1980s) of the green revolution touching around 3.5% per annum. In the second phase the growth was mainly due to shift in production from food grains to production of commercial crops like cotton, oilseeds etc (Subrahmanyam and Satya Sekhar 2003). Since then, in the nineties, there has been a steep decline in the growth of crop production including commercial crops. Deceleration in the productivity growth of major crops is an important factor contributing to stagnation in the crop sector. For example, stagnation in rice productivity, decline in productivity of groundnut, cotton and sugarcane (Table 3). Only for coarse cereals and pulses the growth in productivity was positive and significant, but these crops account for less than 20-25% of cropped area. However, a more disaggregated performance of agricultural sector in Andhra Pradesh shows that despite stagnating growth of the crop sector between 1993 and 2004, the growth was impressive in other sub-sectors like horticulture, livestock, fisheries etc (Figure 2). During the last 5 years i.e., between to , while the growth in the crop sector was negative (-3.8 percent) the overall annual growth in the agricultural sector was 1.5 percent due to more than 10 percent growth in the livestock and fisheries sectors despite consecutive droughts in the state. With in the crop sector too, horticulture (3%/ annum) and floriculture 21%/annum) were growing impressively compared to the traditional food grains (rice, sorghum, millet) and commercial crops (sugarcane, cotton, groundnut). Consequently, the share of the livestock and fisheries sector in agricultural GDP increased from 23 percent in to 44 percent in (Figure 3). Similarly, the share of horticulture sector in the crop group increased from 18 percent to 20 percent, and floriculture from 0.6 percent to 1.6 percent between 1993 and For details on crop specific changes see appendix 1. Changes in cropping pattern and value shares: 1970 to Relative importance of HVCs: During the last decade at the all-india level the production of HVCs increased impressively such that such that the share of HVCs in total value of agricultural production increased from 37% in 1991 to 44.5% in 2002 (at constant prices). During the same period in Andhra Pradesh too the share of HVCs increased from 30% to 44%. This is reflected in the growing importance of HVCs (including fisheries) in Andhra Pradesh relative to all-india. For example, the share of Andhra Pradesh to all-india area/production of vegetables, flowers, eggs, milk, fish etc 7
14 has increased in recent years (Figure 4). For fish, the share of Andhra Pradesh in all-india production increased significantly (from 6.6 % in year 1991 to 13.3 % 2003) both for inland and marine fish. The share of poultry meat (not reflected in the figure) production to all-india production increased significantly from around 17 percent in 1982 to 25 percent in 1998 (authors calculation). Only for fruits the production share of Andhra Pradesh to all-india declined marginally from 14 percent in 1982 to 12 percent in The impressive growth in HVCs (except the fruits sector) took place despite any concerted policy initiatives to augment their production. Growth in demand for HVCs with in the state and outside was mainly driving their production despite many hurdles on the supply side both technological and institutional. Despite the diversification towards High Value Commodities (HVCs) like livestock products fisheries, fruits, vegetables and flowers, over all the agriculture sector has performed below potential since traditional crops dominate the sector. For example, paddy, oilseeds sugarcane, cotton, coarse cereals and pulses accounted for 81% of cropped area. Delineation of high value commodity zones Historically Andhra Pradesh is divided into three regions, coastal Andhra, Telangana and Rayalaseema. There are 23 districts in the State spread across the three regions - Coastal Andhra (9 districts), Telangana (10 districts) and Rayalaseema (4 districts). The three regions have significant differences in terms of agro-climatic endowments. The average annual rainfall is lowest (650 mm) in Rayalseema region and highest in the coastal region (1050 mm). Coastal Andhra is also the most fertile of the three regions in terms of soils and irrigation potential and has favorable conditions for growing irrigated crops. Rayalaseema (in the rain shadow area) and several districts of Telangana region are more drought-prone. The three regions are further sub-divided into 7 sub-regions: North Coastal, Godavari-Krishna belt, Southern coastal, Scanty rainfall, South and North Telangana. The classification into sub-regions is based on agro-ecological factors (Length of Growing Period (LGP) soils, rainfall, topography etc.) only and do not consider socioeconomic factors or infrastructure availability. Farmers decision to produce or pursue particular crop or livestock activities typically depends not only on agro-ecological feasibility but also economic factors like input and output prices, availability of credit, access to markets, etc (ICRISAT 1999). To map the spread of HVC s across the state a regrouping of districts is attempted to reflect share of HVCs in the value of agricultural production. Thus, the districts are grouped into three zones based on their share in HVCs (or level of diversification) in total value of agricultural production (crop and livestock sector only). Districts with > 40% share of HVCs in total value of agricultural production were grouped under high diversification zone, 35% - 40% under medium diversification zone, and <35% under low diversification zone. A spatial view of the three zones is shown in Map 1. The high to medium diversification districts are spread across the state and mainly cover the north coastal districts, South Telangana, and 2 districts in the scanty rainfall region. Interestingly, the spread of HVCs is in stark contrast to the spread of commercial crops 8
15 (oilseeds, cotton, sugarcane etc) that are mainly concentrated in the scanty rainfall region and north Telangana. Characterization of diversification zones It is obvious that the differences in the extent of diversification in different zones vary due to number of factors. Information on selected indicators by level of diversification is shown in Table 4. Demographic indicators like population density and urban population are significantly higher in the high diversification zone. Average normal rainfall is the lowest in Zone 1 compared to the other zones. Agricultural intensification as reflected in input use etc is less in Zone 1 compared to the medium diversification zone. For example, irrigated area, area under HYVs, fertilizer use, tractorization etc., is lower in highdiversification zone than the state average and much lower than those in medium level diversification zone (Zone 2). Thus Zone 2 represents intensive cropping region i.e., high input agriculture with paddy dominating the cropping pattern. The density of roads and markets are generally lower in Zone 3 compared to Zones 1 and 2. With regard to the livestock sector the proportion of improved cattle and poultry is higher in Zone 1. Feed availability per livestock unit is lower in here despite the booming livestock sector implying import of feed from neighboring districts and states. This zone has the highest urban population and the booming livestock production would be mainly driven by the demand for HVCs due to urbanization. Credit availability is highest in Zone 2 and lowest in Zone 1, implying much of the credit from the formal sector goes to the intensive agriculture regions or high irrigation districts. Thus availability of credit for diversification is a constraint that needs to be addressed. As already indicated the spread of HVCs is in sharp contrast to commercial crops like cotton, oilseeds, pulses, spices etc. that are grown mainly in Zone 3 typically under low rainfall conditions. Here the productivity levels are low since a majority of farmers are resource poor. The over all development of infrastructure facilities is also poor in this region. Paddy on the other hand dominates the agro-climatically better endowed agriculture region i.e., Zone 2 and also under irrigated conditions in Zone 3 mainly in north Telangana districts. In contrast, HVCs are dominant in Zone 1 driven by demand side factors and infrastructure facilities. Composition of value of agricultural production and sources of diversification In the high diversification zone HVCs account for 51% of the total value of production, led by livestock products 32% and fruits and vegetables 19% (Table 5). HVCs account for 37% of the value of production in the medium diversification zone. Here, paddy is the single largest commodity with a share of 38%. In the low diversification zone HVCs account for only 27% of the value of production. The zone is however, diversified with respect to other crops that include, paddy, coarse cereals, pulses and oilseeds. It was observed that HVCs were important sources of agricultural growth in Andhra Pradesh. Between 1982 and 2001, HVCs accounted for two-thirds of the change 9
16 in value of agricultural production in Zone 1, while in the low diversification zone traditional crops account for bulk of the change (62.6%). In the medium diversification zone too, HVCs account for more than half of the change in value of agricultural production followed by paddy (Table 6). These changes are clearly reflected in the faster growth of HVCs in zone 1 (6.1% per annum) between 1982 and Spatial analysis of high value commodities Horticulture crops: Andhra Pradesh is an important fruits and vegetable growing state in India. The state accounts for 12.4% of fruits and 3.4 % of all-india vegetable production. But its share for selected fruits and vegetables ranges from 11% to 50% of all-india production (Table 7). Between 1992 and 2002 area and production under fresh fruits grew at 5.3 % and 2.1 % / annum respectively. Thus, much of the production growth has come through area increases. The decline or stagnation in yields is mainly due to nonadoption of improved varieties and technology since many fruit orchids are old. Among the fresh fruits papaya and lemon area is increasing at the rate of 29.9 % and 5.3 % / annum. For vegetables area and production increased at the rate of 6.1 % and 9.3 % per annum indicating yield contribution to vegetable production. Availability of improved seeds through private sector seed companies has helped to increase yields. Area under tomato and onion is growing the fastest. Among the fruits mango is the dominant crop in the state, which accounts for 50% of area under fruits, followed by cashew nuts. Among vegetables, tomatoes account for 33% of the area followed by onions (Figure 5). District wise share of area and production of major fruits and vegetables is shown in (Table 8 and 9). Spatial variation in area under fruits and vegetables and selected major fruits and vegetables is shown in Map 2, 3 and 4. There is considerable specialization in the production of selected fruits and vegetables by a few districts, for example, papaya, grapes, orange and cashew. Vegetable production is more wide spread across districts although here too tomato, onion and tapioca production is concentrated in a few districts Fisheries sector: Andhra Pradesh is one of the leading states in the fisheries sector. The state fisheries industry ranks first in the country in coastal aquaculture and fresh water prawn production and second in inland fish production and value of fish / prawn produced in India. In 2002 the state produced t of marine fish and t of inland fish, accounting for 8% and 18% of all-india production respectively. The sector is providing direct and indirect employment to over 1.4 million persons particularly in the rural sector and is an important foreign exchange earner (GOAP 2002). The state contributes about Rs. 25,000 million by way of marine product exports, which is nearly 40 percent of the total marine product exports from the country. The fisheries sector in Andhra Pradesh achieved significant growth as compared to the growth in other sectors of the economy. Between 1993 and 2003 fish production grew by 9.5 % /annum (quantity) and by 9 % /annum (in value terms). Within the fisheries sector inland fish production grew much faster at 14% /annum compared to 4% for marine fish. The comparable figures at the all -India level are 5.6 for inland fish and 0.7 % for marine fish. 10
17 The impressive growth in the quantity and value of inland and marine fish is shown in Figure 6 and the district wise production and growth rates are shown in Table 10. The spatial distribution of production is also shown in Map 5. Although shrimps / prawns constitute a small proportion of marine and inland fish production, their share in value terms is 2-3 times higher (Figure 7). Shrimps and scampi constitute the fast growing sub-sectors in aquaculture with growing demand in international markets. The area under these two products in Andhra Pradesh increased from 0.4 million ha in to 0.5 million ha in the following year. Scampi is considered the most suitable species for freshwater aquaculture. The state is a major exporter of fisheries products both domestic and international. The Kolleru lake area in the West Godavari and Krishna districts is a major point of fish exports to eastern and north eastern states in India. International exports from AP were around 24,000 million in Japan and the US are among the major export markets for AP. Dairy sector Andhra Pradesh state is the 5 th largest milk producer in the country, producing 6.58 million t of milk in (7.6% of all-india production). Between and milk production in the state grew by 6.6% /annum compared to 4.1% at the All-India level. Due to the impressive growth in milk production per capita availability of milk increased from 121 g/day to 231g /day between 1991 to The state has now caught up with the all-india availability 230 g /day. Owing to faster growth in buffalo population buffalo milk in 2002 accounted for 70% of the total milk production in the state. District wise milk production and share of buffalo milk in total milk are shown in Table 11. The spatial distribution of milk production is shown in Map 6. Milk production is mainly concentrated in the coastal districts and few South Telangana districts. Despite the impressive growth in milk production the sector is plagued with a number of problems and much of the increase in milk production was due to an increase in milch animal numbers and not driven by productivity growth. Low milk yields, high cost of production and poor quality of milk due to unhygienic production on the production side, inadequate milk collection infrastructure, absence of reliable power supply, poor cold chain infrastructure, and high cost of processing, on the procurement and marketing side has made the sector uncompetitive. Poultry sector Andhra Pradesh produces t of meat annually, and more than 50% of meat production is accounted by poultry meat (Table 11). In a number of districts poultry production accounts for more than 70% of total meat production. The spatial distribution of poultry meat production is shown in Map 6. South Telangana districts dominate poultry meat production. Also poultry meat production is closely related to urbanisation. 11
18 The poultry sector in the state is one of the fastest growing sectors. Between 1992 to 1999 the broiler production grew at 11.3% per annum. Egg production too grew impressively (14% per annum between 1982 to 2002 as against 12 % at the All India level). In 2002 the state produced 14,862 million eggs accounting for 20% of all-india production. The availability of eggs increased from 64 numbers / capita / year in 1993 to 151 in The comparable figures at the all-india level are 27 to 36 numbers / capita / year. The state is a major exporter of eggs to neighboring states like Tamil Nadu, Maharashtra, Karnataka and Madhya Pradesh. Additionally, the state accounts for one fourth of egg exports from India, (60 million out 220 million in 2001) mainly to Gulf countries and small quantities of egg powder. The state also exports poultry meat mainly to East Asian countries, Middle East and south Asian countries. Presently the poultry sector does not enjoy many of the concessions given to agricultural sector nor does it get the concessions under the industrial act. High feed cost and lack of adequate infrastructure is the main problems facing the sector. 12
19 CHAPTER IV FACTORS INFLUENCING DIVERSIFICATION TOWARDS HIGH-VALUE COMMODITIES Background of urbanization and rising incomes In this section, we examined the factors that determined promotion of high-value agriculture in Andhra Pradesh. Earlier studies have shown that expansion of high-value commodities is a demand-driven phenomenon. Important components responsible to push the demand for high-value commodities are rise in income, urbanization and changing food preferences (Parthasarathy Rao et al. 2004, Pingali and Khawaja 2004). These are responsible for a different type of agriculture that transform from a cereal-based system to high-value agriculture. We intend to study how different factors are responsible for transforming traditional to an intensive and commercial agriculture mostly relied on highvalue commodities in Andhra Pradesh. Economic theory reveals that higher economic growth and consequent rise in incomes in both rural and urban areas are translating into higher demands for high-value commodities (Dorjee et al 2002, Joshi et al 2004). Rise in income also alters consumers taste and food preferences. In India, per capita income is 4.2 / annum in the nineties. Similarly, urban population is increasing at an annual rate of 3 percent. There are projections that by the end of 2030, 41 percent of Indian population will live in urban areas (UN 2002). These trends indicate that the demand for high-value commodities would grow much faster rate than ever before. Globalization of agriculture under WTO regime is also becoming important driving force for diversification towards HVCs as it is also responsible for altering diets and food preferences that no longer confirms to local habits (Pingali 2004). In Andhra Pradesh the growth in per capita income is 4.1%, close to the all-india average growth. Urban population increased by about 1.5% /annum between 1990 and 2001 which is lower than the all-india average. Nevertheless, Andhra Pradesh is emerging as an important state in India that has immense potential to meet the growing demand for high-value commodities in the domestic and also export market. Urbanization and HVCs To probe the hypothesis that urbanization promotes high-value agriculture in Andhra Pradesh, we delineated districts into two categories: (i) urban and urban surrounded districts and (ii) hinterland districts. Districts with more than one million urban population are classified as urban districts and districts surrounding the urban districts as urban surrounded districts. The rest are classified as hinterland districts. We expect higher share of HVCs in urban and urban surrounded districts compared to the districts located in hinterlands. On the spatial maps of share of all HVCs to total value of agricultural production and separately for each individual HVC across districts in Andhra Pradesh we superimposed urban and urban surrounded districts using GIS tools. Map 4 and 6 show the spatial distribution of area under fruits and vegetables and milk and poultry meat production across districts in Andhra Pradesh. It is noted that bulk of fruits area is concentrated in the north coastal districts and scanty rainfall region. This suggests that agro-climatic factors have influenced fruit production rather than 13
20 urbanization. This is because fruits have specific niches based on agro-climatic or soil characteristics. However, fruit cultivation is also spreading to non-traditional areas due to availability on improved varieties and increasing demand due to urbanization. In contrast, vegetable production is concentrated close to the demand centers and the area under vegetables is high in urban and near-urban districts. Milk production is important in all districts of the state with a few exceptions. But the share of milk production is higher in urban and urban-surrounded districts. The share of poultry production in total value of production is highest in Hyderabad and surrounding districts. The results of the spatial analysis though not conclusive, indicate close correspondence between urbanization and selected high value commodities. Composition of production by urbanization To further probe the close correspondence between HVCs and urbanization we looked at the composition of the value of agricultural production based on classification of district groups by urban & urban-surrounded and other districts or hinterland districts group. As expected in the urban & urban-surrounded districts group HVCs account for 39 percent in total value of agricultural production. In contrast, HVCs account for only 27 percent in the districts located in hinterlands (Table 12). In hinterlands, traditional commercial crops and coarse cereals account for a larger share besides paddy. Paddy accounts for a large share in both the district groups perhaps indicative of the fact that wherever irrigation is available paddy is grown for household food security and also to take advantage of input subsidies and assured procurement price. Secondly, since Andhra Pradesh is an important exporter of HVCs like fisheries, milk and poultry products both for domestic (inter-state) and export market production takes place close to the highways and ports that link these markets. Since major ports are located close to urban centers export demand for HVCs is also a driving force in urban and urban surrounded districts group. For instance the state enjoys a marketable surplus of 75% in case of fish, 70% for eggs, 43% milk etc. There are no clear figures on how much of this surplus is exported. Horticulture, dairy, poultry, rice, fisheries, and mining account for nearly 60% of its total domestic exports. Maharashtra, Karnataka, Tamil Nadu, Kerala and West Bengal are its major destinations. Similarly, for international exports primary commodities like fisheries, horticulture, mining, dairy and poultry account for 40% of the value of total exports from the state. US, Bangladesh, EU, Japan, UAE, UK and Australia are major destinations (World Bank 2005b). Per capita income and HVCs The districts are divided into 3 income groups by arranging the districts in ascending order of per capita income and taking a third of the districts into each group. Per capita income ranges from Rs to Rs 9000 in the low income group, Rs.9001 to Rs In the medium income group and >11001 for the high group. As expected the production of HVCs is highest in the middle and high income groups and lowest in the low income groups (Table 13). Also, as expected the correlation between urbanization and per capita income is also high (0.50). It should however be noted that consumption and not production would 14
21 be associated with income. The state has a vibrant intra-state trade in agricultural commodities, besides inter-state and export trade as discussed above. Thus there would a wide gap between production and consumption in any district. Data on consumption by districts is not readily available Supply side factors Besides the demand side drivers discussed in detail above supply side variables too are important drivers of HVC production. On the supply side, agro-climatic, technological, institutional and infrastructure variables are important drivers. In a study at the all-india level (Parthasarathy Rao et al 2004) it was found that HVCs were negatively associated with factors promoting intensive agriculture like irrigation, mechanization, high input use, and improved cultivars, the effect of rainfall was generally positive and infrastructure facilities like roads and markets were generally promoting diversification towards HVCs. Labor wage rate and availability of credit are other important factors driving HVC production. Due to higher labor requirement (days/ha) high wages may be a deterrent to production of certain HVCs. Also since HVCs have higher initial start up costs and gestation periods before physical production starts, availability of institutional credit would be an important factor driving HVC production. Model selection, description and quantification of factors The tabular and spatial analysis above provides some clues on the key factors driving HVC production. However, it is not possible to pin point specific factors based on the above analysis nor do we know anything about their significance levels. To get a better handle on the factors driving HVCs simple correlation analysis was attempted on district level data (Table 14). The dependent variables (variables that are influenced by other factors) are expressed as shares in total value of crop and livestock production and includes share of all HVCs, selected HVCs, paddy and commercial crops. Production of all HVCs is positively correlated with urbanization and population density although for individual HVCs like fruits and milk the above relationships are not significant. Per capita income is positively associated with HVCs but is not significant. Poverty on the other hand is closely associated with production of commercial crops. By and large HVCs are negatively associated with farm size. Irrigation and variables related to intensive agriculture (tractorization, HYVs etc.) are positively associated with paddy production and negatively with HVCs and commercial crops. In contrast, in the rainfed areas, coverage of area under watershed programs is positively associated with HVCs particularly vegetables, milk and meat. Field labor wages are negatively influencing HVCs particularly vegetables. Credit is positively related only with paddy production, as are the infrastructure variables (roads and markets). Unlike for roads and markets there is a positive relationship between agroprocessing units and HVCs (fruits and vegetables processing units, and feed 15
22 manufacturing units etc). A similar relationship is found between paddy production and rice mills. For the multivariate analysis we tried models based OLS and Seemingly Unrelated Regression Equation (SURE) technique due to Zellner (1962) 6. The assumption under this estimation is that in many situations not all sets of equations are determined simultaneously. Instead several equations might be connected because their error terms are related. In such cases, estimating the equations as a single set, using a single regression, should improve efficiency by allowing contemporaneous correlation between the error terms across the equations. Model selection and description of variables: To better quantify the relationship between HVCs and key drivers several equations were tried using OLS, Tobit, and SURE. A list of the variables included in the models and their means etc are shown in Table 15. Since many of the independent variables are correlated only representative variables are included in the models, for example irrigation as a proxy for intensive agriculture, urbanization as a proxy for demand side factors etc. The dependent variables included in the model are shares of HVCs in total value of agricultural production and include the following: 1. Share of all All HVCs 2. Share of Fruits 3. Share of Vegetables 4. Share of Milk (Cattle and Buffalo seperately) 5. Share of ruminant Meat 6. Share of monogastric meat Model results: The results indicate that for all HVCs, (OLS estimates) urbanization, rainfed area covered under watershed program and districts with larger share of small and marginal farmers were positively related and significant. (Table 16). Although wage rate and proportion of poor are negatively associated with HVCs as expected they are not significant. Rainfall is positively associated with fruit production while it is negatively related to irrigation. Thus, fruits find niches in high rainfall regions but away from intensive agricultural districts with high irrigation levels. Availability of processing industry is an important factor driving their production. High labor wage rates are negatively associated with fruit production since these are labor intensive crops (Table 17). Vegetables production is positively associated with urbanization on the demand side and negatively with labor wage rates on the supply side. For vegetables rainfall and irrigation do not seem significantly influence their production implying these are grown in all types of 6 The modified version of Tobit model for truncated dependent variable was also tried since it is best suited to deal with truncated dependent variable that is bound between a given maximum and minimum values (Gujarati 1995). In our model the dependent variable is shares of HVCs in the total value of agricultural production, and vary between 0 and 1. However, since the estimates obtained using Tobit model and OLS were not very different only OLS estimates are reported. 16
23 agro-climatic situations. Milk production is not concentrated in urban districts implying more scattered production across different zones of the states (Table 18). However, cattle milk production is significantly related with watershed programs in rainfed areas. Watershed programs contribute to improved fodder production and consequently dairy production. This was found to be the case in an ICRISAT consortium led watershed program in Kothapally village. In the watershed village dairy activity increased over time compared to the surrounding villages without a watershed program. This is mainly due to better soil moisture conservation and fitting of fodder crops in the cropping pattern along with other crops. Also, farmers could be better organized to sell milk in areas covered under watershed programs. Availability of credit for agri-allied sectors positively influences milk production. Cattle milk is also concentrated in districts with more poor, implying regions with poor agro-climatic endowments and consequently poor infrastructure. Surprisingly none of the variables significantly explain buffalo milk production. But the models clearly bring out the difference between the two. Ruminant meat (bovine, sheep and goat) is significantly associated with the availability of grasses from common grazing lands, and their production is concentrated in districts with large proportion of poor. Consequently it is negatively associated with intensive agriculture i.e., irrigated agriculture. Availability of credit is negatively associated implying their production is concentrated in districts with lower access to credit (Table 19). Poultry and pig meat are largely driven by urbanization, and infrastructure variables like roads. Credit is significantly negative which is a little difficult to explain. One possible explanation is that like for ruminant meat, poultry production is also concentrated in less endowed regions while much of the credit is flowing to the better-endowed regions. Poultry production however, is driven by urbanization unlike ruminant meat. The common thread between ruminant and poultry meat is that both are associated with rainfed areas. In summary, urbanization is an important driver of HVCs from the demand side, although it is not a significant driver for fruits and milk production. This is because their production is more scattered due to agro-climatic factors. From the supply side infrastructure related to processing industry, wages, credit and agro-climatic factors are important drivers. Surprisingly, road network, which was an important driver at the all- India level, is not significant in Andhra Pradesh except for the poultry sector. 17
24 CHAPTER V IMPLICATIONS OF AGRICULTURAL DIVERSIFICATION In this section we intend to assess the implications of agricultural diversification on income, employment, water use efficiency, and environment. We also examined how policies to promote agricultural diversification were effective in meeting their objectives. Before we analyze the implications of HVC production we take a brief look at the performance of the traditional crop sector in Andhra Pradesh. Economics of crop production in Andhra Pradesh We have computed the unit cost of production and net returns from important crops in the state. We compared the cost and returns in Andhra Pradesh with major states in India. For this, we used data from Comprehensive Cost of Cultivation Scheme. It was noted that among the food grains Andhra Pradesh does not have comparative advantage in the production of paddy and sorghum. Only for maize, green gram and black gram the state has the lowest per unit cost of production and also higher yields (Figure 8). For commercial crops too Andhra Pradesh does not seem to have comparative advantage in the production of crops like groundnuts, sugarcane, and even cotton. For cotton although yield levels are highest in AP, cost of production is second highest after Tamil Nadu. For groundnut and sugarcane on the other hand yield levels are considerably lower in compared to other states. The results reveal that for a number of major crops grown in Andhra Pradesh the state does not have a comparative advantage in their production despite registering high yields. High cost of production due to indiscriminate use of inputs could be a factor pulling down profitability. For example, indiscriminate use of pesticides on cotton is substantially increasing cost of production (The Economic Times 2003). Also there are a number of imperfections in the agricultural marketing in the state particularly for input markets and most of the farmers did not receive the expected price in the output markets (Nirmala 2003). This is reflected in the declining returns-to-cost ratio for several crops (Figure 9). The returns-to-cost ratio has declined for paddy, sorghum, maize, sugarcane, cotton and groundnut. Only for green gram and black gram the ratio increased. Detailed cost of cultivation data for fruits and vegetables at the all-india level are not available. However, a cursory look at the yield data indicates that yields of a few selected fruits (mango, lemons) and vegetables (onion, egg plant, sweet potato) are higher in Andhra Pradesh compared to all-india average yields (Table 20). Microeconomics of agricultural diversification: implications on income On the supply side, diversification of agriculture towards horticulture crops helps to stabilize income and employment in the farming sector. Horticultural crops are identified as most remunerative crops for replacing subsistence farming in the rainfed semi-arid and arid dry lands, hills and coastal agro-ecosystems. The labor requirement, net income, and benefit-cost ratio for horticultural crops are generally higher than for cereals (Rao 1997). 18
25 In addition, horticultural crops require comparatively less water and are easily adaptable (particularly tree crops) to adverse soil and wasteland situations (Kaul 1997). For cost of cultivation / production, income and employment effects of horticulture crops in Andhra Pradesh the analysis draws on data collected under the baseline surveys of sample households in selected benchmark watershed villages in 4 districts of Andhra Pradesh for the cropping year Each district is represented by 2 villages and includes all major crops grown under rainfed and irrigated situations. Stratified random sampling procedure was used to select the households for the baseline survey in the respective villages. The sample households were selected such that the land distribution and caste distribution closely matched that of the land and caste distribution of the entire village. The sample size varied between percent of the total households in the villages. The total sample size for all villages was 540 households and is representative of small, medium and large farmers (for more details on the villages and no of households in each village etc see Appendix table 1). Data on cost of production was collected from the sample households using a structured questionnaire. Cost of production includes all standard costs (family + hired human labor), bullock, tractor, machinery rentals, cost of fertilizer, seed (own + bought), pesticides, FYM, sheep penning, and actual water cost (own + bought). Gross returns include returns for the main products, i.e., grain and by-product. Net returns thus represent returns to land and management. Findings from farm-level surveys in Andhra Pradesh are reported below. Rainfed crops dominate cropping pattern in the selected villages. On an average (average of all villages in all districts) 98% of coarse cereals are grown under rainfed conditions, the comparable figures for other crops are oilseeds 91%, vegetables 67%, flowers 66%, cotton 93% and paddy less than 2%. The cropping pattern of sample households for each district (average of two villages) for rainfed and irrigated crops are shown in Figure 10. District wise net returns for selected crops are shown in Figure 11. For rainfed crops the net returns were highest for cotton in Medak district, vegetables and spices in Kurnool district, vegetables and cotton in Nalgonda district, and oilseeds in Mahabubnagar district. For irrigated crops net returns were highest for flowers and cotton in Medak district, vegetables in Kurnool district, and paddy followed by groundnut in Mahabubnagar district. Thus, the non-traditional or high value crops like flowers and vegetables were more profitable in the major growing districts. Only in Mahabubnagar our sample did not include any households growing vegetables or flowers and here oilseeds were most profitable. Implications on employment In general, high value crops are labor-intensive in the entire supply chain from production till these reaches to consumers. Labor requirement per unit of output or per ha is found to 19
26 be higher for vegetables, fruits, and flowers (Joshi et al. 2003, Deshingkar et al. 2003). The data on labor days collected from the four districts in Andhra Pradesh reveals a similar trend. On average (average for all districts) for rainfed crops labor use is highest for vegetables (156 labor days /ha) followed by flowers, cotton and oilseeds. For irrigated crops labor use is highest for flowers (264 labor days per ha) followed by vegetables, paddy, cotton and oilseeds (Figure 12). Thus, both for rainfed and irrigated crops HVCs like vegetables and flowers provide greater opportunities for employment. On the flip side high wages could be a deterrent for cultivating HVCs as shown above in the model results for vegetable production. There is also an increased requirement of supervision by the farmer in the case of high-value crops, which could prove to be a constraint. Another factor that may go against HVCs despite high net returns is the fact that per ha cost of production is high for vegetables, fruits, flowers compared to the traditional crops. Our sample survey results indicate that for rainfed crops cost of production /ha is highest for vegetables, followed by cotton. For irrigated crops cost is highest for flowers followed by cotton, paddy and vegetables. For fruits and flowers besides higher cost of production the long gestation period before the crop starts yielding adds to the start up costs. For example, the gestation period for fruits varies between 2-7 years and 1-3 years for flowers. The availability of institutional credit from formal sources would be essential for success of HVCs particularly for small farmers. Several studies across Asia have found that the shrimp farming generates additional employment opportunities (Phillips and Barg 1999; ADB/NACA 1998). For India, CIBA 1996 found that in the Nellore district of Andhra Pradesh employment increased by 2-15% after the establishment of shrimp farms and 6-22% increase in income of farm laborers. According to the fisheries Commissioner of Andhra Pradesh, scientific shrimp farming generates maximum number of mandays / ha / annum, i.e., 650 as against 225 mandays /ha through agricultural operations. Similarly in a study in Tamil Nadu, Paulraj et al 1998, found that for paddy on an average 180 labor days /crop/ha were required compared to 600 labor days /crop / ha for shrimp farming. Apart from the direct employment, employment opportunities are also created due to shrimp farming in the allied sectors, like, hatchery, brood stock, feed manufacturing, feed supply ice plants etc. Implications for small farmers Is diversification towards fruits and vegetables benefiting marginal and small farmers? Although the survey data were not designed to answer this question since crop data were collected by size of land holding we can partially address the research question raised above. In villages in Kurnool and Rangareddy districts (urban districts) vegetables are an important crop. In Kurnool district both small and large farmers are growing vegetables in 1/3 rd of their area, while in Rangareddy district large farmers have a larger proportion of their area under vegetables (20% compared to 11% by small farmers). The medium 20
27 farmers are devoting a smaller share of their land for vegetables with a large share going to commercial crops like oilseeds and cotton etc (Table 21). In Rangareddy district small farmers are growing flowers in about 1/10 th of their area. Thus although the absolute area under vegetables in higher under medium and large farms small farmers generally devote the same proportion of their area to vegetables compared to large farmers. Similar findings were reported by NSS in a survey on cultivation practices in India carried out in The study found that for Andhra Pradesh as size of land holdings increases a larger proportion of households grow vegetables and fruits (Table 22). But since the number of households is larger in the marginal and small categories the distribution of households growing vegetables is highest for marginal farmers (36%) followed by households with medium land size. For fruits marginal farmers account for 55% of the households growing fruits. However, when we look at distribution of area medium and large farmers account for 57% and 68% of the area under vegetables and fruits respectively, the rest is made up by marginal and small farmers. For Shrimp farming in Andhra Pradesh 78,702 ha area is under shrimp farming, which constitutes 50 % of the available potential brackish water area. Small farmers with less than 2 ha farm holding constitute 75 %; farm holdings of 2-5 ha farms account for 8 %; and more than 5 ha farm holdings are 17 % of total area (Aquaculture Authority 2001). Implications on sustainable use of natural resources: water saving /maintenance of soil health In Andhra Pradesh, area under irrigation increased during the last two decades from 35% of gross cropped area, to 42% in The increase in irrigated area was mainly driven by an increase in ground water irrigation (bore wells) leading to a decline in the ratio of surface water to groundwater irrigation. The share of ground water in total irrigation increased from 21% to 42% while that of surface irrigation declined both for tank and canal irrigation. The shift to groundwater led to over exploitation of water resources and depletion of water table in several areas. As production from dry lands has become more and more uncertain, farmers seek to evade the risk of drought by digging new wells / bore wells at a great cost and at a considerable risk of failure. Information on investments in bore wells collected from the sample farmers in selected watershed villages under the Andhra Pradesh Rural Livelihood Project (APRLP) indicate that farmers were making heavy investments on different types of water exploration (Rao KPC 2004). For example, in Sripuram village in Mahabubnagar district, as many as 200 attempts to dig bore wells were made at a total investment of Rs.2.74 million. The success rate was 42% at the time of water exploration, but the water sources presently in use work out to only 22% of the attempts. Even small farmers attempted to drill bore wells in this village borrowing heavily. Subsidies on irrigation, fertilizers and power were indirectly contributing to over exploitation of the water resources. Generally the profitability of irrigated crops was higher than for rainfed crops since the bulk of input subsidies were being directed 21
28 towards irrigated agriculture. In line with the increase in irrigated area mechanization (tractor and pump sets) also increased. Further policy distortions in fixing MSP, and procurement policies etc, ensured that only 3-4 crops accounted for bulk of the irrigation. In a study on water use efficiency, in Kothapalli village in Andhra Pradesh, Shiferaw et al. 2003, found that water requirement (hrs/ha) are highest for blue water crops like paddy and sugarcane. For other crops like flowers, vegetables, cotton and chickpea water requirement was lesser. They conclude that water productivity is highest for high value crops with low water demand and lowest for high water demand crops like paddy and sugarcane. But the ground situation is that paddy which occupies about a quarter of the irrigated area uses up more than 60% of the water (Table 23). Thus, economic incentives and water charges need to be introduced to shift cropping patterns towards water saving crops with higher net water productivity. Volume (hours of irrigation) or output based water charges or other alternatives need to be explored. Environmental issues relating to fisheries In a study on economics of shrimp farming in Nellore district of Andhra Pradesh, Ratna Reddy et al 2004 found that net returns from shrimp farming are 8-13 times higher than returns from paddy and groundnut crops depending on the variety. Tiger is the most remunerative shrimp followed by scampi. But in terms of cost benefit ratios and returns per rupee shrimp farming does better than paddy but not groundnut. There are a however, a number of environmental consequences related to shrimp farming, that include: diversion of farm land, pollution of water bodies, degradation of land, salinization of soil leading to reduced agricultural production and depletion of drinking water. In consequence lands around the shrimp ponds become unsuitable for growing other crops, livestock population is depleted due to fodder and water shortage. Thus fallowing on a large scale is observed on lands around the shrimp ponds. Also farmers wanting to shift from shrimp farming to crops have to fallow their lands for at least 2 years. Thus the social and economic costs of the environmental problems should be factored in for estimating returns from shrimp farming. In this connection the Supreme court has given a judgment in 1996 to reduce the environmental implication of shrimp farming following public interest litigation. As directed by the court the aquaculture authority was set up in 1997 under the environmental protection act (1986). The main function of the authority is to ensure that no shrimp culture pond is set up with in coastal regulation zone and up to 1000 m of Chilka and Pulicat lake. To implement the precautionary principle and the polluter pays principle in coastal shrimp aquaculture, and give approval to farmers after ascertaining the quality and fertility of cropland being converted. In this connection the Aquaculture Authority has come up with some guidelines for sustainable shrimp farming, highlights of the recommendations include: 22
29 Prepare master plans and consider setting up of aquaculture estates with adequate forward and backward linkages Farmers should be advised to form local associations or farmers group for resolving conflicts in water usage, stakeholder participation and community-based participatory approach in aquaculture development, decision-making and policy planning Continuous monitoring of the environment to promote practical and economically viable farming and management practices that are environmentally responsible and socially acceptable. Legislation to regulate construction of shrimp farms in mangrove areas, other sensitive areas and in agricultural lands. Effective national institutional arrangement and policy, planning and regulatory frameworks in aquaculture and other relevant sectors are essential to support aquaculture development. Policy initiatives required for promoting diversification To sustain the growth in HVC s and consequently the agricultural sector there is a need for a paradigm shift in the way the policy makers have looked at the sector hitherto (Mellor 2004). First and foremost due to the perishable nature of HVCs the post-harvest infrastructure facilities from the farmers field to the consumers should be in place. These include pre-cooling capacity (bulk coolers) at the farm level, storage facilities at field level, packaging materials, refrigerated vans, roads, and well functioning marketing system with cold storages facilities. Secondly, to increase the shelf life of high value commodities and value addition, processing facilities should be in place. The processing industry should be facilitated through innovative market linkages between small-scale producers and the industry. Vertical coordination will not only enable steady supply of raw materials to the industry but will also enable sharing of risks between industry and farmers. The producers take on production-associated risk while the industry takes on the marketing and price risks. The availability of credit at reasonable cost through institutional sources and a well functioning insurance system are important pre requisite for HVC production. Elimination of restrictions on domestic trade, state control on wholesale marketing and small-scale reservation of industries etc would be required to sustainably diversify the agriculture sector. Need for a database that would provide adequate information on demand and supply of horticulture crops and livestock products, production trends in major growing countries, prices and trends in domestic and global markets, This would help in better planning the production of HVCs. Thus, inducing pro-poor diversification requires an improvement in the access of small producers to information, markets, and institutions providing inputs and skills. The role of government is thus critical for successfully diversifying the agriculture sector that would then enable large private investments in the sector and in agro-processing. 23
30 CHAPTER VI CONSTRAINTS TO AGRICULTURAL DIVERSIFICATION In this chapter we take a look at a few critical areas that directly or indirectly influence HVCs sector. These include availability of credit, post harvest infrastructure and marketing, infrastructure for meeting quality standards, processing etc. Unless these sectors are geared to meet the needs of HVC producers and stakeholders they may act as constraints to agricultural diversification. Credit High-value commodities are capital-intensive. One of the most important constrained faced by the farmers, particularly by the smallholders, is non-availability of credit to harness the potential of high-value commodities. Access to credit is very limited to the farmers through formal sector. It is reported that formal credit meets less than 30 percent of the credit requirement of farmers in AP. Thus, informal sources of credit dominate the rural credit sector with interest rates ranging from 24 to 40% compared to 12-15% from formal sources adding to the cost of borrowing (Rao KPC 2004; Rao et al 2005). One of the reasons for low delivery of formal credit is prevalence of tenancy system in the state. And, tenant farmers are deprived of deriving several benefits including bank loans and crop insurance. Since high-value commodities are more dependent on credit due to higher initial costs, tenant farmers have to rely on informal sources compounding the cost of credit and eventually their profitability and competitiveness. In the following section we take a closer look at the composition and regional distribution of formal sources of credit and its implications for high value commodities. Sectoral distribution of formal credit: In Andhra Pradesh, in , the lending to the priority sector from formal sources was Rs.164, 113 million. Of this, crop loans accounted for 51% of the share, followed by other priority sectors like transport, retail trade, education and housing loans etc (Figure 13). Allied activities that include mainly high value commodities like dairy, poultry, fishery, cold storage development etc., received only 6% of the total formal credit. With in the crop sector food grains accounted for 53% share followed by oilseeds, sugarcane cotton etc. The share of vegetables was only 5%. For the allied sector the dairy sector accounted for 32% of credit, followed by small ruminants, poultry, and fishery. Marketing infrastructure and cold storage programs received about 13% of the allied sector credit. Between and credit for priority sector increased four fold from Rs.52, 580 million to Rs.200, 000 million. The increase was faster in the non-farm sector and other priority sector compared to crop and allied sector. Distribution by source: Within the formal sector the main sources of credit are commercial/ nationalized banks, Regional Rural Banks (RRBs) and Cooperatives. For crop and term loans nationalized banks including state bank of India accounted for about 24
31 52% share followed by Cooperative banks 32 % and RRBs 15 % (Figure 14). The share of private banks is only 2%. For the allied sector credit nationalized banks accounted for 57% followed by cooperative banks 27%. Unlike the crop sector here the private sector has a bigger stake (8%) and is on par with the share of RRBs. Implications of above for HVCs. Regional distribution: There is considerable regional disparity in the disbursement of formal credit across the state. Crop credit /ha is highest in the coastal districts of East and West Godavari, Krishna and Guntur (Table 24). Nizamabad is the only exception. Thus, the medium diversification districts account for 38% share of crop credit while the high diversification districts account for only 20% share (Figure 15). The credit flowing to allied activities like dairy, poultry, fisheries etc., follows a similar trend. Thus the coastal districts not only corner a large share of crop loans but also credit for allied activities. Crop credit (including credit for vegetables etc) per cultivator is generally low and is only Rs. 10, 596 / ha, varying from a low of Rs. 4,138 / ha in Visakhapatnam to a high of Rs. 27, 538 / ha in East Godavari. A closer look reveals that credit dispersal is positively correlated with irrigation while the rainfed areas are starved of credit. The low average availability of credit per cultivator particularly in rainfed areas explains the dominance of informal sources of credit and higher cost of borrowing. There is thus a need to reorient the credit towards the high growth sectors like horticulture, fisheries, livestock etc., by diverting some of the credit from irrigated agriculture to rainfed areas since the allied activities are growing mainly in rainfed areas. Marketing An efficient agricultural marketing particularly for high value commodities is essential for the development of the agricultural sector since it provides outlets and incentives for increased production and contributes greatly to the leapfrog from subsistence to the commercialization farming (Dastagiri and Mruthyunjaya 2005). The marketing and processing activities also bring dynamism to the agricultural sector by way of reduction in the cost of cultivation via input costs or raising returns to producers by value addition or diversification (Sukhpal Singh 2000). Integrated production and marketing system helps reduce post-harvest losses, ensures remunerative price to the producers and supply of produce at reasonable rates to consumers. Marketing of high value commodities is complex and risky compared to food grains marketing due to perishable nature of the produce, seasonal production and bulkiness. These characteristics make marketing system of high value commodities different from other agricultural commodities, particularly in providing time, form and space utilities. Absence of assured markets lead to volatility in prices. There are reports that prices of fruits and vegetables, broilers, and eggs fluctuate considerably on a given day and between seasons. While the market infrastructure is well established for food grains, markets for HVCs are not that well developed and are generally congested and unhygienic (Sharan 1998). 25
32 Because the institutional and structural issues have not been properly addressed liberalized programmes adopted by many developing countries in the past two decades have had limited success in developing private, efficient and competitive agricultural markets (IFPRI 2003). In the liberalized era, the paradigm of agricultural marketing is changing and it is realized that there is a need to improve the performance of all marketing functions by replacing the prevailing functions of fee collection and associated policing (Dastagiri and Mruthyunjaya 2005). Andhra Pradesh: In this section we focus on the functioning of regulated markey yards 7 particularly for fruits and vegetables. Regulated market yards for fruits and vegetables cover only few districts of the state. Fruit markets are located in Hyderabad, Warangal, Vijayawada, Rajamundry, Nellore and Chittoor districts and are located in the major towns. Vegetable markets are more in number covering more districts but concentrated in Telengana region. One of the major constraints facing farmers is the high cost of fruits and vegetables marketing and poor infrastructure facilities. Although the government fixes the marketing costs and charges in the state from time to time (Table 25). The Commission Agents are exploiting the farmers by charging higher commission than the stipulated amount (8-10% compared to the official rate of 4%). In wholesale markets farmers have no bargaining power to get remunerative price, since most of the farmers are taking loans/advances from commission agents they are compelled to sell the produce to them. For vegetables the following two market channels are predominant 1. Market channel 1: Producer commission agent wholesaler Retailer consumer 2. Market channel 2: Producer commission agent primary wholesaler secondary wholesaler Retailer consumer. For fruits, the marketing channels are as follows: 1.Producer Pre-harvest contractor Commission agent Wholesaler Retailer Consumer 2. Producer Commission agent Wholesaler Retailer Consumer Owing to higher transaction and marketing cost the producers share in consumers rupee is low and varies from 40 to 56% for vegetables depending on the channel and vegetable crop (Figure 16). Similarly the producers share in consumer rupee is also low for fruits and varies from 28 % to 42% depending on the channel and fruit crop. Producer share is higher in channel 2 compared to channel 1, since the pre-harvest contractors are involved in 7 In the erstwhile state of Andhra Pradesh, market yards were established since 1930 with the enactment of Hyderabad State Agricultural Produce Markets Act of 1930 and Madras Commercial Crops Act of In 1966 Government of Andhra Pradesh enacted the Agricultural Produce Marketing Act 1966, integrating earlier laws. In 2001, 870 markets were functioning under 295 agricultural market committees. Out of 295 market committees 125 are in Telangana region and 170 are located in Andhra and Rayalaseema region. The markets in Telangana region are traditionally better organized than Andhra and Rayalaseema region. 26
33 channel 1. The marketing efficiency index is higher in channel 2 compared to channel 1 8 For more details on the vegetable and fruit markets located in Hyderabad see appendix 2. Marketing of horticulture crops. Farmer s perceptions and suggestions for improvement: Farmers have many problems in production and marketing of horticultural produce. On the production front the problems include lack of quality seed, costly hybrid seed, inadequate credit, lack of technical guidance from horticultural department and lack of awareness regarding postharvest management practices. On the marketing side the problems include high transport costs, spoilage and loses, exploitation of middlemen and lack of timely credit. Farmers are not able to bargain to get better price, they are forced to sell the produce due to perishable nature of produce. The Commission Agents are also giving loans to 2-3 % / month (2 times higher than from formal sector) who are compelled to sell their produce to the CA to repay the loan. Suggestions Commission Agents are charging high commission charges (8 to 10 %). Government should ensure that CAs should charge the prescribed 4 % commission only. Farmers are depending on CAs for credit and are compelled to sell the produce to them. Institutional credit should be available to farmers. Government should procure the produce during glut period for sale in deficit areas. For example for tomatoes in Madanpally, Chittoor district farmers were not recovering even transport charges from village to markets. Government should encourage collective marketing through cooperative / farmers organizations. Horticulture Department should organize more number of sellers and buyers meetings. Innovation in marketing: Rythu Bazars Andhra Pradesh Government introduced the Rythu Bazar concept to avoid middlemen and to ensure fair price to farmers and consumers. Here, the producer sells directly to consumer without the involvement of middlemen. Presently there are 97 such bazaars in the state. The main objectives of Raythu Bazars are: 8 Marketing Efficiency Index (MEI) is calculated as follows: MEI =V/I MEI = Marketing efficiency index. V = Value of the goods sold (consumer's price) I = total marketing costs and marketing margins. The ratio of the total value of goods marketed to the total marketing costs is issued as a measure of efficiency. The higher the ratio the higher is the efficiency and vice versa. 27
34 To ensure remunerative prices to the farmers and provide fresh vegetables to consumers at reasonable rates fixed everyday. Facilitate prompt realization of sale proceeds to farmers without any deductions. Curb malpractices in weighing. Provide direct interface between farmers and consumers- eliminating intermediaries in trade. To provide horticulture extension services To date 107 Raythu bazaars have been established, 33 of these have permanent structures. On an average every week 20, 000 to 25, 000 t of vegetables are sold through these markets. The annual turnover of vegetables is estimated at 1.1 million tons valued at 60 million. The government has estimated that farmers participating in the Raythu Bazar gain an annual additional income of 25, 000 totaling about 1000 million. Estate officer is a full time officer appointed by Joint Collector for upkeep and maintenance of Raythu Bazars. Horticulture consultants are also available in the bazaars, for information on improved seed and practices, and supply chain management. Daily prices are collected through Raythu bazar on-line information system. Every farmer is issued a photo identity card and entry is on the basis of the card. No charges are levied on the farmers on the use of space and services at the bazar. Surveys were carried out in two Raythu Bazaars located in Hyderabad: Mehdipatnam and Erragudda to better understand the functioning of the bazaars and to quantify producers share in consumer rupee. Rythu Bazar: Medhipatnam and Erragudda: Daily 350 to 500 farmers are coming from nearby mandals covering villages. Each farmer sells on average quintals of vegetables per day. Estate officer of the market fixes price of vegetables 25% above the wholesale market price and 25 % less than the local retail price. The Government of Andhra Pradesh is also encouraging farmers to use these markets for (i) reducing market inefficiencies; (ii) procuring hybrid seeds of vegetables at 50 % government subsidy, (iii) getting training programs on vegetable cultivation and vermicompost preparation regularly conducted by specialists. The producers share in consumer rupee for selected vegetables in these markets are shown in Table 26. Price spread is less when compared to wholesale vegetable markets. Producer share in consumer rupee is 82 to 90 %, compared to 40-56% from sale in traditional markets. Besides transport costs which are around 5 to 10%, other hidden costs (labor wages foregone, etc) have also been factored in to compute farmers costs. Suggestions for improving the facilities: Middlemen are gradually entering the raythu bazar; farmers and government should enforce the rules strictly. Government should provide cold storage facilities in the markets to store the produce. Government is providing scales and weights, which are not sufficient in number. Ensure all the farmers get one. 28
35 Government should increase the transport facilities from interior villages to Rythu Bazars. Area under vegetable cultivation may be increased in villages falling under the bazaar command area by earmarking funds and resources. Marketing of live animals: Regulated markets for live animals are not efficient due to lack of effective regulation, and proliferation of middlemen in the market. Infrastructure facilities are also poor in the markets. Funds generated from the transactions are not used for providing facilities in the market. Policies can help in utilizing funds generated from cattle fairs to develop the livestock markets. Other options of linking farmers to the market need to be explored. Livestock insurance is presently not being implemented. Milk marketing: Similarly, for milk because of its highly perishable nature supply chain management is very essential. Not all villages are well connected with the chilling centers or processing plants owing to poor road network or longer distance. There is thus a need to provide bulk coolers at the village level that can be linked with the chilling / processing plant. This would help in preserving the quality of milk for a longer period. There is a need for creating awareness programme with incentives for clean milk production. There is no monitoring of the quality of milk even under the cooperative set up. The health department also turns a blind eye due to under hand dealings. Like for feeds monitoring the quality of milk is critical. Stricter enforcement of quality standards is one solution. Matching of production and processing through contracts is an option. For example, Nestle provides extension services to the producers thus maintaining quality right from the production stage. Price stabilization fund is another option that would help in stabilizing milk prices and thus reduce the influence of private vendors. Dairying should be developed as a package approach and not just create markets for milk. To protect the interest of small producers milk cooperative societies have been formed, but the functioning of these societies is questionable owing to political influence. There is a need to bring in more competition to improve the functioning of cooperatives. The societies are also misused and mismanaged for the benefit of few. Lack of professional management, over staffing and government interference are some of the reasons for their poor performance. Under the co-operatives act one member has one vote irrespective of the quantity of milk supplied to the society, thus the societies are not able to run on business lines. While the Milk and milk products ordinance (MMPO) has allowed the entry of the private sector in dairy processing, there is a need to implement the relevant provisions of the MMPO to ensure food safety, quality and hygiene. Mutually aided cooperative societies were floated in Andhra Pradesh that are free from government interference since they are not attached to the state level Federation. To professionalize the production and marketing of milk to meet the requirements under the WTO commitments the recent debate is on floating Producer Companies, that would come under the Companies Act while Co-operatives come under the Registrar of Cooperatives. These new generation cooperatives would have a two-tier structure. Producers institutions at the grassroots level, for example self help groups with one vote 29
36 for one member. At the higher level the group contributing more milk will have a greater say in the management. There are several advantages of coming under the Companies Act but the concern is that small farmers will not have any say in such a set up. The existing societies are opposing this change as it threatens their existence. Producer companies can be initially experimented with in places where cooperatives are not functioning or are running in losses due to non-professional management. For the existing societies, policies should help to professionalize State Federations so they can compete with multinationals. Professionalization will help farmers get higher price for their milk. Broiler and egg marketing: A number of studies have highlighted the proliferation of middlemen and their exploitation of egg and broiler producers (Sujatha and Eshwaraprasad 2004; Raju and Rao 2004; Naidu and Suseela 2004). The domination by middlemen deprives the producer of his full share in the consumer rupee. Seasonal fluctuations in prices and weak bargaining power of the producer in times of excess production are other constraints that make their marketing risky. For eggs seasonal variation in demand and breakage of eggs in transportation, and lack of grading were additional problems. During the last several years the average unit size of broiler and egg producers has been growing, as small producers are unable to face market risks due to volatility in prices. The question is what measures need to be taken to support the small-scale producers? Some of the possible solutions include, formation of producers cooperatives, group marketing, contract farming, declaration of MSP in off seasons etc. On the infrastructure front cold storage and rapid transportation under refrigerated conditions from village to consuming centers are would help in reducing transit losses. Post- harvest infrastructure Since high value commodities are perishable there is need for appropriate postharvest infrastructure facilities. For instance fruits and vegetables are perishable by nature the post-harvest losses are high particularly in areas where appropriate infrastructure facilities are lacking. Field losses are around 10% followed by storage and transportation losses (Table 27). Post harvest losses of selected fruits and vegetables at the all-india level are shown in Table 28. Approximately % of fruits and vegetables are going waste in the absence of adequate post-harvest and marketing infrastructure facilities like pre-cooling units, packing and grading sheds, short and long-term cold storage facilities, refrigerated containers, modernized outlets, storage and phytosanitary facilities at air ports (CII and Mckinsey 1997; Sharma et al. 2003). Proper handling of horticultural crops is critical due to tropical climate prevailing in most parts of the India, where physiological spoilage and microbial damages take place quite fast. Farmers are compelled to dispose off the entire produce immediately after harvest due to lack of storage facilities at farm level. The infrastructure facilities available presently are a combination of individual components like grading, packing centers, pre cooling units, cold storages, platform for collection of produce, transport vehicle and plastic crates/cfb boxes, etc. For all round 30
37 development of horticulture industry emphasis on quality production needs to be integrated with post-harvest management of the highly perishable horticultural crops. Complete supply chain management is a prerequisite for integrated development of horticulture. The infrastructure facilities required for supply chain management from farm to markets are shown in Table 29. Cold storages: HVCs are highly perishable and their quality is adversely affected when shipped over long distances. Also prices of HVCs like fruits, vegetables, meat, fish and eggs fluctuate considerably across seasons and also with in a given season. Supply and demand factors drive these price changes. Cold storages provide an opportunity to producers to store their products and sell them when market conditions are more favourable. Secondly, cold storages are a must to preserve the quality of the product over a longer period. There is a positive correlation between number of cold storage units and production of fruits and poultry products. There are 235 cold storages units in the state with a total capacity of 569, 307 t. The distribution of units is not uniform across districts. Guntur district accounts for 20% of the units, followed by Hyderabad/Rangareddy districts and Visakhapatnam (Table 30). The availability is low in a number of rainfed districts like Cuddapah, Medak, Prakasam, Srikakulam, Adilabad, Karimnagar, Mahabubnagar and Kurnool. In Hyderabad /Rangareddy district cold storage units are used to store grapes, apples, pomegranate, sweet orange and tamarind. In Guntur district dry chilies and in Punganur and Madanapalle tamarind, potatoes, mango and processed tomato products are the major commodities stored. Farmers awareness about cold storage units is very poor. Hence the units are not occupied round the year. High levels of power tariff and erratic power supply are main problems in maintaining cold storage units. The use of generators escalates the cost of storage and quality of product. In Gaddiannaram fruit market in Hyderabad an extent of one acre of land was allotted to a private entrepreneur for setting up a cold storage plant. The cold storage was established in 1994 and the capacity is 3000 metric tones. Generally wholesalers, traders from Malakpet, Mahbuba mansion markets and Gaddiannaram fruit market are availing cold storage facility. Chilies, tamarind, onion, apple and dry fruits are main commodities stored. Farmers are not utilizing this facility. The charges for using the facility are shown below. Cold storage charges Produce Duration (months) Charges (Rs.) Apple 1 10/20 kg box Tamarind 9 75/100 kg Onion 9 75/100 kg Chilies 9 65/ bag of 75 kg 31
38 The owner of the unit informed that there is less demand for cold storage facility in Hyderabad due to lack of quality consciousness among traders and consumers. In Hyderabad city, approximately 30 cold storage units are available but only 10 to 12 units are fully functioning. On the other hand in Guntur district with more number of cold storages are running successfully because of export market for chilies. The other infrastructure constraints include road conditions and road transportation, rail and air transport, port and associated facilities. In a study conducted by World Bank 2003, it found that for HVCs in Andhra Pradesh existing port facilities are a constraint. The study specifically highlighted horticulture, fisheries, poultry and rice. The first three are perishable and require controlled storage facilities. Impact of SPS measures on exports of high value commodities Indian exports of HVCs constitute fresh fruits, vegetables, processed fruits and vegetables, cut and dried flowers, seeds, spices, cashew kernels and their products. Exports depend not only on domestic production and consumption or exportable surplus but also on varieties grown, adherence to SPS standards, international prices and availability of infrastructure facilities for storage, post harvest handling and transportation to ports etc. An important constraint facing the high value commodities sector both fresh food and processed is the stringent SPS requirements imposed by developing countries, that go beyond the standards stipulated in AOA under WTO 9. Pesticide residue and microbial contamination are important in fruits and vegetables, while parasites and zoonotic diseases are important for animal products. Thus, although trade in fresh and processed food products is growing compared to export of other products, due to stringent food safety hazards the number rejections is also increasing. The top three categories of food that that were detained by FDA in 1999 on SPS grounds include vegetables, fishery products and fruits (Unnevehr 2000). Thus, the benefit of liberalization in the food-processing sector could be undermined by the protectionist use of SPS measures by some countries (Jaiswal 2003). SPS measures can impede trade through unjustified requirements in different markets, unnecessary and costly or time-consuming tests and duplicative conformity assessment procedures (Zarrilli 1999). During and , the decline in export of 9 Traditional non-tariff barriers, Technical Barriers to Trade (TBT), compliance of the sanitary and Phyto- sanitary (SPS) measures are impeding the growth of exports. SPS measures are regulations on trade in foodstuffs and feed and other natural products to protect human, animal and plant health in the importing country. SPS measures are defined as any measures applied to protect human or animal life from risks arising from additives, contaminants, toxins or disease-causing organisms in their food; Protect human life from plant- or animal-carried diseases; Protect animal or plant life from pests, diseases, or disease-causing organisms; Prevent or limit other damage to a country from the entry, establishment or spread of pests WTO, 1995). 32
39 processed fruits and vegetables (-8 %) and animal products (-6.5 %) are due to stringent SPS measures under the guise of WTO (Mehta and George 2003). Certain instances of selective applications of SPS measures are cited below to clarify how they have impacted on food exports from India. EU imposed a complete ban on all fish exports from India in 1997 after some consignments were found to be contaminated with Salmonella and Vibrio cholera bacteria. Marine products were exported to the United States during this period when there was a ban imposed by the EU (FAO 2003). Australia, China and Japan do not allow Indian mangoes and grapes on the ground that certain fruit flies are present. Ironically, China imposed a ban on grapes for a species of fruit fly that does not exist in India. On other hand, USDA allows entry to a fruits and vegetables consignment only after detailed tests of the production region. The Japanese stipulation of Vapour Heat Treatment (VHT) of fruits is yet another instance of SPS becoming the key non-tariff barrier. The technological upgradation to comply with VHT protocol is a story of investment of time and money for at least five years. India was de-listed from the EU's list of approved countries for import of egg powder into EU because of its non-compliance to a Residue Monitoring Plan. India has lost an export market of egg powder of more than Rs 1000 million due to strict SPS measures. To become HACCP compliant, each unit had to invest around Rs. 15 to 20 million, which is around 5 percent of the total investment cost. With no domestic market for egg powder the existence of non-operating units, low capacity utilization of operational units and their higher operating costs adds up to a huge burden on the industry. No domestic agency took the responsibility of preparing the Residue Monitoring Plan for animal products including egg powder and the matter was thrown from one ministry/department to other. As consequences of all these measures, costs are imposed on the exporting country without any expected commensurate return. In view of the above the Andhra Pradesh government should take special steps to adhere to international standards, particularly for paddy, chilies, sugar, mango, grapes, gherkins, prawns, fish and marine products. The government needs to set up pesticide and aflatoxin residue testing laboratories at appropriate places, HACCP, codex standards, and risk analysis in accordance with SPS/TBT regulations. The costs of setting up these facilities or their upgradation needs to be worked out for planned implementation. Constraints facing the food processing industry In India, processed food prices are substantially high due to their high production costs and unreasonably higher taxes compared to fresh foods. Consumers have high price sensitivity and hence a reduction in cost is imperative for raising demand and consumption of food products. Also low opportunity cost of family members encourages them to process commodities in traditional methods and reduces demand for high price branded processed products. However, demand for processed foods is growing in the 33
40 nineties due to income growth, urbanization and changing life style patterns. Gandhi and Namboodiri 2003 found that there is a close relationship between growth in per capita net national income and index of production of food products industry. However, the industry is plagued by a number of bottlenecks on the supply side. These include availability of raw materials in adequate quantity and of right quality, small size of the units and obsolete technology leading to diseconomies of scale, regulations and policy hurdles, high taxes, lack of post-harvest infrastructure and food standards testing labs. And finally, lack of adequate finance since processing industries have a large component of working capital in total capital. Until recently a number of food products were reserved for Small-Scale Industries (SSIs), which often lack capital, use obsolete technology, are inefficient in production and weak in marketing, and not have any incentive to develop effective farm-firm linkages for reducing their transaction costs. Realizing the importance of scale of industry in agro-processing, the Government of India has recently taken-off some of the food items reserved for SSIs. In a competitive environment it would have been difficult for the SSIs to take advantage of the new technologies and economies of scale in production and marketing, both in domestic and international market (Birthal et al 2005). The tax level on the processed foods in the country is one of the highest in the world. For instance there is Central Sales Tax (CST) on food products, state sales tax, octroi, mandi and entry tax, customs duty levied at various levels. The net effect is 21-23% tax on food items (MOFPI 2004). The approach paper of the Ministry also states that India is the only country to levy excise duty on machinery and equipment for processed foods. Compared to many other countries, this tax burden is high. Comparative tax burden is 10 percent in Philippines, Indonesia and Malaysia, percent in Netherlands and United Kingdom, 17 percent in China and Ireland. (CIFTI 2002). All this adds to the cost impacting on the price and consequently on demand for processed foods. Cost of packaging ranging from 10 to 64 % of production costs is another major constraint facing the sector. It adds 30-70%to the cost of the processed food product. A good packaging is essential to not only preserve the freshness of the product but also prevent spoilage and increase its shelf life. There is thus a need to find cheaper and effective packaging materials and technologies. 34
41 The regulatory overhang with more than twelve Union Ministries and corresponding State Ministries, and plethora of laws governing the Food Industry 10. There are about 17 laws governing the food industry. And, there are separate laws relating to weights and measurements, packaging, adulteration, etc. These laws are administered and implemented by different departments and/or ministries. Besides rules and regulations framed by central government there are a number of regulations that come under the purview of state government. For instance, while excise duty is imposed by the central government, sales taxes etc are imposed by state governments. Processors face a stiff challenge to meet all the regulations. While agro-processing can reduce post harvest losses, this is only possible if suitable varieties for processing are available. For example, for horticulture crops, many varieties with heterogeneous quality traits are produced in large quantities and are not suitable for processing leading to poor outturn per unit weight of raw material or are unsuitable for processing. Thus, the challenge is to not only promote agro-processing industry but also ensure supply of raw materials suitable for the processing industry. Contract farming, farmer field schools, capacity building of NARES and NGOs etc can play an important role here. In addition to the above constraints diversification to high value crops is constrained by lack of institutional and legal backing for vertical coordination. For example, no legislation exists for a breach of contract by any party (farmer or the firm). These are discussed in greater detail in the subsequent chapter on vertical coordination. 10 There are laws that govern a specific commodity or a group of commodities. And, there are separate laws relating to weights and measurements, packaging, adulteration, etc. These laws are administered and implemented by different departments and/or ministries. As for instance, Prevention of Food Adulteration Act 1954 is implemented by the Ministry of Health; Agriculture Produce (Grading and Marking) Act by the Ministry of Rural Development; laws related to standards, weights and measurements are under the jurisdiction of Ministry of Civil Supplies, Consumer Affairs and Public Distribution and the laws related to environment are implemented by the Ministry of Environment and Forests. For setting up an agroprocessing unit an investor has to get clearance from all the concerned departments. Such a multiplicity often results in conflicting approaches, lack of coordination and administrative delays. 35
42 Chapter VII VERTICAL COORDINATION IN HIGH VALUE COMMODITIES Need for vertical coordination There are several constraints, which are hindering the growth of food processing industry for HVCs. As already discussed in the previous chapters, one of the important factors hindering growth is the difficulty in procuring the right quantity and quality of raw materials from the established markets (Asokan and Singh 2003). Gandhi et al 2001 have found that there is a strong relationship between agricultural output and growth of agro processing industry indicating the important role of raw material supply to the industry. There are several alternatives to procure the raw materials and one such alternative is procuring through vertical coordination. Vertical coordination is an important part of the competitive strategy and is defined broadly as various methods used to manage vertical stages in a marketing channel (Boland, Barton and Domine 2002). There are different forms of vertical coordination: open marketing; contract production and marketing; and vertical integration through cooperative, producers associations or public companies. Among these, contracting production and marketing is emerging an importance method to promote high-value commodities in many developing countries. It is an agreement between farmers and processing and / or marketing firms for the production and supply of agricultural products under forward agreements, mostly at some pre negotiated prices. The contract could include a commitment from the farmers to supply a particular agriculture commodity at a specified time, in specified quantity and a specified quality (Eaton and Shepard 2001). In contract farming system the firm and the farmer share the risk, but the distribution of risk depends on factors like bargaining power, availability of alternatives and access to information. In general, the farmer bears most of the production-associated risks, while the firm bears risk of marketing the final product (Asokan and Singh 2003) Contract farming initiatives and models All India: Though not a new concept, contract farming is still at infancy in India. Very few states have initiated the process of linking producers with agri-business through contract farming. These include Punjab, Karnataka, Maharashtra, Gujarat, Tamil Nadu, Uttar Pradesh, and Andhra Pradesh. Tomato, chilly, barley, basmati rice, and maize in Punjab; wheat, soybean and maize in Uttar Pradesh and Madhya Pradesh; fruits, vegetables, spices and medicinal plants in Maharashtra and Karnataka; and cotton in Tamil Nadu are some of the popular crops produced and markets through contract system. One of the major benefits of contract farming is to reduce transaction costs and minimize market inefficiencies. In a study on contract farming models for milk, vegetables, and broilers Birthal et al. (2005), found that contract farmers were taking advantage of the new institutional arrangement that reduced their transaction cost. In case of milk and vegetables the savings were in time, transportation cost and labor cost for marketing the produce. For broiler farms, in Andhra Pradesh, the principal attraction was 36
43 availability of chicks, medicines and feed from the firm and transfer of some of the production risk to the firm. The farmer is assured of a fixed return and the entire marketing risk is borne by the firm. Evidence from the above case studies indicates participation by small- farmers in large numbers in contract farming. In summary, in all the models of contract farming tried so far in India, the company is supplying to the contracting farmers seedling, technical assistance, access to farm machinery etc either free of cost or at subsidized rates. A few firms are also providing inputs on credit at nominal interest rates. In a majority of the models price is pre- determined at the time of entering into contract. However in some cases although the prices are pre-determined, these are subject to change depending on the market price at the time of purchase 11. For more information on farmers and sponsoring firms perceptions on contract farming see appendix 3. Generally, in all the models rejection of the produce by the company on quality grounds and farmers diverting the produce to the market (due to higher prices) are the major threats to the smooth functioning of contract farming. A major hurdle is that in the entire contract farming agreements there is no mechanism to settle disputes in a speedy manner and the legal status of the contract itself is questionable. Contract growers, as a group need legal protection to shield from contracts that go against them. Co-operatives or other agricultural producer organizations are able to negotiate for equitable and standardized contracts and their scrutiny by a government agency. Andhra Pradesh: In Andhra Pradesh contract farming is in a nascent stage and only a small proportion of area is covered under contract farming. Oil palm occupies the largest area under contract farming followed by gherkins. The contract farming projects in the state is shown in Table 31. However, none of the models of contract farming have a legal status for enforcement in case of any dispute. In recent years the government has taken a number of initiatives to promote contract farming and is discussed later in this chapter. Case studies of vertical coordination / contract farming in Andhra Pradesh In this study, we have analyzed the contract farming models in the state for gherkins, which are mainly exported and involve a large number of small farmers in their production. Since this is a successful model of contract farming in the state it is taken up as a case study. The integration of broiler production is another example of successful contract farming in the state. While in the case of gherkins farmers profitability increased substantially due to contract farming, in the case of broiler production the marketing risk 11 For barley although the purchase price by the company is pre-determined there scope for increasing the price depending on the market price. Under the Apachi model the purchase price of cotton is not fixed in advance as the prices are fluctuating due to domestic and international market forces. The contract allows the farmer to sell his commodity at the prevailing market prices during the time of negotiation. The cocoordinating agency has the first right to negotiate, but in the event of disagreement about price during negotiation, the farmer groups can call for tender / auction and sell to the highest bidder (Spice 2003a). Other models include indexing the price with market price at the time of harvest or purchase etc. 37
44 is completely taken over by the integrator. These case studies it is hoped would provide some insights on the working of contract farming in the state and its possible application for other crops. Gherkins Gherkins are mainly exported after processing although there is a small but growing domestic market. The crop is mainly exported to Europe, Australia and America. Russia is an important buyer from India. The produce has huge international market. Global Green is exporting 2000 containers per annum. The company has 6 years experience in this business. So far only corporate houses are involved in this business. The company has adopted contract farming model for procuring the produce from farmers. Under this model the company is providing technical guidance and inputs to farmers and the farmers in turn are supplying quality produce to company. The company has two processing plants one at Zaheerabad and another one at Bangalore and their processing plant capacities are 50 and 30 t/day respectively. In Andhra Pradesh the company has four production centers /growing regions that feed the processing plant in the state. These are located in Gadwal and Jedcherla mandal in Mahabubnagar district, Siddipet mandal in Medak district and Vikarabad mandal in Rangareddy district. In Siddipet the Company has a facilitator, Mahindra Shublabh, who procures the produce on behalf of Global Green. This type of contract farming is also called intermediary model. The Company is supplying calypso variety seed, which is resistant to downy mildew disease. Incidence of downy mildew disease is very common in gerkins. To meet the daily requirement of the processing unit, the company follows staggered sowings (sowings taking place every week). Sowings starts from 15 May and continues until 10 February. Sowings are negligible in April and May due to high temperature and water scarcity. In Gadwal mandal where the survey was carried out, every month approximately acres is sown covering 5-10 villages. If the production exceeds the capacity of the processing plant, company has capacity to store up to 2000 t. Alternatively, it can send the excess produce to Bangalore processing plant. The firm applies following criteria to select growing area, villages and farmers: Nearness to processing plant Suitability of area in terms of soil, availability of irrigation facilities Availability of sufficient area Farmers willingness to take up this crop Large area (5-15) acres in a single village Availability of irrigation facility with farmer Type of soil especially red sandy soils and Character of the farmer Supporting services provided by company The company is supplying seed, fertilizers and pesticides to the farmers on credit and recovers the loan from payments to the farmers for the final output. If the crop fails 38
45 before harvest, company encourages farmers to take up another crop of gherkin and extents the repayment period of the first crop. Company is providing extension services like technical guidance on agronomic practices and appropriate use of fertilizers and pesticides and effective management to augment productivity and reduce unit cost of production to become more competitive. Quantity and quality Based on the export demand, the company fixes the grades 12 and price before sowings (Table 32). Price is uniform throughout the year but sometimes the prices are changed for particular grades depending upon export demand. The entire production is purchased from the farmers as long as they meet the required quality standards or grades. The produce is rejected only if it is not conforming with the specified grades. But to maintain relationship with farmer, the company is buying rejected produce at a nominal price (i.e., 50 paise per kg) and selling in domestic market. Incidence of rejection rate is very low ranging from 2 to 5 % of the total produce. Crop delivery arrangements The fruits are harvested every day after 35 days of sowing, and continued for about 30 days. The produce is brought to the collection center/buying points set up by the company. There are no marketing costs incurred by farmer. At collection center the produce is graded and details of quantity by grade are entered into farmers passbook given by company. Payments to farmers are made in two installments. The produce is packed in plastic crates and transported to the processing unit at the cost of company. At the processing plant, produce is thoroughly screened for quality standards and then bottled by adding preservatives as per the requirement. Presently, the company is exporting % of the produce to Russia. Monitoring- a mouse click away By a simple system of "tagging the crop" at the time of purchase it is possible to trace any product in the processing plants up to the buying point. This traceability also allows the company to check for customer complaints if any. A computerized MIS system enables recording of farmer contracts and forecasting of expected crop arrival. This allows for planning of sowings to meet export orders. Through same system purchase of crop and issues of seeds and chemicals are recorded. All this ensured a transparent and accountable system. The farmer and company perspectives on the functioning of contract faming related to gherkins are discussed in Box 1. The salient features of the contract farming model related to broilers are highlights in Box At present ( ) 18.5 m.m (1 st grade) and 26 m.m (2 nd grade) grades are in demand. The company offers Rs. 7.00/kg for 18.5 m.m grade and Rs. 3/kg for 26 m.m grade. 39
46 Box 1: Contract farming for gherkins in Andhra Pradesh: A successful model Gherkins is a short duration crop (60-70 days only) and farmers are realizing net income of Rs 6000 to 7000/ acre/ crop and have the option of cultivating a second crop or grow alternative crops. The returns over variable costs are about 30% higher / acre /annum for farmers growing at least one gherkin crop during the year. The company bears the marketing risk and makes prompt payment as per the specified quality standards and keeps well-organized record keeping system. The area under gherkin contract farming at present is 3500 ha and is expected to double in the next 2-3 years. Growing gherkins under contract farming has brought into light a number of new insights related to contract farming. For instance in contrast to the popular belief that contract farming is beneficial for large farmers, for gherkins a large number of small and marginal farmers are also involved in growing gherkins, family labor can be engaged throughout the crop period, women are getting on average women days of employment / crop/acre during harvest period and with money in hand women are empowered and thus have better stake in farm and family decision making, migration of family members engaged in gherkins production reduced due to availability of wage employment in the off season also. Farmer perception: Most of the farmers had experience in cultivation of vegetables, hence they could easily adopt the improved practices, assured buy back at pre- determined price, the prices offered by the company are remunerative and farmers know well in advance the quality requirements and incentive by way of higher price for best grades, middlemen are completely eliminated in the marketing chain, reduced marketing cost as the company is bearing transport charges and other costs, appropriate technical guidance from the company. On the flip side the farmers expect the company to take measures to insure the crop and in case of crop failure, presently the farmer has to bear the production risk especially for new cultivars introduced by the company for the first time, price gap between different grades is too wide and the company should consider reducing the gap. Sponsor (company) perspective: While the company is assured of quality product at fixed prices they too face a few problems: Farmers are not following the advice given by company related to crop technology and management, for example fertilizer application and are diverting urea to other crops. Thus farmers are realizing lower yields than potential yields. Finally, farmers are withdrawing from contract due to water shortage. The above model can be replicated for other crops but should be fine-tuned to meet the requirements of specific crops. 40
47 Box 2: Broiler production in Andhra Pradesh under contract farming: A boon to smallscale producers High risk in broiler production due to outbreak of diseases and fluctuating prices led to the closure of several small-scale broiler farms in Andhra Pradesh. Over time the size of the smallest units hovered around 100, 000 or more birds. At this juncture Venkateshwara Hatcheries Limited a leading poultry integrator based in Hyderabad, Andhra Pradesh, came up with a contract-farming scheme in broiler production since mid-1990s in Andhra Pradesh and a few other southern and western states of the country. Several farmers who had earlier abandoned their broiler farms were now back in the reckoning by entering into contract with the firm. Under this agreement the the integrating firm is supplying chicks, medicines and feed to the farmers which constitutes 75 percent in the total cost of broiler production. The firm is also providing technical guidance, communication and transportation for acquiring inputs. The broiler producers inputs include his land with the shed, water facilities, electricity connections and his labor. The poultry producer gets a fixed / pre determined price per kg live body weight of the bird. In addition to this the firm shares profits due to rise in market prices with the farmers. On the production side the firm shares mortality risk of 5 percent and remaining risk to be borne by the farmer. For mortality exceeding 5 percent, the firm charges Rs. 0.10/kg of live body weight of the grown-up broiler for every one percent increase in the mortality. A premium of 25% is also paid on the price if the feed conversion ratio is higher than some stipulated average. Thus the firm is bearing the market risk while the producer and the firm is bearing the production risk. This type of risk-sharing mechanism protects farmers, specially the smallholders, under volatile market conditions. Ramaswami et al. (2004) have estimated that contract farming in broiler industry could shift about 88 percent of risk from the farmer to the processor. Such a risksharing mechanism helps the smallholders in improving their management strategies and minimizing production and price risks. Farmers are also able to increase their scale of operation in such a risk free arrangement. Additionally, the contract farmers are also making 13 percent more profit compared to noncontract farmers in broiler production. Costs and profits in broiler production under contract and non-contract farming 1 (Rs/t) Production cost Transaction cost Total cost Net profit Non contract producer Contract producer Sample size is 25 farmers contract farmers and equal number of non-contract farmers from 10 villages of Rangareddy, Mahaboobnagar and Nalgonda districts of Andhra Pradesh. 2. Firm supplies free chicks, medicines and feed to farmers. Source: Birthal et al
48 Domestic markets for gherkins Domestic market: In India domestic market consumption of processed gherkins is negligible. Generally the processed gherkins are taken along with breakfast, and in India people are not habituated to this. Also, many cannot afford to buy the processed gherkins, as these products are costly ( Rs 55 /200 gm bottle ). The domestic marketing channel is as follows: At present production valued at Rs 0.1 million /month is marketed in Hyderabad market and includes consumers in the market and star hotels. To increase the sales the company has started conceptual selling initially, i.e., in bakeries and in super markets they are offering burgers and foods made with processed gherkins to customers at free of cost to habituate the customers for these products. The consumption of gherkins is more in north and western India. Delhi, Chandigarh, Jaipur, Ahmedabad, Bombay and Pune are major markets. In Delhi, consumption is more due to expatriate population (Embassies) and Indians with more exposure to wide range of foods. In , the value of produce marketed was around Rs 0.5 million /month. In it could be around Rs 2.5 million /month. Demand for processed gherkins in domestic market is gradually increasing. Indianised recipes with processed gherkins would further stimulate consumption. Policy initiatives Policies should permit the private sector to capture a major share in international market by providing necessary incentives within the WTO framework. Marketing the produce under one brand name would be beneficial to all companies in the long run. At present companies are marketing their produce under different brand names as per agreements with their counterparts in different countries. Institutions like CFTRI can make new recipes with these processed products to cater the needs of International market. studies should be undertaken by the companies for exploring new markets and markets for new products.. Oil palm is another example of contract farming in the state. Despite the largest area under contract farming this model is not successful despite the Government providing subsidy on planting material, drip irrigation and fertilizers. The involvement of Government is all stages of the contract, long gestation period of the crop, need for continuous irrigation, buy back price of oil palm fixed by a Committee consisting of Government and processors representatives every quarter based on oil recovery in the previous quarter, dishonoring of the contracts by companies due to lack of sufficient processing capacity etc. could be some of the reasons for the failure of this model. Documentation of government initiatives promoting vertical coordination in Andhra Pradesh The Government of Andhra Pradesh is keen to promote contract-farming initiatives in the state for diversification and faster growth of the agricultural sector. In this direction it has 42
49 taken a number of steps and policy decisions to support and promote contract farming in the state. Contract Farming is a vital element to raise the level of economy and food processing in the State. The State Government intends creation of symbiotic and strong cohesive partnership webs between, farmers, processors/companies bankers, essentially to be built upon mutual trust. The role of the State is mostly that of a catalyst or facilitator to provide an enabling environment for the smooth and effective implementation of Contract Farming. Contract Farming is expected to facilitate more investments, technology transfer, and assurance of ready markets from corporate sector for the ultimate benefit of the farmer and the State. After due consideration of the above facts, Government of Andhra Pradesh has evolved Contract Farming Policy for development of horticulture crops as described below: 1. Promotion and speedy implementation of Agri Export Zones (AEZ) for selected crops where contract farming is key to promote the interests of the farmer, processor and exporter. 2. Prioritized support through various prevailing schemes of central and state Government organizations like Agricultural and Processed Food Export Development Authority (APEDA), National Horticulture Board (NHB), Ministry of Food Processing (MFPI), etc., to the contract farmers in AEZs. 3. Provision for the following basic support services for contract growers and firms: Good quality plant material and drip irrigation facility at 50% subsidy, Disease forecasting system, Agri Information system, Testing laboratory facilities for soil, water, leaf & fruit at 50% subsidy, enable companies to avail benefits related to procuring mobile pre- cooling units, cold storage, refrigerated transportation and collection counters & pack house, freight subsidy. Subsidize 50% of the certification expenses in case of organic farming contracts, declare Crop Zones for promoting organic farming under contract farming. 4. Training and skill building of horticulture growers through training in key areas like modern agronomic practices, Integrated Pest Management, Post Harvest Management; exposure visits nationally and guidance of expert consultants and subject matter specialists free of cost to contract farmers. 5. Establishment of a Project Management Unit to exclusively handle all issues pertaining to contract Farming projects in the Department of Horticulture, Government of Andhra Pradesh. 6. Exemption from Pollution Clearance Charges for setting up of Food Processing Units, payment of Agricultural Market Cess as per Section-35 of the Andhra Pradesh (Agricultural Produce and Live Stock) Markets Act 1966 for the produce under contract farming. 7. Government will participate in the price negotiations, but upon mutual consent/ request of the contract farmer and contracting company only. 8. Facilitate in acquiring of land to companies, which are into contract farming for setting up food processing units on a priority basis. 9. Encourage banks to provide loans to the contracting farmers through tripartite agreement between the Farmer, the Company and the Bank. 43
50 10. Provide a single window redressed system for clearing the projects with speed and accuracy. Reforms in agricultural marketing An important step besides several others is to implement the Model Act on Agricultural Marketing to modify existing Agricultural Produce Market Act The model act is an attempt to over come some of the major shortcomings of the present system and the main thrust is on promoting competitive marketing from farm to the consumer plate. Once implemented the act will enable compulsory registration of all contract farming sponsors, recording of contract farming agreements and resolution of disputes arising out of such agreements. Main recommendations include the following: New markets can be established by the private sector and other legal entities, and farmers are free to sell their produce in any market. Promote public-private partnership in the management of agricultural markets. Promoting agricultural processing including activities for value addition in agricultural produce. Compulsory registration of all contract farming sponsors, recording of contract farming agreements, resolution of disputes, if any, arising out of such agreement, exemption from levy of market fee on produce covered by contract farming agreements etc (For details see appendix 4: Model marketing act). The Government of Karnataka has already modified Karnataka Agricultural Produce Marketing (Regulation) Act 1966 to allow establishment of an "Integrated Produce Market " to be owned and managed by National Dairy Development Board for marketing fruits and vegetables and flowers in that state (for details see appendix 4: Model marketing act). The government of Andhra Pradesh has recently passed an amendment incorporating the model-marketing act into the existing act. 44
51 Chapter VIII FOOD-PROCESSING INDUSTRY Food processing industry the emerging sector Mckinsey et al 1998 have analyzed the evolution of eating patterns through the different stages of development in over 20 countries. In the first stage the focus is on obtaining basic dietary inputs or subsistence stage, the second stage involves additional basic requirements and dietary enhancers, and the third stage involves adding of premium foods to the diet. India is no exception, processed food accounts for a third of the value of the Indian food market and this is expected to grow further as ready to eat and packed food segment is expected to grow faster than the traditional food market (Spice 2003b). Income growth, urbanization, diet change and globalization are driving the process of value addition to agricultural produce and fostering of farm and non-farm linkages is gathering momentum. Other factors include fast paced lifestyle, increasing number of working women, nuclear families and demand for safe food. This is reflected in the faster growth of the agro-based industries (that includes a large share of food processing industries) in the post-reform period compared to pre-reform period. During the postreform period ( to ) the number of agro based enterprises has grown at a rate of 6.7 % per annum as compared to 4.4 % during the pre reform period ( to ). (Chadha and Sahu 2003). According to Mckinsey high volumes and high growth are expected in packaged atta, packaged milk, confectionery, bakery etc, low volumes but high growth expected in frozen vegetables, fruit drinks, jams and sauces, poultry products, etc. The potential for growth of food processing industry in India is immense since at present in India, only 2% of fruits and vegetables, meat and poultry and 14% of milk production by way of modern dairies is processed (Ministry of Food Processing Industry 2005). In contrast 70% of fruits and vegetables are processed in Brazil and USA, 78 percent in Philippines, 83 percent in Malaysia and 30 percent in Thailand (Kaul 1997). More over, due to lack of appropriate post-harvest infrastructure facilities for fruits and vegetables the annual losses is put at more than Rs.30 billion (Gaur 2000). Food processing not only contributes to the value chain but also promoted rural urban linkages, rural industrialization and employment opportunities (Shivkumar et al 1999). Agro based food industry generates on an average employment for 14 persons per investment of Rs 100,000 versus three persons / Rs 100,000 in non-agro industries (Gandhi et al. 2001). The average raw material intensity (share of agricultural raw materials in total inputs) of food industries is around 83% indicating large dependence on agricultural production. As already discussed in Chapter 1, Andhra Pradesh is no exception to the changing diets, and the state is also an important exporter of fresh and semi-processed HVCs for both the domestic and international markets. A number of key constraints facing the sector related to infrastructure, supply of raw materials, taxes etc were discussed in Chapter 6. In this chapter we will examine how the processing industry in Andhra Pradesh is responding to the changing demand and the recent initiatives taken by the government to promote the sector. 45
52 Structure of food processing industry: Andhra Pradesh Andhra Pradesh is an important food processing state with 40% of the factories in the manufacturing sector falling under the agro-food industries category accounting for 10% of the total fixed capital. The comparable figures at the all-india level are 17% and 4.5%. The industry contributes about 18% of the total output from the manufacturing sector in the state, 18% of the total employment and 27% of total net value added (Table 33). Andhra Pradesh ranks second next to Maharashtra with 10 % share of total value added from food processing industry in the country in In there were 5350 food manufacturing industries in the organized sector with an investment of Rs million (Mahendra Dev and Chandrasekhar 2004). Of these the maximum number of units are in grain milling accounting for about 67% of the total units, followed by edible nuts units, bakery products and dairy products (Table 34). Canning and preservation of fruits industries are still at infancy stage. Despite this grain milling contributes only 23% of the net value added in the food industry compared to 25% from HVCs. At the all-india level too within the food category, grain milling dominates with 44% share of industries, edible oils and sugar accounts to 23 % while other foods category including high value commodities account for 33% of the factories. In terms of net value added however, the other foods category, accounts for 49% of total net value added and accounts for 43% of employment in the food category compared to grain milling which contributes only 7% to value addition and 20% to employment. For the state as a whole the average growth rate of food industries was around 5% in the 80ies but declined to around 1% in the nineties. The decline in the growth rate can be attributed to the slowing down of the growth of grain milling, processing of edible nuts and vegetable oils and fats industries. These industries grew rapidly in the eighties and had reached a saturation point by mid nineties. In contrast, in the nineties industries related to HVCs like dairy products, fishing, and feed manufacture (for dairy and poultry industry) grew faster reflecting their growing importance. This is also reflected, in the faster growth rates in net value added in the industries like processing of edible nuts and in industries related to HVCs like fruits and fish processing, feed industry, ice creams etc. However, since these sectors are growing from a low base it is not reflected in the overall growth of the food processing industry. Fruit processing: Andhra Pradesh is second largest producer of fruits and vegetables in the country. Mango, grapes, banana, papaya, sweet orange, pomegranate, onions, tomato and okra are most potential fruits and vegetables for processing. The state has recently started exporting a small quantity of processed fruits and vegetables. 46
53 Most of the food processing units in the state is small-scale industrial units 13. There are only few medium scale units equipped with facilities for fruit processing and assertive packaging. The fruit processing units in the state are concentrated mainly in Chittoor district where the raw material is available. At present, only fruit pulps of tomato and mango; juices, canned fruits, jams, pickles and squashes are manufactured. The recent additions are frozen fruits, pulps, dehydrated and freeze dried vegetables, fruit powders, fruit juice concentrates and canned mushrooms. There is ample scope for processing of fruit crops like papaya, guava, pomegranate, banana, grapes etc, and vegetables crops like gherkins, tomato, peas, tapioca etc. Mango pulp: Chittoor district of Andhra Pradesh is an important source for export of mango pulp in the country. The value of mango pulp exports from India increased from a low of Rs million in 1991 to a high of Rs million during In Andhra Pradesh accounted for a third of these exports. The state however, processes only 1.8% of its mango production (0.4 million t out of 2.4 million t production) and exported about 40% (0.17 million t) of the mango pulp production in (GOAP, 2001). Mango kernal oil, kernal flour, peels juice, and fried peels are other by products from mango processing that have commercial value and export potential. Different technologies are adopted for making mango pulp. While mango jelly making is carried out in cottage industries under traditional technology with minimal capital investment, mango canning involves considerable capital outlay in fixed assets. A NABARD study in 2001 found that the net margin realized by the farmer is 21% if mango is sold to processing unit compared to 4.6% if sold to traditional consumer. The macro impact of mango processing was also considerable with value addition of Rs.650 million from 400 jelly units and 33 canning units. The success of Chittoor district in the export of processed mango products can be attributed to the successful functioning of the Agri-Export Zone (AEZ) for mangoes in Andhra Pradesh. More details on the AEZs are provided in the next section. Although the mango pulp processing industry is growing, the quantities processed are still very small. One of the main reasons for this is that most of the mango varieties in the state are of benishan variety that is not suitable for pulp production. The other problem encountered by the mango pulp processors is compliance with HACCP (Hazard Analysis Critical Control Point). Compliance costs for implementing HACCP are high than returns. Financial institutions are not coming forward to fund upgrading infrastructure for HACCP compliance. For the existing units to revamp their infrastructure to comply with HACCP approximately the costs of production will rise by 40%, making the units uncompetitive. Also, most of the processing units are small in this sector and meeting HACCP requirements substantially raises their cost. Therefore, the mango pulp processors (exporters) are targeting Gulf countries where HACCP is yet to be enforced. 13 An industrial undertaking is considered to be small scale Industrial undertaking in which the investment in fixed assets in plant and machinery does not exceed Rs 10 million. This criterian is in force w.e.f and applies to all units whether held on ownership terms or on lease or on hire purchase (subject to the condition that the unit is not owned, controlled or subsidiary of any other industrial unit. 47
54 Low price is the main concern in these markets. New units however, are taking appropriate measures so that HACCP requirements are a part of infrastructure development. Extension services, cold storage facilities and quality control laboratories are inadequate. Financial institutions are not providing credit as they rate-financing foodindustry as high risk proposition. Packaging material available in the domestic market is of low quality and deteriorates the quality of mango pulp and packaging costs are increasing with quality material. Processed mango products have limited domestic market, and middlemen margins, taxes and packing cost are leading to high prices of processed products. On the crop production side high incidence of pest (fruit fly), lack of uniform practices for assessing fruit maturity, uncertain yields and adoption of age-old crop management facilities are basic concerns for processors. Vegetable Processing: Most of the vegetable processing units come under SSI and are using traditional preservation and processing technologies like sun drying, chemical preservation using vinegar, acetic acid etc. Small land holdings, poor farm management practices, non-uniform quality due to early or late harvesting and non-availability of varieties suitable for processing are the problems in procuring raw material. Pesticide residues and aflatoxin contamination in some vegetables are adversely impacting on exports. Tomato: Tomato is leading vegetable crop grown in the state. This crop can be grown throughout the year. Out of total production of tomatoes in the state about 705 goes for direct consumption, and 13% are processed, while 18% are wasted in different stages of post-harvest operations. There is scope for increasing processed products since Tomato market in some districts experience glut in certain months immediately after harvest, such that farmers do not even realize harvesting costs. Transporting the tomatoes to demand centers or as a long-term solution processing them can protect farmers from the above situations. However, varieties characterized by high yields and more pulp, uniform maturity, rich in total soluble salts are required for processing. Growing select varieties under contract farming is an option that can be tried. Innovations in export marketing: Agri-Export Zones (AEZs) The government of India had announced AEZ concept during EXIM policy The main objective of AEZ s is to promote agricultural exports from the country and remunerative returns to the growers in a sustainable manner. There are 60 AEZ s across 20 states in the country. The main objectives of the AEZ s are 1. To bring central and State governments and local agencies in the value chain to one point. 2. To reduce transaction costs. 3. To reduce time in the complete export process For more details on role of AEZs see appendix 5. 48
55 The government of Andhra Pradesh too has promoted AEZs mainly to promote exports of horticulture products. Presently, there are four zones covering gherkins, mango and products, grapes, and vegetables (Table 35). A new zone was recently created for chilies. Mahendra Dev and Chandrasekhar Rao (2004) recommended few more AEZ to include, poultry in East and West Godavari, fisheries in Nellore or Prakasam, meat in Medak, and banana in Pulivendula. The estimated costs of developing AEZs are borne by the central and state governments, and private agencies as per the MOUs signed by the parties. For example in the AEZ Hyderabad, for grapes and mangoes the estimated total project outlay is Rs. 572 million of which the Government share is Rs. 154 million and Private Entrepreneurs share is Rs. 418 million. Farmers, agro-processors and exporters falling in these zones are allowed access to present schemes on a priority basis including some concessions /subsidies. Government is organizing exposure visits for farmers for pack houses and training programs for farmers on various aspects like INM (Integrated Nutrient Management) and IPM (Integrated Pest Management). The Government of Andhra Pradesh is establishing necessary labs like soil testing laboratories in these zones and supplying packing material like plastic crates etc. The AEZs would serve as a catalyst for contract farming by creating the necessary enabling environment. The Chittoor AEZ for mangoes is the most successful in the state and also in the country. The exports from Chittoor district increased from Rs. 750 million prior to start of the AEZ to Rs million in Besides modernization of several units and HACCP certification the government has exempted from levy of sales tax on all inputs and packaging material used for exports. There are a number of other demands from the processors (creation of mango complex, cold storage and ripening sheds, concession on electricity charges etc) but on the whole the industry is responding to infrastructure facilities, and policy support from the government. Livestock products Among the large ruminants cows and buffaloes are not reared for meat purpose in India as also in the state. The slaughter laws also do not permit culling of young animals so the quality of meat is not upto export standards. By-products from slaughter of animals form an important component and can be processed into high value added products. However, due to poor abattoir conditions and improper recovery 20-25% of the by-products are lost at the production point annually. The poultry industry in the state is one of the fastest growing in the country. However, only 1% of egg production is processed into egg powder while processed poultry accounts for less than 5% of meat production. The two egg plants in the state produce whole egg, yolk and albumen powder. High taxes increase the cost of production making the units uncompetitive in the export market. Restrictions on domestic sales also need to be addressed to make the units viable. This industry needs to be given a fillip since the state has a surplus of egg production. 49
56 Marine products: Shrimps occupy 69.5 % in the total value of marine products exports from India during However, the unit value realization remains low due to high compliances cost of SPS measures. Japan. (31%), USA (24%) and EU (19%) accounted 74% of the value of India s marine product exports. Quality of produce is important as processed marine products differ widely, and deteriorate rapidly in tropical conditions. Markets for aquatic products are more organized at the secondary level than at the primary level. It is estimated that 10 % of the market arrivals are wasted due to quality deterioration in the absence of proper cold storage. Hence, it is important that the infrastructure at the primary market level be strengthened so that fish farmers will be able to realize better prices. Generally farmers have buy back arrangement with merchants. The merchants provide credit for buying fertilizers, seeds, feed etc in advance with an understanding that the entire production will be sold to them at market prices. In the short run, the government needs to take steps for enactment of aquaculture seed quality control act; establishment of disease diagnostic centers, popularizing alternative species that would reduce cost of production, conducting farmer awareness camps, levying power and water charges to aquaculture on par with agricultural sector, comprehensive act for Inland fisheries conservation, development and exploitation. In the long run however, the Andhra Pradesh government is planning to bring a comprehensive policy for the development of fisheries sector aimed at improving both production and quality through better regulation, improved infrastructure and modern technology. For details see appendix 6: Fisheries sector draft policy paper and on-going schemes in Andhra Pradesh. Policy changes initiated to promote food-processing industries To address some of the concerns related to food processing industry the Government of India during the last few years has initiated a series of measures or policy initiatives. These include liberalization of import of technology and foreign technology tie-ups, reduction in duties on import of capital goods and permission for equity participation and hiring of foreign consultants to facilitate flow of investment and managerial capabilities. All food processing industries, barring those manufacturing beer, potable alcohol and wine, have been delicensed. Automatic approval for foreign investment up to 51%, except a few items reserved specifically for the small-scale sector. To ensure proper quality of processed foods, the enforcement of the Food Products Order (FPO) 1955, has been made stricter than in the past. This Order regulates product specifications and hygienic conditions in the manufacture of food products. The quality aspect is being spruced up also because the phyto-sanitary and hygiene norms are gradually becoming important in international trade. The Export Inspection Act provides for pre-shipment inspection of export consignments by the Union Ministry of Food Processing Industries. This has helped in creation of quality consciousness among the exporters of processed fruit and vegetables. 50
57 Food processing policy draft (2005): All India The draft on food processing policy is a follow up of the discussions held at the conference of State Ministers related to Food Processing. The conference focused on need for integrated food law, national food processing policy and lowering of taxes on food products. The draft has been developed for speedy development of food processing sector. The salient points include: The policy expects food-processing industry should grow at the rate of 7.3 % per annum in the next five years. Emphasis will be on the following aspects: Measures to reduce cost of production and make processed foods affordable. Consolidation of the supply chain to reduce transaction costs. It is recognized that lack of infrastructure, post harvest losses, multiplicity of regulatory authorities add to the costs of the processed foods. Research on packaging needs to be stepped up to arrive at cost -effective solutions. Large food retailers or markets are encouraged to procure fresh produce from farmers or at best villages and make it directly available to consumers. Infrastructure facilities need to be improved like post-harvest handling, cleaning, grading, packaging and storage. Physical marketing and warehousing infrastructure needs to be upgraded. State government should enter into joint ventures to build and operate infrastructure facilities. In a nut shell: Existing policy There are multiplicity of loss and multifarious agencies administering them. The existing laws are concerned with regulatory mechanism. Conforming to AGMARK, Export Act (quality control and inspection), ISO-9000, and SQS-2000 and codex standard is voluntary under existing laws. Proposed Act The proposed act will attempt to harmonize and nationalize the existing food laws. Proposed act will give priority for promotional and developmental mechanism. Strict adherence to quality standards is compulsory under the proposed act. Food processing policy: Andhra Pradesh Upon the request of Ministry of Food Processing, Government of India, Andhra Pradesh state government has evolved a Food Processing Policy. The Government of Andhra Pradesh has announced a policy on food processing industry dated Prior to this the government had issued an operational guideline for food processing industry dated The Commissioner of Industries shall be the nodal agency to implement 51
58 the policy. All concessions under the policy shall be extended to existing units treating them as new units. The main objectives of the policy are: To develop food parks and agri-export zones; to harmonize various policies related to agriculture, horticulture, cooperatives etc; rapid technology upgradation; establish linkages between research, farmers and industry; create a market for processed foods; develop futures market and increase use of information technology. Ultimate goal is to give clearance under single window act. Simplify all procedures for inspection, pollution control etc leading to zero inspection regime. The policy will cover the following major areas: horticulture, agriculture, animal husbandry, fisheries, and agro-food processing industries. Additionally it would also cover allied industries like, cold storage units, refrigerated transportation vehicles, food packaging, canning and bottling industries, and food additives and preservatives industry. The various incentives and concessions under the policy include the following: Additional 10% on the subsidy given by GOI to food processing industry Government is providing electricity at subsidized Rs 1.75 per unit for a period of five years for newly established units. Refund of 50% of the stamp duty on land registration etc A 5%interest subsidy on working capital loans upto Rs. 2 lakhs. 50% subsidy on mechanized primary processing equipment for grading, sorting, packing, washing etc. 25% subsidy on dryers Sales tax on inputs, other than fuel, used by the food processing industry shall be adjusted against the tax payable, on the sales of the finished products. Further in respect of exports, industries department shall refund the input tax. 25% airfreight subsidy on actual airfreight incurred for export of perishables. Market cess exempted for all food processing industries. But the government will collect development cess of 0.5 % on the turnover of the value of finished product for exports and the amount will be utilized for improving the infrastructure for food processing industry. The Andhra Pradesh Industrial Infrastructure Corporation Limited shall form special purpose vehicles with private agencies to develop food parks and other food processing clusters. It will draw special funds from IIDF and set aside some funds for effluent treatment plants, and infrastructure like roads, electricity etc for the benefit of food processing industry. Backward Linkage: promote micro irrigation systems and contract farming and assist in establishment of futures market. Forward Linkage: develop and promote electronic trade exchanges for processed food products. 52
59 Food parks: The parks will be set up as joint ventures between government agencies like APIIC and private sector. Food processing units set up with in the parks are eligible for all concessions under food processing besides additional incentives. Presently, food parks are being set up for processing of poultry products, coarse grains and spices in Telangana districts; rice products, marine and horticulture products in coastal Andhra and vegetable and spice products in Rayalaseema region. 53
60 Chapter 1X ROAD MAP FOR AGRICULTURAL DIVERSIFICATION Agriculture in Andhra Pradesh is closely linked with the over all development and trends in the agriculture sector of the country. Currently, Indian agriculture is passing through a transition phase moving away from a supply driven to a demand or consumer driven phase. This change is reflected in the agricultural sector of Andhra Pradesh also. The factors underlying the paradigm shift include the following: Food self-sufficiency at the macro level and food grain surpluses Yield growth in cereals no longer the main goal Unsustainable paddy and wheat cycles in the green revolution belt and regions with irrigation potential Shift in consumer preference to high value commodities (HVCs) like fruits, vegetables and animal products driven by urbanization, rising incomes and changes in diet patterns Changing relative prices between cereals and commercial crops / HVCs Integration of markets under WTO or open trade policies opening markets for exports However, the shift from traditional crops or food grain crops to diversified agriculture particularly high value crops requires a whole new set of technologies, infrastructure, institutions and policies. The current agricultural policy thrust is founded on the philosophy of attaining food self sufficiency i.e., supply driven. For agricultural diversification to succeed on a sustainable basis and protect the interests of small-scale producers there is a need to develop new strategies, institutions and policies for the sector. The demand driven diversification can be a win win strategy if supply side constraints related to technology, credit, insurance, markets and post harvest infrastructure, vertical coordination and agro-processing are addressed appropriately. Thus reforms /policy changes are required in the following areas to diversify sustainably meet the emerging challenges in the agricultural sector. Marketing and processing Implement the Model Marketing Act: In 2003, a Model Marketing Act (MMA) was formulated by the national Government to improve the competitiveness of the present agricultural marketing system. Highlights of the act include, setting up of new markets by private or other parties, direct marketing by farmers to agro-processors, provision for contract farming, and futures or forward marketing. All these amendments would ensure that market regulation would give way to market competition and thus reduce marketing costs. In this regard the Government of Andhra Pradesh has brought about an amendment to the existing Marketing Act (1966) to include the features of the MMA to speed up its implementation. To be effective the implementation of MMA should be accompanied by an integrated food law, negotiable warehousing receipt system and liberalization of Essential Commodities Act (ECA 1955) to allow free movement, storage and marketing. FC (regulation) Act to allow futures trading in agricultural commodities. 54
61 Until the above acts are in place and functional steps should be taken to stream line the present marketing set up. For example, checking collection of unauthorized commission from farmers by the Commission Agents above the stipulated rate and the practice of deferred payment. Grading and standardization of produce should be transparent and publicized widely. All stakeholders should be made aware of concepts like pledge finance and negotiable warehousing receipts. If required necessary training programs may be taken up at the district level. The aim should be to reduce the farmers dependence on Commission Agents, thus giving him more flexibility in the sale of his produce. The existing Market Committees should be revamped and funds collected as market fees should be used for improving infrastructure to meet the requirement of diversified agricultural produce. Study the feasibility of a market stabilization fund particularly for fruits and vegetables to protect the farmers from low prices during gluts. Food processing industry: The industry faces a number of challenges that include monopoly commodity markets leading to high cost of procurement for raw materials, poor infrastructure, high transaction cost, multiplicity of laws, price controls and high taxes on processed foods. To take an example from the horticulture sector, India is a force to reckon with in the production of fruits, vegetables and milk etc i.e., high share in world production. However, due to low share in processing less than 1% of fruits and vegetables are exported. Unless necessary steps are taken this huge potential will remain untapped. Provide a single window facility to all stakeholders in the food industry, related to clearances, subsidies and other schemes of state and central government. Reduce taxes on processed food in line with taxes in other countries. Legalize contract farming agreements and register all contract production under the Model Market Act. Simplify procedures for arbitration in case of disputes between growers and contracting agencies. As the case studies indicate the role of government should be restricted to facilitation only. Once the enabling environment is created and restrictions on the role of private sector in agriculture is streamlined we can expect the following: Farmers get access to latest technology, production geared to meet quality standards, brand building, value addition and exports, strengthened supply chain leading to lower transaction costs. The role of government should be mainly facilitating role, the second green revolution has to be brought about by the private sector unlike the green revolution in rice and wheat. Commodity Committees Establish Commodity Committees for horticulture crops (fruits, vegetables) and other high value crops including spices etc. Crop specific associations at the farmer level will not only facilitate bulking, grading and storing of produce and selling directly to processors through appropriate market linkages but also enable farmers to avail schemes offered by various government departments related to horticulture. 55
62 The state level committee would include representatives from all stakeholders i.e., farmers, all concerned Government Departments, State and central agencies related to horticulture crops, research departments, bankers, industry, exporters and farmers organization. At the next level would be the commodity committees at the regional level that would include all the above representatives from the region. The state level committee would provide market intelligence and take up policy issues with the government. The regional committees would create awareness among farmers on latest technologies, package of practices, and schemes and subsidies available from the government. At the primary level farmers should be encouraged to form into Growers Association by commodity that enable them to utilize incentives from various government departments. The association can also take corrective measures in case of glut of particular crop by reducing area, bulk storing of produce, or simple value addition. Strategies to promote fruits and vegetables should include both short and long term strategies. Short-term strategies would include facilitating export of fruits and vegetables through appropriate grading, packing, pre-cooling, vapour heat treatment, fast track transport, and subsidy on air/sea freight. Long term strategy would include promotion of contract farming, value addition, market intelligence for both domestic and international markets, rationalizing land leasing laws, research and development, formation of agri-export zones. Credit Credit is an important requirement for the production of HVCs due to long gestation period, high start up costs and high input costs. Banks are unable to lend to 30-35% of farmers since they are either share croppers, or do not have pattadar passbooks or are defaulters. All farmers including tenant farmers, and women farmers should be eligible for loans. For this the government has to record tenants as cultivators and issue passbooks to them. This would also enable tenant farmers to get access to government subsidies on inputs etc. Alternatively, banks may consider crop loans to tenants on group guarantee basis. Insurance premium on commercial crops should be reduced since high premiums detract farmers from taking insurance and thus are not eligible for loans. The state level agricultural sub-committee of the SLBC should revisit the sectoral and regional distribution of primary credit in the state. Crop loans account for a major share of credit although the allied sector is growing. Within the crop sector the bias towards paddy and irrigated crops should be addressed to cover more crops, particularly rainfed crops. Also, a large share of the allied sector credit goes to the better-endowed regions, thus depriving the less endowed regions where allied activities are more important. In a number of rainfed districts credit /cultivator is half to less than half of the state average. This could be because banks consider lending to rainfed farmers as more risky. The vicious circle can be broken only if the state promotes a comprehensive crop or rainfall insurance scheme via the existing National Agriculture Insurance Scheme, to mitigate the risk of rainfed farming to some extent. The coverage should include all crops including horticulture crops. The calculation of compensation etc should be worked out in a transparent and easily understood manner. Additionally, the banks should consider 56
63 flexible and longer repayment schemes for rainfed farmers and special incentives should be given to banks meeting the targets in rainfed areas. The number of rural bank branches should be increased and this should be accompanied by an increase in credit-deposit ratio of rural banks to around 80% from the current 60% level. To the extent possible all loans for agriculture should be charged at the same interest rate. It goes with out saying that the functioning of RRBs and Cooperatives need to be improved as they suffer from political interference, lack of professionalism and end up as loss making units. In this connection the Government should accept the recommendations of the task force on revival of Cooperative Credit Institutions under the Chairmanship of Prof. A. Vaidyanathan. Water The share of groundwater in total irrigated water increased substantially in the state leading to depletion of water table. The depletion of water table is reflected in the unsuccessful attempts at digging bore wells, entailing huge costs and losses to the farmers many of whom end up in perpetual indebtedness. 2-3 crops account for bulk of the irrigated water, like paddy, wheat and sugarcane. The Water Use Efficiency (WUE) of these crops is low compared to less water consuming crops like fruits, vegetables, cotton, flowers etc. Since water is free resource farmers water use and allocation patterns do not reflect the marginal productivity of scarce water resources. The maintenance of surface water sources should be stepped up, particularly tank irrigation through desiltation, and incentives created for their maintenance by the community. Economic incentives and water charges would be needed to regulate irrigation water. The water charges should be large enough to shift cropping pattern to high value and Water Efficient Crops. Different options like volumetric pricing of water, output based pricing of water can be considered in place of the present pricing based on extent of area irrigated. The MSP for paddy is one of the main factors responsible for inefficient water use by the farmers, since they are assured of a market and fixed price. For several other crops including horticulture crops the support prices are not operational since the market prices are higher than the support prices. Extension There is an urgent need to change the mind set with respect to extension. Presently, the focus is on food crops and not on the emerging sectors. The government of India s new policy framework for agricultural extension, 2002, will focus on increasing farm household income through diversification. The goal is to make extension more market driven, promote public-private partnership in extension and withdraw public extension where farmers are willing to pay. The demand for paid services in India was higher in non-food grain crops especially horticulture crops and oilseeds (World Bank 2005). Some of the latest developments in the field of extension include ATMA (Agriculture Technology Management Agency, a registered society of key stakeholders 57
64 in a district) that serves as a focal point for integrating research and extension; agriclinics scheme introduced by NABARD in 2002 is designed to supplement the government extension system; increasing the role of private extension by agri-business firms, NGOs, cooperatives, input suppliers etc. The state government should adopt or take advantage of some of these models for more effective extension. Fisheries Aquaculture has to be treated on par with agriculture for providing important services like water, power, and credit. The government has also drafted a bill on aquaculture seed quality control order. This coupled with reduction in consumption of antibiotics and supply of pure water for processing and setting up of laboratories for disease diagnosis would help meet quality standards. Road linkages to landing centers are critical for quick disposal of produce. The environmental issues related to aquaculture need to be addressed since it leads to negative externalities for the environment and effects nonparticipating producers also adversely. The government should sort out issue related to insurance of shrimp farming, since companies are avoiding insurance and the banks are refusing to lend with out insurance. Step up the process for acquiring license from aquaculture authority for brackish water shrimp unit. There is also judgment that fresh water aquaculture units also should take permission, this needs to be sorted by the state at the appropriate level. Livestock and poultry The poultry sector neither comes under the agriculture sector nor the under the Companies Act. Thus poultry income is taxable but they do not get the benefits Companies Act related to industrial units. For the milk sector the supply chain system has to be revamped. Provision of bulk coolers and its link with chilling /processing plant is essential. Institutional reforms would play an important role in the dairy sector. The government has already taken a lead by promoting Mutually Aided Cooperative Societies in AP that are free from government interference since they are not attached to the state level Dairy Federation. To further professionalize the production and marketing of milk and to meet the requirements under the WTO commitments the government should seriously consider the advantages of floating Producer Companies or new generation cooperatives. Producer Companies would come under the Companies Act while cooperatives come under the Registrar of Cooperatives. This could be tried in a few regions where presently the cooperatives are not functioning efficiently. 58
65 References Acharya SS Analytical framework for review of agricultural marketing institutions. Institutional change in Indian Agriculture, (eds) Suresh pal, Mruthunjaya, Joshi, Raka Saxena, pp. ADB/ NACA Final report on the regional study and workshop on aquaculture sustainability and the environment (RETA 5534). Asian Development Bank and Network of Aquaculture Centres in Asia-Pacific, NACA, Bangkok, Thailand. Aquaculture Authority Shrimp aquaculture and the environment An environment impact assessment report, Asokan SR and Singh Gurudev Role and Constraints of Contract Farming in Agro-Processing Industry. Indian Journal Agricultural Economics, Vol 58, No 3. Barghouti Shawki, Kane S, Sorby K and Ali Mubarik DOA for the Poor: Guidelines for Practitioners. (World Bank/ARD Discussion Paper 1, March). Barghouti Shawki, Kane S and Sorby K Poverty and Agricultural Diversification in Developing Countries. Paper presented at the International Workshop on Agricultural Diversification and Vertical integration in South Asia, November 5-7, New Delhi, India jointly organized by International Crops Research Institute for the Semi-Arid Tropics, Federation of Indian Chambers of Commerce and Industry and International Food Policy Research Institute. Bhole BD. Problems in Marketing of Oranges in Vidharbha region of Maharashtra. Accessed on 23 rd May Birthal PS, Joshi PK and Gulati A Vertical Coordination in High-Value Food Commodities: Implications for Smallholders. Markets, Trade and Institutions Division (MTID) Discussion Paper No. 85, IFPRI, Washington DC. Bonilla ED and Reca L Trade and Agro-Industrialization in Developing Countries: Trends and Policy Impacts. In Agro Industrialization, Globalization and International Development. (Christopher BB and Reardon T, eds.), Agricultural Economics (special issue) 23: pp. Boland Michael, Barton David and Domine Matthew Economic issues with vertical coordination. Department of Agricultural Economics, Kansas State University. Kansas. Chadha GK and Sahu PP Small Scale Agro-industry in India: Low productivity is its Achilles Heel, Indian Journal Agricultural Economics, Vol.58, and No.3 July - September, pp. 59
66 CIBA Comprehensive survey of impact assessment of shrimp farms in Nellore district. Mimeo. Confederation of Indian Industry (CII) and Mckinsey Modernising Indian Food Chain: Food and Agriculture Development in Action, CII. New Delhi. Dastagiri MB and Mruthyunjaya Agriculture trade liberalization reforms: Effects on indian agriculture and agricultural marketing institutions. SAARC Seminar series papers. Hyderabad. Deshingkar Priya, Usha K, Laxman R and Srinivas R Changing food systems in India: resource-sharing and marketing arrangements for vegetable production in Andhra Pradesh. Development Policy Review, ODI. Vol. 21, 5-6: pp. DGCIS : Directorate General of Commercial Intelligence and Statistics, Ministry of Commerce and Industry, GOI, Directorate of Economics and Statistics Selected socio economic indicators: Andhra Pradesh & other major states & Government of Andhra Pradesh, Hyderabad. Directorate of Economics and Statistics State domestic product of Andhra Pradesh ( to ). Government of Andhra Pradesh, Hyderabad. Directorate of Economics and Statistics Statistical abstract of Andhra Pradesh Government of Andhra Pradesh, Hyderabad. Directorate of Economics and Statistics Season and crop report of Andhra Pradesh Government of Andhra Pradesh. Hyderabad. Directorate of Economics and Statistics, th Quinquennial Livestock Census, Andhra Pradesh. State Report. Government of Andhra Pradesh. Hyderabad. Directorate of Economics and Statistics Cost of cultivation of principal crops in India. Department of Agriculture & Co-operation Ministry of Agriculture. Government of India. New Delhi. Dorjee K, Broca S and Pingali P Agricultural Diversification in South Asia. A paper prepared for the Collaborative MOA (RGOB) NCAP IFPRI Workshop on Agricultural Diversification in South Asia, November , Olathang Hotel, Paro, Bhutan. Eaton Charles and Shepard AW Contract Farming: Partners for growth. Agricultural Services Bulletin 145, Food and Agriculture Organization of the United Nations, Rome. 60
67 FAO WTO Agreement on Agriculture: The Implementation Experience - Developing Country Case Studies. Accessed on June 1 st FAO Production, accessibility, marketing and consumption patterns of freshwater aquaculture products in Asia: A cross country comparison. FAO, Rome. Fulton A. and Clark, R Farmer decision making under contract farming in northern Tasmania, in Burch D., Rickson, R. & Lawrence, G. (eds), Globalization and Agri-Food Restructuring: Perspectives from the Australasia Region, Avebury, Aldershot, pp. Gandhi Vasanth P and Namboodiri NV Marketing of fruits and vegetables in India: A case study covering the Ahmedabad, Chennai and Kolkata markets IIMA working papers , Indian Institute of Management, Ahemedabad, Research and publication department. Gandhi V, Gauri Kumar and Marsh Robin Agroindustry for rural and small farmer development: Issues and lessons from India. International Food and Agriculture Management Review, 2 (3/4): pp. Gaur Govind Singh Country papers, India (1), In: Appropriate Post Harvest Technologies for Horticultural Crops in Asia, Asian Productivity Organisation, Tokyo: pp. Glover David and Ken Kusterer Small Farmers, Big Business Contract Farming and Rural Development, Macmillan, London. Goletti, Francesco DOA and Rural Industrialisation as a Strategy for Rural Income Generation and Poverty Reduction in Indochina and Myanmar (IFPRI Research Paper No 30, July) Government of Andhra Pradesh Department of fisheries. Government of Andhra Pradesh Vision Revitalizing Agriculture, pp. Hanumantha Rao CH and Mahendra Dev S Economic Reforms and Challenges Ahead an Overview. Economic and Political Weekly, March Hanumantha Rao CH 2000a. Declining Demand for Food Grains in Rural India causes and Implications. Economic and Political Weekly, January
68 Horticulture Department Government of Andhra Pradesh, Accessed on 24 th May ICRISAT Typology Construction and Economic Policy Analysis for Sustainable Rainfed Agriculture. A report on the Sustainable rainfed agriculture research and development, International Crops Research Institute for the Semi-arid, Patancheru, Andhra Pradesh IFPRI Public policies for rural institutions, markets and infrastructure development. MSSD Research Theme. Jaiswal Anand Kumar WTO Agreement on SPS Strategic Implications. Economic and Political Weekly pp. Joshi PK, Gulati Ashok, Birthal PS and Tewari Laxmi Diversification of Agriculture in South Asia. Economic and Political weekly, June Joshi PK, Gulati Ashok, Tewari Laxmi and Birthal PS Agricultural diversification in South Asia: patterns, determinants and policy implications. Markets, Trade and Institutions Division (MTID) Discussion Paper No. 57, IFPRI, Washington DC. Kaul GL Horticulture in India: Production, Marketing and Processing, Indian Journal Agricultural Economics, 52 (3): Kumar P, Mruthyunjaya and Birthal PS Changing Consumption Pattern in South Asia, Paper presented at the International Workshop on Agricultural Diversification and Vertical integration in South Asia, November 5-7, New Delhi, India. Jointly organised by International Crops Research Institute for the Semi-Arid Tropics, Federation of Indian Chambers of Commerce and Industry and International Food Policy Research Institute. Mahendra Dev S and Chandrasekhara Rao N Food processing in Andhra Pradesh-opportunities and challenges. Centre for Economic and Social Studies, Hyderabad. Mehta R and George J Processed food products exports from India: An Exploration with SPS Regime. Research and information system for non-aligned and other developing countries (RIS), India Habitat Center. New Delhi. f. Mellor JW Agricultural growth and poverty reduction The rapidly increasing role of smallholder livestock. Pages in Livestock and Livelihoods: Challenges and Opportunities for Asia in the Emerging Market Environment (Vinod Ahuja.ed). National Dairy Development Board, India. Pro-poor Livestock Policy Facility (South Asia Hub). 62
69 Ministry of Food Processing Industry Draft food processing policy Government of India. Accessed on January 19 th Ministry of Agriculture Directorate of Marketing & Inspection. Government of India. Salient features of the model act on agricultural marketing. on 23 rd May Ministry of Agriculture Report of inter-ministerial task force on agricultural marketing reforms, Department of Agriculture & Cooperation. Government of India. on 23 rd May Naidu MR and Susheela K Production and Marketing of Broiler in Vizianagaram District of Andhra Pradesh An Economic Analysis. Summary. Indian Journal of Agricultural Marketing (Conference Special) 18:(3) 185 pp. Nirmala AK Market imperfections and farmers distress in Andhra Pradesh. Report No.111. Agro - Economic Research Center, Andhra University, Visakhapatnam. NSSO Employment-Unemployment in India , Key Results. Parthasarathy Rao P, Birthal PS, Joshi PK and Kar D Agricultural diversification in India: role of urbanization. Markets, Trade and Institutions Division (MTID) Discussion Paper 77. International Food Policy Research Institute, Washington D.C. Paulraj R, Rajagopalan M, Vijayakumaran M, Vivekanandan E and Sathiadhas R Environmental and social issues in coastal aquaculture - A case study. Bay of Bengal News, II (11): Pingali P and Khawaja Y Globalization of India diets and the transformation of food supply systems. Keynote address XVΙΙ Annual Conference of The Indian Society Agricultural Marketing. 5 th February, Acharya N.G.Ranga Agricultural University and Indian Society of Agricultural Marketing. Pingali, Prabhu DOA: Opportunities and Constraints (Paper presented at the FAO Rice Conference, February, Rome) Planning Commission Report of the working group on horticulture development for the Tenth Five Year Plan. Government of India. Planning Department Economic Survey Government of Andhra Pradesh. Hyderabad. 63
70 Pokharel C Agricultural diverdification in Nepal. Paper presented at the International Workshop on Agricultural Diversification and Vertical integration in South Asia, November 5-7, New Delhi, India. Jointly organised by International Crops Research Institute for the Semi-Arid Tropics, Federation of Indian Chambers of Commerce and Industry and International Food Policy Research Institute. Raju VT and Sasibhushana Rao U Marketing of Poultry Meat and Eggs in Guntur District of Andhra Pradesh. Summary. Indian Journal of Agricultural Marketing (Conference Special) 18:(3) 186 pp. Rao AN Higher Employment and Income Potential of Horticultural Crops. Indian Journal of Agricultural Economics 52 (3): Rao KPC, Chopde VK, Mohan Rao Y and Kumaracharyulu D Salient features of village economies in the Semi-Arid Tropics (SAT) of India. Progress Report 130. International Crops Research Institute for the Semi-Arid Tropics, Patancheru, Andhra Pradesh, India. Rao KPC Survey report of Nemmikal (APRLP watershed village) and Isthalapuram (non-watershed village) in Nalgonda district, Andhra Pradesh, India, ICRISAT. Ramaswami B, Birthal PS, and Joshi PK Measuring gains from contract farming: an empirical analysis of poultry in Andhra Pradesh, India. Draft report submitted to the International Food Policy Research Institute, Washington, DC, USA. Ratna Reddy V, Prudhvikar Reddy P and Hemantha Kumar U Ecological and Economic Aspects of Shrimp Farming in Andhra Pradesh. Indian Journal Agricultural Economics, Vol.59, and No.3 July -September, pp. Ravallion M and Datt G Why Has Economic Growth Been More Pro-Poor in Some States of India than Others?, Journal of Development Economics, 68: Reddy Dasarath B Policy for Indian fisheries sector on the cards, Rosegrant Mark and Hazell Peter BR (1999) Transforming the Rural Asian Economy: The Unfinished Revolution. Hong Kong: Oxford University Press. Shanmugasundaram S Fruits and vegetables: Opportunities for small holders. Paper presented at the international workshop on Agricultural diversification and vertical integration in South Asia, 5-7 November 2003, New Delhi, India. ICRISAT, FICCI and IFPRI. 64
71 Sharan An Operational study of the CJ Patel vegetable and fruit market of Ahmedabad, Center for Management in Agriculture, Indian Institute of Management (IIM), Ahmedabad. Sharma KD, Pathania and Vashist GD Role of Rural Women in Small-Scale Agro-processing Sector -An Economic Analysis of Samridhi Mahila Processing Cooperative Society in Himachal Pradseh, Indian Journal Agricultural Economics, 58 (3). Shiferaw BA, Wani SP and Nageswara Rao GD Irrigation investments and ground water depletion in Indian semi-arid villages: The effect of alternative water pricing regimes. Working Paper Series No. 17. Patancheru ,Andhra Pradesh, India: International Crops Research Institute for the Semi Arid Tropics. 24 pp. Shivkumar SD, Balasubramanian R and Srinivasan N Growth Linkages Effects of Agro-Industrialization. Indian Journal Agricultural Economics. Vol 54, No.3, July- September, pp. Siddiqui Kalim Agricultural Exports, Poverty and Ecological Crisis-Case Study of Central American Countries. Economic and Political Weekly, No 39: A-128-A-136 pp. Spice. 2003a. Contract Farming Ventures in India: A few successful cases Vol No.4 March 2003, PGPABM, Manage, Hyderabad. Spice. 2003b. The Indian Processing Industry, Vol 1. No.3. January PGPABM, Manage, Hyderabad. Subrahmanyam S and Satya Sekhar P Agricultural Growth: Pattern and Prospects. Economic and Political Weekly. Sujatha RS and Eswaraprasad Y Marketing of Poultry Products in Andhra Pradesh an Over View. Indian Journal of Agricultural Marketing (Conference Special) 18 (3): pp. Sukhpal Singh Contract farming for Agricultural Diversification in the Indian Punjab: A Case Study of Performance and problems, Indian Journal of Agricultural Economics 55 (3): pp. The Economic Times Rural Economy. The ET Knowledge series report. Economic Times and NABARD. United Nations. Population Division World Urbanization prospects. Department of Economic and Social Affairs. USA. Unnevehr LJ Food Safety Issues and Fresh Food Product Exports from LDCs. Agricultural Economics 23:
72 Viswanathan KU and Satyasai KJS Fruits and Vegetables: Production Trends and Role of Linkages, Indian Journal Agricultural Economics, Vol.52, No.3 July- September, pp. Wickramasinghe PJ, Abeysekera T and Herath A Agricultural Diversification in Sri Lanka. Paper presented at the International Workshop on Agricultural Diversification and Vertical integration in South Asia, November 5-7, New Delhi, India jointly organised by International Crops Research Institute for the Semi-Arid Tropics, Federation of Indian Chambers of Commerce and Industry and International Food Policy Research Institute. World Bank. 2005a. Andhra Pradesh Overview. worldbank.org /INTINDIA/ Resources/ /APBriefState.pdf World Bank. 2005b. India: Re-energizing the agricultural sector to sustain growth and reduce poverty. Oxford University Press. WTO.1995.Sanitary and phytosanitary measures. Zarrilli S WTO Sanitary and phytosanitary agreement: Issues for developing countries, Trade-Related Agenda Development and Equity (TRADE), Working Papers, No 3, South Center. Zellner A An efficient method of estimating seemingly unrelated regressions and tests for aggression bias. Journal of the American Statistical Association 57, pp. 66
73 Table 1. Consumption pattern (quantity in kg/person/annum), India. Items Rural Urban Rice Wheat Coarse cereals Pulses Milk and milk products Edible oils Vegetables Fruits Meat, egg, fish Source: Consumption of Some Important Commodities India(various issues), National Sample Survey Organization Ministry of Statistics and Programme Implementation, Govt. of India. 67
74 Table 2. Proportion of food expenditure on major categories. Food item/nss Round India Andhra Pradesh 32 th 43 rd 50 th 55 th 59 th 32 th 43 rd 50 th 55 th 59 th Rural Total cereals Pulses and pulse products Milk and milk products Edible oil Meat, Egg and Fish Vegetable & fruits Food total Urban Total cereals Pulses and pulse products Milk and milk products Edible oil Meat, Egg and Fish Vegetable & fruits Food total Source: Various NSS Rounds 32 th refers to the year , 43 rd to ,50 th to , 55 th to and 59 th to 2003 respectively. 68
75 Table 3. Annual compound growth 1 rates in yield of major crops; Andhra Pradesh. Crop (Percent) Rice Sorghum Pearl millet Maize Finger millet Chickpea Pigeonpea Groundnut Sesamum Castor Sunflower 0.8 Sugarcane Cotton Growth rates were calculated using the exponential growth rate, Y =b 0 (e b1t ) linearized as ln Y = ln (b 0 ) + b 1 t, where ln Y = natural logarithm of variable Y, t = time period (years) and b 1 = growth rate of Y. 69
76 Table 4. Selected indicators by level of diversification; Andhra Pradesh, HVCs based diversification zones Indicators High Medium Low Total Demographic (Zone 1) (Zone 2) (Zone 3) (All zones) Population density (No./km 2 ) Urban population (%) Literate rural female (%) Agrarian structure/farm size Average size of land holding (ha) No of small land-holders (%) Technological Irrigated area (% to gross cropped area) Area under high yielding varieties (%) Fertilizer (kg/ha of net cropped area) Tractor density (per 000 ha of NCA) Diesel and electric pumpset density (per 000 ha of NCA) Cropping intensity Agro-climatic Average normal rainfall (mm) Infrastructure Road density (km/km 2 of geographical area) Market density (markets/10,000 km 2 of geographical area) Livestock Common property resources (% to geographical area) Feed availability (t/livestock unit) Improved poultry (%) Improved cattle, sheep and pig (%) She buffalo to cow (ratio) Veterinary institutes (No./000 livestock units) AI centers (No./000 livestock units) Socio-economic All crop and livestock (Rs/ha of GCA) High value commodities (Rs/ha of GCA) High value commodities (Rs/capita (rural)) Credit (Rs./ha) Crop Agricultural allied activities
77 Table 5. Composition of the value of agricultural production by level of diversification; Andhra Pradesh, ( constant prices). HVCs based diversification zones Commodities High Medium Low Total (Zone 1) (Zone 2) (Zone 3) (All zones) (% to total value) Paddy C. Cereals Pulses Oilseeds Sugarcane Cotton Chilies Turmeric Tobacco Commercial crops Total crops Fruits Vegetables Milk Bovine meat Ovine meat Pig, poultry meat & eggs Meat & eggs Total livestock High value commodities Total value (million Rs.) : Commercial crops include oilseeds, sugarcane, cotton, chilies, turmeric and tobacco. 71
78 Table 6. Sources of change in value of production by level of diversification: Andhra Pradesh, ( constant prices) HVCs based diversification zones Commodities High Medium Low Total (Zone 1) (Zone 2) (Zone 3) (All zones) Paddy C. Cereals Pulses Oilseeds Sugarcane Cotton Chilies Turmeric Tobacco Commercial crops Total crops Fruits Vegetables Milk Bovine meat Ovine meat Pig, poultry meat & eggs Meat & eggs Total livestock High value commodities Total
79 Table 7. Area and production of major fruits and vegetables; Andhra Pradesh, Fruits / vegetables Fruits Area (000 ha) Production (000 tons) Share to all India (%) Area Production Mango Banana Grapes Mousambi Lemon Citrus fruits Cashewnuts Total Fruits Vegetables Onion Sweet Potato Brinjal Tapioca Tomato Total Vegetables Source: CMIE Agriculture
80 Table 8. Distribution of fruits across districts in Andhra Pradesh, District name Mango Cashew Banana Orange & bativa Papaya Grapes Total fresh fruits Area Prod Area Prod Area Prod Area Prod Area Prod Area Prod Area Prod % to state area and production Nizamabad Warangal Adilabad Guntur Karimnagar Anantapur Kurnool Medak West Godavari Nellore Khammam Krishna Nalgonda East Godavari Srikakulam Cuddapah Mahabubnagar Chittoor Visakhapatnam Hyderabad Andhra Pradesh Area 000 ha 2. Production 000 tons 74
81 Table 9. Distribution of vegetables across districts in Andhra Pradesh, Tomato Onion Brinjal Tapioca Sweet Potato Total vegetables District name Area Prod Area Prod Area Prod Area Prod Area Prod Area Prod % to state area and production Nizamabad Warangal Adilabad Guntur Karimnagar Anantapur Kurnool Medak West Godavari Nellore Khammam Krishna Nalgonda East Godavari Srikakulam Cuddapah Mahabubnagar Chittoor Visakhapatnam Hyderabad Andhra Pradesh Area 000 ha 2. Production 000 tons 75
82 Table 10. Growth in inland and marine fish production in Andhra Pradesh by district. Inland fish Marine District name Production (000 tons) ( ) Growth % ( ) Production (000 tons) ( ) Growth % ( ) Nizamabad Warangal Adilabad Guntur Karimnagar Anantapur Kurnool Medak West Godavari Nellore Khammam Krishna Nalgonda East Godavari Srikakulam Cuddapah Mahaboobnagar Chittoor Vishakapatanam Hyderabad Andhra Pradesh Not applicable 76
83 Table 11. Districtwise milk, meat and egg production, 2002, Andhra Pradesh. District Total (000 tons) Milk Buffalo (%) Total (000 tons) large ruminant (%) Meat small ruminant (%) pig & poultry (%) Eggs (lakh nos) Nizamabad Warangal Adilabad Guntur Karimnagar Ananthapur Kurnool Medak West Godavari Nellore Khammam Krishna Nalgonda East Godavari Srikakulam Cuddapah Mahabubnagar Chittoor Vishapatnam Hyderabad Andhra Pradesh Source: Directorate of Animal Husbandry, Govt. of Andhra Pradesh. 77
84 Table 12. Composition of the value of agricultural production by level of urbanization; Andhra Pradesh, ( constant prices). District groups Commodities Urban & Others surrounded (% to total value) Paddy C. Cereals Pulses Oilseeds Sugarcane Cotton Chilies Turmeric Tobacco Commercial crops Total crops Fruits Vegetables Milk Bovine meat Ovine meat Pig, poultry meat & eggs Meat and eggs Total livestock High value commodities Total value (million Rs.) : Commercial crops include oilseeds, sugarcane, cotton, chilies, turmeric and tobacco 78
85 Table 13. Composition of the value of agricultural production by level of income; Andhra Pradesh, ( constant prices). Income Distribution (Rs.) Commodities Low Medium High (0-9000) ( ) (>11000) Paddy C. Cereals Pulses Oilseeds Sugarcane Cotton Chilies Turmeric Tobacco Commercial crops Total crops Fruits Vegetables Milk Bovine meat Ovine meat Pig, poultry meat and eggs Meat & eggs Total livestock HVC Total Value (million Rs.) : Commercial crops include oilseeds, sugarcane, cotton, chilies, turmeric and tobacco. 79
86 Table 14. Correlation between HVC s and selected indicators: Andhra Pradesh 1. Variables HVC s Fruits Veget Milk Ruminant Pig,Pou Livest Com. ables meat & Eggs ock 2 Crops 3 Paddy % to total value of production Correlation coefficients Urban (%) Population density (No./sq. km of geog. area) Literacy (rural female %) Marginal farms (%) Farm Size (ha) Poverty (%) Human Development Index Income (Rs. per capita/annum) Wages (Field labor male, Rs. /day) Wages (Field labor female, Rs. /day) Crop credit (Rs./NCA) Allied activities (agrl.) credit (Rs./ha) Crop and allied activities credit (Rs./ha) Road density (Km/km 2 of geog. area) Market density (No/km 2 of geog. area) Irrigation (%) Tractors density (No./000 ha) Fertilizer consumption (Kg/ha) Area under HYV (%) Unirrigated land covered by watershed programs (%) Normal rainfall (mm.) Crossbred animals (%) Common property (%) Feed availability (t/lsu) Fruits and vegetables units (no.) F & V and cold storage units (no.) Livestock, f & v and cold storage units (no.) Paddy and flour mills (no.) N = 23. District level data for Andhra Pradesh 2. All livestock products 3: Commercial crops include oilseeds, sugarcane, cotton, chilies, turmeric and tobacco. LSU = Livestock Units 80
87 Table 15. Description and summary statistics of variables entered in the models. Variable Description Mean SD CV Abbreviation Explanatory variables PCI District per capita income at factor cost (Rs/annum in constant prices) WAGEF Wages (Field labor female, Rs/day) WAGEM Wages (Field labor male, Rs/day) FVCOLPR Fruits, vegetables processing industries and cold storage (No.) FVLSPR Fruits, vegetables, livestock processing industries and cold storage (No.) IRRI Irrigated area (% to GCA) NRAIN Normal rainfall (cm) CREDIT Credit to agriculture allied activities (Rs/ha) TERMLN Agriculture term loan (plant and horticulture sector)/ha ROADD Road density (Km/km 2 of geographical area) SMFARM Marginal and small farms (%) WSCOV Unirrigated land covered by watershed programs (%) URBAN Urban population (%) POVERTY No. of poor (%) Dependent variables HVC S Share of high value commodities to total value (%) Fruits Share of fruits to total value (%) Vegetables Share of vegetables to total value (%) CMILK Share of cattle milk to total value (%) BMILK Share of buffalo milk to total value (%) RMEAT Share of ruminant meat to total value (%) Pig, poultry meat and eggs Share of pig, poultry meat and eggs to total value (%) Livestock Share of total livestock products to total value (%)
88 Table 16. Factors determining diversification: All HVC s, model results, Estimated Variables t-ratio elasticities URBAN ** SMFARM *** WSCOV *** WAGEM POVERTY CONSTANT 0.90 R- Sq ***, ** and * refers to significant at 1, 5 and 10 percent probability levels respectively Table 17. Factors determining diversification: fruits and vegetables, model results, Fruits Vegetables Variables OLS SURE OLS SURE elasticity t-ratio elasticity t-ratio elasticity t-ratio elasticity t-ratio CONSTANT URBAN WAGEM TERMLN FVCOLPR POVERTY NRAIN IRRI No. of observations 20 82
89 Table 18. Factors determining diversification: milk, model results, Cattle Buffalo Variables OLS SURE OLS SURE elasticity t-ratio elasticity t-ratio elasticity t-ratio elasticity t-ratio CONSTANT URBAN ROAD WSCOV CREDIT POVERTY No. of observations 20 Table 19. Factors determining diversification: ruminant and poultry, pig meat and eggs model results, Ruminant Poultry, Pig meat & eggs Variables OLS SURE OLS SURE elasticity t-ratio elasticity t-ratio elasticity t-ratio elasticity t-ratio CONSTANT URBAN CPR POVERTY CREDIT NRAIN IRRI ROAD WAGEM IMPPOU No. of observations 20 83
90 Table 20. Comparison of yield of major fruits and vegetables in Andhra Pradesh and All India, Crops Andhra Pradesh All India Yield (t/ha) Fruits Mango Cashew nuts Banana Lemons Grapes All fruits Vegetables Tomato Onion Brinjal Tapioca Sweet Potato All vegetables Source: CMIE Agriculture
91 Table 21: Districtwise share of small, medium and large farmers in different commodities Crop group Kurnool Mahabubnagar Nalgonda Rangareddy small medium large small medium large small medium large small medium large Cotton Dryland cereals Fruits Flowers Fodder Maize and Wheat Oils and Spices Paddy Pulses Vegetables Total area (ha) crop not grown 85
92 Table 22: Fruits and vegetable cultivation by size group of land holding in AP Marginal Small Medium Large Total Share in rural households (%) Share in land possessed (%) Households growing vegetables (%) Households growing fruits (%) Distribution of vegetable growing households (%) Distribution of fruits growing households (%) Distribution of vegetable growing area (%) Distribution of fruit growing area (%) Source: Based on cultivation practices in India, NSS 1999, Report No: 451, NSS 54 round, January 98 to June
93 Table 23. Farmers' irrigation decisions and water productivity relationships, Medak district, Andhra Pradesh, Percentag Intensity Net Percentage Area Area Net water Actual e of total of water Returns of total Crops Cultivated irrigated productivity irrigatio area use (Rs.1000 water (ha) (ha) (Rs./hr) n (hrs) irrigated (hrs/ha) /ha) applied Cotton Flowers Chickpea Vegetables Turmeric Maize Wheat Paddy Sugarcane Total Estimates based on average cropping and irrigation decisions of sample farmers (n=120). Source: Shiferaw et al Irrigation investments and groundwater depletion in Indian semi-arid villages: the effect of alternative water pricing regimes, Working paper series no. 17, Socioeconomics and Policy, ICRISAT, Patancheru. 87
94 Table 24. Distribution of crop and allied activities credit from formal sources 1, Andhra Pradesh, Credit per cultivator Credit per ha District name Crop Allied activities Total primary sector 2 Crop Allied activities Nizamabad Warangal Adilabad Guntur Karimnagar Anantapur Kurnool Medak West Godavari Nellore Khammam Krishna Nalgonda East Godavari Srikakulam Cuddapah Mahabubnagar Chittoor Visakhapatnam Hyderabad Andhra Pradesh Nationalized banks, private banks, regional rural banks and co-operatives. 2. Total primary sector includes credit for agriculture, allied activities, non-farm sector and other priority sectors. 88
95 Table 25. Marketing charges in Andhra Pradesh markets, Trader Market charges Market Fee License fee Rs./unit Rs./annum Commission charges All commodities (except fish) 1% Fish 0.5 % Category A 125 B 75 C 50 D 25 Weighing 0.50 to 0.75 Unloading 0.50 to 0.75 Hamal 0.50 to 0.75 Cleaning 0.75 to 1.00 Loading 0.50 to 0.75 All crops (except F&V) 1 to 2% F & V 4% Source: Report of inter-ministerial task force on agricultural marketing reforms, May
96 Table 26. Price spread for selected vegetables in Rythubazar Andhra Pradesh, Vegetables Tomato Green chilies Mehdipatnam Cabbage Price received by producer (Rs/100 kg) Costs incurred by producer (Rs/100 kg) Net price received by producer. (Rs/100 kg) Erragadda Brinjal Potato Tomato Carrot Cabbage Bhendi Consumer price. (Rs/100 kg) Producers share in consumer price (%) Costs incurred by producer includes transport cost + other hidden costs. 90
97 Table 27. Post harvest losses of fruits and vegetables at various stages in Andhra Pradesh. Extent of post Sl.No: Stage harvest losses 1 Field level 10 2 Transport 5 3 Packing 2 4 Storage 9 5 Processing 4 Source:GOAP (2003) Total 30 Table 28. Post harvest losses of selected fruits and vegetables crops in All India. Serial No. Crop Extent of post harvest losses (%) 1 Banana Mango Citrus Guava Papaya Apple 14 7 Grapes Tomato Onion 25 Source : National Horticultural Board 91
98 Table 29. Infrastructural facilities required for horticultural crops. S.no Infrastructure Purpose Location facilities 1. Collection centers To collect the produce from farms Near farms 2. Small pre-cooling units&evaporation chambers Required before keeping the produce in cold storage to bring down the temperature of the produce. Production center 3. Medium/small cold storages These can be used as transit godowns. In small towns. 4. Ripening chambers To ripen the produce Near markets 5. Specialized cold storage With built in pre cooling, high humidity and controlled/modified atmosphere, required for long term of the produce 6. Integrated pack house Here the farm produce will be given treatments like washing, sorting, grading, waxing and packaging Source: Report of the working group on horticulture development. Cities Regions where fruits and vegetables account an area of 5000 to ha 92
99 Table 30. Number of cold storage units and capacity in Andhra Pradesh. S.no District Number of Cold Storage units Capacity (Tonnes) 1 Ananthapur 8 22,382 2 Chittoor 11 16,430 3 Cuddapah East Godavari 15 17,875 5 Guntur ,697 6 Hyderabad 30 57,828 7 Khammam 8 26,347 8 Krishna 13 17,264 9 Kurnool 4 8, Mahabubnagar 1 2, Medak Nalgonda 1 2, Nellore 10 22, Nizamabad 3 8, Prakasham 2 1, Rangareddy 12 37, Srikakulam 1 4, Visakhapatnam 32 35, Vizianagaram 6 30, Warangal 5 18, West Godavari 11 29,899 Total ,307 Source: 93
100 Table 31. Contract farming projects in Andhra Pradesh. Company Crop Area (ha) District Covered Sical, Godrej, Palmtech Mark fed. Oil palm East & West Godavari Cadburys India Ltd Cocoa 8500 East & West Godavari BHC Agro Vegetables 417 Chittoor Global Green, Capricorn Foods Ltd., Dabur India Gherkins 3333 AEZ-Gherkins Districts Amla (Indian Gooseberry) 417 Across State Venkateshwara Hatcheries Broiler birds farms Around Hyderabad Source. A.P Horticulture Department. Table 32. Common grades for gherkins in Andhra Pradesh. Size of the Fruit (mm) Grade termed as No of fruits per Kilogram more than more than to 48 stacker less than 10 Source: Global green 94
101 Table 33. Share of food products in output, employment and net value added in total manufacturing sector in Andhra Pradesh. Year Output Employment Net value added Source: Chakravarty,
102 Table 34. Growth rate of food processing enterprises in Andhra Pradesh. Net Raw NIC Number of value material 87 Item Enterprises added intensity code (lakh Rs) (%) to Growth rate to Manufacture of dairy products * 202 Canning and preservation of * 0.58 fruits 203 Processing, canning and preserving of fish, crustaceans and similar foods 204 Grain milling * 1.43* 205 Manufacture of bakery products * 206 Manufacturing and refining of sugar 207 Production of indigenous sugar, * boora, khandasari, gur etc from sugarcane, palm juice etc. 209 Manufacture of cocoa products * 1.59 and sugar confectionery (including sweets) 210+ Manufacture of hydrogenated vegetable oils and vanaspati ghee etc 211 Manufacture of vegetable oils * 2.25* and fats (other than hydrogenated) 215 Processing of edible nuts * 5.1* 216+ Manufacture of ice Manufacture of prepared animal and bird feed 218 Manufacture of starch Manufacture of food products 1681 not elsewhere classified All food products Source: Mahendra Dev and Chandrashekar Rao,
103 Table 35. Agri-Export Zones (AEZ) in Andhra Pradesh. S.no Name of AEZ Districts covered Fruits / Products Total estimated cost (crore Rs.) 1 AEZ Vijayawada Krishna Mangoes 18 2 AEZ Hyderabad Ranga Reddy, Mahabubnagar and Medak 3 AEZ Gherkins Ranga Reddy, Mahabubnagar, Medak, Karimnagar, Warangal, Nalgonda and Ananthapur. Grapes and Mangoes Gherkins 4 AEZ Chittoor Chittoor Mango pulp and vegetables 5 AEZ Chilies Guntur Chilies Source: A.P Horticulture Department
104 Figure 1: Relative shares of selected sectors to GDP : Andhra Pradesh. Figure 2. Annual compound growth rates of agriculture sub sectors and total GDP, Andhra Pradesh (at constant prices). 98
105 Figure 3: Share of agriculture sub-sectors to agriculture GDP, Andhra Pradesh ( constant prices 99

106 Figure 4: Share of high value commodities : Andhra Pradesh to All India. 100

107 Figure 5. Major fruit and vegetable crops in Andhra Pradesh, TE
108 Figure 6: Trend in fish production, Andhra Pradesh Quantity Value 102
109 Figure 7: Production of fish and shrimp from marine and inland sources, Andhra Pradesh Quantity Value 103


110 Figure 8: Cost of production and yields of selected crops in major growing states. Paddy : Sorghum : Sorghum :

111 Figure 8 contd. Maize : Greengram : Blackgram :
112 Figure 8 contd. Groundnut : Sugarcane (yield in cane) : Cotton (yield in kapas) :
113 Figure 9: Returns to cost of production for selected crops in Andhra Pradesh. 107
114 Figure 9 contd., 108


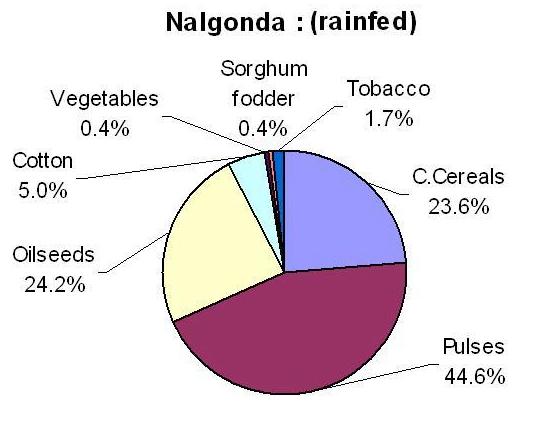
115 Figure 10: Cropping pattern of sample households in selected districts of AP,


116 Figure 10 contd.., 110


117 Figure 11: Net returns for selected crops in sample households, AP:
118 Figure 11 contd.., Figure 12: Labor use (days / ha) for selected crops: average of sample households,
119 Figure 13. Distribution of priority sector credit by sub-sectors, Andhra Pradesh,


120 Figure 14. Major sources of credit for crop and allied activities, Andhra Pradesh, Figure 15. Distribution of credit by diversification zones, Andhra Pradesh,

121 Figure 16. Price spread of fruits and vegetables in wholesale markets 115

122 116


123 117

124 118
Does Urbanisation Influence Agricultural Activities? A Case Study of Andhra Pradesh
 Ind. Jn. of Agri.Econ. Vol.64, No.3, July-Sept. 2009 SUBJECT II URBANISATION AND ITS IMPACT ON FARM SECTOR Does Urbanisation Influence Agricultural Activities? A Case Study of Andhra Pradesh P. Parthasarathy
MTID DISCUSSION PAPER NO. 77 AGRICULTURAL DIVERSIFICATION IN INDIA AND ROLE OF URBANIZATION
 MTID DISCUSSION PAPER NO. 77 AGRICULTURAL DIVERSIFICATION IN INDIA AND ROLE OF URBANIZATION P. Parthasarathy Rao, P.S. Birthal, P.K. Joshi and D. Kar Markets, Trade and Institutions Division International
Progress and Potential of Horticulture in India
 Ind. Jn. of Agri.Econ. Vol.63, No.3, July-Sept. 2008 SUBJECT I TRIGGERING AGRICULTURAL DEVELOPMENT THROUGH HORTICULTURE CROPS Progress and Potential of Horticulture in India Ramesh Chand, S.S. Raju and
Identifying Investment Priorities for Malawian Agriculture
 Identifying Investment Priorities for Malawian Agriculture Rui Benfica (IFAD) and James Thurlow (IFPRI) Presentation to the Ministry of Agriculture, Irrigation and Water Development Lilongwe, 8 February
SUSTAINABLE AGRICULTURE DEVELOPMENT IN INDIA: A CASE STUDY OF UTTAR PRADESH ABSTRACT
 SUSTAINABLE AGRICULTURE DEVELOPMENT IN INDIA: A CASE STUDY OF UTTAR PRADESH ABSTRACT Agriculture is a critical sector of the Indian economy. It forms the backbone of development in the country. An average
Feasibility Check for Diversification towards Horticultural Production*
 Agricultural Economics Research Review Vol. 22 January-June 2009 pp 81-86 Feasibility Check for Diversification towards Horticultural Production* Surabhi Mittal Indian Council for Research on International
DEMAND FOR FRUITS AND VEGETABLES IN INDIA
 Agric. Econ. Res. Rev., Vol. 8(2), pp. 7-17 (1995) DEMAND FOR FRUITS AND VEGETABLES IN INDIA Praduman Kumar and Mruthyunjaya Division of Agricultural Economics, IARI, New Delhi India is a vast country,
Evaluating Policies and Public Investments to Transform Tanzania s Agriculture-Food System
 Evaluating Policies and Public Investments to Transform Tanzania s Agriculture-Food System James Thurlow, Senior Research Fellow, International Food Policy Research Institute Coauthors: Todd Benson and
AGRICULTURE IN BANGLADESH A NOTE ON FOOD SECURITY BY ENHANCING PRODUCTIVITY
 AGRICULTURE IN BANGLADESH A NOTE ON FOOD SECURITY BY ENHANCING PRODUCTIVITY Summary Awami League s Election Manifesto 2008 appropriately recognizes the importance of ensuring food security for all in Bangladesh.
Government of India Ministry of Agriculture Department of Agriculture and Cooperation Directorate of Economics and Statistics
 Agricultural Statistics at a Glance 2014 Government of India Ministry of Agriculture Department of Agriculture and Cooperation Directorate of Economics and Statistics QX F O RD UNIVERSITY PRESS Contents
22: List of Studies Conducted by Agro-Economic Research Centres
 22: List of Studies Conducted by Agro-Economic Research Centres 2006-07 1 India s Global Tea Trade Reducing Share, Declining Competitiveness. 2 Developing India s Strategic Responses to the Global Debate
Supply chain coordination, contract farming and small farmers in Asia
 Supply chain coordination, contract farming and small farmers in Asia INTERNATIONAL FOOD POLICY RESEARCH INSTITUTE Workshop on Contract farming: Methods and Experiences ICAR, New Delhi, May 5-6 2007 Questions
Cost of Cultivation and Yield Rates of Paddy Crop in Agriculture: A Comparative Study between Irrigated and Un-Irrigated Areas of Telangana State
 Asian Journal of Agriculture & Life Sciences Vol. 1(2), April 2016: 48-53 Website: www.crsdindia.com/aajals.html e-issn: 2455-6149 ORIGINAL ARTICLE and Yield Rates of Paddy Crop in Agriculture: A Comparative
Do small-scale producers gain from supply chain coordination? The case of high-value agriculture in Asia
 Do small-scale producers gain from supply chain coordination? The case of high-value agriculture in Asia Presented by Nicholas Minot, Workshop on Linking Small-Scale Producers to Markets: Old and New Challenges
Demand vs Supply of Food in India - Futuristic Projection
 Published Online on 22 December 2016 Proc Indian Natn Sci Acad 82 No. 5 December 2016 pp. 1579-1586 Printed in India. DOI: 10.16943/ptinsa /2016/48889 Demand vs Supply of Food in India - Futuristic Projection
Session - II. Livelihood Linkages of Trade in Agricultural Products. A Presentation By
 Session - II Livelihood Linkages of Trade in Agricultural Products A Presentation By Rahul Arora, Policy Analyst CUTS International, Jaipur India Email: rha@cuts.org 1 Importance of Agriculture Trade and
Agriculture in China - Successes, Challenges, and Prospects. Prof. Zhihao Zheng College of Economics & Management China Agricultural University
 Agriculture in China - Successes, Challenges, and Prospects Prof. Zhihao Zheng College of Economics & Management China Agricultural University I. Success 1. For the past three decades (1978-2010), China
Minimum Core Data Set
 Global Strategy IMPROVING AGRICULTURAL AND RURAL STATISTICS IN ASIA PACIFIC Minimum Core Data Set Regional Office for the Asia-Pacific Regional Action Plan to Improve Agricultural and Rural Statistics
Sustainable Agricultural Mechanization in India Strategy and Long-term Policies
 Sustainable Agricultural Mechanization in India Strategy and Long-term Policies Dr. Kanchan K. Singh A.D.G. (Engg.) Indian Council of Agricultural Research New Delhi, INDIA 5 th Regional Forum on Sustainable
DEPARTMENT OF ECONOMICS
 DEPARTMENT OF ECONOMICS AGRICULTURE IN MAHARASHTRA: EMERGING ISSUES AND CHALLENGES BY R.G. Dandge Arun Pawar WORKING PAPER UDE 11/7/2003 OCTOBER 2003 DEPARTMENT OF ECONOMICS UNIVERSITY OF MUMBAI Vidyanagari,
Regional Pattern of Agricultural Growth and Rural Employment in India: Have Small Farmers Benefitted?
 Agricultural Economics Research Review Vol. 26 (Conference Number) 2013 pp 1-11 Regional Pattern of Agricultural Growth and Rural Employment in India: Have Small Farmers Benefitted? M.L. Nithyashree* and
Indian Pulses Market.
 Indian Pulses Market Indian Pulses Market India is the largest producer, importer and consumer of pulses, accounting for 25% of global production from 35% of global area under pulses. However, the productivity
SECTOR ASSESSMENT (SUMMARY): AGRICULTURE, NATURAL RESOURCES, AND RURAL DEVELOPMENT 1
: AGRICULTURE, NATURAL RESOURCES, AND RURAL DEVELOPMENT 1") Country Partnership Strategy: Timor-Leste, 2016 2020 SECTOR ASSESSMENT (SUMMARY): AGRICULTURE, NATURAL RESOURCES, AND RURAL DEVELOPMENT 1 A. Sector Performance, Problems, and Opportunities 1. Agriculture
Country Partnership Strategy: Timor-Leste, 2016 2020 SECTOR ASSESSMENT (SUMMARY): AGRICULTURE, NATURAL RESOURCES, AND RURAL DEVELOPMENT 1 A. Sector Performance, Problems, and Opportunities 1. Agriculture
PERFORMANCE OF AGRICULTURAL EXPORT FROM INDIA
 Indo-Am. J. Agric. & Vet. Sci., 2014 ISSN 2321 9602 D www.iajavs.com P Singh, 2014 Vol. 2, No. 1, March 2014 2014 Meghana Publications. All Rights Reserved Research Paper PERFORMANCE OF AGRICULTURAL EXPORT
Growth in area, production and productivity of major crops in Karnataka*
 Karnataka J. Agric. Sci.,25 (4) : (431-436) 2012 Introduction Growth in area, production and productivity of major crops in Karnataka* SARASWATI POUDEL ACHARYA, H. BASAVARAJA, L. B. KUNNAL, S. B. MAHAJANASHETTI
Assessing Poverty in Kenya
 Findings reports on ongoing operational, economic and sector work carried out by the World Bank and its member governments in the Africa Region. It is published periodically by the Africa Technical Department
MML Lecture. Globalization and Smallholder Farmers
 24th Annual Ralph Melville Memorial Lecture delivered at the Annual General Meeting held at the Royal Over-Seas League on 13th December 2006. Globalization and Smallholder Farmers MML Lecture Dr M. Joachim
Global Strategy. Session 1.2: Minimum Set of Core Data Items. Module 1: Sampling in the Context of the Global Minimum Set of Core Data Items
 Global Strategy IMPROVING AGRICULTURAL AND RURAL STATISTICS IN ASIA PACIFIC Module 1: Sampling in the Context of the Global Minimum Set of Core Data Items Session 1.2: Minimum Set of Core Data Items 13
MACRO ECONOMIC AGGREGATES
 MACRO ECONOMIC AGGREGATES 2 Chapter Gross State Domestic Product Gross State Domestic Product (GSDP) is the most popular method of measuring output of the State's economy and is therefore considered a
INDIAN STATE-LEVEL SORGHUM PRODUCTIVITY MEASURES
 INDIAN STATE-LEVEL SORGHUM PRODUCTIVITY MEASURES BY DAYAKAR BENHUR AND SALEEM SHAIK CORRESPONDING AUTHOR: SALEEM SHAIK 310 Lloyd-Ricks, West Wing Dept of Agricultural Economics MSU, Mississippi State,
Impact of WTO Accession on China's Agriculture, Rural Development and on Farmers
 Impact of WTO Accession on China's Agriculture, Rural Development and on Farmers Li Xiande Professor Institute of Agricultural Economics, Chinese Academy of Agricultural Sciences May 16, 2006, World Bank
From Aspiration to Transformation: Myanmar Agriculture and the Rural Economy
 From Aspiration to Transformation: Myanmar Agriculture and the Rural Economy Duncan Boughton and Ben Belton Michigan State University Yangon, June 1, 2018 Outline MOALI s Agricultural Development Strategy
Dynamics of Labour Demand and its Determinants in Punjab Agriculture
 Agricultural Economics Research Review Vol. 26 (No.2) July-December 2013 pp 267-273 Dynamics of Labour Demand and its Determinants in Punjab Agriculture Y. Latika Devi, Jasdev Singh*, Kamal Vatta and Sanjay
SECTOR ASSESSMENT (SUMMARY): AGRICULTURE, NATURAL RESOURCES, AND RURAL DEVELOPMENT 1
: AGRICULTURE, NATURAL RESOURCES, AND RURAL DEVELOPMENT 1") Horticulture Value Chain Development (RRP UZB 47305) SECTOR ASSESSMENT (SUMMARY): AGRICULTURE, NATURAL RESOURCES, AND RURAL DEVELOPMENT 1 A. Sector Performance, Problems, and Opportunities 1. During 2010
Horticulture Value Chain Development (RRP UZB 47305) SECTOR ASSESSMENT (SUMMARY): AGRICULTURE, NATURAL RESOURCES, AND RURAL DEVELOPMENT 1 A. Sector Performance, Problems, and Opportunities 1. During 2010
Inter-Linkages Among Agricultural Research Investment, Agricultural Productivity and Rural Poverty in India
 Inter-Linkages Among Agricultural Research Investment, Agricultural Productivity and Rural Poverty in India Kiresur V.R and Melinamani V.P. Paper prepared for presentation at the 12 th EAAE Congress People,
AGRICULTURAL DIVERSIFICATION IN INDIA
 Hrideshwer Gupta* AGRICULTURAL DIVERSIFICATION IN INDIA Abstract: Agriculture has always been the backbone of the Indian Economy and despite concerted industrialization in the last six decades; agriculture
The Central Role of Agriculture in Myanmar s Economic Development
 The Central Role of Agriculture in Myanmar s Economic Development Duncan Boughton, Professor, International Development, MSU Ben Belton, Assistant Professor, International Development, MSU Steven Radelet,
Prepared by the office of the Minister Counsellor for Food and Agriculture, Embassy of Denmark in New Delhi, India
 SECTOR ANALYSIS India: Food, Agriculture and Agro Business Date January 2014 Our ref. AKA Prepared by the office of the Minister Counsellor for Food and Agriculture, Embassy of Denmark in New Delhi, India
Overview of Global Strategy Minimum Core Data Set requirements
 Global Strategy IMPROVING AGRICULTURAL AND RURAL STATISTICS IN ASIA PACIFIC Overview of Global Strategy Minimum Core Data Set requirements Allan Nicholls, Regional Coordinator Workshop on Statistical Capacity
Agricultural Growth in India: Examining the Post-Green Revolution Transition
 Agricultural Growth in India: Examining the Post-Green Revolution Transition Research Conducted by Nicholas Rada, Economic Research Service, USDA and Presented by Keith Fuglie, Economic Research Service,
IMPACTS OF NATIONAL AGROFOOD POLICY TOWARDS AGRICULTURE SECTOR IN MALAYSIA
 IMPACTS OF NATIONAL AGROFOOD POLICY TOWARDS AGRICULTURE SECTOR IN MALAYSIA Rozhan Abu Dardak Director General Office, MARDI Head Quarters, Persiaran MARDI-UPM 43400 Serdang. E-mail: rozhan@mardi.gov.my
Minimum Core Data Set
 Minimum Core Data Set Dalip Singh Statistician Regional Office for the Asia-Pacific Regional Action Plan to Improve Agricultural and Rural Statistics 1 Background The Global Strategy describes three pillars
China s Role in the Future Food Security Situation of Asia: A Threat or An Ally
 China s Role in the Future Food Security Situation of Asia: A Threat or An Ally Jikun Huang Center for Chinese Agricultural Policy Chinese Academy of Sciences Presented at International Conference on Asian
The most recent publication of MAP (in June)
") Composition of agricultural trade of major WTO players 2 July 26 MAP - Brief Monitoring Agri-trade Policy European Commission Directorate-General for Agriculture and Rural Development The most recent publication
Composition of agricultural trade of major WTO players 2 July 26 MAP - Brief Monitoring Agri-trade Policy European Commission Directorate-General for Agriculture and Rural Development The most recent publication
REGIONAL CONVERGENCE IN AGRICULTURE GROWTH IN INDIA: A STATE LEVEL ANALYSIS
 REGIONAL CONVERGENCE IN AGRICULTURE GROWTH IN INDIA: A STATE LEVEL ANALYSIS Anju Rani Research Scholar, Dept. of economics, Central University of Haryana Dr. Ranjan Aneja Head, Assistant Professor, Dept.
CHAPTER- I INTRODUCTION AND RESEARCH METHODOLOGY
 CHAPTER- I INTRODUCTION AND RESEARCH METHODOLOGY 1.1 INTRODUCTION: Food processing industry comprises a large spectrum of industrial units producing foods and vegetables based products, marine products,
Trading in Livestock and Livestock Products
 Ind. Jn. of Agri. Econ. Vol. 63, No. 1, Jan.-March 2008 Subject II SUMMARIES OF GROUP DISCUSSION Trading in Livestock and Livestock Products Rapporteurs: P.S. Birthal, Anjani Kumar and T.N. Datta* Market
FAMILY FARMING AND VALUE CHAIN DEVELOPMENT IN SIERRA LEONE AN OPPORTUNITY TO LINK FAMILY FARMERS TO MARKETS
 FAMILY FARMING AND VALUE CHAIN DEVELOPMENT IN SIERRA LEONE AN OPPORTUNITY TO LINK FAMILY FARMERS TO MARKETS Agricultural value chains are organizational schemes that enable a primary product to get sold
The Essential Role of Agriculture in Myanmar s Economic Transition
 The Essential Role of Agriculture in Myanmar s Economic Transition Duncan Boughton, Aung Hein and Ben Belton Ministry of National Planning and Economic Development Nay Pyi Taw, January 20, 2016 Why is
Deciding Minimum Set of Core Data at national and global level
 Global Strategy IMPROVING AGRICULTURAL AND RURAL STATISTICS IN ASIA PACIFIC Item 5 Deciding Minimum Set of Core Data at national and global level Allan Nicholls, Regional Coordinator Orientation Programme
Agrarian Stagnation in Eastern Gangetic Plains. Avinash Kishore IFPRI, New Delhi
 Agrarian Stagnation in Eastern Gangetic Plains Avinash Kishore IFPRI, New Delhi Agriculture is stagnant across India 17500 AgGDP of India (2011-12 billion rupees) 17000 16500 CAGR = 2.32% 16000 15500 15000
B. Articles. Identification of Predominant Farming Systems and their Economics in Telangana Region of Andhra Pradesh
 B. Articles Identification of Predominant Farming Systems and their Economics in Telangana Region of Andhra Pradesh V. RAJENDRA PRASAD, M. MALLA REDDY AND M. V. RAMANA* Introduction Telangana is one of
2. Recommendation for Effective Agro Marketing Strategies
 Recommendations207 1. General Recommendations 10. RECOMMENDATIONS Agriculture should be treated as a priority sector Small and marginal farmers should be recognized as a special group Direct income support
Agriculture: Engine of Rural Economic Growth in Myanmar. Duncan Boughton, Aung Hein and Ben Belton Yangon, December 8, 2015
 Agriculture: Engine of Rural Economic Growth in Myanmar Duncan Boughton, Aung Hein and Ben Belton Yangon, December 8, 2015 Why focus on rural economic growth? Agriculture makes many contributions to the
Food Grain Stocking Pattern in India & the Information Gap
 International Seminar on Approaches and Methodologies for Private Food Grain Stock Measurement New Delhi, 9-11 November 2016 Food Grain Stocking Pattern in India & the Information Gap Technical Session
CONCLUSION, MAJOR FINDINGS AND POLICY SUGGESTIONS
 CHAPTER-7 CONCLUSION, MAJOR FINDINGS AND POLICY SUGGESTIONS 7.1. INTRODUCTION: Indian agriculture has, since Independence, made rapid strides in taking the annual food grains production from 51 million
Rural Economy: Driver of Growth and Poverty Alleviation. Review of Cross-country Experiences. By Rashid Faruqee Senior Policy Advisor MINFAL
 Rural Economy: Driver of Growth and Poverty Alleviation Review of Cross-country Experiences By Rashid Faruqee Senior Policy Advisor MINFAL 1 Plan of Presentation 1. Key Definitions Sources of Growth Driver
Vulnerability and Adaptation to Drought: Economic Impact Scenarios*
 Vulnerability and Adaptation to Drought: Economic Impact Scenarios* Satya Priya, PhD Senior Water Resources Mgt. Specialist Water GP, SAR April 26, 2017 For Drought Mitigation and Preparedness Workshop,
Labour Demand and Labour-saving Options: A Case of Groundnut Crop in India
 Agricultural Economics Research Review Vol. 24 (Conference Number) 2011 pp 423-428 Labour Demand and Labour-saving Options: A Case of Groundnut Crop in India G. Govindaraj* and A.P. Mishra Directorate
Ensuring Remunerative Prices to Farmers Challenges and the Way Forward
 Ensuring Remunerative Prices to Farmers Challenges and the Way Forward Surabhi Mittal, P K Joshi, Avinash Kishore and Suresh Pal * Background Doubling farmers income by 2022 is a paradigm shift in transforming
Agribusiness Status in India..Issues and Way Forward
 Agribusiness Status in India..Issues and Way Forward By Sanjeev Asthana Sanjeev Asthana Reliance Agribusiness 1 Flow of Presentation Indian Agriculture Snapshot & Challenges Development Needs Suggestions
Focus - Oilseeds & Pulses. Sanjeev Asthana
 India Growth & Demand, Agriculture Focus - Oilseeds & Pulses Sanjeev Asthana Presentation Flow India Demand Side Equation Economy and Growth Momentum India Food & Agriculture Production Challenges Oilseeds
CHAPTER V DEMAND VERSUS SUPPLY OF FOOD GRAINS IN INDIA: FUTURE SCENARIO
 139 CHAPTER V DEMAND VERSUS SUPPLY OF FOOD GRAINS IN INDIA: FUTURE SCENARIO To project the future food security scenario of India is the objective of this chapter for which future demand and supply of
Success Rates. Successful Projects in the Agriculture and Natural Resources Sector Operations Evaluation Department
 Success Rates Projects in the Agriculture and Natural Resources Sector 2002 2004 Operations Evaluation Department Second Agriculture Program Nepal s agriculture sector growth had been constrained by various
Mudasir Hassan Bhat* & Prof. Md Abdus Salam**
 Diversification as a Strategy for Sustainable Agriculture Development in India: Issues and Concerns Mudasir Hassan Bhat* & Prof. Md Abdus Salam** Abstract: Agriculture development policies in India have
Prospects and challenges of agricultural trade between China and Latin America: analysis of problems and opportunities from the Chinese perspective
 Prospects and challenges of agricultural trade between China and Latin America: analysis of problems and opportunities from the Chinese perspective Li Xiande Institute of Agricultural Economics and Development,
Centre for Economic Policy Research. Working Paper on Role of food processing industry in Indian economy
 Centre for Economic Policy Research Working Paper on Role of food processing industry in Indian economy Food Processing industry has emerged as a vital part of Indian economy both in generating GDP and
TROPICAL ROOT CROPS AND SOCIO-ECONOMIC IMPROVEMENTS IN THE DEVELOPING WORLD
 TROPICAL ROOT CROPS AND SOCIO-ECONOMIC IMPROVEMENTS IN THE DEVELOPING WORLD S. Chandra Abstract Tropical root crops play a significant role in the world's food supply. These crops are produced and consumed
Factors Influencing Economic Viability of Marginal and Small Farmers in Punjab 1
 Agricultural Economics Research Review Vol. 22 July-December 2009 pp 269-279 Factors Influencing Economic Viability of Marginal and Small Farmers in Punjab 1 Mandeep Singh*, A.S. Bhullar and A.S. Joshi
Kharif Sorghum in Karnataka: An Economic Analysis
 Agricultural Economics Research Review Vol. 18 July-December 2005 pp 223-240 Kharif Sorghum in Karnataka: An Economic Analysis H. Basavaraja 1, A.Y. Hugar 2, S.B. Mahajanshetti 3, V.V. Angadi 4 and B.
Agriculture Update 12 TECHSEAR RAVI SHREY, S.H. KAMBLE, CHANDRESH DHURWEY AND GOPAL KRISHNA ACHARYA OBJECTIVES
 A U Volume DOI: 10.15740/HAS/AU/1TECHSEAR(6)2017/1682-1687 Agriculture Update 12 TECHSEAR-6 2017 1682-1687 Visit us : www.researchjournal.co.in RESEARCH ARTICLE : Identification of cropping pattern and
It is challenged massively by the high prevalence of malnourished children and high incidence of rural poverty. The pressure on agriculture to
 Credit SEMINAR DETERMINANTS OF AGRICULTURAL GROWTH AND THEIR MEASUREMENT INTRODUCTION The Indian economy has changed structurally over time with the anticipated decline in agriculture s share in the gross
Achieving self sufficiency in pulse production in India
 Achieving self sufficiency in pulse production in India Towards self sufficiency in pulse production On average, over the last three years Indian s consumed approximately 22 million tonnes of pulses per
Strategic Review FEED THE FUTURE August 6, 2010
 Strategic Review FEED THE FUTURE August 6, 2010 This presentation represents the preliminary strategic direction of a multi-year, whole-of-government, U.S. strategy to address food security in a Feed the
Livestock sector development and implications for rural poverty alleviation in India
 Livestock Research for Rural Development 19 (2) 2007 Guidelines to authors LRRD News Citation of this paper Livestock sector development and implications for rural poverty alleviation in India Jabir Ali
MAIN REPORT of SOCIO ECONOMIC BASELINE SURVEY (SEBS) AND PARTICIPATORY RURAL APPRAISAL (PRA)
 AND PARTICIPATORY RURAL APPRAISAL (PRA)") FOOD AND AGRICULTURE ORGANIZATION OF THE UNITED NATIONS - ROME Special Programme for Food Security (SPFS Project GCSP/INS/073/JPN) MAIN REPORT of SOCIO ECONOMIC BASELINE SURVEY (SEBS) AND PARTICIPATORY
FOOD AND AGRICULTURE ORGANIZATION OF THE UNITED NATIONS - ROME Special Programme for Food Security (SPFS Project GCSP/INS/073/JPN) MAIN REPORT of SOCIO ECONOMIC BASELINE SURVEY (SEBS) AND PARTICIPATORY
Status and prospects of millet utilization in India and global scenario
 Status and prospects of millet utilization in India and global scenario P. Parthasarathy Rao and G. Basavaraj Presented at Global consultation on millets promotion for health and nutritional security Directorate
has taken place in western and south-western states, whereas crop specialization has occurred
 Trans. Inst. Indian Geographers Joydeep Saha, New Delhi agricultural economy in terms of income, employment and security. Obtaining required secondary data on area under crops, this paper attempts to explore
Indian Horticulture Market Overview
 Indian Horticulture Market Overview Indian Horticulture Market Overview Horticulture crops have a significant third and fourth place with around 7.7% and 7.2%, contribution in the gross domestic respectively,
LANGUAGE IN INDIA Strength for Today and Bright Hope for Tomorrow Volume 12 : 5 May 2012 ISSN
 LANGUAGE IN INDIA Strength for Today and Bright Hope for Tomorrow Volume ISSN 1930-2940 Managing Editor: M. S. Thirumalai, Ph.D. Editors: B. Mallikarjun, Ph.D. Sam Mohanlal, Ph.D. B. A. Sharada, Ph.D.
Economic Review. South African Agriculture. of the DEPARTMENT OF AGRICULTURE, FORESTRY AND FISHERIES
 Economic Review of the South African Agriculture 2018 DEPARTMENT OF AGRICULTURE, FORESTRY AND FISHERIES Compiled by the Directorate: Statistics and Economic Analysis, Private Bag X246, PRETORIA 0001 Published
Socioeconomic Constraints to Legumes Production in Rice-Wheat Cropping Systems of India
 Socioeconomic Constraints to Legumes Production in Rice-Wheat Cropping Systems of India Why only rice? Legumes are also profitable! Where can we grow legumes? T he major problem of the rice-wheat system
ROLE OF IT IN AGRICULTURE A SURVEY
 ROLE OF IT IN AGRICULTURE A SURVEY Dr. K.B.S. SASTRI Dept. Of Computer Science, Andhra Loyola College, Vijayawada-8 ABSTRACT Today information technology (IT) has long vision to estimates the calibre to
Chapter VII: Economics of sweet sorghum feedstock production for bioethanol
 Chapter VII: Economics of sweet sorghum feedstock production for bioethanol A Ashok Kumar and Belum VS Reddy I. Introduction Sweet sorghum is similar to grain sorghum but possesses sugar-rich stalks, with
Smallholder or family farming in transforming economies of Asia & Latin America: Challenges and opportunities
 Smallholder or family farming in transforming economies of Asia & Latin America: Challenges and opportunities Ganesh Thapa Regional Economist, Asia and the Pacific Division, International Fund for Agricultural
3.5 Total factor productivity growth and agricultural production growth
 Figure 24: Output per worker Source: FAOSTAT 3.5 Total factor productivity growth and agricultural production growth If land and labour productivity growth occurred in both subregions (particularly in
7. ( ) Traditional Chinese agriculture was characterized by high land intensity high labor intensity high capital intensity a high export ratio
 Traditional Chinese agriculture was characterized by high land intensity high labor intensity high capital intensity a high export ratio") Modern China Economics Midterm Examination 2012/4/20 I. Multiple Choice Questions. Choose the most appropriate answer to each question. All questions refer to China unless mentioned otherwise. Answer all
Modern China Economics Midterm Examination 2012/4/20 I. Multiple Choice Questions. Choose the most appropriate answer to each question. All questions refer to China unless mentioned otherwise. Answer all
Competitiveness of American Agriculture in the Global Economy. Ian Sheldon. AED Economics
 Competitiveness of American Agriculture in the Global Economy Ian Sheldon AED Economics What is globalization? Increasing world economic integration Trade, direct investment, financial flows, and migration
Cost of cultivation and returns on different cost concepts basis of onion in Rajasthan
 Cost of cultivation and returns on different cost concepts basis of onion in Rajasthan Susheela Meena 1, I.P.Singh 2 and Ramji Lal Meena 3 1 Department of Agricultural Economics, SKRAU, Bikaner-334 006,
Trends and Developments in Sri Lanka s Livestock Industry
 Trends and Developments in Sri Lanka s Livestock Industry Vanitha Prasannath Eastern University, Vantharumoolai, Chenkalady, Sri Lanka vanithap@esn.ac.lk Abstract Agricultural sector contributes to Sri
Horticulture Supply Chains in India: A Private Sector Perspective
 Horticulture Supply Chains in India: A Private Sector Perspective S Sivakumar, ITC Limited SASKI & SASSD BBL Seminar @ World Bank Washington, 26 th March 2007 Composition of Diet is diversifying across
ECONOMICS SOLUTION BOOK 1ST PUC. Unit 2
 Unit 2 I. Choose the correct answer (Each question carries one mark) 1. Which is not the goal of five-year plans a) Growth b) Modernization c) Self-efficiency d) Self-reliance 2. First phase of Green Revolution
Performance of Agriculture sector in India with Special Reference to Food grains
 IOSR Journal Of Humanities And Social Science (IOSR-JHSS) Volume 19, Issue 9, Ver. V (Sep. 2014), PP 18-28 e-issn: 2279-0837, p-issn: 2279-0845. Performance of Agriculture sector in India with Special
Impact Assessment of Agricultural Extension Reforms in Bihar. K.M. Singh 1, M.S. Meena 2 and A.K. Jha 3 ABSTRACT
 110 Indian Res. J Ext. Edu. 9 (2 ), May 2009 Impact Assessment of Agricultural Extension Reforms in Bihar K.M. Singh 1, M.S. Meena 2 and A.K. Jha 3 1. Head, 2. Sr.Scientist (Agril. Ext.), Division of Socio
Economic Change in Lao Agriculture: The Impact of Policy Reform
 Page 1 of 5 Economic Change in Lao Agriculture: The Impact of Policy Reform Peter G. Warr 1 Abstract Since implementation of economic reforms in the Lao PDR, beginning about 1990, rice output has grown
September Expert Consultation on Statistics in Support of Policies to Empower Small Farmers. Bangkok, Thailand, 8-11 September 2009
 Agenda item 5 STAT-EMPOWER-8 September 2009 Expert Consultation on Statistics in Support of Policies to Empower Small Farmers Bangkok, Thailand, 8-11 September 2009 STRATEGIES IN MEETING THE STATISTICAL
Impact of Global Markets on Indian Agricultural Markets
 Impact of Global Markets on Indian Agricultural Markets Surabhi Mittal Senior Fellow Theme paper presentation at the 23 rd National Conference on Agricultural Marketing, on 12-14 th November, 2009, organized
Fish, Rice and Agricultural Land Use in Myanmar:
 Fish, Rice and Agricultural Land Use in Myanmar: Preliminary findings from the Food Security Policy Project May 5, 2015 Ben Belton (MSU), Aung Hein, Kyan Htoo, Seng Kham (MDRI) Paul Dorosh and Emily Schmidt
Savar, Bangladesh, on 15 th to 17 th October, Sub-theme II: Farm Size and Productivity Revisited
 8 th International Conference of Asian Society of Agricultural Economists (ASAE), Savar, Bangladesh, on 15 th to 17 th October, 2014 Sub-theme II: Farm Size and Productivity Revisited Agricultural Production
Thematic Brief 2 Water Productivity
 Thematic Brief 2 Water Productivity Brief prepared for the Entry phase of the project: Strengthening Agricultural Water Efficiency and Productivity on the African and Global Level The Project The GCP/INT/166/SWI