How to view Results with Scaffold. Proteomics Shared Resource
|
|
|
- Jayson Watts
- 6 years ago
- Views:
Transcription
1 How to view Results with Scaffold Proteomics Shared Resource
2 Starting out Download Scaffold from oftware.com/proteom e_software_prod_sca ffold_download.html Follow installation instructions on website When install is finished double-click on the scaffold icon to begin. When prompted to enter a Key select Free Viewer to use Scaffold for free to view you data
")
3 Select Open and select the.sfd file containing the data of interest The file will load in the viewer (this may take a minute) The opened file should be similar to what is on the next page Loading a file

4 Scaffold Main Screen
 that")
5 Left Toolbar The Load Data Tab isn t used in the viewer Samples displays a spread-sheet like format allowing you to sort your data Proteins shows the MS/MS spectra and % coverage information from a chosen protein Publish creates a paragraph suitable for a methods Section from the settings on the Samples page The Statistics page shows statistical data created from the search algorithm(s) that processed the dataset
6 Top Toolbar On the far Left of the Top toolbar is the Open, Save, Print, and Print Preview commands respectively (note you can only have one Scaffold file displayed at a time) Next are tools for exporting the data to an excel spreadsheet Copy data in current view copies the displayed data so that you can paste it into an existing excel file and Export to Excel Spreadsheet exports all the data and creates a new file. The next two tabs switch between viewing the sample s name and the name of the mass spectrometer raw data file. Switch to Biological Sample view displays the sample name given when the scaffold file was created Switch to MS/MS sample view displays the mass spectrometer raw data file name
7 Top Toolbar 2 Min Protein, Min # of Peptides, and Min Peptide determine what Proteins are displayed on the spreadsheet. Note that Proteins displayed must meet all the criteria listed. So with the criteria above a protein with 2 peptides, each peptide with >90% peptide prob. and 90% protein prob. would be displayed; but a protein with 1 peptide with peptide and protein probabilities of 95% each would not be in the list Also note that Protein probability is derived in part from peptide probability, so setting the protein probability much lower than the peptide probability likely won t display any more results For more details on how peptide and protein probabilities relate you can view the statistics tab The blue? access the help menu for scaffold

8 Displays a list of samples on the horizontal axis and proteins on the vertical axis Where these columns meet there is a value for that protein in the particular protein What value is displayed is determined by the display options tab Color corresponds to the Probability Legend referring to Protein Prob. Samples Screen

9 The Display Options drop-down menu determines what shows up where the two columns intersect Protein Identification Probability lists the Probability being present % of total spectra lists what % of the MS/MS spectra were assigned to that protein # of Identified Spectra gives the total # of spectra assigned to the protein # of Unique Peptides lists the # of Unique peptides in the identified protein (note that missed cleavages/degradation products are considered a different peptide) Finally # of unique Spectra shows the # of Spectra that are unique to that protein Display Options


10 Sorting data -Clicking on any of the horizontal axis columns sorts the data -Clicking once sorts the data, clicking twice sorts it in the opposite order, and clicking a 3 rd time returns the data to its original look once Click here 3 times twice

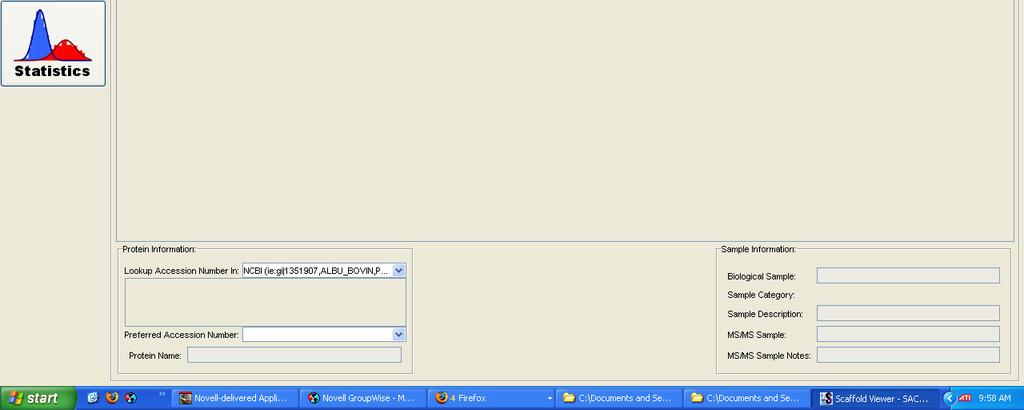
11 Other Sample Screen info Hovering your mouse over a value in the table will display more details When hovered over the Protein name this displays all proteins with which the identified peptides are a strong match. If more than one protein is listed here then you do not have enough sequence information to determine the protein your peptides belong to, but instead have one or more of the proteins listed in your sample. This list can also be viewed under the Proteins Tab on the Left Scroll Bar At the bottom of the page is a protein information screen. This interface allows you to look up your protein on-line at various sites. This will allow you to find more information on your protein, but what these screens reveal is beyond the scope of this guide to cover

12 Protein Screen To view data in the Proteins Tab on the left tool bar first select a protein in the Samples screen by clicking on it. Then select the Proteins Tab on the left toolbar First click here Then here

13 Main Protein Screen

14 Upper Left Window The Upper left window contains much of the same information as the Samples Tab The Chosen Protein is listed Other Proteins can be chosen from various samples using the drop-down menus Select Protein Current Protein Select Sample
 Modified amino acids are shown as a green letter in the sequence")
15 Upper Right Window The upper right window displays the peptides which have been assigned to the protein in the upper left window Values from the database search are included as well (i.e. mascot identity score) Modified amino acids are shown as a green letter in the sequence
")
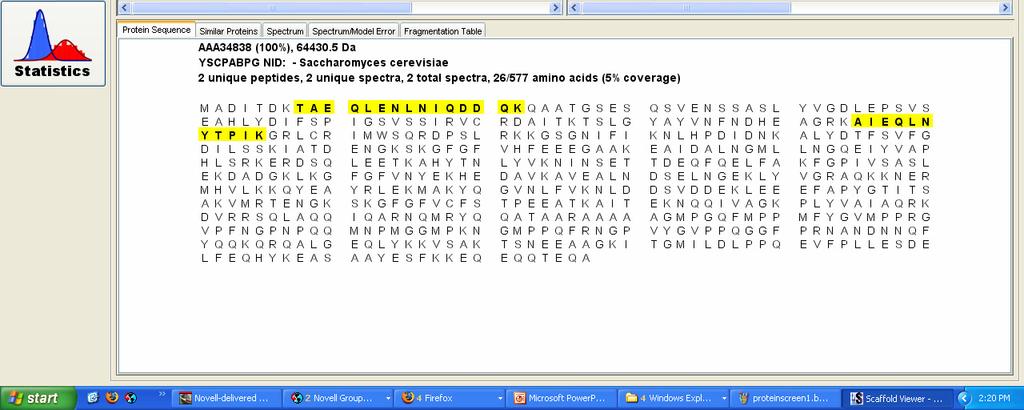
16 Lower window The lower window has 6 tabs to display information about the current protein The Protein Sequence tab shows the location of identified peptides on the protein Amino-acids matched to a MS/MS spectrum are in yellow. Aminoacids marked in green have a post-translational modification (i.e. phosphoylation)
")
17 Lower Window 2 The similar proteins tab lists all the protein which share the sequences identified (yellow/green) in the protein sequence tab If there is more than one protein listed here than there isn t enough identified sequence information to distinguish between the proteins listed. This is common with genes that are heavily processed after transcription (i.e. exons and/or post translational modifications)
18 Lower Window 3 The Spectrum tab displays the MS/MS spectra which the mass spectrometer generated, this is matched against the peptide in the database which lined up best with the fragmentation pattern B-ion and y-ion series are color-coded (red and blue) and the aminoacid sequence is across the top, and the parent ion mass is listed. Please note that this is a graphical representation and will differ in appearance slightly from the actual MS/MS spectra generated by the mass spectrometer
19 Lower Window 4 This window displays the Spectrum/Model error The bars on the graph show how far the masses recorded by the mass spectrometer differ from the calculated masses. When a spectrum and peptide are matched correctly the error for the peaks should match up well to the mass accuracy of the mass spectrometer used.
 Green boxes refer to neutral loss or similar fragmentation patterns;")
20 Lower Window 5 The fragmentation table displays the same information as the spectrum window, but in a spreadsheet format. Potential ions which match the spectra are colored (these colored boxes are the lines in the spectra window) Green boxes refer to neutral loss or similar fragmentation patterns; this is the same as the green bars in the spectrum window


21 Click here To get to Publish screen Publish Screen
22 Publish Info. The Publish screen creates a couple of short paragraphs suitable for the methods section of a paper using the settings that software was run with, the way data has been filtered in the samples tab, and variables entered into the lines on the left side of the screen. The paragraphs are written on the right side of the screen. This data can be transferred to a document program (i.e. MS Word) by highlighting it, right-clicking and selecting copy. Then you can paste the paragraphs into the document program with the same method. The corresponding data in the samples tab can be exported to excel using the tabs on the bottom of the screen


23 Statistics -Displays information relating to the software used to match the MS/MS spectra to the amino-acid sequences in the database, and which make probability estimates based on this information. Click here to View Statistics

24 Upper Left Window This window lists the different samples from the samples tab The data displayed in the other 3 windows is for the sample highlighted in this window Note that any of the other fields may be blank if there is not enough data in the sample

25 Upper Right Window This window displays the relationship between peptide probability, # of peptides and protein probability Note that the # of peptides found strongly affects the protein probability Also note that with 95% probability on a single peptide this only relates to about a 50% probability of the protein being present Often 2 to 3 high probability peptides are necessary to have a confident protein identification

26 Lower Left Window This window displays a scatter plot of the X! Tandem and other search engine scores for each identified peptide. This field is useful for comparing the search engines and evaluating how useful they are to your dataset Note that if X! Tandem was not run on your dataset then this field will be blank

27 Lower Right Window This displays the calculated curves which the peptide identification algorithm uses to calculate probabilities Scores are sorted by value and 2 curves are matched to the distributions The degree of overlap of the two curves relates to the peptide probability
28 Questions? If you have questions about using Scaffold please contact us: (503)
How to view Results with. Proteomics Shared Resource
 How to view Results with Scaffold 3.0 Proteomics Shared Resource An overview This document is intended to walk you through Scaffold version 3.0. This is an introductory guide that goes over the basics
Analyzing an individual sequence in the Sequence Editor
 BioNumerics Tutorial: Analyzing an individual sequence in the Sequence Editor 1 Aim The Sequence editor window is a convenient tool implemented in BioNumerics to edit and analyze nucleotide and amino acid
ProteinPilot Software for Protein Identification and Expression Analysis
 ProteinPilot Software for Protein Identification and Expression Analysis Providing expert results for non-experts and experts alike ProteinPilot Software Overview New ProteinPilot Software transforms protein
Nature Biotechnology: doi: /nbt Supplementary Figure 1. The workflow of Open-pFind.
 Supplementary Figure 1 The workflow of Open-pFind. The MS data are first preprocessed by pparse, and then the MS/MS data are searched by the open search module. Next, the MS/MS data are re-searched by
N- The rank of the specified protein relative to all other proteins in the list of detected proteins.
 PROTEIN SUMMARY file N- The rank of the specified protein relative to all other proteins in the list of detected proteins. Unused (ProtScore) - A measure of the protein confidence for a detected protein,
ProteinPilot Report for ProteinPilot Software
 ProteinPilot Report for ProteinPilot Software Detailed Analysis of Protein Identification / Quantitation Results Automatically Sean L Seymour, Christie Hunter SCIEX, USA Powerful mass spectrometers like
Excel 2011 Charts - Introduction Excel 2011 Series The University of Akron. Table of Contents COURSE OVERVIEW... 2
 Table of Contents COURSE OVERVIEW... 2 DISCUSSION... 2 OBJECTIVES... 2 COURSE TOPICS... 2 LESSON 1: CREATE A CHART QUICK AND EASY... 3 DISCUSSION... 3 CREATE THE CHART... 4 Task A Create the Chart... 4
The Benchmarking module
 5 45 5.1 What is the Benchmarking module? lets you easily evaluate your research performance in comparison to others. How does your institution compare to others in your region, country or the world? Choose
20. Alternative Ranking Using Criterium Decision Plus (Multi-attribute Utility Analysis)
") The selection of the preferred alternative, using a structured decision process, begins with creation of the decision hierarchy. The hierarchy is the clear organization of the goal, listing of categories
The selection of the preferred alternative, using a structured decision process, begins with creation of the decision hierarchy. The hierarchy is the clear organization of the goal, listing of categories
AutoClerk User Guide. Tape Chart, Marketing, Yield Management
 AutoClerk User Guide Tape Chart, Marketing, Yield Management Table of Contents TABLE OF CONTENTS... 2 COPYRIGHT INFORMATION... 3 1. TAPE CHART... 4 SETTING TAPE CHART PARAMETERS... 4 MENU BAR... 6 TAPE
Microsoft Office: Excel 2013
 Microsoft Office: Excel 2013 Intro to Charts University Information Technology Services Training, Outreach and Learning Technologies Copyright 2014 KSU Department of University Information Technology Services
Browser Exercises - I. Alignments and Comparative genomics
 Browser Exercises - I Alignments and Comparative genomics 1. Navigating to the Genome Browser (GBrowse) Note: For this exercise use http://www.tritrypdb.org a. Navigate to the Genome Browser (GBrowse)
Highly Confident Peptide Mapping of Protein Digests Using Agilent LC/Q TOFs
 Technical Overview Highly Confident Peptide Mapping of Protein Digests Using Agilent LC/Q TOFs Authors Stephen Madden, Crystal Cody, and Jungkap Park Agilent Technologies, Inc. Santa Clara, California,
PEAKS 8 User Manual. PEAKS Team
 PEAKS 8 User Manual PEAKS Team PEAKS 8 User Manual PEAKS Team Publication date 2016 Table of Contents 1. Overview... 1 1. How to Use This Manual... 1 2. What Is PEAKS?... 1 3. What Is New in PEAKS 8?...
Workforce One Time & Labor Management
 Workforce One Time & Labor Management Web Based Time & Labor Management is a web-based time and attendance system used for a variety of labor tracking needs such as: attendance management, project tracking,
Finding Genes, Building Search Strategies and Visiting a Gene Page
 Finding Genes, Building Search Strategies and Visiting a Gene Page 1. Finding a gene using text search. For this exercise use http://www.plasmodb.org a. Find all possible kinases in Plasmodium. Hint: use
DIGITAL VERSION. Microsoft EXCEL Level 2 TRAINER APPROVED
 DIGITAL VERSION Microsoft EXCEL 2013 Level 2 TRAINER APPROVED Module 4 Displaying Data Graphically Module Objectives Creating Charts and Graphs Modifying and Formatting Charts Advanced Charting Features
Cell Signaling Technology
 Cell Signaling Technology PTMScan Direct: Multipathway v2.0 Proteomics Service Group January 14, 2013 PhosphoScan Deliverables Project Overview Methods PTMScan Direct: Multipathway V2.0 (Tables 1,2) Qualitative
ProteinPilot Software Overview
 ProteinPilot Software Overview High Quality, In-Depth Protein Identification and Protein Expression Analysis Sean L. Seymour and Christie L. Hunter SCIEX, USA As mass spectrometers for quantitative proteomics
Mass Spectrometry Based Proteomics Data Analysis Using GalaxyP
 Mass Spectrometry Based Proteomics Data Analysis Using GalaxyP GCC 2015 GalaxyP Workshop July 6th, 2015 Norwich, UK Presenters: Tim Griffin, Pratik Jagtap and James Johnson Documentation: Kevin Murray,
P6 Analytics Reference Manual
 P6 Analytics Reference Manual Release 3.2 December 2013 Contents Getting Started... 7 About P6 Analytics... 7 Prerequisites to Use Analytics... 8 About Analyses... 9 About... 9 About Dashboards... 10
START Saratoga Taking Action and Report Tool Help Document
 www.pwc.com/workforce-analytics START Saratoga Taking Action and Report Tool Help Document Table of contents Introduction...1 Dashboard... 2 Common report features... 3 Metrics... 5 Contact for Further
Improving Productivity with Applied Biosystems GPS Explorer
 Product Bulletin TOF MS Improving Productivity with Applied Biosystems GPS Explorer Software Purpose GPS Explorer Software is the application layer software for the Applied Biosystems 4700 Proteomics Discovery
You will need genotypes for up to 100 SNPs, and you must also have the Affymetrix CEL files available for import.
 SNP Cluster Plots Author: Greta Linse Peterson, Golden Helix, Inc. Overview This function creates scatter plots based on A and B allele intensities that can be split on SNP genotypes to create tri-colored
TRUST. Technology Reporting Using Structured Templates for the FCH JU. User Manual for data providers. Version 1.00
 TRUST Technology Reporting Using Structured Templates for the FCH JU User Manual for data providers Version 1.00 Table of contents TRUST ----------------------------------------------------------------------------------------------------------------------------
The first thing you will see is the opening page. SeqMonk scans your copy and make sure everything is in order, indicated by the green check marks.
 Open Seqmonk Launch SeqMonk The first thing you will see is the opening page. SeqMonk scans your copy and make sure everything is in order, indicated by the green check marks. SeqMonk Analysis Page 1 Create
Contents Getting Started... 7 Sample Dashboards... 12
 P6 Analytics Reference Manual Release 3.4 September 2014 Contents Getting Started... 7 About P6 Analytics... 7 Prerequisites to Use Analytics... 8 About Analyses... 9 About... 9 About Dashboards... 10
static MM_Index snap(mm_index corect, MM_Index ligct, int imatch0, int *moleatoms, i
 BIOLUMINATE static MM_Index snap(mm_index corect, MM_Index ligct, int imatch0, int *moleatoms, int *refcoreatoms){int ncoreat = :vector mappings; PhpCoreMapping mapping; for COMMON(glidelig).
Spectrum Mill MS Proteomics Workbench. Comprehensive tools for MS proteomics
 Spectrum Mill MS Proteomics Workbench Comprehensive tools for MS proteomics Meeting the challenge of proteomics data analysis Mass spectrometry is a core technology for proteomics research, but large-scale
Finding Genes, Building Search Strategies and Visiting a Gene Page
 Finding Genes, Building Search Strategies and Visiting a Gene Page 1. Finding a gene using text search. For this exercise use http://www.plasmodb.org a. Find all possible kinases in Plasmodium. Hint: use
quick start guide A quick start guide inflow support GET STARTED WITH INFLOW
 GET STARTED WITH INFLOW quick start guide Welcome to the inflow Community! This quick start guide includes all the important stuff to get you tracking your inventory before you know it! Just follow along
Bionano Access v1.2 Release Notes
 Bionano Access v1.2 Release Notes Document Number: 30220 Document Revision: A For Research Use Only. Not for use in diagnostic procedures. Copyright 2018 Bionano Genomics, Inc. All Rights Reserved. Table
Next, switch from your browser to the inflow Cloud for Windows app and log in.
 Table of Contents 1.0 First-time setup...3 2.0 How do I navigate around inflow Cloud?...6 2.1 The inflow Cloud Homepage...6 2.2 inflow Cloud list views...6 2.3 Action toolbar...8 3.0 Where do I enter my
BCHM 6280 Tutorial: Gene specific information using NCBI, Ensembl and genome viewers
 BCHM 6280 Tutorial: Gene specific information using NCBI, Ensembl and genome viewers Web resources: NCBI database: http://www.ncbi.nlm.nih.gov/ Ensembl database: http://useast.ensembl.org/index.html UCSC
THE GANTT CHART WHAT IS USED FOR HOW TO MAKE IT WITH EXCEL
 Disegno, Progettazione e Organizzazione Industriale English lesson 5BMEC Prof. Massimiliano Usai THE GANTT CHART WHAT IS USED FOR HOW TO MAKE IT WITH EXCEL WHAT IS USED FOR: The Gantt chart is mainly used
My Market Reports. Search Options. Working with All Reports. Inventory Report
 My Market Reports The My Market reports show a variety of information about the current and recent state of MLS s market. A graph and corresponding numeric table display statistics for each of five reports:
Confident Protein ID using Spectrum Mill Software
 Welcome to our E-Seminar: Confident Protein ID using Spectrum Mill Software Slide 1 Spectrum Mill Informatics Software Start with batches of raw MS data! Sp ec t ru m Mi ll Biologist-friendly answers!
ProteomicsBrowser User Guide
 Vol.1 ProteomicsBrowser User Guide Copyrighted by Yale University Table of Contents PROTEOMICSBROWSER DOWNLOADING AND INSTALLATION...3 PROJECT MANAGEMENT...3 CREATE PROJECT... 3 SAVE PROJECT... 3 OPEN
Top N Pareto Front Search Add-In (Version 1) Guide
 Guide") Top N Pareto Front Search Add-In (Version 1) Guide Authored by: Sarah Burke, PhD, Scientific Test & Analysis Techniques Center of Excellence Christine Anderson-Cook, PhD, Los Alamos National Laboratory
Top N Pareto Front Search Add-In (Version 1) Guide Authored by: Sarah Burke, PhD, Scientific Test & Analysis Techniques Center of Excellence Christine Anderson-Cook, PhD, Los Alamos National Laboratory
CAT Enterprise. Reports Manual
 CAT Enterprise Reports Manual Version 1.6 Revised February 2013 NOTICE AND DISCLAIMER The information contained herein (WORK) was prepared by or contributed to by various parties in support of professional
Introduction. Benefits of the SWATH Acquisition Workflow for Metabolomics Applications
 SWATH Acquisition Improves Metabolite Coverage over Traditional Data Dependent Techniques for Untargeted Metabolomics A Data Independent Acquisition Technique Employed on the TripleTOF 6600 System Zuzana
Key questions of proteomics. Bioinformatics 2. Proteomics. Foundation of proteomics. What proteins are there? Protein digestion
 s s Key questions of proteomics What proteins are there? Bioinformatics 2 Lecture X roteomics How much is there of each of the proteins? - Absolute quantitation - Stoichiometry What (modification/splice)
Datastream Desktop - Getting Started
 Datastream Desktop - Getting Started Maggie Kan Knowledge Network Senior Specialist maggie.kan@thomsonreuters.com Introduction The Datastream interface (Advance) offers easy-to-use, pre-formatted charts
Quantitative Analysis on the Public Protein Prospector Web Site. Introduction
 Quantitative Analysis on the Public Protein Prospector Web Site Peter R. Baker 1, Nicholas J. Agard 2, Alma L. Burlingame 1 and Robert J. Chalkley 1 1 Mass Spectrometry Facility, Dept. of Pharmaceutical
Excel 2016: Charts - Full Page
 Excel 2016: Charts - Full Page gcflearnfree.org/excel2016/charts/1/ Introduction It can be difficult to interpret Excel workbooks that contain a lot of data. Charts allow you to illustrate your workbook
Real-Time Air Quality Activity. Student Sheets
 Real-Time Air Quality Activity Student Sheets Green Group: Location (minimum 3 students) Group Sign-up Sheet Real-time Air Quality Activity 1. 3. 2. Red Group: Time (minimum 4 students) 1. 3. 2. 4. Yellow
Using the Genome Browser: A Practical Guide. Travis Saari
 Using the Genome Browser: A Practical Guide Travis Saari What is it for? Problem: Bioinformatics programs produce an overwhelming amount of data Difficult to understand anything from the raw data Data
RIT ORACLE CAPITAL EQUIPMENT PHYSICAL INVENTORY
 RIT ORACLE CAPITAL EQUIPMENT PHYSICAL INVENTORY Table of Contents Overview... 2 FA Physical Inventory User Responsibility... 2 Fixed Asset Parent Departments... 2 Contact Information... 2 Inventory Cycles...
Supplementary Figure 1: MS Data Quality (1/2)
") Supplementary Figure 1: MS Data Quality (1/2) a.4.3 Precursor Mass Error Plot Median Absolute Mass Error:.72 ppm b.2.15 Fragment Mass Error Plot Median Absolute Mass Error: 1.95 ppm.2.1.1.5. 6 4 2 2 4
Supplementary Figure 1: MS Data Quality (1/2) a.4.3 Precursor Mass Error Plot Median Absolute Mass Error:.72 ppm b.2.15 Fragment Mass Error Plot Median Absolute Mass Error: 1.95 ppm.2.1.1.5. 6 4 2 2 4
DNA Repair Protein Exercise
 Name StarBiochem DNA Repair Protein Exercise Background In this exercise, you will use StarBiochem, a protein 3-D viewer, to explore the structure of a DNA repair protein found in most species, including
Exploring Microsoft Office Excel 2007
 Exploring Microsoft Office Excel 2007 Chapter 3: Charts: Delivering a Message Robert Grauer, Keith Mulbery, Judy Scheeren Committed to Shaping the Next Generation of IT Experts. Copyright 2008 Prentice-Hall.
timstof Innovation with Integrity Powered by PASEF TIMS-QTOF MS
 timstof Powered by PASEF Innovation with Integrity TIMS-QTOF MS timstof The new standard for high speed, high sensitivity shotgun proteomics The timstof Pro with PASEF technology delivers revolutionary
A Highly Accurate Mass Profiling Approach to Protein Biomarker Discovery Using HPLC-Chip/ MS-Enabled ESI-TOF MS
 Application Note PROTEOMICS METABOLOMICS GENOMICS INFORMATICS GLYILEVALCYSGLUGLNALASERLEUASPARG CYSVALLYSPROLYSPHETYRTHRLEUHISLYS A Highly Accurate Mass Profiling Approach to Protein Biomarker Discovery
ipep User s Guide Proteomics
 Proteomics ipep User s Guide ipep has been designed to aid in designing sample preparation techniques around the detection of specific sites or motifs in proteins and proteomes. The first application,
Agilent Genomic Workbench 7.0
 Agilent Genomic Workbench 7.0 Product Overview Guide Agilent Technologies Notices Agilent Technologies, Inc. 2012, 2015 No part of this manual may be reproduced in any form or by any means (including electronic
Learning to Use PyMOL (includes instructions for PS #2)
") Learning to Use PyMOL (includes instructions for PS #2) To begin, download the saved PyMOL session file, 4kyz.pse from the Chem 391 Assignments web page: http://people.reed.edu/~glasfeld/chem391/assign.html
Learning to Use PyMOL (includes instructions for PS #2) To begin, download the saved PyMOL session file, 4kyz.pse from the Chem 391 Assignments web page: http://people.reed.edu/~glasfeld/chem391/assign.html
Enabling Systems Biology Driven Proteome Wide Quantitation of Mycobacterium Tuberculosis
 Enabling Systems Biology Driven Proteome Wide Quantitation of Mycobacterium Tuberculosis SWATH Acquisition on the TripleTOF 5600+ System Samuel L. Bader, Robert L. Moritz Institute of Systems Biology,
Scheduler Book Mode User Guide Version 4.81
 Scheduler Book Mode User Guide Version 4.81 Contents Introduction...2 Scheduler Active Tab...2 Appointment Colors and Markings...2 Setting Book Mode...3 Active Tab Options...3 Active Tab Use...3 Active
Manager Dashboard User Manual
 Manager Dashboard User Manual Manager User Guide The Manager User Guide is designed to provide a supervisor or a manager with step-by-step instructions for their daily tasks. Although every database will
Applicant Reviewer Quick Guide
 Applicant Reviewer Quick Guide Viewing and moving applicants through the Workflow October 22, 2015 PeopleAdmin User Guide for Staff/Temp Positions Contents Applicant Reviewer... 3 Logging In... 3 Changing
Aesop Reference Guide for Administrators Table of Contents
 Aesop Reference Guide for Administrators Table of Contents Internet Feature Section A: Section B: Section C: Section D: Section E: Section F: Section G: Section H: Section I: Section J: Section K: Section
Application Note TOF/MS
 Application Note TOF/MS New Level of Confidence for Protein Identification: Results Dependent Analysis and Peptide Mass Fingerprinting Using the 4700 Proteomics Discovery System Purpose The Applied Biosystems
Functional analysis using EBI Metagenomics
 Functional analysis using EBI Metagenomics Contents Tutorial information... 2 Tutorial learning objectives... 2 An introduction to functional analysis using EMG... 3 What are protein signatures?... 3 Assigning
RNA-Seq Analysis. August Strand Genomics, Inc All rights reserved.
 RNA-Seq Analysis August 2014 Strand Genomics, Inc. 2014. All rights reserved. Contents Introduction... 3 Sample import... 3 Quantification... 4 Novel exon... 5 Differential expression... 12 Differential
Course Companion E-Z Data, Inc. All rights reserved. SmartOffice is a registered trademark of E-Z Data, Inc.
 Course Companion Group Benefits Module 2004. E-Z Data, Inc. All rights reserved. SmartOffice is a registered trademark of E-Z Data, Inc. Group Census The first column hyperlink is reserved to open the
Infor LN Resource Management Workbench User Guide
 Infor LN Resource Management Workbench User Guide Copyright 2017 Infor Important Notices The material contained in this publication (including any supplementary information) constitutes and contains confidential
Modification Site Localization Scoring Integrated into a Search Engine
 Modification Site Localization Scoring Integrated into a Search Engine Peter R. Baker 1, Jonathan C. Trinidad 1, Katalin F. Medzihradszky 1, Alma L. Burlingame 1 and Robert J. Chalkley 1 1 Mass Spectrometry
Supervisor Overview for Staffing and Scheduling Log In and Home Screen
 Supervisor Overview for Staffing and Scheduling Log In and Home Screen On the login screen, enter your Active Directory User Name and Password, and click the Sign-in button. You will then be taken to your
DRM DISPATCHER USER MANUAL
 DRM DISPATCHER USER MANUAL Overview: DRM Dispatcher provides support for creating and managing service appointments. This document describes the DRM Dispatcher Dashboard and how to use it to manage your
Findmyshift - Getting started with Findmyshift
 Findmyshift - Getting started with Findmyshift Managers Creating your first schedule Adding employees to your team Inviting your employees to log in Choosing your settings Entering shifts Publishing shifts
Supplementary Figure 1. Processing and quality control for recombinant proteins.
 Supplementary Figure 1 Processing and quality control for recombinant proteins. (a) Schematic representation of processing of a recombinant protein library. Recombinant proteins were generated individually.
Week 1 BCHM 6280 Tutorial: Gene specific information using NCBI, Ensembl and genome viewers
 Week 1 BCHM 6280 Tutorial: Gene specific information using NCBI, Ensembl and genome viewers Web resources: NCBI database: http://www.ncbi.nlm.nih.gov/ Ensembl database: http://useast.ensembl.org/index.html
Scheduling Work at IPSC
 Scheduling Work at IPSC Overview The purpose of this document is to describe and lay out the specific steps for how Work Orders will be scheduled in Maximo at IPSC. In general, Work Orders will be planned
IT portfolio management template User guide
 IBM Rational Focal Point IT portfolio management template User guide IBM Software Group IBM Rational Focal Point IT Portfolio Management Template User Guide 2011 IBM Corporation Copyright IBM Corporation
Inventory Management*
 CHEMATIX Quick Guide Viewing Your Inventory Report Inventory Management* 4. Select your lab or labs 5. Enter container description or CAS number (leave empty to see all). 6. The initial list is a quick
HR Business Partner Guide
 HR Business Partner Guide March 2017 v0.1 Page 1 of 10 Overview This guide is for HR Business Partners. It explains HR functions and common actions HR available to business partners and assumes that the
Go to the Design tab to see the entire Business Process workflow and check each particular step (Task or Rule).
.") License Verification License Verification is a sample Business Process that gets a list of license numbers as initial data set, checks their validity, scrapes the license information from the web-site,
License Verification License Verification is a sample Business Process that gets a list of license numbers as initial data set, checks their validity, scrapes the license information from the web-site,
ACCOUNTING TAB OVERVIEW PAYMENT/DEPOSIT LIST. Accounting Tab>Add New Payment/Deposit
 O f f i c e A l l y 1 ACCOUNTING TAB OVERVIEW This module has been designed to provide full accounting capabilities enabling the user to report and apply payments, create billing statements, and generate
Reports in Profit Center Accounting (Revenues and Expenses) NOTE: NOTE:
 NOTE: NOTE:") Reports in Profit Center Accounting (Revenues and Expenses) The University of Mississippi 1/2012 R/3 Path Accounting > Controlling > Profit Center Accounting > Information System > Reports for Profit Center
Reports in Profit Center Accounting (Revenues and Expenses) The University of Mississippi 1/2012 R/3 Path Accounting > Controlling > Profit Center Accounting > Information System > Reports for Profit Center
TIMESHEET. Project economy, planning and forecasting AutoPilot
 Version 7.201.133 AutoPilot Timesheet TIMESHEET Project economy, planning and forecasting AutoPilot Contents 1. Preface... 4 1.1 The timesheet your daily registration tool... 4 2. Daily use of the timesheet...
SAN ANTONIO SPURS. Seat Selection Instruction Manual
 1 Spurs Sports & Entertainment are very excited to share this state-of-the-art and 3D technology with you. You will have the ability to view and select the best available seats according to your individual
1 BASIC CHARTING. 1.1 Introduction
 1 BASIC CHARTING 1.1 Introduction This section covers the basic principles of how to create and modify a chart in Excel. With Excel 2016, the charting process is user-friendly and offers many ways to amplify
Product: ODTView. Subject: Basic Overview of Delivery and Orders Tab. Version: December 6, Distribution: Customer
 Product: ODTView Subject: Basic Overview of Delivery and Orders Tab Version: December 6, 2016 Distribution: Customer Setting Up Delivery and Orders Tab Log into ODT Viewer with an Admin user Navigate to
PIE Performance Process Dashboard & Grid
 PIE Performance Process Dashboard & Grid All Managers who have direct reports will have access to the Dashboards and Analytics functions in Reports under the main menu. Contents TASK : Running PIE Performance
Frontline Education s Absence Management Solution Reference Guide for Administrators Table of Contents
 Frontline Education s Absence Management Solution Reference Guide for Administrators Table of Contents Internet Feature Section A: Section B: Section C: Section D: Section E: Section F: Section G: Section
Enterprise by HansaWorld Resource Planner
 Enterprise by HansaWorld Resource Planner Version 7.2 Mac OS October 2014 Table of Contents THE RESOURCE PLANNING MODULE...3 Settings...3 Display Groups...3 Invoice Items...4 Number Series Reservations...4
KnetMiner USER TUTORIAL
 KnetMiner USER TUTORIAL Keywan Hassani-Pak ROTHAMSTED RESEARCH 10 NOVEMBER 2017 About KnetMiner KnetMiner, with a silent "K" and standing for Knowledge Network Miner, is a suite of open-source software
How do I Reconcile MCPS Invoices?
 How do I Reconcile MCPS Invoices? Overview Purpose This document explains how schools can reconcile Montgomery County Public School (MCPS) invoices to requisitions charged to their cash account and to
Figure 1. FasterDB SEARCH PAGE corresponding to human WNK1 gene. In the search page, gene searching, in the mouse or human genome, can be done: 1- By
 1 2 3 Figure 1. FasterD SERCH PGE corresponding to human WNK1 gene. In the search page, gene searching, in the mouse or human genome, can be done: 1- y keywords (ENSEML ID, HUGO gene name, synonyms or
Oncomine cfdna Assays Part III: Variant Analysis
 Oncomine cfdna Assays Part III: Variant Analysis USER GUIDE for use with: Oncomine Lung cfdna Assay Oncomine Colon cfdna Assay Oncomine Breast cfdna Assay Catalog Numbers A31149, A31182, A31183 Publication
MAKING WHOLE GENOME ALIGNMENTS USABLE FOR BIOLOGISTS. EXAMPLES AND SAMPLE ANALYSES.
 MAKING WHOLE GENOME ALIGNMENTS USABLE FOR BIOLOGISTS. EXAMPLES AND SAMPLE ANALYSES. Table of Contents Examples 1 Sample Analyses 5 Examples: Introduction to Examples While these examples can be followed
Oracle. Field Service Cloud Using Forecasting Cloud Service 18B
 Oracle Field Service Cloud 18B Part Number: E94751-02 Copyright 2018, Oracle and/or its affiliates. All rights reserved Authors: The Field Service Cloud Information Development Team This software and related
HYPERION: SALARY Task List Guide
 HYPERION: SALARY Task List Guide Table of Contents General Notes... 2 Forms... 2 Tasks and the Task List... 2 Home Departments versus Funding Departments... 2 Getting Started... 3 Logging into Hyperion
Using SPSS for Linear Regression
 Using SPSS for Linear Regression This tutorial will show you how to use SPSS version 12.0 to perform linear regression. You will use SPSS to determine the linear regression equation. This tutorial assumes
PeopleAdmin Navigation Reference Guide
 PeopleAdmin Navigation Reference Guide PeopleAdmin Navigation Reference Guide Table of Contents General System Information... 2 System Roles... 3 Non-HR System Roles... 3 How to log-in to PeopleAdmin (PA7)...
TLM 2.1 User's Manual
 Software Package for Water Sciences TLM 2.1 User's Manual By Miloš Gregor 2010 Product Name: FDC 2.1 Version: 2.1 Build: 6 Author: Miloš Gregor 1,2,3 1 Department of Hydrogeology, Faculty of Natural Science,
Manager Self Service User Reference Guide for Hiring Managers
 Manager Self Service User Reference Guide for Hiring Managers Contents 1. Sign In... 2 2. Set General Preferences... 4 3. Create a Requisition... 8 4. Approve Requisition... 13 5. Manage Candidates...
TurboMass GC/MS Software
 TurboMass GC/MS Software GAS CHROMATOGRAPHY / MASS SPECTROMETRY P R O D U C T N O T E Today s demanding laboratory requires software that is easy to learn yet offers sophisticated instrument control, robust
SAS Enterprise Guide: Point, Click and Run is all that takes
 ABSTRACT SAS Enterprise Guide: Point, Click and Run is all that takes Aruna Buddana, TiVo Inc, Alviso, CA The Audience Research and Measurement team at TiVo constantly collects and processes anonymous
Spectronaut Pulsar X. Maximize proteome coverage and data completeness by utilizing the power of Hybrid Libraries
 Spectronaut Pulsar X Maximize proteome coverage and data completeness by utilizing the power of Hybrid Libraries More versatility in proteomics research Spectronaut has delivered highest performance in