Ströer SE & Co. KGaA Investor Presentation. dbaccess German, Swiss & Austrian Conference Berlin, 09 th June 2016
|
|
|
- Rosamund Lamb
- 6 years ago
- Views:
Transcription

1 Ströer SE & Co. KGaA Investor Presentation dbaccess German, Swiss & Austrian Conference Berlin, 09 th June 2016

2 AGENDA 01 Ströer #1 in OOH & Digital Ströer s well- diversified product portfolio Focus on highest ad subsegments Ströer outperforming total ad market Clear market leader in Display & Mobile 02 Strategic update From analogue to digital Five key strategic areas New management team Digitisation Content Evolution of media Value Creation Local markets Strategic Roadmap 03 Financials FY 2015 KPIs Cash flow on more detail Exceptionals Adj. EPS P&L in more detail Organic growth explained ROCE M&A Financing costs Segment Digital Transparency Governance 04 Q Financials in more detail P&L Org. growth Ströer Digital Product Segment Digital Ströer OOH Germany Ströer OOH International FCF Financial Status Summary Guidance 2

3 STRÖER #1 in OOH & DIGITAL
")


 To")
4 Well diversified product portfolio 2015 with focus on premium products Digital Billboards 1) Desktop/Mobile, Video, Transactional 29% 17% Network with regional and local density Transport MegaLight/ Scroller 1) XXL poster 7% 15% Rotating, backlit posters at traffic hubs Street Furniture 28% 4% BlowUp 1) Urban ad culture, CityLight Poster Trains, Busses 1) To be renamed as Large Formats 4
5 Ströer: Focus on highest growing Ad Sub Segments Video ~ +20% Display/Mobile ~5-10% OoH ~ +3% Radio / TV Magazines Newspaper Advertising Market (in %, CAGR )* ca. + 2% ca. -2% ca. -3% Market Ø: 2% Ströer s Focus Video TOP3 WEB TV with 650m video views (incl. social media) Leading public video network in Europe with 3bn views per month Display/Mobile # 1 German Sales House (>600 exclusive websites access to around 5,000 more in extended network, 35-40% of revenues based on own digital websites) Transactional Leading statistics portal worldwide - Statista Various strong subscription revenue models OoH # 1 marketer in Germany 230,000 advertising faces ~50% market share *Source: Video, Display/Mobile PwC; OOH, Radio, TV, Magazines, Newspaper Zenith OptiMedia/GroupM 5
6 Total Market in EURm Ströer Revenue in EURm Ströer outperformed the total Ad Market & OoH Market Ströer s OoH Market Share beyond 50% Media Market Breakdown Ströer / OoH market OoH / Total market % 46% 44% 46% 50% 4.1% 4.7% 5.6% 5.8% 6.0% CAGR ( ) Total market: - 4% CAGR ( ) Ströer: + 4% 52% 6.3%* Print market share (magazines and newspapers) is constantly declining Out of Home market share is continuously growing, in 2015 exceeds radio advertising spendings for the first time Online overall is still showing massive growth in advertising spendings Total German ad market Ströer Germany OoH spend * % 6% 4% 23% 40% Print TV Radio Cinema Outdoor Internet Source: Nielsen, ZAW, FAW; *2015 is an estimate 6


7 Clear German Market Leader in both Display & Mobile (1/2) Online EURm Mobile 94.5 EURm SDG Media Impact UIM SevenOne Media IP Deutschland ebay Adv. Group Forward Adgroup IQ Yahoo! DT EURm EURm EURm EURm EURm EURm EURm 97.8 EURm EURm SDG Media Impact SevenOne Gruner Forward YOC AG IP Deutschland IQ UIM 33.7 EURm 29.8 EURm 21.2 EURm 20.0 EURm 19.4 EURm 17.1 EURm 13.2 EURm 69.0 EURm 94.4 EURm Source: Nielsen Gross Billings 2015 (Deutschland); WITHOUT Adscale and TubeOne! 7
8 Clear German Market Leader in both Display & Mobile (2/2) STRÖER TOTAL Monthly Net Reach of 83.4%* 44.0 Interactive Media 37.8 United Internet 35.6 Ströer Digital 35.2 Axel Springer 34.9 Pro7Sat Forward AdGroup 33.7 Group 28.3 OMS 28.1 Gruner+Jahr 26.6 muus Portfolio Quality Tech & Data # 1 for both mobile and display (>600 websites) 17 Channels of websites with strongest and most consistent premium portfolio in the market (examples) Market share of roughly 17% of total German Display/Mobile/Video Market** allows full leverage of tech acquisitions Fully developed own tech stack to monetize own and 3 rd party inventory out of one hand: Adserver, DMP, DSP, SSP in integrated ecosystem Continuously improving data depth and quality from sales house, own content assets as well as E-commerce and subscription business * AGOF digital facts ; Basis: Adults, 14+, Unique Users (Online-User); ** Basis: OVK 8
9 AGENDA 01 Ströer #1 in OOH & Digital Ströer s well- diversified product portfolio Focus on highest ad subsegments Ströer outperforming total ad market Clear market leader in Display & Mobile 02 Strategic update From analogue to digital Five key strategic areas New management team Digitisation Content Evolution of media Value Creation Local markets Strategic Roadmap 03 Financials FY 2015 KPIs Cash flow on more detail Exceptionals Adj. EPS P&L in more detail Organic growth explained ROCE M&A Financing costs Segment Digital Transparency Governance 04 Q Financials in more detail P&L Org. growth Ströer Digital Product Segment Digital Ströer OOH Germany Ströer OOH International FCF Financial Status Summary Guidance 9

10 STRATEGIC UPDATE
11 What has changed from analoge to digital Times Digitisation reduces entry barriers for many business models across value chains in all industries Innovative intermediate business can be short-term extremely successful; on the long-run, intermediate businesses are not sustainably successful Companies with vertically integrated value chains push out intermediate business models 11
12 Ströer s Strategic Answer No stand alone intermediate business (e.g. stand alone Adtech companies) Focussing on integrating platforms public, mobile and home screens to become a real digital multi-channel company Focus on extending & integrating vertical value chains 12


13 Five Key Development Areas and Business Segments Building a Digital, Multi-Channel Media Company around Big Data, Digital Content and OoH Infrastructure Out of Home Content Local Markets National Market Ventures digitisation of our infrastructure: LED, LCD, beacons, small cells disruptive, tech and performance based digital business models only nation-wide sales organisation for local marketing & digital ad products building the biggest, data-driven nontelevision media sales house M&A around disruptive, datadriven and digital business models 13


 Integration & further build up of existing content portfolio Strengthening of our")
14 Broadened new Management Team according to Business Segments expansion Board of Management Udo Müller CEO Christian Schmalzl COO Bernd Metzner CFO OoH Local Markets Content National Sales Ventures Alexander Stotz Marc Schmitz Robert Bosch Board of Management Watch out for opportunistic M&A-deals Expansion of Digital Public Advertising Portfolio Accelerating regional/ local business (+100 to 200 sales people p/a) Integration & further build up of existing content portfolio Strengthening of our cross media market position 14


15 Out of Home Digitisation of Out of Home is the basis for integrating public, mobile and home screens. 15


16 On-going, Value-creating Transformation Yesterday: 100% of Revenues with traditional, wet glued OoH Products Today: <10% Revenues with traditional wet glued OoH products 16


 Public Video Mall (>2.")
17 1 st Step to OoH Digitisation: Shopping Malls & Stations Over Video-Displays reaching appr. 30 Mio. People per Month Public Video Station (>1.000 Screens) Supermotion (6 Boards) Public Video Mall (>2.000 Screens) Infoscreen (>300 Screens) 17


18 Ströer is disrupting the German OoH Market in the upcoming 4 Years! up to 1,000 Screens in the coming 4 years up to 2,000 Screens in the coming 7 years 18

19 Content Moving from traditional Broadcasting Portals to fully integrated & interactive Verticals. 19
20 Evolution of Media: The Consumer Perspective MEDIA MODUS 1.0 LEAN BACK MEDIA MODUS 2.0 MOVE FORWARD MEDIA MODUS 3.0 JUMP IN MEDIA MODUS 4.0 ALWAYS ON MEDIA MODUS 5.0 PLUG IN INVOLVEMENT INVOLVEMENT INVOLVEMENT TEMPORARY INVOLVEMENT PERMANENT INVOLVEMENT IMPLANTED Entertainment Attention Profiling Interaction Creation Participation Web of things Always on Web of thoughts Extensions Source: TrendOne 20
21 Reach, Traffic & Stickiness Ströer Value Creation Model for Digital Content Assets Integrating Interactive Services Boosting Reach through Social Traffic & Public Video Traditional Broadcasting Portal 1 Slowly growing Ad Revenues; single Revenue Stream Ad Revenue Optimisation through No 1 Saleshouse on national and local Level & Big Data Impact Niche E-Commerce Subscription Models 4 Monetization & Revenue Diversification 21

 94% of top 50")
 Ecosystem with Ströer Verticals 58% 26% 16% AdSales Search")
22 Strategic Integration and Development of t-online.de Quality Content and Commerce Backbone Leveraging Public Video to boost Portal Traffic #3 -Provider with 8.5m unique active users. 90% of users check their account at least every three days #1 news portal, #1 real-estate/interior portal, #3 sports portal, #3 business portal, #3 entertainment/celebrity portal #4 search provider very close to Yahoo s position in Germany (using Google technology) 94% of top 50 online marketing spenders in Germany have advertised on TOL in 2015 to benefit from the 22m UUs* Revenue & Product Mix today Leveraging Ströer Content Group & Sales Synergies #1 Online Saleshouse Social Traffic (Faceadnet) Ecosystem with Ströer Verticals 58% 26% 16% AdSales Search Shopping Multiscreen- Packaging Tech Stack (Content Fleet) E-Commerce Spin-offs * Source: AGOF, Nielsen 22


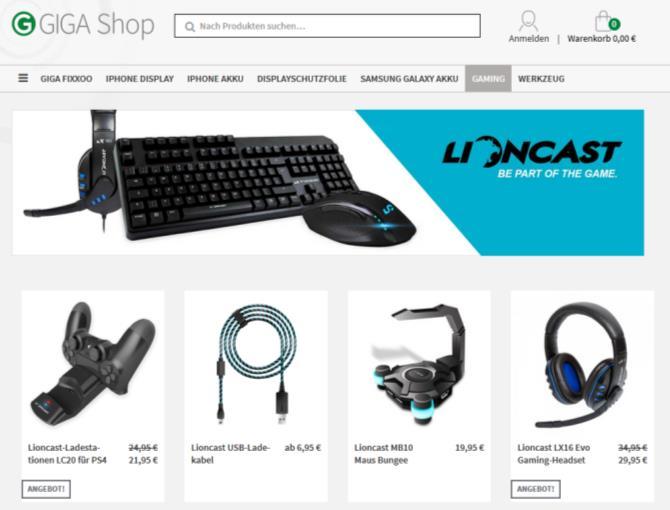


23 Diversification of Revenues beyond Advertising: Example GIGA Gaming Accessories Mobile Phone Accessories 23

24 Women & Lifestyle Vertical: Full Value Chain Integration From Traditional Broadcasting Portals to Interactive Digital Communities 1 Our Success Model: Reach & Data out of one Hand 2 Vertical integration alongside the digital Value Chain 3 24


25 ADVERTSISING SALES, PRODUCT & DATA MANAGEMENT Tech Stack & DMP Segment Digital : Overall Structure & Units National Digital Sales House News & Services Tech & Games Public Video Entertainment Women & Lifestyle CONTENT & TRAFFIC MANAGEMENT Local Digital Products & Services TRANSACTION & SUBSCRIPTION 25

26 Local Markets Integration of Platforms and Value Chains to massively expand Business with SMBs. 26
27 360 Integrated Online Marketing Suite for local SMBs RegioHelden Product Range Topseller: RegioHelden Marketing System Directory Management & Google My Business + Marketing Website + Google AdWords +SEO / Display ads Invest 29/month/POS 89/month/POS from 500/month/POS from 800/month/POS 27
28 Broadening Local Digital Product Portfolio: RegioHelden and Omnea Development of headcount and order book 1 Out-of-Home only + Digital Sales Orders Digital Sales OOH Sales Marketing Services for SMBs Visibility Active management of shop presence in directories, local portals, apps, maps and navigation systems Performance Creation of marketing websites, Google adwords, display performance and SEO services Branding Campaigns In EURm, end of year Active management of locally targeted display, mobile and video Campaigns via the number 1 saleshouse inventory 28
29 Strategic Roadmap: Well ahead of our Transformation Plans! % Non-Digital 2020 All Digital 100% OoH Infrastructure 50% OoH Infrastructure 50% Services 100% Advertising 50% Advertising 50% Transaction 29

30 Strategic Roadmap: Well ahead of our Transformation Plans! % Non-Digital % Non-Digital 50% Digital 2020 All Digital 100% OoH Infrastructure 60% OoH Infrastructure 40% Services 50% OoH Infrastructure 50% Services 100% Advertising 85% Advertising 15% Transaction 50% Advertising 50% Transaction 30
31 AGENDA 01 Ströer #1 in OOH & Digital Ströer s well- diversified product portfolio Focus on highest ad subsegments Ströer outperforming total ad market Clear market leader in Display & Mobile 02 Strategic update From analogue to digital Five key strategic areas New management team Digitisation Content Evolution of media Value Creation Local markets Strategic Roadmap 03 Financials FY 2015 KPIs Cash flow on more detail Exceptionals Adj. EPS P&L in more detail Organic growth explained ROCE M&A Financing costs Segment Digital Transparency Governance 04 Q Financials in more detail P&L Org. growth Ströer Digital Product Segment Digital Ströer OOH Germany Ströer OOH International FCF Financial Status Summary Guidance 31

32 FINANCIALS
33 Steering the Ströer Group Key Performance Indicators In 2015, all Key Performance Indicators of Ströer Group performed well ROCE 15.4% Organic Revenue Growth 9.8% Key Performance Indicators of Free Cash Flow before M&A EURm Ströer Operational EBITDA EURm Financial Leverage
34 Strong Cashflow Development CAGR : Free Cash Flow > 100% EURm 35EURm 78 EURm EURm Operating cash flow Investing cash flow (without M&A) Free cash flow before M&A 34
35 Free Cash Flow Perspective 2015 & Outlook 2016 Free Cash Flow 2015 EURm % Outlook 2016 Op. EBITDA % - Interest (paid) % - Tax (paid) % -/+ WC % - Others % Operational EBITDA of more than 280 EURm Further optimisation of financing structure Low level and positive effects of previous years Lower working capital contribution Stable development of exceptionals Operating Cash Flow % Investments % Investments in digitalization (OOH & Digital) ~ 100 EURm Free Cash Flow (before M&A) % FCF > 135 EURm 35
36 Exceptionals 2015 Conversion into KGaA ~ 1 EURm Acquisition of TOL / IAM ~ 5 EURm Other M&A (OMS, Regiohelden etc.) ~ 2 EURm Integration / Restructuring ~ 6 EURm Others ~ 1 EURm TOTAL ~ 15 EURm 36
37 Adjusted Earnings per Share almost tripled since 2013 Net Adjusted Income & Adjusted Earnings per Share ( ) Aspects ,50 2,00 1,50 1,00 0,50 Strong underlying operational performance leads to strong bottom line increase Value accretive acquisitions for shareholders Financial expenses significantly reduced Adjusted Earnings per Share calculated on the Weighted Average of Shares outstanding ~ 50m in EURm ,00 Net Adjusted Income Adjusted Earnings per Share 37
38 P&L view in more detail & Outlook 2016 EURm FY 2015 % FY 2016e Revenues (reported) (1) % Adjustments (IFRS 11) % Revenues (Management View) % Operational EBITDA % Exceptionals % IFRS 11 adjustment % EBITDA % Depreciation & Amortisation % EBIT % Financial result % Tax result % Net Income 59.5 > + 100% Adjustment (2) % Net income (adjusted) % Revenue growth mid to high single digit organic growth Operational EBITDA of more than 280 EURm stable Increase in D&A base on larger consolidation scope Futher optimisation of financing structure Stable tax result > 150 EURm (1) According to IFRS (2) Adjustment for exceptional items (+15.2 EURm)), amortization of acquired advertising concessions&impairment losses on intangible assets ( EURm), Tax Adjustment (-8.7 EURm) 38
39 Strong organic growth e Organic growth trend over the years 2016e: mid to high single digit % % +9.8%* +3.5% -4.0% OOH Germany - mid single digit - on national level: driven by higher utilization rates and pricing - on regional level: better penetration Digital (~10%) - strong performance of proprietary assets (Content Group) - growth among all product groups (Display, Video, Transactional) OOH International - low single digit - Strong market presence in Turkey - Poland catching up beyond the trough *change of calculation method in
40 Reported Organic Growth 2015 ( Accountability Concept) - Group In EURm Organic growth 9.8% 74,9 837, Revenues reported 2014 IFRS 11 Revenues Operations 4 / (management view) Discontinued Disposals Acquisitions Revenues 2014 adjusted FX Organic Revenues 2015 (management view) IFRS 11 Revenues reported
41 Organic Growth 2015 ( Lagging behind Approach) Group In EURm Organic growth 8.4% Revenues reported 2014 IFRS 11 Revenues (management view) Organic Acquisitions/ FX Revenues disposals 2015 (management view) IFRS 11 Revenues reported
42 Reported Organic Growth 2015 ( Accountability Concept) Segment Digital In EURm Organic growth 23.5% Revenues 2014 Discontinued Operations / Disposals Acquisitions Revenues 2014 adjusted Organic* Revenues FX 42
43 Organic Growth 2015 ( Lagging behind Approach) Segment Digital In EURm Organic growth 20.2% Revenues 2014 Acquisitions/ Disposals FX Organic FY 2015*
44 Stable ROCE in 2016 expected ROCE Development over Time Aspects Adjusted EBIT EURm , e Capital Employed EURm ~ ~ 1,1-1,2 EURbn : % ROCE ~15.4% EBIT Adjustments: - exceptional items - amortization of acquired advertising concessions (PPA effect) Increasing Adjusted EBIT in line with strong operational performance Capital Employed arithmetic average of total assets less noninterest-bearing responsibilities Increasing Capital employed due to investments and acquisitions Stable ROCE in 2016 expected , ,7 714, e e 44
45 Significant Increase of Capital Employed due to M&A Composition (EURm) End of 2014 End of 2015 M&A 2015 Goodwill Purchase Price Instangible fixed assets Non-Controlling Interest 1.2 PPE Non-current financial assets 1 2 Net Assets acquired 83.8 Goodwill Non-current assets & liabilities Total Capital employed * xxx 45
46 Value accretive Acquisitions since 2013 to 2015 Total acquisition spend ~ 580 EURm since 2013 Aspects 60% 40% With these acquisitions we generate in 2016 more than 420 EUR turnover Organic growth prospects of around 5-10% EBITDA-Multiple for these transactions around 7 times EBITDA on average Purchase Price for all of the 40 acquisitions around 580m EUR Not yet all synergies are captured in forecasts More than 60% of the purchase price is limited to the acquisition of T-online / IAM 46
47 Reduction of Financing costs continues April 2016 Issue of Debenture planned Planned timetable Refinancing of Term Loan Amount of more than 150 EURm Cost Savings (around 1 EURm per year) No covenants Slim and efficient process Start of Marketing 20th April TelCo investors 4th May Order book closed end of May Signing contract beginning June Valuta mid of June In EURm
 50% of revenue Video (Multiscreen) 20% of revenue Transaction &")
 via display advertising Strong German No.")


48 Segment Digital : Revenue Streams & reported Products (2016e) Display (Desktop & Mobile) 50% of revenue Video (Multiscreen) 20% of revenue Transaction & Subscription 30% of revenue Monetisation of digital traffic (both mobile and desktop) via display advertising Strong German No.1 position with exclusive 3rd party inventory as well as own assets (~ 40%) To agencies, direct clients, SMBs Monetisation of video views across home/desktop, mobile and public screens Dedicated video specialists for own assets as well as sales house and product/tech development To agencies, direct clients, SMBs Monetization of traffic of own assets via affiliate and performance marketing offers Own e-commerce models and shopping concepts integrated in content verticals Dedicated subscription models 48
49 Transparency 1 Detailed first response to the unjustified allegations of Muddy Waters 22nd April 2 Questions were raised in the course of the last couple of days: Q: Is Permodo a related party transaction? A: No Q: Is Statista related party transaction? A: No Q: Explain me about the 0.2 EURm evidero deal? A: No related party transaction Q: Revenues due to Media for Equity Transactions? A: No Q: What was about the Ballroom Group 2014? A: We cleaned it up 49
50 Development of Supervisory Board by TOL/IAM 11/2015: Acquisition of TOL 9/2015: Kick off: change of Ströer s legal form Ströer SE Ströer SE 3/2016: Official change of Ströer s legal form Late March/2016: Implementation of status proceedings Vilanek (V) Voigt Ströer Vilanek (V) Voigt Vento Bosch Ströer SE & Co KGaA Ströer SE & Co KGaA Ströer SE & Co KGaA Ströer SE & Co KGaA Vilanek (V) Voigt Ströer Flemmerer Diederichs Remagen Vilanek (V) Voigt Ströer Flemmerer Diederichs Remagen Vilanek (V) Voigt Ströer Flemmerer Vento Bosch Bronder Vilanek (V) Voigt Ströer Flemmerer Vento Bosch Bronder N.N N.N N.N N.N N.N. N.N. Ströer Mnmnt SE Ströer Mnmnt SE Ströer Mnmnt SE Ströer Mnmnt SE Employees Vilanek (V) Voigt Ströer Vilanek (V) Voigt Ströer Vilanek (V) Voigt Ströer Diederichs Vento Bosch Hagspihl Vilanek (V) Voigt Ströer Diederichs Vento Bosch Hagspihl 50
51 AGENDA 01 Ströer #1 in OOH & Digital Ströer s well- diversified product portfolio Focus on highest ad subsegments Ströer outperforming total ad market Clear market leader in Display & Mobile 02 Strategic update From analogue to digital Five key strategic areas New management team Digitisation Content Evolution of media Value Creation Local markets Strategic Roadmap 03 Financials FY 2015 KPIs Cash flow on more detail Exceptionals Adj. EPS P&L in more detail Organic growth explained ROCE M&A Financing costs Segment Digital Transparency Governance 04 Q Financials in more detail P&L Org. growth Ströer Digital Product Segment Digital Ströer OOH Germany Ströer OOH International FCF Financial Status Summary Guidance 51
52 Profit and Loss Statement Q EURm Q Q % Analysis Revenues (reported) (1) % Expansion driven by 11% organic growth and M&A Adjustments (IFRS 11) % Revenues (Management View) % Operational EBITDA % On track to deliver > 280 EURm for the FY 2016 Exceptionals > 2 x Higher Exceptionals than expected IFRS 11 adjustment % EBITDA % Depreciation & Amortisation % Increase in D&A base on larger consolidation scope EBIT n.d Financial result % Futher optimisation of financing structure Tax result n.d Net Income n.d Adjustment (2) ~ 2 x Higher adjustment due to PPA-amoritization Net income (adjusted) > 4 x On track to deliver > 150 EURm for the FY 2016 (1) According to IFRS (2) Adjustment for exceptional items (+5.4 EURm), amortization of acquired advertising concessions&impairment losses on intangible assets ( EURm), Tax Adjustment (-2.4 EURm) 52
53 Reported Organic Growth of 11% in Q In EURm e.g. T-Online, Interactive Media, RegioHelden ~ 12 OOH Germany ~ 9 Digital ~ 3 OOH Int Neodau Discontinued Q1 2015* Acquisitions Q FX Organic Q1 2016* adjusted Operations / Disposals *Revenues correspond to management accounting pre IFRS11 53
54 Ströer Digital: Profitable Growth backed by recent Acquisitions Revenues Operational EBITDA EURm EURm +10.0% % Q1 Q1 Digital segment consisting of a balanced portfolio of growth drivers and profitability Revenues and operational EBITDA more than doubled Significant organic growth in both acquired and established digital assets Organic Growth Rate Margin
55 Details on Digital Segment: Product group development Display Video Transactional % MM MM MM % % Q1 Q1 Q Growth rate 55
56 Ströer OoH Germany: Strong start in 2016 Revenues Operational EBITDA EURm EURm +12.6% % Q1 Q1 Strong revenue growth in all product groups Positive revenue momentum backed by Regional sales initiatives and active national sales performance Organic Growth Rate Margin
57 Ströer OoH International: Organic growth and improved profitability Revenues Operational EBITDA EURm EURm EURm +10.1% +5.9% Q1 Q1 Q1 revenues in Turkey organically up in a continuously challenging macro environment blowup business with excellent start in the year Poland with highest growth rate for a first quarter in local currency since many years Organic Growth Rate Margin
58 Free Cash Flow Perspective Q Free Cash Flow 2016 EURm 2015 EURm Analysis Op. EBITDA Interest (paid) Tax (paid) /+ WC Others Strong operational cash generation in line with increased operational EBITDA Further reduced interest payments after successful refinancing in 2014 and 2015 Positive tax effect Higher exceptionals due to M&A and Integration efforts Higher investments due to LED technology, public video, IT-infrastructure and various other projects Operating Cash Flow Investments Free Cash Flow (before M&A)
59 Financial Status and Outlook Improving leverage ratio Financial Status & Outlook Leverage Ratio could be reduced vs PY from 1.9 to ,8 1,6 1,4 1,2 1 0,8 0,6 80 meur M&A cash out in Q increased Leverage Ratio by 0.3 vs Q Free Cashflow before M&A of more than 135 meur in 2016 expected Long term financial outlook M M M M M M ,4 0,2 0 Maintaining a solid financial profile with a target leverage ratio of is a key element of our growth strategy Dividend pay-out ratio: 25 50% Net debt Leverage Ratio Acquisition strategy: smaller/larger bolt-on investments 59
60 AGENDA 01 Ströer #1 in OOH & Digital Ströer s well- diversified product portfolio Focus on highest ad subsegments Ströer outperforming total ad market Clear market leader in Display & Mobile 02 Strategic update From analogue to digital Five key strategic areas New management team Digitisation Content Evolution of media Value Creation Local markets Strategic Roadmap 03 Financials FY 2015 KPIs Cash flow on more detail Exceptionals Adj. EPS P&L in more detail Organic growth explained ROCE M&A Financing costs Segment Digital Transparency Governance 04 Q Financials in more detail P&L Org. growth Ströer Digital Product Segment Digital Ströer OOH Germany Ströer OOH International FCF Financial Status Summary Guidance 60
61 Summary: Excellent Start into 2016 Total revenue growth by 40% Operational EBITDA expanded by 72% to 45.3 EURm Net Income (adjusted) more than quadrupled to 20.1 EURm Free Cashflow more than 14 meur higher than PY 61 Leverage Ratio at 1.4 times operational EBITDA

62 Guidance Statement 2016: Confirmed For 2016 we expect total revenue between 1.1 and 1.2 billion Euro and an operational EBITDA of more than 280 Million Euro istock 62
63 NEXT CATALYSTS: DATES Intense Investors Teach-In in May / June Annual Shareholder Meeting 23 rd June 2016 Quarterly Report to be published on 11 th August

64 Contact: Dafne Sanac Head of Investor Relations T +49 (0) 2236 / E dsanac@stroeer.de Ströer Media SE Ströer-Allee Köln
H Presentation. 11th August 2016 Ströer SE & Co. KGaA
 H1 2016 Presentation 11th August 2016 Ströer SE & Co. KGaA Agenda 01 02 03 04 Key Developments Operational Highlights Financials Summary Key Financials H1 2016 M&A Overview Integration & Synergies Out
Ströer SE & Co. KGaA Oddo Salesforce Briefing. 17 th February 2017
 Ströer SE & Co. KGaA Oddo Salesforce Briefing 17 th February 2017 Ströer Reporting Summary 2016e - Consensus Digital OoH Germany OoH International ~% Ströer SE ~4% ~45% Recon.* Statutory Net Sales 1.117
Ströer SE & Co. KGaA Roadshow Morgan Stanley. 24 th of October 2017 Boston
 Ströer SE & Co. KGaA Roadshow Morgan Stanley 24 th of October 2017 Boston Two Key Business Approaches with a very different Profile LOCAL HEROES vs GLOBAL CHAMPIONS Local market specification know-how
Roadshow Ströer SE Oddo Seydler. Paris, 29 January 2016
 Roadshow Ströer SE Oddo Seydler Paris, 29 January 2016 AGENDA 01 02 03 Introduction Profile FY 2015 Strategic elements Strategic elements OOH Content Local markets National markets Ventures Financials
9M/Q Presentation. 10th November 2016 Ströer SE & Co. KGaA
 9M/Q3 2016 Presentation 10th November 2016 Ströer SE & Co. KGaA Agenda 01 02 03 04 Key Developments Operational Highlights Financials Summary Key Financials Key Strategies M&A Integration Five Development
Ströer SE & Co. KGaA Company Presentation UniCredit and Kepler Cheuvreux Conference GCC 2018, Frankfurt
 Ströer SE & Co. KGaA Company Presentation UniCredit and Kepler Cheuvreux Conference GCC 2018, Frankfurt January 15&16, 2018 Disclaimer This presentation contains forward looking statements regarding Ströer
FY 2013 RESULTS PRESENTATION. March 28, 2014 l Ströer Media AG
 RESULTS PRESENTATION March 28, 2014 l Ströer Media AG Ströer Media AG Results Change Revenues 634.8 560.6 +13.2% Organic growth (1) 3.5% -4.0% Operational EBITDA 118.0 107.0 +10.3% Net income (adjusted)
Q August 10, 2017 Ströer SE & Co. KGaA
 Q2 2017 August 10, 2017 Ströer SE & Co. KGaA Results 6M 2017 MM 6M 2017 6M 2016 Revenues Reported (1) 597.4 502.3 +19% Organic (2) 7.6% 8.7% -1.0%pts Operational EBITDA 135.9 115.4 +18% Operational EBITDA
Q November 10, 2017 Ströer SE & Co. KGaA
 Q3 2017 November 10, 2017 Ströer SE & Co. KGaA INDEX 01 02 03 04 Q3 Results and Strategic Update Operational Excellence Financial Figures Outlook 2 Results 9M 2017 EURm 9M 2017 9M 2016 Revenues Reported
Kepler Cheuvreux. 18 th German Corporate Conference. January 21 st, 2019 Strategic Update
 Kepler Cheuvreux 18 th German Corporate Conference January 21 st, 2019 Strategic Update Ströer Leading digital Multi-Channel Media Company 13,000 employees 1.6 bn sales* #2 in call center ranking More
Continued Growth Ströer Out-of-Home Media AG Investor Presentation Roadshow Stockholm, June
 Continued Growth Ströer Out-of-Home Media AG Investor Presentation Roadshow Stockholm, June 7 2011 1 # 1 in underpenetrated and attractive growth markets #1 in GERMANY Europe s largest ad. market #1 in
Ströer Out-of-Home Media AG: We create Visibility. Investor Presentation Copenhagen January 26, 2011
 Ströer Out-of-Home Media AG: We create Visibility Investor Presentation Copenhagen January 26, 2011 # 1 operator in underpenetrated and very attractive growth markets #1 in GERMANY Europe s largest ad.
Ströer Out-of-Home Media AG. Company Presentation June , Copenhagen
 1 Ströer Out-of-Home Media AG Company Presentation June 28 2012, Copenhagen Underlying market trends supportive of outdoor performance Structural growth fully intact driven by DIGITALISATION Structural
Unilever Investor Event 2017 Graeme Pitkethly 29 th November 2017
 Unilever Investor Event 2017 Graeme Pitkethly 29 th November 2017 What you have heard so far Driving growth in each Category Fuelling growth and margin expansion Personal Care Home Care Foods & Refreshment
REINVENTING MARKETING ALL ABOUT VELTI FOR THE MOBILE ERA. The Velti Investor Presentation MARCH 2013
 ALL ABOUT VELTI REINVENTING MARKETING FOR THE MOBILE ERA The Velti Investor Presentation MARCH 2013 SAFE HARBOR STATEMENT MARCH 2013 This presentation contains forward-looking information about the Company
FY 2011: Building the future of outdoor Ströer Out-of-Home Media AG Investor Presentation Roadshow Frankfurt, 30 th March 2012
 1 FY 2011: Building the future of outdoor Ströer Out-of-Home Media AG Investor Presentation Roadshow Frankfurt, 30 th March 2012 Ströer highlights 2011 Solid increase of revenue (+8.6%) and Operational
Mitchell Communication Group
 Mitchell Communication Group Presentation to ASX Small to Mid Caps Conference, Singapore 27 May 2010 Presented by: Luke Littlefield - Chief Operating Officer nothing is beyond our reach. Agenda Company
Alma Media Q3/2018 Kai Telanne, President and CEO Juha Nuutinen, CFO
 Alma Media Q3/2018 Kai Telanne, President and CEO Juha Nuutinen, CFO 25.10.2018 1 Agenda Performance highlights Advertising market development Business development by unit Financial position Strategy and
FUTURE PLC 2018 H1 RESULTS. 17th May 2018
 FUTURE PLC 2018 H1 RESULTS 17th May 2018 2 Executive summary Another strong set of results Group revenue up 25% year-on-year Driven by underlying organic growth particularly in the Media division and contributions
Positive signs in net sales and good progress in product development. Tradedoubler. Interim report January June 2015 Stockholm, 23 July 2015
 Positive signs in net sales and good progress in product development Tradedoubler Interim report January June 2015 Stockholm, 23 July 2015 Agenda Tradedoubler in brief A European Performance Marketing
Fiscal Year 2014 & Outlook 2015
 Fiscal Year 2014 & Outlook 2015 Agenda Ralph Dommermuth Company development 2014 Outlook 2015 Norbert Lang Results 2014 2 Fiscal Year 2014 & Outlook 2015 Frankfurt/Main, 26 March 2015 2009 Company development
Cxense Quarterly Presentation 2014-Q Oslo, Norway
 Cxense Quarterly Presentation 2014-Q3 2014-11-19 Oslo, Norway Important notice THIS PRESENTATION AND ITS ENCLOSURES AND APPENDICES (HEREINAFTER JOINTLY REFERRED TO AS THE PRESENTATION ) HAVE BEEN PREPARED
Dentsu 2017 and Beyond -Innovation Reinvention-
 Dentsu 2017 and Beyond -Innovation Reinvention- This document contains forward-looking statements regarding the intent, belief or current expectations of the management of Dentsu Inc. with respect to the
2016 half year results August 10 th 2016
 2016 half year results August 10 th 2016 HALF YEAR RESULTS 2016 1 Certain statements in this document are forward looking statements. These forward looking statements speak only as at the date of this
Monetising Online and Mobile Traffic. March 2016
 Monetising Online and Mobile Traffic March 2016 1 Disclaimer THIS PRESENTATION (THE PRESENTATION ) WHICH HAS BEEN PREPARED BY XLMEDIA PLC. (THE COMPANY) IS FOR INFORMATION PURPOSES ONLY AND DOES NOT CONSTITUTE
Capital Markets Day December 6, PILLAR 3: COMMERCE NCG NUCOM GROUP Claas van Delden
 Capital Markets Day December 6, 2017 PILLAR 3: COMMERCE NCG NUCOM GROUP Claas van Delden VALUE OUR JOURNEY FROM MEDIA INVESTMENTS TO OMNICHANNEL GROWTH PLATFORM GROWTH PLATFORM Selected examples Utilize
Fyber N.V. Deutsches Eigenkapitalforum Ziv Elul, CEO 26 November 2018
 Fyber N.V. Deutsches Eigenkapitalforum 2018 Ziv Elul, CEO 26 November 2018 Agenda 01 02 03 04 Market Update Fyber at a Glance Growth Strategy & Perspectives Financials & Outlook - Page 3 - - Page 6 - -
Tradedoubler. Interim report January March May 2015
 Tradedoubler Interim report January March 2015 5 May 2015 Agenda Tradedoubler in brief Confidence and opportunity in a rapidly changing world A European Performance Marketing leader We drive online sales
RNTS MEDIA. DVFA Spring Conference May 2017
 RNTS MEDIA DVFA Spring Conference May 2017 AGENDA 01 02 03 THE COMPANY & LATEST NEWS THE OPPORTUNITY FINANCIALS & OUTLOOK 2 01 THE COMPANY DIGITAL ADVERTISING TECHNOLOGY PROVIDER NEUTRAL SUPPLY-SIDE POWERHOUSE
Thiel Logistik AG Investor Meetings Frankfurt August 31, 2007
 Thiel Logistik AG Investor Meetings Frankfurt August 31, 2007 Agenda Market and Business Profile New Management Structure Financial Review and Outlook Half-Year Results 2007 1 Company Profile Business:
Q4 and Fiscal Year 2018 Financial Results. Investor Presentation February 2019
 Q4 and Fiscal Year 2018 Financial Results Investor Presentation February 2019 Safe harbor statement This presentation contains forward-looking statements that are based on our management s beliefs and
Preliminary Results January September 2014
 Creating the Leading Digital Telco Preliminary Results January September 2014 November 10, 2014 Disclaimer This document contains statements that constitute forward-looking statements and expectations
SIMPLIFY OPERATIONS, SPEND SMARTER. May 2018
 SIMPLIFY OPERATIONS, SPEND SMARTER May 2018 IMPORTANT NOTICE The following information contains, or may be deemed to contain, forward-looking statements. These statements relate to future events or future
Second Quarter and Half Year 2016 Results. Wednesday, July 20, 2016
 Second Quarter and Half Year 2016 Results Wednesday, July 20, 2016 Safe Harbor Statement Any statements contained in this document that are not historical facts are forward-looking statements as defined
TXT e-solutions. Corporate Presentation March 2015
 TXT e-solutions Corporate Presentation March 2015 2014: Another year of Growth Revenues: 55.9 m (+6.3%), 57% from Int l Operations EBIT: 5.5 m (+10%) Cash Flow from Op. 9.3% of Revenues NFP: 8.5m (+ Treasury
Health Care Worldwide. Crédit Suisse Global Credit Products Conference October 1, Barcelona
 Health Care Worldwide Crédit Suisse Global Credit Products Conference October 1, 2015 - Barcelona Safe Harbor Statement This presentation contains forward-looking statements that are subject to various
Investor Relations Presentation. September 2014
 Investor Relations Presentation September 2014 Forward Looking Statements This presentation contains historical information and forward-looking statements within the meaning of The Private Securities Litigation
Avery Dennison Investor Presentation August 2014
 Avery Dennison Investor Presentation August 2014 Unless otherwise indicated, the discussion of the company s results is focused on its continuing operations, and comparisons are to the same period in the
+ 3.1bn bn bn bn. Organic revenue ( m) 8,371 7,820 7,377 7,018 6,627 6,496 5,854 5,275 4,908 4,504 4,111 3,810
 8,371 7,820 7,377 7,018 6,627 6,496 5,854 5,275 4,908 4,504 4,111 3,810") Jeremy Darroch This document contains certain forward looking statements with respect to the Group s financial condition, results of operations and business, and our strategy, plans and objectives for
Jeremy Darroch This document contains certain forward looking statements with respect to the Group s financial condition, results of operations and business, and our strategy, plans and objectives for
Thiel Logistik AG June 19, 2007
 Thiel Logistik AG June 19, 2007 Agenda Company Overview New Management Structure Financial Review and Outlook 1 Company Profile Business: As an external partner, Thiel Logistik AG, develops holistic logistics
The power of television
 The power of television Capital Markets Day October 13, 2016 Red Arrow Jan Frouman We engage audiences worldwide 2 We are raising our 2018 target by EUR 100m [in EUR m] Revenue target 303 +31% CAGR 370
The power of television
 The power of television Capital Markets Day October 13, 2016 Digital Entertainment Christof Wahl Agenda I Digital Entertainment at a glance II Growth strategy III Summary & outlook 2 We executed a technology
PUBLICIS TO ACQUIRE EPSILON. 15 April 2019
 PUBLICIS TO ACQUIRE EPSILON 15 April 2019 DISCLAIMER Certain information contained in this document, other than historical information, may constitute forward-looking statements or unaudited financial
ADLER Modemärkte Equity Story
 ADLER Modemärkte Equity Story November 2017 1 Investment Summary: ADLER Modemärkte is well positioned to face short-term challenges and lift mid- to long-term potentials Growing target group Assets Very
Thiel Logistik AG Company Presentation Sebastian Esser, Director Finance. European Small & MidCap Conference, London / May 23, 2007
 Thiel Logistik AG Company Presentation Sebastian Esser, Director Finance European Small & MidCap Conference, London / May 23, 2007 Agenda Company Overview New Management Structure Financial Review and
2011 THIRD-QUARTER EARNINGS
 2011 THIRD-QUARTER EARNINGS Paris, November 14th, 2011-8:00 am CET Board of Directors meeting on November 10th, 2011 Revenues: 54.5 million euros, down 20% compared with the third quarter of 2010, linked
KBC Securities London. December 2013
 KBC Securities London December 2013 Disclaimer This presentation is not an offer or solicitation of an offer to buy or sell securities. It is furnished to you solely for your information and use at this
A Leading Global Health Care Group
 A Leading Global Health Care Group Roadshow Copenhagen October 6, 2015 For detailed financial information please see our annual/quarterly reports and/or conference call materials on www.fresenius.com/ir.
PERFORMANCE MARKETING
 September 2016 Technology based PERFORMANCE MARKETING DISCLAIMER THIS PRESENTATION (THE PRESENTATION ) WHICH HAS BEEN PREPARED BY XLMEDIA PLC. (THE COMPANY) IS FOR INFORMATION PURPOSES ONLY AND DOES NOT
Viewing the Future On the Way to become a Television and Digital Entertainment Powerhouse by 2015
 Capital Markets Day ProSiebenSat.1 Media AG Viewing the Future On the Way to become a Television and Digital Entertainment Powerhouse by 2015 Thomas Ebeling, October 5, 2011 Keynote Page 1 An attractive
Investor Presentation. February 2017
 Investor Presentation February 2017 Safe Harbor Statement This presentation contains forward-looking statements that are based on our management s beliefs and assumptions and on information currently available
Wirecard AG Results 1 st quarter of fiscal 2013 Investor Presentation
 Wirecard AG Results 1 st quarter of fiscal 2013 Investor Presentation Aschheim, May 16 2013 2013 Wirecard AG 1 Content 1. Key Figures / Highlights 1st quarter of fiscal 2013 2. Products and Solutions 3.
Seven West Media. 1HFY17 Results Presentation
 Seven West Media 1HFY17 Results Presentation 1 Disclaimer Basis of Preparation of Slides Data included in this presentation is prepared for the management of Seven West Media Limited and its associated
Draft 14 09/02/17 1 INDEPENDENT. ALWAYS.
 Draft 14 09/02/17 1 INDEPENDENT. ALWAYS. SUMMARY INFORMATION This presentation contains summary information about Fairfax Media Limited and its activities current as at 22 February 2017. The information
Internet Advertising: Current and Future Trends 2018 Mobile World Congress Shanghai
 Internet Advertising: Current and Future Trends 2018 Mobile World Congress Shanghai Agenda 1. Overview: Global E&M macro trends 2. Internet advertising 3. Programmatic advertising 4. Use of agency PwC
HSBC S 13TH EQUITY CONFERENCE
 HSBC S 13TH EQUITY CONFERENCE Bernhard Wolf, Head Investor Relations Paris, April 1, 2015 GfK 2015 HSBC April 1, 2015 1 Making research matter we deliver for 80 years GfK 2015 HSBC April 1, 2015 2 GfK
Future of advertising sales
 Future of advertising sales Arndt C. Groth, CEO, PubliGroupe Dreikönigstagung, 8 January 2013 Consumer in driving position «In a few hundred years, when the history of our time is written from a long-term
Dentsu Inc. H1 FY2018 Consolidated Financial Results
 August 9, 2018 Dentsu Inc. H1 FY2018 Consolidated Financial Results (The first half ended June 30, 2018 reported on an IFRS basis) Note: - IFRS 15 Revenue from Contracts with Customers is applied from
Second Quarter and Half Year 2018 Financial Highlights. Walldorf, Germany Thursday, July 19, 2018
 Second Quarter and Half Year 2018 Financial Highlights Walldorf, Germany Thursday, July 19, 2018 Safe Harbor Statement Any statements contained in this document that are not historical facts are forward-looking
Thales further strengthens its digital leadership thanks to the acquisition of Guavus 28 April 2017
 Thales further strengthens its digital leadership thanks to the acquisition of Guavus 28 April 2017 www.thalesgroup.com Digital transformation: a key growth opportunity for Thales Building a growing, more
Introduction Sarah Bowman Investor Relations. Strategy and Business update Andreas Andreades CEO. Acquisition Update Max Chuard Director, M&A and IR
 Financial Results & Business Update Quarter ended 31 March 2011 Disclaimer Any remarks that we may make about future expectations, plans and prospects for the company constitute forward-looking statements.
Third quarter and first nine months 2017 Results Release. October 19 th, 2017
 Third quarter and first nine months 2017 Results Release October 19 th, 2017 Safe harbor statement Any statements contained in this document that are not historical facts are forward-looking statements
Sidoti & Company Spring 2018 Conference. Greg Woods, President and CEO David S. Smith, CFO March 29, 2018
 Sidoti & Company Spring 2018 Conference Greg Woods, President and CEO David S. Smith, CFO March 29, 2018 Forward-looking Statements Information included in this presentation may contain forward-looking
Tradedoubler. Interim report January-September 2015 Stockholm, 12 November 2015
 Tradedoubler Interim report January-September 2015 Stockholm, 12 November 2015 1 CEO comment In the third quarter we saw good financial results in some markets while others were more challenging. We are
March Technology driven PERFORMANCE MARKETING
 March 2017 Technology driven PERFORMANCE MARKETING DISCLAIMER THIS PRESENTATION (THE PRESENTATION ) WHICH HAS BEEN PREPARED BY XLMEDIA PLC. (THE COMPANY) IS FOR INFORMATION PURPOSES ONLY AND DOES NOT CONSTITUTE
Investor Presentation
 HÜRRİYET GAZETECILIK ve MATBAACILIK A.Ş. Investor Presentation Q3 2017 November 10, 2017 NOTICE This presentation does not constitute an offer or invitation to purchase or subscription for any securities
Digital Globe Services, Ltd. HY Results
 Digital Globe Services, Ltd. HY1 2014 Results March, 2014 Agenda Business Overview 3 Operational Highlights 11 Financial Review 12 Business Development 16 Outlook 19 Jeff Cox - Founder & CEO Jeff Cox has
Full Year Results Presentation
 Full Year Results Presentation for the full year ended 30 June 2007 Paul Moore, Chief Executive Officer Stephen Audsley, Chief Financial Officer 21 August 2007 Agenda FY2007 performance highlights Strategy
Q Financial Results. Investor Presentation October 2018
 Q3 2018 Financial Results Investor Presentation October 2018 Safe harbor statement This presentation contains forward-looking statements that are based on our management s beliefs and assumptions and on
Half-year figures 2017
 1 Half-year figures 2017 Beter Bed Holding N.V. 30 August 2017 1 2 Agenda Financials Objectives and strategy Formats Outlook 2 3 Revenue per quarter Eur x 1.000 3 4 EBITDA per half-year Eur x 1.000 4 5
Fresenius Investor News
 health care worldwide August 3, 2006 Contact: Birgit Grund Fresenius AG Investor Relations Tel. ++49-6172 - 608 2485 Fax ++49-6172 - 608 2488 e-mail: ir-fre@fresenius.de Internet: www.fresenius-ag.com
The Warehouse Group Limited 2016 Interim Result
 The Warehouse Group Limited 2016 Interim Result Friday, 11 March 2016 Chairman s Introduction A strong first half profit performance, the result of favourable trading conditions, a focus on returning to
Investor & Analyst Presentation 9M Report Dr. Cornelius Patt, CEO November 15 th, 2017
 Investor & Analyst Presentation 9M Report 2017 Dr. Cornelius Patt, CEO November 15 th, 2017 Safe Harbor Statement This document includes supplemental financial measures that are or may be non-gaap financial
A Leading Global Health Care Group
 A Leading Global Health Care Group Roadshow Benelux June 29/30, 2015 For detailed financial information please see our annual/quarterly reports and/or conference call materials on www.fresenius.com/ir.
Corporate Presentation. August 2010
 Corporate Presentation August 2010 Network18 - India s Fastest Growing Media Conglomerate One of India s leading professionally owned and run media conglomerates Operate the country s leading brands in
CONFERENCE CALL 2015 RESULTS. Frankfurt stock exchange (DAX30): FRE US ADR program (OTC): FSNUY
: FRE US ADR program (OTC): FSNUY") CONFERENCE CALL 205 RESULTS Frankfurt stock exchange (DAX30): FRE US ADR program (OTC): FSNUY www.fresenius.com/investors SAFE HARBOR STATEMENT This presentation contains forward-looking statements that
CONFERENCE CALL 205 RESULTS Frankfurt stock exchange (DAX30): FRE US ADR program (OTC): FSNUY www.fresenius.com/investors SAFE HARBOR STATEMENT This presentation contains forward-looking statements that
Delivering Content Across Multiple Media Platforms
 Delivering Content Across Multiple Media Platforms Citibank 17 th Annual Global Entertainment, Media and Telecommunications Conference January 9, 2007 Safe Harbor This presentation and management s public
Thomas Ebeling, CEO Axel Salzmann, CFO November 11, 2010
 21 Thomas Ebeling, CEO Axel Salzmann, CFO November 11, 21 At a glance Thomas Ebeling, CEO 2 Highlights Q3 21 1. We continued our earnings growth due to higher revenues and sustained cost management 2.
CISCO SYSTEMS, INC. Q4 FY 2004 CONFERENCE CALL
 CISCO SYSTEMS, INC. Q4 FY 2004 CONFERENCE CALL August 10, 2004 2004, Cisco Systems, Inc. All rights reserved. 1 GAAP Reconciliation and Forward-Looking Statements GAAP RECONCILIATION During this presentation
home24 Earnings Presentation Q September 2018
 home24 Earnings Presentation Q2-18 12 September 2018 0 Today s agenda 1 Vision & Highlights 2 Q2 Financial Update 3 Outlook and Q&A 1 1 Vision & Highlights 2 Our vision: to offer the best value and an
Servelec FY 2015 results
 Servelec FY 2015 results Alan Stubbs, Chief Executive Officer Mike Cane, Chief Financial Officer 1 Servelec Group Overview Central services 41 employees HQ: Sheffield Health & Social Care 255 employees
Singtel: Asia s Leading Commuications Group. Credit Suisse Asian Investment Conference March 2018
 Singtel: Asia s Leading Commuications Group Credit Suisse Asian Investment Conference 20-21 March 2018 Forward looking statement Important note The following presentation contains forward looking statements
2017 Half Year Results. 28 September 2017
 2017 Half Year Results 28 September 2017 Disclaimer Restricted distribution This presentation is not for release, publication or distribution, in whole or in part, directly or indirectly, in, into or from
Avnet Presentation Raymond James 38 th Annual Institutional Investors Conference
 William Amelio, Chief Executive Officer Vincent Keenan, Senior VP of Investor Relations March 7, 2017 Avnet Presentation Raymond James 38 th Annual Institutional Investors Conference 1 Safe Harbor Statement
HT MEDIA GROUP Q2 FY Consolidated Financial Results
 HT MEDIA GROUP Q2 FY 2017-18 Consolidated Financial Results 1 Cautionary Statements Certain statements in this presentation may be forward-looking statements. Such forward looking statements are subject
THE GLOBAL EXCHANGE FOR ADVERTISING
 THE GLOBAL EXCHANGE FOR ADVERTISING JANUARY 2018 0 COPYRIGHT RUBICON PROJECT 2018 SAFE HARBOR Forward-Looking Statements This presentation may include, forward-looking statements, including statements
HGL Limited. For personal use only. Annual General Meeting 16 February Computershare Offices 60 Carrington Street, Sydney
 HGL Limited Annual General Meeting 16 February 2017 Computershare Offices 60 Carrington Street, Sydney CEO Presentation Henrik Thorup 16 February 2017 AGENDA CORPORATE HIGHLIGHTS GPS STRATEGY PLAN FY16
Q1 FY2015 Operating Results
 Q1 FY2015 Operating Results August 7, 2015 DeNA Co., Ltd. 1. Financial Results 2. Strategy and Initiatives 3. Guidance 4. Reference 1 Q1 FY2015 Consolidated Financial Results Both revenue and operating
Nomura Media Summit 2015 New York
 Nomura Media Summit 2015 New York May 27, 2015 Robert Horler CEO Dentsu Aegis Network US Innovating The Way Brands Are Built Agenda Dentsu Group overview & 2014 results highlights Global market context
Full year 2014 results
 Listen-only live audio webcast available from www.gemalto.com/investors Full year 2014 results March 5, 2015 Olivier Piou, CEO Jacques Tierny, CFO Disclaimer This communication does not constitute an offer
Opera Software: Third quarter 2012
 Opera Software: Third quarter 2012 3Q 2012 Financial highlights Financial metric 3Q12 (MUSD) 3Q11 (MUSD) Revenue Total revenue 56.4 40.1 Profitability Adj. EBITDA*/** 17.0 13.6 EBIT** 13.7 11.0 Revenue
PIONEERS IN BRINGING TRUE CONVERGENCE TO NORDIC CUSTOMERS. 20 July, 2018
 PIONEERS IN BRINGING TRUE CONVERGENCE TO NORDIC CUSTOMERS 20 July, 2018 TRANSACTION SUMMARY STRATEGIC RATIONAL VALUE FINANCIAL EFFECTS BALANCE SHEET IMPACT By combining Bonnier Broadcasting s competence
Telefónica Czech Republic
 Telefónica Czech Republic Quarterly Results January December 2013 26 th February 2014 CAUTIONARY STATEMENT Any forward-looking statements concerning future economic and financial performance of Telefónica
Analyst Presentation. First Quarter 2013 ADLER
 Analyst Presentation First Quarter 2013 1 2 Highlights Steilmann Group 3 Financials 4 Outlook 2013 2 Highlights Q1 2013 Revenue and Profitability Revenue of 104.4 mio. Gross profit margin increase of 2.9
For personal use only MOBILE EMBRACE ASX: MBE. FY 2016 Results. Chris Thorpe, CEO REACH ENGAGE TRANSACT EMBRACE 1
 MOBILE EMBRACE ASX: MBE FY 2016 Results Chris Thorpe, CEO 1 TABLE OF CONTENTS 2016 FY RESULTS 1. PROVEN, PROFITABLE, GROWING: 2016 FY RESULTS 2. WHO WE ARE p 5-13 p 14-23 3. SET UP FOR SUCCESS p 24-28
Fresenius Investor News
 health care worldwide October 31, 2006 Contact: Birgit Grund Fresenius AG Investor Relations Tel. ++49-6172 - 608 2485 Fax ++49-6172 - 608 2488 e-mail: ir-fre@fresenius.de Internet: www.fresenius-ag.com
AIM INVESTOR DAY. III Edizione. Palazzo Mezzanotte 14 aprile 2016
 AIM INVESTOR DAY III Edizione Palazzo Mezzanotte 14 aprile 2016 MOBILE MARKETING PERFORMANCE SOCIAL MOBILE DMP Nov 2015 Apr 2007 DigiTouch set up Jan 2009 DigiTouch becomes member of IAB Italia Nov 2009
The Global Exchange For Advertising November 2018
 The Global Exchange For Advertising November 2018 1 COPYRIGHT RUBICON PROJECT 2018 SAFE HARBOR FORWARD-LOOKING STATEMENTS This presentation and management's remarks may include, forward-looking statements,