ABSTRACT. The research reported in this thesis investigates the behavior and the punching shear capacity
|
|
|
- Oswin Walker
- 6 years ago
- Views:
Transcription
1 ABSTRACT KHALAF ALLA, OMAR MOHAMED. Design and Behavior of Ledges for Short Span L- Shaped Spandrel Beams. (Under the direction of Dr. Sami Rizkalla.) The research reported in this thesis investigates the behavior and the punching shear capacity of typical ledges used for spandrel L-shaped beams. The research is focused on short span beams to minimize the effect of the global stresses on the behavior of the ledges. The research included an extensive experimental program conducted to determine the effect of different parameters believed to affect the behavior and the ultimate strength of the ledge. The parameters included the parameters considered by the current PCI design and others believed to affect the behavior of punching shear capacity of ledges for short span L-shaped spandrel beams. The experimental program consisted of 17 full-scale precast reinforced concrete L-shaped spandrel beams tested at different locations along the span. Test results were used to recommend new failure surface and the corresponding shear strength for ledges as affected by the selected parameters. Research findings are used to propose equations for the design and prediction of the punching shear capacity of ledges for short span L-shaped spandrel beams.
2 Copyright 2015 by Omar Khalaf Alla All Rights Reserved
3 Design and Behavior of Ledges for Short Span L-Shaped Spandrel Beams by Omar Khalaf Alla A thesis submitted to the Graduate Faculty of North Carolina State University in partial fulfillment of the requirements for the degree of Master of Science Civil Engineering Raleigh, North Carolina 2015 APPROVED BY: Dr. Sami Rizkalla Chair of Advisory Committee Dr. Rudolf Seracino Advisory Committee Member Dr. Gregory Lucier Advisory Committee Member
4 DEDICATION This thesis is dedicated to my beloved wife and my beautiful baby girl who lightened my world. I would also like to dedicate my work to my dear beloved parents who have encouraged and supported me throughout all phases of my life and for raising me into the person I am today. I Love you all! ii
5 BIOGRAPHY Omar Khalaf Alla started studying engineering in 2007 at Ain Shams University, Cairo, Egypt. During his undergraduate studies, he participated in various training programs at different companies in Egypt including Dar Al-Handasah. He also did an internship at North Carolina State University in the summer of Omar obtained his BS degree in Civil Engineering in 2012, with a grade very good with honor and ranked as the third top student among 200 students in the graduation project. Soon after his graduation, he started full-time work as a junior engineer at AACE consulting office specializing in structural analysis and design of reinforced and prestressed concrete structures. In 2013, Omar was awarded a scholarship to pursue a M.Sc. at North Carolina State University where he joined the graduate school program. Upon receiving his degree, Omar plans to continue studying toward a Doctor of Philosophy degree. iii
6 ACKNOWLEDGMENTS I would like to take this opportunity to express my sincere gratitude to my supervisor Dr. Sami Rizkalla for his guidance throughout the research. I cannot thank him enough for his generous support, continuous patience and unwavering encouragement. His wisdom was unparalleled, his care and belief in the potential of his students is something extraordinary. I would also like to extend my gratitude to Dr. Paul Zia, whose extensive knowledge and experience are pioneering, for his great contribution and advice to this research. I was so fortune to work under direction of Dr. Gregory Lucier. His professional experience and engineering abilities are outstanding. I look to follow in his footsteps to be a professional researcher and engineer. Special thanks to Dr. Rudolf Seracino for his guidance through my master program and for his time in editing and examining the thesis. I would also like to acknowledge the Precast / Prestressed Concrete Institute for their sponsorship of this research and for extensive guidance, feedback and direction provided by the professional members and committees. In addition, I would like to thank the companies and individuals within the precast industry who contributed to this research. I am greatly indebted to another member of the research team, Mohamed Nafadi. His hard work and dedication set the entire project on the right track. His extraordinary guidance and outstanding help cannot be neglected. Finally, I would like to thank my family, friends, colleagues and staff at the Constructed Facilities Laboratory for their help and support. iv
7 TABLE OF CONTENTS LIST OF TABLES... vii LIST OF FIGURES... viii 1. Introduction Objectives Scope Thesis Overview Literature Review Modes of Failure Current Design Procedure Published Research Experimental Program Test Specimens Test Parameters Concrete Strength Ledge Height, hh Ledge Projection, ll Transverse Steel (C bars) Longitudinal Steel in Ledge Eccentricity of the applied load, e Bearing Width, bb Bearing Length, L Edge Distance of load, dd Bearing Type Loading type Fabrication of the Test Specimens Test setup Instrumentation Load Cells String Potentiometers PI Gages Results of the Experimental Program Material Properties Ledge Behavior Inner Tests End Tests Punching Shear Capacity Parametric Study and Results Concrete Strength Ledge Height Ledge Projection Transverse Steel (C bars) v
8 Longitudinal Steel Eccentricity of Applied Load Bearing Width Bearing length Edge Distance of the Load Bearing Type Loading Type Summary and conclusions Analysis of Test Results Inner Failure Surface Idealized Surface for Inner Failures Shear Stresses of Inner Failures End Failure Surface Idealized Surface for End Failures Shear Stresses of End Failures Design Recommendations Summary and Conclusions Future Recommendations REFERENCES APPENDIX vi
9 LIST OF TABLES Table 2-1: Summary of PCI design equations... 9 Table 2-2: Comparison between ultimate shear stresses used by PCI (2010) and Raths (1984) Table 3-1: Inner tests Table 3-2: End tests Table 4-1: Concrete Compressive Strengths Table 4-2: Modulus of elasticity test results Table 4-3: Steel material sample results Table 4-4: Results of inner ledge location tests Table 4-5: Results of end ledge location tests Table 5-1: Different idealized areas for inner failures Table 5-2: Summary of results from the analysis done on different idealized areas Table 5-3: Different idealized areas for end failures Table 5-4: Average shear stresses for end tests vii
10 LIST OF FIGURES Figure 1-1: L-shaped spandrels used in parking structures... 2 Figure 2-1 Inner and end location failure surfaces (Raths, 1984)... 6 Figure 2-2: PCI idealized failure surface at inner and end locations... 6 Figure 2-3: Independent failures (Nafadi et al. 2013)... 8 Figure 2-4: Overlapped failures (Nafadi et al. 2013)... 8 Figure 2-5: Design of transverse bending of ledge (PCI Design Handbook, 2010) Figure 2-6: Ledge hanger steel geometry (PCI Design Handbook 2010) Figure 2-7: Example of a punching shear failure of the ledge (Mirza and Furlong, 1983) Figure 2-8: Punching shear failure in the second specimen (Klein, 1986a) Figure 2-9: Punching shear failures near the end and inner locations (Klein, 1986a) Figure 2-10: Principal compressive strains distribution at failure (Hassan, 2007) Figure 2-11: Punching shear failures in ledge of spandrels SP12 and SP14 (Lucier et al., 2010) Figure 2-12: Elevation views of the conducted test configurations, SP16 (Nafadi et al., 2013) Figure 2-13: Cracking pattern and principal compressive strains in SP16 (Nafadi et al., 2013) Figure 3-1: Typical specimen dimensions Figure 3-2: Ledge height Figure 3-3: Ledge Projection Figure 3-4: Transverse steel, C bars Figure 3-5: Longitudinal steel in ledge Figure 3-6: Load Eccentricity Figure 3-7: Bearing Width Figure 3-8: Bearing Length Figure 3-9: Edge distance of load Figure 3-10: Bearing type Figure 3-11: Sustained load cycle Figure 3-12: Production of spandrels Figure 3-13: Test setup Figure 3-14: Test setup top view Figure 3-15: Loading beam support at the ledge side Figure 3-16: Testing sequence Figure 3-17: Instrumentation Figure 3-18: Location of string potentiometers Figure 3-19: Locations of PI gages (A), (B) and (C) Figure 4-1: Modulus of Elasticity test Figure 4-2: Typical reinforcing bar sample test Figure 4-3: stress strain curves for different bas diameters Figure 4-4 (A)-(F): Cracking pattern for typical inner failure Figure 4-5 (A)-(F): Crack pattern for typical end test viii
11 Figure 4-6: Influence of concrete strength on ledge punching shear capacity for inner tests 54 Figure 4-7: Influence of concrete strength on ledge punching shear capacity for end tests Figure 4-8: Influence of ledge height on ledge punching shear capacity for inner tests Figure 4-9: Influence of ledge height on ledge punching shear capacity for end tests Figure 4-10: Influence of ledge projection on ledge punching shear capacity for inner tests 58 Figure 4-11: Influence of ledge projection on ledge punching shear capacity for end tests.. 59 Figure 4-12: Influence of transverse steel on ledge punching shear capacity for inner tests. 60 Figure 4-13: Influence of longitudinal steel in ledge on ledge punching shear capacity for inner tests Figure 4-14: Influence of longitudinal steel in ledge on ledge punching shear capacity for end tests Figure 4-15: Influence of eccentricity of applied load on ledge punching shear capacity for inner tests Figure 4-16: Influence of eccentricity of applied load on ledge punching shear capacity for end tests Figure 4-17: Influence of bearing width on ledge punching shear capacity for inner tests Figure 4-18: Influence of bearing width on ledge punching shear capacity for end tests Figure 4-19: Influence of bearing length on ledge punching shear capacity for inner tests Figure 4-20: Effect of edge distance of the load on the failure surface Figure 4-21: Influence of edge distance of the load on ledge punching shear capacity Figure 4-22: Bearing type configuration Figure 4-23: Influence of bearing type on ledge punching shear capacity Figure 4-24: Influence of sustained load on ledge punching shear capacity Figure 4-25: Effect of all parameters on ledge punching shear capacity for inner failures Figure 4-26: Effect of all parameters on ledge punching shear capacity for end failures Figure 5-1: Inner failure surface boundaries Figure 5-2: PCI failure surface Figure 5-3: Inner failure surface examples Figure 5-4: Idealization of inner failures Figure 5-5: Different observed inner failure surfaces and corresponding idealized surfaces. 80 Figure 5-6: Free body diagram of the ledge of inner location failures Figure 5-7: Shear stress distribution on the idealized surface Figure 5-8: Shear stresses for all inner location tests using idealized failure surface Figure 5-9: Shear stresses for all inner location tests using idealized failure surface Figure 5-10: Shear stress for all inner location tests using idealized failure surface Figure 5-11: Shear stress for all inner location tests using PCI idealized failure surface Figure 5-12: Idealized failure surface Figure 5-13: Predicted loads compared to experimental measured loads for inner failures Figure 5-14: Alternative approach predicted loads compared to measure loads for inner failures Figure 5-15: End failure surface boundaries Figure 5-16: End failure surface examples when dd < 2hh Figure 5-17: Selected failures when dd = 2hh Figure 5-18: Selected failures when dd > 2hh ix
12 Figure 5-19: Idealization of end failures Figure 5-20: Different observed end failure surfaces and corresponding idealized surfaces. 95 Figure 5-21: Free body diagram of the ledge of end location failures Figure 5-22: Predicted loads compared to measured loads for end failures Figure A-1: Reinforced concrete beams RS1 and RS1-D Figure A-2: Reinforced concrete beam RS Figure A-3: Reinforced concrete beams RS3 and RS3-D Figure A-4: Reinforced concrete beam RS Figure A-5: Reinforced concrete beams RS5 and RS5-D Figure A-6: Reinforced concrete beam RS Figure A-7: Reinforced concrete beams RS7 and RS7-D Figure A-8: Reinforced concrete beam RS Figure A-9: Reinforced concrete beams RS9 and RS9-D Figure A-10: Reinforced concrete beam RS Figure A-11: Reinforced concrete beams RS11 and RS11-D x
13 1. Introduction Precast concrete L-shaped beams are commonly used for parking structures. The beams, typically known as spandrel beams, are typically used to support precast concrete deck elements such as double-tee beams as shown in Figure 1-1. The load from the double tees is transferred to the web of the L-shaped spandrel beam through its ledge where the double tees are resting and therefore the ledge is exposed to very high eccentric loads. The spandrel beams are subjected to high shear, torsion and bending moments consequently resulting in deformations in the vertical plane and out plane accompanied flexural and shear cracks. The current design procedure recommended by Precast/Prestressed Concrete Institute (PCI) estimates the punching shear capacity of the ledge based on empirical values using an assumed failure surface and concrete shear strength. In spite of the fact that there are no reported failures of ledge in real life due to punching shear, there have been many concerns from researches regarding the estimation of the current PCI design equations of the nominal capacity of ledges. Several reported researches, Klein (1986) and Lucier et al. (2011) indicated that the measured failure load is quite less in comparison to the prediction of the nominal capacity according to PCI equations. Prediction of the nominal punching shear capacity by the finite element used to model the behavior of the ledge conducted by Nafadi et al. (2013) confirmed that the PCI equations over estimates the punching shear capacity of the ledge. The finite element analysis also indicated that predictions of the nominal punching shear capacity of the ledges of short span L-shaped spandrel beams are in the range of 50% to 60% of the measured values. 1

14 The research reported in this thesis describes an experimental program undertaken to study the behavior of ledges of relatively short span reinforced concrete L-shaped beams. Double Tee beam L-shaped spandrel beam Figure 1-1: L-shaped spandrels used in parking structures 2
15 1.1. Objectives The objective of this research is to determine the effect of different parameters believed to affect the behavior of punching shear capacity of ledges for short span L-shaped spandrel beams. The short span beams were selected to minimize the effect of global stresses in the beam on the ledge behavior. The parameters are expected to include parameters considered by the current PCI design equations and other parameters that are not considered in the current PCI design equations. The main objective is to determine the geometry of the failure surface and the corresponding shear strength for ledges as affected by these parameters at different locations along the beam span. Results from the experimental program will be used to propose equations for the design and prediction of the punching shear capacity of ledges of short span L-shaped spandrel beams Scope The research will review all published research related to the behavior of ledges of L-shaped spandrel beams. The research includes an extensive experimental program to determine the behavior of ledges of short span beams tested at different critical locations. The measured failure surface will be used to propose idealized surface and the corresponding shear strength. 3
16 1.3. Thesis Overview Following the introduction, objectives and scope presented in chapter 1, Chapter 2 will include a summary of the published data related to the behavior and design of ledges of L- shaped spandrel beams. Chapter 2 also presents also the design method specified in the PCI equations and the procedure required for ledges of L-shaped spandrel beams. Detailed description of the experimental program is presented in chapter 3. This includes the different parameters considered in the experimental program along with a detailed illustration of the test setup and the instrumentations. Chapter 4 presents and discusses test results of the experimental program including comparisons to the PCI equations. The effect of the different parameters on the punching shear capacity of the ledge is also discussed. Chapter 5 focuses on the analysis of the test results, the failure surface and the corresponding shear strength of ledges of short span L-shaped spandrel beams. Finally, Chapter 6 presents summary and conclusions of the research along with future recommendations. 4
17 2. Literature Review This chapter reviews the published research work related to the behavior and design of ledges of L-shaped reinforced concrete beams. The emphasis will be on the failure shape and modes as well as the stresses that can be used to estimate the punching shear capacity of the ledge. The literature review will include also review of the current PCI design procedure of ledges Modes of Failure Ledges of spandrel beam are typical configuration used to transfer of the applied concentrated loads from supported slabs and precast concrete members to web as shown in Figure 2-1. Transfer of the load to the web occurs through flexure, direct shear and web direct tension (Raths, 1984). The high concentrated loads may lead to localized punching shear failure. The nature of the failure is usually a sudden brittle failure. The type of the failure is dependent on the location of the load along the span of the ledge. The two typical types of failure are identified by their locations as inner location failure and end location failure as shown in Figure 2-1. The current 7 th edition of the PCI design handbook (2010) considers an idealized rectangular configuration of the failure surfaces as shown in Figure 2-2. The idealized failure surface assumed by the PCI was used to develop equations that are currently being used to predict the ledge punching shear capacity. 5

18 Figure 2-1 Inner and end location failure surfaces (Raths, 1984) V u N u V u N u Figure 2-2: PCI idealized failure surface at inner and end locations 6
19 2.2. Current Design Procedure Section 5.5 of the 7 th edition of the PCI Design Handbook (2010) provides design equations to predict the ultimate capacity of the ledge against punching shear. The idealized failure surfaces used by the PCI design procedure are shown in Figure 2-3 for the case of independent failures. If the applied loads are close enough to each other overlapping between failure surfaces may occur as shown in Figure 2-4. For the case of independent failures, the PCI design procedure assumes a uniform shear stress of 3 f c acting on the three vertical planes of the idealized inner failure surface (Equation 5-44, PCI Design Handbook, 2010). This value is reduced to 2 f c on the two vertical planes of the idealized surface for the end locations failures (Equation 5-45, PCI Design Handbook, 2010). The same values of shear stresses are assumed on the vertical planes at each location for the case of overlapped failures (Equation 5-46 & 5-47, PCI Design Handbook, 2010). A uniform shear stress of 2 f c is assumed on the back vertical plane for continuous failures (Equation 5-48, PCI Design Handbook, 2010). The ledge punching shear capacity is predicted using the idealized failure surface and the selected shear strength as given in Table

 8")
20 Figure 2-3: Independent failures (Nafadi et al. 2013) Figure 2-4: Overlapped failures (Nafadi et al. 2013) 8

![per stem (lbs) 3 f c 2 f c Independent failures V n = 3 h l λ f c [2 (b l b) + b t + h l ] V n = h l λ f c [2(b l b) + b t + h](/docs-images/78/77102642/images/21-1.jpg "l + 2d e ] Eq. 5-44 Eq. 5-45 Lesser of the two equations 3 f c 2 f c Overlapped failures s < b t + h l V n = 1.")
![5 h l λ f c [2 (b l b) + b t + h l + s] V n = h l λ f c (b l b) + b t + h l + d 2 e + s Eq. 5-46 Eq.](/docs-images/78/77102642/images/21-2.jpg "5-47 Lesser of the two equations 2 f c Continuous V n = 24 h l λ f c, lb/ft Eq. 5-48 Where; : Reduction factor = 0.")

21 A summary of the PCI design equations for the different location failures and loading configurations are listed in Table 2-1. Table 2-1: Summary of PCI design equations Idealized failure surface Uniform shear stress Type of failure Design shear strength per stem (lbs) 3 f c 2 f c Independent failures V n = 3 h l λ f c [2 (b l b) + b t + h l ] V n = h l λ f c [2(b l b) + b t + h l + 2d e ] Eq Eq Lesser of the two equations 3 f c 2 f c Overlapped failures s < b t + h l V n = 1.5 h l λ f c [2 (b l b) + b t + h l + s] V n = h l λ f c (b l b) + b t + h l + d 2 e + s Eq Eq Lesser of the two equations 2 f c Continuous V n = 24 h l λ f c, lb/ft Eq Where; : Reduction factor = 0.75 s= Spacing of concentrated loads, in. h l : Ledge height of the beam, in. b: Beam web width, in. b l : Beam web width, in. f c : Specified concrete compressive strength, psi. d e : Edge distance of applied load, in. b t : Bearing width of the bearing plate, in. λ: Modification factor for density of concrete. 9
22 The current PCI design procedure requires flexural reinforcement, A s, to resist the transverse bending of the ledge and the moment due to the inward frictional force, N u, from the pads as shown in Figure 2-5. N u should be taken as at least 0.2 times the factored dead load portion of V u unless it can be shown as less by calculation. The reinforcement may be uniformly spaced over a distance of 6h l on either side of the applied load, but not to exceed half the distance to the next load. Bar spacing should not exceed the ledge depth, h l, or 18 in. The required reinforcement can be determined using the following equation: A s = 1 V f u a + N y d u h l Eq (PCI Design Handbook, 2010) d The design procedure also specifies longitudinal reinforcement, A l, that should be placed at both the top and bottom of the ledge as shown in Figure 2-5. The longitudinal reinforcement can be calculated using the following equation: V u = 200. l p. d l /f y Eq (PCI Design Handbook, 2010) Figure 2-5: Design of transverse bending of ledge (PCI Design Handbook, 2010) 10
23 Hanger steel, A sh, is also required to transfer the load from the ledge to the web as shown in Figure 2-6. The distribution and spacing of the hanger reinforcement follows the same limitations of the transverse steel reinforcement. The PCI specifies that the hanger steel is not an additive to shear and torsion reinforcement and the larger of the two amounts should be used. The required hanger steel reinforcement can be determined using the following equation: Where; A sh = V u f y (m) Eq (PCI Design Handbook, 2010) m is the hanger modification factor and can be determined using the following equation: m = m 0.6 for L-shaped beams. m 0.4 for Inverted-tee beams. ( d s + a) 3 2 h 2 l h h l h b l 2 eγ t d s (x 2 y) l x 2 y Eq (PCI Design Handbook, 2010) x, y = Shorter and longer sides, respectively of the component rectangles forming the ledge and web parts of the beam, in. γ t = 0, when closed ties are not used in the ledge. γ t = 1, when closed ties are used in the ledge. 11
24 Figure 2-6: Ledge hanger steel geometry (PCI Design Handbook 2010) 2.3. Published Research There are limited studies on the behavior of ledges of precast beams. Several ledge failures were observed in some experimental programs that included tests conducted by Mirza and Furlong (1983), tests conducted by Klein (1986a) and tests conducted by Lucier et al. (2011a). However the study of the ledge behavior was not the main objective of any of those tests. The behavior of the ledge was studied by Hassan (2007) and Nafadi et al. (2013). The researches included an analytical study to investigate the influence of different parameters on the shear behavior of the ledge using finite element modeling. The study by Mirza and Furlong (1983) investigated the behavior of inverted T-beams under a combination of flexure and torsion. The study included 27 tests on seven specimens, three reinforced concrete and four prestressed concrete specimens. The specimens represented one- 12

25 third scale models of inverted T-beams used in parking structures. Four failures, of the 27 tests, were due to punching shear of the ledge. The observed punching shear failures exceeded the capacities predicted by the PCI. This is due to the different characteristics and behavior of the inverted T-beams from those of the L-shaped beams in terms of geometry, stress distribution and reinforcement details. It also should be noted that the tested specimens were of relatively short span where there are low global flexural and shear stress. One example of a punching shear failure obtained by Mirza and Furlong is shown in Figure 2-7. Figure 2-7: Example of a punching shear failure of the ledge (Mirza and Furlong, 1983) 13
26 A paper by Raths (1984), reported a vast study on some of the common problems associated with spandrel beams. The paper discussed the different types of loading applied on spandrel beams and suggested design requirements for the beams. His research addressed the behavior of the ledges and introduced a modified procedure to predict the punching shear capacity of the ledge. He also classified the type of failure based on the location of the failure. Raths indicated that the end failure was only achieved when the edge distance was less than twice the ledge height. The estimation of the ledge capacity depended on using reduced ultimate shear stresses on the vertical shear plane along the face of the web. Table 2-2 presents a comparison of the ultimate shear stresses used by Raths and the current PCI procedure for the case of independent failures. The comparison indicates that the modified procedure introduced by Raths is more conservative in predicting the ledge capacity than the PCI procedure specifically for the end locations failures. Table 2-2: Comparison between ultimate shear stresses used by PCI (2010) and Raths (1984) Location of failure Inner failures Idealized failure surface shape Design method PCI Design Handbook (201) Uniform shear stress on back plane 3 f c Uniform shear stress on side planes 3 f c Raths (1984) 3 f c 3 f c End failures PCI Design Handbook (2010) 2 f c 2 f c Raths (1984) 1 f c 2 f c 14
27 Later, Klein (1986a) conducted a study on the behavior of precast spandrel beams. The research was primarily directed toward spandrel beams commonly used in parking structures to study the design requirements and practices to determine the spandrel beam design. The research included analytical studies using finite element models and full-scale load tests of two L-shaped beams and one pocket spandrel beams. All test specimens were 28 ft. long. Unexpectedly, two punching shear failure occurred in the second L-shaped specimen. Figure 2-8 shows the locations of the failures, one near the end shown in Figure 2-9(A) and one at an inner location shown in Figure 2-9(B). The failure loads were observed to be less than the loads predicted by the current PCI equations at both locations. Furthermore, Klein indicated that the eccentricity of the applied load to the centroid of the resisting section of the L-shaped beam cannot be neglected in the design of the hanger reinforcement for ledge and web attachment. Klein also indicated that the hanger reinforcement is not additive to shear and torsion reinforcement. Based on these findings, Klein raised some concerns regarding the safety level provided by the current PCI equations for the punching shear capacity of the ledge and recommended further research in this area. 15
 (A) Punching")
 (B) Punching shear failure at inner")

28 Figure 2-8: Punching shear failure in the second specimen (Klein, 1986a) (A) Punching shear failure near the end of the beam (Klein, 1986a) (B) Punching shear failure at inner location (Klein, 1986a) Figure 2-9: Punching shear failures near the end and inner locations (Klein, 1986a) 16

29 The first known study on ledges of L-shaped spandrel beams was by Hassan (2007). The paper presented non-linear finite element analysis to model the behavior of prestressed L- shaped spandrel beams. The paper focused on the behavior of the ledge at the end regions, where punching shear controls the design. The finite element model was first calibrated using the second specimen tested by Klein (1986a) to confirm the capability of the program to simulate the measured behavior. The failure in the analytical model was due to punching shear of the ledge at an end reaction 9 percent less than the measured value. Figure 2-11 shows the principal compressive strains distribution at failure predicted by the model. The analysis confirmed that the PCI design equations could overestimate the ledge punching shear capacity. Figure 2-10: Principal compressive strains distribution at failure (Hassan, 2007) 17
30 Based on the calibrated model, Hassan (2007) conducted a parametric study to investigate the effect of different parameters believed to affect the ledge capacity. The study compromised of 14 different cases and one parameter was varied in each case, while other parameters were kept the same as those used in modeling the basic spandrel beam. A total of seven parameters were studied by Hassan, including four parameters considered by the PCI design equations; ledge height, ledge projection, concrete strength and bearing width. The study was extended to investigate other parameters that are not considered by the PCI design equations and believed to influence the ledge capacity including prestressing level, strand debonding and hanger reinforcement in the web. The analysis indicated that the prestressing level and the hanger reinforcement had a positive influence on the ledge punching shear capacity. The analysis also indicated that the bearing width and strand debonding had slight effect on the ledge capacity. Hassan also reported that the effect of concrete compressive strength on the punching shear capacity can be better represented using (f c ) 1 4. Finally the finite element analysis indicated that the increase in ledge projection, accompanied by increase of the applied load eccentricity significantly reduced the ledge capacity. The main conclusion of this study was that the predictions of PCI design equations for the ledge punching shear capacity were unconservative. In addition the study introduced key parameters like eccentricity of applied load and prestressing level that could influence the ledge capacity. Based on these finding Hassan recommended using 0.60 as a reduction factor for the PCI design equations to ensure that punching shear failure will not govern the design of typical spandrel ledges. 18


31 Recently, Lucier et al. (2011a) conducted an extensive experimental program, at North Carolina State University, including sixteen full scale spandrel beams. The experimental program was accompanied by a detailed analytical study included three-dimensional linear and non-linear finite element models that were calibrated to the experimental data. The objective of this research was to develop rational guidelines for the design of precast slender L-shaped spandrel beams that reflect the observed behavior. Specifically the research focused on investigating whether traditional closed ties were required for the slender cross-sections of typical precast L-shaped and corbelled spandrels. Detailed descriptions of the research program and results are presented in the final report submitted by Lucier et al. (2010). Unexpectedly eight failures of the ledge occurred in five of the tested specimens. Seven failures were due to punching shear in the ledge, while one failure was due to hanger failure at the end of the beam where the ledge detached from the web. Two examples of the punching shear failures as shown in Figure 2-11 (A) and (B). (A)Punching shear failure in spandrel SP12. (Lucier et al.,2010) (B)Punching shear failure in spandrel SP14. (Lucier et al. 2010) Figure 2-11: Punching shear failures in ledge of spandrels SP12 and SP14 (Lucier et al., 2010) 19
32 Four of the seven punching shear failures occurred in the same specimen, SP16, as it was tested with different load combination to study the effect of global stresses. This highlighted the significant effect of global stresses on the ledge punching shear capacity. The loading configuration used to evaluate the ledge capacity is shown in Figure Two punching shear failures occurred at identical locations, at both ends of the ledge. It should be noted that the failure load of the initial test was less than the failure load of the first retest by 25 percent. This was mainly due to the less effect of global stresses on the first retest. The same trend was observed in the second and third retests conducted at inner locations. All measured failure loads were less than those predicted by the current PCI equations. Therefore, Lucier et al. concluded that the current PCI equations overestimate the ledge capacity and recommended further research. Figure 2-12: Elevation views of the conducted test configurations, SP16 (Nafadi et al., 2013) 20
33 The test results reported by Klein (1986a) and Lucier et al. (2011a) were evaluated by Logan (2012) using the current PCI design procedure with the corresponding equation of each location rather than using the least value from the two equations specified in the PCI Design Handbook (2010). Based on the results, he recommended using 50 percent of the predicted capacities by the current PCI design equations. Nafadi et al. (2013) conducted an extensive three-dimensional non-linear finite element analysis to determine the relevant parameters believed to affect the ultimate strength of the ledge. The main objective of this research was to examine the ledge capacity of L-shaped beams. The study also aimed to investigate the effects of various parameters that are not considered by the current PCI design procedure. The finite element model was first calibrated using test results of three specimens; reinforced concrete beam, SP16, (Lucier et al., 2010), prestressed concrete beam, specimen #2, (Klein, 1986a) and prestressed concrete beam, SP14, (Lucier et al., 2010). The results of the calibrated models showed good agreement with the measured behavior. The failure loads predicted by the finite element analysis were 90 percent of the measured values. The calibrated models also predicted the same failure modes and cracking pattern. Figure 2-13 shows one example of the calibrated models for the reinforced concrete beam, SP16, (Lucier et al., 2010). 21
 included models for short span beams and also long span beams to study the effect of global stresses on the ledge capacity.")
34 Figure 2-13: Cracking pattern and principal compressive strains in SP16 (Nafadi et al., 2013) The parametric study performed by Nafadi et al. (2013) included models for short span beams and also long span beams to study the effect of global stresses on the ledge capacity. Reinforcement details and geometry of the modeled beams were similar to those used in the reinforced concrete L-shaped beam SP16 and the prestressed concrete beam SP14 tested by Lucier et al. (2010). A total of sixteen parameters were studied through 145 models including ten parameters not considered by the current PCI design procedure. Results of the analytical study indicated that the current PCI design procedure can seriously overestimate the ledge punching shear capacity. The overestimation was more pronounced for the inner location failures than the end location failures. Based on the research findings an extensive experimental program was proposed consisting of full-scale reinforced and prestressed concrete L-shaped beams. 22
35 3. Experimental Program The experimental program consisted of 17 spandrel beams each 16-6 long simply supported with clear span of 15-6 as shown in Figure 3-1: Typical specimen dimensions. Each beam was tested at mid-span and at the two ends for a total of three tests conducted for each beam. The total number of tests were 51 comprise of 17 mid-span tests and 34 end tests. This chapter describes test specimens, the different parameters investigated, test setup and the instrumentations used Test Specimens All tested beams had the same general geometrical configuration of 16-6 long, a height of 60 inches, and a web thickness of 8 inches. The ledge is projected along the bottom of the inner surface of the web for a length of The detailed design drawings of the spandrel beams are presented in appendix A. Two 2 inch diameter holes were provided at each end of the beam. High-strength threaded rods that passed through these holes were used to tie the spandrels to the testing frame in a similar manner that simulates field conditions. These horizontal ties are used to resist the applied torsion due to the eccentric location of the applied load. The holes were placed at 6 inches in from the ends and 12 inches from the top and bottom. 23

36 Figure 3-1: Typical specimen dimensions 3.2. Test Parameters A total of eleven parameters were considered in the experimental program. Five of these parameters are considered by the current design procedure of PCI including ledge height, ledge projection, bearing width, concrete strength and edge distance of the load. The other six parameters believed to affect the behavior of the ledges of L-shaped spandrel beams as determined by Nafadi et al. (2013). These six parameters were eccentricity of applied load, transverse steel (C bars), longitudinal steel in the ledge, bearing length, bearing type and effect of sustained load. 24
37 The 17 L-shaped spandrel beams consisted of 11 beams tested using different parameters and 6 beams were used as duplicates to provide confident in the test results. Designation of the test specimens is as follows RS#-D, Where: R Reinforced concrete beam S Short span beam # - Unique number for each specimen: RS1, RS2, RS3, etc. D for Duplicated beam. The following section discusses in details the considered ten parameters Concrete Strength In order to study the effect of concrete strength on the behavior and capacity of ledges, the nominal concrete compressive strength proposed for the experimental program was 5000 psi, 7000 psi and psi. 25
38 Ledge Height, h l The ledge height is an effective parameter in the current PCI design procedure for determining the punching shear capacity of the ledge. To study this parameter, the ledge height was increased from 8 inches to 12 inches as shown in Figure 3-2. Figure 3-2: Ledge height Ledge Projection, l p Ledge projection is one of the dominant parameters affecting the ledge punching shear capacity and the failure surface as well. The ledge projection was increased from 8 inches to 10 inches while keeping the location of the bearing plate constant as shown in Figure
39 Figure 3-3: Ledge Projection Transverse Steel (C bars) In order to study the effect of the shear reinforcement on the ledge punching shear capacity, three different amounts of transverse steel were investigated; inches, inches and inches as shown in Figure 3-4. Figure 3-4: Transverse steel, C bars 27
40 Longitudinal Steel in Ledge The effect of longitudinal steel in the ledge was also investigated using three different amounts of reinforcement; 2#4, 2#6 and 3#6 as shown in Figure 3-5. Figure 3-5: Longitudinal steel in ledge Eccentricity of the applied load, e The current PCI design procedure does not consider the eccentricity of the load with respect to the inner surface of the web. In order to study the effect of load eccentricity separately four values of load eccentricity were investigated; 7.5 inches, 6 inches, 4.5 inches and 3 inches as shown in Figure 3-6. In this study the ledge projection remained constant as well as the amount of reinforcement was kept the same. 28
41 Figure 3-6: Load Eccentricity Bearing Width, b t The effect of bearing width on the ledge punching shear capacity is studied by considering three different bearing widths; 4 inch, 8 inches and 12 inches wide bearing widths as shown in Figure 3-7. Figure 3-7: Bearing Width 29
42 Bearing Length, L Two values were used to investigate the effect of bearing length on the ledge punching shear capacity; 4 inches and 8 inches. In both cases the load eccentricity was kept constant as shown in Figure 3-8. Figure 3-8: Bearing Length Edge Distance of load, d e In order to determine the influence of the distance between the first load and the end of the ledge on the punching shear capacity of the ledge four values were tested; 8 inches, 16 inches, 20 inches and 24 inches as shown in Figure
43 Figure 3-9: Edge distance of load Bearing Type All tests were conducted using a steel bearing plate of 2 inches thick except for one end test a Masticord bearing was used beneath the steel plate as shown in Figure Figure 3-10: Bearing type 31

44 Loading type The loads were applied on beams incrementally up to failure except for one end test, a sustained load was held for 24 hours after reaching the factored load as shown in Figure Factored load Failure Service load Figure 3-11: Sustained load cycle A summary of all the parameters studied is presented in test matrix, as given in Table 3-1 for inner tests locations and Table 3-2 for end tests locations. 32
45 Specimen Test Design Concrete Strength (psi) Actual concrete Strength (psi) Ledge Height (in) Table 3-1: Inner tests Ledge Projection (in) 11 Original beams Transverse steel, c bars Longitudinal Steel in ledge Eccentricity (in) Bearing Width (in) RS1 RS1.I #3@6 2# Bearing Length (in) RS2 RS2.I #3@7 8 RS3 RS3.I #3@5 8 RS4 RS4.I #4@8 RS5 RS5.I #3@5 2#4 2# RS6 RS6.I #3@7 2# RS7 RS7.I #4@8 2# RS8 RS8.I 8640 #5@6 2#4 RS9 RS9.I 7730 #4@ RS10 RS1-.I 7730 #3@6 3#6 RS11 RS11.I 7910 #3@6 2# Duplicated beams RS1-D RS1-D.I #3@6 8 2#4 6 RS3-D RS3-D.I #3@5 4 RS5-D RS5-D.I #3@ #5 RS7-D RS7-D.I #4@ RS9-D RS9-D.I 7730 #4@6 2# RS11-D RS11-D.I 7730 #3@6 2#
46 Table 3-2: End tests Specimen RS1 RS2 RS3 RS4 RS5 RS6 RS7 RS8 RS9 RS10 RS11 RS1-D RS3-D RS5-D RS7-D RS9-D RS11-D Test Design Concrete Strength (psi) Actual concrete Strength (psi) Ledge Height (in) Ledge Projection (in) Transverse steel, c bars 11 Original beams Longitudinal Steel in ledge Eccentricity (in) Bearing Width (in) RS1.E #3@6 2#4 RS1.E2 24 RS2.E #3@7 RS2.E #4 RS3.E #3@5 RS3.E RS4.E #4@8 RS4.E2 24 2#5 4 RS5.E #3@5 RS5.E2 4.5 RS6.E #3@7 2#4 RS6.E RS7.E #4@8 2#5 RS7.E RS8.E #5@6 16 RS8.E2 2#4 RS9.E #4@6 RS9.E RS1-.E #3@6 3#6 4 RS1-.E2 RS11.E #3@6 2#6 RS11.E2 8 6 Duplicated beams RS1-D.E #3@6 RS1-D.E #4 RS3-D.E #3@5 RS3-D.E2 24 RS5-D.E #3@5 RS5-D.E2 3 2#5 RS7-D.E #4@8 RS7-D.E RS9-D.E #4@6 2#4 RS9-D.E RS11-D.E #3@6 2#6 RS11-D.E2 12 Edge Distance (in) Bearing type Steel Masticord Steel Loading Incremental till failure Sustained 4 Incremental till failure Steel Incremental till failure 34


47 3.3. Fabrication of the Test Specimens The short span L-shaped spandrel beams were produced at precast plant on flat table forms, lying on their outer face as shown in Figure Steel cages and form dimensions were checked and samples of concrete and steel were used to determine material properties of each material. Figure 3-12: Production of spandrels 35
48 3.4. Test setup The tested short span spandrels were simply supported vertically using steel stands and tied horizontally to columns of testing frame at the two ends. The holes in the web were aligned with the holes in the columns and two threaded rods at each end passed through to tie the spandrel laterally to the columns. The top rod at each end prevented the spandrel from tipping over. The columns of the testing frame were post-tensioned to the floor with large diameter dywidag bars. The ledge of the spandrels was not supported at any location as it was directed away from the supporting columns. The load was applied to the ledge by a steel beam that was supported from one end on concrete blocks and the other end resting on the ledge of the spandrel. Hydraulic jacks were used to apply the load on the steel beam and load cells were used to measure the applied load. Figure 3-13 and Figure 3-14 show the sketch and the actual test setup respectively. The load was applied to the ledges using a system of rollers to allow the horizontal displacement and a pin to allow rotation as shown in Figure A rigid steel plate was used to distribute the applied load uniformly onto the ledge. The first test was conducted at mid-span to obtain an inner failure and then the loading system was moved to one end location to achieve an end failure and finally the loading system was moved to the opposite end to achieve a second end failure, the testing sequence is shown in Figure


49 Figure 3-13: Test setup Testing frame Threaded rods Hydraulic jack Load cell Steel stand Spreader beam Loading beam Concrete block Figure 3-14: Test setup top view 37
50 Loading beam Rollers Steel pin Steel plate Figure 3-15: Loading beam support at the ledge side Figure 3-16: Testing sequence 38

 were used to measure the vertical and lateral displacements of the spandrel.")
51 3.5. Instrumentation Four types of instrumentations were used to collect and record data during each test. All instruments were connected to an electronic data acquisition system to monitor the data while testing. Figure 3-17 shows the different types of instruments used. 1- Load cells were used to measure the applied load from the hydraulic jack to the loading beam. 2- String potentiometers (Pots) were used to measure the vertical and lateral displacements of the spandrel. 3- PI gages were used to measure concrete strain at different location on the ledge and the web. 4- An inclinometer was used to measure the rotation of the beam at mid-span. PI gages Inclinometer Load cell String pots PI gages String pots. Figure 3-17: Instrumentation 39
52 Load Cells The load cell was placed between the hydraulic jack and the loading beam to measure the applied load on the loading beam and thus calculating the applied load on the ledge String Potentiometers Two string potentiometers were placed beneath the beam, one under the ledge and the other under the web to measure the vertical displacements. Two more string pots were placed horizontally using a steel stand to measure the lateral displacements at the top and bottom of the spandrel. Figure 3-18 shows the locations of the string pots used in this program. Figure 3-18: Location of string potentiometers 40


 PI gages on the ledge face (B) PI gage on the top of the web (C) PI")
53 PI Gages PI gages were used to measure the concrete strain at different locations. Two PI gages were placed on the face of the ledge and two additional PI gages were added for the inner tests; one on the top face of the web and the other on the bottom face of the web as shown in Figure (A) PI gages on the ledge face (B) PI gage on the top of the web (C) PI gage on the bottom of the web Figure 3-19: Locations of PI gages (A), (B) and (C) 41
54 4. Results of the Experimental Program This chapter presents test results of the material properties and results of the experimental program. Test results are compared to the predicted values using the current PCI design procedure for ledges of L-shaped spandrel beams. The observed ledge behavior during testing and the effect of the various parameters, considered in the experimental program, on the punching shear capacity of the ledge are discussed Material Properties The concrete used for fabrication of the test beams was a normal weight concrete typically used by the precast industry. Concrete cylinders (4 x 8 ) were cast and cured under the same conditions of the beams. The cylinders were tested in compression at the time of testing according to ASTM C39 Compressive Strength of Cylindrical Concrete Specimens. Table 4-1 shows the concrete specified nominal compressive strength and the average measured compressive strength based on the cylinders tested at the time of beam testing. Table 4-1: Concrete Compressive Strengths Specimen Specified 28-day Design strength (psi) Average Test Cylinder Compressive strength (psi) RS1 RS1-D 7,000 7,310 RS2 5,000 7,010 RS3 RS3-D 10,000 8,800 RS4 7,310 RS5 RS5-D 7,890 RS6 RS7 8,640 RS7-D 7,000 RS8 RS9 RS9-D 7,730 RS10 RS11 7,910 RS11-D 7,730 42

55 The elastic modulus of the concrete was measured using the average of three extensometers as shown in Figure 4-1. The average measured value for the modulus of elasticity was found to be 80 percent of the value recommended by the ACI using the estimation of 57,000 f c. Test results are given in Table 4-2. Figure 4-1: Modulus of Elasticity test Batch Number Table 4-2: Modulus of elasticity test results Measured Concrete compressive strength (psi) Measured Modulus of Elasticity (ksi) E c /( 57,000 f c ) 1 8,800 4,390 82% 2 7,310 3,854 79% 43

56 Coupon specimens of the steel reinforcement bars were tested to determine the mechanical properties of the steel for all the reinforcing bar sizes and welded wire reinforcement. The steel samples were tested using a 220 kip capacity Universal Testing Machine as shown in Figure 4-2. The stress strain curves of different bar sizes are shown in Figure 4-3. Average of the measured yield stress for the different bar sizes are given in Table 4-3. Figure 4-2: Typical reinforcing bar sample test 44
57 Stress (Ksi) Bar #3 Bar #4 Bar #5 Bar # ε (micro strain) Figure 4-3: stress strain curves for different bas diameters Table 4-3: Steel material sample results Sample Description Yield Strength (ksi) #3 69 #4 67 #5 68 #6 72 W4x4 Wire mesh 92 45
58 4.2. Ledge Behavior Behavior of the ledges at mid-span inner tests, and at the two ends of the ledge end tests under the effect of the applied concentrated loads are described in the following sections Inner Tests The observed behavior under the applied concentrated load for the tested ledges indicated that the first crack was a flexural crack initiated at the ledge/web junction as shown in Figure 4-4 (A). As the load was increased, the cracks extended in length along the length of the ledge and propagated horizontally with an angle into the face of the ledge as shown in Figure 4-4 (B). Prior to failure, additional cracks were initiated at the back of the bearing plate and extended diagonally to the horizontal surface of the ledge as shown in Figure 4-4 (C) & (D). Failure occurred by sudden initiation of vertical diagonal cracks of the ledge as shown in Figure 4-4 (E). These diagonal tension cracks were dominant on the front face of the ledge due to the applied shear and torsion as a result of the eccentric location of the load with respect to the centroid of the beam. Some flexural cracks were observed on the front and back face of the web of the spandrel beam due to the overall global flexural stresses. Figure 4-4 (F) shows typical failure surface configuration for an inner ledge location. The global flexural cracks of the beam are also shown in Figure 4-4 (F). 46
 Crack at back of bearing plate, Load = 52 kips (E) Failure, Load = 54 kips (F) Failure surface and flexural cracks in the web.")
59 (A) Web/ledge junction cracks, Load = 30 kips Flexure cracks on front face, Load = 35 kips (B) Diagonal cracks on top and front face of the ledge, Load = 40 kips (C) Increase of Diagonal cracks on top and front face of the ledge, Load = 45 kips (D) Crack at back of bearing plate, Load = 52 kips (E) Failure, Load = 54 kips (F) Failure surface and flexural cracks in the web. Figure 4-4 (A)-(F): Cracking pattern for typical inner failure 47
60 End Tests Similar to the behavior of inner tests, the first crack initiated at the web/ledge junction as shown in Figure 4-5 (A) and followed by diagonal flexural cracks on the top surface of the ledge as shown in Figure 4-5 (B). The diagonal tension cracks propagated to the front face by increasing the load as shown in Figure 4-5 (B). Before failure, a crack behind the bearing plate was initiated as shown in Figure 4-5 (C). It continued to propagate on the front face of the ledge from the one side as shown in Figure 4-5 (D). However, from the other side it extended along the length of the spandrel until it reached the end of the ledge. The crack then extended on the side of the ledge until it reached the web as shown in Figure 4-5 (E). Typical end failure surface is shown in Figure 4-5 (F). 48
 Diagonal cracks")
")
 Failure surface Figure 4-5 (A)-(F): Crack pattern for")
61 (A) Web/ledge junction cracks, Load = 30 kips Flexure cracks on front face, Load = 35 kips (B) Diagonal cracks on top and front face of the ledge, Load = 40 kips (C) Crack at back of bearing plate, Load = 44 kips (D) Failure, Load = 45 kips (E) Crack at the end of the ledge (F) Failure surface Figure 4-5 (A)-(F): Crack pattern for typical end test 49
62 4.3. Punching Shear Capacity The measured load at failure for the inner ledge locations and the predicted values based on PCI equation 5-44 are given in Table 4-4. Percentage of measured failure load to the PCI prediction is also given in Table 4-4. The different parameters used in this study are also listed for each test. Measured test results of end failures are compared to PCI equation 5-45 and the parameters used for each test are given in Table 4-5. Specimen Measured Punching shear capacity (Kips) Table 4-4: Results of inner ledge location tests Punching shear capacity using PCI equation 5-44 (Kips) Percentage of measured load to PCI prediction Parameter tested RS % Control beam RS1-D % Control beam RS % Bearing width RS % Concrete strength RS3-D % Concrete strength RS % Ledge height RS % Ledge height RS5-D % Eccentricity RS % Ledge projection RS % Ledge projection RS7-D % Bearing length RS % Transverse RFT, C bars RS % Transverse RFT, C bars RS9-D % Bearing width RS % Longitudinal RFT in RS % Longitudinal RFT in RS11-D % Longitudinal RFT in 50
63 The comparison given in Table 4-4 indicated that the measured values range from 73 to 102 percent of the predicted values. This confirms the research findings by Nafadi et al. (2013) that the current PCI equation 5-44 overestimates the ledge punching shear capacity for inner locations. Specimen Test RS1 RS1-D RS2 RS3 RS3-D RS4 RS5 RS5-D RS6 Table 4-5: Results of end ledge location tests Measured Punching shear capacity Punching shear capacity using PCI equation 5-45 Percentage of measured result to PCI prediction Parameter tested E % Control beam E % Edge distance E % Control beam E % Edge distance E % Concrete strength E % Edge distance E % Edge distance E % Concrete strength E % Concrete strength E % Edge distance E % Ledge height E % Edge distance E % Ledge height E % Eccentricity E % Ledge height E % Eccentricity E % Ledge projection E % Eccentricity 51
64 Table 4-6: Continued RS7 RS7-D RS8 RS9 RS9-D RS10 RS11 RS11-D E % Ledge projection E % Eccentricity E % Eccentricity E % Eccentricity E % Transverse RFT, C E % Bearing Type E % Transverse RFT, C E % Bearing width E % Transverse RFT, C E % Bearing width E % Longitudinal RFT E % Type of loading E % Longitudinal RFT E % Bearing width E % Longitudinal RFT E % Bearing width The comparison given in Table 4-5 for the end locations ranges from 79 to 158 percent of the prediction by the current PCI design procedure. The comparison indicated that the current PCI procedure safely predicts the ledge punching shear capacity at the end location with the exceptional few cases. 52
65 4.4. Parametric Study and Results This section discusses the effect of various parameters believe to affect the behavior and the strength of ledges. The various parameters are concrete strength, ledge height, ledge projection, transverse steel, longitudinal steel in ledge, eccentricity of the applied load, bearing width, bearing length, edge distance of the load, bearing type and loading type. To highlight the effect of each parameter independently, the strength of concrete was normalized for all the parameters except for the compressive strength of concrete. The normalization was performed by modifying the measured punching shear load in each test by the ratio DDDDDD f c AAAAAA f c where, design f c is the specified nominal compressive strength of concrete and actual f c is the measured value of concrete compressive strength. The study was considered for the inner and the end locations separately as well as comparisons of the measured loads to PCI equations 5-44 and 5-45, without and with the edge distance respectively Concrete Strength Test results of the inner locations indicated that increasing the concrete strength from 7310 psi to 8800 psi resulted in an improvement in the ledge punching shear capacity. The increase in the punching shear capacity was almost proportional to the magnitude of the increase of the square root of the strength. The increase of the square root of the concrete compressive strength was 10 percent and the increase in ledge punching shear capacity was 7 percent. Such an improvement was also confirmed the finite element analysis calculated by Nafadi et 53
66 al. (2013). The measured load deflection responses of the two inner tests are shown in Figure 4-6. Ledge capacity (kips) PCI prediction 60 PCI prediction ff 50 c = 8800 psi ff c = 7310 psi 7% Increase in 40 ledge capacity Vertical Ledge Deflection (in.) Figure 4-6: Influence of concrete strength on ledge punching shear capacity for inner tests The test results of the end tests locations for the same beams showed a similar increase in the ledge punching shear capacity. It must be noted that the PCI predictions for the end failure loads gave the same results as the measured failure loads as shown in Figure 4-7 for the load deflection responses. 54
67 Ledge capacity (kips) PCI prediction ff c = 8800 psi 8% Increase in PCI prediction ff 40 c = 7310 psi ledge capacity Vertical Ledge Deflection (in.) Figure 4-7: Influence of concrete strength on ledge punching shear capacity for end tests Test results indicated that the increase in the punching shear capacity for ledges, regardless of the location, is proportional to the increase of the square root of concrete compressive strength. 55
68 Ledge Height Test results indicated that increasing the Ledge height from 8 inches to 12 inches which corresponds to 50 percent increase, greatly enhanced and increased the ledge punching shear capacity by 91 percent. The load deflection responses for the inner ledge locations are shown in Figure 4-8. The measured loads indicate that in the three cases considered, the PCI design procedure overestimates the punching shear capacity of the inner locations of the ledge. Ledge capacity (kips) 100 PCI prediction 90 h l =12 in. 80 PCI prediction 70 h l =10 in. 60 PCI prediction 50 h l =8 in % Increase in 30 ledge capacity Vertical Ledge Deflection (in.) Figure 4-8: Influence of ledge height on ledge punching shear capacity for inner tests In case of the end tests, the results also indicated that increasing the ledge height from 8 inches to 12 inches increased the ledge punching shear capacity by 77 percent as shown in Figure 4-9. It should be noted that in the case of end tests, the current PCI design procedure safely predicts the ledge punching shear capacity. 56
69 Ledge capacity (kips) h l =12 in. 70 PCI prediction h l =10 in. 60 PCI prediction 50 PCI prediction 77% Increase in 40 h l =8 in. ledge capacity Vertical Ledge Deflection (in.) Figure 4-9: Influence of ledge height on ledge punching shear capacity for end tests Test results indicated that increasing the ledge height greatly increased the ledge punching shear capacity much higher than the ratio of increase for the ledge height. 57
70 Ledge Projection The PCI prediction of the punching shear capacity for the inner tests indicate that increasing the ledge projection from 8 inches to 10 inches which is equivalent to 25 percent increase will result in increasing the ledge punching shear capacity by 13 percent. However test results indicated that the measured increase in the ledge capacity was 5 percent as shown in Figure Ledge capacity (kips) 100 PCI prediction 90 PCI prediction 80 l p =10 in. 70 l p =8 in % Increase in 30 ledge capacity Vertical Ledge Deflection (in.) Figure 4-10: Influence of ledge projection on ledge punching shear capacity for inner tests For the case of end locations, the study included three ledge projections 6, 8 and 10 inches. In all cases the eccentricity of the applied load was 3 inches. Test results indicated that increasing the ledge projection by 67 percent resulted in enhancing the ledge punching shear capacity by 25 percent. Three other end tests were performed with ledge projections 6, 8, and 58
71 10 inches, and the eccentricity of the applied load was at a maximum value by locating the bearing plate at the edge of the ledge. Test results indicated that increasing the ledge projection by 67 percent even decreased the ledge punching shear capacity by 16 percent. The current PCI equations predict an increase of 14 percent in the ledge capacity. Figure 4-11 shows the load deflection responses for the case of ledge projections with maximum eccentricity. Ledge capacity (kips) PCI prediction PCI prediction PCI prediction l p =6 in. l p =8 in. l p =10 in. 16% decrease in ledge capacity Vertical Ledge Deflection (in.) Figure 4-11: Influence of ledge projection on ledge punching shear capacity for end tests (Bearing plate at the edge of the ledge) The current PCI predictions for the inner locations overestimate the ledge punching shear capacity as well as the percentage of increase of that capacity for the case of increasing the ledge projection from 8 inches to 10 inches. However, for the end locations the PCI equations provide an adequate prediction of the ledge capacity. It should be noted that 59
72 increasing the ledge projection while keeping the applied load at maximum eccentricity decreased the ledge capacity. This effect was not captured by the PCI equations as the current design procedure does not consider the effect of the load eccentricity Transverse Steel (C bars) Test results for inner tests indicated that increasing the transverse steel reinforcement, C bars, from #3@6 inches to #5@6 inches which is almost three times increase in area, resulted in only 6 percent increase in the ledge capacity as shown in Figure The same behavior and results were concluded by the finite element analysis by Nafadi et al. (2013). The current PCI design procedure does not include this parameter in the design equations. Ledge capacity (kips) PCI prediction #3@6 in. #5@6 in. #4@6 in. 6% Increase in ledge capacity Vertical Ledge Deflection (in.) Figure 4-12: Influence of transverse steel on ledge punching shear capacity for inner tests 60
73 Test results for the end locations indicated also that the ledge punching shear capacity increased by 9 percent when the shear reinforcement area increased three times. It can be concluded that the increase in transverse steel does not have an effect on the ledge punching shear capacity Longitudinal Steel Effect of the longitudinal steel in the ledge was investigated by changing the amount of reinforcement from 2#4 to 3#6 which corresponds to an increase in area to 3.4 times. Test results indicated that the ledge punching shear capacity increased only by 8 percent as shown in the load deflection responses in Figure This increase is not captured by the PCI predictions. Ledge capacity (kips) PCI prediction 3#6 50 2#6 40 2#4 8% Increase in 30 ledge capacity Vertical Ledge Deflection (in.) Figure 4-13: Influence of longitudinal steel in ledge on ledge punching shear capacity for inner tests 61
74 For the case of end locations, the amount of reinforcement was also increased to 3.4 times. The test results indicated that such an increase resulted in only 5 percent increase in the ledge punching shear capacity as shown in Figure Ledge capacity (kips) #4 PCI prediction 3#6 40 2#6 5% Increase in 30 ledge capacity Vertical Ledge Deflection (in.) Figure 4-14: Influence of longitudinal steel in ledge on ledge punching shear capacity for end tests It should be noted that the current PCI design procedure does not consider the longitudinal steel in ledge in the equations but it safely predicts the failure loads for the end tests. It can be concluded from this study that the increase in the longitudinal steel in ledge does not have obvious effect on the ledge punching shear capacity. 62
75 Eccentricity of Applied Load Test results indicated that increasing the eccentricity of applied load from 4.5 inches to 6 inches, which represent an increase of 30 percent, resulted in 11 percent decrease in the ledge punching shear capacity. Figure 4-15 shows the load deflection responses of the two inner tests. It must be pointed out that the current PCI design procedure does not account for the eccentricity of the applied load in the design equations and the prediction overestimates the ledge punching shear capacity at the inner locations. Ledge capacity (kips) PCI prediction e=4.5 in. 70 e=6 in % Decrease in ledge capacity Vertical Ledge Deflection (in.) Figure 4-15: Influence of eccentricity of applied load on ledge punching shear capacity for inner tests For the case of end locations, the eccentricity of applied load was also increased by 2.5 times using eccentricity of 3 inches and increased to 7.5 inches. The test results indicated that the measured ledge punching shear capacity was decreased by 36 percent as shown in Figure
76 Ledge capacity (kips) 100 e=3 in e=4.5 in. 70 PCI prediction e=6 in. 60 e=7.5 in. 36% decrease in 50 ledge capacity Vertical Ledge Deflection (in.) Figure 4-16: Influence of eccentricity of applied load on ledge punching shear capacity for end tests The study indicates that eccentricity of the applied load for the inner locations of the ledge has a significant effect on the ledge punching shear capacity. The current PCI design procedure does not include this parameter in the design equations. 64
77 Bearing Width The load deflection responses for inner tests, shown in Figure 4-17, illustrate some improvement of the ledge punching shear capacity due to the increase of bearing width. The original anticipation of using a wider bearing plate was to increase the failure surface area consequently engaging additional ledge reinforcement and concrete. However, test results indicated that increasing the bearing width from 4 inches to 12 inches enhanced the ledge punching shear capacity by only 12 percent. Although this parameter is considered by the current PCI design procedure but the PCI predictions overestimate the ledge punching shear capacity at the inner location. Ledge capacity (kips) PCI prediction 70 PCI prediction 60 PCI prediction 50 b t =12 in. b t =8 in. b 40 t =4 in. 12% Increase in 30 ledge capacity Vertical Ledge Deflection (in.) Figure 4-17: Influence of bearing width on ledge punching shear capacity for inner tests 65
78 The same phenomenon was observed for the end locations. The measured increase in the ledge punching shear capacity was only 13 percent when the bearing width doubled, from 4 inches to 8 inches as shown in the load deflection responses in Figure The test results indicate that the current PCI design equations overestimate the ledge capacity at the end locations as influenced by this parameter. Ledge capacity (kips) PCI prediction b t =8 in. b t =12 in. PCI prediction 40 PCI prediction b t =4 in. 13% Increase in 30 ledge capacity Vertical Ledge Deflection (in.) Figure 4-18: Influence of bearing width on ledge punching shear capacity for end tests It can be concluded that the bearing width does not have a significant effect on the ledge punching shear capacity. 66
79 Bearing length The effect of bearing length was studied only at mid-span location. Test results showed negligible difference by increasing the bearing length the double, from 4 inches to 8 inches, as shown in the load deflection responses in Figure The PCI equations do not consider the effect of bearing length and the equations overestimate the ledge punching shear capacity. Ledge capacity (kips) 100 PCI prediction L=8 in. L=4 in Vertical Ledge Deflection (in.) Figure 4-19: Influence of bearing length on ledge punching shear capacity for inner tests Based on the limited number of tests, it is obvious that increasing the bearing length does not have a significant effect on the ledge punching shear capacity. The analysis by Nafadi et al. (2013) confirmed the same conclusion. 67
80 Edge Distance of the Load Increasing the edge distance of the applied load from the end of the ledge changed the failure surface from end failure to inner failure as shown in Figure Test results indicated that increasing the edge distance from 8 inches to 24 inches which corresponds to a 3 times increase, resulted in a 45 percent increase in the ledge punching shear capacity as shown in the load deflection responses shown in Figure The current PCI equations safely predict the ledge punching shear capacity if the edge distance triggers an end failure. On the other hand if the edge distance is large to cause an inner failure, the PCI equations overestimate the ledge punching shear capacity. It must also be noted that PCI equations predict an increase of 73 percent for the ledge punching shear capacity when increasing the edge distance from 8 inches to 24 inches. 68
 d e = 24 inches (3h l ) Figure 4-20: Effect of edge distance of the load on the failure surface Ledge capacity (kips) 100 90")

81 d e = 8 inches (1h l ) d e = 16 inches (2h l ) d e = 20 inches (2.5h l ) d e = 24 inches (3h l ) Figure 4-20: Effect of edge distance of the load on the failure surface Ledge capacity (kips) PCI prediction 50 PCI prediction d e =24 in. PCI prediction d e =20 in. 45% Increase in 40 d e =16 in. ledge capacity 30 d e =8 in. PCI prediction Vertical Ledge Deflection (in.) Figure 4-21: Influence of edge distance of the load on ledge punching shear capacity 69


82 This study conclude that edge distance of the load is an important parameter as it greatly affects both the ledge punching shear capacity and the type of the failure surface Bearing Type The bearing type was considered only at the end location. Interestingly test results indicated that the measured failure load using a steel bearing plate was not different from the measured value using Masticord pad under the steel plate. This could be due to the relative high stiffness of the 2 inch thick steel plate and the relative low stiffness of the 0.5 inch thick Masticord. Figure 4-22 (A) and Figure 4-22(B) show the two types of bearing plates steel bearing plate and Mast-cord bearing plate respectively. The load deflection responses for the end tests are shown Figure (A) Steel bearing plate (B) Masticord bearing plate Figure 4-22: Bearing type configuration 70
83 Ledge capacity (kips) Steel bearing plate 50 PCI prediction Masticord bearing plate Vertical Ledge Deflection (in.) Figure 4-23: Influence of bearing type on ledge punching shear capacity This limited test indicate that the bearing plate type has insignificant effect on the ledge punching shear capacity due to the high stiffness of the steel plate. 71
84 Loading Type The study of the loading type was considered only at the end location. One end test was conducted using monotonic loading and the other end of the same beam sustained loading was applied. For the case of sustained loading, the ledge was loaded to the service load level and then subjected to cycles of unloading and reloading up to the factored load level. At this stage, the factored load was held on the ledge for 24 hours. The ledge was then unloaded from the factored load, and its recovery was monitored for 1 hour. At the end of the hour the ledge was loaded again and another cycle was completed before loading the ledge incrementally to failure. Figure 4-24 shows the flexural strain measured at the bottom of the beam for the cyclic loading and also the monotonic loading. The test results indicated that the sustained load showed no effect on the ledge punching capacity Ledge capacity (kips) Monotonic loading Sustained loading 40 Factored load = 34.2 kips Service load = 36.5 kips Flexural Strain (microstrain) Figure 4-24: Influence of sustained load on ledge punching shear capacity 72
85 4.5. Summary and conclusions Conclusions of the parametric study indicate clearly that the current PCI equation 5-44 significantly overestimates the ledge punching shear capacity for the inner location failures. However for the end location failures the PCI equation 5-45 is on the conservative side. It is also clear that the current PCI equations generally overestimate the effect of the parameters considered by the design equations. Figure 4-25 and Figure 4-26 show a comparison between the ratio of increase / decrease of each parameter and its effect on the ledge punching shear capacity for the inner failures and end failures respectively. These comparisons are given to evaluate the effect of each parameter on the ledge capacity as shown in Figure 4-25 and Figure 4-26 for the inner failures and end failures respectively. Percentage of increase in ledge capacity Datum (f'c) Ledge Height Area of Transverse Steel Ratio of increase / decrease in parameter Figure 4-25: Effect of all parameters on ledge punching shear capacity for inner failures 73
86 100 Percentage of increase / decrease in ledge capacity Datum (f'c) Ledge Height Ledge projection Area of Transverse Steel Area of Longitudinal Steel Eccentricity of applied load Bearing width Edge distance Ratio of increase / decrease in parameter Figure 4-26: Effect of all parameters on ledge punching shear capacity for end failures The comparisons shown in these figures indicate that the ledge punching shear capacity is greatly influenced by mainly four parameters; ledge height, concrete compressive strength, eccentricity of the applied load and the edge distance of the applied load. It should be noted that the effect of concrete compressive strength was evaluated based on unpublished and analytical work performed by Nafadi. The effect of bearing length, bearing type and effect of sustained load were minimal and therefore are not shown in the figures. 74
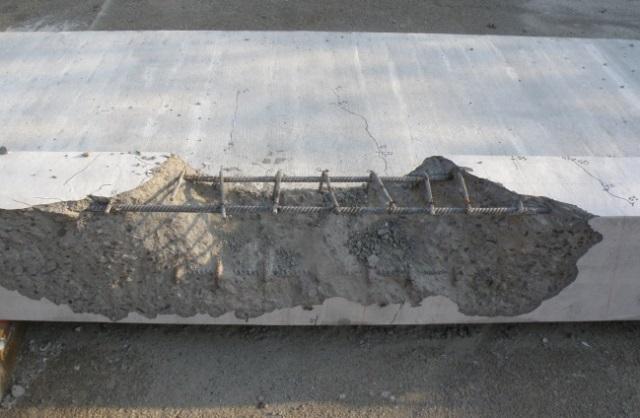
87 5. Analysis of Test Results This chapter presents the various failure surfaces observed from the experimental program for the inner and end locations along the ledge of L-shaped concrete beams in attempt to develop an idealized failure surface and the corresponding shear stresses based on the measured failure load. The idealized failure surfaces are compared to the idealized failure surface currently used by the PCI design procedure Inner Failure Surface The inner measured failure surface typically start from the back of the bearing plate and extended diagonally along the top surface of the ledge up to the front face of the ledge. The failure extended to the front face of the ledge with an angle ranging from 27 to 34 degrees as shown in Figure 5-1(A). After completion of the test, the cracked concrete was chipped off to measure the geometry of the failure surface. Elevation of the chipped surface shown in Figure 5-1(B), illustrate clearly the shape of the failure surface. The bottom view of the failure surface, shown in Figure 5-1(C), shows that the failure was extended into the beam and bypassed the hanger bars. It should be noted that the current PCI failure surface starts at the edge of the bearing plate, and extends in the front face of the ledge with a 45 degree angle as shown Figure

 Elevation view of the chopped")
 Bottom view of Hanger bars Figure")
88 Bearing plate location (A) Failure surface of a beam with 8 inch ledge height. 34ᵒ (B) Elevation view of the chopped failure surface. (C) Bottom view of failure surface. Hanger bars Figure 5-1: Inner failure surface boundaries 76
89 Figure 5-2: PCI failure surface Selected typical failure surfaces for the tested spandrel beams with different ledge dimensions are shown in Figure 5-3. The figure shows the failure surface before and after chipping off the cracked concrete in Figures 5-3 (A) and (B) respectively for each case. Figure 5-3(1A & 1B) shows the failure surface for an 8 inches ledge height and 8 inches ledge projection spandrel beam. The failure surface for a 10 inches ledge height with 6 inches and 8 inches ledge projection are shown in Figure 5-3(2A & 2B) and Figure 5-3(3A & 3B) respectively. Inspections of these failure surfaces indicate clearly that the failure surface starts always at the back of the bearing plate and the horizontal and vertical diagonal cracks are much flatter than the current angles assumed by the PCI for inner failure surfaces. 77

 Beam with 10 ledge height and 6")
 Beam with 10 ledge height and 8")

90 (1A) Beam with 8 ledge height and 8 ledge projection. (1B) Beam with 8 ledge height and 8 ledge projection. (2A) Beam with 10 ledge height and 6 ledge projection. (2B) Beam with 10 ledge height and 6 ledge projection. (3A) Beam with 10 ledge height and 8 ledge projection. (3B) Beam with 10 ledge height and 8 ledge projection. Figure 5-3: Inner failure surface examples 78
. Based on the measured geometry of the failures, several idealized surfaces are considered.")

91 Idealized Surface for Inner Failures Based on the observed failure surface, a simplified surface configuration can be assumed as shown in Figure 5-4(A) and a corresponding idealized failure surface can be introduced as shown in Figure 5-4(B). Based on the measured geometry of the failures, several idealized surfaces are considered. The different idealized surfaces are directly related to the horizontal and vertical angles of the observed diagonal cracks. Figure 5-5 introduces the selected three failure surfaces with different geometry. In each case, the simplified and idealized failure surfaces are overlaid on the measured one. The first failure surface 1, shown in Figure 5-5(A), is based on a horizontal angle of 45 degrees starting from the back edges of the bearing plate and 27 degree angle in the front face of the ledge. The second failure surface 2, shown in Figure 5-5(B) is based on a horizontal angle of 45 degrees and a vertical angle of 34 degrees. The third failure surface 3 is based on a horizontal angle and vertical angle of 27 degrees and 34 degrees respectively as shown in Figure 5-5(C). (A) Observed inner failure surface (B) Idealization of inner failure surface h l b t l p Figure 5-4: Idealization of inner failures 79
 + (2h l l p ) Idealized failure surface 2 Observed failure surface l p 2h l + b t 34ᵒ (B) Idealized failure surface 2: h l (2h l + b t ) + (2h l l p ) Idealized failure surface 3")
92 Idealized failure surface 1 Observed failure surface l p 1.5h l + 3b t 27ᵒ (A) Idealized failure surface 1: h l (1.5h l + 3b t ) + (2h l l p ) Idealized failure surface 2 Observed failure surface l p 2h l + b t 34ᵒ (B) Idealized failure surface 2: h l (2h l + b t ) + (2h l l p ) Idealized failure surface 3 Observed failure surface l p 2.5h l + b t 34ᵒ (C) Idealized failure surface 3: h l (2.5h l + b t ) + (2h l l p ) Figure 5-5: Different observed inner failure surfaces and corresponding idealized surfaces 80
93 A summary of the selected idealized failure surfaces, including the currently considered by the PCI design procedure, are listed in Table 5-1. Table 5-1: Different idealized areas for inner failures Area of idealized failure surfaces Failure surface 1 h l (1.5h l + 3b t ) + (2h l l p ) Failure surface 2 h l (2h l + b t ) + (2h l l p ) Failure surface 3 h l (2.5h l + b t ) + (2h l l p ) PCI failure surface h l (h l + b t ) + (2h l l p ) Where; h l : Ledge height of the beam, in. b t : Bearing width of the bearing plate, in. l p : Ledge projection of the beam, in. It should be noted that the ledge projection was selected to approximate the diagonal crack from the back edge of the bearing plate towards the hanger bars of the beam rather than considering the length of the bearing plate which showed minimum effect on ledge capacity. To select the optimum idealized failure surface, the corresponding shear stress for each idealized surface was determined based on the measured failure load. Statistical analysis was performed to determine the most appropriate idealized surface in terms of the statistical parameters and also provides good agreement with the geometry of the observed failure surfaces. 81


94 Shear Stresses of Inner Failures The idealized area of the inner failure surface consists of three vertical planes, one back plane and two side planes. The applied vertical load on the ledge, P applied, with an eccentricity e from the front face of the web, induces vertical shear forces V b and V on the back plane and side planes respectively. Eccentricity of the applied load induces bending moment which is resisted by two torsional moments, M T, two bending moments, M s, on each side of the idealized surface and transverse bending moment, M b, on the back plane. The bending moments induce normal stresses on the vertical planes which are considered in the analysis. Figure 5-6 shows a free body diagram illustrating the different forces acting on a typical idealized failure surface. P applied M s M s V M b V b V M T M T Figure 5-6: Free body diagram of the ledge of inner location failures 82
95 Distribution of the shear stresses on the back plane, v b, due to the vertical load, is typically uniform. However, the presence of the torsional moment induces a non-uniform distribution with a minimum shear stress at the back plane and a maximum shear stress, v, at the edge of the ledge. The average value of the shear stresses on the sides is close to the shear stress on the back plane as shown in Figure 5-7. Average shear stress of the side plane v v b v Figure 5-7: Shear stress distribution on the idealized surface For simplicity, the following analysis assumes uniform shear stress distribution on the three planes of the idealized surface. The shear stresses for the three selected idealized failure surfaces 1, 2, 3 and the PCI idealized failure surface, using the measured failure load for each test, are shown in Figure 5-8, Figure 5-9, Figure 5-10 and Figure 5-11, respectively. The minimum shear stress and the average shear stress, expressed in terms of the square root of concrete compressive strength, for each surface are shown in each Figure. The coefficient of variation of the average shear stresses for each failure surface was calculated and is also shown in each Figure. 83
96 Shear stress (x f'c) (psi) C.O.V = 12.0% Average shear stress = 1.8 f c Minimum shear stress = 1.2 f c Test Number Figure 5-8: Shear stresses for all inner location tests using idealized failure surface 1 The analysis indicated that the average shear stress for idealized failure surface 1 is 1.8 f c and the minimum value is 1.2 f c as shown in Figure 5-8. The coefficient of variation of the average shear stresses was 12.0 percent.. Shear stress (x f'c) (psi) C.O.V = 6.6% Average shear stress = 2 f c Minimum shear stress = 1.8 f c Test Number Figure 5-9: Shear stresses for all inner location tests using idealized failure surface 2 84
97 The average shear stress for the idealized failure surface 2 was 2.0 f c while the minimum shear stress for several tests was 1.8 f c as shown in Figure 5-9. The coefficient of variation of the average shear stresses was 6.6 percent which establish better confident in this idealized surface in comparison to the first idealized surface. Shear stress (x f'c) (psi) C.O.V = 6.0% Average shear stress = 1.8 f c Minimum shear stress = 1.6 f c Test Number Figure 5-10: Shear stress for all inner location tests using idealized failure surface 3 Due to the relative large assumed failure surface 3 in comparison to the idealized failure surface 2, the average shear stress and the minimum are significantly reduced, as shown in Figure 5-10, which are not realistic in comparison to the values typically used for punching shear failure. The coefficient of variation was 6.0 percent which is the same order of magnitude of the idealized surface 2. 85
98 Shear stress (x f'c) (psi) C.O.V = 9.1% Average shear stress = 2.6 f c Minimum shear stress = 2.2 f c Test Number Figure 5-11: Shear stress for all inner location tests using PCI idealized failure surface Figure 5-11 shows the results of the same analysis performed on the idealized failure surface currently used by the PCI design procedure. For this case the coefficient of variation was 9.1 percent and the minimum shear stress is 2.2 f c. A summary of the analysis for each idealized failure surface are given in Table 5-2. Idealized failure surface 1 Idealized failure surface 2 Idealized failure surface 3 PCI idealized failure surface Table 5-2: Summary of results from the analysis done on different idealized areas Failure Surface Area Minimum shear stress Average shear stress Coefficient of variation h l (1.5h l + 3b t ) + (2h l l p ) 1.2 f c 1.8 f c 12.0% h l (2h l + b t ) + (2h l l p ) 1.8 f c 2.0 f c 6.6% h l (2.5h l + b t ) + (2h l l p ) 1.6 f c 1.8 f c 6.0% h l (h l + b t ) + (2h l l p ) 2.2 f c 2.6 f c 9.10% 86

 70 60 50 40 30 20 10 0 0 10 20 30 40 50 60 70 80 90 100 Measured load (kips) Figure 5-13: Predicted loads")
99 The analysis indicated that idealized failure surface 2, shown in Figure 5-12, was the most appropriate surface which can be used to represent the observed failure surface since it provided good agreement with the geometry of the observed failure surfaces. Idealized failure surface 2 also showed reasonable values for the coefficient of variation. The predicted failure load for each inner test was determined using the minimum value of shear stresses and the selected idealized area and are compared to the measured values in Figure h l b t l p Figure 5-12: Idealized failure surface Predicted load (kips) Measured load (kips) Figure 5-13: Predicted loads compared to experimental measured loads for inner failures 87
100 The comparison shown in Figure 5-13, clearly indicates that idealized failure surface 2 can be used with the stress of 1.8 f c to predict the ledge punching shear capacity for the inner failures of short span L-shaped spandrel beams. Due to the applied load a uniform distribution of shear stresses is expected on the back plane, an alternative approach may be used based on an assumed uniform shear stress of 2.0 f c on the back plane. In this case the average minimum shear stress on the two sides is 1.6 f c. The comparison using this approach is shown in Figure Predicted load (kips) Measured load (kips) Figure 5-14: Alternative approach predicted loads compared to measure loads for inner failures The alternative approach also gives good predictions of the failure loads as shown in the comparison in Figure The two points when the predicted loads are higher than the measured values represent tests where the bearing widths were 8 inches and 12 inches which are not common values used for bearing widths. 88
101 5.2. End Failure Surface The geometry and corresponding uniform shear strength of the failure surface at the end of the ledge was determined following the same procedures used for the inner failure surface. Figure 5-15 (A) shows typical failure surface which initiated by formation of crack on the back of the bearing plate and extended horizontally towards the end of the ledge along the top surface. From the other side the crack on the back of the bearing plate extended diagonally along the top surface of the ledge up to front face of the ledge and then extended on the front face of the ledge with an angle approximately ranging from 27 to 34 degrees as also shown in Figure 5-15 (A). After completion of the test, the cracked concrete was chipped off to measure the geometry of the failure surface. Elevation of the chipped surface shown in Figure 5-15 (B) illustrates clearly the shape of the failure surface. The bottom view of the failure surface, shown in Figure 5-15 (C), shows that the failure was extended into the beam and bypassed the hanger bars. 89

 Elevation view of failure surface after")
 Bottom view of failure surface after Hanger")
102 Bearing plate location (A) Failure surface of a beam with 10 inch ledge height and 16 inch edge distance. 34ᵒ (B) Elevation view of failure surface after chipping off the concrete. (C) Bottom view of failure surface after chipping off the concrete. Hanger bars Figure 5-15: End failure surface boundaries 90

 and (B) for each case respectively.")
 and Figure 5-16 (3A & 3B) are for beams with ledge")

 Beam with h l = 8 in. and d e = 8 in.")
 Beam with h l = 10 in. and d e = 16 in. (3A) Beam with h l = 12 in., and d e = 16 in.")
103 The described geometrical configuration of the failure surface was observed for all tested end failures of spandrels with an edge distance less than twice the ledge height. Selected failure surfaces from different spandrels before and after the cracked concrete was chipped off are shown in Figure 5-16 (A) and (B) for each case respectively. Figure 5-16 (1A & 1B) is the failure surface of 8 inches ledge height with an 8 inches edge distance Figure 5-16 (2A & 2B) and Figure 5-16 (3A & 3B) are for beams with ledge height 10 inches and 12 inches respectively and edge distance less than twice the ledge height. All the above figures confirm that the typical end surface take place when the edge distance is less than twice the ledge height. (1A) Beam with h l = 8 in. and d e = 8 in. (1B) Beam with h l = 8 in. and d e = 8 in. (2A) Beam with h l = 10 in. and d e = 16 in. (2B) Beam with h l = 10 in. and d e = 16 in. (3A) Beam with h l = 12 in., and d e = 16 in. (3B) Beam with h l = 12 in. and d e = 16 in. Figure 5-16: End failure surface examples when d e < 2h l 91


 Beam with h l = 8 inches and d e = 16 inches. (B) Beam with h l = 8 inches and d e = 16 inches.")
104 When the edge distance of the applied load is equal or more than twice the ledge height the measured failure surface is similar to the failure surface introduced for the inner locations as shown in Figure Figure 5-17 (A, B & C) shows the end failure surface for 8 inches ledge height and 16 inches edge distance which is twice the ledge height. The failures in these cases clearly indicate that the failure did not extend to the end of the ledge and the failure became close to the inner failure. Figure 5-17 (D) confirms the behavior for 12 inches ledge eight and 24 inches edge distance which twice the ledge height. (A) Beam with h l = 8 inches and d e = 16 inches. (B) Beam with h l = 8 inches and d e = 16 inches. (C) Complete inner failure of a beam with h l = 8 inches and d e = 16 inches. (D) Complete inner failure of a beam with h l = 12 inches and d e = 24 inches. Figure 5-17: Selected failures when d e = 2h l 92

105 When the edge distance of the applied load was more than twice the ledge height, the observed failure surface was obviously an inner failure as shown in Figure 5-18 for 8 inches ledge height and edge distance 20 and 24 inches which are more than twice the ledge height. Beam with h l = 8 inches and d e = 20 inches. Beam with h l = 8 inches and d e = 24 inches. Beam with h l = 8 inches and d e = 24 inches. Figure 5-18: Selected failures when d e > 2h l 93


106 Idealized Surface for End Failures The simplified configuration and the idealized failure surface for a typical end failure are shown in Figure Following the same procedure used for the inner failures, several idealized surfaces could be considered in the analysis as shown in Figure The observed failure surface 1, shown in Figure 5-20 (A), is based on horizontal diagonal crack angle of 45 degrees and vertical diagonal angle of 27 degrees from one side towards the center of the beam. Towards the edge of the beam it is assumed that the crack on the back of the bearing plate extends to the end and continues on the side of the ledge with an angle of 34 degrees. The second failure surface 2, shown in Figure 5-20 (B), is based on horizontal diagonal crack angle of 45 degrees and vertical diagonal angle of 34 degrees. The third failure surface 3 is based on a horizontal crack angle and a vertical diagonal angle of 27 degrees and 34 degrees respectively as shown in Figure 5-20 (C). The simplified and idealized failure surfaces are over laid to the observed failure surface in each case Observed end failure surface Idealized end failure surface d e h l l p Figure 5-19: Idealization of end failures 94
 Idealized failure surface 1: h l (0.75h l + 1.")
 Idealized failure surface 2: h l (h l + 0.")

107 Observed failure surface Idealized failure surface 1 l p 0.75h l + 1.5b t + d e 27ᵒ (A) Idealized failure surface 1: h l (0.75h l + 1.5b t + d e ) + (h l l p ) Idealized failure surface 2 Observed failure surface l p 34ᵒ h l + 0.5b t + d e (B) Idealized failure surface 2: h l (h l + 0.5b t + d e ) + (h l l p ) Observed failure surface Idealized failure surface 3 l p 1.25h l + 0.5b t + d e 34ᵒ (C) Idealized failure surface 3: h l (1.25h l + 0.5b t + d e ) + (h l l p ) Figure 5-20: Different observed end failure surfaces and corresponding idealized surfaces 95
Nafadi, Khalaf Alla, Lucier, Rizkalla, Zia and Klein BEHAVIOR AND DESIGN OF DIRECTLY LOADED LEDGES OF SHORT SPAN L- SHAPED BEAMS
 BEHAVIOR AND DESIGN OF DIRECTLY LOADED LEDGES OF SHORT SPAN L- SHAPED BEAMS Mohamed Nafadi, Omar Khalaf Alla, Gregory Lucier, Sami Rizkalla, Paul Zia, NC State University, Raleigh, NC and Gary Klein, Wiss,
Precast concrete L-shaped spandrel beams are commonly
 Ledge behavior and strength of short-span L-shaped beams Mohamed K. Nafadi Omar M. Khalafalla Gregory W. Lucier Sami Rizkalla Paul Zia and Gary J. Klein Precast concrete L-shaped spandrel beams are commonly
ABSTRACT. HARIHARAN, VIVEK. Behavior of Precast L-Shaped Spandrel Beams. (Under the direction of Dr. Sami Rizkalla.)
") ABSTRACT HARIHARAN, VIVEK. Behavior of Precast L-Shaped Spandrel Beams. (Under the direction of Dr. Sami Rizkalla.) Reinforced and Prestressed precast spandrel beams are commonly used in parking structures
ABSTRACT HARIHARAN, VIVEK. Behavior of Precast L-Shaped Spandrel Beams. (Under the direction of Dr. Sami Rizkalla.) Reinforced and Prestressed precast spandrel beams are commonly used in parking structures
Development of a rational design methodology for precast concrete slender spandrel beams: Part 1, experimental results
 Development of a rational design methodology for precast concrete slender spandrel beams: Part 1, experimental results Gregory Lucier, Catrina Walter, Sami Rizkalla, Paul Zia, and Gary Klein Editor s quick
Precast concrete double-tee beams with thin stems
 Dapped ends of prestressed concrete thin-stemmed members: Part 1, experimental testing and behavior Amir W. Botros, Gary J. Klein, Gregory W. Lucier, Sami H. Rizkalla, and Paul Zia Precast concrete double-tee
Development of a rational design methodology for precast concrete slender spandrel beams: Part 2, analysis and design guidelines
 Development of a rational design methodology for precast concrete slender spandrel beams: Part 2, analysis and design guidelines Gregory Lucier, Catrina Walter, Sami Rizkalla, Paul Zia, and Gary Klein
Precast Concrete, L-Shaped Spandrels Revisited: Full-Scale Tests
 Precast Concrete, L-Shaped Spandrels Revisited: Full-Scale Tests Sami Rizkalla, Ph.D. P.Eng. Distinguished Professor of Civil, Construction, and Environmental Engineering and Director Constructed Facilities
SHEAR AND BUCKLING STRENGTHENING OF STEEL BRIDGE GIRDER USING SMALL-DIAMETER CFRP STRANDS
 20 th International Conference on Composite Materials Copenhagen, 19-24 th July 2015 SHEAR AND BUCKLING STRENGTHENING OF STEEL BRIDGE GIRDER USING SMALL-DIAMETER CFRP STRANDS Hamid Kazem 1, Sami Rizkalla
Structural Performance of 8-inch NRG Concrete Masonry Units. Report Compiled for: Niagara Regional Group. Date: January 28, 2013
 Structural Performance of 8-inch NRG Concrete Masonry Units Report Compiled for: Niagara Regional Group Date: January 28, 2013 Report Prepared by: Dr. Shawn Gross, Associate Professor Dr. David Dinehart,
TORSION SIMPLIFIED: A FAILURE PLANE MODEL FOR DESIGN OF SPANDREL BEAMS
 TORSION SIMPLIFIED: A FAILURE PLANE MODEL FOR DESIGN OF SPANDREL BEAMS Gary Klein, Gregory Lucier, Sami Rizkalla, Paul Zia and Harry Gleich Biography: Gary Klein, FACI, is Executive Vice President and
Seliem, Lucier, Rizkalla, and Zia BEHAVIOR OF CONCRETE BRIDGE DECKS REINFORCED WITH HIGH- STRENGTH STEEL
 26 CBC BEHAVIOR OF CONCRETE BRIDGE DECKS REINFORCED WITH HIGH- STRENGTH STEEL HATEM SELIEM GREGORY LUCIER SAMI RIZKALLA PAUL ZIA Constructed Facilities Laboratory Department of Civil Engineering, North
Footings GENERAL CONSIDERATIONS 15.2 LOADS AND REACTIONS 15.4 MOMENT IN FOOTINGS
 4 Footings GENERAL CONSIDERATIONS Provisions of Chapter 15 apply primarily for design of footings supporting a single column (isolated footings) and do not provide specific design provisions for footings
BEHAVIOR OF BRIDGE DECKS REINFORCED WITH MMFX STEEL
 BEHAVIOR OF BRIDGE DECKS REINFORCED WITH MMFX STEEL HATEM SELIEM GREGORY LUCIER SAMI RIZKALLA PAUL ZIA Constructed Facilities Laboratory Department of Civil Engineering, North Carolina State University
5.4 Analysis for Torsion
 5.4 Analysis for Torsion This section covers the following topics. Stresses in an Uncracked Beam Crack Pattern Under Pure Torsion Components of Resistance for Pure Torsion Modes of Failure Effect of Prestressing
CHAPTER III DYNAMIC BEHAVIOR OF A LABORATORY SPECIMEN
 CHAPTER III DYNAMIC BEHAVIOR OF A LABORATORY SPECIMEN To address the vibration response of a long span deck floor system, an experiment using a specimen that resembles the conditions found in the in-situ
Contents. Foreword 1 Introduction 1
 Contents Notation x Foreword xiii 1 Introduction 1 1.1 Aims of the Manual 1 1.2 Eurocode system 1 1.3 Scope of the Manual 3 1.4 Contents of the Manual 4 1.5 Notation and terminology 4 2 General principles
ABSTRACT. RAGAN, DAVID MICHAEL. Behavior of Efficient Two Story Precast Concrete Wall Panels. (Under the direction of Dr.
 ABSTRACT RAGAN, DAVID MICHAEL. Behavior of Efficient Two Story Precast Concrete Wall Panels. (Under the direction of Dr. Sami Rizkalla) Precast concrete panels are utilized by engineers in order to create
Chapter 2 Notation and Terminology
 Reorganized 318 Chapter Titles Chapter 1 General 1.1 Scope 1.2 Purpose 1.3 Interpretation 1.4 Drawings and Specifications 1.5 Testing and Inspection 1.6 Administatration and Enforcement 1.6.1 Retention
FRP Shear Transfer Mechanism for Precast Prestressed Concrete Sandwich Load Bearing Panels. Sami Rizkalla, Tarek Hassan and Gregory Lucier
 FRP Shear Transfer Mechanism for Precast Prestressed Concrete Sandwich Load Bearing Panels Sami Rizkalla, Tarek Hassan and Gregory Lucier Synopsis: This paper describes the structural behavior of precast
Analysis and Design of One-way Slab System (Part-I)
") Lecture-02 Analysis and Design of One-way Slab System (Part-I) By: Prof Dr. Qaisar Ali Civil Engineering Department UET Peshawar www.drqaisarali.com 1 Topics Addressed Concrete Floor Systems Analysis and
Lecture-02 Analysis and Design of One-way Slab System (Part-I) By: Prof Dr. Qaisar Ali Civil Engineering Department UET Peshawar www.drqaisarali.com 1 Topics Addressed Concrete Floor Systems Analysis and
BOND BEHAVIOR OF MMFX (ASTM A 1035) REINFORCING STEEL
 REINFORCING STEEL") BOND BEHAVIOR OF MMFX (ASTM A 1035) REINFORCING STEEL A Summary Report Of a Cooperative Research Program Phase I Submitted to MMFX Technologies Corporation Irvine, California by Hatem M. Seliem, Arm Hosny,
BOND BEHAVIOR OF MMFX (ASTM A 1035) REINFORCING STEEL A Summary Report Of a Cooperative Research Program Phase I Submitted to MMFX Technologies Corporation Irvine, California by Hatem M. Seliem, Arm Hosny,
Design and analysis of T and inverted L beams- Theory and Examples
 Design and analysis of T and inverted L beams- Theory and Examples - Dr. E. R. Latifee Reference Book: Design of Reinforced Concrete by Jack C. McCormac and Russell H. Brown, Clemson University, 9 th Edition,
Reinforced Concrete Design. A Fundamental Approach - Fifth Edition
 CHAPTER REINFORCED CONCRETE Reinforced Concrete Design A Fundamental Approach - Fifth Edition Fifth Edition REINFORCED CONCRETE A. J. Clark School of Engineering Department of Civil and Environmental Engineering
Behavior and Strength of Slab-Edge Beam-Column Connections under Shear Force and Moment
 Behavior and Strength of Slab-Edge Beam-Column Connections under Shear Force and Moment Omar M. Ben-Sasi Abstract A total of fourteen slab-edge beam-column connection specimens were tested gradually to
AC : STUDENT FEEDBACK AND LESSONS LEARNED FROM ADDING LABORATORY EXPERIENCES TO THE REINFORCED CONCRETE DESIGN COURSE
 AC 2007-2802: STUDENT FEEDBACK AND LESSONS LEARNED FROM ADDING LABORATORY EXPERIENCES TO THE REINFORCED CONCRETE DESIGN COURSE Micah Hale, University of Arkansas Seamus Freyne, Manhattan College Stephan
The Use of Bolted U-Link Swimmer Bars in the Reinforced Concrete Beams
 IOSR Journal of Engineering (IOSRJEN) e-issn: 2250-3021, p-issn: 2278-8719 Vol. 3, Issue 10 (October. 2013), V5 PP 26-32 The Use of Bolted U-Link Swimmer Bars in the Reinforced Concrete Beams Moayyad M.
VARIOUS TYPES OF SLABS
 VARIOUS TYPES OF SLABS 1 CHOICE OF TYPE OF SLAB FLOOR The choice of type of slab for a particular floor depends on many factors. Economy of construction is obviously an important consideration, but this
Appendix B Flexural Resistance of Members with Reinforcing Bars Lacking Well-Defined Yield Plateau
 Appendix B Flexural Resistance of Members with Reinforcing Bars Lacking Well-Defined Yield Plateau B.1 Introduction The nominal moment capacity (M n ) for non-prestressed members is commonly calculated
ST7008 PRESTRESSED CONCRETE
 ST7008 PRESTRESSED CONCRETE QUESTION BANK UNIT-I PRINCIPLES OF PRESTRESSING PART-A 1. Define modular ratio. 2. What is meant by creep coefficient? 3. Is the deflection control essential? Discuss. 4. Give
Supplemental Plan Check List for Concrete Special Moment Resisting Frame
 Plan Check / PCIS Application Number: Your feedback is important, please visit our website to complete a Customer Survey at /LADBSWeb/customer-survey.jsf. If you have any questions or need clarification
EXPERIMENTAL INVESTIGATION ON THE INTERACTION OF REINFORCED CONCRETE FRAMES WITH PRECAST-PRESTRESSED CONCRETE FLOOR SYSTEMS
 EXPERIMENTAL INVESTIGATION ON THE INTERACTION OF REINFORCED CONCRETE FRAMES WITH PRECAST-PRESTRESSED CONCRETE FLOOR SYSTEMS B.H.H. Peng 1, R.P. Dhakal 2, R.C. Fenwick 3, A.J. Carr 4 and D.K. Bull 5 1 PhD
Load capacity of slender reinforced concrete walls governed by flexural cracking strength of concrete
 Magazine of Concrete Research, 2000, 52, No. 3, June, 169±175 Load capacity of slender reinforced concrete walls governed by flexural cracking strength of concrete J. G. Sanjayan Monash University This
Experimental study on the seismic performance of RC moment resisting frames with precast-prestressed floor units.
 Experimental study on the seismic performance of RC moment resisting frames with precast-prestressed floor units. B.H.H. Peng, R.C. Fenwick, R.P. Dhakal & D.K. Bull Department of Civil and Natural Resources
BS EN :2004 EN :2004 (E)
") Contents List 1. General 1.1 Scope 1.1.1 Scope of Eurocode 2 1.1.2 Scope of Part 1-1 of Eurocode 2 1.2 Normative references 1.2.1 General reference standards 1.2.2 Other reference standards 1.3 Assumptions
Contents List 1. General 1.1 Scope 1.1.1 Scope of Eurocode 2 1.1.2 Scope of Part 1-1 of Eurocode 2 1.2 Normative references 1.2.1 General reference standards 1.2.2 Other reference standards 1.3 Assumptions
4/12/2011. Outline. Introduction. Introduction. Introduction. Introduction
 Evaluation of the Orientation of 9 and 18 Reinforcing Bar Hooks in Wide Members By: Nichole Podhorsky, M.S. Student Lesley Sneed, Ph.D., P.E., Missouri S&T Outline I. Introduction II. Objective III. 1.
Behavior of Skew Reinforced and Prestressed Concrete Composite Decks. Hany Ahmed Ahmed Dahish, Ahmed Foad El-ragi and Alaa Aly El-Sayed
 Life Science Journal 212;9(4) Behavior of Skew Reinforced and Prestressed Concrete Composite Decks Hany Ahmed Ahmed Dahish, Ahmed Foad El-ragi and Alaa Aly El-Sayed Faculty of Engineering, Fayoum University
Ce 479 Reinforced Masonry Fall 2005
 INTRODUCTION TO STRUCTURAL DESIGN OF REINFORCED MASONRY In the preceding lecture on structural design of masonry, we have seen examples of unreinforced masonry bearing walls. In bearing walls, when the
Lehigh Preserve. Lehigh University. Sonam Srivastava Lehigh University. Theses and Dissertations
 Lehigh University Lehigh Preserve Theses and Dissertations 2013 Analytical Lateral Load Response of Unbonded Post-Tensioned Cast-in-Place Concrete Special Structural Walls with Bonded or Debonded Longitudinal
Presentation in support of
 Presentation in support of Proposed Acceptance Criteria For Continuous or Semi- Continuous Fiber-Reinforced Grid Connectors used in combination with Rigid Insulation in Concrete Sandwich Panel Construction
TABLE OF CONTENTS FINITE ELEMENT MODELING OF CONCRETE FILLED DOUBLE SKIN
 TABLE OF CONTENTS SECTION 1 INTRODUCTION... 1 1.1 Introduction... 1 1.2 Objectives and Scope of Work... 2 1.2.1 Experimental Phase... 2 1.2.2 Analytical Phase... 3 1.3 Outline of the Report... 4 SECTION
Seismic-Resistant Connections of Edge Columns with Prestressed Slabs
 ACI STRUCTURAL JOURNAL Title no. 102-S32 TECHNICAL PAPER Seismic-Resistant Connections of Edge Columns with Prestressed Slabs by Mark Ritchie and Amin Ghali This paper reviews the procedure developed by
PRIMARY AND SECONDARY REINFORCEMENTS IN CORBELS UNDER COMBINED ACTION OF VERTICAL AND HORIZONTAL LOADINGS
 16th International Conference on Composite Structures ICCS 16 A. J. M. Ferreira (Editor) FEUP, Porto, 2011 PRIMARY AND SECONDARY REINFORCEMENTS IN CORBELS UNDER COMBINED ACTION OF VERTICAL AND HORIZONTAL
FLEXURAL AND SHEAR STRENGTHENING OF REINFORCED CONCRETE STRUCTURES WITH NEAR SURFACE MOUNTED FRP RODS
 FLEXURAL AND SHEAR STRENGTHENING OF REINFORCED CONCRETE STRUCTURES WITH NEAR SURFACE MOUNTED FRP RODS ABSTRACT The use of Near Surface Mounted (NSM) Fiber Reinforced Polymer (FRP) rods is a new and promising
BEHAVIOR OF INFILL MASONRY WALLS STRENGTHENED WITH FRP MATERIALS
 BEHAVIOR OF INFILL MASONRY WALLS STRENGTHENED WITH FRP MATERIALS D.S. Lunn 1,2, V. Hariharan 1, G. Lucier 1, S.H. Rizkalla 1, and Z. Smith 3 1 North Carolina State University, Constructed Facilities Laboratory,
Tests of R/C Beam-Column Joint with Variant Boundary Conditions and Irregular Details on Anchorage of Beam Bars
 October 1-17, 8, Beijing, China Tests of R/C Beam-Column Joint with Variant Boundary Conditions and Irregular Details on Anchorage of Beam Bars F. Kusuhara 1 and H. Shiohara 1 Assistant Professor, Dept.
Pile to Slab Bridge Connections
 Pile to Slab Bridge Connections Mohamed I. Ayoub 1, David H. Sanders 2 and Ahmed Ibrahim 3 Abstract Slab bridges are a common bridge type, where the pile extends directly from the ground to the superstructure.
Investigating the Use of Spliced Swimmer Bars as Shear Reinforcement in Reinforced Concrete Beams
 IOSR Journal of Engineering (IOSRJEN) ISSN (e): 2250-3021, ISSN (p): 2278-8719 Vol. 05, Issue 02 (February. 2015), V2 PP 47-54 www.iosrjen.org Investigating the Use of Spliced Swimmer Bars as Shear Reinforcement
Copyright. Bradley Allen Wood
 Copyright by Bradley Allen Wood 1997 Investigation of Design and Repair Methods for Cantilever Bridge Bents Volume II by Bradley Allen Wood, B.S., M.S. Dissertation Presented to the Faculty of the Graduate
Copyright. Bradley Allen Wood
 Copyright by Bradley Allen Wood 1997 Investigation of Design and Repair Methods for Cantilever Bridge Bents Volume II by Bradley Allen Wood, B.S., M.S. Dissertation Presented to the Faculty of the Graduate
APPENDIX B. LOAD FRAME. This Appendix will describe the philosophy in the design and operation of the loading system.
 APPENDIX B. LOAD FRAME This Appendix will describe the philosophy in the design and operation of the loading system. LOAD FRAME The large-scale gusset plate testing required a unique loading fixture. A
SEISMIC RESPONSE OF LINEAR, FLANGED, AND CONFINED MASONRY SHEAR WALLS
 SEISMIC RESPONSE OF LINEAR, FLANGED, AND CONFINED MASONRY SHEAR WALLS M. T. Shedid 1, W. W. El-Dakhakhni 2, and R. G. Drysdale 3 1 Ph.D. Candidate, Dept. of Civil Engineering, McMaster University, Hamilton.
Level 6 Graduate Diploma in Engineering Structural analysis
 9210-111 Level 6 Graduate Diploma in Engineering Structural analysis Sample Paper You should have the following for this examination one answer book non-programmable calculator pen, pencil, ruler, drawing
Steel Design Guide Series. Steel and Composite Beams with. Web Openings
 Steel Design Guide Series Steel and Composite Beams with Web Openings Steel Design Guide Series Steel and Composite Beams with Web Openings Design of Steel and Composite Beams with Web Openings David Darwin
TENSION TESTS OF HEADED STUD ANCHORAGES IN NARROW / THIN EDGE MEMBERS
 3 rd International Symposium on Connections between Steel and Concrete Stuttgart, Germany, September 27 th -29 th, 2017 TENSION TESTS OF HEADED STUD ANCHORAGES IN NARROW / THIN EDGE MEMBERS Neal S. Anderson
twenty two concrete construction: flat spanning systems, columns & frames ARCHITECTURAL STRUCTURES: FORM, BEHAVIOR, AND DESIGN
 ARCHITECTURAL STRUCTURES: FORM, BEHAVIOR, AND DESIGN DR. ANNE NICHOLS SUMMER 2014 lecture twenty two concrete construction: http:// nisee.berkeley.edu/godden flat spanning systems, columns & frames Concrete
This point intends to acquaint the reader with some of the basic concepts of the earthquake engineer:
 Chapter II. REVIEW OF PREVIOUS RESEARCH II.1. Introduction: The purpose of this chapter is to review first the basic concepts for earthquake engineering. It is not intended to review the basic concepts
AN INVESTIGATION OF SEISMIC RETROFIT OF COLUMNS IN BUILDINGS USING CONCRETE JACKET
 AN INVESTIGATION OF SEISMIC RETROFIT OF COLUMNS IN BUILDINGS USING CONCRETE JACKET Gnanasekaran, K. 1 and Amlan K. Sengupta 2 1 Ph.D. Scholar, Dept. of Civil Engineering, Indian Institute of Technology
twenty two concrete construction: flat spanning systems, columns & frames Reinforced Concrete Design Reinforced Concrete Design
 ARCHITECTURAL STRUCTURES: FORM, BEHAVIOR, AND DESIGN DR. ANNE NICHOLS SUMMER 2013 lecture twenty two economical & common resist lateral loads concrete construction: flat spanning systems, columns & frames
CHAPTER 4 PUNCHING SHEAR BEHAVIOUR OF RECYCLED AGGREGATE CONCRETE TWO WAY SLABS
 103 CHAPTER 4 4.1 GENERAL PUNCHING SHEAR BEHAVIOUR OF RECYCLED AGGREGATE CONCRETE TWO WAY SLABS The problem of punching shear in reinforced concrete slabs under a concentrated load or around a column has
Effect of web reinforcement on shear strength of shallow wide beams
 International Journal of Engineering and Technical Research (IJETR) ISSN: 2321-0869, Volume-2, Issue-11, November 2014 Effect of web reinforcement on shear strength of shallow wide beams Ehab M. Lotfy,
Investigation of Negative Moment Reinforcing in Bridge Decks
 Tech Transfer Summaries Institute for Transportation 9-2015 Investigation of Negative Moment Reinforcing in Bridge Decks Brent Phares Institute for Transportation, bphares@iastate.edu Sameera Jayathilaka
INTERNATIONAL JOURNAL OF CIVIL AND STRUCTURAL ENGINEERING Volume 3, No 2, 2012
 INTERNATIONAL JOURNAL OF CIVIL AND STRUCTURAL ENGINEERING Volume 3, No 2, 2012 Copyright 2010 All rights reserved Integrated Publishing services Research article ISSN 0976 4399 Optimizing the use of swimmer
Introduction to Structural Analysis TYPES OF STRUCTURES LOADS AND
 AND Introduction to Structural Analysis TYPES OF STRUCTURES LOADS INTRODUCTION What is the role of structural analysis in structural engineering projects? Structural engineering is the science and art
Simplified Building Schematic for Typical Floor (Levels 9 through 22):
:") Introduction to Structural System Simplified Building Schematic for Typical Floor (Levels 9 through 22): Key: - Tower Columns - Tower Shear Walls - Parking Garage Columns - Parking Garage Shear Walls Solid
Introduction to Structural System Simplified Building Schematic for Typical Floor (Levels 9 through 22): Key: - Tower Columns - Tower Shear Walls - Parking Garage Columns - Parking Garage Shear Walls Solid
Analysis and Design of Steel
 Analysis and Design of Steel and Composite Structures Qing Quan Liang CRC Press Taylor & Francis Croup Boca Raton London New York CRC Press is an imprint of the Taylor & Francis Croup, an informa business
STRENGTHENING OF UNBONDED POST-TENSIONED CONCRETE SLABS USING EXTERNAL FRP COMPOSITES
 STRENGTHENING OF UNBONDED POST-TENSIONED CONCRETE SLABS USING EXTERNAL FRP COMPOSITES F. El M e s k i 1 ; M. Harajli 2 1 PhD student, Dept. of Civil and Environmental Engineering, American Univ. of Beirut;
CHAPTER III METHODS AND MATERIALS
 CHAPTER III METHODS AND MATERIALS 3.1: Tensile Tests 3.1.1: Introduction The first phase of testing for the experimental program, was to conduct tensile tests of No. 4, No. 5, and No. 6 nominal diameter
Metal-plate connections loaded in combined bending and tension
 Metal-plate connections loaded in combined bending and tension Ronald W. Wolfe Abstract This study evaluates the load capacity of metal-plate connections under combined bending and axial loads and shows
How to Design a Singly Reinforced Concrete Beam
 Time Required: 45 minutes Materials: -Engineering Paper -Calculator -Pencil -Straight Edge Design For Flexural Limit State How to Design a Singly Reinforced Concrete Beam Goal: ΦMn > Mu Strength Reduction
BEHAVIOR OF HIGH PERFORMANCE STEEL AS SHEAR REINFORCEMENT FOR. Matthew S. Sumpter, Sami H. Rizkalla, and Paul Zia
 BEHAVIOR OF HIGH PERFORMANCE STEEL AS SHEAR REINFORCEMENT FOR CONCRETE BEAMS Matthew S. Sumpter, Sami H. Rizkalla, and Paul Zia 1 1 1 1 1 1 1 1 1 Sami H. Rizkalla, sami_rizkalla@ncsu.edu (corresponding
Class Topics & Objectives
 EGCE 406: Bridge Design Design of Slab for Bridge Deck Praveen Chompreda, Ph.D. Mahidol University First Semester, 2010 Class Topics & Objectives Topics Objective Bridge Superstructures Students can identify
Upgrading Flat R.C. Slab with Haunch Using F.R.P
 International OPEN ACCESS Journal Of Modern Engineering Research (IJMER) Upgrading Flat R.C. Slab with Haunch Using F.R.P Dr. Eiad Hafiz. Zahran Lecturer, Department of structural Engineering, Higher institute
EGCE 406: Bridge Design
 EGCE 406: Bridge Design Design of Slab for Praveen Chompreda Mahidol University First Semester, 2006 Bridge Superstructure Outline Components of bridge Superstructure Types Materials Design of RC Deck
PRESTRESSED CONCRETE STRUCTURES. Amlan K. Sengupta, PhD PE Department of Civil Engineering Indian Institute of Technology Madras
 PRESTRESSED CONCRETE STRUCTURES Amlan K. Sengupta, PhD PE Department of Civil Engineering Indian Institute of Technology Madras Module 5: Analysis and Design for Shear and Torsion Lecture-23: Analysis
Composite Steel Deck - Slabs
 American National standards institute / steel deck institute T - CD - 2011 Test Standard for Composite Steel Deck - Slabs copyright 2012 steel deck institute disclaimer The Steel Deck Institute has developed
twenty two concrete construction: flat spanning systems, columns & frames Reinforced Concrete Design Reinforced Concrete Design
 ARCHITECTURAL STRUCTURES: FORM, BEHAVIOR, AND DESIGN DR. ANNE NICHOLS SUMMER 2014 lecture twenty two economical & common resist lateral loads concrete construction: flat spanning systems, columns & frames
FINITE ELEMENT MODELING OF STEEL CONTAINMENT STRUCTURES UNDER LATERAL LOADS
 Ain Shams University Faculty of Engineering Structural Engineering Department Abstract of the M.Sc. Thesis submitted by: Al-Hussein Ibrahim Hilal Ibrahim Title of Thesis: Finite Element Modeling of Steel
Seismic Performance of Hollow-core Flooring: the Significance of Negative Bending Moments
 Seismic Performance of Hollow-core Flooring: the Significance of Negative Bending Moments L.J. Woods University of Canterbury and Holmes Consulting Group, New Zealand. R.C. Fenwick University of Canterbury,
The use of 0.5 and 0.6 in. (13 and 15 mm) diameter
 diameter") Benefits of using.7 in. (18 mm) diameter strands in precast, pretensioned girders: A parametric investigation Jessica Salazar, Hossein Yousefpour, Alex Katz, Roya Alirezaei Abyaneh, Hyun su Kim, David
Benefits of using.7 in. (18 mm) diameter strands in precast, pretensioned girders: A parametric investigation Jessica Salazar, Hossein Yousefpour, Alex Katz, Roya Alirezaei Abyaneh, Hyun su Kim, David
1. Cast-in-place concrete is specified in Section
 SECTION 03 38 00 PART 1 - GENERAL 1.01 DESCRIPTION A. This Section describes the requirements for furnishing and installing post-tensioned slabs, jacks, jacking and anchors at Parking Structure, and record
North Mountain IMS Medical Office Building
 North Mountain IMS Medical Office Building Phoenix, Arizona Michael Hopple Technical Assignment 1 October 5 th, 2007 AE 481W-Senior Thesis The Pennsylvania State University Faculty Adviser: Dr. Ali Memari,
CHAPTER 3 BEHAVIOUR OF FERROCEMENT HOLLOW SLABS
 30 CHAPTER 3 BEHAVIOUR OF FERROCEMENT HOLLOW SLABS 3.1 INTRODUCTION There are numerous similarities between ferrocement and reinforced concrete. Both use similar matrix and reinforcement materials. They
Modelling of RC moment resisting frames with precast-prestressed flooring system
 Modelling of RC moment resisting frames with precast-prestressed flooring system B.H.H. Peng, R.P. Dhakal, R.C. Fenwick & A.J. Carr Department of Civil Engineering, University of Canterbury, Christchurch.
Precast Concrete Bearing Wall Panel Design (Alternative Analysis Method) (Using ACI )
 (Using ACI )") Precast Concrete Bearing Wall Panel Design (Alternative Analysis ethod) (Using ACI 318-14) Precast Concrete Bearing Wall Panel Design (Alternative Analysis ethod) (Using ACI 318-14) A structural precast
Precast Concrete Bearing Wall Panel Design (Alternative Analysis ethod) (Using ACI 318-14) Precast Concrete Bearing Wall Panel Design (Alternative Analysis ethod) (Using ACI 318-14) A structural precast
ADAPT PT7 TUTORIAL FOR ONE-WAY SLAB 1
 Structural Concrete Software System TN187_PT7_tutorial_one_way_slab 012705 ADAPT PT7 TUTORIAL FOR ONE-WAY SLAB 1 1. ONE-WAY SLAB SUPPORTED ON BEAMS The objective of this tutorial is to demonstrate the
Applications due by March 15, 2008 Results due by June 15, 2008
 PCI Engineering Student Design Competition Official Rules Applications due by March 15, 2008 Results due by June 15, 2008 Sponsored by and Program The PCI Student Education Committee is inviting entries
In-plane testing of precast concrete wall panels with grouted sleeve
 In-plane testing of precast concrete wall panels with grouted sleeve P. Seifi, R.S. Henry & J.M. Ingham Department of Civil Engineering, University of Auckland, Auckland. 2017 NZSEE Conference ABSTRACT:
Simplified Building Schematic for Typical Floor (Levels 9 through 22):
:") Introduction to Structural System Simplified Building Schematic for Typical Floor (Levels 9 through 22): Key: - Tower Columns - Tower Shear Walls - Parking Garage Columns - Parking Garage Shear Walls Solid
Introduction to Structural System Simplified Building Schematic for Typical Floor (Levels 9 through 22): Key: - Tower Columns - Tower Shear Walls - Parking Garage Columns - Parking Garage Shear Walls Solid
10-COLUMNS: 10.1 Introduction.
 1 10-COLUMNS: 10.1 Introduction. Columns are vertical compression members of a structural frame intended to support the loadcarrying beams. They transmit loads from the upper floors to the lower levels
Encased Beam with Variable Upper Steel Flange Position
 Encased Beam with Variable Upper Steel Flange Position Ahmed Youssef Kamal Civil Engineering Department, Benha Faculty of Engineering, Benha University, Egypt. ABSTRACT Encased beam composite construction
PERFORMANCE OF LAP SPLICES IN CONCRETE MASONRY SHEAR WALLS UNDER IN-PLANE LOADING
 PERFORMANCE OF LAP SPLICES IN CONCRETE MASONRY SHEAR WALLS UNDER IN-PLANE LOADING J. Z. MJELDE 1, D.I. MCLEAN 2, J. J. THOMPSON 3 AND W. M. MCGINLEY 4 1 Graduate Student, 2 Professor and Chair Department
Site Director: Dr. Sami Rizkalla Associate Director: Dr. Rudi Seracino Date: February 1 st, 2011
 Site Director: Dr. Sami Rizkalla Associate Director: Dr. Rudi Seracino Date: February 1 st, 2011 AltusGroup, Inc. Freyssinet, Inc. Fyfe Company, LLC Grancrete, Inc. Martin Marietta Composites Nippon Steel
Ensuring sufficient robustness to resist
 Performance of precast concrete moment frames subjected to column removal: Part 2, computational analysis Yihai Bao, Joseph A. Main, H. S. Lew, and Fahim Sadek This paper presents a computational study
COLUMNS 1- Definition: The Egyptian code defines columns as : 2- Types of concrete columns
 COLUMNS 1- Definition: Columns are vertical compression members which carry primarily axial compression load; the axial load may be associated with bending moments in one or two directions, as shown in
Design of Reinforced Concrete Slabs
 Lecture 07 Design of Reinforced Concrete Slabs By: Prof Dr. Qaisar Ali Civil Engineering Department UET Peshawar drqaisarali@uetpeshawar.edu.pk 1 Topics Addressed Introduction Analysis and Design of slabs
Punching shear behavior of Lightweight foamed RC slabs
 Punching shear behavior of Lightweight foamed RC slabs A.A. Zaher 1, A.A. Abdelrahman 2, A. S. Eldeib 3, A.A. Mohamed 3 1 Faculty of Engineering (Civil), Ain Shams University, Cairo, Egypt 2 Faculty of
Punching Shear Resistance of Flat Slabs By Shear Heads
 International Journal Of Engineering Research And Development e-issn: 2278-067X, p-issn: 2278-800X, www.ijerd.com Volume 13, Issue 11 (November 2017), PP.47-66 Punching Shear Resistance of Flat Slabs By
ADAPT-PT 2010 Tutorial Idealization of Design Strip in ADAPT-PT
 ADAPT-PT 2010 Tutorial Idealization of Design Strip in ADAPT-PT Update: April 2010 Copyright ADAPT Corporation all rights reserved ADAPT-PT 2010-Tutorial- 1 Main Toolbar Menu Bar View Toolbar Structure
Seismic performance of New Steel Concrete Composite Beam-Columns
 Seismic performance of New Steel Concrete Composite Beam-Columns Toshiaki FUJIMOTO, Hiroshi KOMATSU, Tomoyuki SAKURADA & Noritaka MOROHASHI College of Industrial Technology, Nihon University, Japan SUMMARY: