ABSTRACT. HARIHARAN, VIVEK. Behavior of Precast L-Shaped Spandrel Beams. (Under the direction of Dr. Sami Rizkalla.)
|
|
|
- Maurice Thompson
- 5 years ago
- Views:
Transcription
1 ABSTRACT HARIHARAN, VIVEK. Behavior of Precast L-Shaped Spandrel Beams. (Under the direction of Dr. Sami Rizkalla.) Reinforced and Prestressed precast spandrel beams are commonly used in parking structures to transfer vertical loads from deck members to columns. These beams typically have unsymmetrical cross-sections and are often subjected to heavy, eccentric loading conditions. Configuration of the beams and the nature of the applied load induce a complex stress distribution due to the combined applied flexural and shear due to torsion. Traditionally, slender spandrel beams have been reinforced using the torsion and shear provisions of ACI-318 which require closely spaced closed stirrups to resist the crack pattern typically reported for members subjected to combined shear and torsion. A recent study at North Carolina State University provided design guidelines for L-shaped slender spandrel beams. Currently there are no guidelines for the design of compact L- shaped spandrel beams. This thesis describes a research program undertaken at North Carolina State University to study the behavior of four full-scale compact L-shaped spandrel beams (aspect ratio 1.2) and two full scale slender L-shaped spandrel beams (aspect ratio 4.6) loaded to failure. The main parameter considered in the study is the use of open reinforcement configuration versus the traditional closed stirrups. Research findings indicate that out-of-plane bending controls the behavior of the end region for these types of beams. The results of this research demonstrate that properlydesigned open web reinforcement is a safe, effective, and provide an efficient alternative to traditional closed stirrups for precast spandrels. Behavior of beams reinforced with open and closed stirrups were identical up to service loading levels and exceed the design factored loads. Based on the results of the experimental program, a simple and rational design approach is proposed to help practitioners design these types of beams using open reinforcements instead of the closed stirrups currently in use. This proposed procedure significantly reduces the reinforcement, reduces construction time, while maintaining a significant margin of safety.
2 Behavior of Precast L-Shaped Spandrel Beams by Vivek Hariharan A thesis submitted to the Graduate Faculty of North Carolina State University in partial fulfillment of the requirements for the Degree of Master of Science Civil Engineering Raleigh, North Carolina 2008 APPROVED BY: Dr. Sami Rizkalla Chair of Advisory Committee Dr. Emmett Sumner Dr. Rudolf Seracino
3 DEDICATION For you father, a thousand times over ii
4 BIOGRAPHY Vivek Hariharan began his college education in July, 2002 at Anna University, Chennai, India to obtain his Bachelor s of Engineering in Civil Engineering. After graduating with a distinction, Vivek worked as a Site Engineer with an engineering firm in Chennai learning the ways of the real world. In 2007, he enrolled in the department of Civil Engineering, North Carolina State University to pursue his Masters of Science with an emphasis on structures and engineering mechanics. While a graduate student at NC State, he gained engineering research experience at the University s Constructed Facilities Laboratory during the spring 2008 and later continued to do his thesis study under the direction of Dr. Sami Rizkalla. Upon completion of his Masters Vivek hopes to find a job where he can utilize his experimental and analytical experience gained over 2 years at NC State, to make a difference. iii
5 ACKNOWLEDGEMENTS I would like to gratefully acknowledge Metromont Corporation and Precast/Prestressed Concrete Institute for funding this research program. Specifically, I would like to thank Mr. Harry Gleich of Metromont for supplying the specimens tested in this thesis. I would like to express gratitude to the members of my advisory committee. I would like to thank Dr. Rudi Seracino and Dr. Emmett Sumner who have played important roles in my life through the lessons they have taught me in the classroom and in the laboratory. I am forever in gratitude to my advisor Dr. Sami Rizkalla who has always believed in me even when I wavered. The lessons learned from him over these two years will undoubtedly, be invaluable throughout my life. Special thanks to Dr. Paul Zia who was always a part of my research study, for sharing his insights and knowledge. I would also like to express thanks to my friends and colleagues at the Constructed Facilities Laboratory who assisted me through every step of the experimental program. I would also like to thank undergraduate students Matt, Bradley, Kurtis, Eric and Mike for helping me keep up with the schedule. Special thanks to Johnathan McEntire and Jerry Atkinson for their tireless work to keep this project running smoothly. I am eternally grateful to Gregory Lucier who has guided me through every step with his tireless dedication and patience, by enlightening me through the variety of questions that I faced in this journey. My two years of graduate school at NC State have been possible thanks to the everlasting support of my family and friends. I would especially like to thank Dillon, Adam, John and Elliot for giving me their support me through tough times and a warm smile through the better ones. Dillon, you have been my friend and guru, I am always in debt for the pillar of strength you have been to me. Last but not least, I thank my family who have always inspired and encouraged me with their undying love. And to you all, who have shown me how to dream! iv
6 TABLE OF CONTENTS LIST OF TABLES... vii LIST OF FIGURES... viii 1 Background... v 1.1 Objectives Scope Literature Review Background Previous Research Skewed Failure Plane Current Practice Challenges to Current Practice: Experimental Program Test Specimens Compact L-shaped Spandrels Slender Spandrels Test Setup General Setup Setup for Compact L-Shaped Spandrel Tests Setup for Slender L-shaped Spandrel Tests Instrumentation Compact L-shaped Spandrels Slender L-shaped Spandrels Loading Experimental Results Material Properties Concrete Reinforcement Structural Behavior of Tested Beams Compact Spandrel LG Compact L-Shaped Spandrel - LG Compact L-Shaped Spandrel - LG Compact L-Shaped Spandrel - LG Slender L-Shaped Spandrel SP Slender L-Shaped Spandrel - SP Summary of Experimental Results: Compact L-Shaped Spandrels Slender L-Shaped Spandrels Analysis Proposed Rational Design Approach General Design Procedure Conclusions v
7 Appendix vi
8 LIST OF TABLES Table 3.1: Test Specimens Table 3.2: Reinforcement Types Table 3.3: Test Specimens Table 3.4: Reinforcement Types Table 3.5: Design Loads Table 3.6: Load Levels for Testing Table 4.1 : Concrete Compressive Strengths for Compact Spandrels Table 4.2 : Prestressing Strand Porperties (PCI Handbook) Table 4.3: Material Properties of Conventional Reinforcement used for L-shaped compact beams Table 4.4: Material Properties of Welded Wire Reinforcement used for L-shaped compact beams Table 4.5: Material Properties of Conventional Reinforcing Bars used for Spandrels of aspect ratio Table 4.6 : Test Results at Failure Compact Spandrels Table 4.7 : Lateral Reactions at Factored Design Load Compact Spandrels Table 4.8 : Maximum Lateral Reactions Prior to Failure Compact Spandrels Table 4.9 : ACI Recovery Criteria for LG Table 4.10: ACI recovery Criteria for LG Table 4.11 ACI Recovery Criteria for LG Table 4.12 : ACI Recovery Criteria for LG Table 4.13 : Significant Crack Propagation Stages Table 4.14 : Test Results at Failure - Slender Spandrels Table 4.15 : Lateral Reactions at Factored Load - Slender Spandrels Table 4.16 : Lateral Reactions prior to Failure - Slender Spandrels Table 4.17 : ACI Recovery Criteria for SP Table 4.18 : Significant Crack Propagation Stages Table 5.1 : Selected Data at Failure for Specimens with End-Region Failure Modes Table 5.2 : Friction Coefficient and Deck Tie Forces Determined by Equilibrium Table 5.3 : Results from the Twist Model Calibration vii
9 LIST OF FIGURES Figure 1-1 : Loads and Reactions Acting on an L-Shaped Spandrel (Compact)... 2 Figure 2-1: Stresses Acting along the Inner and Outer Web Faces... 7 Figure 2-2: Skewed Failure Plane in a Compact and Slender Section... 9 Figure 3-1 : Typical Compact L-Shaped Spandrel Figure 3-2 : Typical Midspan Reinforcement Details for Compact Spandrels LG1 through LG Figure 3-3 : Typical Slender L-Shaped Spandrel Figure 3-4 : Typical Midspan Details for Slender Spandrels SP20 and SP Figure 3-5 : Profile View of Test Setup Compact L-Shaped Spandrel Figure 3-6: Top View of Test Setup Compact L-Shaped Spandrel Figure 3-7: Connection Detail as Tested for Compact L-Shaped Spandrels Figure 3-8 : Compact L-Shaped Spandrel and Deck with Jacks and Spreaders Figure 3-9: Compact L-Shaped Spandrel Setup Showing Jacks and Spreader Beams on the Deck Sections Figure 3-10: Photograph of Top View of Test Setup of Compact L-Shaped Spandrels Figure 3-11: Bearing Pads at Support (Left) and at Deck resting on Ledge (Right) Figure 3-12: Location of Resultant Force at Ledge Figure 3-13 : Profile View of Test Setup for Slender L-shaped Spandrels Figure 3-14: Experimental Setup for Slender L-Shaped Spandrel Figure 3-15: A Slender L-shaped Spandrel with Spreader Beams and Decks Figure 3-16 : Connection Details as Tested for Slender L-Shaped Spandrels Figure 3-17: Instruments Used in Testing (shown at midspan) Figure 3-18 : Instruments Used in Testing (end support) Figure 3-19 : Instruments Used in Testing of Compact L-Shaped Spandrels Figure 3-20: Cross-Sections Showing Instrument Locations for Compact L-Shaped Spandrels Figure 3-21: PI Gage Locations for Compact L-Shaped Spandrel Tests Figure 3-22: Measurement of Gap between spandrel and Stem Figure 3-23: Arrangement of Load Cells for Slender L-Shaped Spandrel Figure 3-24: Cross Sections Showing Instrument Locations for Slender L-Shaped Spandrels Figure 3-25 : Load Levels for Testing - LG1, LG2, LG3, SP20 and SP Figure 3-26: Load Levels for Testing - LG Figure 4-1 : Left - Conventional Reinforcing Bars; Right - WWR, Samples after Testing Figure 4-2 : MTS machine Test Setup and Mesh Samples Figure 4-3: Stress Strain Curve for #4 Reinforcing Bars LG series Figure 4-4 : Stress Strain Curve for #3 Reinforcing Bars LG series Figure 4-5 : Stress Strain Curve for #3 Rebar used as WWR LG series Figure 4-6 : Stress Strain curves for conventional WWR LG series Figure 4-7 : Stress Strain curve #5 Reinforcing Bars SP series Figure 4-8 : Stress Strain curve #4 Reinforcing Bars SP series viii
10 Figure 4-9: Midspan Vertical Deflection vs. Applied Vertical Reaction LG Figure 4-10: Support Vertical Deflection vs. Applied Vertical Reaction LG Figure 4-11: Support Deflection LG Figure 4-12: Midspan Lateral Deflection vs. Applied Vertical Reaction LG Figure 4-13: Rotation vs. Applied Vertical Reaction LG Figure 4-14: Mid-Span Strains vs. Applied Vertical Reaction LG Figure 4-15: End Region Strains vs. Applied Vertical Reaction LG Figure 4-16: Lateral Reaction vs. Applied Vertical Reaction LG Figure 4-17 : Change in Eccentricity - Compact L-shaped Spandrel Figure 4-18: Eccentricity vs. Applied Vertical Reaction LG Figure 4-19 : Comparison of Load Cell Reaction with 8 and 16 Bearing Pads LG Figure 4-20: Cracking Pattern of the Inner Face (Digitally Enhanced Cracks) LG Figure 4-21 : Cracking Pattern of the Outer Face (Digitally Enhanced Cracks) - LG Figure 4-22 : Inner face Cracking of LG Figure 4-23 : Front View at Midspan after Completion of the Test and Removing Double Tees - LG Figure 4-24: Midspan Vertical Deflection vs. Applied Vertical Reaction LG Figure 4-25: Support Vertical Deflection vs. Applied Vertical Reaction LG Figure 4-26: Midspan Lateral Deflection vs. Applied Vertical Reaction LG Figure 4-27: Rotation vs. Applied Vertical Reaction LG Figure 4-28: Midspan Strains vs. Applied Vertical Reaction LG Figure 4-29: End Region Strains vs. Applied Vertical Reaction LG Figure 4-30: Lateral Reaction vs. Applied Vertical Reaction LG Figure 4-31: Eccentricity vs. Applied Vertical Reaction LG Figure 4-32: Cracking Pattern Inner Face LG Figure 4-33: Cracking Pattern Outer Face LG Figure 4-34 : Views of Specimen Separated along Failure Surface - LG Figure 4-35: Midspan Vertical Deflection vs. Applied Vertical Reaction LG Figure 4-36: Support Vertical Deflection vs. Applied Vertical Reaction LG Figure 4-37: Midspan Lateral Deflection vs. Applied Vertical Reaction LG Figure 4-38: Rotation vs. Applied Vertical Reaction LG Figure 4-39: Midspan Strains vs. Applied Vertical Reaction LG Figure 4-40: End Region Strains vs. Applied Vertical Reaction LG Figure 4-41: Lateral Reactions vs. Applied Vertical Reaction LG Figure 4-42: Eccentricity vs. Applied Vertical Reaction LG Figure 4-43: Cracking Pattern with Digitally Enhanced Cracks along Inner Face LG Figure 4-44 : Front View of LG3 after Failure with Digitally Enhanced Cracks Figure 4-45: Cracking Pattern with Digitally Enhanced Cracks along Outer Face LG Figure 4-46 : Top Surface after Failure - LG Figure 4-47 : Close up View of Failure along Inner Face - LG Figure 4-48: Midspan Vertical Deflection vs. Applied Vertical Reaction LG Figure 4-49: Support Vertical Deflection vs. Applied Vertical Reaction LG Figure 4-50: Midspan Lateral Deflection vs. Applied Vertical Reaction LG ix
11 Figure 4-51: Rotation vs. Applied Vertical Reaction LG Figure 4-52: Midspan Strains vs. Applied Vertical Reaction LG Figure 4-53: End Region Strains vs. Applied Vertical Reaction LG Figure 4-54: Lateral Reactions vs. Applied Vertical Reaction LG Figure 4-55: Eccentricity vs. Applied Vertical Reaction LG Figure 4-56: Cracking Pattern Inner Face with Digitally Enhanced Cracks LG Figure 4-57: Failure Plane Before (Left) and After (Right) Careful Demolition LG Figure 4-58 : Right Side View of Inner Web Face after Failure - LG Figure 4-59 : Right Side Inner Face showing Shear Failure Plane Before (Left) and After (right) Careful Demolition - LG Figure 4-60 : Vertical Deflection vs. Applied Vertical Reaction at Midspan- SP Figure 4-61 : Vertical Deflection vs. Applied Vertical Reaction at Support - SP Figure 4-62 : Lateral Deflection vs. Applied Vertical Reaction at Midspan - SP Figure 4-63 : Measured Rotation vs. Applied Vertical Reaction at Midspan and Quarter Span - SP Figure 4-64 : End Region Face Strain vs. Applied Vertical Reaction - SP Figure 4-65 : Strain from Strain Gages vs. Applied Vertical Reaction - SP Figure 4-66 : Lateral Reaction vs. Applied Vertical Reaction - SP Figure 4-67 : Inner Face Cracking (Digitally Enhanced Cracks) - SP Figure 4-68 : Inner and Top Surfaces (Digitally Enhanced Cracks) - SP Figure 4-69 : Outer Face Cracking Looking Left (Digitally Enhanced Cracks) -SP Figure 4-70 : Failure Plane Before Careful Separation - SP Figure 4-71 : Failure Plane after Careful Separation - SP Figure 4-72 : Vertical Deflection vs. Applied Vertical Reaction at Midspan - SP Figure 4-73 : Lateral Deflection at Midspan with varying Deck Connections - SP Figure 4-74 : Measured Rotation vs. Applied Vertical Reaction at Midspan and Quarter Span - SP Figure 4-75 : Measured Rotation with varying Deck Connection - SP Figure 4-76 : Load- Strain at Midspan - SP Figure 4-77 : Load - Strain Gages - SP Figure 4-78 : Load - Lateral Reaction at Supports - SP Figure 4-79 : Inner Face Cracking and Failure Location (Digitally Enhanced Cracks) - SP Figure 4-80 : Inner Face Cracking - SP Figure 4-81 : Inner Face Failure Location (Digitally Enhanced Cracks) - SP Figure 4-82 : Outer Face Cracking near Failure Location (Digitally Enhanced Cracks) - SP Figure 4-83 : Vertical Deflection vs. Applied Vertical Reaction at Midspan Compact Spandrels Figure 4-84 : Lateral Deflections at Midspan (final loading cycle) - LG1 vs. LG Figure 4-85 : Lateral Deflections at Midspan (final loading cycle) - LG1 vs. LG Figure 4-86 : Lateral Deflections at Midspan (final loading cycle) - LG1 vs. LG Figure 4-87 : Deck Connection Buckling - LG x
12 Figure 4-88: Compact L-shaped Spandrel Rotation at Midspan Figure 4-89 : Typical Cracking Pattern along Inner Face Figure 4-90 : Typical Cracking along Top Surface Figure 4-91 : Vertical Deflection vs. Applied Vertical Reaction at Midspan - Slender Spandrels Figure 4-92 : Load- Lateral Deflection at Midspan Slender Spandrels Figure 4-93 : Outer Face Strains - Slender Spandrels Figure 4-94 : Cracking Pattern along Inner Face - Slender Spandrels Figure 5-1 : Regions of a Spandrel Beam Figure 5-2 : Generalized Nomenclature Applied to an End Region for Two Possible Crack Planes Figure 5-3: Typical Factored Shear, Moment, and Torsion Diagrams Figure 5-4: Eccentric Loading of L-Shaped Spandrel Figure 5-5 : Components of Torque Figure 5-6 : Nomenclature Applied in the Proposed Rational Design Approach Figure 5-7 : Resistance to Out of Plane Plate Bending (ledge not shown) Cut along Critical Crack Figure 5-8 : Twist Component on Diagonal Failure Plane along Crack Figure 5-9 : Horizontal Twist Resistance Couple along the Diagonal Failure Plane Figure 5-10 : Linear Distribution of Shear Stresses at a Slab-Column Interface Figure 5-11 : Equilibrium of a Generic Slender Spandrel Beam Figure 5-12 : Forces Contributing to Torque on a Slender Spandrel End Region Figure 5-13 : Calibrated Twist Values in Terms of X roots f c Figure 5-14 : Ratio of Failure Twist Moment to Nominal Twist Moment xi
13 1 BACKGROUND Precast, prestressed L-shaped spandrels are commonly used in parking structures, and are primarily utilized to transfer vertical loads from deck members to columns. Large single-tees or double-tees are used as deck sections and typically span 40 to 60 feet. L-Shaped spandrels are often used where the driving surface of a parking deck must continue over the supported end of a double tee. Typical L-shaped spandrels can vary between 2 to 6 feet deep can span as large as 50 feet. Depending on the web thickness, which is usually 10 inches or more, they are categorized as compact (aspect ratio less than 3) or slender spandrels. Compact L-shaped spandrels usually have a web thickness of 16-inches or more and can usually be found supporting a deck section at the top of a ramp. In most cases, a continuous ledge runs along the bottom edge on one side of the beam, creating the L-shaped cross-section. As the ledge is used to provide bearing for the deck sections, the L-shaped spandrel beam is subjected to a series of discrete eccentric loadings. These spandrels are usually simply supported at the columns with lateral connections to the web preventing torsional rotation. In addition, discrete connections between deck sections and the web of the spandrel provide lateral restraint along its length. The ends of these spandrels are also connected to the columns to resist out-of-plane rotation about the longitudinal axis. The eccentric location of the applied loads with respect to the unsymmetrical L-shaped spandrel cross-section causes vertical displacement in addition to significant lateral displacement and rotation. It has been observed from earlier tests (Lucier, 2007) that maximum torsional and shear effects have occurred near the end of the L-shaped spandrel beam. This complex structural behavior, coupled with the heavy loading, often results in designs requiring conservative reinforcement details. Frequently, the steel is heavily congested in critical zones such as the end regions where prestressing strands and reinforcing bars must weave through numerous closed stirrups that are closely spaced as required by the ACI Code (2005). 1
14 Figure 1-1 : Loads and Reactions Acting on an L-Shaped Spandrel (Compact) For many years, spandrel beams (both slender and compact) have been designed by the precast and prestressed concrete industry following the general procedure originally proposed by Zia and McGee (1974), and later modified by Zia and Hsu (1978, 2004). Investigations by Raths (1984) and Klein(1986) revealed significant plate bending effects in the webs of the slender spandrels resulted in major diagonal crack in the end region that caused failure. In view of the observed behavior, questions were raised as to the need for closed stirrups in a slender non-compact L-shaped section. Lucier et. al (2007) demonstrated through full-scale experimental tests and finite element analysis that open web reinforcement could be used safely and effectively in slender precast spandrel beams (aspect ratio greater than 7). Open web reinforcement offers significant advantages in production over traditional closed stirrups. The successful use of open web reinforcement in slender spandrels has led the industry to question whether a similar approach can be utilized for L-shaped spandrel beams of lesser aspect ratio. 1.1 OBJECTIVES The primary objective of this research program was to determine the performance of full-size L-shaped spandrel beams reinforced with open web reinforcement in lieu of the closed 2
15 stirrups and longitudinal torsional reinforcement prescribed by the ACI Code (2008) and to develop a rational design methodology for these spandrel beams loaded eccentrically along their bottom edge. In addition, the proposed design methodology should allow for simplified detailing of reinforcement when compared to current practice. More specifically, behavior at different load levels, strength, and mode of failure are observed and evaluated in order to validate the concept of using conventional reinforcing bars along with welded wire reinforcement as shear-torsion reinforcement. 1.2 SCOPE To complete the primary objective, the scope of the investigation included the following: 1. A detailed review of literature of the development of torsion design for precast concrete members including published reports of field observations of spandrel beams in service. 2. An experimental program including testing full-scale compact and slender L-shaped spandrel beams with various reinforcing schemes. 3. Develop a rational design approach using the data from the experimental program that is simple and can be easily adopted by practitioners to design safe and economical precast L-shaped spandrel beams. 3
16 2 LITERATURE REVIEW The literature presented in this chapter includes published experimental work, analytical studies and field observations of precast slender spandrel beams. However, the focus of this literature review is on recent tests conducted on precast prestressed slender spandrel beams. This chapter provides an understanding of the observed behavior of slender spandrel beams from previous research studies. The design methodology of the current practice is also discussed as well the challenges it faces. 2.1 BACKGROUND Zia and McGee introduced the first design methodology for beams subjected to bending, shear and torsion in 1974 (Zia et al. 1974). The method that they proposed was based on the induced nominal shear and torsional stresses for a given cross-section and reinforcing material properties and provided the concrete contribution to the member s overall capacity. In addition, web reinforcement required for shear and torsion resistance was also investigated. A later study (Zia et al 1976) revealed that the minimum reinforcement provided by ACI for flexural shear was inadequate for a prestressed member subjected to these combined loading conditions. Thus in 1977, the ACI Building Code was changed to be based on forces and moments instead of stresses. The equations were then updated by Zia and McGee and were adopted by Zia and Hsu to be incorporated into their design guidelines for prestressed members subjected to combined loadings, which would later become the basis for the current PCI guidelines for torsion in concrete members. 2.2 PREVIOUS RESEARCH Research on precast slender spandrel behavior has been discussed among precast producers and engineers for over six decades. However, the first study on in-service behavior of precast slender spandrel beams was documented in 1984 with a report published on in-field spandrel beam behavior and design (Raths 1984). The report was perhaps the most thorough account of precast spandrel behavior to date, contained evidence of field observations of structural distress and failure of parking structures. Extensive out-of-plane bending and web face 4
17 cracking were observed to resist what was referred to as beam end torsion, the end couple acting to restrain the beam from rolling inward due to the eccentrically applied loads. Previous research on slender precast spandrel beams was conducted in response to the aforementioned in-field behavior that indicated significant plate bending effects in the end regions of these beams contrary to the to the typical torsion failure mode which is characterized by spalling of the concrete cover. Selected load tests on precast L-shaped spandrel beams have been documented since the early 1960s. Informal testing of this nature was commonly carried out by precast producers to investigate design issues which had not been formally documented at the time. A test conducted in 1961 was unable to generate either torsional rotation or distress in a precast L-shaped spandrel subjected to eccentric vertical loading (Logan 2007). The spandrel was 20 feet long with a web aspect ratio of 2.4. The beam experienced diagonal cracking at roughly 45 degrees in the end region on the inside face (ledge side) that began to flatten out towards midspan. The outside face experienced vertical cracking near midspan that extended upwards from the bottom of the spandrel. The failure mode of the spandrels was an out-ofplane fracture in the end region. The author concluded that the torsional distress needed to cause the classic symptoms of concrete spalling and spiral cracking was not possible in the tested beam as the web was incapable of distributing the internal torsion, caused by the boundary conditions and eccentric loading. The necessity of providing complex torsion reinforcement, i.e, closed web stirrups, in slender L-shaped precast members was also questioned by the author. Full scale load tests and analytical studies using Finite Element methods of L-shaped slender (aspect ratio of 9) spandrel beams commonly used in parking structures was undertaken by Klein in The shear and torsion design was based on the method by Zia-Hsu published in the current PCI Design Handbook. The spandrels were loaded along the ledge by deck sections consisting of double-tees and a single-tee. The focus of the research program was to understand end region behavior and it was found that the torsional response of deep spandrels is dominated by out-of plane bending. It recommended that reinforcement be provided to 5
18 resist out-of-plane bending caused by the horizontal torsional equilibrium reactions. It was also conceived that this reinforcement was not additive to the reinforcement for internal torsion provided a critical section for shear and torsion at the face of the support is considered. Further, the research also advised that the longitudinal reinforcement in the bearing areas be sufficiently developed to resist the external normal force, as well as the tension induced by the vertical reaction. The author realized that the detailing practices for torsional reinforcement did not always follow ACI code requirements which utilized closed stirrups, closed ties or spirals. It was also noted that the commentary to the ACI code indicated that this reinforcement detailing is primarily directed at hollow box sections and solid sections subjected primarily to torsion in which the side cover spalls off. The author argues that this behavior is unlikely in slender (and deep) spandrels with transverse reinforcement provided by pairs of lapped-spliced U-stirrups. Similar full-scale load tests conducted in a recent study at the research facility at North Carolina State University (2007). Four slender L-Shaped spandrels of web aspect ratio 7.5 and varying span lengths were designed neglecting conventional torsion design procedures. The main objective of the research program described in this thesis was to determine if closed stirrups could be eliminated from slender L-shaped spandrel design; this was done by using a combination of L-bars, U-bars, C-bars and welded-wire reinforcement (WWR) as web reinforcement. All test specimens were over reinforced for flexure to prevent premature flexural failure or localized failure modes in order to study end-region behavior. As there were no set design guidelines for using open reinforcement in slender L-shaped spandrel beams, the authors described a general design approach has been followed. Reinforcing requirements were met for traditional hanger reinforcement and vertical shear reinforcement. Ignoring torsion as the controlling failure mode, the authors instead reinforced the beam for out-of-plane bending. All four specimens were able to sustain to meet the recovery criteria set forth by ACI 318 and achieve an ultimate load carrying capacity beyond the full factored design load. While not all four beams ultimately failed due to out of plane bending in the end regions, localized failures along the spandrel ledge controlled the shorter spans, the observed cracking pattern was identical for all four beams. The results from this study demonstrated 6
19 that out of plane behavior was observed in slender spandrel beams loaded along the ledge and confirmed the absence of classical torsional distress associated with the current design. In the tests by Klein, failure occurred when a major diagonal crack developed in the end region of the spandrel as the result of plate-bending which was similar in nature to the failure modes observed in the author s tests where failure was along a diagonal 45 degree plane near the support causing separation of the web of the spandrel along a skewed plane. In addition, several diagonal cracks were seen along the inner face near the support indicating a significant amount of shear and torsional stress along this face. Also, the outer face of the spandrel was characterized primarily by flexural cracks indicating that the shear and torsional stresses oppose each other along this face as shown in Figure 2-1. Shear flow, υ + _ + Torsion, Figure 2-1: Stresses Acting along the Inner and Outer Web Faces In view of the observed behavior, questions were raised as to the need for closed stirrups in a slender non-compact section such as the spandrel beam. The research included welded wire fabric as the reinforcement in the web of the slender spandrel in lieu of longitudinal bars and closed stirrups in order to simplify the fabrication process to a great extent thereby reducing the cost of production. It was also thought that friction at the bearing connections could play a major role in determining the out of plane behavior. The weld connection between the deck and the spandrel face was observed to influence the out of plane movement of the spandrel to a 7
20 certain extent. The author suggested the use of some form of instrumentation to further understand the influence of this connection on the spandrel behavior. 2.3 SKEWED FAILURE PLANE It has been well documented that the failure mechanism for slender reinforced concrete sections subjected to combined flexure, shear, and torsion will be in the form of skew bending (Klein 1986, Logan 2007, Lucier et al 2007, Raths 1984). The failure mode observed from reported tests on slender L-shaped spandrel beams occurred when the compression zone, ie failure plane, occurred on the side of the specimens. Previously published research (Hsu 84 and Walsh et al 1966, 1967) has defined this possible skew bending failure where the compression zone formed on the side of the beam where the shear and torsional stresses were subtractive as shown in Figure 2-1. In the case of L-shaped spandrel beams loaded along the ledge, the compression zone occurred on the non-ledge side. This failure mode was observed when the applied torsional moment and shear force were much greater than the applied flexural moment. At failure the two ends of the beam, separated at the failure surface, rotated against each other about a neutral axis along the compression zone. The torsion design of compact rectangular sections, which form the basis for the ACI and PCI approach, where spiral cracking and face shell spalling may be observed, the failure plane is crossed effectively on all four faces by closed ties. For slender sections, however, the value of the shorter legs of the ties is questionable because the projection of the failure plane crossing the narrow face of the member is often less than the longitudinal spacing of such ties and contributes very slightly to the overall torsional resistance of the beam, as shown in Figure 2-2. As the short legs of the closed stirrups have such a minimal effect in strengthening slender member it has been suggested that they could be replaced with combinations of straight bars, sheets of WWR and L-shaped bars (Lucier et al 2007). Rather, it is the vertical legs of such closed ties which are providing the bulk of torsional resistance, since these legs cross the failure plane along the much longer inner and outer faces of the web. For a typical slender spandrel of 8 inch web thickness, tie spacing exceeding the web 8

21 thickness would create a situation in which the top edge of the failure surface would likely pass between adjacent ties, as shown in Figure 2-2. Therefore the geometry of the skewed failure surface itself seems to indicate that the short legs of closed ties do not significantly contribute to torsional resistance in slender spandrels. There have been no reported studies on compact spandrels (aspect ratio less than 3) where the aforementioned transverse (or shorter) leg of the tie would be of comparable length to that of the longitudinal leg and thereby contribute towards the overall torsional resistance. Figure 2-2: Skewed Failure Plane in a Compact and Slender Section 9
22 2.4 CURRENT PRACTICE The current guidelines for designing spandrel beams is presented in 6 th Edition of the PCI Handbook (2005) and is based on the design method provided by Zia and McGee, updated by Zia and Hsu (Zia et al,2004). The method illustrated in the Handbook can be utilized for prestressed and non prestressed spandrel beams and is based on the sectional torsion strength of compact rectangular sections with aspect ratio less than 3. The Zia and McGee method is essentially the same as the pre-1995 codes for non-prestressed concrete, but allows the effects of prestressing to be included. The following is a step-by-step procedure for shear and torsion design based on: 1. Determine the design ultimate shear, Vu, and the design ultimate torsional moment, T u, at the critical section for shear and torsion. The critical section, determined per ACI 318, is d from the face of the support for non-prestressed members and h/2 for prestressed members; d is to be taken from the point of load application for a spandrel beam loaded along the ledge. 2. Determine if torsion can be neglected based on specimen cross section and concrete and prestressing material properties. T ' 2 = φ(0.5λ f x y) γ u (min) c Equation 2-1 Where: Tu = Factored torsional moment, lb-in Φ = 0.75 Λ = Conversion factor for lightweight concrete f c = Concrete compressive strength, psi x, y = Short side and long side, respectively, of a component rectangle, inch Γ = A factor dependent on the level of prestress = f f pc ' c f pc = 1.0 for non-prestressed sections = Average prestress after losses 10
23 If T u T u (min) no torsion reinforcement is needed and design is complete. 3. If torsion cannot be neglected, check that required nominal torsional moment and shear strengths are at appropriate limits so that potential compression failures, due to over-reinforcing, do not occur. T n(max) 1 ' K tλ f c 3 = K tvu 1+ 30CtT u 2 x y Tu 2 ϕ V n(max) = 10λ f ' c b w 30CtT 1+ K tvu d u 2 Vu ϕ Where: K t = f pc γ ' f c V u = Factored shear force, lb C t = b w d 2 x y b w = Web width of member, inch d = Effective depth of member, inch 4. The shear and torsion interaction has long been represented by a circular curve. When the requirements in Step 3 are met, calculate the nominal torsional moment and shear strength provided by the concrete. 11
24 12 2 ' ' ' 1 + = u c u c c c V V T T T T 2 ' ' ' 1 + = u c u c c c T T V V V V Where: T c = Nominal torsional moment strength of concrete under combined shear and torsion V c = Nominal shear strength of concrete under combined shear and torsion V c = d b T d V f w U u c ' =Nominal shear strength of concrete under pure torsion T c = 1.5) ( ' γ λ y x f c =Nominal torsional moment strength of concrete under pure torsion 5. Provide stirrups if the torsional moment is greater than that carried by the concrete. These stirrups are in addition to those required for shear. y t c u t f y x s T T A 1 1 α ϕ = To ensure reasonable member ductility, a minimum area of closed stirrups should be determined: ( ) ( ) y w y w t v f s b f s b A A min = + γ
25 Where: A t = Required area of one leg of closed tie, in 2 x 1 y 1 s α t f y A v = Short side of closed tie, inch = Long side of closed tie, inch (x 1 +y 1 )/4 or 12 = tie spacing, inch = [ y 1 /x 1 ] < 1.5 = torsion coefficient = Yield strength of closed tie, psi = Area of shear reinforcement, inch 6. Provide longitudinal reinforcement to resist the longitudinal component of the diagonal tension induced by torsion. This longitudinal steel is in addition to that calculated for flexure. Or A ( x y ) 2 At 1 + Al = s 400x T 1 2A ( x y ) u t l = 1 f V + y T u s u + 3C t The value of A l, calculated in Equation 2-9, should not exceed that obtained when substituting: 50b 12 f pc w 200bw 2A t 1 for ' f + y f c f y s The current PCI handbook does address out-of-plane bending in L-shaped spandrel beam end regions. An equation is given for determining the amount of vertical (A wv ) and longitudinal (A wl ) reinforcement on the inner face. This steel is to be distributed across a height and width equal to the distance between the two lateral equilibrium reactions. 1 13
26 A wv = A wl Vue = 2ϕf d y w Where: V u e = Factored shear force at critical section = Eccentricity, distance between ledge load and main vertical reaction φ = 0.75 f y d w = Yield strength of reinforcement = Depth of A wv and A wl reinforcement from outside face of beam 2.5 CHALLENGES TO CURRENT PRACTICE: The current practice recommended by the American Concrete Institute for proportioning reinforcement to resist shear and torsion within a concrete member is based on a space truss analogy (ACI ). Longitudinal steel and closed stirrups are provided to resist torsional stresses which are assumed to develop and spiral along the length of a member. Well distributed longitudinal steel and closed ties serve to maintain the integrity of the concrete core enclosed within the stirrups, allowing inclined compression struts to develop and resist the applied forces. The ACI approach assumes that later stage member response will be characterized by spalling of the concrete face shell outside the stirrups. Researchers have recommended detailing such as 135-degree stirrup hooks to maintain the integrity of the concrete core after spalling (Mitchell et al 1976). These detailing requirements often require tightly congested, interwoven reinforcement, especially in the end regions. It is important to mention that within the torsion provisions of ACI , there is a stipulation allowing for alternative approaches to the torsion design of solid sections having an aspect ratio of three or greater. Alternative approaches must be shown as adequate by analysis and comprehensive testing. For many years, spandrel beams have been designed by the precast and prestressed concrete industry following one such alternative procedure, originally proposed by Zia and McGee (1974), and later modified by Zia and Hsu (1978, 2004). Their design procedure was 14
27 developed based on the results of laboratory testing of small symmetrical flanged sections under controlled loadings to produce various combinations of torsion, shear, and bending. The current version of the PCI Design Handbook (version 6, 2004), recommends the guidelines proposed by Zia and Hsu for the design of precast and prestressed spandrel beams. Both the ACI and PCI approaches to shear and torsion design (and their associated detailing requirements) result in safe designs, but often require tightly congested, interwoven reinforcement, especially in the end regions of slender members. Such congested reinforcement is difficult to place, and leads to inefficiency in production. This difficulty is further increased for spandrel beams of aspect ratio less than 3. With no previous research studies on compact L-shaped spandrel beams (aspect ratio less than 3), the shear and torsion design of these beams has no guidelines to follow. 15
28 3 EXPERIMENTAL PROGRAM This chapter describes the experimental program undertaken at the Constructed Facilities Laboratory of North Carolina State University. The chapter provides details of the test specimens, test set up, instrumentation and loading procedures. 3.1 TEST SPECIMENS The experimental program consists of four compact L-shaped spandrel beams with aspect ratio 1.2 and two slender L-shaped spandrel beams with aspect ratio 4.6. This section will illustrate the section and reinforcement details of each spandrel beam COMPACT L-SHAPED SPANDRELS Configuration of the compact L-shaped spandrels tested in the program is shown in Figure 3-1. All specimens had a height of 34 inches, a web thickness of 28 inches, and an 8 inchsquare continuous ledge running along the bottom of the inner web face. The ledge was held back 12 inches at each end to replicate a typical field detail which may be required to facilitate connecting the compact spandrel to a column. In addition, two through-holes were provided at each end of the specimens. These holes were set 6 inches from the ends and 6 inches in from the top of the beam as shown in Figure 3-1 below. The holes were sized to accommodate high-strength threaded rods which were used to bolt the beam to the test frame in a manner that mimicked field conditions. The parameter that was considered for the four test specimens were their reinforcement details. Four different schemes were used for the shear and torsion reinforcement. The longitudinal and ledge reinforcement (both prestressed and conventional) was the same for all specimens. Details of reinforcing are described in a later section. All specimens were fabricated and cast by one precast company. All specimens were cast on October 22 nd 2008 to ensure identical prestressing forces and similar concrete properties. Test specimens were delivered to the laboratory as they were scheduled for testing. Table 3.1 summarizes the tested specimens. 16

29 Figure 3-1 : Typical Compact L-Shaped Spandrel Table 3.1: Test Specimens Test Specimen Dates Tested Description LG1 12/11 12/15/2008 Control Beam with closed stirrups LG2 12/22 12/23/2008 LG3 02/09 02/10/2009 LG4 02/23 02/25/2009 Experimental beam, Welded Wire Reinforcement on Inner Face Experimental Beam, WWR on Inner Face with U-bar on top. Experimental Beam, C-bars on Inner Face REINFORCEMENT DETAILS The reinforcement used for the compact spandrels consisted of prestressing strands, weldedwire reinforcement (WWR), and conventional deformed reinforcing bars. The prestressing strands used were ½ diameter, 7-wire, 270 ksi, low-relaxation strands with a nominal crosssectional area of in 2. Conventional Grade 60 (Metric Gr. 420) #3, #4, #5 and #9 deformed bars were also used in various forms. 17
30 Welded-wire reinforcement was utilized in conjunction with open L- and C-shaped reinforcing bars as the main shear and torsion reinforcement in the front and back faces of specimens LG2, LG3 and LG4. The type of welded-wire reinforcement used on the inner (ledge) face in specimens LG2 and LG3 was D4 x D10 with a 4 spacing. This WWR provided an area of 0.1 in 2 /ft in the vertical direction. Welded wire reinforcement was also used on the outer face of LG2, LG3 and LG4. This WWR was W2.5 x W2.5, a more conventional mesh with a 6 spacing providing 0.08 in 2 /ft in both directions. Table 3.2: Reinforcement Types Reinforcement Sizes Used Deformed Bars #3, #4, #5, and #9 Tendons Welded Wire Reinforcement ½ Dia. Special 270 ksi, D4.0 x D10.0, var. x 4 spacing W2.5 x W2.5, 6 x 6 spacing Specific details of reinforcement for each test specimen are described in the sections below. Sketches of the reinforcement scheme used in each test specimen are found in Figure 3-2. Additional details can be found in the shop tickets used to produce each compact spandrel provided in Appendix A. In order to force the types of end region failures of interest in this study, all four compact spandrels had been over reinforced for flexure. Prestressing steel was provided at typical levels in each compact spandrel, and partial length mild-steel reinforcement was added to provide additional moment capacity away from the end regions. A total of twenty prestressing strands were used for the compact spandrels of which eighteen were placed in the web and two in the ledge. Fifteen strands were laid out at the bottom of the web on a 2 grid, while three were placed on the top of the web as shown in Figure 3-2. Of the two strands placed along the ledge, one was placed along the top corner farthest away from the web inner face and the other placed along the bottom corner nearest to the web inner face. All strands were pulled to an initial tension of 31,600 lbs (70% of ultimate) and had a clear cover of The additional flexural reinforcement in the web was provided using six 30 18
31 long #9 bars centered at midspan. The additional flexural steel was held back from the end regions to prevent their contributions to shear and torsion capacity. In addition to the additional flexural reinforcement, a special detail reinforced the ledge against punching shear failure at each loading point. Additional reinforcements were provided for the ledges at load levels well above the factored load level to prevent punching shear failure. The special reinforcement detail consisted of plates and angles welded to mildsteel reinforcing bars as shown in Figure A LG1 Compact L-shaped spandrel LG1 was designed with conventional closed stirrups to serve as a control specimen for the testing program. Closed stirrups were provided according to the approach recommended by Zia-Hsu, as outlined in the 6 th edition of the PCI handbook (PCI, 2004). In addition to closed stirrups, longitudinal reinforcement was provided in the end regions of LG1 in addition to the flexural reinforcement as required by the Zia-Hsu approach. A total of 116 (#3) closed stirrups were spaced along the web of LG1 at 5 for a majority of the length and 3 near the ends. The end regions also had 4 (#5) bars placed longitudinally along the web for a length of 15 feet. These bars overlapped with the #5 U-shaped bars at each end of the specimen. Figure 3-2 shows the typical reinforcement while Figure A 1 and Figure A 3 provide additional details. As with all four test specimens, the ledge of LG1 was heavily reinforced to prevent localized failures. In addition to the ledge reinforcement mentioned in the previous section, the ledge of LG1 had (#3) closed stirrups spaced at 5 as shown in Figure A LG2 Compact L-shaped spandrel LG2 was designed using flat sheets of welded wire reinforcement (WWR) on the inner and outer web faces and L-shaped bars in the ledge along with the longitudinal reinforcement listed earlier. The scheme used to reinforce LG2 is shown in Figure 3-2. WWR (6 x 6 W2.5 x W2.5) was provided along the entire length on the outer (non ledge) web face. Along the inner web face D4.0 x D10.0 WWR with a 19
32 variable 4 spacing was provided continuously down the entire length of the beam. The continuous D4.0 x D10.0 mesh was supplemented by an additional piece of W2.5 x W2.5, 6 x 6 WWR for the first three feet at each end of the specimen. All WWR extended the full depth of the web as shown in Figure A 4 and Figure A 6. No steel of any sort crossed over the top or bottom surfaces of the web in LG2 as shown in Figure 3-2. In addition to the WWR, longitudinal mild steel reinforcement was provided in the end regions of LG2 to resist plate bending forces. Five U-shaped (#5) bars measuring 2 1 by 2 6 were placed at each end of the web, one with each of the three layers of prestressing strands and the remaining two spaced at 10 near the mid-height of the web. The ledge of LG2 was reinforced with L-shaped #3 bars spaced at 8. Reinforcing details for LG2 are shown in Figure A 4 through Figure A LG3 The reinforcement used for compact spandrel LG3 was identical to that used in LG2 except that 43 U-bars spaced at 12 were placed along the top of the web as shown in Figure 3-2. These U-bars were placed on top of the upper prestressing strands and hooked over the vertical WWR sheets onto the faces of the web. The reinforcement details for LG3 as shown in Figure A 7 through Figure A LG4 The web of compact spandrel LG4 was reinforced with a combination of WWR and conventional reinforcement. A layer of W2.5 x W2.5 6 x 6 WWR was provided on the outer (non-ledge) face. On the inner web face, #4 C-shaped bars were provided at a spacing of 8. The C-shaped bars were placed so that the shorter legs of the C-shape extended over the top and bottom web surfaces, fully developing the vertical leg of the bar. The scheme used for reinforcing specimen LG4 is shown in Figure 3-2. Additional reinforcement details are shown in Figure A 10 and Figure A 11 in Appendix A. Similar to specimens LG2 and LG3, longitudinal U-bars were provided in the end regions of the beam to help resist plate-bending effects. 20
33 Figure 3-2 : Typical Midspan Reinforcement Details for Compact Spandrels LG1 through LG SLENDER SPANDRELS The configuration of the slender spandrel specimens tested in the program is provided in Figure 3-3. Alll specimenss had a height of 46 inches, a web thickness of 10 inches, and an 8 inch-square continuous ledge running along the bottom of the inner web face. The ledge was held back 12 inches at each end to replicate a typical field detail which may be required to facilitate connecting a spandrel to a column. In addition, two through-holes were provided at 21
34 each end of the specimens. These holes were set 6 inches in from the ends and 7 inches in from the bottom of the slender spandrel as shown in Figure 3-3 below. The holes were sized to accommodate high-strength threaded rods which were used to bolt the slender spandrels to a test frame in a manner that mimics field conditions. The parameters considered for testing the slender spandrels were their reinforcement details. Both specimens were provided with open reinforcement along the web and ledge while differing only in the conventional longitudinal reinforcement. All specimens were fabricated and cast by one precast producer. Specimens were cast together on November 17 th 2008 to ensure identical prestressing forces and similar concrete properties. Test specimens were delivered to the laboratory as they were scheduled for testing. The table below summarizes the tested specimens. Table 3.3: Test Specimens Test Specimen Dates Tested Description SP20 01/12 01/13/2009 SP21 01/26/2009 Experimental beam, L-bars on inner face and welded wire reinforcement on outer face. Typical beam, identical to SP20 except for the lack of additional conventional longitudinal reinforcement at midspan. 22
35 ISOW TRIC VIEW MICIoL,...,... Figure 3-3 : Typical Slender L-Shaped Spandrel 23
36 REINFORCEMENT DETAILS The reinforcement used for the slender spandrels consisted of prestressing strands, weldedwire reinforcement (WWR), and conventional deformed reinforcing bars. The prestressing strands used were ½ -diameter, 7-wire, 270 ksi, low-relaxation strands with a nominal crosssectional area of in 2. Conventional Grade 60 (Metric Gr. 420) #3, #4, #5, #7 and #9 deformed bars were also used in various forms. Welded-wire reinforcement was utilized in conjunction with open L- shaped reinforcing bars as the main shear and torsion reinforcement in the web of the specimens. The type of weldedwire reinforcement used on the outer (non ledge) face in both specimens was W2.5 x W2.5 with a 6 spacing. This WWR provided an area of 0.08 in 2 /ft in both directions. Table 3.4: Reinforcement Types Reinforcement Sizes Used Deformed Bars #3, #4, #5, #7 and #9 Tendons Welded Wire Reinforcement ½ Dia. Special 270 ksi, W2.5 x W2.5, 6 x 6 spacing Specific details of reinforcement for each test specimen are described in the following sections. Sketches of the reinforcement scheme used in each test specimen are found in Figure 3-2. Additional details can be found in the shop tickets used to produce each slender spandrel. These tickets are provided in Appendix A. Both slender spandrels utilized the open reinforcement scheme along the web. WWR (6 x 6 spacing, W2.5 x W2.5) was provided along the entire length on the outer (non ledge) web face. All WWR extended the full depth of the web as shown in Figure 3-4. L-shaped bars spaced at 8 were provided along the inner face with the shorter leg placed along the bottom surface. The ledge of both the spandrels used U-shaped bars spaced at 8. No steel of any sort crossed over the top surfaces of the web in either specimen. A total of sixteen prestressing strands were used in each spandrel of which thirteen were placed in the web and three in the ledge. Nine strands were laid out at the bottom of the web on a 2 grid while two more were placed 8 above them. Two strands were placed on the top 24
37 of the web as shown in Figure 3-4. Of the three strands placed along the ledge, two were placed near the top corner farthest away from the web inner face and the third placed along the bottom corner nearest to the web inner face. All strands were pulled to an initial tension of 31,000 lbs (70% of ultimate) and had a clear cover of In addition to the prestressing steel, the ledges of both spandrels were provided with one #5 bar placed at the bottom corner farthest away from the inner web face and spanned across the entire ledge. Similar to the compact L-shaped spandrels, a special detail reinforced the ledge against punching shear failure at each loading point. This special welded ledge detail is shown in Appendix A. Both slender spandrels were also provided with longitudinal U-bars were provided in the end regions of the beam to help resist plate-bending effects SP20 Slender L-shaped spandrel SP20 was designed with the open reinforcement described earlier. In addition to the WWR and L-bars, longitudinal reinforcement was provided in the end regions of SP20 in order to ensure end region failures which is of interest in this study. Two #9 reinforcing bars 30 in length centered along midspan were placed above the L-bar that crossed over from the ledge to the web. A further two #9 reinforcing bars 20 in length also centered along midspan were placed above them. Two more #9 reinforcing bars 30 long and two #7 bars 20 long were placed at the top of the web below the top prestressing strands shown in Figure SP21 Slender L-shaped spandrel SP21 was designed with open reinforcement along the web and ledge identical to that provided in SP20. However, SP21 was designed as the typical beam without any additional flexural reinforcement that was usually provided to ensure failures in the end region. However, along the ledge one #5 bar was provided in addition to the one described earlier and placed at the top corner closest to the inner web face and spanned across the entire ledge. 25
38 Figure 3-4 : Typical Midspan Details for Slender Spandrels SP20 and SP21 26
39 3.2 TEST SETUP GENERAL SETUP The setup used to test all six spandrels was designed in consideration of the 3 hole spacing of the strong floor at the Constructed Facilities Laboratory. This setup consisted of the primary components listed below. 1) A system of columns, beams, and stands designed to transfer the vertical and horizontal reactions of the spandrels to the strong floor. 2) A system of spreader beams, tie-down rods, hydraulic jacks, and a control system designed to apply the required loads and transfer them evenly to the appropriate points on the test specimens. 3) A system of concrete support blocks, steel channels, and tie-down rods which supported the end of the double-tee deck opposite to the spandrel under test. 4) An array of load cells and other instrumentation which will be described in the following sections SETUP FOR COMPACT L-SHAPED SPANDREL TESTS Details from the test setup of the compact spandrel are shown in Figure 3-5 and Figure 3-6. Labeling conventions for front/inner, back/outer, left, and right are also established in these figures, and are used throughout the rest of the thesis. The compact spandrel was supported at the left end on two 200-kip load-cells resting on short steel stands set on the laboratory strong floor. These stands fit tightly against vertical support column which had been post-tensioned to the floor. The ledge of each beam was oriented away from the supporting columns. Measuring the main vertical reaction with two load cells centered at the beam web, allowed for detection of the shift of the reaction during the test. Lateral tie-backs were provided at each end of the compact spandrel by attaching a pair of vertical back-to back channels to the through holes in each specimen with heavy threaded bars. The rigid channels extended above and below the top and bottom surfaces of the beam. Threaded rods were used to attach the channels to the supporting columns and to the strong floor, providing torsional restraint to the spandrel web as shown in Figure 3-8. The purpose 27
40 of the channels was to reduce the lateral reactions on the testing equipment and the instrumentation to acceptable levels. Care was taken to accurately align the channel strong back system, and to record all dimensions so that the lateral forces produced on the beam could be easily determined from the loads recorded at the top and bottom of each channel pair. Note that the two supporting columns shown towards the midspan of the test spandrel in Figure 3-6, were not attached to the beam in any way. These columns were simply part of a rigid framework helping to brace the outer columns and restrain them from warping under load. With the compact L-shaped spandrel secured to the test columns at both ends, the double-tee deck was put in place. Four 10 wide (12 span) double-tee sections (10DT26) were used in conjunction with one 5 wide (12 span) single-tee section to create a 45 long deck. The single tee was placed in the middle of the span with two of the four double tees on either side. All deck sections were placed along the ledge of the L-shaped spandrel with the gap between the inner face of the beam and the decks of 1. Connection plates at the mid-width of each deck were welded to embedded plates in the top surface of the beam web with typical field detail, shown in Figure 3-7. The end of the deck sections opposite to the compact spandrel rested on several concrete support blocks which were post tensioned to the strong floor. The blocks are shown in Figure 3-5 and Figure
41 Figure 3-5 : Profile View of Test Setup Compact L-Shaped Spandrel Figure 3-6: Top View of Test Setup Compact L-Shaped Spandrel 29
42 Figure 3-7: Connection Detail as Tested for Compact L-Shaped Spandrels To apply the test loadings, a system of hydraulic jacks was used in conjunction with several spreader beams and tie-down rods. Four center-hole jacks of 60-ton (120 kip) capacity were used, one for each double-tee section and one 30-ton (60 kip) center hole jack was used for the single-tee section. The jacks were connected with flexible hoses through a series of valves and manifolds to an electric pump. The hydraulic system provided equal pressure to all jacks thereby ensuring equal load distribution (each 60-ton jack loaded 2 stems while the 30-ton jack loaded only 1). In addition, valves were incorporated to allow for control of the loading rate. Finally, a one-way flow valve was added to ensure that the load could not be released unexpectedly. 30
43 JACK AND TOP SPREADER LOWER SPREADER Figure 3-8 : Compact L-Shaped Spandrel and Deck with Jacks and Spreaders Each hydraulic jack reacted against a 5 6 long spreader beam set atop each double-tee deck. A 2 spreader beam was placed above the jack for the single-tee. The centerline of the jacks and spreader beams was 3 back from the face of the compact spandrel. For each of the double-tees, a hole centered in the width of each deck section allowed a heavy threaded bar to pass throughh the jack, the spreader beam, and the deck to a system of lower spreaderr beams tied to the strong-floor. The single tee section had two holes on the deck section, one on each side of the stem to allow for a smaller threaded rod to passs through the spreaderr placed above the jack and the system of lower spreader beams tied to the strong floor. For the double-tees, the upper spreader beam transferred the load from the jack to 6 x 8 steel plates which were centered on top of the two double-tee stems for each deck section. For the double 31

44 tee placed on the left end of the setup, a load-cell was placed between the left end of the spreader beam and the plate to measure the force being transmitted to a single stem. In this case, additional plates were used on the opposite end of the spreader to compensate for the thickness of the load-cell. The lower spreader beams (steel channel and HSS sections) were needed to transfer the load from the bar connected to the jack to the strong floor. Figure 3-8 shows the lower spreader system for the rightmost deck section. Figure 3-9: Compact L-Shaped Spandrel Setup Showing Jacks and Spreader Beams on the Deck Sections 32

45 Figure 3-10: Photograph of Top View of Test Setup of Compact L-Shaped Spandrels BEARING PADS The test setup for all four compact L-shaped spandrel tests, included special bearing pads were to limit friction at the locations where they were used. The pads consist of a very stiff cotton duck pad (Capralon) laminated to a thin layer of Teflon. The Teflon layer is placed in contact with a smooth, stainless steel plate (roughly 1/8 thick) to provide a low friction sliding surface even under heavy loads. The pads and stainless plates were used at the main spandrel reactions and were also used under every double-tee stem along the compact spandrel beam ledge as shown in Figure For the main reactions (at the supports), the bearing pad was attached to the beam using epoxy, and the stainless steel plate was tack welded to a steel plate set on the main load cells. For each stem reaction, a stainless steel plate was attached to the double-tee stem using epoxy, and the bearing pad was set on the compact spandrel beam ledge. 33

 The")


46 TEFLON COATED BEARING PADS AND STAINLESS STEEL PLATES Figure 3-11: Bearing Pads at Support (Left) and at Deck resting on Ledge (Right) The design of the compact spandrel beams assumed that the resultant force from each double-tee stem was applied at a location 6 from the inner face of the web. Thus the 4 x 4 Teflon bearing pad used at each stem reaction was positioned flush with the edge of the ledgee to allow the center of this pad to be located 6 from the inner web face of the beam. A typical stem to ledge bearing reaction is shown in Figure
47 BEARING PAD AND STAINLESS STEEL PLATE Figure 3-12: Location of Resultant Force at Ledge SETUP FOR SLENDER L-SHAPED SPANDREL TESTS Details from the test setup of the slender spandrel are shown in Figure 3-13 to Figure Similar labeling conventions of front/inner, back/outer, left, and right are also established in these figures, and are used throughout the rest of the thesis. The slender spandrel was supported at the left end on one 200-kip load-cell resting on a short steel stand on the laboratory strong floor. This stand fit tightly against the vertical support column which had been post-tensioned to the floor with heavy bars. The orientation of the slender spandrel was identical to thatt of the compact spandrel with the ledge of each slender spandrel oriented away from the supporting column. The main vertical reaction was measured by the 200-kip load cell which was centered along the web of the spandrel at the left end. 35
48 In a similar arrangement as that of the compact spandrels, lateral tie-backs were provided at each end of the slender spandrel by attaching a pair of vertical back-to back channels to the through holes in each specimen with heavy threaded bars. The rigid channels extended above and below the top and bottom surfaces of the beam. Threaded rods were used to attach the channels to the supporting columns and to the strong floor, providing torsional restraint to the slender spandrel web as shown in Figure Care was taken to accurately align the channel strong back system, and to record all dimensions so that the lateral forces actually produced on the beam could be easily determined from the loads recorded at the top and bottom of each channel pair. With the slender L-shaped spandrel secured to the test columns at both ends, the double-tee deck was put in place. The arrangement of the double tee decks for the slender L-shaped spandrel was identical to that of the compact spandrel with a total of four 10 wide (12 span) double-tee sections (10DT26) used in conjunction with one 5 wide (12 span) single-tee section to create a 45 long deck. The single tee was placed in the middle of the span with two of the four double tees on either side of it. All deck sections were placed along the ledge of the slender L-shaped spandrel with the gap between the inner face of the beam and the decks of 1. Connection plates at the mid-width of each deck were welded to embedded plates along the inner surface of the slender spandrel web with typical field detail, shown in Figure The end of the deck sections opposite to the compact spandrel rested on several concrete support blocks which were post tensioned to the strong floor. 36
49 Figure 3-13 : Profile View of Test Setup for Slender L-shaped Spandrels The arrangement of hydraulic jacks in the slender L-shaped spandrels, that were used to apply the required loads were identical to that of the compact L-shaped spandrels. Four jacks of 60-ton (120 kip) capacity were used in conjunction with one 30-ton (60 kip) jack. The hydraulic system provided equal pressure to all jacks thereby ensuring equal load distribution. Valves were incorporated to allow for control of the loading rate and to maintain the load. Each hydraulic jack reacted against a 5 6 long spreader beam set atop each double-tee deck. A 2 spreader beam was placed above the jack for the single-tee. Similar to the compact spandrel, the centerline of the jacks and spreader beams was 3 back from the inner face of the slender spandrel. All the decks were secured with an arrangement of spreader beams and threaded bars tied down to the strong floor. For the double-tees, the upper spreader beam transferred the load from the jack to 6 x 8 steel plates which were centered on top of the two double-tee stems for each deck section. For the double tee placed on the left end of the setup, a load-cell was placed between the left end of the spreader beam and the plate to 37

50 measure the force being transmitted to a single stem. In this case, additional plates were used on the opposite end of the spreader to compensate for the thickness of the load-cell. The lower spreader beams were utilized to spread the load from the jacks to the strong floor below. Figure 3-14: Experimental Setup for Slender L-Shaped Spandrel 38


51 JACK AND TOP SPREADER BEAM LOWER SPREADER BEAM Figure 3-15: A Slender L-shaped Spandrel with Spreader Beams and Decks Figure 3-16 : Connection Details as Tested for Slender L-Shaped Spandrels 39
52 3.3 INSTRUMENTATION COMPACT L-SHAPED SPANDRELS Four basic types of instrumentation were used in testing each compact spandrel. The different types of instruments are shown in Figure 3-17 to Figure All instruments were connected into an electronic data acquisition system. 1) Load cells were used to measure the vertical and lateral reactions and to measure the load being applied by the jacks. 2) String and linear potentiometers ( pots ) were used to measure vertical and lateral displacements at midspan, left quarter span and left support. 3) Inclinometers were used to measure the rotation at midspan, left quarter span and left support. 4) PI gages were used to measure concrete strains on the top, bottom, and front faces of the spandrel beam. A total of 33 instruments were used to record data during each of the compact spandrel test. Two load cells, each having a rated capacity of 200 kips, were used to measure the main vertical reactions at left end of the compact spandrel. These load cells were placed between the support and the spandrel bearing pad as is shown in Figure 3-5 above. In addition, two more load cells were used at each end of all specimens to measure the lateral reactions. A doughnut-shaped load cell with a capacity of 100 kips was used to measure the bottom lateral reaction developed on the double channel strong back at each end of the compact spandrel. Similarly, a 150 kips capacity load cell groups was used to measure the top lateral reaction on the channel strong back at each end of the compact spandrel. 40
")

53 INCLINOMETER STRING POTS Figure 3-17: Instruments Used in Testing (shown at midspan) DOUBLE TEE STEM ORTHOGONAL PAIR OF PI GAGES Figure 3-18 : Instruments Used in Testing (end support) 41
54 PI GAGES LOAD CELLS DATA ACQUISITION - VISHAY Figure 3-19 : Instruments Used in Testing of Compact L-Shaped Spandrels In order to verify the forces being applied by the jacks during testing, another load cell was also placed between one side of an upper spreader beam and the steel plate bearing on the double-tee stem as seen in Figure Vertical displacements of the compact spandrels were measured at midspan, quarter span, and at the supports. Three string pots were used to measure vertical deflections at the midspan and one at quarter span. At midspan, one string pot was located at each web face, and the third was positioned at the front of the ledge. At quarter span, a single string pot was located at the center of the web. At the support, linear potentiometers were used to measuree the vertical deflections near the inner and outer web face. 42

55 Lateral deflections were measured with string potentiometers at the top and bottom of each compact spandrel at midspan, quarter span and support locations. In addition, an inclinometer was used to directly measure the tilting of the compact spandrel at the midspan, quarter span and support. All locations at which deflection measurements were taken are shown below for three cross-sections in Figure Figure 3-20: Cross-Sections Showing Instrument Locations for Compact L-Shaped Spandrels Concrete strain measurements were recorded during all tests using PI gages with gage lengths of 100 mm and 300 mm. In total, 10 PI gages were used for each test. Six of these were used to measure flexural strains at the midspan and left quarter span. These flexural gages all had 100 mm gage lengths, and are referenced by their position on the compact spandrel. The remaining 4 PI gages were used to measure the face concrete strains on the front face of each spandrel web at the ends as shown in Figure These 4 gages all had a 300mm gage length and were arranged into orthogonal pairs of two gages each, one orientated vertically and the other horizontally with their centers aligned. Gage pairs were positioned on the front face below the surface of the deck. The locations and sizes of all PI gages used are shown in Figure 3-21 below. 43


56 Figure 3-21: PI Gage Locations for Compact L-Shaped Spandrel Tests An additional linear potentiometer was used measure the distance between the inner face of the compact spandrel and the stem of the double-tee. The measurement was taken at midspan just above the top surface of the compact spandrel ledge as shown in Figure 3-22 below. The purpose of this measurement was to verify the effectiveness of the slide bearings under each stem, and to illustrate the extent to which the compact spandrel rotated outward from underneath the double-tee stems. DOUBLE TEE STEM LINEAR POTENTIOMETER STAINLESS STEEL PLATE AND BEARING PAD Figure 3-22: Measurement of Gap between spandrel and Stem 44
57 3.3.2 SLENDER L-SHAPED SPANDRELS The instrumentation of the slender L-shaped spandrels was similar to that of the compact spandrels. In addition to the four basic types of instruments used in the compact spandrels, the slender spandrels utilized strain gages placed directly on the concrete surface to measure concrete strain. A total of 35 instruments were used to record data during each of the slender spandrel test. One load cell, having a rated capacity of 200 kips, was placed at each end of the slender spandrel to measure the main vertical reactions. The load cell was placed between the steel support stand and the slender spandrel bearing pad as is shown in Figure Similar to the compact spandrel, an arrangement of load cells with a capacity of 150 kips measured the top lateral reactions at each end and a doughnut-shaped load cell with a capacity of 100 kips was used to measure the bottom lateral reaction at each end. These lateral reactions developed on the double channel strong back at each end of the slender spandrel were then used to determine the actual loads imposed on the slender spandrel. Lateral and vertical displacements measured by string potentiometers on the slender spandrel were placed at identical locations as that of the compact spandrels and is shown in Figure Linear potentiometers measured the vertical displacement at the left support and were placed along the inner and outer web face of the slender spandrel. Inclinometers measured the rotation of the slender spandrels at identical locations as that of the compact spandrels and are shown in Figure In addition to the PI gages which were placed at similar locations to that of the compact spandrel, strain gages were placed at h (height of the spandrel web, 46 ) for SP20 and 1.5h (69 ) from the left end at the center of the top and outer faces for SP21. The gap between the inner web face and the stem of the double tee at midspan was also measured in a similar manner as shown in Figure


58 LOAD CELL MEASRING THE APPLIED LOADING FROM THE HYDARIULIC JACK LOAD CELLS MEASURING LATERAL REACTION LOAD CELL MEASURING VERTICAL REACTION Figure 3-23: Arrangement of Load Cells for Slender L-Shaped Spandrel 46
59 Figure 3-24: Cross Sections Showing Instrument Locations for Slender L-Shaped Spandrels 3.4 LOADING Design loads for the tested beams (slender and compact L-shaped spandrels) are summarized in Table 3.5. Table 3.5: Design Loads Load Value Notes Dead Load 71.6 lbs./ft 2 Weight of the 10DT26 deck Dead Load 1058 lbs./ft Self weight of Compact L-shaped Spandrels 545 lbs./ft Self weight of Slender L-shaped Spandrels Live Load 40 lbs./ft. 2 Snow Load 30 lbs./ft. 2 Based on the given design loads, the spandrel reaction for several desired load combinations was determined. This spandrel reaction was monitored throughout testing, and served as the basis for controlling a loading system of hydraulic jacks during the test. The following load levels were used in the test program of compact and slender spandrels: Dead load (D.L), service load without snow (DL+LL), a reduced service load with snow specified by ASCE7 (DL+0.75LL+0.75SL), the unfactored service load (1.0DL+1.0LL+1.0SL), and the ACI / ASCE7 factored design load (1.2DL+1.6LL+0.5SL). These load combinations and their values are summarized in Table 3.6 below. 47
60 Table 3.6: Load Levels for Testing Designation Load Compact Spandrel Reaction (kips) Slender Spandrel Reaction (kips) Dead DL Service DL+LL ASCE7 Service with Snow 1.0DL+0.75LL+0.75SL Service with Snow 1.0DL+1.0LL+1.0SL Fully Factored 1.2DL+1.6LL+0.5SL Nominal Strength (1.2DL+1.6LL+0.5SL) / It should be noted that references to dead load within the testing program assumed that the spandrel supported the reaction of a 60-foot span double-tee deck. However, due to space limitations, a 12 span double-tee deck was used in the test setup as seen earlier. The design dead load was equal to much more than the self-weight of the spandrel and the associated 12 deck sections. The jacking system was used to introduce extra dead load into the system to represent the full reaction of a 60 span double-tee deck. Load was applied to each specimen in incremental cycles based on the load designations shown in Table 3.6. For each cycle, the spandrel was loaded to the given level, observations were made, and the spandrel was then unloaded. Load was applied in this trend up to the factored load level. Once the factored load was applied, it was then held on each spandrel for a full 24-hours. After the 24-hour load test, each spandrel was unloaded and its recovery was monitored for a period of 1 hour. At the end of the hour (provided the spandrel passed the ACI-318 Chapter 2 recovery criterion), each spandrel was loaded again to failure in incremental cycles, as illustrated in Figure This loading procedure was followed for compact L-shaped spandrel LG1, LG2 and LG 3 and slender L-shaped spandrel SP20 and SP21. Compact L-shaped spandrel LG4 was loaded in a similar procedure through the recovery of the 24-hour factored load test. At this point, it was decided that an extra 24-hour load be introduced at the end of the recovery of the first 24-hour loading cycle. It was decided that 48


61 the second 24-hour load be conducted at the nominal strength level of the compact spandrel. The loading sequence is illustrated in Figure Observations were made and cracks were marked at all pertinent load levels for each cycle. The load was simply held a particular level during a cycle to provide time for marking of cracks. Figure 3-25 : Load Levels for Testing - LG1, LG2, LG3, SP20 and SP21 Figure 3-26: Load Levels for Testing - LG4 49
62 4 EXPERIMENTAL RESULTS This chapter summarizes the properties of materials used in fabricating of the six spandrel beams tested in this program. Test results for the experimental program and overall behavior of the tested specimens based on measured data and observation are reported. The experimental program consisted of four compact L-shaped spandrel beams of aspect ratio 1.2 and two slender L-shaped spandrels of aspect ratio MATERIAL PROPERTIES The first four tested compact spandrel beams produced by the same precast producer were fabricated at the same time using the same batch of reinforcement and concrete. A similar procedure was followed for the other two slender spandrels. The following material characteristics are representative of each aspect ratio CONCRETE The concrete for all L-shaped spandrels was a typical mix used for standard production of precast concrete products, with a normal nominal weight of 150 lbs/ft 3. The mix was selfconsolidating concrete that was batched onsite at the prestressing plant and delivered to the forms in specialized concrete transport vehicles. The average compressive strength reported by the producer was 8600 psi. All four L-shaped spandrel beams were cast together and 4 x8 cylinders were fabricated from the same cast. Two cylinder samples were tested in compression at the time each L-shaped spandrel beam was tested. Results of the compressive strength are given in Table 4.1 provided by the fabricator: Table 4.1 : Concrete Compressive Strengths for Compact Spandrels Spandrel Beam Average Test Cylinder Compressive Strength (psi) LG LG LG LG A similar pattern was followed for the slender L-shaped spandrel beams SP20 and SP21. For spandrel SP21, 4 x 8 concrete cores were extracted from an un-cracked section of the spandrel after testing to determine the compressive strength. The producer reported an 50
63 average compressive strength of 7640 psi for the concrete at 28 days. The measured average compressive strength from the extracted cores was 6500 psi REINFORCEMENT Prestressing strands (tendons) used for the compact L-shaped spandrel beams LG and the SP spandrels with higher aspect ratio of 4.6 were ½ diameter, 7-wire, 270 kip, low-relaxation strands with a nominal area of in 2. Material properties of the tendons were based on the published values provided by the PCI Design Handbook. Prestressed tendons were also used as lifting hooks for all tests beams. The typical material properties used for the prestressing strands are summarized in Table 4.2. Table 4.2 : Prestressing Strand Porperties (PCI Handbook) Elastic Modulus (ksi) Ultimate Stress (ksi) Yield Stress (ksi) Samples of the conventional reinforcing bars and welded wire reinforcement (WWR) used in the production of the beams were tested using a 220-kip MTS universal testing machine with hydraulic wedge grips. Elongation at the center of each steel sample was measured with an electronic extensometer having a 2 gage length. The material properties of each beam category are discussed in the following sections: COMPACT L-SHAPED SPANDREL BEAMS, LG SERIES (ASPECT RATIO: 1.2) Three samples each of #4 rebar and #3 reinforcing bars were tested with a gage length of 8.25 inches and tested using a load rate of 0.1 in./minute. All reinforcing bar samples failed in a similar fashion as shown in Figure 4-1. Three samples of the D10 bars taken from the WWR were also tested in a similar fashion. The failure mode of the D10 bars was similar to that of the conventional rebar as shown in Figure 4-1. Two samples of 6 x 6 WWR were also tested in the same manner. Each of these WWR samples was cut from a larger sheet so that the tested specimens contained two cross-wires within their length. The length was selected as three times the mesh spacing, and the specimens were cut so that both cross-wires would be centered on the longitudinal wire. Test Results are given in Table 4.3 and Table


 102,360 102,880 the")


 (%) #3 WWF 89,000 115,000 102,4300 119,690 8.25 17.")

64 for the LG L-shaped compact beams and SP L-shaped slender beams respectively. Stress- strain relationships are shown in Figure 4-3 through Figure 4-6. Table 4.3: Material Properties of Conventional Reinforcement used for L-shaped compact beams Bar Size Yield Stress (psi) #4 85,667 #3 87,000 * Actual %Elongation would be larger than t Ultimate Stress (psi) 102, ,880 the extensomete Gage Length % Elongationn * (in.) (%) er which was removed prior to failure Table 4.4: Material Properties of Welded Wire Reinforcement used for L-shaped compact beams Bar Size Yield Stress Ultimate Stress Gage Length % Elongationn * (psi) (psi) (in.) (%) #3 WWF 89, , , , * Actual %Elongation would be larger than the extensometer which was removed prior to failure Figure 4-1 : Left - Conventional Reinforcing Bars; Right - WWR, Samples after Testing 52

65 Figure 4-2 : MTS machine Test Setup and Mesh Samples Figure 4-3: Stress Strain Curve for #4 Reinforcing Bars LG series 53
66 Figure 4-4 : Stress Strain Curve for #3 Reinforcing Bars LG series Figure 4-5 : Stress Strain Curve for #3 Rebar used as WWR LG series 54
67 Figure 4-6 : Stress Strain curves for conventional WWR LG series SLENDER L-SHAPED SPANDRELS (ASPECT RATIO: 4.6) A similar procedure was followed to determine the properties of the materials used in the slender spandrels. Two representative samples each of #4 bars and #5 bars were tested with a gage length of 8.25 inches and subjected to a load rate of 0.1 in./minute. Figure 4-7 and Figure 4-8 show the stress strain relationships for these bars, while Table 4.5 lists the material properties. Table 4.5: Material Properties of Conventional Reinforcing Bars used for Spandrels of aspect ratio 4.6 Bar Size Yield Stress Ultimate Stress Gage Length % Elongation (psi) (psi) (in.) (%) #5 69,000 94, #4 67,000 98, * Actual %Elongation would be larger than the extensometer which was removed prior to failure 55
68 Figure 4-7 : Stress Strain curve #5 Reinforcing Bars SP series Figure 4-8 : Stress Strain curve #4 Reinforcing Bars SP series 56
69 4.2 STRUCTURAL BEHAVIOR OF TESTED BEAMS Test results of each tested beam (compact and slender) are presented individually followed by a summary of test results where certain parameters are compared. Test results of the final loading cycle are presented only for each tested beam to clarify the overall behavior. The summary the entire loading sequence is shown where needed to clarify the behavior through the entire loading history COMPACT SPANDREL LG1 Compact L-shaped spandrel beam LG1 was designed using conventional closed stirrups to serve as a control specimen for the testing program. Web reinforcement was designed based on the Zia-Hsu approach, which required the use of closed stirrups in the web and the ledge for L-shaped spandrel beams subjected to eccentric loading. Additional flexural and ledge reinforcement steel were provided to induce failure at the end regions which is the main focus of this research. LG1 sustained a maximum vertical end-reaction of 220 kips as shown in Figure 4-9. The loading was terminated at this load level due to the capacity limitation of the test setup. It was noted that LG1 was able to sustain its design factored design load of 140 kips for 24- hours with minor flexural cracking at midspan of the beam. LG 1 was re-tested using smaller bearing pads at each support to examine the effect of the size of bearing pad on the overall behavior. The bearing pads used was 8 wide instead of the 16 wide pads used in the original test. Detailed information of the data collected for L-shaped compact beam LG1 can be found in Appendix B. The following sub-sections highlight the major aspects of the behavior VERTICAL DEFLECTION The load- vertical deflection behavior of LG1 is shown in Figure 4-9. String potentiometers placed along the outer web face, inner web face and ledge at midspan to measure the vertical deflection of the beams at these locations as shown in Figure 4-9. Note that the reading of the main end reaction started at 36 kips which corresponded to the self-weight of the compact L- 57
70 shaped spandrel beam and 12 double-tee decks used to apply the load to the beam. The deflection behavior at the selected locations indicates that the maximum deflection occurred at the ledge of the beam due to eccentric location of the double tees. Due to rotation, minimal deflection was observed at the outer surface of the web. Vertical deflection at the inner face of the web at the factored load level of kips and at the final load of 220 kips was around 2.7 and 4.7 respectively. Vertical deflections of the inner and outer faces of the web at the end support were also measured by linear potentiometers as shown in Figure The measured deflections are significantly smaller and were mainly due to the overall rotation at the end support. The deflection at the outer face of the web at the factored load of kips and the final load of 220 kips were 0.2 and 0.4 respectively. Figure 4-9: Midspan Vertical Deflection vs. Applied Vertical Reaction LG 1 58
71 Figure 4-10: Support Vertical Deflection vs. Applied Vertical Reaction LG 1 Lifting of the outer face of the beam at the support due to rotation of the beam is shown in Figure Vertical deflection at the inner face at the support was extremely small in comparison. The deflected shape of LG1 at various loading stages, along with the behavior throughout the 24-hour loading cycle and 1-hour recovery are given in detail in Appendix B. 59


72 Figure 4-11: Support Deflection LG LATERAL DEFLECTION: The lateral displacements recorded for LG1 at midspan throughout the range of loading are plotted in Figure Lateral displacements were measured at both the top and bottom of the beam at midspan as sketched in Figure The figure represents the net lateral deflection after consideration of the measured deflections of the supports. Measured deflections indicating outward movement were considered positive as shown in Figure This same convention was also used for all the specimens in the testing program. Both lateral deflections indicate outward movement up to a load level of 180 kips at which the beam started to move inward towards the double-tees. The behavior indicates that the connection with the double tees at the top of the beam effectively held the beam from rolling inwards up to the load level of 180 kips. Beyond this load, the deck connection was 60
73 ineffective in restricting the inward rolling movement and is evident by the buckling of the steel plate connecting the beam and the double tees. As expected the lateral deflection at the top of the beam was lesser than the bottom deflection due to the presence of the welded connections. Maximum net lateral deflection at the bottom of the beam was around 0.37 while that at factored service load level was around 0.3. Figure 4-12: Midspan Lateral Deflection vs. Applied Vertical Reaction LG BEAM ROTATION: Inclinometers were used to measure the rotation of the beam at midspan, quarter span, and at the supports. Figure 4-13 represents the net rotation at midspan and quarter span after consideration of the measured rotations at the support. The sign convention used for analyzing this net rotation considered the top of the beam rotating inward (towards the deck) and the bottom of the beam rotating outward to be positive. 61
74 With increase in each load level, the measured inclination indicated that the top of the beam rotated towards the double tees and the bottom of the beam rotated away from the double tees. The rotation at mid span and quarter span indicated that they were fairly close up to the factored twenty four hour load level of kips and beyond which the rotation at mid span was slightly more than that at quarter span. The net maximum rotation at mid span at factored load and the final load of 220 kips were 0.2 degrees 0.4 degrees respectively. Figure 4-13: Rotation vs. Applied Vertical Reaction LG CONCRETE STRAIN PI gages were used to measure the concrete strain and they attached to flat steel head already adhered to the concrete face at specific locations. For all measured strain data, tensile strain was considered as positive while compressive strain was considered as negative. PI gages were placed on the top and bottom surfaces of the web at midspan and quarter span to measure the strain as shown in Figure The concrete strains on the top surface of the beam were compressive in nature and remained significantly below the crushing strain of 62
75 0.003 at the ultimate load level. Appendix B provides details of the measured flexural strain profile at midspan and quarter spans for compact spandrel LG1. It was interesting to observe that the tensile strain measured at quarter span exceeded the tensile strain at midspan. This could be due to the combined effects of torsion, lateral bending, and vertical flexure near the quarter span. It was also observed that the tensile strains increased significantly towards the ultimate loading cycle indicating the formation of diagonal cracks at a load level of 200 kips. Measured strains from the PI gages mounted on the inner face of the beam near the supports shown in Figure 4-15, indicate out of plane bending. While this data is somewhat inconsistent, due to the fact that crack formations tend to be random and unpredictable, there was a clear trend of increasing strain for each load increment. In addition, at failure both the vertically oriented gages registered strains equal to or above 0.002, indicative that the steel in the inner (front) face of the beam yielded at certain locations. Figure 4-14: Mid-Span Strains vs. Applied Vertical Reaction LG 1 63
76 Figure 4-15: End Region Strains vs. Applied Vertical Reaction LG LATERAL REACTIONS: Lateral reactions at each of the four connection points are shown for various loading stages in Figure 4-16 and Appendix B. The four reactions were almost equal up to the last few applied load levels. While the lateral reactions were comparatively lower compared to their theoretical values at any given load level, they were indicative of a substantial amount of torsion that was introduced to LG1 during the test. It should be noted that the nut attached to the channel connecting the bottom right load cell to LG1 was bearing on the support during the final load cycle and thus this one value is questionable. This problem was rectified for the following tests. The average measured lateral reaction at the top of the beam at the factored load and the maximum load of 220 kips were 51 kips and 75 kips respectively. 64
77 Figure 4-16: Lateral Reaction vs. Applied Vertical Reaction LG ECCENTRICITY The inward (towards the deck) rotation of the beam is indicative that the resultant vertical reaction between the load cells shifts towards the inner load cell (closest to the ledge). Thus the eccentricity of the applied ledge loading decreased with each increment in load. The theoretical eccentricity (20 ) was calculated as the distance between the center of the beam web and the applied ledge load. To clarify the concept of shifting eccentricity Equation 4-1 was used to determine the values of eccentricity for each beam during the final loading cycle. The location of the resultant reaction between the two load cells was calculated using equilibrium of forces and the dimensions shown in Figure The calculated value of eccentricity showed that it decreased as the applied load along the ledge increased, as shown in Figure Eccentricity, e= L D - ((R L / (R L + 1))* L D ) + L L + L E Equation 4-1 Where, R L is the ratio of the measured load at the inner and outer load cell in kips, 65
78 L D is the distance between the centers of the two load cells which is 11 inches, L L is the distance between the center of the inner load cell and the inner web face 8.5, L E is the distance between the applied ledge load and the inner web face which is 6 inches. Figure 4-17 : Change in Eccentricity - Compact L-shaped Spandrel Figure 4-18: Eccentricity vs. Applied Vertical Reaction LG 1 66
79 EFFECT OF THE LENGTH OF BEARING PADS As previously mentioned, two different bearing pad sizes were tested for compact L-shaped spandrel LG1. It was observed that while the 16 bearing pad was used, the inner load cell (the one closest to the spandrel inner face) measured more than the outer load cell. This was further indicative of the tendency of the beam to roll inward. The use of the smaller 8 bearing pad for a subsequent test on LG1 showed a significantly different relationship between the inner and outer load cells shown in Figure This indicated that the reaction of the L-shaped spandrel beam being closer to the centroid of the beam. The use of the smaller bearing pad also increased the lateral reactions on the beam. Figure 4-19 : Comparison of Load Cell Reaction with 8 and 16 Bearing Pads LG CRACKING PATTERN As stated earlier, compact L-shaped spandrel LG1 had a maximum end vertical reaction of 220 kips and did not show signs of imminent failure. Diagonal cracking was observed at both ends of the beam along the inner face. This type of cracking with an angle of approximately 45 degrees was indicative of the effects of torsion and plate-bending, resulting from the 67
 face of the beam showed rather evenly spaced vertical cracks (flexural cracks) that were highest towards the center and gradually decreased in height towards quarter span.")
80 moment caused by the loading applied along the ledge. It was also observed that certain diagonal cracks along the inner face crossed over to the top surface along a skewed angle. The back (outer) face of the beam showed rather evenly spaced vertical cracks (flexural cracks) that were highest towards the center and gradually decreased in height towards quarter span. Figure 4-20 through Figure 4-23 describe the crack pattern at the final stage of loading. Figure 4-20: Cracking Pattern of the Inner Face (Digitally Enhanced Cracks) LG 1 68


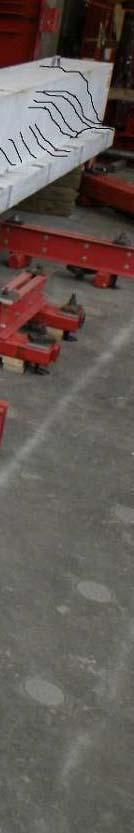
81 Figure 4-21 : Cracking Pattern of the Outer Face (Digitally Enhanced Cracks) - LG1 Figure 4-22 : Inner face Cracking of LG1 69

82 Mid Span Figure 4-23 : Front View at Midspan after Completion of the Test and Removing Double Tees - LG COMPACT L-SHAPED SPANDREL - LG 2 Compact L-shaped spandrel LG2 was designed using welded wire reinforcement along the inner and outer faces of the web. Similar to LG1, additional flexural and ledge reinforcement steel were provided to induce failure within the end regions. LG2 sustained a maximum vertical end-reaction of approximately 220 kips where as the load was increased slightly, the beam failed. The major diagonal crack extending from the right end from both inner and outer surfaces met at the top surface causing the beam to separate along a skewed plane. Measured vertical and lateral deflections were high in magnitude prior to this stage. LG2 was able to sustain its factored design load level of 140 kips for 24-hours with minor flexural cracking at midspan VERTICAL DEFLECTION The load- vertical deflection behavior of LG1 is shown in Figure String potentiometers placed along the outer web face, inner web face and ledge at midspan measured the vertical deflection of the beams as sketched in Figure LG2 reached the same ultimate load to the load at which the test of LG1 was terminated. It can be noted that the deflection of LG2 70
83 was very similar to that of LG1 at any given load level. Vertical deflection at the inner face of the web at the factored load of kips and failure load of 220 kips were 2.8 and 4.9 respectively. Vertical deflections of the inner and outer faces of the web at the end support were also measured by linear potentiometers and are shown in Figure The maximum deflection at the outer face of the web was around 0.4 while it was 0.2 at the factored load level of kips. Similar to LG 1, lifting of the outer face of the beam at the support was observed. Vertical deflections at the inner face at the support were small in comparison. Deflection profiles at various loading stages are given in detail in Appendix C. Figure 4-24: Midspan Vertical Deflection vs. Applied Vertical Reaction LG 2 71
84 Figure 4-25: Support Vertical Deflection vs. Applied Vertical Reaction LG LATERAL DEFLECTION: The lateral deflection response of the top and bottom of LG2 at midspan is shown in Figure Similar to compact spandrel LG1, both lateral deflection measurements indicate outward movement up to a load level of 160 kips at which the beam started to move inward towards the double tees. This behavior further illustrated that the connection effectively held the top of the beam up to this load level. Maximum net lateral deflection at the bottom of the beam was around 0.25 while that at factored service load was around
85 Figure 4-26: Midspan Lateral Deflection vs. Applied Vertical Reaction LG BEAM ROTATION: Inclinometers directly measured the rotation of the beam at midspan, quarter span, and at the supports. Similar to LG1, the net rotations at midspan and quarter span are shown in Figure 4-27 after consideration of the rotations at the support. The measured inclination was indicative of the top of the beam rotating towards (inwards) the double tees. Rotations at quarter span and midspan are slightly more at any given load level for LG2 than for LG1. The net maximum rotation at mid span at factored load and failure load of 220 kips were 0.25 degrees and 0.5 degrees respectively. 73
86 Figure 4-27: Rotation vs. Applied Vertical Reaction LG CONCRETE STRAIN PI gages were used to measured strain from LG2 and strain profiles at midspan and quarter span are shown in Appendix C. Flexural compressive strains on the top of the compact spandrel did not approach the traditional crushing strain of as shown in Figure Similar to LG1, strain measured along the inner web face at beam ends were tensile in nature indicating bending in the out of plane direction and shown in Figure Again, the data is not entirely consistent due to the random nature of crack propagation, but a trend of increasing strains as loads crossed 200 kips are indicative of the formation of diagonal cracks at the ends. Also notable was that the magnitudes of the face strains are slightly less than those seen in LG1. 74
87 Figure 4-28: Midspan Strains vs. Applied Vertical Reaction LG 2 Figure 4-29: End Region Strains vs. Applied Vertical Reaction LG 2 75
88 LATERAL REACTIONS: Similar to LG1, the lateral reactions acting on the beam at each end of LG2 were much lower than what was theoretically expected. The measured reactions correspond were almost equal at the various loading stages as shown in Figure Further detailed behavior is given in Appendix C. It was noted that the left end lateral reactions appeared to lag slightly behind the right end reactions through the entire loading history of the test. The average lateral reaction at the factored load of 140 kips and maximum load of 220 kips at the top was 58 kips and 97 kips respectively. Figure 4-30: Lateral Reaction vs. Applied Vertical Reaction LG ECCENTRICITY: Using Equation 4-1 eccentricity of the applied loads for LG 2 was determined during the final load cycle and shown in Figure As the applied load along the ledge increased, the eccentricity decreased indicative of a shift in the center of reaction between the two load cells measuring vertical reaction at the left end. The magnitude of change in eccentricity was more 76
89 significant in comparison to LG1 although the final location of the resultant reaction was nearly the same. Figure 4-31: Eccentricity vs. Applied Vertical Reaction LG FAILURE MODE AND CRACKING PATTERN: The failure of compact L-shaped spandrel LG2 occurred near the right support when a critical diagonal crack formed along the inner face at approximately 45 degrees. This crack crossed over the top of LG2 along a skew angle at approximately 45 degrees as shown in Figure A similar crack formed on the outer surface but flattened out as it reached the top to meet the diagonal crack along the top surface as shown in Figure The observed diagonal cracking on the inner web face was more in number when compared to that of LG1. Compact spandrel LG2 showed flexural cracking on the back face similar in extent and pattern to that of LG1. LG2 was carefully separated along the skewed failure plane and is shown in Figure The failure surface is a typical skew failure due to applied combined shear and torsion. 77


90 Figure 4-32: Cracking Pattern Inner Face LG 2 Flattened crack reaching top surface 45 degree crack Figure 4-33: Cracking Pattern Outer Face LG 2 78


91 Figure 4-34 : Views of Specimen Separated along Failure Surface - LG2 79
92 4.2.3 COMPACT L-SHAPED SPANDREL - LG 3 Compact L-shaped spandrel LG3 was designed with welded wire reinforcement along the inner and outer face of the web. In addition, U-shaped bars were placed along the top of the web. As with the other compact spandrels, additional flexural and ledge reinforcing steel was provided to induce failure within the end regions. LG3 sustained a maximum vertical end-reaction of approximately 220 kips where as the load was increased slightly, the beam failed. The major diagonal crack extending from the left end (from both inner and outer surfaces) met at the top surface causing the beam to separate along a skewed plane, in a similar manner to that of compact spandrel LG2. The measured vertical and lateral deflections were high in magnitude in comparison to the load cell used. LG3 was able to sustain its factored design load level of 140 kips for 24-hours with very minor flexural cracking at midspan VERTICAL DEFLECTION Similar to the previous two compact spandrels, the measured deflection at midspan at the ledge was largest in comparison with those measured along the web. The string potentiometer measuring vertical deflection at midspan at the web outer face were observed to be lower than that measured at the inner web surface and shown in Figure All three vertical deflections at midspan followed a similar path and had similar slopes as well. Vertical deflection at the inner face of the web at the factored load of kips and failure load was 2.5 and 4.7 respectively. Vertical deflection at the end support was measured using linear potentiometers at the inner and outer faces of the web and shown in Figure The vertical deflection at the outer face of the web at the factored load level and failure load level was 0.2 and 0.4 respectively. The deflected shape of LG3 at various loading stages, along with the behavior throughout the 24-hour loading cycle and recovery are given in detail in Appendix D. The vertical deflection profiles along the span were similar to those shown for the previous two tests. 80
93 Figure 4-35: Midspan Vertical Deflection vs. Applied Vertical Reaction LG3 Figure 4-36: Support Vertical Deflection vs. Applied Vertical Reaction LG3 81
94 LATERAL DEFLECTION: Lateral deflection response at midspan from the top and bottom of LG3 is shown in Figure Lateral deflections from LG3 followed a similar trend to those from LG1 and LG2 where the deck connection effectively held the top of the beam. A difference observed in the test of LG3 was when the loads exceeded 180 kips, the bottom of the beam began to move outwards (away from the double tee). Net lateral deflection at the bottom of the beam at the factored load and failure load was 0.35 and 0.65 respectively. Figure 4-37: Midspan Lateral Deflection vs. Applied Vertical Reaction LG BEAM ROTATION: The net rotation at midspan and quarter span shown in Figure 4-38 is after consideration for rotation at the support. The rotations at mid span and quarter span are fairly close until the factored twenty four hour load level of kips beyond which the rotation at mid span was slightly more than that at quarter span. The rotation data collected at midspan was as expected, with the top of the beam rotating towards the deck and the bottom rotating outwards. When loads exceeded 200 kips and approached failure the observed rotation 82
95 increased significantly. The net maximum rotation at mid span at factored load of 140 kips and failure load of 220 kips was around 0.25 and 0.5 degrees respectively. Figure 4-38: Rotation vs. Applied Vertical Reaction LG CONCRETE STRAIN Measured strain profiles, shown in Appendix D, are indicative of typical flexural behavior at midspan as is also shown in Figure The strains follow a similar pattern as the previous compact spandrel beams except strains at midspan which were higher than those at quarter span. It can be noted that the flexural strains at the top surface of the beam did not reach the traditional concrete crushing strain of Strains measured at the end regions of LG3 as shown in Figure 4-40 follow the same trend as was seen in the test of LG2. It can be observed that the formation of diagonal cracks near the supports began at loads above or equal to 200 kips. 83
96 Figure 4-39: Midspan Strains vs. Applied Vertical Reaction LG3 Figure 4-40: End Region Strains vs. Applied Vertical Reaction LG3 84
97 LATERAL REACTIONS: The lateral support reactions acting on the web of LG3 were almost equal at the various loading stages as shown in Figure Similar to LG2, the magnitudes of the lateral reaction at the left end of the beam tended to lag slightly behind those at the right end. Similar to the previous two compact spandrels, the measured reaction values were still less than the theoretical values. The average lateral reaction at the top of the beam at the factored load level of 140 kips and failure load level of 220 kips were 49 kips and 86 kips respectively. Figure 4-41: Lateral Reactions vs. Applied Vertical Reaction LG ECCENTRICITY: Using Equation 4-1 eccentricity of the applied loads for LG3 was determined during the final load cycle and shown in Figure A similar trend of shifting resultant vertical reaction of the spandrel beam was observed. The change in eccentricity for LG3 was within 0.5 and 85
98 lesser than LG2. However, it can be noted that the final location of the resultant reaction of the spandrel beam with respect to the applied ledge load was similar to that of LG2. Figure 4-42: Eccentricity vs. Applied Vertical Reaction LG FAILURE MODE AND CRACKING PATTERN: The failure mode of LG3 was very similar to that of LG2 and occurred at the left end of the beam. The failure occurred along a skewed diagonal crack that extended the entire depth of the cross-section as shown in Figure The crack propagated from the left end of the ledge near the bottom lateral tie back and extended to the top surface with its location approximately 5 feet from the left end of the member. In addition to this failure crack, extensive diagonal cracking was observed at the end regions as shown in Figure The back face of the compact spandrel showed extensive flexural cracking in the middle two thirds of the span. The critical tensile crack along the outer face began at the bottom support and extended along a 45 degree angle and flattened out considerably upon reaching the top 86


99 surface show in Figure The skewed plane of the failure can be clearly seen in Figure 4-46 with an additional close-up view of the failure in Figure Figure 4-43: Cracking Pattern with Digitally Enhanced Cracks along Inner Face LG 3 Figure 4-44 : Front View of LG3 after Failure with Digitally Enhanced Cracks 87


100 Flattened crack reaching top surface 45 degree crack Figure 4-45: Cracking Pattern with Digitally Enhanced Cracks along Outer Face LG 3 Diagonal Failure Crack along Top Surface Figure 4-46 : Top Surface after Failure - LG3 88
101 Figure 4-47 : Close up View of Failure along Inner Face - LG COMPACT L-SHAPED SPANDREL - LG 4 Compact L-shaped spandrel LG4 was designedd with welded wire reinforcement along the outer face of the web and a C-bar along the inner face with its shorter legs extended over the top and bottom web surfaces. Similar to the previous compact spandrels, additional flexurall and ledge reinforcing steel was provided to induce failure within the end regions. LG4 sustained a maximum vertical end-reaction of approximately 220 kips where upon increase in load failure occurred. The major diagonal crack extending from the right end (from both inner and outer surfaces) met at the top surface causing the beam to separatee along a well defined shear plane. Significant vertical and lateral deflections were observed prior to this stage. LG4 was able to sustain its factored design load level of 140 kips for 24- hours and an applied load equivalent to a nominal resistance of 156 kips for a further 24- hours with some flexural cracking at midspan. 89
102 VERTICAL DEFLECTION The load - vertical deflection response of LG4 was very similar to that of LG3 up to a load level of 200 kips as shown in Figure However, LG4 exhibited significantly higher vertical deflections than LG3 at load levels that exceeded 200 kips. Significant deflection was observed towards the end of the final loading cycle where the beam was unable to hold the applied loading for a considerable length of time. The deflection profiles for LG4, given in Appendix E, were also very similar to those for the previous beams through the 24 hour loading cycle and 1 hour recovery. Vertical deflection at the inner face of the web at the factored load of kips and failure load of 220 kips was 2.6 and 4.7 respectively. Vertical deflection was measured at the inner and outer faces of the web at the end support and shown in Figure The vertical deflection at the support along the outer face of the web at the factored load level and failure load level was 0.21 and 0.75 respectively. Figure 4-48: Midspan Vertical Deflection vs. Applied Vertical Reaction LG 4 90
103 Figure 4-49: Support Vertical Deflection vs. Applied Vertical Reaction LG Lateral Deflection: The lateral deflection measured for LG4 at midspan shown in Figure 4-50 were comparable to that of LG3 up to loads of 200 kips. It should be noted that LG4 rolled inward toward the double tees considerably more than the other compact L-shaped spandrels when the loads exceeded 200 kips. It can be observed that the top lateral deflection increased considerably towards the end of the final loading cycle when the spandrel beam was unable to hold the applied loading. The net lateral deflection at the bottom of the beam at factored load of 140 kips and failure load of 220 kips was 0.35 and 0.65 respectively. 91
104 Figure 4-50: Midspan Lateral Deflection vs. Applied Vertical Reaction LG BEAM ROTATION: The rotation data measured at midspan and quarter span are shown in Figure 4-51 and take into consideration rotation at the support. Similar to the patterns observed in deflections, the net rotation increased considerably as load levels exceeded 200 kips. The net maximum rotation at mid span at factored load and failure load was 0.75 degrees and 2.75 degrees respectively. 92
105 Figure 4-51: Rotation vs. Applied Vertical Reaction LG CONCRETE STRAIN Flexural strain profiles at midspan and quarter span are given in Appendix E. The midspan profile showed the expected flexural behavior, and indicated that the measured compressive strain on the top surface was slightly over when failure occurred. The strain profile from the left quarter span was plotted and similar to LG3, depicted strain values below the corresponding strains at midspan. Measured strains along the inner face at the end regions of LG4 as shown in Figure 4-53 showed similar trends as seen in the data from LG3. However, the magnitudes of the strains observed for LG4 were appreciably higher than those for LG3 for loads exceeding 200 kips. The strain readings indicate that the steel in the front face of LG4 could have yielded at certain locations on the inner web face at failure. It was interesting to observe that the strain values recorded on the right end of LG4 were noticeably higher than those recorded on the left end towards the end of the loading range. Failure occurred on the right end. 93
106 Figure 4-52: Midspan Strains vs. Applied Vertical Reaction LG 4 Figure 4-53: End Region Strains vs. Applied Vertical Reaction LG 4 94
107 LATERAL REACTIONS: The lateral reactions measured at the beam ends for LG4 were almost equal during each loading cycle and remained below theoretical values. For LG4, magnitudes of lateral reactions at the right end of the spandrel tended to lag slightly behind those at the left end as shown in Figure The average top lateral reaction at the factored load and failure load was 49 kips and 86 kips respectively. Figure 4-54: Lateral Reactions vs. Applied Vertical Reaction LG ECCENTRICITY: Using Equation 4-1 eccentricity of the applied loading for LG4 was determined during the final load cycle and shown in Figure Similar to the previous three compact spandrels, the resultant vertical reaction showed a shift towards the centroidal axis of the compact spandrel. The change in eccentricity for LG4 was approximately 2, however the final location of the resultant reaction was similar to the previous spandrels. 95
108 Figure 4-55: Eccentricity vs. Applied Vertical Reaction LG FAILURE MODE AND CRACKING PATTERN: The failure mode of LG4 can be categorized as a shear failure which was somewhat different to the failure modes of the previous two compact L-shaped spandrels. It was observed that LG2 and LG3 failed in a combined torsion-shear failure along a skewed diagonal crack plane. Similar diagonal cracks were observed on compact spandrel LG4 starting near the bottom lateral support and extended upward towards the top surface at approximately 45 degrees. These cracks began to flatten out at points on the span away from the supports. Towards the final loading cycles, these diagonal cracks began to extend over the top of the web surface. While the cracks in the end region crossed over the top of the beam at a skewed angle of 45-degrees, the final failure plane did not follow this skewed path. At failure, the critical diagonal crack from the inner and outer surface met the top surface at approximately 5 feet from the right end where the failure along the top surface was along a plane perpendicular to the inner and outer web faces. This distinct shear failure plane can be observed in Figure 4-59 below. Close up views of this crack is provided in Figure

109 In addition to the diagonal cracking described above, flexural cracks were also observed along the inner face of LG4, and primarily on the middle two thirds of the outer face. These crack patterns were very consistent with the patterns observed in the tests of LG1, LG2 and LG3. Figure 4-56: Cracking Pattern Inner Face with Digitally Enhanced Cracks LG 4 97


")
")


110 Figure 4-57: Failure Plane Before (Left) and After (Right) Careful Demolition LG4 Figure 4-58 : Right Side View of Inner Web Face after Failure - LG4 98


111 Figure 4-59 : Right Side Inner Face showing Shear Failure Plane Before (Left) and After (right) Careful Demolition - LG SLENDER L-SHAPED SPANDREL SP20 Slender L-shaped spandrel SP20 was designed with welded wire reinforcement along the face of the outer web and L-shaped bars along the inner face of the web with the shorter leg extending along the bottom web surface. Additional flexural reinforcement was provided at midspan to induce shear failure within the end regions. SP20 sustained a maximum vertical end-reaction of 170 kips and the failure was sudden due to the formation of the major diagonal crack extending from the right end (from both inner and outer surfaces) to the top surface causing the beam to separate along a skewed plane on the top surface. Significant vertical and lateral deflections were observed prior to failure. SP20 was able to sustain the design factored load level of kips for 24-hours with some flexural cracking at midspan VERTICAL DEFLECTION The load - vertical deflection response of slender spandrel SP20 was similar in nature to that of the compact spandrels as shown in Figure The deflection profiles for SP20, given in Appendix F, were also very similar to those of the compact spandrel beams through the 24 99
112 hour loading cycle and 1 hour recovery. Vertical deflections at the inner face of the web at the factored load of kips and failure load of 170 kips were 2.1 and 3.4 respectively. Vertical deflection was measured at the end supports along the inner and outer faces of the web as shown in Figure The deflection at the outer face of the web at the factored load and the failure load was 0.05 and 0.2 respectively. Figure 4-60 : Vertical Deflection vs. Applied Vertical Reaction at Midspan- SP20 100
113 Figure 4-61 : Vertical Deflection vs. Applied Vertical Reaction at Support - SP LATERAL DEFLECTION The load - lateral deflection response for SP20, shown in Figure 4-62 followed a similar trend to that of the compact spandrels. Lateral displacements were measured at both top and bottom of the beam at midspan as sketched in Figure 4-62, which represents the net lateral deflection after consideration of the measured deflections of the supports. Measured deflections indicating outward movement is considered positive as shown in Figure Both lateral deflections indicate outward movement up to a load level of 180 kips at which the beam started to move inward towards the double-tees. The behavior indicates that the connection with the double tees at the top of the beam effectively held the beam from rolling inwards up to the factored load level of kips. Beyond this load, the deck connection was ineffective in restricting the inward rolling movement due to yielding and/or buckling of the connected welded steel plate. 101
114 As expected the lateral deflection at the top of the beam was lesser than the bottom deflection due to the presence of the welded connections. The net lateral deflection at the bottom of the beam at factored load of 126 kips and failure load of 170 kips was 1.2 and 1.7 respectively. Figure 4-62 : Lateral Deflection vs. Applied Vertical Reaction at Midspan - SP BEAM ROTATION: Inclinometers were used to measure the rotation of the beam at midspan, quarter span, and at the supports. Figure 4-63 represents the net rotation at midspan and quarter span after consideration of the measured rotations at the support. The sign convention used for analyzing this net rotation considered the top of the beam rotating inward (towards the deck) and the bottom of the beam rotating outward to be positive. With increase in each load level, the measured inclination indicated that the top of the beam rotated towards the double tees and the bottom of the beam rotated away from the double tees. The rotation at mid span was slightly higher than that at quarter span throughout the test. The net maximum rotation at mid span at the factored load and failure load was 1 degrees and 2 degrees respectively. 102
115 Figure 4-63 : Measured Rotation vs. Applied Vertical Reaction at Midspan and Quarter Span - SP CONCRETE STRAIN A combination of PI gages and strain gages were used to measure the strain in concrete at various locations. Flexural strain profiles measured by PI gages at midspan and quarter span are provided in Appendix F. The midspan strain profile showed the expected flexural behavior, and indicated that the measured compressive strain on the top surface was slightly over when failure occurred as shown in Appendix F. The strain profile from the left quarter span indicated strain values below the corresponding strains at midspan. Measured strains within the end regions along the inner face of SP20 shown in Figure 4-64, clearly indicated the out of plane bending of the slender spandrel. The magnitude of strain increased considerably past the factored load capacity of 126 kips indicating that the steel in the front face of SP20 is yielded on the inner web face. It was interesting to observe that the strain values recorded on the right end of SP20 were noticeably higher than those recorded on the left end towards the end of the loading range. Failure occurred on the right end. 103
116 Figure 4-64 : End Region Face Strain vs. Applied Vertical Reaction - SP20 Measured strain from the two strain gages sketched in Figure 4-65 that were placed on the outer and top faces at a distance of h (height of the web, 46 ) from the left end support are shown in Figure The location of the strain gage on the top surface was selected to determine the strain across the diagonal 45 degree crack crossing over from the inner web face onto the top surface. The measured strain on the outer face was compressive in nature and indicated larger torsional stresses in comparison to shear stresses. 104
117 Outer Face Strain Gage (Typical Symbol) Figure 4-65 : Strain from Strain Gages vs. Applied Vertical Reaction - SP LATERAL REACTIONS: Lateral reactions at each of the four lateral connection points are shown in Figure The four reactions were almost equal up to the applied factored load which was sustained for 24 hours, beyond which the bottom lateral reactions were noticeably higher. While the lateral reactions were comparatively lower compared to their theoretical values at any given load level, they were indicative of a substantial amount of torsion that was introduced to SP20 during the test. The average lateral reaction at the factored load level of 126 kips and failure load level of 170 kips was 24 kips and 25 kips respectively. 105
118 Figure 4-66 : Lateral Reaction vs. Applied Vertical Reaction - SP FAILURE MODE AND CRACKING PATTERN: Failure of slender L-shaped spandrel SP20 occurred near the start of the ledge closer to the right bottom support, when the critical diagonal crack formed along the inner face at approximately 45 degrees. This crack crossed over the top of SP20 along a skew shown in Figure 4-67 and Figure A similar crack that formed on the outer surface met the diagonal crack along the top surface as shown in Figure Several diagonal cracks were observed along the inner web face near the supports. Slender spandrel SP20 showed flexural cracking on the outer face similar in extent and pattern to that of the compact spandrels. SP20 was carefully separated after failure along the skewed failure plane. Figure 4-70 and Figure 4-71 illustrates the crack pattern after failure. 106
 - SP20")

119 Figure 4-67 : Inner Face Cracking (Digitally Enhanced Cracks) - SP20 Figure 4-68 : Inner and Top Surfaces (Digitally Enhanced Cracks) - SP20 107


120 MIDSPAN Figure 4-69 : Outer Face Cracking Looking Left (Digitally Enhanced Cracks) -SP20 Figure 4-70 : Failure Plane Before Careful Separation - SP20 108

121 Figure 4-71 : Failure Plane after Careful Separation - SP SLENDER L-SHAPED SPANDREL - SP21 Slender L-shaped spandrel SP21 was designed similar to SP20 with welded wire reinforcement along the outer web face and L-shaped bars along the inner web face with the shorter leg extending along the bottom web surface. However, no additional flexural reinforcement was provided along the web, therefore, it present a typical beam designed with open web reinforcements. SP21 was loaded to the dead load of the structure (60 kips) without any connection between the web of the spandrel and the top of the deck, to examine the effects of the deck connection. The beam was unloaded and the connection was then welded between the top of the deck and the inner face of the spandrel as shown in Chapter 3. The slender spandrel SP21 was then loaded until failure in similar load intervals as slender spandrel SP20. SP21 sustained a maximum vertical end-reaction of kips where upon increase in load failure occurred due to crushing of the concrete at the extreme fiber section at midspan. At this stag minor diagonal cracks were observed at the end zone. Significant vertical and lateral deflections were also observed prior to this stage. SP21 was unable to sustain its factored design load level of kips for 24-hours. 109
122 VERTICAL DEFLECTION The load - vertical deflection response of slender spandrel SP21, shown in Figure 4-72 indicated significant vertical deflection as loads approached the factored load level of kips. The deflection profile for SP21, given in Appendix G, illustrated the considerable vertical deflection at the factored load level. The maximum vertical deflection at midspan at the inner face of the web was 3.4 at failure. Figure 4-72 : Vertical Deflection vs. Applied Vertical Reaction at Midspan - SP21 Vertical deflection measured at the end supports along the inner and outer faces of the web were considerably smaller in comparison to that at midspan. The maximum deflection at the outer face of the web was The results indicate the deck connection did not have an effect on the vertical deflection of SP
123 LATERAL DEFLECTION The load - lateral deflection response at midspan for SP21 shown was comparable to that of the slender spandrel SP20 until the factored load level of kips. Lateral deflections from the top and bottom of the spandrel showed outward movement indicating that the spandrel moved away from the double tees throughout the final loading cycle. The behavior also indicated that the connection with the double tees at the top of the beam effectively held the beam from rolling inwards until failure was reached. Figure 4-73 illustrates the effect of the deck connection more clearly where it was observed that the top of the spandrel moved towards the double tee when there was no connection. However, when the deck was welded to the inner face of the spandrel, the spandrel SP21 was effectively held from moving towards the double tees. The maximum net lateral deflection at the bottom of the beam was around 1.28 at failure. Figure 4-73 : Lateral Deflection at Midspan with varying Deck Connections - SP21 111
124 BEAM ROTATION: Inclinometers were used to measure the rotation of the beam at midspan, quarter span, and at the supports. Figure 4-74 represents the net rotation at midspan and quarter span after consideration of the measured rotations at the support. With increase in each load level, the measured inclination indicated that the bottom of the beam rotated away from the double tees. The rotation at mid span was slightly higher than that at quarter span throughout the test. While the deck connection created significant differences in the lateral deflection at midspan, it had no effect on the net rotation of the spandrel as shown in Figure It was noted that the difference in the top lateral deflection with and without the deck connection was comparable to the corresponding difference in the bottom lateral deflection, creating no net change in the rotation of the spandrel SP21. Figure 4-74 : Measured Rotation vs. Applied Vertical Reaction at Midspan and Quarter Span - SP21 112
125 Figure 4-75 : Measured Rotation with varying Deck Connection - SP CONCRETE STRAIN SP21 utilized a combination of PI gages and strain gages to measure the strain in concrete at various locations. Flexural strain profiles measured by PI gages at midspan and quarter span are given in Appendix G. The measured midspan strain shown in Figure 4-76 illustrated the flexural failure of the slender spandrel with the measured compressive strain on the top surface exceeded the traditional crushing strain of concrete of when failure occurred. The strain profile from the left quarter span depicted strain values much below the corresponding strains at midspan. Measured strains along the inner face near the supports of SP20 were considerably smaller than those at midspan. However, the tensile nature of these strains indicated that there was out of plane bending near the supports. 113
126 Figure 4-76 : Load- Strain at Midspan - SP21 Measured strain from the two strain gages that were placed on the outer and top faces at a distance of 1.5h (one and half times the height of the web, 69 ) from the left end support are shown in Figure The location of the strain gage on the top surface was selected to determine the strain across the diagonal 45 degree crack crossing over from the inner web face onto the top surface. The measured strains indicate compression along the top surface but of smaller magnitude in comparison to that at midspan. 114
127 Outer Face Strain Gage (Typical Symbol) Figure 4-77 : Load - Strain Gages - SP LATERAL REACTIONS: Lateral reactions at each of the four connection points are shown for various loading stages in Figure The lateral reactions were almost equal to each other except for the top right lateral reaction which was slightly higher through the various load levels. The average top lateral reaction at the failure load of 126 kips was 25.5 kips. 115
128 Figure 4-78 : Load - Lateral Reaction at Supports - SP FAILURE MODE AND CRACKING PATTERN: Failure of slender L-shaped spandrel SP21 was flexural in nature and occurred near midspan as shown in Figure 4-79 and Figure As the loads approached the factored 24-hour load level of kips significant vertical deflection and compressive strain along the top surface was observed at midspan. Within a few minutes of holding the factored load, failure occurred 5 feet left of midspan with a vertical crack across the inner and outer faces. Diagonal cracks were also observed along the inner web face near the supports. Slender spandrel SP21 showed extensive flexural cracking on the back face as shown in Figure


129 MIDSPAN Figure 4-79 : Inner Face Cracking and Failure Location (Digitally Enhanced Cracks) - SP21 Figure 4-80 : Inner Face Cracking - SP21 117
 - SP21 Figure")
 -")
130 Figure 4-81 : Inner Face Failure Location (Digitally Enhanced Cracks) - SP21 Figure 4-82 : Outer Face Cracking near Failure Location (Digitally Enhanced Cracks) - SP21 118
131 4.3 SUMMARY OF EXPERIMENTAL RESULTS: COMPACT L-SHAPED SPANDRELS This section summarizes the results of four full-size, precast, prestressed, compact L-shaped spandrels, commonly used in parking structures, to assess their behavior and failure modes. The main objective of the test program was to determine the effectiveness of using various combinations of open conventional reinforcement and/or welded wire reinforcement as shear-torsion reinforcement in lieu of conventional closed stirrups. Compact spandrel LG1, which served as a control specimen for the testing program, displayed crack patterns and overall behavior very similar to the compact spandrels LG2, LG3 and LG4 designed with open reinforcement. The failure modes of the compact spandrels with open reinforcement were indicative of skew-bending effects; the crack patterns indicated that the specimens were bent about their top lateral reactions causing tension in the inner face concrete and compression in the outer face concrete along an approximate 45 degree failure plane. A summary of experimental results compares certain parameters amongst the four compact L-shaped spandrels as given in Table
132 Test Compact Spandrel Reaction (kips) Table 4.6 : Test Results at Failure Compact Spandrels Vertical Deflection (in.) Bottom Lateral Deflection * (in.) Top Lateral Deflection * (in.) LG LG Description of Failure Mode Compact spandrel did not fail and test was stopped at the maximum capacity of the loading system was reached. Spandrel showed diagonal cracking on the inner face and flexural cracking on the outer face. Compact spandrel failed along a skewed-diagonal crack near the right support. Extensive diagonal cracking observed on the inner face and moderate flexural cracking on the outer face. LG LG * Max lateral deflection not necessarily at ultimate reaction. Compact spandrel failure along a skewed-diagonal crack on the right side. Spandrel showed extensive diagonal cracking on the inner face and moderate flexural cracking on the outer face. Compact spandrel failure along a well defined shear plane near the right support. Spandrel showed extensive diagonal cracking on the inner face and moderate flexural cracking on the outer face VERTICAL DEFLECTIONS The measured vertical deflections at midspan of the inner web face versus the main vertical reaction for all of the tested four compact L-shaped spandrels is shown in Figure
133 Figure 4-83 : Vertical Deflection vs. Applied Vertical Reaction at Midspan Compact Spandrels The loading cycles at the beginning of the graph reflect the behavior under the effect of service load plus snow load, unloaded, reloaded to factored load and maintained for 24 hours, unloaded, and then loaded until failure. The areas where the graph tends to flatten under constant load correspond to load levels where the load was held on the beam to allow for observation and the marking of cracks. The most pronounced flattening, occurred at the factored design load level, and corresponds to the 24-hour period over which the full factored load was maintained on the beam. It can be observed that the compact spandrel behavior was nearly linear up to an applied load equal to the factored design service load LATERAL DEFLECTIONS Compact L-shaped spandrel LG1 which served as a control specimen with closed reinforcement was used to compare lateral deflections at midspan of each of the tested compact spandrels designed with open reinforcement in Figure 4-84 through Figure
134 Figure 4-84 : Lateral Deflections at Midspan (final loading cycle) - LG1 vs. LG2 Figure 4-85 : Lateral Deflections at Midspan (final loading cycle) - LG1 vs. LG3 122
135 Figure 4-86 : Lateral Deflections at Midspan (final loading cycle) - LG1 vs. LG4 Top and bottom lateral reactions of LG1 and LG2 matched each other through the entire load cycle as shown in Figure However the bottom lateral deflections in LG3 and LG4 tended to move outwards as loads crossed full factored load level (140.6 kips) unlike the control specimen LG1 which moved inwards. It was also observed that the deck connection holding the double tees and the top of the compact spandrel began to buckle at loads that exceeded 160 kips which then allowed the beam to roll inwards. The buckling of the deck connection was significant in LG4 as applied loads exceeded 200 kips as shown in Figure


136 Figure 4-87 : Deck Connection Buckling - LG ROTATION As the applied load along the ledge increased, the bottom of the beam rotated outwards while the top of the beam rotated inwards after being held in position initially by the deck connection. Resistance to overturning was provided by the lateral column reactions, creating a warped deflected shape and significant out-of-plane bending deformation along the diagonal cracks in the end regions. Rotations of the four specimens during the final loading cycle, measured at midspan, are shown in Figure It was observed that the rotation of LG1, LG2 and LG3 were very similar throughout the final loading cycle while LG4 showed significant rotation at each corresponding load stage. 124
137 Figure 4-88: Compact L-shaped Spandrel Rotation at Midspan LATERAL REACTIONS The measured top and bottom lateral reactions are presented in Table 4.7 at full factored design load level and prior to failure in Table 4.8. At the beginning of each test, the four load cells were used to measure the lateral reactions were calibrated for an initial reading of 2 kips. The values were fairly close for each specimen indicating similar behavior at a given loading stage. Test Table 4.7 : Lateral Reactions at Factored Design Load Compact Spandrels Vertical Reaction (kips) Top Right (kips) Top Left (kips) Bottom Right (kips) Bottom Left (kips) LG LG LG LG AVERAGE * all units in kips, data taken after 24 hour load hold 125
138 Table 4.8 : Maximum Lateral Reactions Prior to Failure Compact Spandrels Test Vertical Top Right Top Left Bottom Bottom Reaction (kips) (kips) (kips) Right (kips) Left (kips) LG LG LG LG RECOVERY CRITERIA Loading the four specimens to their respective failure loads did not induce any spalling or concrete crushing. After the specimens held the full factored design load (Vu=140.6 kips) for 24 hours, they were unloaded and allowed to recover for an hour to measure the permanent deformation. The following equations were used to check to see if the specimens met the ACI-318 load test recovery criteria. Δ max = Δ measured (after 24 hour hold) Δ measured (before 24 hour hold) Equation 4-2 Δ residual = Δ (after 1 hour recovery) - Δ measured (before 24 hour hold) Equation 4-3 Δ max. allowed = 0.25 * Δ max Equation 4-4 PASS= Δ max. allowed Δ residual Equation 4-5 Test results indicated that all four compact spandrels satisfied the recovery criteria for deflection, according to ACI , during and after the 24 hour load test, are given in the tables below. All units are given in inches. The net residual deflection for the control specimen LG1 designed with closed reinforcement was lesser when compared to the other three specimens designed with open reinforcement in Table 4.9. The net residual deflections amongst the compact spandrels designed with open reinforcement were very similar as seen in Table 4.10, Table 4.11 and Table
139 Table 4.9 : ACI Recovery Criteria for LG1 Measured Midspan (inches) Recovery Stage Vertical Lateral Front Back Bottom Initial Deflection Before 24-hour Loading Maximum Measured Deflection - After 24-hours Loading Measured Deflection Immediately After Unloading Measured Deflection After 1 Hour Recovery Maximum Net Deflection: Δ max Residual Net Deflection After 1 Hour: Δr max Maximum Allowed Net Deflection: Δ max ACI Recovery Criterion (Δ r max 0.25Δ max )? PASS PASS PASS Table 4.10: ACI recovery Criteria for LG2 Measured Midspan (inches) Recovery Stage Vertical Lateral Front Back Bottom Initial Deflection Before 24-hour Loading Maximum Measured Deflection - After 24-hours Loading Measured Deflection Immediately After Unloading Measured Deflection After 1 Hour Recovery Maximum Net Deflection: Δ max Residual Net Deflection After 1 Hour: Δr max Maximum Allowed Net Deflection: 0.25Δ max ACI Recovery Criterion (Δ r max 0.25Δ max )? PASS PASS PASS Table 4.11 ACI Recovery Criteria for LG3 Measured Midspan (inches) Recovery Stage Vertical Lateral Front Back Bottom Initial Deflection Before 24-hour Loading Maximum Measured Deflection - After 24-hours Loading Measured Deflection Immediately After Unloading Measured Deflection After 1 Hour Recovery Maximum Net Deflection: Δ max Residual Net Deflection After 1 Hour: Δr max Maximum Allowed Net Deflection: 0.25Δ max ACI Recovery Criterion (Δ r max 0.25Δ max )? PASS PASS PASS \ 127
140 Table 4.12 : ACI Recovery Criteria for LG4 Measured Midspan (inches) Recovery Stage Vertical Lateral Front Back Bottom Initial Deflection Before 24-hour Loading Maximum Measured Deflection - After 24-hours Loading Measured Deflection Immediately After Unloading Measured Deflection After 1 Hour Recovery Maximum Net Deflection: Δ max Residual Net Deflection After 1 Hour: Δr max Maximum Allowed Net Deflection: 0.25Δ max ACI Recovery Criterion (Δ r max 0.25Δ max )? PASS PASS PASS CRACK PROPAGATION The cracking pattern across the inner and outer faces amongst all four specimens was very similar. The inner face displayed three distinct cracking regions: diagonal tension cracks that extended from near the bottom lateral reaction at the specimen ends, flexure cracks that extended into flexure-shear cracking near quarter spans and followed by pure flexural cracks into the middle zone of the beams as shown in Figure The outer face was characterized primarily by flexural cracking at mid span. The measured vertical reaction, in kips, corresponding to the observation of significant crack propagation for each specimen is given in Table Table 4.13 : Significant Crack Propagation Stages Web Face Significant Crack Propagation LG 1 LG 2 LG 3 LG 4 Flexural cracks along ledge at mid span Inner Face Diagonal cracks along web face at supports Diagonal cracks crossing top face Flexural cracks reaching mid-height Outer face at mid span Tensile cracks indicating formation of N/A** compression zone * all units in kips, data collected at various load stages. ** LG 1 was not loaded until failure. 128

141 Flexure Region Transition Region Disturbed Region Figure 4-89 : Typical Cracking Pattern along Inner Face Flexural cracking at midspan along the outer face began at around the dead load level of 73 kips although they were minor. These flexural cracks reached mid height along the outer face when the load approached 120 kips. This was also the load at which the first cracks along the ledge were observed at midspan. The flexural cracks at midspan then started to propagate towards quarter span and remained flexural in nature. There were additional flexural cracks along the outer face at the end of the twenty four load level of kips while cracks from the ledge crossed over onto the inner web face. The first diagonal cracks at approximately 45 degrees along the inner face near the supports were noticed as loads levels approached 200 kips for LG 1 and 180 kips for the other compact spandrels. The loading cycle that followed showed an increase in the number of diagonal cracks that formed along the inner face at the support and propagated onto the top face along a skewed plane as shown in Figure

142 Figure 4-90 : Typical Cracking along Top Surface The final loading cycle showed the formation of a critical diagonal crack along the inner face crossing over to the top surface along with the widening of other cracks along the inner face. At failure, the critical diagonal crack along the outer face propagated from the bottom lateral tie back at approximately a 45 degree angle and flattened out as it reached the top surface to meet the diagonal crack from the top face. In general, the outer web face exhibited vertical cracking that extended upward from the bottom of the beam due to bending in-plane. Substantial diagonal cracking was not observed on the outer face since the shear stresses are cancelled by the torsion stresses SLENDER L-SHAPED SPANDRELS This section summarizes the test results of two full-size, precast, prestressed, slender L- shaped spandrels, also used in parking structures, to assess their behavior and failure modes. The main objective of the test program was to determine the effectiveness of using open 130
143 conventional reinforcement and welded wire reinforcement as shear-torsion reinforcement in lieu of conventional closed stirrups. Slender spandrel SP20 which was designed with an open reinforcement scheme displayed similar crack patterns and overall behavior to the compact spandrels. The failure modes was indicative of skew-bending effects with crack patterns that indicated that the slender spandrel was bent about its top lateral reactions causing tension in the inner face concrete and compression in the outer face concrete along an approximate 45 degree failure plane. However, slender spandrel SP21 which had an identical open reinforcement scheme without the additional flexural steel displayed a flexural failure. A summary of experimental results compares certain parameters amongst the two slender L-shaped spandrels in Table Test Compact Spandrel Reaction (kips) Table 4.14 : Test Results at Failure - Slender Spandrels Vertical Deflection (in.) Bottom Lateral Deflection (in.) Top Lateral Deflection * (in.) SP SP * Max lateral deflection not necessarily at ultimate reaction. Description of Failure Mode Slender spandrel failed along a skewed-diagonal crack near the right support. Extensive diagonal cracking observed on the inner face and moderate flexural cracking on the outer face Slender spandrel failed in flexure near midspan. Diagonal cracking was observed near end supports and extensive flexural cracking on the outer face VERTICAL DEFLECTIONS The measured vertical deflection at midspan of the inner web face versus the main vertical reaction of both of the slender spandrels is shown in Figure
144 Figure 4-91 : Vertical Deflection vs. Applied Vertical Reaction at Midspan - Slender Spandrels The additional flexural reinforcement in slender spandrel SP20 indicated a more stiff and linear trend in vertical deflection for service load conditions. This additional reinforcement also prevented a flexural failure as observed in slender spandrel SP21. Significant vertical deflection at the factored 24-hour load level was observed in SP LATERAL DEFLECTIONS Lateral deflections measured at midspan indicated that slender L-shaped spandrel SP20 showed slightly larger lateral deflections than SP21 as shown in Figure The deck connection effectively held the top of both slender spandrels until the factored load level of 126 kips. 132
145 Figure 4-92 : Load- Lateral Deflection at Midspan Slender Spandrels CONCRETE STRAIN Concrete strain along the outer face of the slender spandrels SP20 and SP21 at distances h and 1.5h respectively from the left support, was measured directly by strain gages sketched and shown in Figure In SP20 it was observed that the strain measured was compressive in nature on the outer face which indicated larger torsional stresses in comparison to shear stresses. However, in SP21 the flexural strain at midspan was significant with the compressive strains along the top surface exceeding the traditional concrete crushing strain of
146 Outer Face Strain Gage (Typical Symbol) Figure 4-93 : Outer Face Strains - Slender Spandrels LATERAL REACTIONS The measured top and bottom lateral reactions at the factored load level of 126 kips are presented in Table 4.15 and prior to failure in Table At the beginning of each test, the four load cells used to measure the lateral reactions were calibrated for an initial reading of 2 kips. The values were fairly close for each slender spandrel indicating similar behavior at a given loading stage. Test Table 4.15 : Lateral Reactions at Factored Load - Slender Spandrels Vertical Reaction (kips) Top Right (kips) Top Left (kips) Bottom Right (kips) Bottom Left (kips) SP SP
147 Table 4.16 : Lateral Reactions prior to Failure - Slender Spandrels Test Vertical Reaction Top Right Top Left Bottom Bottom (kips) (kips) (kips) Right (kips) Left (kips) SP SP RECOVERY CRITERIA Slender spandrel SP 20 did not display any spalling or concrete crushing at failure. However, SP21 failed in a flexural manner with crushing of concrete along the top surface at midspan. SP20 held the full factored design load (Vu=126.4 kips) for 24 hours, and was unloaded and allowed to recover for an hour to measure the permanent deformation. Equations 4-2 through 4-5 were used to check the ACI-318 load test recovery criteria. Test results indicated that slender spandrel SP20 satisfied the recovery criteria for deflection, according to ACI , during and after the 24 hour load test, and given in Table Table 4.17 : ACI Recovery Criteria for SP20 Measured Midspan (inches) Recovery Stage Vertical Lateral Front Back Bottom Initial Deflection Before 24-hour Loading Maximum Measured Deflection - After 24-hours Loading Measured Deflection Immediately After Unloading Measured Deflection After 1 Hour Recovery Maximum Net Deflection: Δ max Residual Net Deflection After 1 Hour: Δr max Maximum Allowed Net Deflection: Δ max ACI Recovery Criterion (Δ r max 0.25Δ max )? PASS PASS PASS CRACK PROPAGATION The cracking pattern across the inner and outer faces amongst the two slender spandrels was similar although the modes of failure were different. Similar to the compact spandrels, the inner face displayed three distinct cracking regions: diagonal tension cracks that extended from near the bottom lateral reaction at the specimen ends, flexure cracks that extended into flexure-shear cracking near quarter spans and followed by pure flexural cracks into the middle zone of the beams as shown in Figure The outer face was characterized primarily by flexural cracking at mid span. The measured vertical reaction, in kips, 135

148 corresponding to the observation of significant crack propagation for each specimen is given in Table Table 4.18 : Significant Crack Propagation Stages Web Face Significant Crack Propagation SP20 SP21 Inner Face Flexural cracks along ledge at mid span Diagonal cracks along web face at supports Diagonal cracks crossing top face Outer face Flexural cracks reaching mid-height at mid span * All units in kips, data collected at various load stages. Figure 4-94 : Cracking Pattern along Inner Face - Slender Spandrels 136
149 5 ANALYSIS This chapter presents the analytical phase of the research program that is used to describe the behavior of six full scale spandrel beams tested in the experimental program described in Chapter 4. This analysis validates a design approach that quantifies the required shear and torsion reinforcements in precast L-shaped spandrel beams. Data from the experimental program described in Chapters 4 was used to validate, refine, and calibrate the proposed design approach. The proposed rational approach is simple and can be easily adopted by practitioners to design safe and economical precast L-shaped spandrel beams. 5.1 PROPOSED RATIONAL DESIGN APPROACH The proposed rational design approach is based on equilibrium of forces along the diagonal skewed failure plane observed in the experimental program for all tested beams. The spandrel beam is assumed to be supported at each end by two horizontal reactions and is simply supported for the gravity load. The two horizontal reactions are spaced at a distance greater than 80 percent of the depth of the spandrel beam. The following design principles are based on the results of experimental studies of full-size spandrel beams as well as analytical modeling. The observed behavior of these spandrel beams indicate that the effects of shear and torsion dominate in the end region, followed by a transition region where the effects of shear and torsion are gradually reduced with increasing effect of flexure. Beyond the transition region, the flexural effect dominates in the mid-span region of the beam. For design purposes, the three regions are shown in Figure 5-1. End Region: The end region begins at the edge of the supporting plate of the beam and extends along the span for a distance h beyond the face of the support. Based on previous studies of full-sized spandrels, the angle of the critical diagonal crack likely to develop in this region was found to be 45-degrees. The behavior clearly indicated that plate bending, vertical shear, and lateral shear dominate the behavior of the end-region, as shear and torsion demands are highest in this region. Transition Region: The transition region extends for a distance 2h beyond the End Region. Test results indicate that the angle of the critical diagonal crack is approximately 30-degrees. The behavior indicate that plate bending, vertical shear, and lateral shear are becoming less 137
150 dominant than in the end region, as reflected by the shallower crack angle. Shear and Torsion demands are reduced in this region while bending moment demands are increased in comparison with the End Region. Flexure Region: The remainder of the span is defined as a flexure region. In-plane flexure dominates the behavior in this region. Shear and torsion demands are relatively low while moment demands are high. The geometry shown in Figure 5-1 is defined in a generalized manner to cover the diagonal crack at any angle in any region. Figure 5-2 illustrates the two possible diagonal cracks that could develop in the end region. h 2h Variable to Midspan h a End Region Transition Region Figure 5-1 : Regions of a Spandrel Beam Flexure Region h Height of the spandrel. a The vertical distance from the bottom of a spandrel to the center of the lower tie-back connection. Ө - Theta is the angle of the critical diagonal crack for the region under consideration with respect to the horizontal. Theta is suggested as 45-degrees for End Regions, 30-degrees for Transition Regions. In Flexure Regions, Theta is suggested as 0-degrees because a critical diagonal crack will not form (cracks due to the eccentric loads are nearly horizontal). l ch The length of the horizontal projection of the diagonal crack. 138
151 (a) (b) Figure 5-2 : Generalized Nomenclature Applied to an End Region for Two Possible Crack Planes GENERAL DESIGN PROCEDURE The procedure described in this section is subject to the following restrictions: i. The precast spandrel beam is a simply-supported and loaded along the bottom edge. ii. The web is laterally restrained at two points at each end. iii. Applied loads are evenly distributed along the bottom edge of the web. Note: The proposed procedures were originally developed for slender spandrels with aspect ratios greater than 3. Based on the measured behavior of the compact spandrel beams LG2, LG3 and LG4, it is also proposed to use the same approach for both compact and slender spandrels. Step 1: Determine the loading demands. Determine the factored moment M u (in.-kips), factored shear V u (kips), and factored torsion T u (in.-kips) in the beam and construct the respective factored moment, shear, and torsion diagrams. Typical diagrams are shown in Figure 5-3. Eccentricity for the torsion diagram should be considered from the point of load application to the center of the web as shown in Figure
. Design for flexure should follow all recommendations in the PCI Design Handbook.")
152 Figure 5-3: Typical Factored Shear, Moment, and Torsion Diagrams T u Stem Loads e Figure 5-4: Eccentric Loading of L-Shaped Spandrel Step 2: Design for the applied Bending Moment (M u ). Design for flexure should follow all recommendations in the PCI Design Handbook. 140

153 Step 3: Design for the applied Torsion (T u ). The vertical eccentric loads acting on the L-shaped spandrel produce a torque vector acting about the longitudinal axis of the beam. The T u vector at any point along the beam can be resolved along any angle into two equivalent orthogonal vectors as shown in Figure 5-5. If the angle Ө shown in Figure 5-5 is considered between 0 and 90 degrees, one component of the torque vector Tu b, will act to bend the spandrel web out of plane about the diagonal axis defined by Ө and is referred hereafter as the Plate Bending component. The second component of the applied torque vector Tu t, will act to twist the web about an axis perpendicular to that diagonal axis and is referred hereafter as the Twist component. The magnitude of this factored torsion demand along the length of the beam can be calculated by accumulating the torsion due to applied load from the double tees and the distance from applied load to center of web. Note that the double-headed torsion vectors shown in the figure indicate moments according to the right hand rule. Figure 5-5 : Components of Torque 141
154 Step 4: Design for the Plate Bending Component of Torsion (T ub ). The factored out of plane bending moment demand about the diagonal axis defined by the angle Ө Figure 5-5 can be calculated as: T ub = T u cosө Equation 5-1 The resistance to T ub is developed by plate bending in the web. The nominal resisting moment can be approximately calculated as: 5-2 T nb = A s f y d w Equation Where: -f y is the yield stress of the inner-face reinforcing steel -A s is the total area of steel required on the inner-face crossing the critical diagonal crack oriented in a direction perpendicular to the crack. -d w is defined as the distance from the outer spandrel face to the center of the inner-face longitudinal bars defined in Figure 5-6. Note: The internal lever-arm in the T-C couple resisting T u should technically be considered from the resultant compression force on the outer face to the centroid of the tension (inner-face) steel. However, considering d w as shown is a safe assumption consistent with current PCI practice. Resistance to the out of plane bending T n must be greater than the lateral bending demand: T ub φ T nb Equation 5-3 Based on Equation 5-1 and Equation 5-2 the total required area of steel, A s, as, A s Tu cosθ φ f d y w Equation 5-4 Where φ = 0.9 for flexure and A s is the total area of steel required on the inner-face to cross perpendicular to the 45 degree diagonal crack. Therefore, the total area of vertical steel in the vertical direction crossing the diagonal crack, A sv, can be determined as follows: A A cosθ Equation 5-5 sv = s 142
155 Using Equation 5-4, the required total area of vertical steel for out of plane bending A sv, can be determined as: Where: A T cos θ 2 u sv Equation 5-6 φ fy dw A sv is the total area of vertical steel (in 2 ) required to cross the diagonal crack on the inner face to resist plate bending. Similarly, the total required area of horizontal steel, A sl,(in. 2 ) can be determined as: Thus, Where: A sl = A s A sinθ T cosθ sin θ u sl Equation 5-7 φ f y d w A sl is the total area of horizontal steel (in 2 ) required to cross the diagonal crack on the inner face to resist out of plane bending. Step 5: Distribute the required steel quantity over the projected crack length The total required vertical steel for plate bending, A sv, must be distributed evenly over the horizontal crack projection, l ch where l ch can be determined using geometry along the shorter length critical crack 2-2 as shown in Figure 5-6 as follows: l ch 2 d w h a 2 θ Figure 5-6 : Nomenclature Applied in the Proposed Rational Design Approach 143
156 ( h ) a l ch = Equation 5-8 tan θ Equation 5-8 can be rearranged with a trigonometric identity and re-written as, ( h a) cos θ l ch = Equation 5-9 sin θ Note: For crack orientation 1-1 shown in Figure 5-2 or for regions other than the end region, Equation 5-9 is valid if a is taken as 0. Distributing the total vertical reinforcement, A sv (Equation 5-6) along the horizontal crack projection defined by Equation 5-9, the required vertical reinforcement for out of plane plate bending (A sv. /s) can be determined as follows: A sv / ft. T u φ f cos y ( h a) 2 d θ w cosθ sinθ Which can be rearranged to: A sv Tu cosθ sinθ / ft. (in. 2 /in.) Equation 5-10 φ f d y w ( h a) Similarly, A sl, expressed in terms of total steel area, Equation 5-7, can also be distributed along the vertical projection of the diagonal crack. Considering critical crack 2-2 in Figure 5-6, the vertical projection is h-a. Accordingly, the required horizontal reinforcement per unit length along the failure surface can be determined as: A Which can be rearranged to: sl Tu cosθ sinθ φ f y d w ( h a) Tu cosθ sinθ Asl / ft. (in. 2 /in.) Equation 5-11 φ f d y w ( h a) It should be noted that Equation 5-10 and 5-11 are identical irrespective of crack angle or beam region. A sl and A sv should be calculated once per region at the point of maximum 144
157 torsion (T u ) in that region. It is further interesting to note that A s / s measured along the diagonal length of the crack is also equal to Equation 5-10 and Equation It should also be noted that the required vertical out of plane plate bending steel distributed over the horizontal crack projection equals the required horizontal out of plane plate bending steel distributed over the vertical crack projection for all beam regions. Both A sl / s and A sv / s can be calculated directly from the factored torque T u using a single equation in either the end region or the transition region (Equation 5-10 and Equation 5-11). However, it may be more convenient for design to express the required longitudinal steel in terms of quantity (in 2 ) rather than distributed quantity (in. 2 /in.). Step 6: Demonstrate that Yielding of Inner-face Steel Controls Plate Bending Capacity The fundamental assumption in the above derivation is governed by the yielding of the inner face steel under the effect of the applied factored bending moment T ub. However, there is a potential for the concrete to reach its ultimate compressive strain prior to tension yielding of reinforcement. To ensure yielding prior to crushing of the concrete, the total steel area should be limited to ACI-318 requirements for tension-controlled failure of the section along the failure surface. This can achieved by limiting the out of plane bending compression zone, c, in terms of effective depth, d w, as follows: c 0.375d w Equation
158 2 (h-a) sin θ d w c A s / ft. 2 Compression Zone due to Out of Plane Plate Bending Figure 5-7 : Resistance to Out of Plane Plate Bending (ledge not shown) Cut along Critical Crack 2-2 Based on equilibrium of a unit width along the diagonal crack plane shown in Figure 5-7, the equilibrium equation for the internal forces can be formulated as follows: A ' f y = 0.85 f c 12 β 1 c Equation 5-13 s " / ft. Where β 1 is conservatively assumed as 0.65 for all concrete strengths and the equilibrium equation and limiting value of c can be rewritten as follows: A f 0.85 f 12" ( d ' s / ft. y c w This equation provides the limiting value for the total area of steel (A s per foot) as follows: ) A s / ft. 2.5 f f ' c y d w Equation 5-14 Based on Equation 5-14, and the discussion above, the horizontal and vertical reinforcement should be limited to: A sv / ft. 2.5 f ' c w and f y d A sl / ft. 2.5 f ' c w Equation 5-15 f y d 146
159 The practical nature of these upper limits is equivalent to a #4 bar spaced every 2 for concrete compression strength of 5000 psi, steel yield strength of 60 ksi for the steel, and an effective web depth, d w, of 6 inches. The above analysis indicates that the requirements for plate bending steel given in Equation 5-10 and Equation 5-11 for A sv /s and A sl /s, respectively will allow the steel to yield with the significant ductility required for tension failure, and the use of Φ = 0.9. Step 7: Design for the Twisting Component of Torsion To satisfy equilibrium, there is a need to ensure that the twisting capacity of the section along the failure plane exceed the twisting demand on the section, Tu t. The twisting demand (Tu t ) acting on any given diagonal failure plane can be calculated based on Figure 5-5 as: Tu t = Tu sin θ Equation 5-16 Therefore it is required that twisting resistance Tn t must be greater than twist demand: Tu t φ Tn t Equation 5-17 Where: φ is 0.75, according to the ACI-318 recommendation for torsion design. The cross-section through the primary diagonal crack 2-2, normal to the Tu t vector has dimensions of (h-a) / sin Ө and b as shown in Figure
160 b 2 h (h a ) / sin θ T ut a 2 θ Figure 5-8 : Twist Component on Diagonal Failure Plane along Crack 2-2 Assuming a linear distribution of shear stresses due to the applied twist on the section as shown in Figure 5-9, the resultant H nt can be evaluated. The assumption is similar to the wellaccepted mechanism for the transfer of unbalanced moments from reinforced concrete slabs to columns, the Linear Shear Distribution Model. In the case of a column-slab interface, ACI Section recommends that the shear stress shall vary linearly about the centroid of the critical section, shown in Figure The linear model assumes a shear stress distribution with a maximum value at the extreme end of the section. 148
161 b h L twist (h a ) / sin θ 2 H nt H nt T ut a 2 θ Figure 5-9 : Horizontal Twist Resistance Couple along the Diagonal Failure Plane Figure 5-10 : Linear Distribution of Shear Stresses at a Slab-Column Interface 149
162 From Figure 5-9, the stress resultant H nt can be determined in terms of the maximum shear stresses at the extreme fibers, X ' f c, as follows: H nt = 1 2 ( h a) sinθ 1 2 d w X f ' c Equation 5-18 The equivalent maximum shear stress Accordingly, the twist resistance can be evaluated as: 2 (h a) T nt = H nt. 3 sin θ which can be rewritten as, T nt = X ' X f c can be determined from the experimental tests. f ' c Equation (h a) d 2 w Equation sin θ To ensure that the twisting resistance exceeds or at least equals the factored torque demand, the following should be satisfied: Where: T u 1 h d 6 sin θ 2 ' φ X f c 3 w Equation 5-21 φ is 0.75, according to the ACI-318 recommendation for torsion design. Results from previous tests on L-shaped spandrel beams with varying aspect ratios conducted at North Carolina State University are used in conjunction to the six L-shaped spandrel beams discussed in this thesis, to calibrate the proposed rational model. Of the six beams (four compact and two slender L-shaped spandrels) discussed in this research program, four of them had end region failures. For each of these tests, the measured lateral reactions at failure were used to calculate the out-of-plane shear stresses resisted by a given beam. Beams exhibiting end-region failure modes are listed in Table 5.1 along with the vertical and lateral reactions measured at failure and the measured concrete compressive strength. 150
163 Table 5.1 : Selected Data at Failure for Specimens with End-Region Failure Modes Measured Loads at Failure Measured Concrete Vertical Lateral Reactions (kips) Strength Reaction Top Top Bottom Bottom (kips) Left Right Left Right (psi) LG ,600 LG ,800 LG ,800 SP ,800 *Lateral reactions in bold were measured on the end of the beam that failed. The first step in calibrating the twist resistance model is to determine the torsion acting on the end region of a given beam at failure. To determine the torque at failure, T t shown in Figure 5-12 for each tested beam, all lateral forces shall be in equilibrium. Lateral forces not directly measured during the tests were evaluated by considering equilibrium of the beam as a whole about a selected origin, point O shown in Figure Figure 5-11 : Equilibrium of a Generic Slender Spandrel Beam 151
164 The measured forces during each test are shown in Figure 5-11, as follows: V, the sum of measured vertical reactions at failure V s, the self-weight of the spandrel beam V a, the sum of loads applied to the spandrel by the double-tee decks and jacks H 1, the sum of measured lower lateral reactions at failure H 3, the sum of measured upper lateral reactions at failure The dimensions from each force to point O are known for each beam as follows: Z H1, the height of the lower lateral reaction Z H2, the height of the deck connection NOTE: For a compact L-shaped spandrel the location of the deck connection was at the top of the beam and for a slender L-shaped spandrel the location of the deck connection was along the inner face of the beam. Z H3, the height of the upper lateral reaction Z mv, the height to the Teflon surface of the main bearing pad Z mva, the height to the Teflon surface of the ledge (or corbel) bearing pad X V, the distance from outer web face to the center of the main vertical reaction, estimated to remain at the center of the web. X Vs, the distance from outer web face to the center of the self-weight reaction, estimated to remain at the center of gravity. X Va, the distance from outer web face to the center of the ledge reactions, estimated to remain at the center of the ledge bearing pads. The unknown forces for each test include: H 2, the sum of lateral forces at the deck connections V mv, the sum of lateral forces at the main vertical bearing due to friction V mva, the sum of lateral forces at the ledge (or corbel) due to friction The two unknowns ( H 2, the sum of lateral forces at the deck connections, and μ, the friction coefficient) were determined by taking moment equilibrium about point O and force equilibrium in the horizontal direction. The analysis was preformed for each of the four 152
165 spandrel beams which failed in their end regions, and the results are presented in Table 5.2 for each spandrel beam. The calculated values correspond well to the range published in the PCI Design Handbook (approximately ) for Teflon-coated bearing pads. The values of H 2 listed in the table represent the total lateral force transferred to each spandrel beam by the four and a half double-tee deck sections used in each test (4 double-tees and 1 single-tee). Thus, H 2 / 4.5 represents the lateral load transferred to a given spandrel beam through each deck connection. Note that the negative sign of H 2 indicates that the deck connections were determined to be in compression at failure. Table 5.2 : Friction Coefficient and Deck Tie Forces Determined by Equilibrium Friction Coefficient (m) H2 (kips) LG LG LG SP With all lateral forces determined, the twisting component of torsion resisted by each beam at failure was evaluated. Figure 5-12 shows a free body diagram taken about a 45-degree crack plane extending upward along the crack 1-1 discussed earlier. Crack plane 1-1 corresponds to the approximate location of failure observed in the seven beams given in Figure Note that forces acting into the page are identified by a circle with a cross while forces acting out of the page are identified by a circle with a dot. All dimensions are known from the geometry for a given beam, and all forces were measured, or were determined from equilibrium. Note that there are no deck connections to the left of crack plane 1-1, so the deck connection forces, H 2, do not appear in the free body diagram to the left of the crack. The out-of-plane shear stress distribution induced by the twisting moment at failure, T t, was assumed to be linear across the selected crack plane (1-1), as shown in Figure
166 H3 1 H2 T t H1 μv V 1 Applied Loading from Double Tee Stem Figure 5-12 : Forces Contributing to Torque on a Slender Spandrel End Region The maximum values at the extremes of the distribution are identified as X * f ' c and ' X f c. The location of the centroid of the twisting moment, was determined by an iteration process which satisfied moment equilibrium about the selected centroid and equilibrium of the horizontal forces. It should be noted that the tendency of the vertical reaction to shift inward (towards the ledge) was conservatively neglected. Based on the two equilibrium equations, the height of the centroid and the extreme values of the stress distribution, * X and X, were * determined as given in Table 5.3. Note that X and X are related by the linear distribution. The average values, X avg, of X * and X are also given in the same table for each beam. Table 5.3 : Results from the Twist Model Calibration Z t (inches) X* ' (psi / f c ) (psi / X ' f c ) (psi / LG LG LG SP Mean (above 4 tests) 2.63 Mean (Previous tests included) 2.62 Minimum (above 4 tests) 2.47 Minimum (Previous tests included) 2.32 standard deviation 0.32 X avg ' f c ) 154
167 Given the results presented in Table 5.3 a conservative value of 2.4 is recommended for X in evaluating the twist resistance of concrete in torsion as shown in Figure As the centroid of the linear distribution assumed for design will be considered at the mid-height of the cross-section, it is appropriate to compare the selected value of X to the values of X avg in the table. Selecting a value below the mean, X avg, is a safe choice for design, especially considering the conservative nature of the linear distribution and the assumptions made in the calibration. The ratio of twisting moment at failure to nominal twisting capacity is shown in Figure 5-14 for all four spandrels which failed in their end regions. The plot clearly shows that with X=2.4 conservatively predicts the twisting capacity of each tested beam. Thus, a value of 2.4 is recommended for design. This recommendation provides a conservative prediction of the twisting moment capacity of a slender spandrel, and is consistent with the historical association of 2.4 with torsion (ACI ). ' f c Thus, the proposed twist resistance using the linear shear distribution model is given in Equation 5-22 for units of pounds and inches. 2 ' d wh T φ u 2.4 f c Equation sin θ Step 8: Design the Beam to Resist the Applied Shear Shear design should follow standard practice. Determine the transverse reinforcement A v required to resist V u as follows: A v Vu /φ Vc s f d y (in. 2 /in.) Equation 5-23 Where: φ is the strength reduction factor for shear = 0.75 V c is V ci or V cw whichever is smaller as given respectively by Eqns. (11-11) and (11-12) of ACI A v / s, is the distributed vertical reinforcement required for shear at a given cross-section. Note that the minimum requirements for A v specified by ACI may control over Equation
168 Step 9: Proportion the Inner and Outer Web Face Reinforcement The total amount of vertical steel required on the inner web face is that required for the plate bending component of torsion plus that required for shear. Shear stresses and plate bending stresses act in the same direction across a common crack plane on the inner web face, and thus, their reinforcement requirements are additive. The amount of vertical steel required on the inner face, A si, is equal to the plate bending steel calculated in Equation 5-10 plus half of the shear steel calculated in Equation The total required vertical steel on the inner web face is given by, Thus, A si / s A 1 / s (A sv A v ) / s Equation si + Tu cos θ sin θ Vu / φs Vc + (in. 2 /in.) Equation 5-25 φ f d f y w ( h a) 2 f d The remaining half of the shear steel calculated in Equation 5-23 is placed on the outer web face. There is no requirement for vertical plate bending steel on the outer face since it is in compression. The total area of vertical steel required on the outer web face, A so, is given by, A so / s y Vu / φs Vc (in. 2 /in.) Equation f d y The longitudinal steel, A sl, specified by Equation 5-11, is to be provided on both the inner and the outer web faces. Providing longitudinal steel on the outer face protects against possible plate bending on the outer face. In addition, longitudinal steel provides dowel forces beneficial to twist resistance, particularly in the end region. Appendix H provides two sample designs of the shear and torsion reinforcement discussed in this chapter. The first, LG1 designed by the current method provided by the PCI Handbook and the second, LG2 designed by the proposed Rational Design Method. Comparison between the steel required to reinforce the end region according to the two methods are also provided. The analysis clearly indicated that the proposed design approach can provide significant saving of the steel reinforcement by about 70 % in addition to the ease of construction as shown in Table H
169 Figure 5-13 : Calibrated Twist Values in Terms of X roots f c Figure 5-14 : Ratio of Failure Twist Moment to Nominal Twist Moment 157
170 6 CONCLUSIONS This thesis describes the behavior and proposes design guidelines for compact and slender precast L-shaped spandrel beams, reinforced with an open stirrup configuration, under the effects of typical loading conditions. It consisted of an experimental program including testing of six full scale precast L-shaped spandrel beams. Boundary conditions used in the test are similar to field conditions, using typical double-tee prestressed members representing flooring or roofing of parking structures to apply loads to the spandrel beam. The loading configuration induces combined torsion, shear and flexural stresses similar to typical field conditions. The proposed rational design approach considered in this thesis is based on outof-plane bending behavior accounting for flexure, shear, and torsion induced forces to determine the required open web and flexural reinforcements of L-shaped slender and compact beams. Based on the experimental and analytical studies, the following conclusions were made: 1. Compact and Slender L-shaped spandrel beams, of the same general configuration as those tested can be designed and detailed efficiently and safely using open web reinforcements based on the design method in this thesis. 2. At service load levels, there is virtually no difference in the behavior between spandrel beams reinforced with open stirrups or closed stirrups. 3. The proposed design method classifies the behavior of L-shaped spandrel beams into three distinct beam regions: the end region, the transition region, and the flexure region. The design should consider flexure, shear and torsion in all regions. Design of the end region controlled by the applied shear and torsion. 4. Design of the end region of slender and compact L-shaped spandrel beam using traditional closed web reinforcement according to the current practice outlined in the PCI Design Handbook, v.6, is an overly-conservative approach. 158
171 5. Beams designed using the traditional closed stirrups have more ultimate shear resistance than the open web stirrups. However, beams designed according to the proposed design method can exceed the required shear resistance for the design factored load. 6. The spandrel-deck connections significantly effect the lateral displacement induced by bending about the weak principal axis. 7. Production of a typical L-shaped spandrel beam with open web reinforcement requires 30-50% less web steel and an estimated 50% less labor than a comparable beam with traditional closed web reinforcement. 159
172 REFERENCES ACI Committee Building Requirements for Structural Concrete (ACI ). Farmington Hills, MI: American Concrete Institute. Collins, M. and Mitchell, D Shear and Torsion Design of Prestressed and Non- Prestressed Concrete Beams. PCI Journal 25(5): Hassan, T., Lucier, G., Rizkalla, S. and Zia, P Modeling of L-Shaped, Precast, Prestressed Concrete Spandrels. PCI Journal 52(2): Hsu, T Torsion of Reinforced Concrete. New York: Van Nostrand Reinhold. Klein, G Design of Spandrel Beams. Specially Funded R & D Program Research Project No. 5 (PCISFRAD #5), Chicago, IL: Prestressed Concrete Institute. Klein, G Memo_PCI-SpandrelDeisgn2. to Catrina Walter. January 14, Logan, D L-Spandrels: Can Torsional Distress Be Induced by Eccentric Vertical Loading, PCI Journal 52(2): Lucier, G., Rizkalla, S., Zia, P. and Klein, G Precast Concrete L-Shaped Spandrels Revisited: Full-Scale Tests. PCI Journal 52(2): Lucier, G., Rizkalla, S. and Zia, P Behaviour of Full-Size Spandrel beams. Technical report IS Raleigh, NC: Constructed Facilities Laboratory. North Carolina State University. Mitchell, D. and Collins, M Detailing for Torsion. ACI Journal 73(9) PCI Industry Handbook Committee PCI Design Handbook: Precast and Prestressed Concrete. 6th ed., pp to Chicago, IL: Precast/Prestressed Concrete Institute (PCI). 160
173 Raths, C.H Spandrel Beam Behavior and Design. PCI Journal 29(2): Walsh,P.F., MP Collins, FE Archer and AS Hall The Ultimate Strength Design of Rectangular Reinforced Concrete Beams Subjected to Combined Torsion, Bending and Shear. Institution of Engineers, Australia Civil Engineering Transactions. CE8(2): Walsh, P.F., MP Collins and FE Archer The Flexure-Torsion and Shear-Torsion Interaction Behavior of Rectangular Reinforced Concrete Beams. Civil Engineering Transactions. Zia, P. and Hsu, T Design for Torsion and Shear in Prestressed Concrete Flexural Members. PCI Journal 49(3): May-June. (This paper was previously presented at the American Society of Civil Engineers Convention, October 16-20, 1978, Chicago, IL, reprint #3424.) Zia, P. and McGee, D Torsion Design of Prestressed Concrete. PCI Journal 19(2): Zia, P. and McGee, D Prestressed Concrete Under Torsion, Shear, and Bending. ACI Journal 73(1):
174 APPENDIX 162
175 Figure A 1: Closed Stirrup Reinforcement for LG1 163
176 Figure A 2: Additional Reinforcement along Web and Ledge for LG1 164


177 Figure A 3: Shop Ticket for Compact Spandrel LG1 165

178 Figure A 4: Welded-Wire Mesh Locations for LG2 166
179 Figure A 5: Additional Reinforcement along Web and Ledge for LG2 167


180 Figure A 6: Shop Ticket for Compact Spandrel LG2 168

181 Figure A 7: Welded-Wire Mesh Locations for LG3 169
182 Figure A 8: Additional Reinforcement along Web and Ledge for LG3 170


183 Figure A 9: Shop Ticket for Compact Spandrel LG3 171
184 Figure A 10: Welded-Wire Mesh and Conventional Reinforcement for LG4 172


185 Figure A 11: Shop Ticket for Compact Spandrel LG4 173

186 Figure A 12: Web Reinforcement Details SP20 174
187 Figure A 13: Additional Flexural and Ledge Reinforcement Details SP20 175

188 Figure A 14: Web Reinforcement Details SP21 176
189 Figure A 15: Additional Flexural and Ledge Reinforcement Details SP21 177
190 Detailed Figures for LG1 Figure B 1 : Load - Vertical Deflection Profile up to Full Factored Load - LG1 Figure B 2 : Load - Vertical Deflection Profile along Span for 24 Hour Load Test - LG1 178
191 Figure B 3 : Strain Profile at Midspan - LG1 Figure B 4 : Strain Profile at Quarter Span - LG1 179


192 Figure B 5 : Lateral Reactions at Various Loading Stages - LG1 Figure B 6 : Lateral Top Reactions for Different Bearing Pad sizes - LG1 180
193 Detailed Figures for LG2 Figure C 1 : Load - Vertical Deflection Profile up to Factored Load LG2 Figure C 2 : Load - Vertical Deflection Profile along span for 24 hour Load test LG2 181
194 Figure C 3 : Strain Profile at Midspan LG2 Figure C 4 : Strain Profile at Quarter Span LG2 182
195 Figure C 5 : Lateral Reactions at Various Loading Stages - LG2 183
196 Detailed Figures for LG3 Figure D 1 : Load Vertical Deflection Profile up to Factored Load - LG3 Figure D 2 : Load - Vertical Deflection Profile for 24 Hour Load Test - LG3 184
197 Figure D 3 : Strain Profile at Midspan - LG3 Figure D 4 : Strain Profile at Quarter Span LG3 185

198 Figure D 5 : Lateral Reactions at Various Loading Stages - LG3 186
199 Detailed Figures for LG4 Figure E 1 : Load - Vertical Deflection Profile up to Factored Load - LG4 Figure E 2 : Load - Vertical Deflection Profile for 24 hour Load Test - LG4 187
200 Figure E 3 : Strain Profile at Midspan - LG4 Figure E 4 : Strain Profile at Quarter Span - LG4 188
201 Figure E 5 : Lateral Reactions at Various Loading Stages - LG4 189
202 Detailed Figures for SP20 Figure F 1 : Load Vertical Deflection Profile up to Factored Load SP20 Figure F 2 : Load Vertical Deflection for 24 hour test - SP20 190
203 Figure F 3 : Flexural Strain Profile at Midspan - SP20 Figure F 4 : Flexural Strain Profile at Quarter Span - SP20 191

204 Figure F 5 : Measured Gap between Inner Web face and Double Tee Stem - SP20 Figure F 6 : Face Strains at Supports SP
205 Detailed Figures for SP21 Figure G 1 : Vertical Deflection Profile up to Factored Load - SP21 Figure G 2 : Face Strains at Supports - SP21 193
206 Figure G 3 : Strain Profile at Midspan - SP21 Figure G 4 : Strain Profile at Quarter Span SP21 194

207 Sample Design of Compact L-Shaped Spandrels This section deals with the shear and torsion design of two compact L-shaped spandrels that were tested in this research program. The first, LG1 designed by the Zia-Hsu method as followed in the PCI Handbook and the second, LG2 designed by the proposed Rational Design approach discussed earlier in Chapter 5. Using the dimensions shown in Figure H 1, section properties are determined and given in the following table. Material properties, Prestressing strand details and load factors are listed. Double Tee Stem Loads 5 3 Figure H 1: Typical Cross Section and Loading of a Compact Spandrel Section Propreties Units Type of Beam Compact L-Shaped Spandrel web breadth 28 in. ledge breadth 8 in. web height 34 in. ledge height 8 in. cover 1.5 in. Material Properties Units F'c 7000 psi Fy 60 ksi Unit Weight 150 pcf Load Factors Units Dead 1.2 Live 1.6 Snow 0.5 phi 0.75 zia-hsu phi Prestressed Strand Inputs Units dia_strand 0.5 in. #_strand 20 # area/strand in^2/strand Fpu 270 ksi Initial Pull 70% % of Fpu Losses 5.50% % c.g. of strand 7.6 in. development 25 in. 195
Nafadi, Khalaf Alla, Lucier, Rizkalla, Zia and Klein BEHAVIOR AND DESIGN OF DIRECTLY LOADED LEDGES OF SHORT SPAN L- SHAPED BEAMS
 BEHAVIOR AND DESIGN OF DIRECTLY LOADED LEDGES OF SHORT SPAN L- SHAPED BEAMS Mohamed Nafadi, Omar Khalaf Alla, Gregory Lucier, Sami Rizkalla, Paul Zia, NC State University, Raleigh, NC and Gary Klein, Wiss,
Precast concrete L-shaped spandrel beams are commonly
 Ledge behavior and strength of short-span L-shaped beams Mohamed K. Nafadi Omar M. Khalafalla Gregory W. Lucier Sami Rizkalla Paul Zia and Gary J. Klein Precast concrete L-shaped spandrel beams are commonly
ABSTRACT. The research reported in this thesis investigates the behavior and the punching shear capacity
 ABSTRACT KHALAF ALLA, OMAR MOHAMED. Design and Behavior of Ledges for Short Span L- Shaped Spandrel Beams. (Under the direction of Dr. Sami Rizkalla.) The research reported in this thesis investigates
TORSION SIMPLIFIED: A FAILURE PLANE MODEL FOR DESIGN OF SPANDREL BEAMS
 TORSION SIMPLIFIED: A FAILURE PLANE MODEL FOR DESIGN OF SPANDREL BEAMS Gary Klein, Gregory Lucier, Sami Rizkalla, Paul Zia and Harry Gleich Biography: Gary Klein, FACI, is Executive Vice President and
Development of a rational design methodology for precast concrete slender spandrel beams: Part 1, experimental results
 Development of a rational design methodology for precast concrete slender spandrel beams: Part 1, experimental results Gregory Lucier, Catrina Walter, Sami Rizkalla, Paul Zia, and Gary Klein Editor s quick
Development of a rational design methodology for precast concrete slender spandrel beams: Part 2, analysis and design guidelines
 Development of a rational design methodology for precast concrete slender spandrel beams: Part 2, analysis and design guidelines Gregory Lucier, Catrina Walter, Sami Rizkalla, Paul Zia, and Gary Klein
Precast Concrete, L-Shaped Spandrels Revisited: Full-Scale Tests
 Precast Concrete, L-Shaped Spandrels Revisited: Full-Scale Tests Sami Rizkalla, Ph.D. P.Eng. Distinguished Professor of Civil, Construction, and Environmental Engineering and Director Constructed Facilities
Precast concrete double-tee beams with thin stems
 Dapped ends of prestressed concrete thin-stemmed members: Part 1, experimental testing and behavior Amir W. Botros, Gary J. Klein, Gregory W. Lucier, Sami H. Rizkalla, and Paul Zia Precast concrete double-tee
5.4 Analysis for Torsion
 5.4 Analysis for Torsion This section covers the following topics. Stresses in an Uncracked Beam Crack Pattern Under Pure Torsion Components of Resistance for Pure Torsion Modes of Failure Effect of Prestressing
Chapter 2 Notation and Terminology
 Reorganized 318 Chapter Titles Chapter 1 General 1.1 Scope 1.2 Purpose 1.3 Interpretation 1.4 Drawings and Specifications 1.5 Testing and Inspection 1.6 Administatration and Enforcement 1.6.1 Retention
AC : STUDENT FEEDBACK AND LESSONS LEARNED FROM ADDING LABORATORY EXPERIENCES TO THE REINFORCED CONCRETE DESIGN COURSE
 AC 2007-2802: STUDENT FEEDBACK AND LESSONS LEARNED FROM ADDING LABORATORY EXPERIENCES TO THE REINFORCED CONCRETE DESIGN COURSE Micah Hale, University of Arkansas Seamus Freyne, Manhattan College Stephan
The Use of Bolted U-Link Swimmer Bars in the Reinforced Concrete Beams
 IOSR Journal of Engineering (IOSRJEN) e-issn: 2250-3021, p-issn: 2278-8719 Vol. 3, Issue 10 (October. 2013), V5 PP 26-32 The Use of Bolted U-Link Swimmer Bars in the Reinforced Concrete Beams Moayyad M.
CHAPTER 10: GENERAL STRUCTURAL DETAILS
 CHAPTER 10: GENERAL STRUCTURAL DETAILS 10.1 GENERAL It shall be in accordance with JSCE Standard Specification (Design), 9.1, "steel" shall be taken to signify "steel or CFRM". 10.2 CONCRETE COVER (1)
Structural Performance of 8-inch NRG Concrete Masonry Units. Report Compiled for: Niagara Regional Group. Date: January 28, 2013
 Structural Performance of 8-inch NRG Concrete Masonry Units Report Compiled for: Niagara Regional Group Date: January 28, 2013 Report Prepared by: Dr. Shawn Gross, Associate Professor Dr. David Dinehart,
Seismic Behaviour of RC Shear Walls
 Ductile Detailing of RC Structures :: IS:13920-1993 1993 Short Course on Seismic Design of RC Structures Durgesh C. Rai Department of Civil Engineering, IIT Kanpur The material contained in this lecture
COLUMNS 1- Definition: The Egyptian code defines columns as : 2- Types of concrete columns
 COLUMNS 1- Definition: Columns are vertical compression members which carry primarily axial compression load; the axial load may be associated with bending moments in one or two directions, as shown in
Contents. Foreword 1 Introduction 1
 Contents Notation x Foreword xiii 1 Introduction 1 1.1 Aims of the Manual 1 1.2 Eurocode system 1 1.3 Scope of the Manual 3 1.4 Contents of the Manual 4 1.5 Notation and terminology 4 2 General principles
twenty two concrete construction: flat spanning systems, columns & frames ARCHITECTURAL STRUCTURES: FORM, BEHAVIOR, AND DESIGN
 ARCHITECTURAL STRUCTURES: FORM, BEHAVIOR, AND DESIGN DR. ANNE NICHOLS SUMMER 2014 lecture twenty two concrete construction: http:// nisee.berkeley.edu/godden flat spanning systems, columns & frames Concrete
ZIA RAZZAQ Department of Civil and Environmental Engineering Old Dominion University, Norfolk, Virginia 23529, USA
 Stress, ksi Journal of Multidisciplinary Engineering Science and Technology (JMEST) Strength of Reinforced Concrete Members under Combined Bending and Torsion MUHAMMAD FAHIM Civil Engineering Department
twenty two concrete construction: flat spanning systems, columns & frames Reinforced Concrete Design Reinforced Concrete Design
 ARCHITECTURAL STRUCTURES: FORM, BEHAVIOR, AND DESIGN DR. ANNE NICHOLS SUMMER 2014 lecture twenty two economical & common resist lateral loads concrete construction: flat spanning systems, columns & frames
PRIMARY AND SECONDARY REINFORCEMENTS IN CORBELS UNDER COMBINED ACTION OF VERTICAL AND HORIZONTAL LOADINGS
 16th International Conference on Composite Structures ICCS 16 A. J. M. Ferreira (Editor) FEUP, Porto, 2011 PRIMARY AND SECONDARY REINFORCEMENTS IN CORBELS UNDER COMBINED ACTION OF VERTICAL AND HORIZONTAL
BS EN :2004 EN :2004 (E)
") Contents List 1. General 1.1 Scope 1.1.1 Scope of Eurocode 2 1.1.2 Scope of Part 1-1 of Eurocode 2 1.2 Normative references 1.2.1 General reference standards 1.2.2 Other reference standards 1.3 Assumptions
Contents List 1. General 1.1 Scope 1.1.1 Scope of Eurocode 2 1.1.2 Scope of Part 1-1 of Eurocode 2 1.2 Normative references 1.2.1 General reference standards 1.2.2 Other reference standards 1.3 Assumptions
Abstract. Bulb Tee girders provide a practical, efficient means of spanning the large
 Abstract LACKEY, PAUL E. An Investigation of Bridge Deck Overhang Falsework Systems Installed onto Bulb Tee Girders. (Under the direction of Dr. Emmett Sumner.) Bulb Tee girders provide a practical, efficient
twenty two concrete construction: flat spanning systems, columns & frames Reinforced Concrete Design Reinforced Concrete Design
 ARCHITECTURAL STRUCTURES: FORM, BEHAVIOR, AND DESIGN DR. ANNE NICHOLS SUMMER 2013 lecture twenty two economical & common resist lateral loads concrete construction: flat spanning systems, columns & frames
L-Spandrels: Can Torsional Distress Be Induced by Eccentric Vertical Loading?
 L-Spandrels: Can Torsional Distress Be Induced by Eccentric Vertical Loading? Donald R. Logan, P.E., FPCI CEO/President Stresscon Corp. Colorado Springs, Colo. Current code-required design procedures for
INTERNATIONAL JOURNAL OF CIVIL AND STRUCTURAL ENGINEERING Volume 3, No 2, 2012
 INTERNATIONAL JOURNAL OF CIVIL AND STRUCTURAL ENGINEERING Volume 3, No 2, 2012 Copyright 2010 All rights reserved Integrated Publishing services Research article ISSN 0976 4399 Optimizing the use of swimmer
Contents. Tables. Notation xii Latin upper case letters Latin lower case letters Greek upper case letters Greek lower case letters. Foreword.
 Tables x Notation xii Latin upper case letters Latin lower case letters Greek upper case letters Greek lower case letters xii xiv xvi xvi Foreword xviii 1 Introduction 1 1.1 Aims of the Manual 1 1.2 Eurocode
Footings GENERAL CONSIDERATIONS 15.2 LOADS AND REACTIONS 15.4 MOMENT IN FOOTINGS
 4 Footings GENERAL CONSIDERATIONS Provisions of Chapter 15 apply primarily for design of footings supporting a single column (isolated footings) and do not provide specific design provisions for footings
Supplemental Plan Check List for Concrete Special Moment Resisting Frame
 Plan Check / PCIS Application Number: Your feedback is important, please visit our website to complete a Customer Survey at /LADBSWeb/customer-survey.jsf. If you have any questions or need clarification
PRESTRESSED CONCRETE STRUCTURES. Amlan K. Sengupta, PhD PE Department of Civil Engineering Indian Institute of Technology Madras
 PRESTRESSED CONCRETE STRUCTURES Amlan K. Sengupta, PhD PE Department of Civil Engineering Indian Institute of Technology Madras Module 5: Analysis and Design for Shear and Torsion Lecture-23: Analysis
Analysis and Design of One-way Slab System (Part-I)
") Lecture-02 Analysis and Design of One-way Slab System (Part-I) By: Prof Dr. Qaisar Ali Civil Engineering Department UET Peshawar www.drqaisarali.com 1 Topics Addressed Concrete Floor Systems Analysis and
Lecture-02 Analysis and Design of One-way Slab System (Part-I) By: Prof Dr. Qaisar Ali Civil Engineering Department UET Peshawar www.drqaisarali.com 1 Topics Addressed Concrete Floor Systems Analysis and
Experimental study on the seismic performance of RC moment resisting frames with precast-prestressed floor units.
 Experimental study on the seismic performance of RC moment resisting frames with precast-prestressed floor units. B.H.H. Peng, R.C. Fenwick, R.P. Dhakal & D.K. Bull Department of Civil and Natural Resources
10-COLUMNS: 10.1 Introduction.
 1 10-COLUMNS: 10.1 Introduction. Columns are vertical compression members of a structural frame intended to support the loadcarrying beams. They transmit loads from the upper floors to the lower levels
Appendix M 2010 AASHTO Bridge Committee Agenda Item
 Appendix M 2010 AASHTO Bridge Committee Agenda Item 2010 AASHTO BRIDGE COMMITTEE AGENDA ITEM: SUBJECT: LRFD Bridge Design Specifications: Section 5, High-Strength Steel Reinforcement TECHNICAL COMMITTEE:
Investigating the Use of Spliced Swimmer Bars as Shear Reinforcement in Reinforced Concrete Beams
 IOSR Journal of Engineering (IOSRJEN) ISSN (e): 2250-3021, ISSN (p): 2278-8719 Vol. 05, Issue 02 (February. 2015), V2 PP 47-54 www.iosrjen.org Investigating the Use of Spliced Swimmer Bars as Shear Reinforcement
SEISMIC BEHAVIOR AND DESIGN OF STEEL SHEAR CONNECTIONS WITH FLOOR SLABS
 SEISMIC BEHAVIOR AND DESIGN OF STEEL SHEAR CONNECTIONS WITH FLOOR SLABS Judy LIU 1 And Abolhassan ASTANEH-ASL 2 SUMMARY The 1994 Northridge earthquake raised many questions regarding welded steel moment
ACI Code Revisions Impact on StructurePoint Software
 ACI 318-19 Code Revisions Impact on StructurePoint Software General Themes & Summary ACI 318-19 continues to unify and simplify code provisions started in 2014 reorganization of chapters by members. Nearly
Appendix A Proposed LRFD Specifications and Commentary
 NCHRP Project 12-71 Design Specifications and Commentary for Horizontally Curved Concrete Box-Girder Highway Bridges Appendix A Proposed LRFD Specifications and Commentary A-1 A-2 4.2 DEFINITIONS (Additional)
14.1 PCI Standard Design Practice
 SPECIFICATIONS AND STANDARD PRACTICES Chapter.1 PCI Standard Design Practice Precast and prestressed concrete structures have provided decades of satisfactory performance. This performance is the result
> 0. 1 f, they are treated as beam-columns.
 223 A- Flexural Members (Beams) of Special Moment Frames Requirements of ACI 21.5 are applicable for special moment frame members proportioned primarily to resist flexure with factored axial forces 0.
Abstract. Bulb Tee girders provide a practical, efficient means of spanning the large
 Abstract LACKEY, PAUL E. An Investigation of Bridge Deck Overhang Falsework Systems Installed onto Bulb Tee Girders. (Under the direction of Dr. Emmett Sumner.) Bulb Tee girders provide a practical, efficient
Bijan Khaleghi, Ph, D. P.E., S.E.
 0 Submission date: July, 0 Word count: 0 Author Name: Bijan Khaleghi Affiliations: Washington State D.O.T. Address: Linderson Way SW, Tumwater WA 0 INTEGRAL BENT CAP FOR CONTINUOUS PRECAST PRESTRESSED
Modelling of RC moment resisting frames with precast-prestressed flooring system
 Modelling of RC moment resisting frames with precast-prestressed flooring system B.H.H. Peng, R.P. Dhakal, R.C. Fenwick & A.J. Carr Department of Civil Engineering, University of Canterbury, Christchurch.
SHEAR AND BUCKLING STRENGTHENING OF STEEL BRIDGE GIRDER USING SMALL-DIAMETER CFRP STRANDS
 20 th International Conference on Composite Materials Copenhagen, 19-24 th July 2015 SHEAR AND BUCKLING STRENGTHENING OF STEEL BRIDGE GIRDER USING SMALL-DIAMETER CFRP STRANDS Hamid Kazem 1, Sami Rizkalla
ISSUE A Code Change # 2 Class 3 and Class 4 Buildings
 ISSUE A Code Change # 2 Class 3 and Class 4 Buildings (new) Section 1604.9 Disproportionate Collapse. Design for structural integrity of new buildings to protect against disproportionate collapse shall
Reinforced Concrete Design. A Fundamental Approach - Fifth Edition
 CHAPTER REINFORCED CONCRETE Reinforced Concrete Design A Fundamental Approach - Fifth Edition Fifth Edition REINFORCED CONCRETE A. J. Clark School of Engineering Department of Civil and Environmental Engineering
Appendix A Tables and Diagrams
 Appendix A Tables and Diagrams Table A1.1 Mechanical properties of steel reinforcing bars Type of steel Grade f y (ksi) e y Carbon, A615 40 40 0.00138 60 60 0.00207 75 75 0.00259 80 80 0.00276 Low alloy,
PROFESSIONAL DEVELOPMENT SERIES
 Torsion Design of Structural Concrete Based on ACI 318-05 By Mahmoud E. Kamara, Ph.D., and Basile G. Rabbat, Ph.D., S.E. PROFESSIONAL DEVELOPMENT SERIES September 2007 Professional Development Series Torsion
eight plates and grids APPLIED ACHITECTURAL STRUCTURES: DR. ANNE NICHOLS SPRING 2018 lecture STRUCTURAL ANALYSIS AND SYSTEMS ARCH 631
 APPLIED ACHITECTURAL STRUCTURES: STRUCTURAL ANALYSIS AND SYSTEMS DR. ANNE NICHOLS SPRING 2018 lecture eight plates and grids Plates & Grids 1 http://nisee.berkeley.edu/godden Term Project Plates & Grids
Encased Beam with Variable Upper Steel Flange Position
 Encased Beam with Variable Upper Steel Flange Position Ahmed Youssef Kamal Civil Engineering Department, Benha Faculty of Engineering, Benha University, Egypt. ABSTRACT Encased beam composite construction
eight plates and grids Plates, Slabs & Grids Plates, Slabs & Grids Term Project plates horizontal plane, rigid slabs thin, flat, rigid
 APPLIED ARCHITECTURAL STRUCTURES: STRUCTURAL ANALYSIS AND SYSTEMS DR. ANNE NICHOLS SPRING 2018 Term Project lecture eight plates and grids Plates & Grids 1 Lecture 8 Applied Architectural Structures F2009abn
Column: Part 2 Courtesy of Dr. Latifee s IMI research group, Text books and others
 Column: Part 2 Courtesy of Dr. Latifee s IMI research group, Text books and others Design for Axial Load: With negligible moment and considerable amount of concentric axial load, failure occurs when the
International Journal of Advance Engineering and Research Development REVISION OF IS: A REVIEW (PART 2)
") Scientific Journal of Impact Factor (SJIF): 4.72 International Journal of Advance Engineering and Research Development Volume 5, Issue 01, January -2018 REVISION OF IS: 13920 A REVIEW (PART 2) Dr. Archana
Scientific Journal of Impact Factor (SJIF): 4.72 International Journal of Advance Engineering and Research Development Volume 5, Issue 01, January -2018 REVISION OF IS: 13920 A REVIEW (PART 2) Dr. Archana
EXPERIMENTAL INVESTIGATION ON THE INTERACTION OF REINFORCED CONCRETE FRAMES WITH PRECAST-PRESTRESSED CONCRETE FLOOR SYSTEMS
 EXPERIMENTAL INVESTIGATION ON THE INTERACTION OF REINFORCED CONCRETE FRAMES WITH PRECAST-PRESTRESSED CONCRETE FLOOR SYSTEMS B.H.H. Peng 1, R.P. Dhakal 2, R.C. Fenwick 3, A.J. Carr 4 and D.K. Bull 5 1 PhD
Punching Shear Resistance of Flat Slabs By Shear Heads
 International Journal Of Engineering Research And Development e-issn: 2278-067X, p-issn: 2278-800X, www.ijerd.com Volume 13, Issue 11 (November 2017), PP.47-66 Punching Shear Resistance of Flat Slabs By
BEHAVIOR OF INFILL MASONRY WALLS STRENGTHENED WITH FRP MATERIALS
 BEHAVIOR OF INFILL MASONRY WALLS STRENGTHENED WITH FRP MATERIALS D.S. Lunn 1,2, V. Hariharan 1, G. Lucier 1, S.H. Rizkalla 1, and Z. Smith 3 1 North Carolina State University, Constructed Facilities Laboratory,
CHAPTER 3 BEHAVIOUR OF FERROCEMENT HOLLOW SLABS
 30 CHAPTER 3 BEHAVIOUR OF FERROCEMENT HOLLOW SLABS 3.1 INTRODUCTION There are numerous similarities between ferrocement and reinforced concrete. Both use similar matrix and reinforcement materials. They
7.1 Transmission of Prestress (Part I)
") 7.1 Transmission of Prestress (Part I) This section covers the following topics. Pre-tensioned Members 7.1.1 Pre-tensioned Members The stretched tendons transfer the prestress to the concrete leading to
7.1 Transmission of Prestress (Part I) This section covers the following topics. Pre-tensioned Members 7.1.1 Pre-tensioned Members The stretched tendons transfer the prestress to the concrete leading to
Behavior and Strength of Slab-Edge Beam-Column Connections under Shear Force and Moment
 Behavior and Strength of Slab-Edge Beam-Column Connections under Shear Force and Moment Omar M. Ben-Sasi Abstract A total of fourteen slab-edge beam-column connection specimens were tested gradually to
INFLUENCE OF PRSTRESS LEVEL ON SHEAR BEHAVIOR OF SEGMENTAL CONCRETE BEAMS WITH EXTERNAL TENDONS
 - Technical Paper - INFLUENCE OF PRSTRESS LEVEL ON SHEAR BEHAVIOR OF SEGMENTAL CONCRETE BEAMS WITH EXTERNAL TENDONS Dinh Hung NGUYEN *1, Ken WATANABE *2, Junichiro NIWA *3 and Tsuyoshi HASEGAWA *4 ABSTRACT
Lap Splices in Tension Between Headed Reinforcing Bars And Hooked Reinforcing Bars of Reinforced Concrete Beam
 IOSR Journal of Mechanical and Civil Engineering (IOSR-JMCE) e-issn: 2278-1684,p-ISSN: 232-334X, Volume 13, Issue 3 Ver. I (May- Jun. 216), PP 71-75 www.iosrjournals.org Lap Splices in Tension Between
Seismic Detailing of RC Structures (IS: )
") Seismic Detailing of RC Structures (IS:13920-1993) Sudhir K Jain Indian Institute of Technology Gandhinagar November 2012 1 Outline This lecture covers: Covers important clauses of IS13920 With particular
Seismic Detailing of RC Structures (IS:13920-1993) Sudhir K Jain Indian Institute of Technology Gandhinagar November 2012 1 Outline This lecture covers: Covers important clauses of IS13920 With particular
One-Way Wide Module Joist Concrete Floor Design
 One-Way Wide Module Joist Concrete Floor Design A 1 3 4 30'-0" 30'-0" 30'-0" 3' B 3' C 3' D 3' E 4" 4" (typ.) 3' F 0" 0" (typ.) Figure 1 One-Way Wide Module Joist Concrete Floor Framing System 1 Overview
Torsion. Design of Reinforced Concrete Structures I
 Design of Reinforced Concrete Structures I Torsion Table of Contents 6.1 Introducon... 1 6.2 Torsional Stresses... 2 6.3 When Torsional Reinforcing Is Required by the ACI... 4 6.4 Torsional Moment Strength...
Ce 479 Reinforced Masonry Fall 2005
 INTRODUCTION TO STRUCTURAL DESIGN OF REINFORCED MASONRY In the preceding lecture on structural design of masonry, we have seen examples of unreinforced masonry bearing walls. In bearing walls, when the
10.5 ECCENTRICALLY LOADED COLUMNS: AXIAL LOAD AND BENDING.
 13 10.5 ECCENTRICALLY LOADED COLUMNS: AXIAL LOAD AND BENDING. Members that are axially, i.e., concentrically, compressed occur rarely, if ever, in buildings and other structures. Components such as columns
Crossroads at Westfields Building II
 Crossroads at Westfields Building II Chantilly, Va STEPHEN LUMPP Structural option Faculty Consultant: Dr. Andres Lepage Technical Report 2 EXECUTIVE SUMMARY This report is a study of alternate floor systems
CHAPTER 1 INTRODUCTION
 1 CHAPTER 1 INTRODUCTION 1.1 GENERAL Till the 1960s the design engineers generally ignored torsion. It was assumed that torsion effects were minor and could be taken care of by the large safety factor
BOND BEHAVIOR OF MMFX (ASTM A 1035) REINFORCING STEEL
 REINFORCING STEEL") BOND BEHAVIOR OF MMFX (ASTM A 1035) REINFORCING STEEL A Summary Report Of a Cooperative Research Program Phase I Submitted to MMFX Technologies Corporation Irvine, California by Hatem M. Seliem, Arm Hosny,
BOND BEHAVIOR OF MMFX (ASTM A 1035) REINFORCING STEEL A Summary Report Of a Cooperative Research Program Phase I Submitted to MMFX Technologies Corporation Irvine, California by Hatem M. Seliem, Arm Hosny,
PRESTRESSED CONCRETE STRUCTURES. Amlan K. Sengupta, PhD PE Department of Civil Engineering Indian Institute of Technology Madras
 PRESTRESSED CONCRETE STRUCTURES Amlan K. Sengupta, PhD PE Department of Civil Engineering Indian Institute of Technology Madras Module 5: Analysis and Design for Shear and Torsion Lecture-24: Design for
FRP Shear Transfer Mechanism for Precast Prestressed Concrete Sandwich Load Bearing Panels. Sami Rizkalla, Tarek Hassan and Gregory Lucier
 FRP Shear Transfer Mechanism for Precast Prestressed Concrete Sandwich Load Bearing Panels Sami Rizkalla, Tarek Hassan and Gregory Lucier Synopsis: This paper describes the structural behavior of precast
ABSTRACT. RAGAN, DAVID MICHAEL. Behavior of Efficient Two Story Precast Concrete Wall Panels. (Under the direction of Dr.
 ABSTRACT RAGAN, DAVID MICHAEL. Behavior of Efficient Two Story Precast Concrete Wall Panels. (Under the direction of Dr. Sami Rizkalla) Precast concrete panels are utilized by engineers in order to create
Sabah Shawkat Cabinet of Structural Engineering 2017
 3.1-1 Continuous beams Every building, whether it is large or small, must have a structural system capable of carrying all kinds of loads - vertical, horizontal, temperature, etc. In principle, the entire
APPENDIX B. LOAD FRAME. This Appendix will describe the philosophy in the design and operation of the loading system.
 APPENDIX B. LOAD FRAME This Appendix will describe the philosophy in the design and operation of the loading system. LOAD FRAME The large-scale gusset plate testing required a unique loading fixture. A
STRUCTURAL PERFORMANCE OF STEEL-CONCRETE-STEEL SANDWICH COMPOSITE BEAMS WITH CHANNEL STEEL CONNECTORS
 Transactions, SMiRT-22 STRUCTURAL PERFORMANCE OF STEEL-CONCRETE-STEEL SANDWICH COMPOSITE BEAMS WITH CHANNEL STEEL CONNECTORS Meng Chu 1, Xiaobing Song 2, Honghui Ge 3 1 Senior Engineer, Shanghai nuclear
VARIOUS TYPES OF SLABS
 VARIOUS TYPES OF SLABS 1 CHOICE OF TYPE OF SLAB FLOOR The choice of type of slab for a particular floor depends on many factors. Economy of construction is obviously an important consideration, but this
1 Exam Prep Placing Reinforcing Bars Tabs and Highlights
 1 Exam Prep Placing Reinforcing Bars Tabs and s These 1 Exam Prep Tabs are based on the CRSI Placing Reinforcing Bars Recommended Practices, 9 th Edition. Each 1 Exam Prep tabs sheet has five rows of tabs.
Interior Hangers. Application
 Application Interior bridge deck hangers are typically fabricated using two heavy duty sheet metal end clips that have been electrically resistance welded to an appropriate sized wire or formed metal connecting
Chapter Five Torsion. Reinforced Concrete Structures 2 (CEng-3122)
") Reinforced Concrete Structures 2 (CEng-3122) Chapter Five Torsion 1 School of Civil and Environmental Engineering Concrete Material and Structures Chair 2 1. Introduction 2. Torsional Resistance 3. Analysis
Reinforced Concrete Structures 2 (CEng-3122) Chapter Five Torsion 1 School of Civil and Environmental Engineering Concrete Material and Structures Chair 2 1. Introduction 2. Torsional Resistance 3. Analysis
Strength Design of Reinforced Concrete Structures
 Chapter 6 Strength Design of Reinforced Concrete Structures 6.1 Analysis and Design General Considerations 6.1.1 Convention and Notation Unless otherwise explicitly stated, the following units shall be
Design of Spandrel Beams
 . Specially Funded R&D Program PCISFRAD Project No. 5 Summary Paper Design of Spandrel Beams by Gary J. Klein Consultant bliss, Janney, Elstner Associates, Inc. Northbrook, Illinois Note: This summary
USE OF HEADED BARS AS SHEAR REINFORCEMENT
 USE OF HEADED BARS AS SHEAR REINFORCEMENT By Remy Lequesne, Matthew O Reilly, David Darwin, Andres Lepage, Abdalkader Al-Sabawy, Eduardo Guillen, Donald Spradling A Report on Research Sponsored by Electric
USE OF 500 GRADE STEEL IN THE DESIGN OF REINFORCED CONCRETE SLAB. Prof. M. Shafiul Bari, Ph.D Department of Civil Engg., BUET
 1.0 Introduction USE OF 500 GRADE STEEL IN THE DESIGN OF REINFORCED CONCRETE SLAB Prof. M. Shafiul Bari, Ph.D Department of Civil Engg., BUET There is growing interest within the reinforced concrete industry
FLEXURAL AND SHEAR STRENGTHENING OF REINFORCED CONCRETE STRUCTURES WITH NEAR SURFACE MOUNTED FRP RODS
 FLEXURAL AND SHEAR STRENGTHENING OF REINFORCED CONCRETE STRUCTURES WITH NEAR SURFACE MOUNTED FRP RODS ABSTRACT The use of Near Surface Mounted (NSM) Fiber Reinforced Polymer (FRP) rods is a new and promising
Strengthening of RC Beams subjected to Combined Torsion and Bending with GFRP Composites
 Available online at www.sciencedirect.com Procedia Engineering 51 ( 2013 ) 282 289 Chemical, Civil and Mechanical Engineering Tracks of 3 rd Nirma University International Conference on Engineering (NUiCONE
EMBEDDED STRUCTURAL STEEL CONNECTIONS
 EMBEDDED STRUCTURAL STEEL CONNECTIONS Charles H. Raths President Raths, Raths & Johnson, Inc. Structural Engineers Hinsdale, Illinois Design application of the "PCI Manual on Design of Connections for
Structural Technical Report 1 Structural Concepts / Existing Conditions
 Chris Shelow Structural Advisor: M. Kevin Parfitt Koshland Integrated Natural Science Center 10/05/05 AE 481W Structural Technical Report 1 Structural Concepts / Existing Conditions Executive Summary The
Development of Lap Splices Using Headed Reinforcement. Antonio Lopez Ledesma, B.S.C.E. Thesis. Master of Science in Engineering
 Development of Lap Splices Using Headed Reinforcement by Antonio Lopez Ledesma, B.S.C.E. Thesis Presented to the Faculty of the Graduate School of The University of Texas at Austin in Partial Fulfillment
ST7008 PRESTRESSED CONCRETE
 ST7008 PRESTRESSED CONCRETE QUESTION BANK UNIT-I PRINCIPLES OF PRESTRESSING PART-A 1. Define modular ratio. 2. What is meant by creep coefficient? 3. Is the deflection control essential? Discuss. 4. Give
Ensuring sufficient robustness to resist
 Performance of precast concrete moment frames subjected to column removal: Part 2, computational analysis Yihai Bao, Joseph A. Main, H. S. Lew, and Fahim Sadek This paper presents a computational study
Interaction between ductile RC perimeter frames and floor slabs containing precast units
 Interaction between ductile RC perimeter frames and floor slabs containing precast units R. C Fenwick,. J. Davidson and D.. N. Lau Department of Civil and Environmental Engineering, University of uckland.
Ductile Detailing for Earthquake Resistant R C Structures. Dr. S. K. PRASAD Professor of Civil Engineering S.J. College of Engineering Mysore
 Ductile Detailing for Earthquake Resistant R C Structures Dr. S. K. PRASAD Professor of Civil Engineering S.J. College of Engineering Mysore 570 006 1 Ductile Detailing Objective To provide adequate toughness
ten reinforced concrete construction Concrete Concrete Materials Concrete Construction columns beams slabs domes footings
 APPLIED ACHITECTURAL STRUCTURES: STRUCTURAL ANALYSIS AND SYSTEMS DR. ANNE NICHOLS SPRING 018 lecture ten Concrete columns beams slabs domes ootings http://nisee.berkeley.edu/godden reinorced concrete construction
Design and analysis of T and inverted L beams- Theory and Examples
 Design and analysis of T and inverted L beams- Theory and Examples - Dr. E. R. Latifee Reference Book: Design of Reinforced Concrete by Jack C. McCormac and Russell H. Brown, Clemson University, 9 th Edition,
PRESTRESSED CONCRETE STRUCTURES. Amlan K. Sengupta, PhD PE Department of Civil Engineering Indian Institute of Technology Madras
 PRESTRESSED CONCRETE STRUCTURES Amlan K. Sengupta, PhD PE Department of Civil Engineering Indian Institute of Technology Madras Module 7: Transmission of Prestress Lecture 30: Pre-tensioned Members Welcome
Office Building-G. Thesis Proposal. Carl Hubben. Structural Option. Advisor: Dr. Ali Memari
 Office Building-G Thesis Proposal Structural Option December 10, 2010 Table of Contents Executive Summary... 3 Introduction... 4 Gravity System...4 Lateral System:...6 Foundation System:...6 Problem Statement...
Analysis and Design of Steel
 Analysis and Design of Steel and Composite Structures Qing Quan Liang CRC Press Taylor & Francis Croup Boca Raton London New York CRC Press is an imprint of the Taylor & Francis Croup, an informa business
CHAPTER III DYNAMIC BEHAVIOR OF A LABORATORY SPECIMEN
 CHAPTER III DYNAMIC BEHAVIOR OF A LABORATORY SPECIMEN To address the vibration response of a long span deck floor system, an experiment using a specimen that resembles the conditions found in the in-situ