Cross-Sections DO Concentration (mg/l) High Tide 9/11/2007. Prepared by: LRP 8/10/09 Checked db by: TRK 8/10/09
|
|
|
- Jeremy Clark
- 6 years ago
- Views:
Transcription


1 Prepared by: LRP 8/10/09 Checked db by: TRK 8/10/09 / SAVANNAH HARBOR REOXYGENATION DEMONSTRATION PROJECT GEORGIA PORTS AUTHORITY SAVANNAH, GEORGIA Cross-Sections DO Concentration (mg/l) High Tide 9/11/2007 Project Number: Figure: 3.49


2 Prepared by: LRP 8/10/09 Checked db by: TRK 8/10/09 / SAVANNAH HARBOR REOXYGENATION DEMONSTRATION PROJECT GEORGIA PORTS AUTHORITY SAVANNAH, GEORGIA Cross-Sections DO Concentration (mg/l) High Tide 9/18/2007 Project Number: Figure: 3.50


3 Prepared by: LRP 8/10/09 Checked db by: TRK 8/10/09 / SAVANNAH HARBOR REOXYGENATION DEMONSTRATION PROJECT GEORGIA PORTS AUTHORITY SAVANNAH, GEORGIA Cross-Sections Salinity (ppt) High Tide 7/17/2007 Project Number: Figure: 3.51


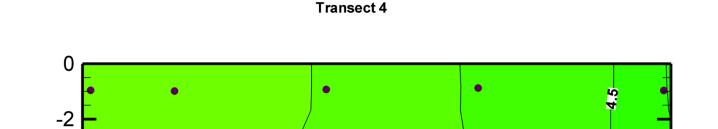
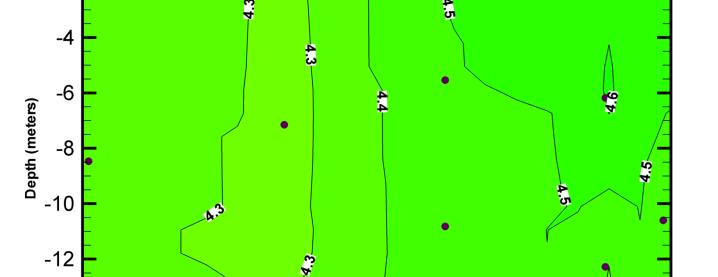
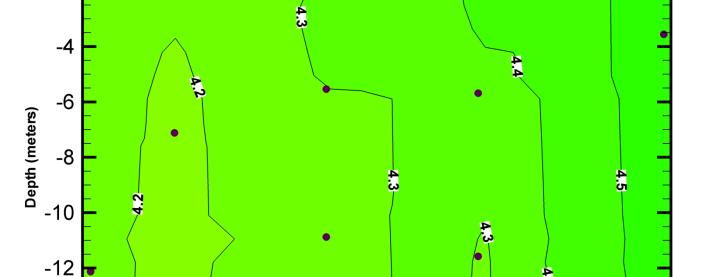
4 Prepared by: LRP 8/10/09 Checked db by: TRK 8/10/09 / SAVANNAH HARBOR REOXYGENATION DEMONSTRATION PROJECT GEORGIA PORTS AUTHORITY SAVANNAH, GEORGIA Cross-Sections Salinity (ppt) High Tide 8/13/2007 Project Number: Figure: 3.52


5 Prepared by: LRP 8/10/09 Checked db by: TRK 8/10/09 / SAVANNAH HARBOR REOXYGENATION DEMONSTRATION PROJECT GEORGIA PORTS AUTHORITY SAVANNAH, GEORGIA Cross-Sections Salinity (ppt) High Tide 8/28/2007 Project Number: Figure: 3.53


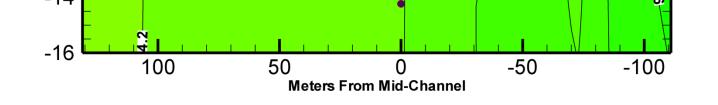
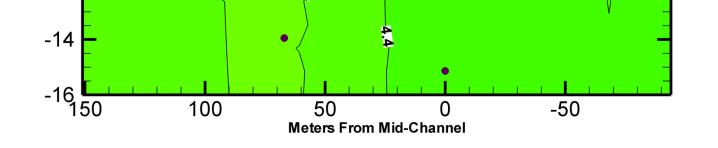
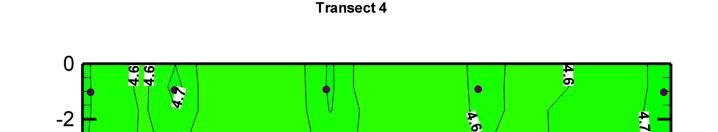
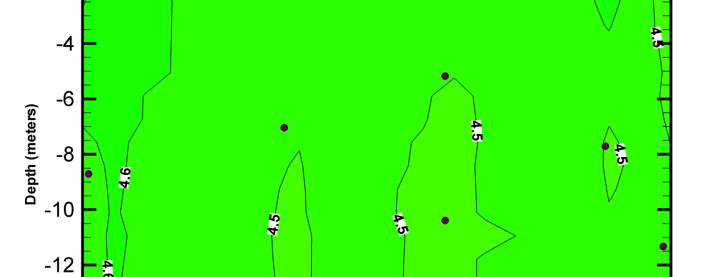
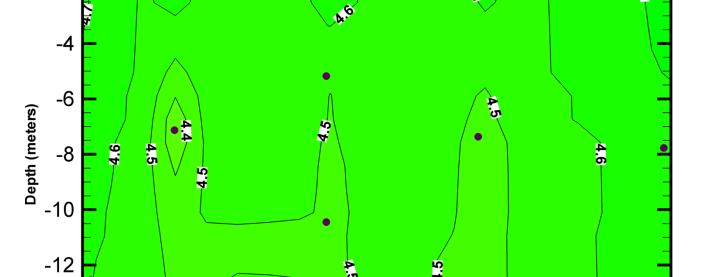
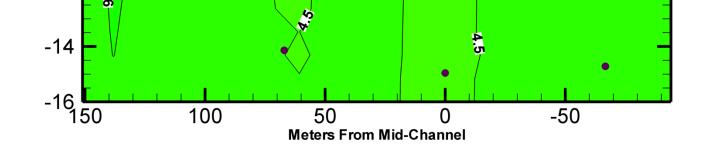
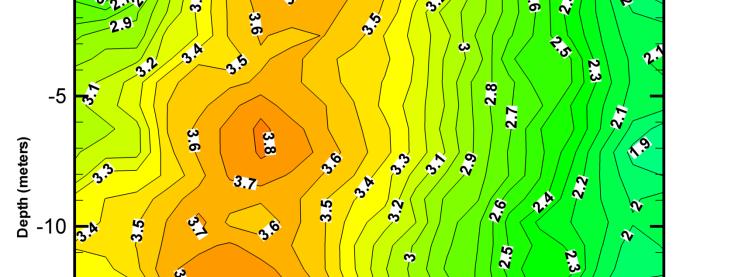
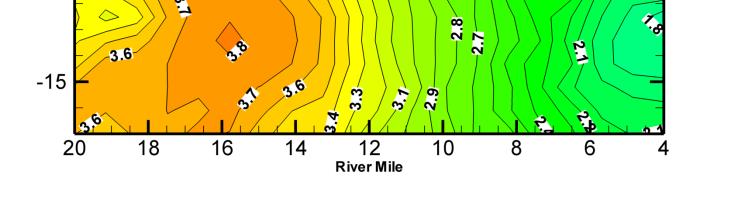
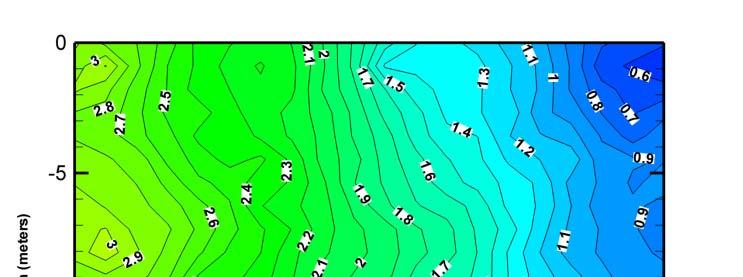
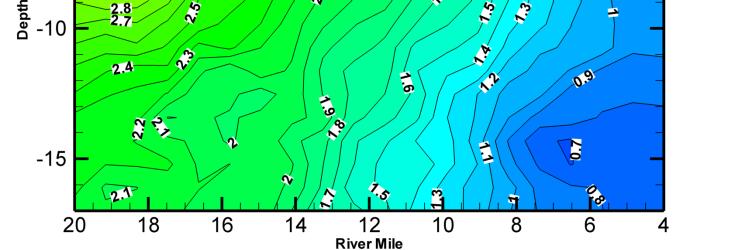
6 Prepared by: LRP 8/10/09 Checked db by: TRK 8/10/09 / SAVANNAH HARBOR REOXYGENATION DEMONSTRATION PROJECT GEORGIA PORTS AUTHORITY SAVANNAH, GEORGIA Cross-Sections Salinity (ppt) High Tide 9/11/2007 Project Number: Figure: 3.54

 High Tide 9/18/2007 Project Number: 6110080064")
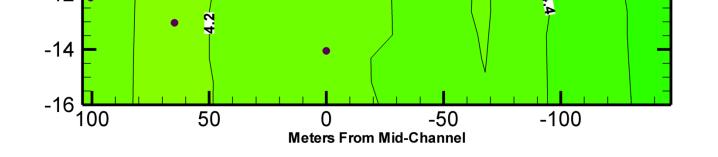
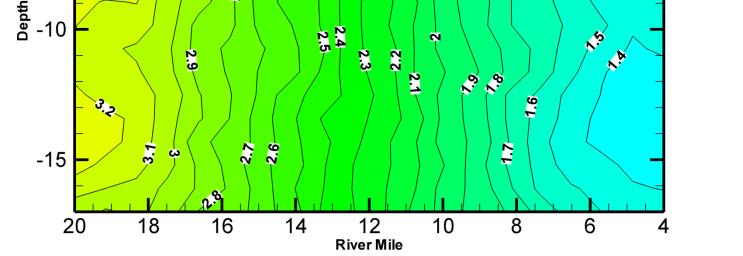
7 Prepared by: LRP 8/10/09 Checked db by: TRK 8/10/09 / SAVANNAH HARBOR REOXYGENATION DEMONSTRATION PROJECT GEORGIA PORTS AUTHORITY SAVANNAH, GEORGIA Cross-Sections Salinity (ppt) High Tide 9/18/2007 Project Number: Figure: 3.55


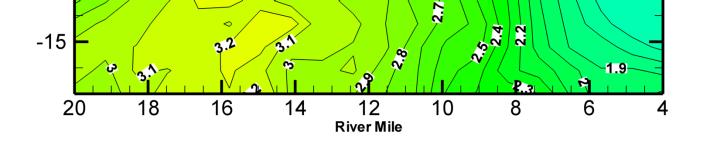
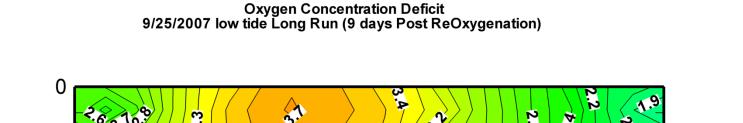
8 LOW TIDE HIGH TIDE Prepared by: NTG 11/16/07 Checked by: JTP 11/16/07 SAVANNAH HARBOR REOXYGENATION DEMONSTRATION PROJECT GEORGIA PORTS AUTHORITY SAVANNAH, GEORGIA Mid-channel DO Deficit (mg/l) Low and High Tide Long Run Events Project Number: Figure: 3.56


9 08/06/07 09/04/07 Average DO Deficit = 3.91 mg/l Average DO Deficit = 3.56 mg/l Prepared by: LRP 1/14/09 Checked by: TRK 1/14/09 SAVANNAH HARBOR REOXYGENATION DEMONSTRATION PROJECT GEORGIA PORTS AUTHORITY SAVANNAH, GEORGIA Mid-Channel Profiles Similar Salinity and Tide Range Comparison Project Number: Figure 3.57


 Similar")

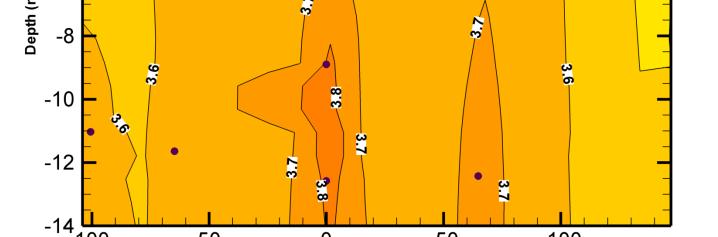
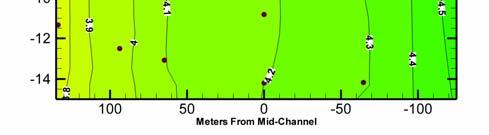
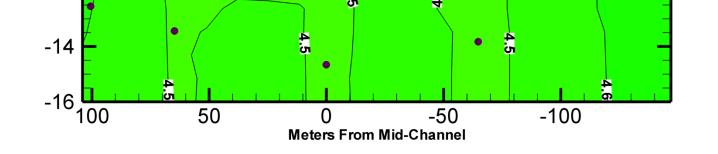
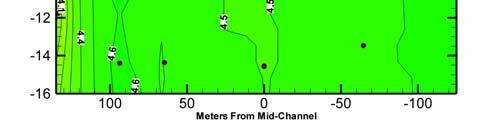
10 Average Point DO Deficit = 3.88 mg/l Average Point DO Deficit = 3.81 mg/l Average Point DO Deficit = 3.94 mg/l Average Point DO Deficit = 3.83 mg/l Average Point DO Deficit = 3.84 mg/l Prepared by: LRP 1/14/09 Checked by: TRK 1/14/09 River Segment Average = 3.86 mg/l SAVANNAH HARBOR REOXYGENATION DEMONSTRATION PROJECT GEORGIA PORTS AUTHORITY SAVANNAH, GEORGIA Cross-Sections Low Tide 8/07/2007 DO Deficit (mg/l) Similar Salinity and Tidal Range Comparison Project Number: Figure 3.58A


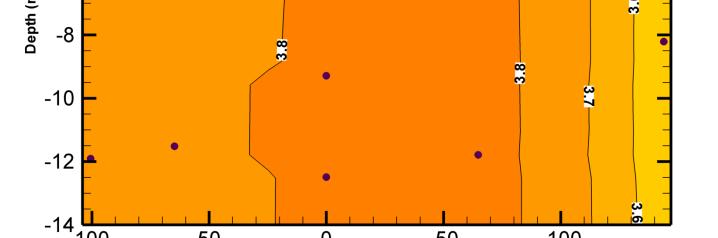
11 Average Point DO Deficit = 3.74 mg/l Average Point DO Deficit = 3.33 mg/l Average Point DO Deficit = 3.54 mg/l Average Point DO Deficit = 3.75mg/L Average Point DO Deficit = 3.37 mg/l Prepared by: LRP 1/14/09 Checked by: TRK 1/14/09 River Segment Average = 3.55 mg/l SAVANNAH HARBOR REOXYGENATION DEMONSTRATION PROJECT GEORGIA PORTS AUTHORITY SAVANNAH, GEORGIA Cross-Sections Low Tide 9/5/2007 DO Deficit (mg/l) Similar Salinity and Tidal Range Comparison Project Number: Figure 3.58B
12 ter Temperature (C) Wat Spcecifc Conductivity (ms/m) Temperature Savannah River Temperature Cooper River Specific Conductivity Savannah River Specific Conductivity Cooper River Dissolved Oxygen Savannah River Dissolved Oxygen Cooper River Diss solved Oxygen (mg/l) /8/07 0:00 4/28/07 0:00 5/18/07 0:00 6/7/07 0:00 6/27/07 0:00 7/17/07 0:00 8/6/07 0:00 8/26/07 0:00 9/15/07 0:00 10/5/07 0:00 10/25/07 0:00 Time/Date SAVANNAH HARBOR REOXYGENATION DEMONSTRATION PROJECT GEORGIA PORTS AUTHORITY SAVANNAH, GEORGIA 2007 Savannah River and Cooper River Comparison Project Number: Figure 3.59
13 APPENDICES
14 APPENDIX A SAVANNAH HARBOR REOXYGENATION MULTIPLE LINEAR REGRESSION ANALYSIS
15 APPENDIX A SAVANNAH HARBOR REOXYGENATION MULTIPLE LINEAR REGRESSION ANALYSIS The method of multiple linear regression was used to investigate the interrelations of several measured parameters of the Savannah River to determine the feasibility of using these measurements to predict dissolved oxygen concentrations. This predicted value would then be used to estimate the effects of the addition of oxygen to the water by supplying an expected value (derived from factors other than the addition) to compare the actual measured values with addition of oxygen. Multiple Linear Regression Multiple linear regression (MLR) is a statistical method of predicting a response (dependent variable) from more than one input value (independent variables). It is directly related to the more common linear regression or least-squares line fit which predicts the dependent variable from a single independent variable ( y from x ). Best Model Determination Unlike simple linear regression with one independent and one dependent variable, MLR offers models with various combinations of the multiple independent variables. For instance, if one has a system with three independent variables X1, X2, and X3, then there are seven models possible: (X1, X2, X3), (X1, X3), (X1, X2), (X2, X3), (X1), (X2), (X3). The last three are really just simple linear regressions of individual independent variables, but are also part of the MLR framework. Since each additional variable added to the regression adds predictive power, it would seem logical to add as many variables to the model as possible and simply go with this longest model. Unfortunately, additional variables also have a negative effect by adding their noise to the mix. Intuitively, adding a variable with no interaction to the underlying relationship will add nothing to the regression model, so additional variables should be added only when they have something to contribute to the regression model. Fortunately, there is a class of methods that can be used to identify when a variable adds more to the predictive value of a regression model than it subtracts with its own noise. Best know of these is the Akaike Information Criterion (AIC). Using this metric, one can compare the predictive power of MLR models with different mixes of independent variables and identify which among them has the best information content the most predictive power with the least amount of individual variable s noise. The A-1
16 AIC rates each model in a group the model with the lowest AIC is the best model within that group, but models with similar AICs are almost equally as good. A difference of 2 points in a pair of AICs is not considered significant. Savannah River MLR This MLR was developed to predict expected oxygen concentration deficits (with no oxygen addition treatment) for comparison to actual measurements of oxygen concentration deficits with the addition treatment. Dissolved oxygen concentration deficits are the difference between the actual dissolved oxygen concentration and the theoretical saturated oxygen concentration. It is easier to interpret because variations in oxygen concentration simply due to temperature changes, salinity changes, and other factors can be eliminated. The MLR was developed with data before oxygen was added to the system (before 8/5/2007). Since the river is not a homogeneous system, models for each of two stations (US Army Corps of Engineers dock and Georgia Port Authority location) for three different depths (shallow, mid, and deep) were developed. The same independent variables were considered for each location and depth tidal range, temperature, and salinity. These independent variables were combined in various permutations into the following candidate models: Tidal Range, Temperature, and Salinity Tidal Range and Temperature Tidal Range and Salinity Temperature and Salinity Tidal Range Temperature Salinity The dependent variable was dissolved oxygen concentration deficit in all candidate models. The best prediction model for DO deficit was chosen based on the Akaike Information Criterion (AIC). Best Model Predictions and Interpretations Once a best model was chosen for a station and depth, the model was then used to predict expected DO deficits (with no additional oxygen addition). This predicted value was compared to actual measured A-2
17 values at various times before, during, and after the oxygen addition and the difference between predicted and measured values was determined (the residual a statistical term having no relation to any chemical analysis of oxygen residual ). These residuals were then time-plotted for visual examination for trends and graphed as box-and-whisker plots, grouped by before, during and after to visually examine for trends in the groups. Results for Individual Locations and Depths USACE Shallow Depth In this location, salinity played a peripheral role in enhancing predictive power. The most efficient model (as determined by the lowest relative AIC) was the model including tidal range and temperature. Adding salinity did not greatly improve the model s predictive ability (multiple r-squared did not change) so the AIC increased. Site Model Parameters USACE Shallow Depth Tidal Range Temp Salinity Multiple R 2 AIC USACES x x x USACES x x USACES x x USACES x x USACES x USACES x USACES x Best model: Tidal Range and Temperature Yellow indicates the model is probably not significantly worse than the model chosen After calculating the residuals and plotting them against periods (and highlighting when reoxygenation began and ended) the following chart is produced. It appears the residuals increase once reoxygenation begins, but decrease at the end of the reoxygenation period and increase again after reoxygenation ends. A-3
18 USACES DO Deficit Prediction Error (measured - predicted) by day Best Model Jul 7-Jul 12-Jul 17-Jul 22-Jul 27-Jul 1-Aug 6-Aug 11-Aug 16-Aug 21-Aug 26-Aug 31-Aug 5-Sep 10-Sep 15-Sep 20-Sep 25-Sep Reoxygenation begins Reoxygenation Ends Looking next at box-and-whisker plots of the residuals to examine group behavior, we see the before (b) and after (a) reoxygenation groups are significantly different (the median line in the box does not overlap the box of the other group), while both before and after are not significantly different from during (d). A-4
19 USACE Mid Depth In this location, temperature played the major role in predictive power. The most efficient model (as determined by the lowest relative AIC) was the model including just the temperature. Adding salinity or tidal range individually did not greatly improve the model s predictive ability (multiple r-squared did not change much) so the AICs increased. Site Model Parameters - USACE Mid Depth Tidal Range Temp Salinity Multiple R2 AIC USACEM x x x USACEM x x USACEM x x USACEM x x USACEM x USACEM x USACEM x Best Model: Temperature only Again, after calculating the residuals and plotting them against time periods (and highlighting when reoxygenation began and ended) the following chart is produced. It appears the residuals do not change much before and during reoxygenation, decreasing somewhat at the end of the reoxygenation period. Data was too sparse after the reoxygenation period to assess trends. USACEM DO Deficit Prediction Error (measured - predicted) by day Best Model Jul 7-Jul 12-Jul 17-Jul 22-Jul 27-Jul 1-Aug 6-Aug 11-Aug 16-Aug 21-Aug 26-Aug 31-Aug 5-Sep 10-Sep 15-Sep 20-Sep 25-Sep Reoxygenation Begins Reoxygenation Ends A-5
20 Looking next at box-and-whisker plots of the residuals to examine group behavior, we see the before (b) and during (d) reoxygenation groups are not significantly different, while data after reoxygenation (a) are not sufficient for meaningful comparisons. A-6
21 USACE Deep Depth In this location, tidal range and temperature played the major roles in predictive power. The most efficient model was the model including the temperature and tidal range. Adding salinity did not greatly improve the model s predictive ability (multiple r-squared did not change much). Model Parameters USACE Deep Depth Site Tidal Range Temp Salinity Multiple R 2 AIC USACED x x x USACED x x USACED x x USACED x x USACED x USACED x USACED x Best Model: Tidal Range and Temperature Calculating the residuals and plotting them against time periods (and highlighting when reoxygenation began and ended) the following chart is produced. Much like the shallow depth, it appears the residuals increase once reoxygenation begins, but decrease at the end of the reoxygenation period and may increase again after reoxygenation ends. USACED DO Deficit Prediction Error (measured - predicted) by day Best Model Jul 7-Jul 12-Jul 17-Jul 22-Jul 27-Jul 1-Aug 6-Aug 11-Aug 16-Aug 21-Aug 26-Aug 31-Aug 5-Sep 10-Sep 15-Sep 20-Sep 25-Sep 30-Sep Reoxygenation Begins Reoxygenation Ends A-7
22 Looking next at box-and-whisker plots of the residuals to examine group behavior, we see the before (b) and during (d) reoxygenation groups are significantly different with before being less than during, while data after reoxygenation (a) are significantly lower than both other groups. A-8
23 GPA Shallow Depth In this location, salinity played a peripheral role in enhancing predictive power. The most efficient model (as determined by the lowest relative AIC) was the model including tidal range and temperature just as in the USACE shallow location. Again, adding salinity did not greatly improve the model s predictive ability (multiple r-squared did not change) so the AIC increased. Site Model Parameters GPA Shallow Depth Tidal Range Temp Salinity Multiple R 2 AIC GPAS x x x GPAS x x GPAS x x GPAS x x GPAS x GPAS x GPAS x Best Model: Tidal Range and Temperature Calculating the residuals and plotting them against time periods (and highlighting when reoxygenation began and ended) the following chart is produced. It appears the residuals increase once reoxygenation begins, but decrease at the end of the reoxygenation period and may increase again after reoxygenation ends. GPAS DO Deficit Prediction Error (measured - predicted) by day Best Model Jul 7-Jul 12-Jul 17-Jul 22-Jul 27-Jul 1-Aug 6-Aug 11-Aug 16-Aug 21-Aug 26-Aug 31-Aug 5-Sep 10-Sep 15-Sep 20-Sep 25-Sep Reoxygenation Begins Reoxygenation Ends A-9
24 Looking next at box-and-whisker plots of the residuals to examine group behavior, we see there are no significant differences among the groups. A-10
25 GPA Mid Depth In this location n this location, tidal range and salinity played the major role in predictive power. The most efficient model (as determined by the lowest relative AIC) was the model including tidal range and salinity. Adding temperature or removing salinity did not greatly improve the model s predictive ability (multiple r-squared did not change) so the AIC increased Site Model Parameters - GPA Mid Depth Tidal Range Temp Salinity Multiple R2 AIC GPAM x x x GPAM x x GPAM x x GPAM x x GPAM x GPAM x GPAM x Best Model: Tidal Range and Salinity Calculating the residuals and plotting them against time periods (and highlighting when reoxygenation began and ended) the following chart is produced. Much like the USACE mid depth, the residuals do not change much before and during reoxygenation, perhaps decreasing somewhat at the end of the reoxygenation period. There was also no clear difference after the reoxygenation period. GPAM DO Deficit Prediction Error (measured - predicted) by day Best Model Jul 7-Jul 12-Jul 17-Jul 22-Jul 27-Jul 1-Aug 6-Aug 11-Aug 16-Aug 21-Aug 26-Aug 31-Aug 5-Sep 10-Sep 15-Sep 20-Sep 25-Sep 30-Sep Reoxygenation Begins Reoxygenation Ends A-11
26 Looking next at box-and-whisker plots of the residuals to examine group behavior, we see there are no significant differences among the groups. A-12
27 GPA Deep Depth In this location, salinity played the major roles in predictive power. The most efficient model was the model including the temperature and tidal range. Adding the other parameters (singly or in combination) did not greatly improve the model s predictive ability (multiple r-squared did not change much). Best Model: Salinity Model Parameters - GPA Deep Depth Site Tidal Range Temp Salinity Multiple R2 AIC GPAD x x x GPAD x x GPAD x x GPAD x x GPAD x GPAD x GPAD x Calculating the residuals and plotting them against time periods (and highlighting when reoxygenation began and ended) the following chart is produced. The residuals do not change much before and during reoxygenation, perhaps decreasing somewhat at the end of the reoxygenation period. There was a decrease after the reoxygenation period. GPAD DO Deficit Prediction Error (measured - predicted) by day Best Model Jul 7-Jul 12-Jul 17-Jul 22-Jul 27-Jul 1-Aug 6-Aug 11-Aug 16-Aug 21-Aug 26-Aug 31-Aug 5-Sep 10-Sep 15-Sep 20-Sep 25-Sep 30-Sep Reoxygenation Begins Reoxygenation Ends A-13
28 Looking next at box-and-whisker plots of the residuals to examine group behavior, we see there are no significant differences between before and during but a significant difference in the after group. A-14
29 Conclusions Due to the complexity of the river system a multiple linear regression (MLR) was used to investigate the interrelations of several measured parameters of the Savannah River to determine the feasibility of using these measurements to predict DO concentrations. The data compared included the tidal range, temperature, and salinity measured in the river system. The MLR method statistically predicted a dependent variable from more than one input value. The MLR method statistically predicted an overall effect at the USACE and GPA locations mostly dependant on tidal range. Deep monitoring locations predicted an influenced effect from temperature and tidal range at USACE and mostly a salinity effect at GPAD. Based on this MLR analysis of the continuous near-shore monitoring data, the MLR analysis does not provide a useful means to directly quantify the relatively small expected DO effects of supplemental oxygenation during the demonstration period. A-15
30 APPENDIX B SAVANNAH HARBOR REOXYGENATION SIGNAL-TO-NOISE RATIO ANALYSIS
31 APPENDIX B: SIGNAL-TO-NOISE RATIO AND THE ABILITY TO DISCERN A SIGNAL In an ideal world, every measurement taken would be perfect and without error or noise. In the real world, neither of these are true. Error can be minimized by careful sampling and analysis, but noise is a random, uncontrollable haze that obscures all measurements to one degree or another. The standard measure of this level of obfuscation is called the signal-to-noise ratio (SN). Measurements with a large SN are easy to deal with since the noise is a small fraction of the measured value sometimes a vanishingly small fraction. On the other hand, if the SN is small, the noise may be as large as the actual signal and the resulting measurements are nearly random noise and impossible to interpret. How small is too small? Physicist Albert Rose developed the Rose Criteria to quantify this. This criteria states the SN must be greater than 5 for all features of the signal to be detected with 100 percent certainty. This criterion was developed for electronic imaging processing, but has general signal processing applicability. In short, if the magnitude of the noise is greater than 20 percent of the magnitude of the signal, then not everything in the signal can be extracted. If the SN is much less than 5, very little of the actual signal can be seen. Application of SN to Savannah River Oxygen Addition During the Savannah River experiment oxygen was added to the river water and the change in oxygen concentration was measured. To measure the effect, it is necessary to ask Is there likely enough signal generated to overcome the inherent noise of measurement and inherent noisy variability within a tidallyinfluenced river environment? Calculating a SN can address this question. To generate a SN, one needs a measure of the signal strength and a measure of the noise strength. One method to estimate signal strength is to model the known processes while ignoring noise-producing processes. (Since noise-producing processes are usually unknown, they are seldom modeled. Most models produce a clean signal that can be used as a best-case estimate of signal strength.) This system has already been modeled (with and without oxygen addition) by TetraTech (2009), so estimates of signal strength can be easily determined from that model. An estimate of noise is a little more difficult to make. Since duplicate samples are not available, instantaneous differences in measurements cannot be used to estimate noise. However, regularly scheduled samples are available and an estimate of variability at time = 0 can be generated from B-1
32 semivariogram analysis commonly used in geostatistics (substituting time steps for distance lags). Average squared differences of measurements taken at a set timelag apart are graphed against the timelag length and a curve is fit through the points. This curve is then extrapolated back to a timelag of 0 and the variability determined. In geostatistics, this variability is termed the nugget effect the inherent variability of co-located samples. With an estimate of the signal strength and the noise strength, a SN can be calculated and compared to the Rose Criterion to determine if the measurement of oxygen addition is theoretically discernable. Estimate of Signal Strength Since the model was run over many cells for many time-steps, a simplification was needed. As a bounding case, the SN at the barge s middle depth was first estimated, assuming this to be one of the most likely locations to have a high SN. Data was extracted from Tetratech s model runs to compare results at cell (15, 59, middle depth) for 481 time-steps with and without oxygen addition to the model. The oxygen addition to the model decreased the oxygen deficit from 1.85 to 0.03 mg/l with an average decrease of 0.28 and median decrease of 0.27 mg/l. A reasonable estimate of the average signal strength at the middle level of the barge is 0.28 mg/l. Estimate of Noise Strength Developing a semivariogram for a data set requires calculating squared differences for each pair of data points in the data set. For a large data set, this may be an unmanageable number, since the number of pairs increases by one-half the square of the number of data points (n 2 /2). For the 481 time-steps of interest at the barge, middle depth, this means a total of (481 2 /2) or nearly 116,000 differences. This large number of differences, along with the expectation of correlation of values over much more than a tidal cycle led to initial review of lags no more than a day. Further review identified substantial homogenization of differences beyond 0.1 days. Plotting of the average difference squared (to avoid graphing problems of positive and negative differences as specified by the semivariogram process) leads to the following semivariogram figure. B-2
33 (Average lag difference)^ Semivariance - DO deficit Time lag - days DO Deficit (squared) The average squared lag difference at time lag 0 appears to be on the order of 0.05 for an average difference of 0.22 mg/l (square root of 0.05). Estimate of Signal-to-Noise Ratio Given the average estimated signal strength at one of the most favorable locations is 0.28 mg/l and the estimated average instantaneous noise strength at any location is 0.22 mg/l, calculation of the SN is straightforward: SN = (0.28 / 0.22) = 1.3 This number is much smaller than the Rose Criterion and strongly suggests the expected size of the nearshore DO effect cannot be separately identified in the noise of the nearshore continuous measurements. Conclusions The signal-to-noise ratio helps decipher noticeable signals from measurements. The ratio value of 1.3 is small enough that the expected size of the DO signal due to reoxygenation in the main channel cannot be reliably separated from the baseline variability of the nearshore continuous DO measurements. B-3
34 APPENDIX C RESPONSE TO COMMENTS
35 Savannah Harbor ReOxygenation Demonstration Project Report Supplemental Data Evaluation Report August 19, 2009 Response to Comments Savannah Harbor ReOxygenation Demonstration Project Report Supplemental Data Evaluation Report August 19, 2009 Response to Comments Wade Cantrell, SCDHEC 1. Both the near-field plume modeling and the far-field dissolved oxygen (DO) modeling are based on characteristics that vary considerably within the harbor area, so a final DO mitigation plan should include similar modeling for each proposed injection location. Depending on location, additional analysis may be needed to rule out the possibility of vertical turbulence, upward movement of the injected plume, and lower DO transfer efficiency compared to the demonstration site. MACTEC understands that this modeling will be performed as part of considerations for permanent ReOx system placement. Ed Eudaly PECONSULTING 1. I believe that this is an excellent recommendation and support it. I realize that logistics and infrastructure are considerations in selecting the injection sites. However, the recommended modeling would be very useful in determining whether the proposed injection sites are effective in addressing the predicted impacts. I expect that this recommendation will be discussed at the upcoming meeting. No response required EPA Technical Review of the Savannah Harbor ReOxygenation Demonstration Project Reports April 17, The Savannah Harbor ReOxygenation Demonstration Project results were presented in 2 separate reports; 1) Savannah Harbor ReOxygenation Demonstration Project Report (MACTEC 2009) and 2) Savannah Harbor ReOxygenation Demonstration Modeling Report (Tetratech 2009). The three (3) main technical goals of the study, from EPA s perspective, were 1) to demonstrate that the Speece Cone Oxygen (O2) injection technology was feasible to install and use in the Harbor; 2) to determine the efficiency of C-1
5.0 RECOMMENDATIONS. Recommendations going forward
 5.0 RECOMMENDATIONS Recommendations going forward Overall, the 2007 ReOx demonstration project confirmed that the Speece Cone technology can effectively add DO to the harbor and reduce instream DO deficits
BRLT Water Testing. 6/30/2016 to 10/27/2016
 BRLT Water Testing 6/30/2016 to 10/27/2016 BRLT Water Testing with 2015-2016 comparison 4/8/2017 return Salinity Sal ppt 4 35.0 3 25.0 2 15.0 3 rd quartile Median 1 st quartile 5.0 0 1 2 3 4 5 6 7 8 9
Appendix L Preliminary trend analysis methodology report
 Appendix L Preliminary trend analysis methodology report Methodology for groundwater level trend analysis Rev 0 April 2012 Uncontrolled when printed GROUNDWATER PROJECT Table of Contents 1.0 GROUNDWATER
Leveraging Smart Meter Data & Expanding Services BY ELLEN FRANCONI, PH.D., BEMP, MEMBER ASHRAE; DAVID JUMP, PH.D., P.E.
 ASHRAE www.ashrae.org. Used with permission from ASHRAE Journal. This article may not be copied nor distributed in either paper or digital form without ASHRAE s permission. For more information about ASHRAE,
January US Army Corps of Engineers Savannah District South Atlantic Division
 ENVIRONMENTAL IMPACT STATEMENT APPENDIX Q: Risk and Uncertainty in Environmental Evaluation Approach SAVANNAH HARBOR EXPANSION PROJECT Chatham County, Georgia and Jasper County, South Carolina January
July 1, Joseph T. Hoke, Jr., P.E. U.S. Army Corps of Engineers Savannah District P.O. Box 889 Savannah, GA Dear Mr.
 July 1, 2005 Joseph T. Hoke, Jr., P.E. U.S. Army Corps of Engineers Savannah District P.O. Box 889 Savannah, GA 31402-0889 Dear Mr. Hoke, We have reviewed the Savannah Harbor hydrodynamic and water quality
MAS187/AEF258. University of Newcastle upon Tyne
 MAS187/AEF258 University of Newcastle upon Tyne 2005-6 Contents 1 Collecting and Presenting Data 5 1.1 Introduction...................................... 5 1.1.1 Examples...................................
A CLIENT S GUIDE WHERE TO START WHAT HAPPENS ON SITE WHAT ARE THE BENEFITS. 10 Advantages of. Design Build
 A CLIENT S GUIDE WHERE TO START WHAT HAPPENS ON SITE WHAT ARE THE BENEFITS 10 Advantages of Design Build WHERE TO START Welcome. I prepared this guide after seeing so many people struggle with understanding
Glossary of Standardized Testing Terms https://www.ets.org/understanding_testing/glossary/
 Glossary of Standardized Testing Terms https://www.ets.org/understanding_testing/glossary/ a parameter In item response theory (IRT), the a parameter is a number that indicates the discrimination of a
Model Comparison Report In Support of the Savannah Harbor Expansion Project
 Model Comparison Report In Support of the Savannah Harbor Expansion Project PREPARED BY: Tetra Tech, Inc. 2110 Powers Ferry Rd. SE, Suite 202 Atlanta, Georgia 30339 Phone: (770) 850-0949 www.tetratech.com
Groundwater Statistical Methods Certification. Neal South CCR Monofill Permit No. 97-SDP-13-98P Salix, Iowa. MidAmerican Energy Company
 Groundwater Statistical Methods Certification Neal South CCR Monofill Permit No. 97-SDP-13-98P Salix, Iowa MidAmerican Energy Company GHD 11228 Aurora Avenue Des Moines Iowa 50322-7905 11114654 Report
Groundwater Statistical Methods Certification. Neal North Impoundment 3B Sergeant Bluff, Iowa. MidAmerican Energy Company
 Groundwater Statistical Methods Certification Neal North Impoundment 3B Sergeant Bluff, Iowa MidAmerican Energy Company GHD 11228 Aurora Avenue Des Moines Iowa 50322-7905 11114642 Report No 11 October
Calculation of BLM Fixed Monitoring Benchmarks for Copper at Selected Monitoring Sites in Colorado
 Prepared by HydroQual, Inc. for the US Environmental Protection Agency Calculation of BLM Fixed Monitoring Benchmarks for Copper at Selected Monitoring Sites in Colorado Final Report October 10, 2008 GLEC.030.004.01.001
Groundwater Statistical Methods Certification. Neal North CCR Monofill Permit No. 97-SDP-12-95P Sergeant Bluff, Iowa. MidAmerican Energy Company
 Groundwater Statistical Methods Certification Neal North CCR Monofill Permit No. 97-SDP-12-95P Sergeant Bluff, Iowa MidAmerican Energy Company GHD 11228 Aurora Avenue Des Moines Iowa 50322-7905 11114642
Data Visualization. Prof.Sushila Aghav-Palwe
 Data Visualization By Prof.Sushila Aghav-Palwe Importance of Graphs in BI Business intelligence or BI is a technology-driven process that aims at collecting data and analyze it to extract actionable insights
POTENTIAL FOR GEOLOGICAL CARBON SEQUESTRATION USING DEEP SALINE AQUIFERS IN THE ILLINOIS BASIN
 POTENTIAL FOR GEOLOGICAL CARBON SEQUESTRATION USING DEEP SALINE AQUIFERS IN THE ILLINOIS BASIN DECEMBER 4, 2015 GIS TERM PAPER Julien Botto Table of Contents Introduction... 2 Background... 3 Objective...
Appendix B. Box Plots of Water Quality Data
 CMP Water Quality Report 2005-2008 June 2009 Appendix B. Box Plots of Water Quality Data Box and whisker plots are provided for all CMP water quality parameters with detected data. Box plots illustrate
Online Student Guide Types of Control Charts
 Online Student Guide Types of Control Charts OpusWorks 2016, All Rights Reserved 1 Table of Contents LEARNING OBJECTIVES... 4 INTRODUCTION... 4 DETECTION VS. PREVENTION... 5 CONTROL CHART UTILIZATION...
Tutorial Segmentation and Classification
 MARKETING ENGINEERING FOR EXCEL TUTORIAL VERSION v171025 Tutorial Segmentation and Classification Marketing Engineering for Excel is a Microsoft Excel add-in. The software runs from within Microsoft Excel
Design of Experiment. Jill Williams and Adam Krinke. Fuel Cell Project
 Design of Experiment Jill Williams and Adam Krinke Fuel Cell Project Spring 2005 Introduction The Proton Exchange Membrane (PEM) fuel cell requires a relatively stringent environment for operation. The
2.2 Middle Fork Nooksack River
 2118 2119 2120 2121 2122 2123 2124 2125 2126 2127 2128 2129 2130 2131 2132 2133 2134 2135 2136 2137 2138 2139 2140 2141 2142 2143 2144 2145 2146 2147 2148 2149 2150 2151 2152 2153 2154 2155 2156 2157 2158
Energy Efficiency Impact Study
 Energy Efficiency Impact Study for the Preferred Resources Pilot February, 2016 For further information, contact PreferredResources@sce.com 2 1. Executive Summary Southern California Edison (SCE) is interested
Urban Transportation Planning Prof Dr. V. Thamizh Arasan Department of Civil Engineering Indian Institute Of Technology, Madras
 Urban Transportation Planning Prof Dr. V. Thamizh Arasan Department of Civil Engineering Indian Institute Of Technology, Madras Lecture No. # 14 Modal Split Analysis Contd. This is lecture 14 on urban
Citizen Science Monitoring for Pathogens on Staten Island A FINAL REPORT FOR THE NY-NJ HARBOR AND ESTURARY PROGRAM
 Citizen Science Monitoring for Pathogens on Staten Island A FINAL REPORT FOR THE NY-NJ HARBOR AND ESTURARY PROGRAM Prepared by Paul L. Sieswerda, President, Gotham Whale September 2017 Introduction: Gotham
Retained Ownership In Cattle Cycles
 Managing for Today s Cattle Market and Beyond Retained Ownership In Cattle Cycles By John C. McKissick, The University of Georgia John Ikerd, University of Missouri The existence of cycles in cattle prices
GEOTHERMAL DATA MINING -- VALUE IN ANTIQUES
 GEOTHERMAL DATA MINING -- VALUE IN ANTIQUES Roland N. HORNE 1 1 Stanford Geothermal Program, Stanford University, USA. Keywords: data analysis, nonparametric regression, wavelets SUMMARY - Analysis of
Econometric Forecasting in a Lost Profits Case
 Econometric Forecasting in a Lost Profits Case I read with interest the recent article by A. Frank Adams, III, Ph.D., in the May /June 2008 issue of The Value Examiner1. I applaud Dr. Adams for his attempt
Sales Forecast for Rossmann Stores SUBMITTED BY: GROUP A-8
 Sales Forecast for Rossmann Stores SUBMITTED BY: GROUP A-8 Executive Summary: a. Problem description: Business Problem: Rossman is Germany s second largest drug store chain with more than 1000 stores across
Can Cascades be Predicted?
 Can Cascades be Predicted? Rediet Abebe and Thibaut Horel September 22, 2014 1 Introduction In this presentation, we discuss the paper Can Cascades be Predicted? by Cheng, Adamic, Dow, Kleinberg, and Leskovec,
A Method to Quantify STAT Impact in DoD Test Design
 A Method to Quantify STAT Impact in DoD Test Design Best Practice Authored by: Sarah Burke, PhD Michael Harman Francisco Ortiz, PhD Lenny Truett, PhD Aaron Ramert Bill Rowell, PhD 15 February 2017 The
The Dissolved Oxygen Status of the Inland Bays : First Draft. Chris Bason Delaware Center for the Inland Bays CIB STAC July 16, 2010
 The Dissolved Oxygen Status of the Inland Bays 1998 2009: First Draft Chris Bason Delaware Center for the Inland Bays CIB STAC July 16, 2010 Importance A primary impairment under the Clean Water Act --
Forecasting for Short-Lived Products
 HP Strategic Planning and Modeling Group Forecasting for Short-Lived Products Jim Burruss Dorothea Kuettner Hewlett-Packard, Inc. July, 22 Revision 2 About the Authors Jim Burruss is a Process Technology
Soil Health Assessment Report
 Part II - Soil Health Assessment Soil Health Assessment Report The raw data from the individual indicators and background information about sample location and management history from the sample submission
Rationale Supporting Application of a Reference Curve for Assessment of the Chesapeake Bay Deep Channel Dissolved Oxygen Criterion
 Rationale Supporting Application of a Reference Curve for Assessment of the Chesapeake Bay Deep Channel Dissolved Oxygen Criterion Briefing Document for the CBP Scientific and Technical Advisory Committee
The Impact of Large Storm Events on Nutrient Loadings in Texas Rivers
 The Impact of Large Storm Events on Nutrient Loadings in Texas Rivers Paul Bireta Fall 2012 Nutrients can be damaging to natural water bodies, harming both human and ecological health. One of the primary
Developing an Accurate Baseline for Electricity Consumption, Focusing on University Residence Halls
 Developing an Accurate Baseline for Electricity Consumption, Focusing on University Residence Halls Richard Turner Mechanical Engineer UNC Chapel Hill Energy Management turnerrwjr@gmail.com 5/1/2012 Abstract
Calculating the Standard Error of Measurement
 Calculating the Standard Error of Measurement If we make a series of measurements of the same clinical variable we expect those measurements to show some variability. This may be because the measurement
Survey of Dissolved Oxygen in the Lamprey and Squamscott Rivers
 Summary Report Survey of Dissolved Oxygen in the Lamprey and Squamscott Rivers A final report to the United States Environmental Protection Agency, Office of Research and Development, Atlantic Ecology
IB internal assessment: Measuring air pollution
 IB internal assessment: Measuring air pollution Introduction Air pollution is a serious issue in the environment. Pollution from cars or other vehicles contains toxic chemicals such as oxides of nitrogen
BUSINESS STATISTICS (PART-37) TIME SERIES & FORECASTING (PART-2) ANALYSIS FOR SECULAR TREND-I (UNITS V & VI)
 TIME SERIES & FORECASTING (PART-2) ANALYSIS FOR SECULAR TREND-I (UNITS V & VI)") BUSINESS STATISTICS (PART-37) TIME SERIES & FORECASTING (PART-2) ANALYSIS FOR SECULAR TREND-I (UNITS V & VI) 1. INTRODUCTION Hello viewers, we have been discussing the time series analysis and forecasting
BUSINESS STATISTICS (PART-37) TIME SERIES & FORECASTING (PART-2) ANALYSIS FOR SECULAR TREND-I (UNITS V & VI) 1. INTRODUCTION Hello viewers, we have been discussing the time series analysis and forecasting
THE CONCEPT OF CONJOINT ANALYSIS Scott M. Smith, Ph.D.
 THE CONCEPT OF CONJOINT ANALYSIS Scott M. Smith, Ph.D. Marketing managers are faced with numerous difficult tasks directed at assessing future profitability, sales, and market share for new product entries
Status and trend analysis in the Maryland water quality monitoring program
 Status and trend analysis in the Maryland water quality monitoring program Matt Hall Research Statistician Tidewater Ecosystem Assessment mhall@dnr.state.md.us Cathy Wazniak Coastal Bays Program Manager
Correlation and Simple. Linear Regression. Scenario. Defining Correlation
 Linear Regression Scenario Let s imagine that we work in a real estate business and we re attempting to understand whether there s any association between the square footage of a house and it s final selling
Optimization of Sediment Microbial Fuel Cell for Power Generation
 Optimization of Sediment Microbial Fuel Cell for Power Generation Jack Lehman 1,Hongjian Lin 1, Bo Hu 1 1 Department of Bioproducts & Biosystems Engineering, University of Minnesota Twin Cities, St. Paul,
Module - 01 Lecture - 03 Descriptive Statistics: Graphical Approaches
 Introduction of Data Analytics Prof. Nandan Sudarsanam and Prof. B. Ravindran Department of Management Studies and Department of Computer Science and Engineering Indian Institution of Technology, Madras
On the Virtues of Parameterized Uniform Crossover
 ^ I f. k, MAY12 1995 On the Virtues of Parameterized Uniform Crossover William M. Spears Naval Research Laboratory Washington, D.C. 20375 USA spears@aic.nrl.navy.mil Kenneth A. De Jong George Mason University
Rethinking branding metrics: how to turn brand consideration into a performance metric
 Rethinking branding metrics: how to turn brand consideration into a performance metric Rethinking branding metrics: how to turn brand consideration into a performance metric Many companies struggle with
When You Can t Go for the Gold: What is the best way to evaluate a non-rct demand response program?
 When You Can t Go for the Gold: What is the best way to evaluate a non-rct demand response program? Olivia Patterson, Seth Wayland and Katherine Randazzo, Opinion Dynamics, Oakland, CA ABSTRACT As smart
Silviculture Exemption Update
 Silviculture Exemption Update US Army Corps of Engineers BUILDING STRONG Public Notice Issued December 8, 2010 Advertising 12-Month Implementation Period Guidelines for Silviculture Exemptions under the
Sample Report Market Sensitivity 30 Year, Fixed, Conforming Mortgages
 Sample Report Market Sensitivity 30 Year, Fixed, Conforming Mortgages DATA is for informational purposes and is not specific to any bank 2010 Heitman Analytics 1 Executive Summary Determine the relationship
R. E. Speece Vanderbilt University David Clidence President of ECO2
 R. E. Speece Vanderbilt University David Clidence President of ECO2 COMPANY PROFILE Headquartered in Indianapolis, IN Founded in 2002 Longest Operating System 15 years 70+ Installations Dr. Richard Speece
and Forecasting CONCEPTS
 6 Demand Estimation and Forecasting CONCEPTS Regression Method Scatter Diagram Linear Regression Regression Line Independent Variable Explanatory Variable Dependent Variable Intercept Coefficient Slope
Appendix C. Demonstration Model
 Appendix C Demonstration Model Connecticut River Partnership Demonstration hydrologic/dam operations models Overview The Nature Conservancy, together with partners, has identified an altered flow regime
Details of DO Criteria. Peter Tango EPA Chesapeake Bay Program Office March 16, 2011
 Details of DO Criteria Peter Tango USGS@ EPA Chesapeake Bay Program Office March 16, 2011 Umbrella Criteria Action Team Walter Boynton Jeni Keisman Tish Robertson Elgin Perry Claire Buchanan Matt Hall
QUESTION 2 What conclusion is most correct about the Experimental Design shown here with the response in the far right column?
 QUESTION 1 When a Belt Poka-Yoke's a defect out of the process entirely then she should track the activity with a robust SPC system on the characteristic of interest in the defect as an early warning system.
SAVANNAH HARBOR DEEPENING PROJECT USGS/USFWS MARSH SUCESSION MODEL MARSH/WETLAND IMPACT EVALUATION
 SAVANNAH HARBOR DEEPENING PROJECT USGS/USFWS MARSH SUCESSION MODEL MARSH/WETLAND IMPACT EVALUATION June 2007 Purpose: The purpose of the Marsh Succession Modeling is to determine the impacts of deepening
Facility Location. Lindsey Bleimes Charlie Garrod Adam Meyerson
 Facility Location Lindsey Bleimes Charlie Garrod Adam Meyerson The K-Median Problem Input: We re given a weighted, strongly connected graph, each vertex as a client having some demand! Demand is generally
TETRA TECH 2110 Powers Ferry Road Suite 202 Atlanta, Georgia Telephone: (770) Telefax: (770)
 Telefax: (770)") TETRA TECH 2110 Powers Ferry Road Suite 202 Atlanta, Georgia 30339 Telephone: (770) 850-0949 Telefax: (770) 850-0950 Date: November 24, 2015 To: From: Cc: Subject: Beth Williams (USACE) Brian Watson, PE,
TETRA TECH 2110 Powers Ferry Road Suite 202 Atlanta, Georgia 30339 Telephone: (770) 850-0949 Telefax: (770) 850-0950 Date: November 24, 2015 To: From: Cc: Subject: Beth Williams (USACE) Brian Watson, PE,
Minutes Saltwater Intrusion Steering Committee Meeting March 4, 2011
 Minutes Saltwater Intrusion Steering Committee Meeting March 4, 2011 Attending: David Baize, Brian Baker, Richard Cyr, Billy Edwards, Kelly Ferda, Chris Foldesi Bill Garbett, Chuck Gorman, Rusty Hildebrand,
Model Building Process Part 2: Factor Assumptions
 Model Building Process Part 2: Factor Assumptions Authored by: Sarah Burke, PhD 17 July 2018 Revised 6 September 2018 The goal of the STAT COE is to assist in developing rigorous, defensible test strategies
Segmentation and Targeting
 Segmentation and Targeting Outline The segmentation-targeting-positioning (STP) framework Segmentation The concept of market segmentation Managing the segmentation process Deriving market segments and
The Implications of Heterogeneity for the Regulation of Energy-Consuming Durable Goods
 The Implications of Heterogeneity for the Regulation of Energy-Consuming Durable Goods Mark R. Jacobsen, 1,5 Christopher R. Knittel, 2,5 James M. Sallee, 3,5 Arthur A. van Benthem 4,5 December 8, 2014
Groundwater Modeling Guidance
 Groundwater Modeling Guidance Richard J. Mandle Groundwater Modeling Program Michigan Department of Environmental Quality Draft 1.0 10/16/02 Executive Summary The use of groundwater models is prevalent
Module 2, Add on Lesson Turbidity Sensor. Student. 90 minutes
 Module 2, Add on Lesson Turbidity Sensor Student 90 minutes Purpose Construct a sensor to measure the turbidity of water Graph data and reason about curves and linear relationships Calibrate the turbidity
P.O. 11POSOW0482. HSW
 Appendix X Watson, K.W., Yang, L., and Mades, D. 211. Memorandum to Mr. Douglas A. Leeper, Southwest Florida Water Management District, dated February 8, 211. Regarding: technical memo, use of a hydrodynamic
Monitoring Carbon Dioxide Sequestration in Deep Geological Formations for Inventory Verification and Carbon Credits
 Monitoring Carbon Dioxide Sequestration in Deep Geological Formations for Inventory Verification and Carbon Credits Sally M. Benson Earth Sciences Division Lawrence Berkeley National Laboratory Berkeley,
dissolved fraction particulate fraction Resuspension
 CE4505 SURFACE WATER QUALITY PROJECT 2B. TORCH LAKE RECOVERY MODEL Due 10/29/09 The model that we will use for the next week is shown in Fig. 1 below. This model is a simplification of reality in two major
Paul Below Quantitative Software Management, Inc.
 Optimal Project Performance: Factors that Influence Project Duration Paul Below paul.below@qsm.com Quantitative Software Management, Inc. Agenda: Project Duration Introduction Causation and the Laugh Test
Pilot Testing of Groundwater Circulation Well Technology for a Caustic Groundwater Plume in a Coastal Aquifer
 Pilot Testing of Groundwater Circulation Well Technology for a Caustic Groundwater Plume in a Coastal Aquifer presented by Lynda Smithard, P.Eng. URS Corporation, Vancouver, BC Background a portion of
Citation Statistics (discussion for Statistical Science) David Spiegelhalter, University of Cambridge and Harvey Goldstein, University of Bristol We
 David Spiegelhalter, University of Cambridge and Harvey Goldstein, University of Bristol We") Citation Statistics (discussion for Statistical Science) David Spiegelhalter, University of and Harvey Goldstein, University of We welcome this critique of simplistic one-dimensional measures of academic
Citation Statistics (discussion for Statistical Science) David Spiegelhalter, University of and Harvey Goldstein, University of We welcome this critique of simplistic one-dimensional measures of academic
Economic Returns from the Beef Checkoff
 Economic Returns from the Beef Checkoff Ronald W. Ward 1 Food and Resource Economics Department University of Florida, Gainesville Generic advertising is the cooperative effort among producers to promote
NEW CLIMATE CHANGE INFORMATION FOR ENHANCING EVERGLADES RESTORATION CLIMATE PREPAREDNESS AND RESILIENCE
 NEW CLIMATE CHANGE INFORMATION FOR ENHANCING EVERGLADES RESTORATION CLIMATE PREPAREDNESS AND RESILIENCE Glenn B. Landers, P.E. USACE Jacksonville District GEER Conference, Coral Springs, FL April 19, 2017
Optimizing a cooling water outfall inside the Maasvlakte 2 port extension - dealing with conflicting requirements
 Optimizing a cooling water outfall inside the Maasvlakte 2 port extension - dealing with conflicting requirements Martijn P.C. de Jong 1,2, Arnout C. Bijlsma 1, and Aron Ament 3 1 Deltares, P.O. Box 177,
August 24, Jean-Philippe Mathevet IAQG Performance Stream Leader SAFRAN Paris, France. Re: 2014 Supplier Performance Data Summary
 Page 1 of 27 August 24, 2105 Jean-Philippe Mathevet IAQG Performance Stream Leader SAFRAN Paris, France Re: 2014 Supplier Performance Data Summary Dear Jean-Philippe: The following report is a summary
Pareto Charts [04-25] Finding and Displaying Critical Categories
![Pareto Charts [04-25] Finding and Displaying Critical Categories](/thumbs/72/68045074.jpg "Pareto Charts [04-25] Finding and Displaying Critical Categories") Introduction Pareto Charts [04-25] Finding and Displaying Critical Categories Introduction Pareto Charts are a very simple way to graphically show a priority breakdown among categories along some dimension/measure
Introduction Pareto Charts [04-25] Finding and Displaying Critical Categories Introduction Pareto Charts are a very simple way to graphically show a priority breakdown among categories along some dimension/measure
Mileage savings from optimization of coordinated trucking 1
 Mileage savings from optimization of coordinated trucking 1 T.P. McDonald Associate Professor Biosystems Engineering Auburn University, Auburn, AL K. Haridass Former Graduate Research Assistant Industrial
Uncertainty in Mass-Balance Calculations of Non-Point Source Loads to the Arkansas River
 Hydrology Days 2006 Uncertainty in Mass-Balance Calculations of Non-Point Source Loads to the Arkansas River Jennifer Mueller Graduate Research Assistant and MS Candidate, Civil Engineering Department,
Statistical Pay Equity Analyses: Data and Methodological Overview
 Statistical Pay Equity Analyses: Data and Methodological Overview by Paul F. White, Ph.D. Resolution Economics, LLC Washington, DC for American Bar Association 10 th Annual Labor and Employment Law Conference
Chapter 2 The Project Management Life Cycle
 Information Systems Project Management: A Process and Team Approach 1 Chapter 2 The Project Management Life Cycle Multiple Choice 1. The phases of managing a project are called: a. systems development
EBM EVIDENCE-BASED MANAGEMENT GUIDE
 EBM EVIDENCE-BASED MANAGEMENT GUIDE Scrum.org September 2018 How to continuously improve business results by measuring business value and using empirical management OVERVIEW Organizations adopting agile
Long Harbour Real-Time Water Quality Monitoring Network. Annual Report
 Long Harbour Real-Time Water Quality Monitoring Network Annual Report 2008 Prepared by: Date: Ryan Pugh Ph: 709.729.16.81 Fx: 709.729.0320 ryanpugh@gov.nl.ca March 2, 2009 Table of Contents Table of Contents...
EBM EVIDENCE-BASED MANAGEMENT GUIDE
 EBM EVIDENCE-BASED MANAGEMENT GUIDE Scrum.org January 2019 How to continuously improve business results by measuring business value and using empirical management OVERVIEW Organizations adopting agile
LETTER F. City of Del Mar
 LETTER F City of Del Mar F-1 The comment provides introductory statements and does not raise a specific issue related to the adequacy of the EIR. Therefore, no specific response is provided. F-2 The assumption
Near-Balanced Incomplete Block Designs with An Application to Poster Competitions
 Near-Balanced Incomplete Block Designs with An Application to Poster Competitions arxiv:1806.00034v1 [stat.ap] 31 May 2018 Xiaoyue Niu and James L. Rosenberger Department of Statistics, The Pennsylvania
AP Statistics Scope & Sequence
 AP Statistics Scope & Sequence Grading Period Unit Title Learning Targets Throughout the School Year First Grading Period *Apply mathematics to problems in everyday life *Use a problem-solving model that
2.0 Scope of Work. 3.0 Stream Discharge Measurements. Technical Memorandum City of Farmers Branch Page 2
 Technical Memorandum City of Farmers Branch Page 2 over the No. 1 dam. Discharge of commingled water from the reservoirs must be of sufficient quality to meet the Surface Water Quality Standards of Segment
Encinitas-Solana Beach Coastal Storm Damage Reduction Project. San Diego County, California. Appendix M. Mitigation Strategy
 0 Encinitas-Solana Beach Coastal Storm Damage Reduction Project San Diego County, California Appendix M Mitigation Strategy U.S. Army Corps of Engineers Los Angeles District 0 December 0 0 0 This page
Machine learning applications in genomics: practical issues & challenges. Yuzhen Ye School of Informatics and Computing, Indiana University
 Machine learning applications in genomics: practical issues & challenges Yuzhen Ye School of Informatics and Computing, Indiana University Reference Machine learning applications in genetics and genomics
Revision confidence limits for recent data on trend levels, trend growth rates and seasonally adjusted levels
 W O R K I N G P A P E R S A N D S T U D I E S ISSN 1725-4825 Revision confidence limits for recent data on trend levels, trend growth rates and seasonally adjusted levels Conference on seasonality, seasonal
W E S T E R N S T A T E S A I R R E S O U R C E S C O U N C I L. March 26, 2015
 W E S T E R N S T A T E S A I R R E S O U R C E S C O U N C I L March 26, 2015 Anna Wood, Director Air Quality Policy Division Mail Code V404-04 Office of Air Quality Planning and Standards U.S. Environmental
6.1.2 Contaminant Trends
 margin analysis and the application of mass flux and mass discharge techniques (Appendix C). All of these methods are designed to assess changes in source loading and/or aquifer assimilative capacity over
GLOSSARY OF COMPENSATION TERMS
 GLOSSARY OF COMPENSATION TERMS This compilation of terms is intended as a guide to the common words and phrases used in compensation administration. Most of these are courtesy of the American Compensation
Low-Grade Waste Heat Recovery for Power Production using an Absorption-Rankine Cycle
 Purdue University Purdue e-pubs International Refrigeration and Air Conditioning Conference School of Mechanical Engineering 2010 Low-Grade Waste Heat Recovery for Power Production using an Absorption-Rankine
Everglades Landscape Sulfate Dynamics: Final Summary Evaluation of CERP ASR Alternatives
 Everglades Landscape Sulfate Dynamics: Final Summary Evaluation of CERP ASR Alternatives http://ecolandmod.ifas.ufl.edu/projects/elmreg500masr In partial fullfillment of U.S. Army Corps of Engineers Cooperative
Philadelphia Water Department 9/24/13
 Philadelphia Water Department 9/24/13 Need for PWD to develop water quality models of Delaware and tidal Schuylkill Rivers Overview of data collection and modeling efforts Hydrodynamics and water quality
ECONOMICS 103. Topic 3: Supply, Demand & Equilibrium
 ECONOMICS 103 Topic 3: Supply, Demand & Equilibrium Assumptions of the competitive market model: all agents are price takers, homogeneous products. Demand & supply: determinants of demand & supply, demand
To provide a framework and tools for planning, doing, checking and acting upon audits
 Document Name: Prepared by: Quality & Risk Unit Description Audit Process The purpose of this policy is to develop and sustain a culture of best practice in audit through the use of a common framework
Restricting the h-index to a citation time window: A case study of a timed Hirsch index
 Restricting the h-index to a citation time window: A case study of a timed Hirsch index Michael Schreiber Institute of Physics, Chemnitz University of Technology, 917 Chemnitz, Germany. Phone: +49 371
MATH THAT MAKES ENTS
 Since 1984, PNC Bank has been tracking the annual Christmas Price Index: how much it would cost to buy all of the gifts in the song, The 12 Days of Christmas. If you d like to learn more about how they
A Visualization is Worth a Thousand Tables: How IBM Business Analytics Lets Users See Big Data
 White Paper A Visualization is Worth a Thousand Tables: How IBM Business Analytics Lets Users See Big Data Contents Executive Summary....2 Introduction....3 Too much data, not enough information....3 Only