List of Figures. List of Tables
|
|
|
- Clifton Tucker
- 6 years ago
- Views:
Transcription


1
2 Table of Contents 1.0 City of Vancouver s Water Utility Source Water Protecting Vancouver s Drinking Water Quality Drinking Water Standards Monitoring Program Sample Collection Frequency Water Quality Results Bacteriology Chemical and Physical Parameters Metals, Disinfection By-Products, VOCs, Aesthetics Ensuring Assets are Well Managed and Resilient Capital Program Summary Distribution Main Replacement Program Transmission Main Replacement Project Georgia Street Trenchless Slip-lining Project Neighbourhood Energy Utility Expansion Service Installations Operating and Maintenance Programs Main Breaks Service Leak Repairs Meters Greenest City Goals for Clean Water Water Conservation & System Leakage Financial Summary Summary Appendix A Source Water Quality Appendix B Water Sampling Stations (Map) Appendix C Metals Analysis Appendix D Disinfection By-products Appendix E Sampling Site Characterization
3 List of Figures Figure 1: Monthly Average Water Temperatures in the Distribution System Figure 2: Monthly Average Turbidity Levels in the Distribution System Figure 3: Annual Distribution Main Replacement Rate ( ) Figure 4: Distribution Main Replacement Costs Figure 5: East Pender Street Transmission Main Construction Figure 6: Sliplining on Georgia Street Figure 7: 2013 Neighbourhood Energy Utility Branch & Service Connections Figure 8: Water Main Break History (2003 to 2013) Figure 9: Greenest City Water Consumption Goal (Liters per Capita) List of Tables Table 1: Required Frequency of Monitoring (BCDWPR)... 3 Table 2: CoV Compliance w/ Required Frequency of Monitoring (BCDWPR)... 3 Table 3: Frequency of Monitoring Samples, Summary of BCDWPR, WQMRP & CoV Compliance. 4 Table 4: CoV Water Quality Results Bacteriology Table 5: CoV Water Quality Results - Chemical and Physical Parameters Table 6: CoV Water Quality Results - Metals, DBPs, VOCs, Aesthetics Table 7: 2013 Waterworks Capital Program Expenditures Table 8: Service Installations Table 9: 2013 Operations and Maintenance Budget, Expenditures, and Revenues Table 10: Water Loss Reduction Programs Table 11: Water Conservation Programs Table 12: 2013 Waterworks Expenditures and Revenues... 24
4 Acronyms AO Aesthetic Objective BCCDC British Columbia Centre for Disease Control BCDWPR British Columbia Drinking Water Protection Regulation CFU Colony forming Units CoV City of Vancouver DBP Disinfection By-product E. coli Escherichia coli EPA Environmental Protection Agency (USA) GCDWQ Guidelines for Canadian Drinking Water Quality HAA Haloacetic Acid HPC Heterotrophic Plate Count MAC Maximum Acceptable Concentration N/A Not available NEU Neighbourhood Energy Utility mg/l Milligram per litre ml Millilitre NTU Nephelometric Turbidity Unit ph Measure of acidity or basicity of water; ph 7 is neutral ppb Parts per Billion SCFP Seymour-Capilano Filtration Plant THM Trihalomethane WHO World Health Organization WQMRP Water Quality Monitoring and Reporting Plan
5 1.0 City of Vancouver s Water Utility As a member municipality of Metro Vancouver, the City of Vancouver Waterworks Utility purchases bulk treated water and operates a City-wide transmission and distribution system to deliver water to customers. The Utility consists of the Design Branch which designs and administers the Utility, and the Operations Branch which builds, operates and maintains the system. Together these groups purchase and deliver more than 109,600,000 cubic metres of high quality drinking water to more than 100,000 properties within Vancouver annually. The Water Utility is self-funded. Revenues collected each year completely offset costs to build and maintain the water system over the same period. Of the total budget of $104.3M in 2013, $66.4M was used to purchase bulk water from Metro Vancouver and the remaining $37.9M was spent rebuilding and maintaining the water system. The three core functions of the Water Utility are: 1) Ensuring that the drinking water quality delivered to customers meets all relevant health and quality guidelines, 2) Ensuring that water system assets are well managed and resilient, and 3) Making progress on the City s water consumption and water quality targets adopted as part of the Greenest City Action Plan s Clean Water goal, effectively offsetting population growth through efficient water use. 2.0 Source Water Vancouver s water originates from three mountainous watersheds protected and managed by Metro Vancouver. These watersheds collect surface water from rain and snowmelt and all three are closed to the public such that no recreational, agricultural and/or industrial activities are permitted within watershed boundaries. This significantly reduces the risk of human contamination within the watersheds. Metro Vancouver is responsible for source water quality monitoring and treatment to ensure high quality water is delivered to its member municipalities. Water treatment by disinfection destroys disease-causing or pathogenic organisms and secondary chlorine disinfection of the water downstream of the watersheds helps to prevent bacterial re-growth in the distribution systems. Metro Vancouver is responsible for both primary and secondary treatment. The City of Vancouver does not further treat the water. To learn how drinking water is treated by Metro Vancouver, visit: spx To view summaries of source water quality for the Capilano, Seymour and Coquitlam watersheds, see Appendix A Source Water Quality. 3.0 Protecting Vancouver s Drinking Water Quality Vancouver s drinking water continues to meet provincial, federal and relevant international standards and guidelines for drinking water quality. The following sections describe drinking water quality standards, the City s monitoring program, Page 1
6 sampling frequency and water quality parameters that substantiate Vancouver s drinking water potability for Drinking Water Standards Drinking water delivered by the City of Vancouver to its customers must comply with the health standards set out by the British Columbia Drinking Water Protection Regulation (BCDWPR). In addition, the British Columbia Drinking Water Protection Act (BCDWPA) places specific requirements and responsibilities on drinking water suppliers. To ensure compliance with provincial drinking water legislation, a regional plan has been jointly developed by the lower mainland Medical Health Officers, Metro Vancouver and member municipalities, including the City of Vancouver. This plan has been accepted by Vancouver Coastal Health and the Fraser Health Authority. The regional Water Quality Monitoring and Reporting Plan for Metro Vancouver and Member Municipalities (WQMRP) states that each water supplier (such as the City of Vancouver) is required to hold an annual operating permit issued by the region s Medical Health Officer approving water potability, monitoring, reporting protocol and emergency response. 3.2 Monitoring Program The City of Vancouver has a long-standing Water Quality Monitoring Program to ensure water quality data is routinely collected throughout the City s distribution system. Water samples are taken from fifty-three dedicated sampling stations. Appendix B contains a map to show the spread of these stations within the City. Samples are analyzed for: Regulatory compliance against provincial health standards. Regional compliance as per the WQMRP. These samples are further scrutinized against: Health Canada s Guidelines for Canadian Drinking Water Quality (GCDWQ). International recommendations by the United States Environment Protection Agency (US EPA) and World Health Organization (WHO) for chlorine residual. Sample results are reported to Metro Vancouver and the region s Medical Health Officer through weekly, monthly and annual reporting. Sample results are available to the public on the City s website at In addition to regulatory monitoring, the City also collects continuous water quality data from two online monitoring stations. This technology supports regulatory compliance, security monitoring, and detects changes in source waters more immediately. Page 2
7 3.3 Sample Collection Frequency Schedule B of the BCDWPR requires the number of water samples collected to correspond with population size. The City of Vancouver continues to exceed the minimum number of samples required per month for monitoring. In 2013, 169 samples per month were collected from fifty-three dedicated sampling stations. This equals 2,025 samples for the year, or 39 samples per week collected over four days. The requirement from Schedule B of the BCDWPR and the actual sample collection frequency by the City of Vancouver (CoV) is summarized below: Table 1: Required Frequency of Monitoring (BCDWPR) Population Served by the Prescribed Water Supply System Number of Samples Per month Less than to per of more than plus 1 per of population in excess of Table 2: CoV Compliance w/ Required Frequency of Monitoring (BCDWPR) Year CoV Population Number of Sample Sites Number of Samples per Month Required* Number of Samples per Month Collected Number of Samples per Year Collected *Minimum Number of Samples per Month as Required by Schedule B of the BCDWPR The WQMRP further details specific parameters and testing frequencies for at least 10% of the sample sites within a distribution system. A summary of both the BCDWPR and WQMRP parameters are provided along with the actual testing frequency by the City s Water Quality Monitoring Program in Table 3. The City s monitoring program continues to meet or exceed the minimum testing frequencies for all listed parameters. Page 3
8 Table 3: Frequency of Monitoring Samples, Summary of BCDWPR, WQMRP & CoV Compliance Category Parameter Location Required Frequency Bacteriological (bac T) Actual CoV Frequency E. coli All 1 BCDWPR See Table 1 & 2 See Table 2 Total coliform All BCDWPR See Table 1 & 2 See Table 2 HPC All Not required Run with bac T Chemical Chlorine free (residual) All WQMRP run with bac T Run with bac T Physical Chlorine total All Not required Run with bac T Conductivity All Not required Run with bac T ph Temperature Representative sites Representative sites WQMRP semi annual WQMRP Quarterly Run with bac T (all sites) Run with bac T (all sites) Turbidity All WQMRP run with bac T Run with bac T Metals Copper Representative sites WQMRP semi annual Semi annually Iron Representative sites WQMRP semi annual Semi annually Lead Representative sites WQMRP semi annual Semi annually Zinc Representative sites WQMRP semi annual Semi annually Other 2 Representative sites Not required Semi annually Disinfection Byproducts Haloacetic Acids Trihalomethanes Representative sites Representative sites WQMRP Quarterly WQMRP Quarterly Quarterly Quarterly Volatile Organic Compounds Vinyl Chloride Representative sites WQMRP Semi annual N/A 3 Aesthetic Odour & Taste Any site WQMRP Complaint basis Complaint basis 1. Location All refers to all CoV sampling sites (53). 2. The methodology for metals analysis produces additional results; see Appendix C Metals Analysis. 3. Vinyl chloride testing is required where PVC pipe is used in the distribution system. Ratio of PVC pipe in Vancouver is less than 0.1% and deemed insignificant for testing at this time. Page 4
9 3.4 Water Quality Results This section provides the overall drinking water quality summary for the City of Vancouver s distribution system in Bacteriology Table 4: CoV Water Quality Results Bacteriology Parameter Results Standard Reference E. coli 0 samples contained E. coli No detectable E. coli bacteria per 100 ml BCDWPR Water Quality Standards for Potable Water Total coliform 1 sample was positive for TC retesting revealed no further TC. 0 samples contained more than 10 total coliform bacteria per 100 ml a) No more than 10% of the samples in a 30 day period should be positive for total coliform bacteria when more than one sample is collected b) No sample should contain more than 10 total coliform bacteria per 100 ml BCDWPR Water Quality Standards for Potable Water Heterotrophic Plate Count (HPC) 96% of the samples measured zero CFU/mL None GCDWQ 100% of the samples were less than 10 CFU/mL (pour plate, 35 C) Bacteriological monitoring conducted by the City of Vancouver includes testing for E. coli bacteria, Total Coliform bacteria and Heterotrophic Plate Count (HPC). All bacteriological samples are analyzed at the water lab within the BC Centre for Disease Control (BCCDC). This laboratory has been approved for use by the region s Medical Health Officer for assessing Vancouver s drinking water safety. Page 5
10 E. coli Zero samples were positive for E. coli in The analysis for Escherichia coli (E. coli) is an indicator test of fecal contamination that has been used in place of fecal coliform testing since April The E. coli group has a stringent standard of zero maximum acceptable concentration (MAC). If E. coli is found in the water, under the BCDWPA, the laboratory conducting the analysis must immediately notify the City and the Medical Health Officer. Together, an assessment will be made to determine the possible health risks and the most effective approach to protecting the public. This assessment will include a review of the bacteriological records, chlorine residuals, pressure levels; and other relevant factors. The water will be resampled immediately. If the risk assessment indicates the water system is operating within expected parameters, then a decision may be made to wait for confirmation of the follow-up sample results. However, if the assessment identifies a risk to water quality, immediate intervention may be necessary including issuing a boil water notice and corrective action taken in accordance with the City s Waterworks Emergency Response Plan. Total Coliform One sample in 2013 was positive for total coliform. The sampling station was retested immediately, and no subsequent total coliform was found. Zero samples contained more than 10 total coliform bacteria per 100 ml. Total coliform is a test of all bacteria within the coliform group. The detection of total coliform indicates possible conditions for pathogen or parasite contamination. HPC Results for Heterotrophic Plate Count (HPC) were predominately zero CFU/mL for This is consistent with previous years. HPC is a count of all heterotrophic micro-organisms and is a useful indicator for monitoring the effectiveness of disinfection and early signs of bacterial re-growth. HPC is not listed as a health standard; however, it serves to monitor general bacteriology in the drinking water distribution system. Page 6
11 3.4.2 Chemical and Physical Parameters Table 5: CoV Water Quality Results - Chemical and Physical Parameters 2013 Results Parameter Avg Max Min Guideline Reference Chlorine free (mg/l Cl 2 ) >0.2 mg/l Cl 2 EPA/WHO Chlorine total (mg/l Cl 2 ) <4 mg/l Cl 2 EPA Conductivity (µs/cm) None ph GCDWQ Temperature ( C) <15 deg C GCDWQ Turbidity (NTU) <1 NTU GCDWQ Chlorine Chlorine levels in the majority of the City s distribution system continued to be above minimum recommended levels in However, low chlorine residual did occur at a few stations this may be due to location (such as distribution endpoints), or chlorine demand caused by localized turbidity and/or higher water temperatures (as seen in summer months). However, all sampling stations identified with low chlorine residual had no indication of bacteriological impairment and were closely monitored by the City. Appendix E (Sampling Site Characterization) provides residual chlorine levels by month at each sampling station within the City. Chlorine is used to disinfect the water and safeguard against microbial re-growth or contamination in the distribution system. International guidelines recommend a chlorine residual (free) of at least 0.2 mg/l to protect drinking water. Conductivity Readings for conductivity in 2013 remained similar to previous years. Conductivity is a measure of the ability of water to pass an electrical current. The US EPA describes that conductivity in water is affected by the presence of inorganic dissolved solids such as chloride, nitrate, sulfate, and phosphate anions (ions that carry a negative charge) or sodium, magnesium, calcium, iron, and aluminum cations (ions that carry a positive charge). Conductivity in Vancouver depends on which source waters are feeding the distribution system at different Page 7

12 times of the year. Generally higher conductivity is seen during Seymour service periods and lower conductivity is seen during Capilano service periods. Overall, however, conductivity in Vancouver is considered low. See Appendix A Source Water Quality for the differences in conductivity levels of each watershed. ph Routine sampling of Vancouver s fifty-three stations showed average ph of 7.25 in This is similar to The region s source waters are a combination of rainfall and snowmelt. This type of supply results in very soft water defined by low amounts of dissolved calcium and magnesium. The region also experiences slightly acidic water. Soft and acidic water has the capacity to corrode. To reduce the corrosiveness of the water and lengthen the service of plumbing systems, Metro Vancouver utilizes ph adjustment under its Corrosion Control Program. Temperature Average water temperatures in the distribution system remained below 15 o C for most of the year, with the exception of summer months. Temperatures in the distribution system are directly related to source water seasonal changes. Temperatures above the aesthetic objective of15 o C enhance the growth of micro-organisms, which can impact aesthetic properties of taste, colour, odour, as well as accelerate corrosion. However, even during warmer periods, there was no sign of bacteriological impairment to the water in the City s distribution system. Figure 1: Monthly Average Water Temperatures in the Distribution System 2013 Page 8

13 Turbidity Since the launch of the Seymour Capilano Filtration Plant (SCFP), filtered water from the Seymour watershed has been improving the clarity of water throughout Vancouver. As such, turbidity levels have decreased considerably. In 2013, the City s dataset included numbers as low as 0.05 NTU. Turbidity is a measure of the relative clarity or cloudiness of water caused by fine suspended matter such as clay, silt, and organics. Turbidity is not a direct measure of these particles, but rather a general measure of the effect these particles have on light. Turbidity levels in Vancouver are most often related to levels at the source where periods of heavy rainfall can cause sediment and runoff to enter the watersheds. The SCFP has greatly reduced impacts to water quality during storm periods. Localized turbidity events can also be caused by water main flushing or construction work within the distribution system. Elevated turbidity events can pose an aesthetic concern for customers and can limit the effectiveness of disinfection. Appendix E shows turbidity levels for individual sampling stations. Turbidity above 1.0 NTU was briefly observed at some stations in 2013; however, these sites showed no signs of bacteriological impairment. Figure 2: Monthly Average Turbidity Levels in the Distribution System Page 9
14 3.4.3 Metals, Disinfection By-Products, VOCs, Aesthetics Table 6: CoV Water Quality Results - Metals, DBPs, VOCs, Aesthetics 2013 Category Parameter Results Guideline Reference Metals Copper All tested 1.0 mg/l (A/O) GCDWQ Iron sites were below 0.3 mg/l (A/O) GCDWQ Lead guidelines mg/l (MAC) GCDWQ Zinc See Appendix C 5.0 mg/l (A/O) GCDWQ Other Metals Analysis Parameter specific GCDWQ Disinfection Byproducts (DBPs) Haloacetic Acids (HAAs) Trihalomethanes (THMs) All tested sites were below guidelines MAC 100 ppb MAC 80 ppb GCDWQ GCDWQ See Appendix D Disinfection By products Results Volatile Organic Compounds Vinyl Chloride Not applicable Aesthetic Odour & Taste Case bycase assessment A/O = Aesthetic objective MAC = Maximum acceptable concentration MAC mg/l Not specified GCDWQ GCDWQ Metals Water in the City s distribution system consistently meets the Guidelines for Canadian Drinking Water Quality. In 2013, metal concentrations in the City s water distribution system were assessed on two separate occasions, once in the spring and again in the fall. These samples were collected by City staff and the analysis was performed by Metro Vancouver s laboratories. A summary of the results for metals is provided in Appendix C. Metal concentrations in drinking water at consumers taps can be affected by the age and materials used in household plumbing. In homes with metallic piping systems, leaching of metals can occur when Vancouver s Page 10
15 naturally soft and slightly acidic water sits stagnant in the pipes. To monitor the extent of dissolved metals in drinking water from household piping, the City, in partnership with Vancouver Coastal Health, conducted testing for metals at the taps of sixty-seven homes over a four year period. The results consistently showed that running the water for 20 seconds significantly lowers dissolved copper and lead (from plumbing systems with lead based solder and brass faucets) to below the Canadian guideline levels. DBPs In 2013, the running locational averages for trihalomethanes (THMs) in Vancouver s drinking water were below the guideline s maximum acceptable concentration. The running locational averages for haloacetic acids (HAAs) in Vancouver s drinking water were also below the guideline s maximum acceptable concentration. See Appendix D for total quarterly average results for THMs and HAAs by sampling location. Disinfection By-products (DBPs) are compounds formed by the interaction between chlorine and naturally occurring organic substances in the water, such as breakdown products of decaying leaves and vegetation. Two groups of DBPs are monitored within Vancouver s drinking water, THMs and HAAs. Within the THM group, chloroform is the compound found in the highest concentrations in drinking water, and as such has been most extensively studied with respect to health. Under the Canadian Guidelines the maximum acceptable concentration (MAC) for total THMs is 100 ppb (0.10 mg/l) and the MAC for HAAs is 80 ppb (0.08 mg/l). Both are based on locational running annual averages from quarterly samples. The guidelines are set conservatively and are based on a person consuming 1.5 litres of water per day over a seventy-year lifetime. VOCs Vinyl chloride testing is listed under the Volatile Organic Compounds category as per the WQMRP (see Table 3). Testing is required where poly-vinyl chloride (PVC) pipe is used in the distribution system. The ratio of PVC pipe in Vancouver is less than 0.1% and deemed insignificant for testing at this time. Page 11
16 Aesthetic Customers are able to contact the City to discuss concerns regarding water quality by dialing or The City makes every effort to provide timely follow-up to water quality inquiries. Common concerns seen in 2013 included chlorine smells from drinking water, occasional turbidity from local construction or flushing, and general questions regarding water treatment at the source waters. Aesthetic properties such as odour and taste can be subjective parameters. However, the City is able to use nearby sampling stations as markers for typical levels that should be seen up to a customer s property line. In some cases, private-side plumbing can impact water quality depending on the age of the internal plumbing system or types of materials used. Therefore, matters beyond the distribution system remain under private jurisdiction. Customers can use City water quality monitoring data as benchmarks for expected parameter levels within property lines. Water quality results are reported publicly through the City s water quality webpage - Page 12
17 4.0 Ensuring Assets are Well Managed and Resilient The City maintains more than 1,400 km of water mains, 100,000 service connections, 6,400 hydrants, 25,000 valves, and 25 pressure reducing valve (PRV) stations. The Utility also maintains a Dedicated Fire Protection System (DFPS) which consists of 11 km of 600 mm diameter steel pipeline that is designed to withstand the maximum credible seismic event for Vancouver. Expenditures fall into one of two major programs Capital and Operating. The capital program includes all expenses related to building new components of the water system which consists mainly of replacing infrastructure that has reached the end of its service life. The Operating program includes all works related to the ongoing cost of operating the water system, also referred to as system maintenance. 4.1 Capital Program Summary The capital investment in replacing and upgrading the water system in 2013 was approximately $12.3M and includes the replacement of distribution mains, transmission mains, valves, hydrants, services, pressure reducing valve (PRV) stations and various other minor appurtenances. The table below summarizes capital expenditures in Table 7: 2013 Waterworks Capital Program Expenditures Program Area Budget Expenditures Distribution Main Replacement 1 $ 6,450,947 $ 8,556,616 Transmission Main Replacement 6,070,000 1,518,003 Aging Service Replacement 1,930,000 1,407,390 Aging Meter Replacement 300, ,240 Fire Hydrant Program 250, ,909 PRV Replacement 100,000 - New Meter Purchases - 21,130 System Extention & Minor Improvement 275,000 - Dedicated Fire Protection System 2 (50,000) - Access to Water 60,000 50,104 Water Conservation Capital 40,000 28,633 Emergency Preparedness 125,000 - Telemetry System 65,041 51,650 Engineering & Site Investigation 150,679 56,283 Misc Water Quality Capital 3 (53,874) 25,915 Total 15,712,793 $ 12,318,873 Notes: 1 Purposely overspent to cover previous year's underspend. 2 Purposely underspent to cover previous year's overspend. 3 Budget reduction because w ork w as not required for Page 13

18 4.1.1 Distribution Main Replacement Program The single largest component of Waterworks annual Capital Plan is the Distribution Main Replacement Program. Since the early 1980 s, Vancouver has conducted an annual water main replacement program to manage the frequency and impacts of water main failures, and to improve system reliability. Since 2003, the target replacement rate for the distribution system has been 0.8% based on analysis regarding the lifespan of the City s water mains. Here is a summary of historic replacement rates: Figure 3: Annual Distribution Main Replacement Rate ( ) Note: 2012 underspent the budget to compensate for overspend in In 2013, approximately 8,800 metres, or 0.6% of distribution mains were replaced using City forces at a cost of approximately $8.6M. The 2013 replacement rate of 0.6% was below the long-term target of 0.8%, in response to a stable break rate in recent years. In addition, there was a reallocation of resources as the City s three water main construction crews worked on other programs for part of the year. These programs include the Pender Transmission Main, NEU Expansion, and site investigations. A large component of the 2013 replacement program included a number of significant infrastructure upgrades on downtown and arterial streets in advance of planned street reconstructions. Some of the highlights of the 2013 program include: West Georgia Street from Thurlow to Pender Street, West 4th Avenue from Burrard to Granville Street, and West King Edward Avenue from Marguerite to Arbutus Street. The average unit cost for typical distribution water main capital replacement on residential streets and arterial streets was $950 and $1,577 per metre respectively. The values are within 5% of the previous year s rates. Construction on arterial roads is more costly due to the extra effort necessary to manage traffic and higher street restoration costs associated with a thicker pavement to support heavy vehicles and traffic volumes. Page 14

19 The figure below illustrates unit costs over the past 10 years: Figure 4: Distribution Main Replacement Costs These costs include the installation of water mains, services, hydrants, air valves, and street restoration costs Transmission Main Replacement Project In November 2013, the City started construction on the Pender Transmission Main. The costs for 2013 were approximately $0.8M and the crews were able to install 50 meters of 750mm and 180 metres of 600mm ductile iron cement lined pipe. The pipe was installed along Pender Street east of Clark to Vernon Street and along Vernon Street south of Pender Street. This main will service the western portion of zone 442 and will provide a reliable water supply to the area. Figure 5: East Pender Street Transmission Main Construction Page 15

20 4.1.3 Georgia Street Trenchless Slip-lining Project Waterworks selects suitable water mains for trenchless rehabilitation. Relative to the open-cut alternative, trenchless rehabilitation has the potential to disrupt the environment less than the traditional open-cut installation. In 2013, approximately 600 metres of water main was installed trenchlessly by Waterworks Operations staff along West Georgia Street from Thurlow to Nicola Street. The project cost $1.0M and it is estimated that $120K to $170K in costs were saved relative to the open-cut installation alternative. Figure 6: Sliplining on Georgia Street Neighbourhood Energy Utility Expansion In the summer of 2013 Waterworks assisted the City s Neighbourhood Energy Utility (NEU) to construct branch and service connections to its existing system. The expansion was designed by a consultant but the construction was delivered using a combination of City Waterworks staff and private contractors. The branch and service connections were made in the Southeast False Creek area and capital costs were approximately $0.3M. Page 16

21 Figure 7: 2013 Neighbourhood Energy Utility Branch & Service Connections There are plans to further expand the NEU system in 2014 using Waterworks resources Service Installations The City conducts a replacement program for leaking service connections where it is more cost effective to replace than repair the service. Services are replaced according to the prescribed criteria when leaks are found, when the water main is being replaced, for new buildings or developments and as part of a service renewal program. In 2013, Waterworks Operations crews installed a number of services: Table 8: Service Installations Program Area Installations Existing Aging Services 115 Existing Leaking Services 319 New Commercial Services 152 New Residential Services 20 New Residential Services* 945 Total 1551 *Installed by a combined Water-Sew er crew for small redevelopments that require both a new w ater and sew er service. Page 17
22 4.2 Operating and Maintenance Programs The Water Utility s Operating and Maintenance budget supports maintenance of the water system to: Maximize the life of each of its components, To get the best value out of our assets, and To ensure that components are in good working order. The budget also allows for water utility staff to conduct reactive repairs in the case of system breaks and leaks to minimize service disruption to customers. In 2013, highlights include: All hydrants in the water system were inspected to ensure proper operation and checked for leakage, thereby meeting the water industry standard and best practice, Crews flushed approximately 30% of the system s water mains; just below the 33% target, and Large valves were exercised and maintained to ensure operation in the case of an emergency. In regard to operating and maintenance, the budget, expenditures, and revenues are shown in Table 9. Page 18
23 Table 9: 2013 Operations and Maintenance Budget, Expenditures, and Revenues Program Area Budget Expenditures Revenues Net Expenditure Water Main Maintenance $ 942,480 $ 1,002,399 $ (911) $ 1,001,488 Water Service Maintenance 1,050, ,891 (13,853) 919,038 Trouble/Shutoff Cal 264, ,450 (43,464) 256,986 Discontinue Service & Meter 150,380 91,973-91,973 Meter Maintenance 954, ,765 (400) 697,365 Hydrant Maintenance 475, ,102 (7,900) 423,202 Valve Maintenance 799, , ,781 Flushing Program 238, , ,778 Musqueam Maintenance 35, Proactive Leak Detection 153,240 79,279-79,279 Ops General Supply 142, ,263 (115) 189,148 Hydrant Damage Repairs 104,680 9,202 (1,196) 8,006 Telemetry & System Op 209, , ,324 General Ops Expenditure 312, ,934 (57,072) 364,862 Connection Control 50,250 31,905-31,905 AMR Metering Program 180, , ,393 TEOB Service - 4,574-4,574 Total $ 6,066,150 $ 5,503,796 $ (124,911) $ 5,378, Main Breaks The Water Utility participated in the 2013 National Benchmarking Program that compares municipalities across a number of indexes. Of the metrics compared, the number of main breaks is typically used as a proxy of the overall condition of a distribution system. In 2012, the City ranked well relative to similar municipal water systems. When compared to other Canadian municipalities of a similar scale, Vancouver s experienced fewer breaks while maintaining one of the older water systems. As such, it can be inferred that water mains chosen to be replaced over the years as part of the Distribution Main Replacement Program have reduced the system s overall risk of failure. In 2013 crews repaired 61 main breaks. Approximately 70% of water main breaks occur during the winter months between October and February. Figure 8 shows the history of water main breaks from 2003 to Page 19

24 Figure 8: Water Main Break History (2003 to 2013) Service Leak Repairs Many of the residential copper services in Vancouver were installed between the late 1950s and late 1960s. These copper services are now reaching the end of their normal life expectancy of approximately 50 years and the number of leaking services is expected to increase. In 2012, the maintenance budget for leaking services was overspent because of the large number of service repairs required. In 2013 this budget was increased to $1.05M and the City spent only 88% of this new budget as the number of service leaks unexpectedly dropped by about 15% from the previous years. Waterworks will continue to closely monitor the number of leaking services in the coming years to see how to best allocate resources and funding of this maintenance program Meters In 2013 crews completed 1,133 new water meter installations and 682 water meter replacements. Page 20
25 The utility has been able to replace many of the older small meters and some of the large industrial fire meters while many mid-sized meters for larger commercial and higher zoned residential properties are reaching the end of their lifespan. The ability to repair and calibrate these meters is becoming much more difficult and costly. In many cases the meter manufacturers are no longer producing parts because meters are usually replaced once they start to fail. While the Water Utility has funding to test, service and replace meters, the amount needs to be reviewed to ensure that it is adequate to support ongoing maintenance needs to allow meters to read accurately and to fund their replacement when they cannot perform their intended function. A sustainable long term funding strategy is being developed in response to the new metering policy that requires all new single and two-family residences to install a water meter. 5.0 Greenest City Goals for Clean Water Vancouver City Council has approved the work and budget for implementing the water consumption goals as part of the Greenest City Action Plan. The majority of this work has focused on water conservation in order to reduce per capita water consumption by 33% from 2006 levels. To date, the City has achieved a 17.6% reduction; more than halfway towards the 2020 goal. A summary of the progress to date is provided below: Figure 9: Greenest City Water Consumption Goal (Liters per Capita) While the City generally continues to show year over year declines in consumption, the rate of decline is slowing. In order to meet the Greenest City target by 2020, water consumption will continue to be monitored closely and new programs will be developed should the trend continue to slow. Page 21
26 As part of the Greenest City Action Plan, the City has also adopted a water quality target to meet or beat the strongest British Columbian, Canadian and appropriate international drinking water quality standards and guidelines. In 2013 and as comprehensively discussed in an earlier section of this report, water quality met all standards and guidelines set by the three agency levels. 5.1 Water Conservation & System Leakage Over the last three years, considerable effort has been spent reviewing the City s strategy to limit water losses in the system. In 2013, total water losses were estimated to be 12 billion litres, or 11% of total billed water purchased, a value of $7.2M. While this leakage rate is typical of water systems of comparable size and age, there remains an opportunity to reduce system leakage to realize operational savings and better the stewardship of this valuable resource. The current water loss reduction strategy consists of the following programs: Table 10: Water Loss Reduction Programs Program Proactive Leak Detection Survey Hydrant Leak Detection Survey Reactive Leak Detection Survey Pressure Management Description Distribution mains, services, other appurtenances Each Hydrant in the City is checked twice annually Based on resident or corporate feedback Pressures in certain parts of the City are lowered to reduce system leakage Furthermore, a number of water conservation programs were undertaken in 2013 to assist in further reducing water consumption. These are shown in the following table. Page 22
27 Table 11: Water Conservation Programs Program Small Business Water Efficiency Audits Water efficiency fixture retrofit Lawn Sprinkling Education and Enforcement Greenest City garden workshops Water efficiency in Parks and City Facilities Garden rain barrel program Indoor and outdoor water saving kits Water conservation school plays, H2 Whoa! Seasonal water rates Description Pilot scale for commercial properties Pilot scale for older building stock (rentals, condominiums) Educating and enforcing the sprinkling bylaw Neighbourhood scale engagement on outdoor water efficiency Fixture retrofits Subsidized rain barrels for residents Subsidized water efficient fixtures for homes Education for elementary school students Seasonal water rates for all metered customers (residential & commercial) 6.0 Financial Summary In 2013, the City purchased and delivered approximately 109,600,000 cubic metres of water from Metro Vancouver at a total cost of $66.4 million; bulk water purchases make up approximately 64% of all Waterworks expenditures. The revenues collected from water users cover the cost of water purchases and the remaining expenditures are made-up of financing for capital projects, water billing costs, and operation and maintenance expenses. The total of 2013 actual expenditures and revenues were within 1% of the forecasted budget. This is a good indication that estimates for water consumption are in line with current trends and that both operating and capital programs are well managed. Waterworks also carries a Water Rate Stabilization Reserve to provide a funding buffer for year-over-year variations in demand and increases of bulk water rates from Metro Vancouver. While approximately $1.5M was transferred out of the Stabilization Reserve due to lower than anticipated revenues, it is $1M less than budgeted. The following table displays the 2013 Waterworks Operating Budget alongside the actual year-end expenditures and revenues. Page 23
28 Table 12: 2013 Waterworks Expenditures and Revenues Expenditures Budget Actual City Debt Charges $ 26,922,730 $ 26,922,730 Water Purchases (Metro Vancouver) 65,988,600 66,412,060 Water Rates Billing 691, ,006 Operating & Maintenance 11,401,951 10,403,406 Total Expenditures $ 105,005,145 $ 104,359,202 Revenue Budget Actual Flat Rate $ 44,605,630 $ 44,019,537 Metered Rate 52,117,330 52,675,590 Meter Service Charge 2,498,550 3,548,975 Fire Line Flat Rate 3,434,830 2,601,503 Other Revenues 3,140 6,487 Total Revenues $ 102,659,480 $ 102,852,092 Transfer from Stabilization Reserve $ 2,345,665 $ 1,507,111 Total Revenues (incld. Transfer) $ 105,005,145 $ 104,359,202 Even though the cost of bulk water purchases have been increasing, water consumption in Vancouver has been generally decreasing over the last several years, offsetting the overall impact. 7.0 Summary In 2013, there were many accomplishments in terms of policy, maintenance, and construction. A number of initiatives were undertaken in order to reduce overall water use by the target of 33% from 2006 levels by the year These initiatives consisted mostly of the water conservation and leak detection programs. Construction crews constructed distribution mains, transmission mains, and the neighbourhood energy utility (NEU) infrastructure. About 8.8km of distribution main and 230m of the Pender Transmission main was constructed. In addition waterworks operations staff installed branch and service connections for the NEU. Operations and maintenance programs continued in These programs are necessary to ensure the operation and reliability of the water system. Water quality also continued to meet provincial, federal and international standards and guidelines. In 2014, there will be a continued effort to monitor performance across the utility to fine tune expenditures and target water system investments in order to meet three goals: 1) Ensuring that the drinking water quality delivered to customers meets all relevant health and quality guidelines, 2) Ensuring that water system assets are well managed and resilient, and 3) Making progress on the City s water consumption and water quality targets adopted as part of the Greenest City Action Plan s Clean Water goal, effectively offsetting population growth through efficient water use. Page 24
29 Appendix A - Source Water Quality


30


31

32
33 Appendix B - Water Sampling Stations (Map)

34
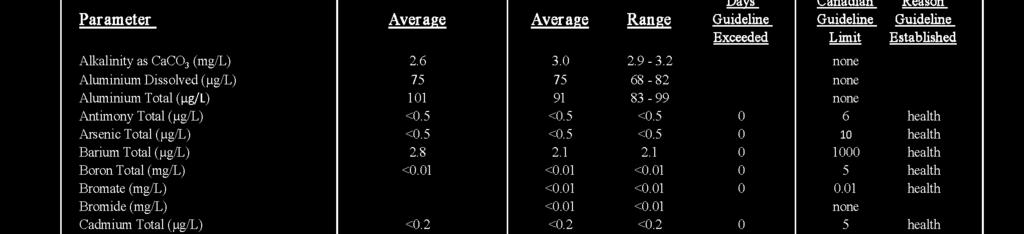
35 Appendix C - Metals Analysis
36 Metals Analysis of CoV Distribution System 2013 (Metals analysis performed by Metro Vancouver laboratory) 14-May COV-09 COV-19 COV-26 COV-34 COV Nov May Nov May Nov May Nov May Nov Canadian Guideline Aluminum Total mg/l <0.2 (A/O) Antimony Total mg/l < < < < < < < < < < Arsenic Total mg/l < < < < < < < < < < Barium Total mg/l Boron mg/l <0.010 <0.010 <0.010 <0.010 <0.010 <0.010 <0.010 <0.010 <0.010 < Cadmium Total mg/l < < < < < < < < < < Calcium Total mg/l none req d Chromium Total mg/l < < < < Cobalt Total mg/l < < < < < < < < < < none Copper Total mg/l < (A/O) Iron Total mg/l < (A/O) Lead Total mg/l < < < < < < < < < < Magnesium Total mg/l none req d Manganese Total mg/l (A/O) Mercury Total mg/l < < < < < < < < < < Molybdenum Total mg/l < < < < < < < < < < None Nickel Total mg/l < < < < < < < < < < None Potassium Total mg/l None Selenium Total mg/l < < < < < < < < < < Silver Total mg/l < < < < < < < < < < none req d Sodium Total mg/l (A/O) Zinc Total mg/l <0.003 <0.003 <0.003 <0.003 <0.003 <0.003 <0.003 <0.003 <0.003 < (A/O) 1. A/O - Aesthetic Objective 2. Copper, iron, lead and zinc require semi-annual testing as per the Water Quality Monitoring and Reporting Plan for the GVRD and Member Municipalities, Since the method for metals analysis produces other metal results, these values are also provided.
37 Appendix D - Disinfection By-products
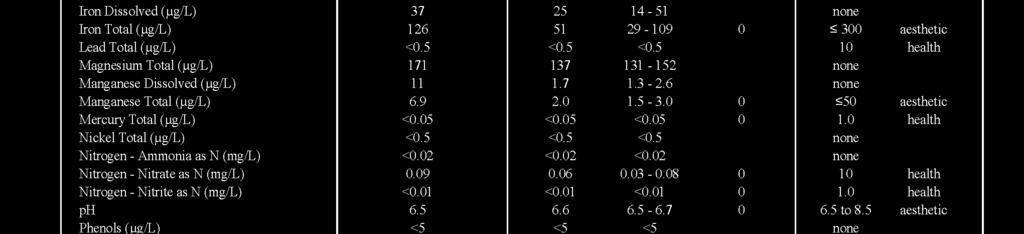
38 THM (ppb) HAA (ppb) Sample Date Sampled Bromodichloromethane Bromoform Chlorodibromomethane Chloroform Total Trihalomethanes Total THM Quarterly Average (MAC = 100 ppb) Dibromoacetic Acid Dichloroacetic Acid Monobromoacetic Acid Monochloroacetic Acid Trichloroacetic Acid Total Haloacetic Acid Total HAA Quarterly Average (MAC = 80 ppb) COV 03 5/10/2012 <1 <1 < < < COV 03 8/30/2012 <1 <1 < < <1 < COV 03 11/29/2012 <1 <1 < < <1 < COV 03 2/21/2013 <1 <1 < < COV 03 5/16/2013 <1 <1 < < < COV 03 9/19/ <1 < <0.5 3 < COV 03 11/28/2013 <1 <1 < <0.5 8 < COV 07 5/10/2012 <1 <1 < < < COV 07 8/30/2012 <1 <1 < <0.5 8 < COV 07 11/29/2012 <1 <1 < <0.5 8 < COV 07 2/21/2013 <1 <1 < < < COV 07 5/16/2013 <1 <1 < <0.5 7 <1 < COV 07 9/19/2013 <1 <1 < < < COV 07 11/28/2013 <1 <1 < <0.5 7 < COV 24 5/10/2012 <1 <1 < < < COV 24 8/30/2012 <1 <1 < <0.5 8 < COV 24 11/29/2012 <1 <1 < <0.5 9 <1 < COV 24 2/21/2013 <1 <1 < <0.5 6 <1 < COV 24 5/16/2013 <1 <1 < <0.5 8 < COV 24 9/19/2013 <1 <1 < <0.5 9 < COV 24 11/28/2013 <1 <1 < <0.5 7 < COV 28 5/10/2012 <1 <1 < < < COV 28 8/30/2012 <1 <1 < < <1 < COV 28 11/29/2012 <1 <1 < <0.5 9 < COV 28 2/21/2013 <1 <1 < <0.5 6 < COV 28 5/16/2013 <1 <1 < < < COV 28 9/19/ <1 < <0.5 7 < COV 28 11/28/2013 <1 <1 < <0.5 8 <
39 THM (ppb) HAA (ppb) Sample Date Sampled Bromodichloromethane Bromoform Chlorodibromomethane Chloroform Total Trihalomethanes Total THM Quarterly Average (MAC = 100 ppb) Dibromoacetic Acid Dichloroacetic Acid Monobromoacetic Acid Monochloroacetic Acid Trichloroacetic Acid Total Haloacetic Acid Total HAA Quarterly Average (MAC = 80 ppb) COV 30 8/30/2012 <1 <1 < < <1 < COV 30 11/29/2012 <1 <1 < <0.5 9 <1 < COV 30 2/21/2013 <1 <1 < <0.5 5 <1 < COV 30 5/16/2013 <1 <1 < < < COV 30 9/19/2013 <1 <1 < <0.5 9 < COV 30 11/28/2013 <1 <1 < <0.5 8 < COV 46 5/10/2012 <1 <1 < COV 46 8/30/2012 <1 <1 < COV 46 11/29/2012 <1 <1 < COV 46 2/21/2013 <1 <1 < COV 46 5/16/2013 <1 <1 < COV 46 9/19/ <1 < COV 46 11/28/2013 <1 <1 < COV 54 5/10/2012 <1 <1 < < < COV 54 8/30/2012 <1 <1 < < <1 < COV 54 11/29/2012 <1 <1 < <0.5 8 <1 < COV 54 2/21/2013 <1 <1 < < <1 < COV 54 5/16/2013 <1 <1 < < < COV 54 9/19/2013 <1 <1 < <0.5 7 < COV 54 11/28/2013 <1 <1 < <0.5 6 < COV 55 5/10/2012 <1 <1 < < < COV 55 8/30/2012 <1 <1 < < < COV 55 11/29/2012 <1 <1 < <0.5 8 <1 < COV 55 2/21/2013 <1 <1 < < < COV 55 5/16/2013 <1 <1 < <0.5 7 <1 < COV 55 9/19/2013 <1 <1 < < < COV 55 11/28/2013 <1 <1 < <0.5 6 <
40 Sample Date Sampled Bromodichlorometh ane Bromoform Chlorodibromometh ane THM (ppb) Chloroform Total Trihalomethanes Total THM Quarterly Average (MAC = 100 ppb) Dibromoacetic Acid Dichloroacetic Acid Monobromoacetic Acid Monochloroacetic Acid HAA (ppb) Trichloroacetic Acid Total Haloacetic Acid Total HAA Quarterly Average (MAC = 80 ppb) COV 58 8/30/2012 <1 <1 < <0.5 9 <1 < COV 58 11/29/2012 <1 <1 < <0.5 8 < COV 58 2/21/2013 <1 <1 < <0.5 9 <1 < COV 58 5/16/2013 <1 <1 < <0.5 7 <1 < COV 58 9/19/2013 <1 <1 < < < COV 58 11/28/2013 <1 <1 < <0.5 8 < COV 62 5/10/2012 <1 <1 < COV 62 8/30/2012 <1 <1 < COV 62 11/29/2012 <1 <1 < COV 62 2/21/2013 <1 <1 < COV 62 5/16/2013 <1 <1 < COV 62 9/19/ <1 < COV 62 11/28/2013 <1 <1 <
41 Appendix E - Sampling Site Characterization
42
43
44
45
46
47
48
49
50
51

52
53
54
55
56

57
Water Utility Annual Report
 Water Utility Annual Report Table of Contents 1.0 City of Vancouver s Water Utility... 1 2.0 Source Water... 1 3.0 Vancouver s Drinking Water Quality... 2 3.1 Drinking Water Standards... 2 3.2 Monitoring
2016 Performance Report FRenCh Creek
 2016 Performance Report FRenCh Creek 2016 PERFORMANCE HIGHLIGHTS Table of Contents Operational Excellence 3 Measuring Success 3 2016 Highlights 3 Water Quality & Quality Assurance 4 Safety 6 Customer Care
NANOOSE BAY PENINSULA
 NANOOSE BAY PENINSULA Water Service Area Annual Report 2010 Prepared by: REGIONAL DISTRICT OF NANAIMO Water Services Department June 2011 6300 Hammond Bay Rd, Nanaimo, BC Canada V9T 6N2 Ph 250-390-6560
Progress Report for the Drinking Water Management Plan
 drinking water Progress Report for the Drinking Water Management Plan quality on tap for the GVWD and Member Municipalities June 2010 Progress Report for the Drinking Water Management Plan for the GVWD
Drinking Water Quality and Compliance SaskWater Wakaw-Humboldt Potable Water Supply System and Treatment Plant 2017 Notification to Consumers
 Drinking Water Quality and Compliance SaskWater Wakaw-Humboldt Potable Water Supply System and Treatment Plant 2017 Notification to Consumers The Water Security Agency (WSA) requires that, at least once
Drinking Water Quality and Compliance SaskWater Wakaw-Humboldt Potable Water Supply System and Treatment Plant 2016 Notification to Consumers
 Drinking Water Quality and Compliance SaskWater Wakaw-Humboldt Potable Water Supply System and Treatment Plant 2016 Notification to Consumers The Water Security Agency (WSA) requires that, at least once
Drinking Water Quality and Compliance SaskWater Melville Water Supply System 2017 Notification to Consumers
 Drinking Water Quality and Compliance SaskWater Melville Water Supply System 2017 Notification to Consumers The Water Security Agency (WSA) requires that, at least once each year, waterworks owners provide
2017 FReNCH CReeK PerFormanCe Report
 2017 FReNCH CReeK PerFormanCe Report TABLe OF ContentS About us Quality Assurance Safety and Environment Customer Care Operational Excellence 3 4 7 8 9 ABOUT US EPCOR has been providing clean drinking
Drinking Water Quality 2017 ANNUAL REPORT
 Drinking Water Quality 2017 ANNUAL REPORT TABLE OF CONTENTS INTRODUCTION 5 REGULATORY CONTEXT 5 Provincial/Federal Regulatory Requirements 5 Regional Health Authority Requirements 5 Metro Vancouver Requirements
Drinking Water Quality and Compliance SaskWater Codette Lake Potable Water Supply System 2017 Notification to Consumers
 Drinking Water Quality and Compliance SaskWater Codette Lake Potable Water Supply System 2017 Notification to Consumers The Water Security Agency (WSA) requires that, at least once each year, waterworks
City of Morden Public Water System Annual Report 2016
 City of Morden Public Water System Annual Report 26 This report is available online at the City of Morden website - www.mordenmb.com as of March 3 st, 26 Email Town address is: tmorden@mordenmb.com Paper
WATER. Town of Osoyoos. Annual Water Report. Submitted by: Prepared by: Town of Osoyoos Main Street Box 3010 Osoyoos, BC V0H 1V0
 2014 WATER Submitted by: Town of Osoyoos 8707 Main Street Box 3010 Osoyoos, BC V0H 1V0 Prepared by: Ron Doucette Director of Operational Services August 2015 Town of Osoyoos Annual Water Report Table of
VILLAGE OF BELCARRA DRINKING WATER QUALITY ANNUAL REPORT
 VILLAGE OF BELCARRA DRINKING WATER QUALITY ANNUAL REPORT 2014 June 2015 J:\3 WATER\Water Quality Report data\2014\vob Drinking Water Quality Annual Report 2014.docx Village of Belcarra Drinking Water Quality
City of Flint October, 2015 Quarter Water Quality Report
 Customer Service Center City Hall 1101 S. Saginaw St. Postage Flint, MI 48501 City of Flint October, 2015 Quarter Water Quality Report The Quarterly Water Quality Report provides important information
Village of McBride Annual Water System Report
 Village of McBride Annual Water System Report - 2016 June 2017 The Village of McBride Annual Water System Report - 2016 McBride Water System Annual Report for 2016 In 2016 the McBride water system supplied
Durban Height Waterworks, Design capacity: 615 ML/d, Period: 01 July June 2014
 Durban Height Waterworks, Design capacity: 615 ML/d, Period: 01 July 2013-30 June 2014 Durban Heights WW Raw Durban Heights WW Final Determinands Units Minimum Average Percentile Maximum Minimum Average
WILDERNESS MOUNTAIN WATER SERVICE 2014 ANNUAL REPORT OCTOBER 5, 2015
 WILDERNESS MOUNTAIN WATER SERVICE 2014 ANNUAL REPORT OCTOBER 5, 2015 Purpose of the Annual General Meeting The agenda for the Annual General Meeting (AGM) is approved by the members of the Commission.
VILLAGE OF LIONS BAY DRINKING WATER QUALITY ANNUAL REPORT
 VILLAGE OF LIONS BAY DRINKING WATER QUALITY ANNUAL REPORT FY 2014 TABLE OF CONTENTS Contents INTRODUCTION 1 GENERAL DESCRIPTION 2 LICENSES 2 SOURCE WATER 3 ISSUES 3 CHALLENGES 3 TESTING & RESULTS 4 WATER
Raw Potable Well Water Analysis: Grid Water Analysis: 2009 & 2016
 Raw Potable Well Analysis: 2006-2016 Grid Analysis: 2009 & 2016 Sun Peaks, British Columbia Sun Peaks Utilities Co., Ltd. 1280 Alpine Road Sun Peaks, BC V0E 5N0 Tel: 250-578-5490 Fax: 250-578-5516 Email:
2005 Annual Drinking Water Quality Report Currituck County Water PWS ID#
 2005 Annual Drinking Quality Report Currituck County PWS ID# 04-27-010 We are pleased to present to you this year's Annual Drinking Quality Report. This report is a snapshot of last year s water quality.
2. Reporting Requirements under Section 11 O. Reg. 170/03
 2017 Annual Drinking Water System Report Port Dover Drinking Water System 1. Introduction The Corporation of rfolk County has prepared this report to satisfy the requirements of Section 11 of Ontario Regulation
DEEP BAY IMPROVEMENT DISTRICT ANNUAL WATER SYSTEM REPORT Mountainview Road Phone/Fax:
 ANNUAL WATER SYSTEM REPORT 2015 5031 Mountainview Road Phone/Fax: 250-757-9312 Bowser, BC V0R 1G0 www.dbid.ca 1 Introduction This annual report describes the Deep Bay Improvement District (DBID) water
2009 Summary Report for Municipalities
 2009 Summary Report for Municipalities (As per Schedule 22 of O. Reg. 170/03) The Onaping Potable Water System - #220003519 Certificate of Approval 1414-0696HD3 0014-6MQQFQ Prepared by: Jean-Marc Joliat
CITY OF GRANITE FALLS 2017 DRINKING WATER QUALITY REPORT
 P a g e 1 City of Granite Falls 206 S. Granite Avenue / P.O. Box 1440 Granite Falls, Washington 98252 P 360/691-6441 F 360/691-6734 www.ci.granite-falls.wa.us CITY OF GRANITE FALLS 2017 DRINKING WATER
DISCUSSION PAPER. 1 Introduction. 2 Existing Legislation and Guidelines
 DISCUSSION PAPER Arrowsmith Water Service Englishman River Water Intake Study Phase 1 Conceptual Planning Discussion Paper 4-2 Drinking Water Quality Criteria Prepared by: Keith Kohut and Matt Henney Issued:
DRINKING WATER QUALITY 2014 ANNUAL REPORT
 DRINKING WATER QUALITY 2014 ANNUAL REPORT i Executive Summary This report provides an analysis of the Drinking Water Quality of the water produced in the City of North Battleford and the results of the
Meeting Standards. Surpassing Expectations.
 At PWC, we care deeply about the quality of the water we provide for our customers, and we re proud of the exceptional standards we maintain. Each year, we publish a Quality Report with the results of
2012 Greater Vernon Water Master Water Plan Technical Memorandum No.7. Water Treatment
 REGIONAL DISTRICT of NORTH OKANAGAN TM7 SUMMARY PAPER File No. 5700.15.11 SUBJECT: 2012 Greater Vernon Water Master Water Plan Technical Memorandum No.7. Water Treatment Summary date: November 2015 / Updated:
City of Plymouth Consumer Confidence Report & Annual Water Quality Report
 City of Plymouth 2015 Consumer Confidence Report & Annual Quality Report The City of Plymouth is pleased to inform you that in 2015, we have surpassed the water quality standards required by the U.S. Environmental
2017 Annual Consumer Confidence Report Naval Station, Guantanamo Bay (NSGB)
") 2017 Annual Consumer Confidence Report Naval Station, Guantanamo Bay (NSGB) WATER SOURCE AND TREATMENT We are pleased to provide you with the 2017 Annual Drinking Water Quality Report. This report is designed
2017 Annual Consumer Confidence Report Naval Station, Guantanamo Bay (NSGB) WATER SOURCE AND TREATMENT We are pleased to provide you with the 2017 Annual Drinking Water Quality Report. This report is designed
CITY OF ST. LOUIS Water Quality Report 2016
 CITY OF ST. LOUIS Water Quality Report 2016 In compliance with the Safe Drinking Water Act, the City of St. Louis Water Division is delivering this Water Quality Report to all its customers who receive
City of Toledo 2007 Water Quality Report Quality on Tap
 City of Toledo 2007 Water Quality Report Quality on Tap Once again, we're pleased to present this year's Annual Water Quality Report. This report is designed to inform you about the quality of water and
District of Peachland Annual Drinking Water Report 2017
 District of Peachland Annual Drinking Water Report 2017 1 INTRODUCTION The District of Peachland is legally required by the Drinking Water Protection Act to provide an annual report on their water supply
ANNUAL WATER QUALITY REPORT FOR CALENDAR YEAR 2013 CITY OF POUGHKEEPSIE
 ANNUAL WATER QUALITY REPORT FOR CALENDAR YEAR 2013 CITY OF POUGHKEEPSIE 26 Howard Street Poughkeepsie, New York Federal Public Water Supply ID #NY1330291 Introduction: To comply with State regulations,
City of Greenvil e Drinking Water Consumer Confidence Report For P a g e
 City of Greenville Drinking Water Consumer Confidence Report For 2017 1 P a g e Introduction The City of Greenville has prepared the following report to provide information to you, the consumer, on the
CHILLICOTHEMO Annual Water Quality Report Consumer Confidence Report
 This report is intended to provide you with important information about your drinking water and the efforts made to provide safe drinking water. Attencion! Este informe contiene información muy importante.
DETERMINING APPROPRIATE DRINKING WATER CHEMICAL AND PHYSICAL MONITORING GUIDELINES
 Page 1 DETERMINING APPROPRIATE DRINKING WATER CHEMICAL AND PHYSICAL MONITORING GUIDELINES 1. Purpose To assist in determining Chemical Standards that are applicable to the water in a water supply system
City of Redding Water Utility 2006 Consumer Confidence Report
 City of Redding Water Utility 26 Consumer Confidence Report Water Supply Sources Our water sources include surface water from the Sacramento River and Whiskeytown Lake and groundwater from the Redding
City of Olathe. Annual Water Quality Report
 2018 City of Olathe Annual Water Quality Report I am pleased to present our annual Consumer Confidence Report covering the 2017 calendar year. This report confirms that your water meets or exceeds all
Drinking-Water Systems Regulation O. Reg. 170/03
 SECTION 11 ANNUAL REPORT Drinking-Water System Number: 210000194 Drinking-Water System Name: Minden Hills DWS Drinking-Water System Owner: Township of Minden Hills Drinking-Water System Category: Large
CHILLICOTHEMO Annual Water Quality Report Consumer Confidence Report
 This report is intended to provide you with important information about your drinking water and the efforts made to provide safe drinking water. Attencion! Este informe contiene información muy importante.
Contents 1 INTRODUCTION 1 2 BACKGROUND 1 Water System Background 1 3 WATER TREATMENT 3 Existing Water Systems 3 Water Quality Regulations and Treated
 Contents 1 INTRODUCTION 1 2 BACKGROUND 1 Water System Background 1 3 WATER TREATMENT 3 Existing Water Systems 3 Water Quality Regulations and Treated Water Goals 4 Long Term Water Treatment Goals 5 Powers
Windsor Utilities Commission 3665 Wyandotte Street East Windsor, ON N9A 5T7
 Windsor Utilities Commission Water Treatment Plant 2010 Annual Compliance Report Windsor Utilities Commission 3665 Wyandotte Street East Windsor, ON N9A 5T7 2010 Annual Compliance Report Table of Contents
Drinking-Water Systems Regulation O. Reg. 170/03
 SECTION 11 ANNUAL REPORT Drinking-Water System Number: 210000194 Drinking-Water System Name: Minden Hills DWS Drinking-Water System Owner: Township of Minden Hills Drinking-Water System Category: Large
Sample Number: Type of Water: Collection Date and Time: Received Date and Time: Date Completed: Revised Report
 Informational Water Quality Report Citycheck Standard Client: Ordered By: Pure Effect Filters.com PO Box 50052 Staten Island, NY 10305 ATTN: Igor Milevsky Sample Number: Location: Type of Water: Collection
Village of Lockland, Ohio. What s On Tap?
 Village of Lockland, Ohio What s On Tap? 206 Water Quality Consumers Confidence Report Last year your Lockland tap water met all US EPA and State EPA drinking water health standards! This pamphlet, What
Welland Water System 2002 First Quarterly Report
 Welland Water System 2002 First Quarterly Report Required under legislation by ONTARIO REGULATION 459/00 made under the ONTARIO WATER RESOURCES ACT, we are proud to present our 2001 THIRD QUARTERLY REPORT.
CALA Directory of Laboratories
 CALA Directory of Laboratories Membership Number: 1429 Laboratory Name: Saint John Laboratory Services Ltd. Parent Institution: Address: 1216 Sand Cove Rd. Saint John NB E2M 5V8 Contact: Dr. Apollos Ikejiani
2017 Annual Drinking Water Quality Report Town of Banner Elk PWSID #: Date: 2/19/18
 2017 Annual Drinking Quality Report Town of Banner Elk PWSID #: 01-06-015 Date: 2/19/18 We are pleased to present to you this year's Annual Drinking Quality Report. This report is a snapshot of last year
CONSUMER CONFIDENCE REPORT Montville Township Water Department PWSID# NJ Reporting Period - January 1, 2017 to December 31, 2017
 CONSUMER CONFIDENCE REPORT Montville Township Water Department PWSID# NJ1421003 Reporting Period - January 1, 2017 to December 31, 2017 The Montville Township Water Department offices are located in the
2012 ANNUAL DRINKING WATER SYSTEM SUMMARY REPORT Dereham Centre Water System
 2012 ANNUAL DRINKING WATER SYSTEM SUMMARY REPORT Dereham Centre Water System 1. GENERAL INFORMATION This report summarizes test results and operating conditions for municipal drinking water systems in
The Municipality of the Village of Lions Bay DRINKING WATER QUALITY ANNUAL REPORT '2 12. Works Department
 ( The Municipality of the Village of Lions Bay DRNKNG WATER QUALTY ANNUAL REPORT '2 12 Works Department The Municipality of the Village of lions Bay DRNKNG WATER QUAliTY ANNUAl REPORT CONTENTS Description
CALIFORNIA STATE ENVIRONMENTAL LABORATORY ACCREDITATION PROGRAM Accredited Fields of Testing
 CALIFORNIA STATE ENVIRONMENTAL LABORATORY ACCREDITATION PROGRAM Accredited Fields of Testing Basic Laboratory, Inc. 2218 Railroad Avenue Redding, CA 96001 Phone: (530) 243-7234 Field of Testing: 101 -
Quality REPORT. annual. Presented By SJWTX Glenwood Subdivision. Water Testing Performed in 2017 PWS ID#:
 annual Quality REPORT Water Testing Performed in 2017 Presented By SJWTX Glenwood Subdivision Este reporte incluye informacion importante sobre el agua para tomar. Para asistencia en español, favor de
2015 Consumer Confidence Report RAF Feltwell
 2015 Consumer Confidence Report RAF Feltwell Illustration provided by: Hailey Holmes (1st grade) Winner of RAFL Elementary Save Water Drawing Contest 2015 Consumer Confidence Report (CCR) Annual Water
Middlefield Village Water Department Drinking Water Consumer Confidence Report 2016
 Middlefield Village Water Department Drinking Water Consumer Confidence Report 2016 The Village of Middlefield has prepared the following report to provide information to you, the consumer, on the quality
Annual Drinking Water Quality Report Town of Wise Water Treatment Plant PWSID #
 Annual Drinking Water Quality Report Town of Wise Water Treatment Plant PWSID # 1195958 INTRODUCTION This Annual Drinking Water Quality Report for calendar year 2018 is designed to inform you about your
City of Dearborn Heights Department of Public Services Van Born Road Dearborn Heights, Michigan (313) Water Quality Report
 Water Quality Report") What is this Report About? City of Dearborn Heights Department of Public Services 24600 Van Born Road Dearborn Heights, Michigan 48125 (313) 791-6000 2014 Water Quality Report The following report was
What is this Report About? City of Dearborn Heights Department of Public Services 24600 Van Born Road Dearborn Heights, Michigan 48125 (313) 791-6000 2014 Water Quality Report The following report was
2014 Caledonia and Cayuga Distribution System Annual Water Quality Report
 2014 Caledonia and Cayuga Distribution System Annual Water Quality Report January 1, 2014 December 31, 2014 TABLE OF CONTENTS QUALITY MANAGEMENT SYSTEM POLICY 2 DRINKING WATER SYSTEM 3 CALEDONIA AND CAYUGA
Annual Drinking Water Quality Report for 2015
 Annual Drinking Water Quality Report for 2015 Bolton Water District Town of Bolton, 4949 Lake Shore Drive, Bolton Landing, NY 12814 (Public Water Supply Identification Number NY5600101) INTRODUCTION We
Annual Drinking Water Quality Report
 THE CITY OF PORT HURON - CALENDAR YEAR 2016 Annual Drinking Water Quality Report Port Huron Water Treatment Plant, Port Huron, MI 48060 810.984.9780 RIGHT TO KNOW RULE PASSED In 1998, a new Federal rule
INTRODUCTION WHERE DOES OUR WATER COME FROM? Source Water Assessment Summary
 Annual Drinking Water Quality Report for 2016 Lusk and Stony Lonesome Water Treatment Plants Directorate of Public Works West Point, New York (Public Water Supply ID# 3511887 and 3511338) INTRODUCTION
CANADA BRITISH COLUMBIA WATER QUALITY MONITORING AGREEMENT
 CANADA BRITISH COLUMBIA WATER QUALITY MONITORING AGREEMENT WATER QUALITY ASSESSMENT OF Fraser River AT RED PASS (1984 4) Prepared by: L. G. Swain, P. Eng. B.C. Ministry of Environment Prepared for: B.C.
French Creek Well # 2 Water Analysis Behind 1221 Ormonde Road
 French Creek Well # 2 Water Analysis Behind 1221 Ormonde Road October 27 2010 Inorganics Fluoride 1.5 MAC 0.17 0.13
CANADA BRITISH COLUMBIA WATER QUALITY MONITORING AGREEMENT
 CANADA BRITISH COLUMBIA WATER QUALITY MONITORING AGREEMENT WATER QUALITY ASSESSMENT OF Elk River AT SPARWOOD (2 5) Prepared by: L. G. Swain, P. Eng. B.C. Ministry of Environment Prepared for: B.C. Ministry
City of Plymouth Consumer Confidence Report & Annual Water Quality Report
 City of Plymouth 2017 Consumer Confidence Report & Annual Quality Report Drinking water quality is important to our community and the region. The City of Plymouth and the Great Lakes Authority (GLWA) are
2008 Water Quality Report
 Mt. Hamilton Community Water System 2008 Water Quality Report This report contains important information about your drinking water and is made available to you as a requirement of the Safe Drinking Water
Guidance on Controlling Corrosion in Drinking Water Distribution Systems
 ITEM 4.01a Guidance on Controlling Corrosion in Drinking Water Distribution Systems Federal-Provincial-Territorial Committee on Drinking Water Federal-Provincial-Territorial Committee on Health and the
WATER QUALITY REPORT
 2018 WATER QUALITY REPORT monitors for numerous contaminants to ensure your water Samples are collected from the water s source, as fresh snowmelt in the mountains, all the way to the tap at residents
Radford Army Ammunition Plant PWSID # Consumer Confidence Report (Water Quality Report)
") Radford Army Ammunition Plant PWSID # 1121643 2015 Consumer Confidence Report (Water Quality Report) INTRODUCTION This Annual Drinking Water Quality Report for calendar year 2015 is designed to inform
Radford Army Ammunition Plant PWSID # 1121643 2015 Consumer Confidence Report (Water Quality Report) INTRODUCTION This Annual Drinking Water Quality Report for calendar year 2015 is designed to inform
CITY OF ST. CATHARINES WATER DISTRIBUTION SYSTEM 2005 ANNUAL REPORT Waterworks #
 CITY OF ST. CATHARINES WATER DISTRIBUTION SYSTEM 2005 ANNUAL REPORT Waterworks # 260003279 The City of St. Catharines presents its 2005 annual report on drinking water quality. This report has been prepared
2017 Consumer Confidence Report (CCR)
") 2017 Consumer Confidence Report (CCR) Annual Water Quality Report RAF Lakenheath United Kingdom Introduction This is an annual report detailing aspects of the water quality delivered to Royal Air Force
2017 Consumer Confidence Report (CCR) Annual Water Quality Report RAF Lakenheath United Kingdom Introduction This is an annual report detailing aspects of the water quality delivered to Royal Air Force
2016 Consumer Confidence Report (CCR)
") 2016 Consumer Confidence Report (CCR) Annual Water Quality Report RAF Mildenhall United Kingdom Introduction This is an annual report on the water quality delivered for Royal Air Force Mildenhall (RAFM).
2016 Consumer Confidence Report (CCR) Annual Water Quality Report RAF Mildenhall United Kingdom Introduction This is an annual report on the water quality delivered for Royal Air Force Mildenhall (RAFM).
CITY OF BILLINGS 2018 WATER QUALITY REPORT
 CITY OF BILLINGS 2018 WATER QUALITY REPORT IN THIS ISSUE What is this Report? Special Population Advisory. More Information EPA Regulations Data Table Definitions Water Quality Data Table Secondary Contaminants
2014 Water Quality Report
 2014 Water Quality Report Dear Lincoln Park Water Customer: As mandated by the ed States Environmental Protection Agency, and prompted by the passage of the 1996 Federal Safe Drinking Water Act, we are
Quarterly Drinking Water Quality Report 1 April 2018 to 30 June 2018 FOR PUBLIC RELEASE
 Quarterly Drinking Water Quality Report 1 April 2018 to 30 June 2018 1 1 April 2018 to 30 June 2018 Quarterly Drinking Water Quality Report Essential Water produces this report to inform Essential Water
Annual Drinking Water Quality Report for Village of Lisle 2612 Liberty Street P.O. Box 729 Whitney Point, NY 13862
 Annual Drinking Water Quality Report for 2016 Village of Lisle 2612 Liberty Street P.O. Box 729 Whitney Point, NY 13862 Public Water Supply ID# NY0301671 TDD# 1 800 662 1220 INTRODUCTION To comply with
2013 ANNUAL DRINKING WATER SYSTEM SUMMARY REPORT Mount Elgin Water System
 2013 ANNUAL DRINKING WATER SYSTEM SUMMARY REPORT Mount Elgin Water System 1. GENERAL INFORMATION Oxford County prepares a report summarizing system operation and water quality for every municipal drinking
Drinking Water Quality Report for the Hartlepool Public Water Supply Zone (HP08) Report period: January 2017 to December 2017
 Report period: January 2017 to December 2017") Your drinking water supply Drinking Water Quality Report for the Hartlepool Public Water Supply Zone (HP08) Report period: January 2017 to December 2017 Hartlepool Water is divided into 2 water supply
Your drinking water supply Drinking Water Quality Report for the Hartlepool Public Water Supply Zone (HP08) Report period: January 2017 to December 2017 Hartlepool Water is divided into 2 water supply
Water Greater Vancouver Water District 2013 Quality Control Annual Report
 Water Greater Vancouver Water District 2013 Quality Control Annual Report Volume 1 9254352 Foreword This report has been produced to meet the requirement for water suppliers to produce an annual report
Annual Drinking Water Quality Report
 Annual Drinking Water Quality Report City of Powell 270 N. Clark P.O. Box 1008 Powell WY. 82435 January 2017 December 2017 We re very pleased to provide you with this year's Water Quality Report. We want
Why am I receiving this report?
 Annual Drinking Water Quality Report 2013 LAVALETTE PUBLIC SERVICE DISTRICT 5308 Rt. 152 Lavalette, WV 25535 PWS# WV3305006 PWS# WV33005012 - Eastern District May 21, 2014 Why am I receiving this report?
Town of Rutland 2015 Drinking Water Quality Report Public Water Supply #
 Drinking Water Quality Report Our goal is to provide our customers with high quality drinking water that meets all state and federal standards for quality and safety. We have made significant investments
Drinking Water Quality Report for the Wynyard Public Water Supply Zone (WY07) Report period: January 2017 to December 2017
 Report period: January 2017 to December 2017") Your drinking water supply Drinking Water Quality Report for the Wynyard Public Water Supply Zone (WY07) Report period: January 2017 to December 2017 Hartlepool Water is divided into 2 water supply areas
Your drinking water supply Drinking Water Quality Report for the Wynyard Public Water Supply Zone (WY07) Report period: January 2017 to December 2017 Hartlepool Water is divided into 2 water supply areas
2012 Annual Drinking Water Quality Report Town of Chadbourn Water System Number:
 2012 Annual Drinking Quality Report Town of Chadbourn System Number: 04-24-020 We are pleased to present to you this year's Annual Drinking Quality Report. This report is a snapshot of last year s water
WATER SUPPLY IN JAPAN 2017
 WATER SUPPLY IN JAPAN 2017 Published by Japan Water Works Association Executive Director s Message This report is published annually by JWWA and presents data from water utilities across Japan. The data
INTRODUCTION. Building Services County Office Building 197 Main Street Cooperstown, New York Phone: (607) Fax: (607)
 Fax: (607)") Building Services County Office Building 197 Main Street Cooperstown, New York 13326-1129 Phone: (607) 547-6484 Fax: (607) 547-6461 Annual Drinking Water Quality Report for 2017 Meadows, Public Safety
Building Services County Office Building 197 Main Street Cooperstown, New York 13326-1129 Phone: (607) 547-6484 Fax: (607) 547-6461 Annual Drinking Water Quality Report for 2017 Meadows, Public Safety
2013 ANNUAL DRINKING WATER SYSTEM SUMMARY REPORT Tavistock Water System
 2013 ANNUAL DRINKING WATER SYSTEM SUMMARY REPORT Tavistock Water System 1. GENERAL INFORMATION Oxford County prepares a report summarizing system operation and water quality for every municipal drinking
Town of Boiling Springs
 Town of Boiling Springs Annual Quality Report 2017 Annual Drinking Quality Report System ID Number: 01-23-025 Town of Boiling Springs 2 0 1 7 A N N U A L D R I N K I N G W A T E R Q U A L I T Y R E P O
2017 Annual Drinking Water Quality Report (Consumer Confidence Report)
") 2017 Annual Drinking Water Quality Report (Consumer Confidence Report) TANGLEWOOD ON TEXOMA 1-866-654-7992 The Utility s water system, owned and operated by SouthWest Water Company, provides our water
2017 Annual Drinking Water Quality Report (Consumer Confidence Report) TANGLEWOOD ON TEXOMA 1-866-654-7992 The Utility s water system, owned and operated by SouthWest Water Company, provides our water
City of St. Louis Water Division Department of Public Utilities 1640 S. Kingshighway St. Louis, MO Curtis B.
 City of St. Louis Water Division Department of Public Utilities 1640 S. Kingshighway St. Louis, MO 63110-4399 314-663-9000 Curtis B. Skouby PE Director of Public Utilities Curtis B. Skouby PE Water Commissioner
2018 ANNUAL DRINKING WATER SYSTEM SUMMARY REPORT Tillsonburg Water System
 2018 ANNUAL DRINKING WATER SYSTEM SUMMARY REPORT Tillsonburg Water System 1. GENERAL INFORMATION Oxford County prepares a report summarizing system operation and water quality for every municipal drinking
2013ANNUAL DRINKING WATER QUALITY REPORT. Naval Air Station Corpus Christi D Street Corpus Christi, TX 78419
 ANNUAL DRINKING WATER QUALITY REPORT Naval Air Station Corpus Christi 11001 D Street Corpus Christi, TX 78419 This report is a summary of the quality of water we provided to our customers during. We hope
2013 Annual Water Report
 2013 Annual Water Report Public Works Department Introduction: Under the terms of the Village of Nakusp Operating Permit for Facility #211995, the Village is required to provide an annual report to users
INTRODUCTION WHERE DOES OUR WATER COME FROM?
 Annual Drinking Water Quality Report for 2017 Town of Niskayuna One Niskayuna Circle, Niskayuna, NY 12309 (Public Water Supply Identification Number NY4600073) INTRODUCTION To comply with State regulations,
2015 Annual Drinking Water Quality Report Wells College Water Department PO Box 500 Aurora, NY (Public Water Supply ID# )
") 2015 Annual Drinking Water Quality Report Wells College Water Department PO Box 500 Aurora, NY 13026 (Public Water Supply ID#0512920) INTRODUCTION To comply with State regulations, Wells College Water
2015 Annual Drinking Water Quality Report Wells College Water Department PO Box 500 Aurora, NY 13026 (Public Water Supply ID#0512920) INTRODUCTION To comply with State regulations, Wells College Water
U.S. NAVAL SUPPORT ACTIVITY NAPLES SUPPORT SITE GRICIGNANO 2015 DRINKING WATER CONSUMER CONFIDENCE REPORT
 U.S. NAVAL SUPPORT ACTIVITY NAPLES SUPPORT SITE GRICIGNANO 2015 DRINKING WATER CONSUMER CONFIDENCE REPORT Is our water safe to drink? Naval Support Activity (NSA) Naples Support Site s drinking water system
Annual Drinking Water Quality Report for 2012 Poughkeepsies Water Treatment Facility (PWS# ) and the City of Poughkeepsie (PWS# )
 and the City of Poughkeepsie (PWS# )") Annual Drinking Water Quality Report for 2012 Poughkeepsies Water Treatment Facility (PWS# 1302774) and the City of Poughkeepsie (PWS# 1330291) The Poughkeepsies Water Treatment Facility, which is owned
Annual Drinking Water Quality Report for 2012 Poughkeepsies Water Treatment Facility (PWS# 1302774) and the City of Poughkeepsie (PWS# 1330291) The Poughkeepsies Water Treatment Facility, which is owned
City of Bellevue Water Department Drinking Water Consumer Confidence Report
 City of Bellevue Water Department Drinking Water Consumer Confidence Report Introduction The Bellevue Water Department has prepared the following report to provide information to you, the consumer, on
Annual Drinking Water Quality Report for 2017 Village of Gowanda 27 East Main St. Gowanda, N.Y Public Water Supply ID# NY
 Annual Drinking Water Quality Report for Village of Gowanda 27 East Main St. Gowanda, N.Y. 14070 Public Water Supply ID# NY0400340 Prospect Street Water District P.O Box 250 Perrysburg, NY 14129 Public