USE OF LIME-ACTIVATED CLASS F FLY ASH IN FULL DEPTH RECLAMATION OF ASPHALT PAVEMENTS
|
|
|
- Roy York
- 6 years ago
- Views:
Transcription
1 USE OF LIME-ACTIVATED CLASS F FLY ASH IN FULL DEPTH RECLAMATION OF ASPHALT PAVEMENTS William E. Wolfe, Ph.D., P.E., Project Manager Civil and Environmental Engineering and Geodetic Science The Ohio State University 470 Hitchcock Hall, 2070 Neil Avenue, Columbus, Ohio Tel: Tarunjit S. Butalia, Ph.D., P.E. Harold Walker, Ph.D., P.E. Civil and Environmental Engineering and Geodetic Science The Ohio State University 470 Hitchcock Hall, 2070 Neil Avenue, Columbus, Ohio Final Report for Project CDO/D-05-8/9 This report does not contain Trade Secret / Propriety Information This project was funded in part by the Ohio Coal Development Office of Ohio Air Quality Development Authority, State of Ohio Period of Performance: 1/01/06 9/30/09 August 20, 2010
2
3 DISCLAIMER This report was prepared by The Ohio State University with support in part by a grant from the Ohio Coal Development Office, Ohio Air Quality Management Authority (OCDO/OAQDA). Neither the State of Ohio nor any of its agencies, nor any person acting on behalf of the State: 1. Make any warranty or representation, express or implied, with respect to the accuracy, completeness, or usefulness of the information contained in this report, or that the use of any information, apparatus, method or process disclosed in this report may not infringe privatelyowned rights; or 2. Assume any liabilities with respect to the use of, or for damages resulting from the use of any information, apparatus, method or process disclosed in this report. Reference herein to any specific commercial product, process, or service by trade name, trademark, manufacturer, or otherwise, does not necessarily constitute or imply its endorsement, recommendation, or favoring; nor do the view and opinions of authors expressed herein necessarily state or reflect those of the State of Ohio or its agencies. NOTICE TO JOURNALISTS AND PUBLISHERS: Please feel free to quote and borrow from this report, however, please include a statement noting the Ohio Coal Development Office s support for the project. i
4 REPORT SUMMARY The overall objective of this research project was to demonstrate the effective use of Class F fly ash in combination with lime or lime kiln dust (LKD) in the full depth reclamation (FDR) of asphalt (flexible) pavements across the state of Ohio. Class F fly ash in itself is not a self-cementing pozzolan. It needs additional lime to undergo a pozzolanic reaction. Hence the need for lime-activated Class F fly ash as a chemical stabilizer for FDR work. It is important to note that fly ash when used in combination with lime or lime kiln dust performs two important functions in FDR work: - Fly ash provides the silica and alumina needed for pozzolanic reaction with lime to increase the strength, stiffness, and durability of the stabilized base layer. - Fly ash acts as a mineral filler to fill the voids in the granular pulverized pavement mix and hence reduces the permeability of the FDR stabilized base layer. Full depth reclamation (FDR) describes a maintenance process in which the complete depth of the flexible pavement section consisting of the asphalt layer, base, sub-base, and a predetermined amount of the underlying existing subgrade soil are uniformly pulverized, blended with chemical additives (Class F fly ash in combination with lime or lime kiln dust), and compacted to construct a new stabilized base course. An asphalt overlay is then placed over the stabilized base. In this study, The Ohio State University in collaboration with two of the fastest growing counties in Ohio, Delaware County & Warren County, designed, constructed, and monitored the performance of full-scale full depth reclamation (FDR) of failing pavements by incorporating lime-activated Class F fly ash. The goal of this research was to establish field-verified relationships for the service performance, structural, and environmental behavior of FDR pavements constructed using lime-activated fly ash. The project objective and goal was accomplished in a work effort consisting of laboratory testing and mix design, construction and monitoring of full-scale pavement sections, and outreach. Laboratory testing and strength-based mix design for the for Delaware and Warren County road sections was carried out. Engineering and environmental (chemical composition and leachate potential) properties were investigated in developing mixes in the laboratory that could be implemented at the two full-scale demonstration sites in collaboration with the respective County Engineer s offices. Class F fly ash from Zimmer Power Plant was studied as the CCP admixture for use in FDR construction of asphalt pavements. For the Delaware county site, mix designs were carried out for the planned rehabilitation of five types of test sections located along 4 miles of Section Line Road in Delaware County, Ohio. The admixtures for FDR work utilized were cement & emulsion, cement, LKD & emulsion, fly ash & LKD, fly ash & lime and a control section of mill and overlay. The Warren county mix design ii
5 was carried out for a fly ash & lime section with a control (mill and overlay) section for the planned rehabilitation of 0.37 miles of Long Spurling Road in Warren County, Ohio. Laboratory tests for measuring the engineering properties of the FDR mixes were carried out to develop a strength-based mix design to ensure structural stability of the pavement sections. This resulted in recommendations for the appropriate amount of admixtures to be used during each of the rehabilitation processes as well as construction recommendations. The laboratory leaching tests indicated that none of the leachate concentrations exceeded regulations. Both the SPLP and TCLP tests revealed that the leachate concentrations of As, Ba, Cd, Cr, Hg, Pb and Se were well below the standards set by the Ohio EPA s non-toxic criteria. The concentrations reported from the TCLP test were also well below the concentrations the US EPA has set for characterization of a hazardous material. It was noticed that the TCLP concentrations were generally slightly higher than the concentrations reported by the SPLP test, and the presence of acetate in the TCLP test offers a possible explanation for this trend. Furthermore, it was determined that after comparing the leachate concentration from both TCLP and SPLP to the environmental monitoring samples that one method was not clearly a better regulatory tool than the other. Two full-scale project demonstration sites were chosen in collaboration with the Warren and Delaware County Engineer s Offices. The Long Spurling Road (0.37 mile) located in the northeastern part of Warren county was chosen by the Warren County Engineer's Office for FDR construction to be reclaimed as follows 4-percent lime with 6-percent fly ash, 12-inch stabilization depth (0.28 mile) 5-inch mill and fill (0.09 mile) In collaboration with the Delaware County Engineer's Office, a four mile long segment of Section Line Road was selected for FDR reconstruction in 2006 using the following admixtures: Cement & Emulsion: 2-percent cement with 1.6 gallons per square yard emulsion, 8- inch stabilization depth (0.42 mile) Cement Only: 5-percent cement, 12-inch stabilization depth (0.80 mile) LKD & Emulsion: 3-percent lime kiln dust with 1.4 gallons per square yard emulsion, 8-inch stabilization depth (0.79 mile) Fly Ash & LKD: 5-percent lime kiln dust with 5-percent fly ash, 8-inch stabilization depth (0.62 mile) Fly Ash & Lime: 4-percent lime with 6-percent fly ash, 8-inch stabilization depth (0.62 mile) Controls: 5-inch mill and overlay (two 0.09-mile sections at the north and south ends of the project, and a 0.14 mile as well as 0.52 mile section near the middle of the project). The construction work was carried out in Summer of 2006 under the respective supervision of the Warren County and Delaware County Engineer s Office. The pavements constructed were instrumented with structural and environmental monitoring devices. Falling Weight Deflectometer (FWD) tests were conducted by ODOT before pavement reclamation and at regular intervals after the FDR of the pavements for up to 3 years after reclamation. Overall for the Warren and Delaware county pavement sites, FWD tests conducted up to 3 years after reclamation show that the cement, fly ash & LKD, and fly ash & lime sections exhibited iii
6 resilient modulus values comparable to soil cement. Cement & emulsion as well as LKD & emulsion treatment did not provide adequate stabilization. The cement treatment resulted in a significant increase in resilient modulus within three weeks of the end of construction but beyond this curing time the stiffness increase was slow. Tests on the fly as & LKD and fly ash & lime test sections indicated slower short-term increase in stiffness, but the two fly ash stabilized sections 3 years after construction exhibited average resilient modulus values of about 400 ksi to 1,300 ksi. Monitoring of the instrumentation installed in the pavement sections showed that the measured values for the FDR pavements were within the range of values we measured in the APLF OCDO Project in which none of the CCP asphalt pavement sections failed when tested to 20 years of equivalent highway traffic. In this project we did not depend primarily on the pavement instrumentation for our evaluating the performance of various sections built using FDR technology because the instrumentation at a site is only representative of that location and not the entire section it is located in. Instead non-destructive Falling Weight Deflectometer (FWD) testing by ODOT carried out at least three times a year for up to 3 years post FDR construction along the length of the test sections. The resilient modulus values back-calculated from the FWD data are representative of the test section under study and provide information for the mechanistic design of pavement structures. It also needs to be noted that the resilient modulus for a given pavement varies seasonally (with lowest values in Spring thaw and highest values in Fall). In this project we monitored the reclaimed pavement sections for up to 3 years of FWD monitoring and none of the sections have failed or indicating any signs of distress. Monitoring these sections for at least an additional 2 years is recommended so that a total of 5 years of FWD monitoring can be carried out to assess the long-term performance of the test sections built in this project. The environmental monitoring of the test sections at Delaware and Warren county sites revealed that all of the sections met both the US EPA s drinking water MCL and Ohio EPA s non-toxic criteria for As, Ba, Cr, Cu, Hg, Pb and Se. The results also show that when compared to the elemental compositions of the FDR base materials of each section, that just small amounts of each element are being leached from the FDR base layer. The percent difference between the solid phase of the FDR base material and liquid phase of the groundwater samples ranges between ~0.01% - 10%. The single direct comparison between a control section and fly ash & lime section for Warren County indicated that the critical metals that are relevant to the Ohio EPA and US EPA (As, Ba, Cd, Cr, Hg, Pb and Se) all were leached to an equivalent amount. Finally, it was found that a majority of the solids present within the samples consist of hydrates with Al, Fe, Mg and Mn. It is possible that these hydrates are having an effect on the leaching of elements from the FDR base layer. Due to the difficulty to obtain water samples from many of the fly ash amended test sections, it is theorized that pozzolanic reactions are continuing to take place and thus decreasing porosity and permeability of the FDR base layers. It is also believed that certain sections (those containing fly ash) have a lower porosity and permeability than other sections (such as control sections) that have produced sufficient amounts of water to be analyzed. The work outlined in this report promotes the use of Ohio coal by providing a positive revenue stream for the large quantities of fly ash (especially of high-carbon content) generated from the combustion of coal and currently landfilled in the state. The end users of this technology can reap significant cost saving (50% or more) as compared to expensive complete reconstruction of road sections. The FDR procedure is environmentally sound since it recycles existing pavement iv
7 materials without the need for additional virgin materials in constructing a new road. The replacement of cement with fly ash in FDR work reduces significantly the CO 2 emissions associated with the use of cement (one ton of fly ash replacing cement will reduce about one ton of CO 2 emissions). A very important contribution of this technology is the rehabilitation of the decaying road infrastructure in the state thus providing an impetus for economic development by providing for safe and secure means of road transportation of goods and people. v
8 vi
9 TABLE OF CONTENTS Page # REPORT SUMMARY ii EXECUTIVE SUMMARY 1 CHAPTER 1: INTRODUCTION Background and Objectives Outline of Report Project Demonstration Sites Warren County Delaware County 7 CHAPTER 2: LABORATORY TESTING & MIX DESIGN Introduction Engineering Characteristics Delaware County Sections Section 1: Cement & Emulsion Section 2: Cement Section 3: Emulsion & Lime Kiln Dust Section 4: Fly Ash & Lime Kiln Dust Section 5: Fly Ash & Lime Control Sections: Mill and Overlay Warren County Sections Environmental Characteristics Chemical Composition of FDR Base Laboratory Leaching Potential Summary 77 CHAPTER 3: CONSTRUCTION OF FULL-SCALE PAVEMENT SECTIONS Introduction Warren County Road Sections Delaware County Road Sections Section 1: Cement & Emulsion Section 2: Cement Section 3: Emulsion & Lime Kiln Dust Section 4: Fly Ash & Lime Kiln Dust Section 5: Fly Ash & Lime Control Sections: Mill and Overlay Summary 116 CHAPRTER 4: POST-CONSTRUCTION MONITORING Introduction Pavement Instrumentation Environmental Monitoring Lysimeter 122 vii
10 4.3.2 Hydrology Around Test Sections Sampling Procedures Monitoring Results Geochemical Speciation Modeling Limitations Structural Monitoring Falling Weight Deflectometer (FWD) Testing FWD Test Procedure Back Calculation of Base layer Resilient Modulus Results Pavement Instrumentation Response Limitations Summary 164 CHAPTER 5: SUMMARY AND CONCLUSIONS 166 REFERENCES 171 FINAL PROJECT BUDGET 180 APPPENDICES 181 Appendix A: Construction Costs 182 Appendix B: Papers Presented/Published & Outreach Publicity Articles 185 Appendix C: Warren County Instrumentation Photos 187 Appendix D: Delaware County Instrumentation Photos 194 Appendix E: Environmental Monitoring Data 202 viii
11 EXECUTIVE SUMMARY The work presented in this report promotes the use of Ohio coal by providing a positive revenue stream for the large quantities of non-concrete quality fly ash generated from the combustion of coal and currently landfilled in the state. The end users of this technology can reap significant cost saving (50% or more) as compared to expensive complete reconstruction of the road section. The procedure is environmentally sound since it recycles existing pavement materials without the need for additional virgin materials in constructing a new road. The replacement of cement with fly ash in FDR work further reduces significantly the CO 2 emissions associated with the use of cement (one ton of fly ash replacing cement will reduce about one ton of CO 2 emissions). A very important contribution of this technology will be the rehabilitation of the decaying road infrastructure in the state thus providing an impetus for economic development by providing for safe and secure means of road transportation of goods and people. Full depth reclamation (FDR) describes a maintenance process in which the complete depth of the flexible pavement section consisting of the asphalt layer, base, sub-base, and a predetermined amount of the underlying existing subgrade soil are uniformly pulverized, blended with chemical additives (Class F fly ash in combination with lime or lime kiln dust), and compacted to construct a new stabilized base course. An asphalt overlay is then placed over the stabilized base. The objective of this work is to demonstrate the effective use of Class F fly ash in combination with lime or lime kiln dust (LKD) in the full depth reclamation (FDR) of asphalt (flexible) pavements across the state of Ohio. Class F fly ash in itself is not a self-cementing pozzolan. It needs additional lime to undergo a pozzolanic reaction. Hence the need for lime-activated Class F fly ash as a chemical stabilizer for FDR work. It is important to note that fly ash when used in combination with lime or lime kiln dust performs two important functions in FDR work: - Fly ash provides the silica and alumina needed for pozzolanic reaction with lime to increase the strength, stiffness, and durability of the stabilized base layer. - Fly ash acts as a mineral filler to fill the voids in the granular pulverized pavement mix and hence reduces the permeability of the FDR stabilized base layer. In this study, The Ohio State University in collaboration with two of the fastest growing counties in Ohio, Delaware County & Warren County, designed, constructed, and monitored the performance of full-scale full depth reclamation (FDR) of failing pavements by incorporating lime-activated Class F fly ash. The goal of this research program was to establish field-verified relationships for the service performance, structural, and environmental behavior of FDR pavements constructed using limeactivated fly ash. The project objective and goal was accomplished in a work effort consisting of the laboratory testing and mix design, construction and monitoring of full-scale pavement sections, and outreach. 1
12 Laboratory testing and strength-based mix design for the for Delaware and Warren County road sections was carried out. Engineering and environmental (chemical composition and leachate potential) properties were investigated in developing mixes in the laboratory that could be implemented at the two full-scale demonstration sites in collaboration with the respective County Engineer s offices. Class F fly ash from Zimmer Power Plant was studied as the CCP admixture for use in FDR construction of asphalt pavements. For the Delaware county site, mix designs were carried out for the planned rehabilitation of five types of test sections located along 4 miles of Section Line Road in Delaware County, Ohio. The admixtures for FDR work utilized were cement & emulsion, cement, LKD & emulsion, fly ash & LKD, fly ash & lime and a control section of mill and overlay. The Warren county mix design was carried out for a fly ash & lime section with a control (mill and overlay) section for the planned rehabilitation of 0.37 miles of Long Spurling Road in Warren County, Ohio. Laboratory tests for measuring the engineering properties of the FDR mixes were carried out to develop a strength-based mix design to ensure structural stability of the pavement sections. This resulted in recommendations for the appropriate amount of admixtures to be used during each of the rehabilitation processes as well as construction recommendations. The laboratory leaching tests indicated that none of the leachate concentrations exceeded regulations. Both the SPLP and TCLP tests revealed that the leachate concentrations of As, Ba, Cd, Cr, Hg, Pb and Se were well below the standards set by the Ohio EPA s non-toxic criteria. The concentrations reported from the TCLP test were also well below the concentrations the US EPA has set for characterization of a hazardous material. It was noticed that the TCLP concentrations were generally slightly higher than the concentrations reported by the SPLP test, and the presence of acetate in the TCLP test offers a possible explanation for this trend. Furthermore, it was determined that after comparing the leachate concentration from both TCLP and SPLP to the environmental monitoring samples that one method was not clearly a better regulatory tool than the other. Two full-scale project demonstration sites were chosen in collaboration with the Warren and Delaware County Engineer s Offices. Warren County, near Cincinnati, Ohio, is the second fastest growing county in the state. The Long Spurling Road located in the northeastern part of the county was chosen by the Warren County Engineer's Office for FDR construction. The failing asphalt pavement was 0.37 miles in length, 20 to 21 feet in width with minimal shoulders with a 2-inch asphalt layer on top of 4 to 6 inches of chipsealed pavement. Two sections were constructed at this pavement site: 4-percent lime with 6-percent fly ash, 12-inch stabilization depth (0.28 mile) 5-inch mill and fill (0.09 mile) Delaware County (located 20 miles north of Columbus, Ohio, USA) is the fastest growing county in Ohio. In collaboration with the Delaware County Engineer's Office, a four mile long segment of Section Line Road was selected for FDR reconstruction in Roadway width was 20 feet with minimal shoulders. The asphalt surface thickness ranged from 5.25 to 14 inches 2
13 (average of inches). The original pavement was underlain by a base course ranging from 1 to 11 inches (average of 5.18 inches) thick. Six types of sections were constructed using the following mixes: Cement & Emulsion: 2-percent cement with 1.6 gallons per square yard emulsion, 8-inch stabilization depth (0.42 mile) Cement Only: 5-percent cement, 12-inch stabilization depth (0.80 mile) LKD & Emulsion: 3-percent lime kiln dust with 1.4 gallons per square yard emulsion, 8- inch stabilization depth (0.79 mile) Fly Ash & LKD: 5-percent lime kiln dust with 5-percent fly ash, 8-inch stabilization depth (0.62 mile) Fly Ash & Lime: 4-percent lime with 6-percent fly ash, 8-inch stabilization depth (0.62 mile) Controls: 5-inch mill and overlay (two 0.09-mile sections at the north and south ends of the project, and a 0.14 mile as well as 0.52 mile section near the middle of the project). Class F fly ash from Zimmer Power Plant was utilized in the construction of the Warren and Delaware county pavement sections. The construction work was carried out in Summer of 2006 by Base Construction / Strawser Paving with site QA/QC services provided by EDP Consultants under the respective supervision of the Warren County and Delaware County Engineer s Office. The pavements constructed were instrumented with structural and environmental monitoring devices. Falling Weight Deflectometer (FWD) tests were conducted by ODOT before pavement reclamation and at regular intervals after the FDR of the pavements for up to 3 years after reclamation. Overall for the Warren and Delaware county pavement sites, FWD tests conducted up to 3 years after reclamation show that the cement, fly ash & LKD, and fly ash & lime sections exhibited resilient modulus values comparable to soil cement. Cement & emulsion as well as LKD & emulsion treatment did not provide adequate stabilization. The cement treatment resulted in a significant increase in resilient modulus within three weeks of the end of construction but beyond this curing time the stiffness increase was slow. Tests on the fly as & LKD and fly ash & lime test sections indicated slower short-term increase in stiffness, but the two fly ash stabilized sections 3 years after construction exhibited average resilient modulus values of about 400 ksi to 1,300 ksi. Monitoring of the instrumentation installed in the pavement sections showed that the measured values for the FDR pavements were within the range of values we measured in the APLF OCDO Project in which none of the CCP asphalt pavement sections failed when tested to 20 years of equivalent highway traffic. In this project we did not depend primarily on the pavement instrumentation for our evaluating the performance of various sections built using FDR technology because the instrumentation at a site is only representative of that location and not the entire section it is located in. Instead non-destructive Falling Weight Deflectometer (FWD) testing by ODOT carried out at least three times a year for up to 3 years post FDR construction along the length of the test sections. The resilient modulus values back-calculated from the FWD data are representative of the test section under study and provide information for the mechanistic design of pavement structures. It also needs to be noted that the resilient modulus for a given pavement varies seasonally (with lowest values in Spring thaw and highest 3
14 values in Fall). In this project we monitored the reclaimed pavement sections for up to 3 years of FWD monitoring and none of the sections have failed or indicating any signs of distress. Monitoring these sections for at least an additional 2 years is recommended so that a total of 5 years of FWD monitoring can be carried out to assess the long-term performance of the test sections built in this project. The environmental monitoring of the test sections at Delaware and Warren county sites revealed that all of the sections met both the US EPA s drinking water MCL and Ohio EPA s non-toxic criteria for As, Ba, Cr, Cu, Hg, Pb and Se. The results also show that when compared to the elemental compositions of the FDR base materials of each section, that just small amounts of each element are being leached from the FDR base layer. The percent difference between the solid phase of the FDR base material and liquid phase of the groundwater samples ranges between ~0.01% - 10%. The single direct comparison between a control section and fly ash & lime section for Warren County indicated that the critical metals that are relevant to the Ohio EPA and US EPA (As, Ba, Cd, Cr, Hg, Pb and Se) all were leached to an equivalent amount. Finally, it was found that a majority of the solids present within the samples consist of hydrates with Al, Fe, Mg and Mn. It is possible that these hydrates are having an effect on the leaching of elements from the FDR base layer. Due to the difficulty to obtain water samples from many of the fly ash amended test sections, it is theorized that pozzolanic reactions are continuing to take place and thus decreasing porosity and permeability of the FDR base layers. It is also believed that certain sections (those containing fly ash) have a lower porosity and permeability than other sections (such as control sections) that have produced sufficient amounts of water to be analyzed. 4
15 CHAPTER 1 INTRODUCTION 1.1 Background and Objectives Coal combustion products (CCPs) can be used in a variety of highway and construction related applications including flexible (asphalt) pavements, which account for more than 90% of pavement miles in Ohio. The use of lime-activated fly ash in the reconstruction of existing pavements in the state provides a large-volume potential application, the use of which can be sustained over a long period of time if the performance of such reconstruction can be demonstrated in the field. While the use of fly ash in concrete applications (including concrete pavements, which account for only 10% of Ohio s pavement miles) is well established, it presents a limited market potential for the use of high-carbon or varying carbon content fly ashes. CCP stakeholders are now being increasingly attracted to the largest highway construction industry in the state and the nation reconstruction of existing flexible pavements to accommodate the enormous future traffic needs and limited financial resources available. Limited laboratory research investigations have been conducted on the use of fly ash in construction of flexible pavements. Most of these investigations at the laboratory scale have focused on use of low-carbon fly ash in construction of new pavements. However, the performance of fly ash materials in the reconstruction or recycling of existing pavements at the full-scale field demonstration level has been lacking. Full depth reclamation (FDR) describes a maintenance process in which the complete depth of the flexible pavement section consisting of the asphalt layer, base, sub-base, and a predetermined amount of the underlying existing subgrade soil are uniformly pulverized (see Figure 1.1), blended with chemical additives (Class F fly ash in combination with lime or lime kiln dust), and compacted to construct a new stabilized base course. An asphalt overlay is then placed over the stabilized base. The objective of this work is to demonstrate the effective use of Class F fly ash in combination with lime or lime kiln dust (LKD) in the full depth reclamation (FDR) of asphalt (flexible) pavements across the state of Ohio. Class F fly ash in itself is not a self-cementing pozzolan. It needs additional lime to undergo a pozzolanic reaction. Hence the need for lime-activated Class F fly ash as a chemical stabilizer for FDR work. It is important to note that fly ash when used in combination with lime or lime kiln dust performs two important functions in FDR work: 1. Fly ash provides the silica and alumina needed for pozzolanic reaction with lime to increase the strength, stiffness, and durability of the stabilized base layer. 5
16 2. Fly ash acts as a mineral filler to fill the voids in the granular pulverized pavement mix and hence reduces the permeability of the FDR stabilized base layer. In this study, The Ohio State University, in collaboration with two of the fastest growing counties in Ohio, Delaware County & Warren County, designed, constructed, and monitored the performance of full-scale full depth reclamation (FDR) of failing pavements by incorporating lime-activated Class F fly ash. The work presented in this report promotes the use of Ohio coal by providing a positive revenue stream for the large quantities of non-concrete quality fly ash generated from the combustion of coal and currently landfilled in the state. The end users of this technology can reap significant cost saving (50% or more) as compared to expensive complete reconstruction of the road section. The procedure is environmentally sound since it recycles existing pavement materials without the need for additional virgin materials in constructing a new road. The replacement of cement with fly ash in FDR work further reduces significantly the CO 2 emissions associated with the use of cement (one ton of fly ash replacing cement will reduce about one ton of CO 2 emissions). A very important contribution of this technology will be the rehabilitation of the decaying road infrastructure in the state thus providing an impetus for economic development by providing for safe and secure means of road transportation of goods and people. The goal of the proposed program is to establish field-verified relationships for the service performance, structural, and environmental behavior of FDR pavements constructed using limeactivated fly ash. The project objective and goal was accomplished in a work effort consisting of the laboratory testing and mix design, construction and monitoring of full-scale pavement sections, and outreach. 1.2 Outline of Report The engineering and environmental testing carried out to develop suitable admixture mixes for field implementation is presented in Chapter 2. The construction and QA/QC for the Delaware (4 mile length) and Warren (0.37 mile length) county sections is presented in Chapter 3. In Chapter 4, we describe the post-construction monitoring for the full-scale sections (built in Summer 2006) using non-destructive Falling Weight Deflectometer (FWD) test and installed structural as well as environmental sampling devices for a period of up to 3 years after FDR work. Chapter 5 presents the summary and conclusions of our work. Several appendices have been added at the end of this report. 1.3 Project Demonstration Sites Two full-scale project demonstration sites were chosen in Warren and Delaware counties in Ohio. See Figure 1.2. An overview of the pavements chosen for FDR work is presented below. 6
17 1.3.1 Warren County Warren County, near Cincinnati, Ohio, is the second fastest growing county in the state. The Long Spurling Road located in the northeastern part of the county was chosen by the Warren County Engineer's Office for FDR construction. The failing asphalt pavement (see Figure 1.3) was 0.37 miles in length, 20 to 21 feet in width with minimal shoulders with a 2-inch asphalt layer on top of 4 to 6 inches of chipsealed pavement. Two sections were constructed at this pavement site: 4-percent lime with 6-percent fly ash, 12-inch stabilization depth (0.28 mile) 5-inch mill and fill (0.09 mile) Delaware County Delaware County (located 20 miles north of Columbus, Ohio, USA) is the fastest growing county in Ohio. In collaboration with the Delaware County Engineer's Office, a four mile long segment of Section Line Road (see Figure 1.4) was selected for FDR reconstruction in Roadway width was 20 feet with minimal shoulders. The asphalt surface thickness ranged from 5.25 to 14 inches (average of inches). The original pavement was underlain by a base course ranging from 1 to 11 inches (average of 5.18 inches) thick. Six types of sections were constructed using the following mixes: Cement & Emulsion: 2-percent cement with 1.6 gallons per square yard emulsion, 8-inch stabilization depth (0.42 mile) Cement Only: 5-percent cement, 12-inch stabilization depth (0.80 mile) LKD & Emulsion: 3-percent lime kiln dust with 1.4 gallons per square yard emulsion, 8- inch stabilization depth (0.79 mile) Fly Ash & LKD: 5-percent lime kiln dust with 5-percent fly ash, 8-inch stabilization depth (0.62 mile) Fly Ash & Lime: 4-percent lime with 6-percent fly ash, 8-inch stabilization depth (0.62 mile) Controls: 5-inch mill and overlay (two 0.09-mile sections at the north and south ends of the project, and a 0.14 mile as well as 0.52 mile section near the middle of the project). 7

18 Figure 1.1 Pulverization During FDR Work 8

19 Figure 1.2 Demonstration Project Locations in Ohio 9
20 Figure 1.3 Long Spurling Road in Warren County 10
21 Figure 1.4 Section Line Road in Delaware County 11
22 CHAPTER 2 LABORATORY TESTING & MIX DESIGN 2.1 Introduction This chapter presents an overview of the development of the mix designs for Delaware and Warren County road sections. Engineering and environmental properties were investigated in developing a mix in the laboratory that could be implemented at the two full-scale demonstration sites in collaboration with the respective County Engineer s offices. Class F fly ash from Zimmer Power Plant was utilized in this project. 2.2 Engineering Characteristics Delaware County Sections This section presents the results of the Full Depth Reclamation (FDR) and soil-cement mix designs for the planned rehabilitation of the five test sections located along Section Line Road in Delaware County, Ohio. It includes the results of the field and laboratory testing along with recommendations for the appropriate amount of admixtures to be used during each of the rehabilitation processes (EDP Consultants, 2006b). The Section Line Road was divided into several test sections for this study. The locations and methods to rehabilitate each section, as planned, are shown in Table 2.1. The admixtures for FDR work utilized were cement & emulsion, cement, LKD & emulsion, Fly Ash & LKD, Fly Ash & Lime and a control section (mill and overlay). The upper 5 inches of the existing asphalt was to be milled and removed. Once reclamation and/or stabilization was completed in each test section the reclaimed materials were to be surfaced with 5 inches of hotmix asphalt. Section 6 was to be rehabilitated with a 5 inch mill and overlay. This section serves as the control for the study. Based on the testing and mix design needs, the amount of road material needed for each mix design was calculated. A total of 40 cores were obtained by drilling at 17 different locations along Section Line Road. These areas were selected based on the information gathered during past exploration and sampling that was completed by EDP Consultants prior to this project. 12
23 Table 2.1 Summary of Planned Test Sections for Delaware County Section Approximate Location Planned Length (miles) Admixture for Pavement Repair 1 Home Rd. to South Lake Hill Rd. 0.5 Cement & Emulsion 2 South Lake Hill Rd. to Highlands Dr. 0.5 Cement 3 Highlands Dr. to Clark Shaw Rd. 1 Emulsion & Lime Kiln Dust 4 Clark Shaw Rd. to N. of Bean Oller Rd. 1 Fly Ash & Lime Kiln Dust 5 N. of Bean Oller Rd. to Bunty Station Rd. 1 Fly Ash & Lime 6 Bunty Station Rd. to US Mill and overlay Note: This table is for planned sections. Actual constructed sections vary slightly Section 1: Cement & Emulsion This FDR section (approximately 0.5 miles in length) was planned to be on Section Line Road beginning at Home Road and extending north to approximately South Lake Hill Road. The planned rehabilitation work for this section is as follows: 1. Mill and remove 5 inches of the existing asphalt. 2. Pre-pulverize the remaining materials to a depth of 8 inches. 3. Reclaim the upper 8 inches of the pavement materials with emulsion and cement to create a stabilized base course (SBC). 4. Surface the SBC with 5 inches of hot-mix asphalt. The pavement section to be reclaimed was studied by coring the existing asphalt at 11 locations using a 10-inch diameter diamond-tipped core barrel. A 6½ ft deep Standard Penetration Boring (SPT) boring was drilled at test locations AB-1 and AB-2 in general accordance with ASTM Standards. The locations and areas were selected based on information gathered through past exploration. At each of the test locations, the existing pavement was cored, and the underlying aggregate base, where present, was sampled in its entirety. The thicknesses of the asphalt and base were measured during the completion of the field work. The boreholes were backfilled with soil cuttings and the pavement was restored using ready-mix concrete and cold-mix asphalt. A schematic of the boring location plan is shown in Figure 2.1. The majority of the distress in Section 1 consisted of transverse cracking and raveling. The samples from the field work were classified as per ASTM Standards. Cohesive split-barrel samples were tested for their water content as an indicator of the subgrade consistency, strength, and compressibility. Intact asphalt cores were measured for thickness in general accordance with ASTM D3549. The pavement and subsurface profile may be generalized as consisting of hot-mix asphalt followed by aggregate base contaminated with clay, placed over a subgrade consisting of brown lean clay with sand and gravel. 13
24 The thicknesses of the asphalt and base material measured during the field work are presented in Table 2.2. Table 2.2 also lists gradation of the existing base layer. The base course materials had significant clay contamination. The asphalt thickness varied throughout Section 1, ranging from approximately 8½ to 13 inches, with an average of about 10¼ inches. The granular base thickness also varied, ranging from 1¼ to 8 inches, with an average of approximately 5 inches. At nine of the thirteen test locations, the base resembled ODOT #304 crushed limestone contaminated with clay. At the remaining four locations the base consisted of crushed limestone with a strong petroleum odor. The total pavement section including the asphalt and the granular base ranged in thickness from about 11½ to 20 inches with an average of about 15¼ inches. A strength-based mix design was carried out. Laboratory testing was conducted to complete the mix design as follows: Phase I Sample Preparation: Based on a five inch pre-mill, the top five inches of each core was removed, and the remainder of the cores were pulverized to a size judged similar to that obtained in the field using a reclaimer/stabilizer. The pulverized asphalt was combined into a single composite sample. The base material from core locations AB-1, AC-1, AC-2, AC-5, AC- 6, AC-7, B-1, B-2, and C-1 were blended to create a composite sample that resembled ODOT #304 crushed limestone contaminated with clay. Phase II Extraction with Gradation Testing: The bitumen from the composite sample of the pulverized asphalt was extracted in general accordance with ASTM D2172. The recovered aggregate was tested for particle size distribution in general accordance with ASTM C136 as shown in Figure 2.2. Phase III Mix Preparation and Ratio Blending: After a 5-inch pre-mill, the average pavement section along the road was calculated to consist of 5½ inches of asphalt and 6¼ inches of base. Based on the 8-inch pre-pulverization depth, the pulverized materials along the project route will consist of approximately 68% asphalt, and 32% base material contaminated with clay, on average. A mix was prepared using volumetric ratio blending techniques to represent the average condition that will be encountered throughout Section 1. Phase IV Modified Proctor and Gradation Testing: A modified Proctor test was completed on a representative sample of the blended mix in general accordance with ASTM D1557 (see Figure 2.3). A sample of the blended mix was tested for particle size distribution in general accordance with ASTM C136 (see Figure 2.4). Phase V Strength Testing: The water content of a representative portion of the average mix was adjusted to approximately 90% of optimum, as determined by modified Proctor testing. The moisture content was adjusted based on the need for moisture within the pulverized pavement materials during the reclamation process in order to achieve proper density during compaction. The percentage of optimum was selected based on EDP s experience from previous reclamation projects. A portion of the moisture-conditioned material was divided into four sets of six 1,200 g samples. The sets of moisture-conditioned material were used to prepare Marshall briquettes for strength testing. The briquettes were prepared by treating the material with an HFRE emulsion at application rates varying from 1.2 gal/yd 2 to 1.8 gal/yd 2 in 0.2 gal/yd 2 increments. Portland cement was added to each sample at an application rate of 2% by weight. The briquettes, six per application rate, were prepared using heavy-duty Marshall methods utilizing 4 diameter molds. 14
25 After the briquettes were allowed to cure for six days at ambient temperature, they were measured for height, weight, and diameter. Each set of briquettes was then tested in the following manner: Two of the six briquettes from each set were tested for dry indirect tensile strength (ITS). Results are shown in Figure 2.5. Two briquettes were allowed to soak in a vacuum desiccator for 1 hour and then tested for soaked ITS. See Figure 2.6. The last two briquettes from each set were allowed to soak in a circulating water bath at 140 degrees Fahrenheit for 30 minutes before testing for stability and flow. These results are shown in Figure 2.7. Phase VI Additional Engineering Properties: A sample representing each emulsion application rate was tested for maximum theoretical density (MTD) in general accordance with ASTM D2041. A sample representing each emulsion application rate was also tested for percent air voids in general accordance with ASTM D3203. Phase VII Test Results: All of the mixes tested using a combination of 2% Portland cement and emulsion produced results meeting the typical minimum specified dry ITS of 250 kpa, and the minimum soaked ITS of 175 kpa. The highest dry indirect tensile strength (ITS) and stability value were achieved with an emulsion application rate of 1.2 gal/yd 2 in conjunction with 2% Portland cement. However, it was judged that an emulsion application rate of 1.6 gal/yd 2 in conjunction with 2% Portland cement produced the most favorable mix in terms of overall cohesion based on laboratory observations. The average stability value using this application rate was 2,664 lbs with a flow of 15.5 and an air void content of 11.4%. The average dry ITS was 408 kpa and the average soaked, 383 kpa. Based on these results, the mix retained approximately 94% of the dry strength when soaked. A summary of the test results is presented below: Emulsion gals/yd 2 Portland Cement Stability, lbs Flow, 0.01 inches Dry ITS, kpa Soaked ITS, kpa Retained Strength 1.2 2% 2, % 1.4 2% 2, % 1.6 2% 2, % 1.8 2% 2, % Phase VIII Verification Testing: At core location B-1, a thinner pavement section was encountered, which would result in a higher percentage of subgrade being incorporated into the reclaimed materials. Based on the 8 inch pre-pulverization depth, the blended material at this location would consist of approximately 60% pulverized asphalt, 19% base, and 21% clay subgrade. This blend of material represents the worst-case scenario in terms of subgrade content that should be encountered along the project route. Testing was completed to verify that the recommended mix of 1.6 gal/yd 2 emulsion and 2% Portland cement would produce acceptable strengths where the clay is present within the reclaimed material. The test results indicated that the recommended additives would achieve the specified strengths. The average dry ITS was 631 kpa and the average soaked ITS, 558 kpa. 15
26 Based on the above mentioned testing, it was recommended that for the Delaware Section 1 the following mix design by used: - Pre-Mill Depth = 5 inches - Pre-Pulverization Depth = 8 inches - Reclamation Depth = 8 inches - HFRE Emulsion Application Rate = 1.6 gal/yd 2 - Portland Cement Application Rate Based on 130 pcf Material Density = 2% It was further recommended that the reclaimed mat should be allowed to cure for a minimum of 5 days. No construction or other traffic should be allowed on the mat during the cure period. Prior to placing the wearing course of asphalt over the reclaimed pavement, the reclaimed mat should be swept of loose material. Once the mat is cleaned, a tack coat should be applied over the reclaimed surface to help bond the new wearing course to the underlying reclaimed mat. This was recommended to help prevent water from ponding beneath the new asphalt, possibly resulting in damage from frost-related heave. 16
27 Figure 2.1: Delaware Section 1 - Boring Plan 17
28 Figure 2.2: Delaware Section 1 - Particle Size Distribution of Recovered Aggregate 18
29 Figure 2.3: Delaware Section 1 Modified Proctor Test Results on Blended Mix 19
30 Figure 2.4: Delaware Section 1 Particle Size Distribution of Blended Mix 20
31 Figure 2.5: Delaware Section 1 Indirect Tensile Strength Test Results for Dry Briquettes 21
32 Figure 2.6: Delaware Section 1 Indirect Tensile Strength Test Results for Soaked Briquettes 22
33 Figure 2.7: Delaware Section 1 Indirect Tensile Strength Test Results for Heated and Soaked Briquettes 23
34 Table 2.2 Delaware Section 1 - Existing Pavement Thickness Measurements & Base Classification Asphalt Thickness (inches) Asphalt Thickness After 5" Mill Base Thickness (inches) Pavement Thickness (inches) Water Encountered in Base Boring # AB-1 8 1/2 3 1/ /2 no AC-1 9 1/4 4 1/ /4 no AC-2 9 3/4 4 3/4 6 1/2 11 1/4 no AB /4 7 3/ /4 no AC no AC /4 6 1/4 4 1/2 10 3/4 no AC-5 8 1/2 3 1/2 4 1/2 8 no AC /2 9 1/2 no AC no B-1 9 3/4 4 3/4 1 1/2 6 1/4 no B no C no C /2 6 1/ /2 no Average 10 1/4 5 1/ /4 - Boring # Base Classification AB-1 Resembles ODOT #304 gradation limestone with clay contamination. AC-1 Resembles ODOT #304 gradation limestone with clay contamination. AC-2 Resembles ODOT #304 gradation limestone with clay contamination. AB-2 Crushed limestone base with clay contamination and a petroleum odor. AC-3 Crushed limestone base with clay contamination and a petroleum odor. AC-4 Crushed limestone base with clay contamination and a petroleum odor. AC-5 Resembles ODOT #304 gradation limestone with clay contamination. AC-6 Resembles ODOT #304 gradation limestone with clay contamination. AC-7 Resembles ODOT #304 gradation limestone with clay contamination. B-1 Resembles ODOT #304 gradation limestone with clay contamination. B-2 Resembles ODOT #304 gradation limestone with clay contamination. C-1 Resembles ODOT #304 gradation limestone with clay contamination. C-2 Crushed limestone base with clay contamination and a petroleum odor. 24
35 Section 2: Cement This FDR section (approximately 0.5 miles in length) was planned to be on Section Line Road beginning at approximately South Lake Hill Road and extending north 2,460 feet to approximately Highlands Drive. The planned rehabilitation work for this section is as follows: 1. Mill and remove 5 inches of the existing asphalt. 2. Pre-pulverize the remaining materials to a depth of 12 inches. 3. Reclaim the upper 12 inches of the pavement materials with cement to create a stabilized base course (SBC). 4. Surface the SBC with 5 inches of hot-mix asphalt. The pavement section to be reclaimed was studied by coring the existing asphalt at 8 locations within 3 areas using a 10-inch diameter diamond-tipped core barrel. The locations and areas were selected based on information gathered through past exploration. Because the borings completed in 2003 were considered to be sufficient for design purposes, no additional Standard Penetration Test (SPT) borings were drilled in Section 2. At each of the test locations, the existing pavement was cored, and the underlying aggregate base, where present, was sampled in its entirety. The thicknesses of the asphalt and base were measured during the completion of the field work. The boreholes were backfilled with soil cuttings and the pavement was restored using ready-mix concrete and cold-mix asphalt. A schematic of the boring location plan is shown in Figure 2.8. The majority of the distress in Section 2 consisted of alligator cracking, lateral cracking, and minor rutting. The samples from the field work were classified as per ASTM Standards. Cohesive split-barrel samples were tested for their water content as an indicator of the subgrade consistency, strength, and compressibility. Intact asphalt cores were measured for thickness in general accordance with ASTM D3549. The pavement and subsurface profile may be generalized as consisting of hot-mix asphalt followed by aggregate base contaminated with clay, placed over a subgrade consisting of brown clay with sand and gravel. The thicknesses of the asphalt and base material measured during the field work are presented in Table 2.3. Table 2.4 lists gradation of the existing base layer. The asphalt thickness varied throughout Section 2, ranging from approximately 6¼ to 12 inches, with an average of about 9¾ inches. The granular base thickness also varied, ranging from 1 to 8¾ inches, with an average of approximately 4½ inches. At eleven of the twelve test locations, the base resembled ODOT #304 crushed limestone contaminated with clay. At four of the locations some #1 and #2 sized limestone pieces were also present. The materials at location B-4 consisted of crushed limestone with clay contamination and a petroleum odor. The total pavement section including the asphalt and the granular base ranged in thickness from about 9¾ inches to 17½ inches with an average of about 14 inches. A strength-based mix design was carried out. Laboratory testing was conducted to complete the mix design as follows: 25
36 Phase I Sample Preparation: Based on a five inch pre-mill, the top five inches of each core was removed, and the remainder of the cores were pulverized to a size judged similar to that obtained in the field using a reclaimer/stabilizer. The base materials from each test location, excluding AC-9, were blended to create one composite sample. The sample from test location AC-9 consisted of limestone with asphalt grindings, which was not representative of the majority of the road. Phase II Extraction with Gradation Testing: The bitumen from the composite sample of the pulverized asphalt was extracted in general accordance with ASTM D2172. The recovered aggregate was tested for particle size distribution in general accordance with ASTM C136 as shown in Figure 2.9. Phase III Mix Preparation and Ratio Blending: The asphalt thicknesses in Section 2 after the 5 inch pre-mill was calculated to range from 1¼ to 7 inches, with an average of 4¾ inches. The base material thickness ranged from 1 to 8¾ inches with an average of 4¼ inches. The average conditions in this section based on a 5 inch pre-mill and a 12 inch pre-pulverization depth will consist of approximately 41% asphalt, 30% base material contaminated with clay, and 29% subgrade. However, prior EDP experience with other cement stabilization projects have indicated that higher proportions of granular material produce higher strengths than mixes that contain greater proportions of soil. Based on this, a mix was developed using the worst-case scenario of 39% asphalt, 8% base material, and 53% subgrade, determined by the thickness measurements from location B-7. This mix was prepared using volumetric ratio blending techniques to represent the conditions along this portion of the project route. Phase IV Standard Proctor and Gradation Testing: A standard Proctor test was completed on a representative sample of the blended mix in general accordance with ASTM 698A (see Figure 2.10). A sample of the blended mix was tested for particle size distribution in general accordance with ASTM D422 (see Figure 2.11). Phase V Strength Testing: The blended mix was adjusted to approximately 2% over optimum moisture as determined by standard Proctor testing. Portland cement was added to the moistureconditioned material at application rates of 3%, 5%, and 7%. The amount of Portland cement added was computed based on volume-density relationships using the results of the standard Proctor testing. Three soil-cement cylinders were prepared at each cement application rate, for a total of nine specimens. Three specimens from each application rate were cured in an oven for six days at 104º F. After the cure period, the specimens were set up for a 24 hour capillary soak. After the capillary soak, the specimens were tested for compressive strength in general accordance with ASTM D1633. Phase VI Test Results: It was recommend adding Portland cement at an application rate of 5%, based on a material density of pcf. At this application rate, an average compressive strength of 370 psi was achieved after the 6 day cure period. This strength is well above what is typically required by ODOT for soil-cement projects, 150 psi after a 5 day cure period. Although the higher application rate of Portland cement achieved somewhat greater strengths, higher percentages of Portland cement could result in significant shrinkage that could be counterproductive to the stabilized subgrade. Phase VII Additional Testing: After evaluating the test results and selecting the admixture rate, three additional soil-cement specimens were prepared in the same manner as previously described using 5% Portland cement. These cylinders were tested in the same manner as that 26
37 done during the initial testing. They were cured for 7 days at ambient temperature and tested for compressive strength. The cylinders cured in the same manner as that done during the initial phase of testing indicated compressive strengths of about 435 psi, while the 7 day ambient cure indicated nearly 500 psi. Based on the above mentioned testing, it was recommended that for the Delaware Section 2 the following mix design by used: - Pre-Mill Depth = 5 inches - Pre-Pulverization Depth = 12 inches - Stabilization Depth = 12 inches - Portland Cement Application Rate Based on pcf Material Density = 5% It was further recommended that the reclaimed mat should be allowed to cure for a minimum of 5 days. No construction or other traffic should be allowed on the mat during the cure period. Prior to placing the wearing course of asphalt over the reclaimed pavement, the reclaimed mat should be swept of loose material. Once the mat is cleaned, a tack coat should be applied over the reclaimed surface to help bond the new wearing course to the underlying reclaimed mat. This was recommended to help prevent water from ponding beneath the new asphalt, possibly resulting in damage from frost-related heave. 27
38 Figure 2.8: Delaware Section 2 - Boring Plan 28
39 Table 2.3 Delaware Section 2 - Existing Pavement Thickness Measurements Asphalt Thickness (inches) Asphalt Thickness After 5" Mill Base Thickness (inches) Pavement Thickness (inches) Water Encountered in Base Boring # AC-8 6 1/2 1 1/ /2 no AC no AC /4 6 3/4 2 1/4 9 no AC /4 5 1/4 6 1/2 11 3/4 no AC /4 6 1/ /4 no AC /2 5 1/2 3/4 6 1/4 no AC /4 1 1/4 8 1/2 9 3/4 no AC /4 3 3/4 8 3/4 12 1/2 no B no B no B no B-7 9 3/4 4 3/ /4 no Average 9 3/4 4 3/4 4 1/4 9 - Table 2.4 Delaware Section 2 Base Classification Boring # Base Classification AC-8 Resembles ODOT #304 gradation limestone with clay contamination. AC-9 Resembles ODOT #304 gradation limestone with some asphalt pieces and clay contamination. AC-10 Resembles ODOT #304 gradation limestone with some organics and clay contamination. AC-11 Resembles ODOT #304 gradation limestone with #1 and #2 sized pieces and clay contamination. AC-12 Resembles ODOT #304 gradation limestone with #1 and #2 sized pieces and clay contamination. AC-13 Resembles ODOT #304 gradation limestone with some asphalt pieces and clay contamination. AC-14 Resembles ODOT #304 gradation limestone with #1 and #2 sized pieces and clay contamination. AC-15 Resembles ODOT #304 gradation limestone with #1 and #2 sized pieces and clay contamination. B-3 Resembles ODOT #304 gradation limestone with some asphalt pieces and clay contamination. B-4 Crushed limestone base with clay contamination and a petroleum odor. B-6 Resembles ODOT #304 gradation limestone with some asphalt pieces and clay contamination. B-7 Resembles ODOT #304 gradation limestone with some asphalt pieces and clay contamination. 29
40 Figure 2.9: Delaware Section 2 - Particle Size Distribution of Recovered Aggregate 30
41 Figure 2.10: Delaware Section 2 Standard Proctor Test Results on Blended Mix 31
42 Figure 2.11: Delaware Section 2 Particle Size Distribution of Blended Mix 32
43 Section 3: Emulsion & Lime Kiln Dust This FDR section (approximately 1 mile in length) was planned to be on Section Line Road beginning at approximately Highlands Drive and extending north 1 mile to Clark Shaw Road. The planned rehabilitation work for this section is as follows: 1. Mill and remove 5 inches of the existing asphalt. 2. Pre-pulverize the remaining materials to a depth of 8 inches. 3. Reclaim the upper 8 inches of the pavement materials with emulsion and Lime Kiln Dust (LKD) to create a stabilized base course (SBC). 4. Surface the SBC with 5 inches of hot-mix asphalt. The pavement section to be reclaimed was studied by coring the existing asphalt at 8 locations within 4 areas using a 10-inch diameter diamond-tipped core barrel. The locations and areas were selected based on information gathered through past exploration. Because the borings completed in 2003 were considered to be sufficient for design purposes, no additional Standard Penetration Test (SPT) borings were drilled in Section 3. At each of the test locations, the existing pavement was cored, and the underlying aggregate base, where present, was sampled in its entirety. The thicknesses of the asphalt and base were measured during the completion of the field work. The boreholes were backfilled with soil cuttings and the pavement was restored using ready-mix concrete and cold-mix asphalt. A schematic of the boring location plan is shown in Figure The majority of the distress in Section 3 consisted of alligator cracking, longitudinal and transverse cracking, and raveling. The pavement and subsurface profile may be generalized as consisting of hot-mix asphalt followed by aggregate base contaminated with clay, placed over a subgrade consisting of brown lean clay with sand and gravel. The thicknesses of the asphalt and base material measured during the field work are presented in Table 2.5. Table 2.6 lists gradation of the existing base layer. The asphalt thickness varied throughout Section 3, ranging from 7½ to 12½ inches, with an average of about 10 inches. The granular base thickness also varied, ranging from no base to 9 inches, with an average of 4½ inches. At eleven of the fifteen test locations, the base resembled ODOT #304 crushed limestone with clay contamination. At location C-4 the base consisted of crushed limestone with a strong petroleum odor. The base at locations AC-16 and AC-23 resembled limestone screenings with clay contamination and at location AC-18, no base was encountered. The total pavement section including the asphalt, and the granular base ranged in thickness from 9½ to 18½ inches, with an average of 14½ inches. A strength-based mix design was carried out. Laboratory testing was conducted to complete the mix design as follows: Phase I Sample Preparation: Based on a five inch pre-mill, the top five inches of each core was removed, and the remainder of the cores were pulverized to a size judged similar to that obtained in the field using a reclaimer/stabilizer. The pulverized asphalt was combined into one composite sample. The base material from core locations AC-17, AC-19, AC-20, AC-21, AC-22, 33
44 P in AC-23, B-8, B-10, C-3, C-5, C-6, and C-7 were blended to create one composite sample that resembled ODOT #304 crushed limestone with clay contamination. Phase II Extraction with Gradation Testing: The bitumen from the composite sample of the pulverized asphalt was extracted in general accordance with ASTM D2172. The recovered aggregate was tested for particle size distribution in general accordance with ASTM C136 as shown in Figure Phase III Mix Preparation and Ratio Blending: After a 5-inch pre-mill, the average pavement section along the road was calculated to consist of 5¼ inches of asphalt and 4¾ inches of base. Based on the specified 8-inch pre-pulverization depth, the pulverized materials along the project route will consist of approximately 67% asphalt, and 33% base material contaminated with clay, on average. A mix was prepared using volumetric ratio blending techniques to represent the average condition that will be encountered throughout Section 3. Phase IV Modified Proctor and Gradation Testing: A modified Proctor test was completed on a representative sample of the blended mix in general accordance with ASTM D1557 (see Figure 2.14). A sample of the blended mix was tested for particle size distribution in general accordance with ASTM C136 (see Figure 2.15). Phase V Strength Testing: The moisture content of a representative portion of the average mix was adjusted to approximately 90% of optimum, as determined by modified Proctor testing. The moisture content was adjusted based on the need for moisture within the pulverized pavement materials during the reclamation process in order to achieve proper density during compaction. The percentage of optimum was selected based on EDP s experience from previous reclamation projects. A portion of the moisture-conditioned material was divided into four sets of six 1,200 g samples. The sets of moisture-conditioned material were used to prepare Marshall briquettes for strength testing. The briquettes were prepared by treating the material with an HFRE emulsion at application rates varying from1.2 gal/yd 2 Pto 1.8 gal/yd gal/yd 2 increments. Lime Kiln Dust was added to each sample at an application rate of 3% by weight as chosen by the design team. The briquettes, six per application rate, were prepared using heavyduty Marshall methods utilizing 4 diameter molds. After the briquettes were allowed to cure for six days at ambient temperature, they were measured for height, weight, and diameter. Each set of briquettes was then tested as follows: Two of the six briquettes from each set were tested for dry indirect tensile strength (ITS). Results are shown in Figure Two briquettes were allowed to soak in a vacuum desiccator for 1 hour and then tested for soaked ITS. See Figure The last two briquettes from each set were allowed to soak in a circulating water bath at 140 degrees Fahrenheit for 30 minutes before testing for stability and flow. These results are shown in Figure Phase VI Additional Engineering Properties: A sample representing each emulsion application rate was tested for maximum theoretical density (MTD) in general accordance with ASTM D2041. A sample representing each emulsion application rate was also tested for percent air voids in general accordance with ASTM D3203. Phase VII Test Results: None of the mixes tested using a combination of 3% Lime Kiln Dust and emulsion produced results meeting the typical minimum specified dry ITS of 250 kpa. However all the mixes achieved the minimum soaked ITS of 175 kpa. The highest dry indirect tensile strength (ITS) and stability value was achieved with an emulsion application rate of
45 gal/yd 2 in conjunction with 3% Lime Kiln Dust. However, we judged that an emulsion application rate of 1.4 gal/yd 2 in conjunction with 3% Lime Kiln Dust produced the most favorable mix in terms of overall cohesion based on laboratory observations. The average stability value using this application rate was 1,609 lbs with a flow of 11.5 and an air void content of 13.2%. The average dry ITS was 211 kpa and the average soaked, 185 kpa. Based on these results, the mix retained approximately 88% of the dry strength when soaked. A summary of the test results is presented below: Emulsion gals/yd 2 Lime Kiln Dust Stability, Lbs Flow, 0.01 inches Dry ITS, kpa Soaked ITS, kpa Retained Strength 1.2 3% 1, % 1.4 3% 1, % 1.6 3% 1, % 1.8 3% 1, % Phase VIII Verification Testing: At core location C-7, a thinner pavement section was encountered, which would result in a higher percentage of subgrade being incorporated into the reclaimed materials. Based on the 8 inch pre-pulverization depth, the blended material at this location would consist of approximately 31% pulverized asphalt, 25% base, and 44% clay subgrade. This blend of material represents the worst-case scenario in terms of subgrade content that should be encountered along the project route. Testing was completed to verify that the recommended mix of 1.4 gal/yd 2 emulsion and 3% Lime Kiln Dust would produce acceptable strengths where the clay is present within the reclaimed mat. The test results indicate that the recommended additives would achieve strengths considerably greater than were indicated by the previous tests. The average dry ITS was 292 kpa and the average soaked ITS was 264 kpa. Based on the above mentioned testing, it was recommended that for the Delaware Section 3 the following mix design by used: - Pre-Mill Depth = 5 inches - Pre-Pulverization Depth = 8 inches - Reclamation Depth = 8 inches - HFRE Emulsion Application Rate = 1.4 gal/yd 2 - Lime Kiln Dust Application Rate Based on 130 pcf Material Density = 3% It was further recommended that the reclaimed mat should be allowed to cure for a minimum of 5 days. No construction or other traffic should be allowed on the mat during the cure period. Prior to placing the wearing course of asphalt over the reclaimed pavement, the reclaimed mat should be swept of loose material. Once the mat is cleaned, a tack coat should be applied over the reclaimed surface to help bond the new wearing course to the underlying reclaimed mat. This was recommended to help prevent water from ponding beneath the new asphalt, possibly resulting in damage from frost-related heave. 35
46 Figure 2.12: Delaware Section 3 - Boring Plan 36
47 Table 2.5 Delaware Section 3 - Existing Pavement Thickness Measurements Asphalt Thickness (inches) Asphalt Thickness After 5" Mill Base Thickness (inches) Pavement Thickness (inches) Water Encountered in Base Boring # AC no AC /4 4 1/ /4 no AC /2 7 1/ /2 no AC /2 10 1/2 no AC /2 5 1/ /2 no AC no AC /4 5 3/ /4 no AC /2 3 1/2 5 1/2 9 no C /2 7 1/2 no C /2 13 1/2 no C /4 6 3/ /4 no C /2 5 1/2 5 1/2 11 no C-7 7 1/2 2 1/ /2 no B no B /2 8 1/2 no Average /2 9 1/2 - Table 2.6 Delaware Section 3 Base Classification Boring # Base Classification AC-16 Resembles limestone screenings with clay contamination. AC-17 Resembles ODOT #304 gradation limestone with clay contamination. AC-18 None AC-19 Resembles ODOT #304 gradation limestone with clay contamination. AC-20 Resembles ODOT #304 gradation limestone with clay contamination. AC-21 Resembles ODOT #304 gradation limestone with clay contamination. AC-22 Resembles ODOT #304 gradation limestone with clay contamination. AC-23 Resembles limestone screenings with clay contamination. C-3 Resembles ODOT #304 gradation limestone with clay contamination. C-4 Crushed limestone base with clay contamination and a petroleum odor. C-5 Resembles ODOT #304 gradation limestone with clay contamination. C-6 Resembles ODOT #304 gradation limestone with clay contamination. C-7 Resembles ODOT #304 gradation limestone with clay contamination. B-8 Resembles ODOT #304 gradation limestone with clay contamination. B-10 Resembles ODOT #304 gradation limestone with clay contamination. 37
48 Figure 2.13: Delaware Section 3 - Particle Size Distribution of Recovered Aggregate 38

49 Figure 2.14: Delaware Section 3 Modified Proctor Test Results on Blended Mix 39
50 Figure 2.15: Delaware Section 3 Particle Size Distribution of Blended Mix 40
51 Figure 2.16: Delaware Section 3 Indirect Tensile Strength Test Results for Dry Briquettes 41

52 Figure 2.17: Delaware Section 3 Indirect Tensile Strength Test Results for Soaked Briquettes 42
53 Figure 2.18: Delaware Section 3 Indirect Tensile Strength Test Results for Heated and Soaked Briquettes 43
54 Section 4: Fly Ash & Lime Kiln Dust This FDR section (approximately 1 mile in length) was planned to be on Section Line Road beginning at approximately at Clark Shaw Road and extending north of Bean Oller Road. The planned rehabilitation work for this section is as follows: 1. Mill and remove 5 inches of the existing asphalt. 2. Pre-pulverize the remaining materials to a depth of 8 inches. 3. Reclaim the upper 8 inches of the pavement materials with Class F fly ash and Lime Kiln Dust (LKD) to create a stabilized base course (SBC). 4. Surface the SBC with 5 inches of hot-mix asphalt. The pavement section to be reclaimed was studied by coring the existing asphalt at 8 locations within 3 areas using a 10-inch diameter diamond-tipped core barrel. The locations and areas were selected based on information gathered through past exploration. Because the borings completed in 2003 were considered to be sufficient for design purposes, no additional Standard Penetration Test (SPT) borings were drilled in Section 4. At each of the test locations, the existing pavement was cored, and the underlying aggregate base, where present, was sampled in its entirety. The thicknesses of the asphalt and base were measured during the completion of the field work. The boreholes were backfilled with soil cuttings and the pavement was restored using ready-mix concrete and cold-mix asphalt. A schematic of the boring location plan is shown in Figure The majority of the distress in Section 4 consisted of alligator cracking, longitudinal and transverse cracking, and raveling. The pavement and subsurface profile may be generalized as consisting of hot-mix asphalt followed by aggregate base contaminated with clay, placed over a subgrade consisting of brown lean clay with sand and gravel. The thicknesses of the asphalt and base material measured during the field work are presented in Table 2.7. Table 2.8 lists gradation of the existing base layer. The asphalt thickness throughout Section 4 varied from approximately 5¼ to 13½ inches, with an average of about 10¼ inches. The granular base thickness also varied, ranging from 2½ to 8¾ inches, with an average of approximately 5¼ inches. At fourteen of the fifteen test locations, the base resembled ODOT #304 crushed limestone. At nine of the fourteen locations the base material was contaminated with clay, and at core location AC-27 the material resembled limestone screenings with clay contamination. The total pavement section including the asphalt and the granular base ranged in thickness from about 11 to 19½ inches with an average of about 15½ inches. A strength-based mix design was carried out. Laboratory testing was conducted to complete the mix design as follows: Phase I Sample Preparation: Based on a five inch pre-mill, the top five inches of each core was removed and the remainder of the cores was pulverized to a size judged similar to that obtained in the field using a reclaimer/stabilizer. The pulverized asphalt was combined into one composite sample. The base material from each core location, except core location AC-27, was 44
55 combined and blended to create one composite sample that resembled ODOT #304 crushed limestone contaminated with clay. Phase II Extraction with Gradation Testing: The bitumen from the composite sample of the pulverized asphalt was extracted in general accordance with ASTM D2172. The recovered aggregate was tested for particle size distribution in general accordance with ASTM C136 as shown in Figure Phase III Mix Preparation and Ratio Blending: After a 5-inch pre-mill, the average pavement section along the road was calculated to consist of 5 inches of asphalt and 5½ inches of base. Based on the 8-inch pre-pulverization depth, the pulverized materials along the project route will consist of approximately 68% asphalt, and 32% base material contaminated with clay, on average. A mix was prepared using volumetric ratio blending techniques to represent the average condition that will be encountered throughout Section 4. Phase IV Modified Proctor and Gradation Testing: A modified Proctor test was completed on a representative sample of the blended mix in general accordance with ASTM D1557 (see Figure 2.21). A sample of the blended mix was tested for particle size distribution in general accordance with ASTM C136 (see Figure 2.22). Phase V Strength Testing: The water content of a representative portion of the average mix was adjusted to approximately 2 to 3% over optimum, as determined by modified Proctor testing. The moisture content was adjusted based on the need for moisture within the pulverized pavement materials during the reclamation process in order to activate the additives and achieve proper density during compaction. The percentage of optimum was selected based on a need for water to hydrate the Lime Kiln Dust. A portion of the moisture-conditioned material was divided into two sets of six 1,200 g samples. The sets of moisture-conditioned material were used to prepare Marshall briquettes for strength testing. The briquettes were prepared by treating each set with Lime Kiln Dust at an application rate of 5%, by weight, followed by treating each set with 5% fly ash. These admixture rates were selected by the design team prior to the completion of the mix design. The briquettes were prepared using heavy-duty Marshall methods utilizing 4 diameter molds. After the briquettes were allowed to cure for six days at ambient temperature, they were measured for height, weight, and diameter. Each set of briquettes was then tested as follows: Four of the twelve briquettes from each set were tested for dry indirect tensile strength (ITS). Four briquettes were allowed to soak in a vacuum desiccator for 1 hour and then tested for soaked ITS. The last four briquettes from each set were allowed to soak in a circulating water bath at 140 degrees Fahrenheit for 30 minutes before testing for stability and flow. Phase VI Additional Engineering Properties: Samples of treated material were tested for maximum theoretical density (MTD) and percent air voids in general accordance with ASTM D2041 and ASTM D3203, respectively. Phase VII Test Results: None of the briquettes tested using a combination of 5% Lime Kiln Dust and 5% fly ash produced results meeting the typical minimum specified dry ITS of 250 kpa, however, the typically specified minimum soaked ITS of 175 kpa was achieved. The average stability value using these additives was 2,849 lbs with a flow of 12.3 and an average air void content of 15.0%. The average dry ITS of the 4 briquettes was 188 kpa and the average soaked, 188 kpa. Based on the average of the results, the mix retained 100% of the dry strength when soaked. A summary of the test results is presented below: 45
56 Fly ash Lime Kiln Dust Stability, Lbs Flow, 0.01 inches Dry ITS, kpa Soaked ITS, kpa Retained Strength 5% 5% 2, % 5% 5% 2, % 5% 5% 3, % 5% 5% 2, % Phase VIII Verification Testing: At core location C-8, a thinner pavement section was encountered, which would result in a higher percentage of subgrade being incorporated into the reclaimed mat. Based on the 8 inch pre-pulverization depth, the blended material at this location would consist of approximately 44% pulverized asphalt, 31% base, and 25% clay subgrade. This blend of material represents the worst-case scenario in terms of subgrade content that should be encountered along the project route. Testing was completed to determine whether the mix of 5% Lime Kiln Dust and 5% fly ash would produce acceptable strengths when the greater proportion of clay is present within the reclaimed mat. The test results indicate that the specified additives would produce strengths slightly lower those produced in the original testing which evaluated the average conditions. The average dry ITS was 231 kpa and the average soaked ITS, 108 kpa. The average stability value using this application rate was 2,339 lbs with a flow of 12. Based on the above mentioned testing, it was recommended that for the Delaware Section 4 the following mix design by used: - Pre-Mill Depth = 5 inches - Pre-Pulverization Depth = 8 inches - Reclamation Depth = 8 inches - Fly ash Application Rate Based on 130 pcf Material Density = 5% - Lime Kiln Dust Application Rate Based on 130 pcf Material Density = 5% It was further recommended that the reclaimed mat should be allowed to cure for a minimum of 5 days. No construction or other traffic should be allowed on the mat during the cure period. Prior to placing the wearing course of asphalt over the reclaimed pavement, the reclaimed mat should be swept of loose material. Once the mat is cleaned, a tack coat should be applied over the reclaimed surface to help bond the new wearing course to the underlying reclaimed mat. This was recommended to help prevent water from ponding beneath the new asphalt, possibly resulting in damage from frost-related heave. 46
57 Figure 2.19: Delaware Section 4 - Boring Plan 47
58 Table 2.7 Delaware Section 4 - Existing Pavement Thickness Measurements Asphalt Thickness (inches) Asphalt Thickness After 5" Mill Base Thickness (inches) Pavement Thickness (inches) Water Encountered in Base Boring # AC /2 7 1/2 4 3/4 12 1/4 no AC /4 7 3/4 3 1/2 11 1/4 no AC /4 4 3/4 3 1/2 8 1/4 no AC /4 5 3/4 5 1/2 11 1/4 no AC /2 8 1/ /2 no AC /2 14 1/2 no AC /4 5 1/4 5 1/2 10 3/4 no AC /4 4 1/ /4 no C-8 8 1/2 3 1/2 2 1/2 6 no C /4 7 1/ /4 no C /4 1/4 8 3/4 9 no C /2 11 1/2 no B /2 5 1/2 5 1/2 11 no B /2 3 1/2 4 1/2 8 no B /2 5 1/2 6 1/2 12 no Average 10 1/4 5 1/4 5 1/4 10 1/2 - Table 2.8 Delaware Section 4 Base Classification Boring # Base Classification AC-24 Resembles ODOT #304 gradation limestone. AC-25 Resembles ODOT #304 gradation limestone. AC-26 Resembles ODOT #304 gradation limestone. AC-27 Resembles limestone screenings with clay contamination. AC-28 Resembles ODOT #304 gradation limestone. AC-29 Resembles ODOT #304 gradation limestone. AC-30 Resembles ODOT #304 gradation limestone with clay contamination. AC-31 Resembles ODOT #304 gradation limestone with clay contamination. C-8 Resembles ODOT #304 gradation limestone with clay contamination. C-9 Resembles ODOT #304 gradation limestone with clay contamination. C-10 Resembles ODOT #304 gradation limestone with clay contamination. C-11 Resembles ODOT #304 gradation limestone with clay contamination. B-11 Resembles ODOT #304 gradation limestone with clay contamination. B-13 Resembles ODOT #304 gradation limestone with clay contamination. B-14 Resembles ODOT #304 gradation limestone with clay contamination. 48
59 Figure 2.20: Delaware Section 4 - Particle Size Distribution of Recovered Aggregate 49
60 Figure 2.21: Delaware Section 4 Modified Proctor Test Results on Blended Mix 50
61 Figure 2.22: Delaware Section 4 Particle Size Distribution of Blended Mix 51
62 Section 5: Fly Ash & Lime This FDR section (approximately 1 mile in length) was planned to be on Section Line Road beginning north of Bean Oller Road and extending north to approximately Bunty Station Road. The planned rehabilitation work for this section is as follows: 1. Mill and remove 5 inches of the existing asphalt. 2. Pre-pulverize the remaining materials to a depth of 8 inches. 3. Reclaim the upper 8 inches of the pavement materials with lime and allow the lime treated material to mellow for a 24 hour period. Then add Class F Fly ash to create a stabilized base course (SBC). 4. Surface the SBC with 5 inches of hot-mix asphalt. The pavement section to be reclaimed was studied by coring the existing asphalt at 7 locations within 4 areas using a 10-inch diameter diamond-tipped core barrel. The locations and areas were selected based on information gathered through past exploration. At each of the test locations, the existing pavement was cored, and the underlying aggregate base, where present, was sampled in its entirety. A 6½ ft deep Standard Penetration Test (SPT) boring was drilled at test locations AB-3, AB-4, AB-5, and AB-6 in general accordance with ASTM Standards. The thicknesses of the asphalt and base were measured during the completion of the field work. The boreholes were backfilled with soil cuttings and the pavement was restored using ready-mix concrete and cold-mix asphalt. A schematic of the boring location plan is shown in Figure The majority of the distress in Section 5 consisted of alligator cracking, longitudinal and transverse cracking, and raveling. The pavement and subsurface profile may be generalized as consisting of hot-mix asphalt followed by aggregate base contaminated with clay, placed over a subgrade consisting of brown lean clay with sand and gravel. The thicknesses of the asphalt and base material measured during the field work are presented in Table 2.9. Table 2.10 lists gradation of the existing base layer. The asphalt thickness throughout the section varied from approximately 8¼ to 14 inches, with an average of about 10½ inches. The granular base thickness also varied, ranging from 3 to 13½ inches, with an average of approximately 7¼ inches. At all twelve test locations, the base resembled ODOT #304 crushed limestone and ten of the twelve were contaminated with clay. The total pavement section including the asphalt and the granular base ranged in thickness from about 13 to 27 inches with an average of about 17¾ inches. A strength-based mix design was carried out. Laboratory testing was conducted to complete the mix design as follows: Phase I Sample Preparation: Based on a five inch pre-mill, the top five inches of each core was removed and the remainder of the cores was pulverized to a size judged similar to that obtained in the field using a reclaimer/stabilizer. The pulverized asphalt was combined into one composite sample. The base material from each core location was combined and blended to 52
63 create one composite sample that resembled ODOT #304 crushed limestone contaminated with clay. Phase II Extraction with Gradation Testing: The bitumen from the composite sample of the pulverized asphalt was extracted in general accordance with ASTM D2172. The recovered aggregate was tested for particle size distribution in general accordance with ASTM C136 as shown in Figure Phase III Mix Preparation and Ratio Blending: After a 5-inch pre-mill, the average pavement section along the road will consist of 5½ inches of asphalt and 7¼ inches of base. Based on the 8-inch pre-pulverization depth, the pulverized materials along the project route will consist of approximately 66% asphalt, and 34% base material contaminated with clay, on average. A mix was prepared using volumetric ratio blending techniques to represent the average condition that will be encountered throughout Section 5. Phase IV Modified Proctor and Gradation Testing: A modified Proctor test was completed on a representative sample of the blended mix in general accordance with ASTM D1557 (see Figure 2.25). A sample of the blended mix was tested for particle size distribution in general accordance with ASTM C136 (see Figure 2.26). Phase V Strength Testing: The water content of a representative portion of the average mix was adjusted to approximately 2 to 3% over optimum, as determined by modified Proctor testing. The moisture content was adjusted based on the need for moisture within the pulverized pavement materials during the reclamation process in order to activate the additives and achieve proper density during compaction. The percentage of optimum was selected based on experience from previous reclamation projects. A portion of the moisture-conditioned material was divided into two sets of six 1,200 g samples. The sets of moisture-conditioned material were used to prepare Marshall briquettes for strength testing. The briquettes were prepared by treating each set with lime at an application rate of 4%, by weight, followed by treating each set with 6% fly ash. These admixture rates were selected by the design team prior to the completion of the mix design. The briquettes were prepared using heavy-duty Marshall method utilizing 4 diameter molds. After the briquettes were allowed to cure for six days at ambient temperature, they were measured for height, weight, and diameter. Each set of briquettes was then tested as follows: Four of the twelve briquettes from each set were tested for dry indirect tensile strength (ITS). Four briquettes were allowed to soak in a vacuum desiccator for 1 hour and then tested for soaked ITS. The last four briquettes from each set were allowed to soak in a circulating water bath at 140 degrees Fahrenheit for 30 minutes before testing for stability and flow. Phase VI Additional Engineering Properties: Samples of treated material were tested for maximum theoretical density (MTD) and percent air voids in general accordance with ASTM D2041 and ASTM D3203, respectively. Phase VII Test Results: Only one of the four briquettes prepared using a combination of 4% Lime and 6% fly ash produced results meeting the typical minimum standards of reclamation. The average stability value calculated using this application rate was 1,256 lbs with a flow of 9.8 and an air void content of 17.8%. The average dry ITS was 242 kpa and the average soaked, 168 kpa. Based on these results, the mix retained approximately 69% of the dry strength when soaked. A summary of the test results is presented below: 53
64 Fly ash Lime Stability, Lbs Flow, 0.01 inches Dry ITS, kpa Soaked ITS, kpa Retained Strength 6% 4% 1, % 6% 4% 2, % 6% 4% 1, % 6% 4% 1, % Phase VIII Verification Testing: At core location B-17, a thinner pavement section was encountered, which would result in a higher percentage of subgrade being incorporated into the reclaimed materials. Based on the 8 inch pre-pulverization depth, the blended material at this location would consist of approximately 40% pulverized asphalt, 44% base, and 16% clay subgrade. This blend of material represents the worst-case scenario in terms of subgrade content that should be encountered along the project route. Testing was completed to determine whether the addition of 4% Lime and 6% fly ash would produce acceptable strengths where the clay is present within the reclaimed material. The average dry ITS was 173 kpa and the average soaked ITS was 104 kpa. The average stability value using this application rate was 2,339 lbs with a flow of 12. Based on the above mentioned testing, it was recommended that for the Delaware Section 5 the following mix design by used: - Pre-Mill Depth = 5 inches - Pre-Pulverization Depth = 8 inches - Reclamation Depth = 8 inches - Fly ash Application Rate Based on 130 pcf Material Density = 6% - Lime Application Rate Based on 130 pcf Material Density (with 24 hour mellow period) = 4% It was further recommended that the reclaimed mat should be allowed to cure for a minimum of 5 days. No construction or other traffic should be allowed on the mat during the cure period. Prior to placing the wearing course of asphalt over the reclaimed pavement, the reclaimed mat should be swept of loose material. Once the mat is cleaned, a tack coat should be applied over the reclaimed surface to help bond the new wearing course to the underlying reclaimed mat. This was recommended to help prevent water from ponding beneath the new asphalt, possibly resulting in damage from frost-related heave. 54
65 Figure 2.23: Delaware Section 5 - Boring Plan 55
66 Table 2.9 Delaware Section 5 - Existing Pavement Thickness Measurements Asphalt Thickness (inches) Asphalt Thickness After 5" Mill Base Thickness (inches) Pavement Thickness (inches) Water Encountered in Base Boring # AB-3 9 1/2 4 1/ /2 no AB /2 6 1/2 12 1/4 18 3/4 no AC /4 5 3/ /4 no AB no AC no AB no AC /2 4 1/ /2 no B /2 14 1/2 no B /4 3 1/4 3 1/2 6 3/4 no B /2 3 1/2 6 1/2 10 no B no C /2 8 1/2 13 1/2 22 no Average 10 1/2 5 1/2 7 1/4 12 3/4 - Table 2.10 Delaware Section 5 Base Classification Boring # Base Classification AB-3 Resembles ODOT #304 gradation limestone with clay contamination. AB-4 Resembles ODOT #304 gradation limestone with clay contamination. AC-32 Resembles ODOT #304 gradation limestone with clay contamination. AB-5 Resembles ODOT #304 gradation limestone with clay contamination. AC-33 Resembles ODOT #304 gradation limestone. AB-6 Resembles ODOT #304 gradation limestone. AC-34 Resembles ODOT #304 gradation limestone with clay contamination. B-16 Resembles ODOT #304 gradation limestone with clay contamination. B-17 Resembles ODOT #304 gradation limestone with clay contamination. B-18 Resembles ODOT #304 gradation limestone with clay contamination. B-20 Resembles ODOT #304 gradation limestone with clay contamination. C-12 Resembles ODOT #304 gradation limestone with clay contamination. 56
67 Figure 2.24: Delaware Section 5 - Particle Size Distribution of Recovered Aggregate 57
68 Figure 2.25: Delaware Section 5 Modified Proctor Test Results on Blended Mix 58
69 Figure 2.26: Delaware Section 5 Particle Size Distribution of Blended Mix 59
70 Control Sections: Mill and Overlay This FDR section (approximately 0.08 miles in length) was planned to be on Section Line Road beginning just north of Bunty Station Road and extending a short distance north to US42 as shown in Figure The planned rehabilitation work for this section was to mill and remove 5 inches of the existing asphalt and then place 5 inches of hot-mix asphalt without disturbing the pavement thickness below it Warren County Sections This section presents the results of the Full Depth Reclamation (FDR) and soil-cement mix designs for the planned rehabilitation of Long Spurling Road in Warren County, Ohio. It includes the results of the field and laboratory testing along with recommendations for the appropriate amount of admixture to be used during each of the rehabilitation processes (EDP Consultants, 2006a). The Warren County test section is on Long Spurling Road from S.R. 132 to the north driveway to the LM Animal Products Plant. This section of road measures approximately 0.37 miles in length with an existing width of 20 to 21 ft. The admixture for FDR work utilized was Fly Ash & Lime for a 0.28 mile section and a small (0.9 mile long) section of mill and overlay (control). The upper 4 inches of the existing asphalt was to be milled and removed. Once reclamation and/or stabilization was completed in each test section, the reclaimed materials were to be surfaced with 5 inches of hotmix asphalt. The planned rehabilitation work for this section is as follows: 1. Mill and remove 4 inches of the existing asphalt. 2. Pre-pulverize the remaining materials to a depth of 16 inches. 3. Reclaim the upper 16 inches of the pavement materials (including any subgrade) with lime and allow the lime treated material to mellow for a 24 hour period. Then add Class F Fly ash to create a stabilized base course (SBC). 4. Surface the SBC with 5 inches of hot-mix asphalt. The coring test locations were chosen to provide general coverage of the existing pavements within the project limits. To evaluate the composition of the existing pavement materials, the asphalt was cored at eleven test locations using a 10-inch diameter, diamond tipped core barrel turned by an electric coring machine. The underlying base material was sampled at each location using an electric impact hammer. The asphalt and base thicknesses were measured in the field, and the cores and base samples were collected for further laboratory evaluation. The subgrade at six of the eleven test locations was drilled and sampled to a depth of 6½ ft below the existing pavement surface in general accordance with ASTM Standards. A two-inch O.D. splitbarrel sampler was driven to obtain samples at selected intervals. The number of blows of a 140 lb hammer dropping 30 inches was recorded for each of three, six-inch penetration intervals at the sample locations. The boreholes were checked for the presence of groundwater after drilling, the 60
71 boreholes were backfilled with soil cuttings, and the pavement was restored with ready-mix concrete and cold-mix asphalt. A schematic of the boring location plan is shown in Figure The pavement and subsurface profile may be generalized as consisting of hot-mix asphalt followed by bankrun sand and gravel mixed with limestone, placed over a subgrade consisting of lean/fat clays. The asphalt thickness varied throughout the road, ranging from approximately 2 to 11¾ inches, with an average of about 8 inches (see Table 2.11). The granular base thickness also varied, ranging from zero to about 33½ inches, with an average of approximately 5¼ inches. The base consisted of brown bankrun sand and gravel mixed with limestone pieces, some being contaminated with clay. At test location B-4, the asphalt was placed directly onto the underlying subgrade. The total pavement section including the asphalt and the granular base ranged in thickness from about 11¼ to 36 inches with an average of about 13½ inches. Table 2.12 summarizes the classification of the existing base layer. The soils encountered throughout the project limits consisted of medium stiff to stiff brown and/or gray lean/fat clay. Groundwater was encountered within the aggregate base course at test location B-1, but was not present at the remaining borings during the relatively short duration of pre-construction field work. A strength-based mix design was carried out. Laboratory testing was conducted to complete the mix design as follows: Phase I Mix Preparation and Ratio Blending: The bitumen from the composite sample of the pulverized asphalt was extracted in general accordance with ASTM D2172. The recovered aggregate was tested for particle size distribution in general accordance with ASTM C136 as shown in Figure Based on pre-milling 4 inches of the existing asphalt and a 16-inch stabilization depth, a mix was developed to represent the average condition that would be encountered along the project route. The mix was developed based on the average thickness measurements encountered during the field sampling. After the 4 inch pre-mill, the 16 inch stabilization depth would result in treating a mix consisting of 31% asphalt, 27% aggregate base, and 42% subgrade. This mix was prepared to represent these proportions using volumetric ratio blending techniques. Phase II Standard Proctor and Gradation Testing: A standard Proctor test was completed on a representative sample of the blended mix in general accordance with ASTM D698B (see Figure 2.29). A sample of the blended mix was tested for particle size distribution in general accordance with ASTM C136 (see Figure 2.30). Phase III Strength Testing: Four samples of the blended mix were adjusted to approximately 2% over the optimum moisture content and treated with lime. Two of the samples were treated with lime at an application rate of 3% and the remaining two samples were treated at an application rate of 4%. After mixing the lime into the samples, the treated material was allowed to mellow for 24 hours. After the 24 hour mellowing period, the moisture was again adjusted to 61
72 approximately 3% over optimum. The samples were then treated with fly ash at application rates of 6% and 8%. Three soil-cement cylinders were prepared per application rate for a total of 12 specimens. The samples were cured in a laboratory oven for 6 days at 104 F prior to completing the 24 hour capillary soak. After completing the capillary soak the specimens were tested for compressive strength in general accordance with ASTM D1633. Based on the results of the compressive strength testing, it was recommended that the application rates of 4% lime and 6% fly ash be used for this project. The average compressive strength achieved at these application rates was 100 psi. Although the 150 psi anticipated strength was not achieved, the other combinations of lime and fly ash produced strengths lower than the recommended application rates. Based on the above mentioned testing, it was recommended that for the Warren test section the following mix design by used: - Pre-Mill Depth = 4 inches - Pre-Pulverization Depth = 16 inches - Reclamation Depth = 16 inches - Fly ash Application Rate Based on 130 pcf Material Density = 6% - Lime Application Rate Based on 130 pcf Material Density (with 24 hour mellow period) = 4% It should be noted that as described in Chapter 3 later, during the initial pulverization of the Warren County sections it became clear that the water table was very high. Hence the reclamation depth was reduced from the design recommendation of 16 inches to 12 inches. It was further recommended that the reclaimed mat should be allowed to cure for a minimum of 5 days. No construction or other traffic should be allowed on the mat during the cure period. Prior to placing the wearing course of asphalt over the reclaimed pavement, the reclaimed mat should be swept of loose material. Once the mat is cleaned, a tack coat should be applied over the reclaimed surface to help bond the new wearing course to the underlying reclaimed mat. This was recommended to help prevent water from ponding beneath the new asphalt, possibly resulting in damage from frost-related heave. 62
73 Figure 2.27: Warren Section - Boring Plan 63
74 Table 2.11 Warren Section - Existing Pavement Thickness Measurements Core # Pavement Thickness (inches) Pavement Thickness After 4" Mill Base Thickness (inches) Pavement Thickness (inches) Water Encountered in Base *B-1 2 1/2-1 1/2 33 1/2 32 yes B /2 8 1/2 no B-3 8 3/4 4 3/ /4 no B /4 7 3/ /4 no B /4 6 1/ /4 no B-6 8 3/4 4 3/ /4 no C-1 7 1/2 3 1/2 7 1/2 11 no C /2 10 1/2 no C no C no C-5 8 1/2 4 1/ /2 no Average /4 9 1/4 - * Location B-1 and C-4 were not included in the calculations for the average pavement calculations. Table 2.12 Warren Section Base Classification Core # Base Classification B-1 Resembles ODOT #304 gradation limestone with some #1 and #2 sized pieces. B-2 Brown bankrun sand and gravel with some limestone pieces. B-3 Brown bankrun sand and gravel with some limestone pieces. B-4 No Base Encountered B-5 Clay contaminated brown sandy bankrun gravel with limestone pieces. B-6 Brown bankrun sand and gravel with some limestone pieces. C-1 Brown bankrun sand and gravel with some limestone pieces. C-2 Clay contaminated sandy bankrun gravel with limestone and #1 and #2 sized pieces. C-3 Brown bankrun sand and gravel with some limestone pieces. C-4 Resembles ODOT #304 gradation limestone with some #1 and #2 sized pieces. C-5 Clay contaminated brown sandy bankrun gravel with limestone pieces. 64
75 Figure 2.28: Warren Section - Particle Size Distribution of Recovered Aggregate 65
76 Figure 2.29: Warren Section Standard Proctor Test Results on Blended Mix 66
77 Figure 2.30: Warren Section Particle Size Distribution of Blended Mix 67
78 2.3 Environmental Characteristics Chemical Composition of FDR Base The chemical composition, which was determined using the US EPA Method 3051a, of the FDR base for each of the test sections in Warren and Delaware counties is shown in Table 2.13 (Mackos, 2008). The compositions of fly ash and lime kiln dust are also shown, for comparison. The major constituents of the FDR base layers and raw materials were Al, Ca, Fe, K, Mg and S, which each had a concentration that exceeded 1.0 g/kg. The minor elements contained in each of the samples were Ba, Mn, Na, Si and Sr with concentrations that ranged from approximately 100 mg/kg to 1,000 mg/kg. Trace elements, such as As, Cd, Cr, Cu, Hg, Mo, Ni, Pb, Se and Zn, were present at concentrations below 100 mg/kg. Beryllium was not detectable in the samples that were tested. Table 2.13 shows the differences between the elemental composition of Class F fly ash and the sections of road (W-2, D-5 and D-6) that had fly ash added to the FDR base material. The road sections contained higher concentrations of Ca and Mn. The FDR base materials normally were composed of less As, Cr, Fe, Hg, Mo and S than the Class F fly ash. There was not a notable difference between the Class F fly ash and FDR base materials in regards to Al, Ba, Cd, Cu, K, Mg, Na, Ni, Pb, Si, Sr and Zn. Due to the low percentage of Class F fly ash that was added to the FDR base materials, there is no notable difference between the fly ash base materials and those sections containing no fly ash. However, the sections that included LKD in the FDR base material do show differences compared to the other test sections. Table 2.13 shows the Na concentrations in the LKD sections to be noticeably higher than each of the other sections. This is to be expected due to the high concentration of Na in the LKD. Calcium, on the other hand, has a high concentration in LKD, but the concentration in the FDR base material was smaller than the other test sections analyzed. 68
79 Table 2.13: Elemental Composition of FDR Base Material Element Warren County 4% Lime, 6% Fly Control Ash Cement & Emulsion LKD & Emulsion Delaware County Control 5% LKD, 5% Fly Ash 4% Lime, 6% Fly Ash Fly Ash LKD W-1 W-2 D-1 D-3 D-4 D-5 D-6 ~ g/kg ~ Al Ca Fe K Mg S ~ mg/kg ~ As Ba Be <0.091 <0.091 <0.091 <0.091 <0.091 <0.091 <0.091 <0.091 <0.091 Cd Cr Cu < Mn Mo Na Ni Pb Se 3.1 < < <2.3 Si Sr Zn ~ µg/kg ~ Hg
80 2.3.2 Laboratory Leaching Potential The leaching potential of 21 elements were determined for the FDR base materials from each of the test sections in this project (Mackos, 2008). Leachate concentrations were compared to Ohio EPA s non-toxic criteria and other regulatory standards. Each test section was evaluated by both the TCLP and SPLP tests. The results of these tests are shown in Tables 2.14 to Table 2.14 shows both the TCLP and SPLP results for the FDR base materials from the Warren County test site. Table 2.15 contains the results of the SPLP tests of the Delaware County test site, and Table 2.16 contains the results from the TCLP tests of the Delaware County test site. Each of the tables also include comparisons of the leaching results to the Ohio EPA s non-toxic criteria. These data demonstrate that none of the leachate concentrations exceeded the Ohio EPA s nontoxic criteria. In fact, leachate concentrations generally met US EPA maximum contaminant levels (MCLs) for drinking water. The leachate concentrations of the major elements such as Ca, Fe, Mg, S and Si were approximately one order of magnitude greater in the TCLP test than in the SPLP test. Meanwhile, the limited results obtained for Al show that the SPLP results were approximately one order of magnitude greater than the TCLP test. Due to a lack of data, a comparison between the two types of leaching tests could not be drawn for K. The final major constituent, Na, did not show a noticeable difference in leaching potential between the two types of leaching procedures. At both the Warren County test section (W-2) and Delaware County test sections (D-5 and D-6), the results from the SPLP and TCLP tests in Table 2.14 to 2.16 can also be compared to the resulting data for the leaching extraction of the fly ash that was used. Both the SPLP and TCLP show that the concentration of S and Se available for leaching in the fly ash is much higher than it is within the FDR base material. Both TCLP and SPLP show results where Cd, Cu, Fe, Hg, Mn, Mo and Na each are approximately equivalent between the fly ash test sections and the fly ash. It is also possible to compare the differences between the SPLP and TCLP tests in regards to fly ash. The Ca and Cr concentrations in the leachate from both the TCLP and SPLP test is approximately equal across the two tests. Finally, there is a very large difference in leachate concentrations of Mg for SPLP and TCLP. In general, the minor and trace elements from each test section showed a propensity to be higher in the TCLP test compared to the SPLP test. For example, As, Cr and Mn were generally only detectable in the TCLP test, while normally the concentrations were below detection limits for the SPLP test. The slightly higher concentrations in the leachate of the TCLP tests, compared to the SPLP tests, was likely because the TCLP tests had a lower final ph, which could enhance the dissolution of some mineral solids (Stumm, 1992). 70
81 Figures 2.31 and 2.32 show the initial and final ph s for the SPLP test and TCLP test, respectively. The final ph in the SPLP test was consistently higher than the TCLP test in terms of final ph. Figure 2.31, which shows the initial and final ph s in the SPLP tests, shows that the final ph s are generally consistent in regards to the samples that include the fly ash or the control. These samples had a final ph of approximately 12. The samples that included emulsion and cement (D-1) or emulsion and LKD (D-3), however, had lower ph s of approximately 11 and 10, respectively. The most likely reason for this is that the leachate for each of these sections had much lower concentrations of Ca, potentially associated with alkalinity, than each of the other sections. Furthermore, D-3 had ph 10 and D-1 had ph 11 because section D-3 had a Ca concentration that was nearly one order of magnitude lower than that of section D-1. Figure 2.32, shows that the Warren County fly ash test section and Delaware County control section had significantly higher ph s than the remainder of the test sections in the TCLP tests. Figure 2.32 also shows the leachate solutions generally had a ph of approximately 7 with the exception of the two previously mentioned sections, which each had a ph in excess of 9. Based on the results from the SPLP tests, it is expected that each of the Delaware County sites should have higher ph due to significantly higher concentrations of Ca. Each of the Delaware sites would be expected to have a similar ph because the Ca concentrations of the leachate for each FDR base were similar. Warren County, due to the leachate concentrations of Ca, is expected to have a lower ph than the Delaware County sites, but the fly ash section, W-2, would be expected to have the higher ph of the two. In the case of Warren County, the ph results given in Figure 2.32 are as to be expected in relation to each other. The presence of organic ligands such as acetate in the TCLP test may also enhance dissolution. In general, the organic species increase extraction in the order of acetate < oxalate < citrate (Mohapatra et al, 2005). Organic ligands may increase extraction by forming a (multi-) dentate, mono-nuclear, inner sphere complex on a mineral s surface that can lower the activation energy for complexed metal ions to detach from the surface of the mineral (Furrer and Stumm, 1986). This mechanism has been supported by a number of studies (Lackovic et al., 2003; Hidber et al., 1996). The effect of these organic ligands is ph dependent. Another mechanism involves the formation solution metal-ligand complexes which decrease the free metal concentration which enhances dissolution (Cheng et al., 2008). It has been shown that, in regards to Cu leaching, the presence of organic ligands in synthetic rainwater can increase the recovery of Cu in a leachate solution from 31% (without organic ligands) to 40% (with organic ligands) (Hur et al., 2004). Since it has been shown in previous studies that organic ligands, such as acetate, could indeed increase the potential for leaching, it follows suit that the leachate produced by the TCLP test would have slightly higher elemental concentrations than that of the SPLP test due to the acetic acid present in TCLP test. 71
82 Table 2.14: Leaching potential of FDR base materials from Warren County test sites Element Control Warren County SPLP 4% L, 6% FA Fly Ash Control TCLP 4% L, 6% FA W-1 W-2 W-1 W-2 Fly Ash ph initial Ohio Non- Toxic Criteria ph final Al As <0.001 < ± < Ba 0.272± ± ± ± ± ± Ca 178.5± ±24 430±4 548±25 711±24 436±10 Cd <0.010 <0.010 <0.010 <0.010 <0.010 < Cr <0.010 < ± ±0.001 < ± Cu <0.010 <0.010 <0.010 <0.010 <0.010 <0.010 Fe < ±0.001 < ± ± ±0.011 Hg <0.001 <0.001 <0.001 <0.001 <0.001 < K Mg ± ± ± ±14 Mn <0.010 <0.010 < ±0.564 <0.010 <0.010 Mo <0.010 <0.010 <0.010 <0.010 <0.010 <0.010 Na 7.9± ± ± ± ± ±0.5 Ni 0.013±0.001 < ± ± ± ±0.003 Pb 0.028± ±0.014 < ± ± ± S 1.2± ± ± ± ±5 Se <0.001 < ± ± Si 0.441± ± ± ± ± ±0.005 Sr 0.024± ± ± ± ± ±0.001 Zn 0.013± ±0.003 <0.010 <0.010 <0.010 <0.010 Units: µg/ml 72
83 Table 2.15: Synthetic precipitation leaching procedure results from Delaware County test sites Element Cem. & Emul. LKD & Emul. Delaware County Control SPLP 5% LKD, 5% FA 4% L, 6% FA D-1 D-3 D-4 D-5 D-6 Fly Ash ph initial Ohio Non- Toxic Criteria ph final Al As <0.001 <0.001 <0.001 < ±0.001 < Ba 0.028±0.001 < ± ± ± ± Ca 61.0± ± ±4 169±7 171±3 430±4 Cd <0.010 <0.010 <0.010 <0.010 <0.010 < Cr 0.010±0.002 <0.010 < ±0.002 < ± Cu < ± ± ± ±0.004 <0.010 Fe <0.010 <0.010 <0.010 <0.010 <0.010 <0.010 Hg <0.001 <0.001 <0.001 <0.001 <0.001 < K Mg 0.082± ± ± ±0.035 < ±0.083 Mn <0.010 <0.010 <0.010 <0.010 <0.010 <0.010 Mo <0.010 < ± ± ±0.001 <0.010 Na ± ± ±0.2 5± ±0.1 Ni <0.010 <0.010 < ±0.002 < ±0.006 Pb < S 9.7± ± ± ± ±4 Se < < < ± Si ± ± ±0.1 Sr 0.189±0.001 < ± ± ± ±0.002 Zn <0.010 < ±0.002 < ±0.001 <0.010 Units: µg/ml 73
84 Table 2.16: Toxicity characteristic leaching procedure results from Delaware County test sites Element Cem. & Emul. LKD & Emul. Delaware County Control TCLP 5% LKD, 5% FA 4% L, 6% FA D-1 D-3 D-4 D-5 D-6 Fly Ash ph initial Ohio Non- Toxic Criteria ph final Al As 0.003±0.001 < < < Ba 0.239± ± ± ± ± ± Ca 1200±5 1170±3 1190±4 1220±6 1170±8 436±10 Cd < ±0.009 <0.010 <0.010 <0.010 < Cr < ± ± ±0.015 < ± Cu 0.126± ± ± ± ±0.019 <0.010 Fe ±0.011 Hg <0.001 <0.001 <0.001 <0.001 <0.001 < K Mg 20.4± ± ± ± ± ±14 Mn 0.777±0.005 <0.010 < ± <0.010 Mo 0.014±0.001 < ± ± ±0.001 <0.010 Na 11.4± ± ± ± ± ±0.5 Ni 0.045± ± ± ± ± ±0.003 Pb ± S 29.9± ± ± ± ± ±5 Se ± Si 22.8± ± ± ± ± ±0.005 Sr ±0.001 Zn 0.016±0.001 <0.010 <0.010 <0.010 <0.010 <0.010 Units: µg/ml 74

85 Figure 2.31 SPLP Initial and Final ph 75

86 Figure 2.32 TCLP Initial and Final ph 76
87 2.4 Summary In this chapter the laboratory testing and mix designs for Delaware and Warren County road sections were presented. Engineering and environmental (chemical composition and leachate potential) properties were investigated in developing mixes in the laboratory that could be implemented at the two full-scale demonstration sites in collaboration with the respective County Engineer s offices. Class F fly ash from Zimmer Power Plant was studied as the CCP admixture for use in FDR construction of asphalt pavements. For the Delaware county site, mix designs were carried out for the planned rehabilitation of several test sections located along Section Line Road in Delaware County, Ohio. The admixtures for FDR work utilized were cement & emulsion, cement, LKD & emulsion, fly ash & LKD, fly ash & lime and a section of mill and overlay. The Warren county mix design was carried out for a fly ash & lime section with a control (mill and overlay) section for the planned rehabilitation of Long Spurling Road in Warren County, Ohio. Laboratory tests for measuring the engineering properties of the FDR mixes were carried out to develop a strength-based mix design to ensure structural stability of the pavement sections. This resulted in recommendations for the appropriate amount of admixtures to be used during each of the rehabilitation processes as well as construction recommendations. Laboratory chemical composition and leaching tests on the FDR mixes under consideration for Delaware and Warren county pavement materials indicated that none of the leachate concentrations exceeded regulations. Both the SPLP and TCLP tests revealed that the leachate concentrations of As, Ba, Cd, Cr, Hg, Pb and Se were well below the standards set by the Ohio EPA s non-toxic criteria. The concentrations reported from the TCLP test were also well below the concentrations the US EPA has set for characterization of a hazardous material. It was noticed that the TCLP concentrations were generally slightly higher than the concentrations reported by the SPLP test, and the presence of acetate in the TCLP test offers a possible explanation for this trend. Furthermore, it was determined that after comparing the leachate concentration from both TCLP and SPLP to the environmental monitoring samples that one method was not clearly a better regulatory tool than the other. 77
88 CHAPTER 3 CONSTRUCTION OF FULL-SCALE PAVEMENT SECTIONS 3.1 Introduction This chapter includes the construction of the full-scale pavement sections in Delaware and Warren Counties. The construction work was carried out by Base Construction / Strawser Paving with site QA/QC services provided by EDP Consultants under the respective supervision of the Warren County and Delaware County Engineer s Office. Class F fly ash from Zimmer Power Plant was utilized in the construction of the Warren and Delaware county pavement sections. The major equipment used for the full depth reclamation (FDR) of the pavement sections was as follows: - Self-propelled reclaimer (Wirtgen WR 2500 machine). See Figures 3.4, 3.5, 3.6, and Motor grader (Figure 3.12) - Compactor (HAMM 2242 padfoot roller and HAMM 2420 smooth-drum vibratory compactor). See Figures 3.9, 3.18, 3.19, and Calibrated bulk spreader (Figures 3.3, 3.7) - Water truck with spray bar (Figure 3.8) The total amount of distance to be completed in one day (a segment) was decided to be approximately one-quarter of a mile. The first pulverization pass of the reclaimer was along the outer edge of the roadway. The next pulverization pass was back to the starting point of the segment along the opposite outer edge. Subsequent pulverization passes were inside the previous passes until the complete road width was pulverized once. Then using the same procedure for passes, the chemical stabilizers (fly ash, lime, lime kiln dust, etc.) were spread out and water added if need be. The final mixing pass again occurred in the same manner so as to produce a uniform pulverized mixture of existing pavement materials, chemical admixtures, and water. Following this, a motor grader would shape the reclaimed material in the segment. Initial compaction was then carried out by using a padfoot roller for the segment. Final compaction then followed with a smooth-drum vibratory compactor for the segment. After initial curing, a fog seal was applied to the constructed base course and cured for at least 5 days. After the curing period, the asphalt wearing surface was placed on top of the constructed base course. The road was then opened to through traffic a few days after the final asphalt layer was placed. It is important to note that the FDR process pulverizes and compacts the existing pavement materials in-situ into one stabilized layer. Therefore it is important that the depth of the pulverization remain constant, mixing of chemical admixtures through the thickness be uniform, and adequate compactive effort be applied so that it is effective even at the bottom of the single 8 to 12 thick layer. In addition, the following guidelines were followed in the construction process: 78
89 Pulverization A minimum of 4 overlap between adjacent pulverization passes. Reclaimers are not crushers and will not reduce the particle size to less than the original aggregate size. Lower cutting drum rotation speed with larger torque is needed for thicker first pass FDR pulverization. Depth of the pulverization pass should be 1 to 2 less than the final mixing pass Mixing and Placement Higher cutting drum rotation speed with lesser torque is needed for the mixing process. Light compaction and reshaping should be carried out when chemical stabilizers are being added. If mixed material moisture content is acceptable, the mixed material can be compacted immediately. For excessive moisture, the mix will need to be aerated and then recompacted. For dry mixes, additional water will need to be added and another pass of the reclaimer applied for mixing before compaction. Target moisture content should be slightly below optimum moisture content and under 75% degree of saturation. Addition of Chemical Admixtures The addition and uniform mixing of appropriate amounts of chemical admixtures is one of the most important factors affecting the performance of an FDR pavement. Spreading of admixtures must be done uniformly. Fly ash may need to be moistened for a short period of time before spreading to control dust. Compaction Compaction is the second most important factor affecting FDR pavement performance. Do not over compact, especially when using a vibratory compactor. Compaction must be uniform across the project site. A degree of compaction of at least 90% to 95% is recommended and must be monitored regularly at the site using a nuclear gauge for total density and laboratory testing for moisture content. Curing Allow the new base course to cure 5-7 days before laying the asphalt wearing surface on it. If a core can be extracted from the reclaimed base course, then it is ready to be covered by the wearing surface. Keep heavy truck traffic off an FDR road for a few days after the asphalt wearing surface is placed to allow for the stabilized base course to gain adequate strength and stiffness. Wearing Surface The wearing surface must bond well with the reclaimed base course. A tack course of asphalt emulsion may be needed to assist with bonding. 79
90 3.2 Warren County Road Sections Warren County, near Cincinnati, Ohio, is the second fastest growing county in the state. The Long Spurling Road located in the northeastern part of the county was chosen by the Warren County Engineer's Office for FDR construction. The failing pavement was 0.37 miles in length, 20 to 21 feet in width with minimal shoulders with a 2-inch asphalt layer on top of 4 to 6 inches of chipsealed pavement (see Figure 3.1). Two sections were constructed: 4-percent lime with 6-percent fly ash, 12-inch stabilization depth (0.28 mile) 5-inch mill and fill (0.09 mile) The rehabilitation of Long Spurling Road was completed in five phases in summer of 2006 (EDP Consultants, 2006c). Initially Strawser Paving milled and removed four inches of the existing pavement from the road (Figure 3.2). During the second phase, Base Construction pre-pulverized the remaining pavement materials to a depth of 12 inches. The third phase consisted of treating the pulverized pavement materials with lime (see Figure 3.3 for placement of lime and Figure for mixing of lime with pavement materials) at an application rate of 4% and allowing the material to mellow for a 24 hour period. Once the planned mellowing time had elapsed, fly ash was added to the blended mix at an application rate of 6% to a depth of 12 inches (Figure ) and compacted (Figure 3.9). The final phase of the rehabilitation consisted of resurfacing the road with hot mix asphalt (Figure 3.13). EDP Consultants Inc. was contracted to be on-site for QA/QC control. The four inch mill and removal along the road began on July 30, 2006 and was completed from S.R. 132 to 1,960 ft west. The following day the pavement materials were reportedly pulverized from 20 ft west of S.R. 132 to 1,460 ft west. The remaining 500 ft of milled asphalt was left in place to be used as a control section after being surfaced with hot mix asphalt. On August 1st the materials were reportedly treated with lime from 20 ft west of S.R. 132 to approximately 1,460 ft west. The addition of fly ash began on August 2nd and was completed the same day. Base Construction completed the fly ash stabilization process from 20 ft west of S.R. 132 to approximately 1,460 ft west, to the east entrance of the L&M Animal Farm Plant. In the early morning of August 2, water was encountered at the planned 16 inch treatment depth during pre-pulverization and hence the pre-pulverization depth was decreased to a depth of 12 inches. After a review of the mix design and discussions with the design team, it was decided that the remainder of the stabilization process would be completed at a cut depth of 12 inches rather than the planned 16 inches. Prior to the fly ash treatment, samples of the lime-treated material were obtained from various locations to a depth of 12 inches and tested for moisture content. The test results indicated that the moisture content of the material varied from 2.4% to 5%. The testing indicated that additional water would be needed during the reclamation process in order to achieve proper density. 80
91 The process of spreading fly ash at an application rate of approximately 6% was carried out using a calibrated spreader truck. Based on a material density of pcf and a treatment depth of 12 inches, approximately 70 lbs/yd 2 of product was placed. In order to achieve this application rate, two passes with the spreader truck were required. The amount of fly ash being applied was measured by the contractor using a one square yard canvas and scale. After the fly ash was spread, a water truck was connected to the Wirtgen (Figure 3.8), and used to moisture-condition the material to 1 to 2% above its optimum moisture content. The treated material was compacted using a Hamm vibratory padfoot roller immediately after blending. After initial compaction, a motor grader was used to establish profile and final compaction was accomplished using a Hypac vibratory smooth-drum roller. Varying applications of water were placed on the treated material during compaction, as needed to maintain adequate moisture in the material. During the stabilization process, representative samples of the treated material were obtained and field one-point standard Proctor tests were completed. In combination with this work, twelve soil-lime-fly ash cylinders were prepared using standard Proctor methods. After final compaction of the treated material, representative moisture-density tests were completed on the mat using a Troxler 3440 nuclear densometer. Compaction testing was based on the results of the field one-point standard Proctor test results. The compaction testing indicated that the treated material was compacted to at least 95% of the values obtained during the field one-point standard Proctor testing. After the addition of lime and fly ash, an area of instability was observed extending from approximately 1,380 ft west of S.R. 132 to 1,460 ft west, across the full width of the road (Figure ). It was determined that the instability was due to high moisture content of the base material. Base Construction scarified the south edge of the road using a grader in order to allow the material to dry. After further evaluation of the scarified area, it became evident that the instability was due to #1 and #2 sized pieces of limestone that extended to an unknown depth which were holding water. Once the materials excavated from this area were allowed to dry (Figure 3.12), Base Construction placed the dried material into the excavation and recompacted the area with a smooth drum roller. In addition to this area, several other areas of instability were encountered along the road throughout the day. It was determined that similar conditions to that previously described existed in each of the areas of instability. Since treatment, grading, and compaction was completed, it was decided that no additional traffic would be allowed to travel on each area until a proof-roll was completed in 7 days. The specimens that were prepared during the field work were tested for strength. Three of the specimens from each of two locations were cured in a similar manner as that done during the completion of the mix design i.e. 6 day cure in an oven at 104º F and a 24 hour capillary soak. The remaining six specimens were allowed to cure for 7 days at ambient temperature. After curing, they were tested for compressive strength in general accordance with ASTM D1633. The average strengths for the prepared cylinders are shown in Table
92 Table 3.1 Strength of Warren County Field Samples Location Cure Method Strength (psi) 235 ft east of S.R day ambient ft east of S.R day oven w/ cap. soak 80 1,150 ft east of S.R day ambient 147 1,150 ft east of S.R day oven w/ cap. soak 110 Figure 3.1 Warren County Pre Reclamation Pavement Condition 82
93 Figure 3.2 Warren County Milling of Asphalt Layer Figure 3.3 Warren County Spreading of Lime 83

94 Figure 3.4 Warren County Pre-pulverization with lime Figure 3.5 Warren County FDR pulverization machine 84

95 Figure 3.6 Warren County Close up of pulverization Teeth Figure 3.7 Warren County - Spreading of Fly Ash 85

96 Figure 3.8 Warren County - FDR Machine Connected to Water Truck Figure 3.9 Warren County - Compaction with Padfoot Roller after Final Mixing 86


97 Figure 3.10 Warren County - Area of instability after lime has been added Figure 3.11 Warren County - Area of instability after fly ash has been added 87

98 Figure 3.12 Warren County - Drying out area of instability with the grader Figure 3.13 Warren County Placement of Hot Mix Asphalt Wearing Surface 88
99 3.3 Delaware County Road Sections Delaware County (located 20 miles north of Columbus, Ohio, USA) is the fastest growing county in Ohio. In collaboration with the Delaware County Engineer's Office, a four mile long segment of Section Line Road was selected for FDR reconstruction in 2006 (see Figure 3.14). Roadway width was 20 feet with minimal shoulders. The asphalt surface thickness ranged from 5.25 to 14 inches (average of inches). The original pavement was underlain by a base course ranging from 1 to 11 inches (average of 5.18 inches) thick. Six types of sections were constructed using the following mixes: Cement & Emulsion: 2-percent cement with 1.6 gallons per square yard emulsion, 8-inch stabilization depth (0.42 mile) Cement Only: 5-percent cement, 12-inch stabilization depth (0.80 mile) LKD & Emulsion: 3-percent lime kiln dust with 1.4 gallons per square yard emulsion, 8- inch stabilization depth (0.79 mile) Fly Ash & LKD: 5-percent lime kiln dust with 5-percent fly ash, 8-inch stabilization depth (0.62 mile) Fly Ash & Lime: 4-percent lime with 6-percent fly ash, 8-inch stabilization depth (0.62 mile) Controls: 5-inch mill and overlay (two 0.09-mile sections at the north and south ends of the project, and a 0.14 mile as well as 0.52 mile section near the middle of the project). The FDR rehabilitation of Section Line Road began in August, 2006 and was completed by October 5, 2006 (EDP Consultants, 2006d). The rehabilitation of Section Line Road was completed in five phases. Initially, Strawser Paving milled and removed five inches of existing asphalt from the road. Once the five inches of asphalt was removed Base Construction prepulverized the remaining pavement materials to specified depths. The third phase consisted of blending (see Figure ) the pre-pulverized pavement materials with the admixtures selected by the design team during the mix design phase of this project, and compacting the mat (Figure ). The final phase of the rehabilitation consisted of resurfacing the road with hot mix asphalt (Figure ). EDP Consultants was contracted to be on-site during the mixing of the chemical admixtures and provided on-site QA/QC control. Prior to the reclamation work in each section, Base Construction Company pre-pulverized the existing asphalt and base materials along the road. Sections 1, 3, 4, and 5 were pre-pulverized to a depth of 8 inches and Section 2 was pre-pulverized to a depth of 12 inches. Following prepulverization in each section, the material was graded using a grader and compacted using a Hamm vibratory padfoot roller Section 1: Cement & Emulsion A control section was added to the project at the request of the Delaware County Engineer s office. The control section began at Home Road and extended approximately 461 ft north along Section Line Road. For the control section the work consisted of mill and overlay. Base Construction began the reclamation process utilizing Portland cement and emulsion for Section 1 89
100 at approximately 461 ft north of Home Road and worked northward to 2,667 ft north of Home Road. Before treatment began, samples of the pre-pulverized material within Section 1 were obtained at various locations to a depth of 8 inches, and field moisture content testing was completed. The test results indicated that the moisture content of the material ranged from approximately 4.5% to 5%. The reclamation process began by spreading Portland cement onto the surface of the prepulverized material using a calibrated spreader truck at an application rate of 2%. Based on an average material density of pcf, determined by the mix design, and a treated depth of 8 inches, approximately 16 lbs/yd² of Portland cement was placed. The weight of cement being spread was measured with a one square yard canvas and scale, and adjustments to achieve the correct application rate were made as necessary. A tanker filled with emulsion was connected to a Wirtgen 2500 reclaimer/stabilizer. The pre-pulverized material was treated with emulsion at an application rate of 1.6 gals/yd 2, as predetermined by the mix design. Based on the water content results, a water truck was used to moisture condition the treated material to near or above its optimum moisture content, as indicated by the treated standard Proctor test. During the reclamation process, a representative sample of the treated material was obtained and used to prepare nine 4 diameter Marshall briquettes. Density of the briquettes was varied by applying differing compactive energy using a Marshall hammer. Three of the briquettes were compacted using 50 blows per side of the briquettes, three at 75 blows per side, and three at 112 blows per side. The briquettes were measured for height, weight and diameter to determine the material s wet density. The average wet density of the briquettes prepared using 75 blows per side, i.e. the material s heavy-duty Marshall density, measured pcf. The varying compactive effort was done so that the density of some of the plugs would be below the measured density of the treated material in the field, as well as near and above the densities being achieved. In this manner, the briquettes could be tested for strength in the same manner as that done during the completion of the mix design and trend lines could be developed to estimate the actual strength of the reclaimed pavement in the field. An average of 218 kpa of dry indirect tensile strength, 192 kpa of soaked indirect tensile strength, and 1,556 lbs of stability was achieved (see Table 3.3 and Figure 3.24). During the sampling, the material was excavated by hand to a depth of 8 inches and the specified treatment depth was verified using a distilled water and phenolphthalein solution. As the process continued, the treated material was observed to have higher proportions of clay incorporated into the mix at 2,130 ft to 2,620 ft north of Home Road. A representative sample of the material containing the higher clay content was obtained and a second set of three Marshall briquettes were prepared at 75 blows per side. The average wet density of the second set of briquettes measured pcf. The treated material was compacted using a Hamm vibratory padfoot roller after blending. Once this initial compaction was completed, a grader was used to establish profile in the treated 90
101 sections. Final compaction was completed using a Hypac vibratory smooth-drum roller. Varying applications of water were placed onto the treated material s surface during grading and after the compaction process, as needed to maintain moisture within the treated material. Once final compaction of the treated material was completed, representative moisture density tests were completed on the mat using a Troxler 3411 nuclear densometer (see Table 3.2). Compaction was based on the material s heavy-duty Marshall density values of pcf and pcf. The compaction testing indicated that the treated material had been compacted to at least 98% of its respective heavy-duty Marshall density. When treatment in this section utilizing Portland cement and emulsion was completed, Base Construction began Section 2, consisting of chemical stabilization using Portland cement only Section 2: Cement The planned 2,620 ft of stabilization to be completed in Section 2 was extended to a length of approximately 4,230 feet by the Delaware County Engineer s Office based on the traffic patterns along the road. Stabilization for Section 2 utilizing cement only was completed from 2,667 ft to 6,897 ft north of Home Road. Before treatment began, samples of the pre-pulverized material were obtained at various locations within Section 2 to a depth of 12 inches, and field moisture content testing was completed. The test results indicated that the moisture content of the material ranged from approximately 5% to 6%. The stabilization process began by spreading Portland cement at an application rate of 5% using a calibrated spreader truck. Based on a material density of pcf and a treatment depth of 12 inches, approximately 57 lbs/yd 2 of cement was placed. The contractor used a one square yard canvas and scale to verify the amount of cement being applied. After the Portland cement was spread, a water truck was connected to the Wirtgen and used to blend and moisture-condition the material to 1% to 2% above its optimum moisture content. The treated material was compacted using a Hamm vibratory padfoot roller immediately after blending. After initial compaction, a motor grader was used to establish profile and final compaction was accomplished using a Hypac vibratory smooth-drum roller. Varying applications of water were placed onto the treated material during compaction, as needed to maintain adequate moisture in the material. During the stabilization process, representative samples of the treated material were obtained and field one-point standard Proctor tests were completed. In combination with this work, nine soilcement cylinders were prepared using standard Proctor methods. The specimens prepared during the field work were strength tested. Three of the nine specimens were cured in a similar manner as done during the completion of the mix design i.e. 6 day cure in a laboratory oven at 104ºF and a 24 hour capillary soak. Three specimens were allowed to cure for 7 days at ambient laboratory temperature and the remaining three specimens were allowed to cure in a laboratory oven at 91
102 104ºF for 7 days to simulate a 28 day cure period. After curing, they were tested for compressive strength in general accordance with ASTM D1633. The average strength for the prepared cylinders for 7 day ambient cure was 803 psi, the simulated 28 day cure was 830 psi, and the 6 day oven with capillary soak was 687 psi. During the sampling, the material was excavated by hand to a depth of 12 inches and the specified treatment depth was verified using a distilled water and phenolphthalein solution. After final compaction of the treated material, representative moisture-density tests were completed on the mat using a Troxler 3411 nuclear densometer (Table 3.4). Compaction testing was based on the results of the field one-point standard Proctor test results. The compaction testing indicated that the treated material was compacted to at least 98% of the values obtained during the field one-point standard Proctor testing Section 3: Emulsion & Lime Kiln Dust A second control section was added to the project from 6,897 ft to 7,629 ft north of Home Road along Section Line Road. Base Construction began the reclamation process utilizing Lime Kiln Dust (LKD) and emulsion at approximately 7,629 ft north of Home Road and continued to approximately to Clark Shaw Road, i.e. 11,813 ft north of Home Road. Before treatment began, samples of the pre-pulverized material were obtained at various locations within Section 3 to a depth of 8 inches, and field moisture content testing was completed. The test results indicated that the moisture content of the material ranged from approximately 5.4% to 6%. The reclamation process began by spreading LKD onto the surface of the pre-pulverized material using a calibrated spreader truck at an application rate of 3%. Based on an average material density of pcf, as determined by the mix design, and a treated depth of 8 inches, approximately 23 lbs/yd² of LKD was placed. The weight of product being spread was measured with a one square yard canvas and adjustments were made to obtain the required application rate. A tanker filled with emulsion was then connected to a Wirtgen 2500 reclaimer/stabilizer. The pre-pulverized material was treated with emulsion at an application rate of 1.4 gals/yd 2 as predetermined by the mix design. Based on the water content results, a water truck was used to moisture condition the treated material to near or above its optimum moisture content, as indicated by the standard Proctor test. During the reclamation process, a representative sample of the treated material was obtained and used to prepare nine 4 diameter Marshall briquettes. Density of the briquettes was varied by applying differing compactive energy using a Marshall hammer. Three of the briquettes were compacted using 50 blows per side of the briquettes, three at 75 blows per side, and three at 112 blows per side. The briquettes were measured for height, weight and diameter to determine the material s wet density. The average wet density of the briquettes prepared using 75 blows per side, i.e. the material s heavy-duty Marshall density, measured pcf. The varying compactive effort was done so that the density of some of the plugs would be below the 92
103 measured density of the treated material in the field, as well as near and above the densities being achieved. In this manner, the briquettes could be tested for strength in the same manner as that done during the completion of the mix design and trend lines could be developed to estimate the actual strength of the reclaimed pavement in the field. An average of 176 kpa of dry indirect tensile strength, 165 kpa of soaked indirect tensile strength, and 590 lbs of stability was achieved (see Table 3.6 and Figure 3.25). During the sampling, the material was excavated by hand to a depth of 8 inches and the 8 inch specified treatment depth was verified using a distilled water and phenolphthalein solution. The treated material was compacted using a Hamm vibratory padfoot roller after blending. Once this initial compaction was completed, a grader was used to establish profile in the treated sections. Final compaction was completed using a Hypac vibratory smooth-drum roller. Because of the rainy weather, no water was applied to the surface of the road during the grading or compaction process. Once final compaction of the treated material was completed, representative moisture density tests were completed on the mat using a Troxler 3440 nuclear densometer (see Table 3.5). Compaction was based on the material s heavy-duty Marshall density of pcf. The compaction testing indicated that the treated material had been compacted to at least 98% of this value. Once compaction tests were completed, Base Construction placed a light dusting of LKD over the surface of the road to aid in absorbing excess surface water that was accumulating from the rain at the site at that time Section 4: Fly Ash & Lime Kiln Dust A third control section, consisting of a 5 inch mill and overlay, was completed from Clark Shaw Road to approximately 2,744 feet north. Treatment utilizing 5% fly ash and 5% lime kiln dust (LKD) began at the north side of Bean Oller Road, and extended approximately 3,297 feet north. Base Construction blended the Class F fly ash into the pre-pulverized material. The fly ash was placed using at a calibrated spreader truck at a rate of 5%. Based on a treatment depth of 8 inches and an average material weight of pcf, approximately 40 lbs/yd 2 of fly ash was placed. Samples of the fly ash treated material were obtained at various locations throughout Section 4 to a depth of 8 inches, and field moisture content testing was completed. The test results indicated that the moisture content of the material ranged from approximately 6.7% to 9.8%. The reclamation process continued by spreading LKD at an application rate of 5% using a calibrated spreader truck. Based on a material density of pcf and a treatment depth of 8 inches, approximately 40 lbs/yd 2 of LKD was placed. The amount of admixture being applied was measured by the contractor using a one square yard canvas and scale. After the LKD was spread, a water truck was connected to the Wirtgen, and used to blend and moisture condition the pre-pulverized material to approximately 1% to 2% above its optimum moisture content. During the process, a representative sample of the treated material was obtained and used to prepare nine 4 diameter Marshall briquettes. Density of the briquettes was varied by applying differing compactive energy using a Marshall hammer. Three of the briquettes were compacted using 50 blows per side of the briquettes, three at 75 blows per side, and three at 112 blows per side. The 93
104 briquettes were measured for height, weight and diameter to determine the material s wet density. The average wet density of the briquettes prepared using 75 blows per side, i.e. the material s heavy-duty Marshall density, measured pcf. The varying compactive effort was done so that the density of some of the plugs would be below the measured density of the treated material in the field, as well as near and above the densities being achieved. In this manner, the briquettes could be tested for strength in the same manner as that done during the completion of the mix design and trend lines could be developed to estimate the actual strength of the reclaimed pavement in the field. An average of 130 kpa of dry indirect tensile strength, 85 kpa of soaked indirect tensile strength, and 1,212 lbs of stability was achieved (see Table 3.8 and Figure 3.26). During the sampling, the material was excavated by hand to a depth of 8 inches and the 8 inch specified treatment depth was verified using a distilled water and phenolphthalein solution. The treated material was compacted using a Hamm vibratory padfoot roller immediately after blending. After initial compaction, a motor grader was used to establish profile and final compaction was accomplished using a vibratory double smooth-drum roller. Because of rain in the forecast and the current in-place moisture contents, it was judged that only one application of water over the surface of the treated material would be needed. Once final compaction of the treated material was completed, representative moisture density tests were completed on the mat using a Troxler 3440 nuclear densometer (see Table 3.7). Compaction was based on the material s heavy-duty Marshall density of pcf. Approximately 68% of the compaction test locations achieved at least 95% of the heavy duty Marshall value of pcf Section 5: Fly Ash & Lime Treatment utilizing 6% fly ash and 4% lime began at 3,297 ft north of Bean Oller Road, and extended approximately 3,297 feet north towards Bunty Station Road. Section 5 ended at the south side of Bunty Station Road, approximately 6,595 ft north of Bean Oller Road. Base Construction blended lime into the pre-pulverized material on the first day. The lime was placed using at a calibrated spreader truck at a rate of 4%. Based on a treatment depth of 8 inches and an average material weight of pcf, it was reported that approximately 31 lbs/yd 2 of lime was placed. Samples of the lime treated material were obtained at various locations throughout Section 5 to a depth of 8 inches and field moisture content testing was completed. The test results indicated that the moisture content of the material ranged from approximately 4.4% to 6.6%. The next day, fly ash was spread over the surface of the lime-treated material using a calibrated spreader truck, at an application rate of 6%. Based on a material density of pcf and a treatment depth of 8 inches, approximately 47 lbs/yd 2 of fly ash was placed. The amount of admixture being applied was measured by the contractor using a one square yard canvas and scale. After the fly ash was spread, a water truck was connected to the Wirtgen, and used to blend and moisture-condition the prepulverized material. Constructing a reclaimed mat using 94
105 high percentages of admixtures, as in Section 4 and 5, typically requires the moisture content of the material to be approximately 2% over its optimum moisture content. However, during the completion of Section 4 it was found that higher moisture contents resulted in pumping and cracking of the reclaimed mat during compaction. Therefore the amount of additional water was decreased in Section 5 for constructability reasons. It was agreed that during the following three days, Base Construction would continue to water the surface of the treated mat to maintain needed moisture. During the process, a representative sample of the treated material was obtained and used to prepare nine 4 diameter Marshall briquettes in the same manner as prepared on the previous days of work. In this manner, the briquettes could be tested for strength in the same manner as that done during the mix design and trend lines could be developed to estimate the strength of the reclaimed pavement in the field. The average wet density of the briquettes prepared using 75 blows per side, i.e. the material s heavy duty Marshall density, measured pcf. An average of 184 kpa of dry indirect tensile strength, 135 kpa of soaked indirect tensile strength, and 2,422 lbs of stability was achieved (see Table 3.10 and Figure 3.27). During the sampling, the material was excavated by hand to a depth of 8 inches and the 8 inch specified treatment depth was verified using a distilled water and phenolphthalein solution. The treated material was compacted using a Hamm vibratory padfoot roller immediately after blending. After initial compaction, a motor grader was used to establish profile and final compaction was accomplished using a vibratory double smooth-drum roller. Varying applications of water were placed onto the treated material s surface during grading and after the compaction process. It was also determined water would be applied by Base Construction over the surface of Section 5 for the next three days, to maintain moisture within the treated mat. Once final compaction of the treated material was completed, representative moisture-density tests were completed on the mat using a Troxler 3440 nuclear densometer (see Table 3.9). Compaction was based on the material s heavy-duty Marshall density of pcf. The compaction testing indicated that the treated material had been compacted to at least 95% of the heavy-duty Marshall density Control Sections: Mill and Overlay A total of four control sections (5 inches mill and overlay) were constructed along Section Line Road as follows: a) First control section was constructed at the south end of Section Line Road. It began at Home Road and extended approximately 461 ft north along Section Line Road. b) The second control section was constructed from 6,897 ft to 7,629 ft north of Home Road along Section Line Road. c) The third control section third control section was completed from Clark Shaw Road to approximately 2,744 feet north along Section Line Road. d) The fourth control section was constructed at the north end of Section Line Road. It began approximately 500 ft south of SR42 on Section Line Road and ended at SR42. 95
106 For the control sections, the top five inches of the asphalt layer were milled and removed first. Then 5 inches of hot mix asphalt was placed on top. The pavement materials below 5 inch pavement depth were left undisturbed. Figure 3.14 Delaware County Pre Reclamation Pavement Condition 96


107 Figure 3.15 Delaware County Blending of Admixtures with pulverized pavement materials Figure 3.16 Delaware County Pulverization with Admixtures 97
108 Figure 3.17 Delaware County Compactor following FDR machine led by water tank Figure 3.18 Delaware County - Roller compacting reclaimed material 98

109 Figure 3.19 Delaware County Compaction of reclaimed material Figure 3.20 Delaware County Compaction of reclaimed base 99
110 Figure 3.21 Delaware County Final Compaction by Vibratory Smooth Drum Roller Figure 3.22 Delaware County Placement of asphalt layer 100

111 Figure 3.23 Delaware County Placement of Hot Mix Asphalt Wearing Surface 101
112 Table 3.2 Delaware County Section 1 Field Compaction Results 102

113 Table 3.3 Delaware County Section 1 Density Correlated Strength Values 103
114 Figure 3.24 Delaware County Section 1 ITS vs Density 104
115 Table 3.4 Delaware County Section 2 Field Compaction Results 105
116 Table 3.5 Delaware County Section 3 Field Compaction Results 106
117 Table 3.5 Delaware County Section 3 Field Compaction Results (continued) 107
118 Table 3.6 Delaware County Section 3 Density Correlated Strength Values 108
119 Figure 3.25 Delaware County Section 3 ITS vs Density 109
120 Table 3.7 Delaware County Section 4 Field Compaction Results 110
121 Table 3.8 Delaware County Section 4 Density Correlated Strength Values 111
122 Figure 3.26 Delaware County Section 4 ITS vs Density 112
123 Table 3.9 Delaware County Section 5 Field Compaction Results 113
124 Table 3.10 Delaware County Section 5 Density Correlated Strength Values 114
125 Figure 3.27 Delaware County Section 5 ITS vs Density 115
126 3.4 Summary Warren County, near Cincinnati, Ohio, is the second fastest growing county in the state. The Long Spurling Road located in the northeastern part of the county was chosen by the Warren County Engineer's Office for FDR construction. The failing pavement was 0.37 miles in length, 20 to 21 feet in width with minimal shoulders with a 2-inch asphalt layer on top of 4 to 6 inches of chipsealed pavement. Two sections were constructed: 4-percent lime with 6-percent fly ash, 12-inch stabilization depth (0.28 mile) 5-inch mill and fill (0.09 mile) Delaware County (located 20 miles north of Columbus, Ohio, USA) is the fastest growing county in Ohio. In collaboration with the Delaware County Engineer's Office, a four mile long segment of Section Line Road was selected for FDR reconstruction in Roadway width was 20 feet with minimal shoulders. The asphalt surface thickness ranged from 5.25 to 14 inches (average of inches). The original pavement was underlain by a base course ranging from 1 to 11 inches (average of 5.18 inches) thick. Six types of sections were constructed using the following mixes: Cement & Emulsion: 2-percent cement with 1.6 gallons per square yard emulsion, 8- inch stabilization depth (0.42 mile) Cement Only Section: 5-percent cement, 12-inch stabilization depth (0.80 mile) LKD & Emulsion: 3-percent lime kiln dust with 1.4 gallons per square yard emulsion, 8-inch stabilization depth (0.79 mile) Fly Ash & LKD: 5-percent lime kiln dust with 5-percent fly ash, 8-inch stabilization depth (0.62 mile) Fly Ash & Lime: 4-percent lime with 6-percent fly ash, 8-inch stabilization depth (0.62 mile) Controls: 5-inch mill and overlay (two 0.09-mile sections at the north and south ends of the project, and a 0.14 mile as well as 0.52 mile section near the middle of the project). Class F fly ash from Zimmer Power Plant was utilized in the construction of the Warren and Delaware county pavement sections. The construction work was carried out in Summer of 2006 by Base Construction / Strawser Paving with site QA/QC services provided by EDP Consultants under the respective supervision of the Warren County and Delaware County Engineer s Office. The major equipment used for the full depth reclamation (FDR) of the pavement sections was as follows: - Self-propelled reclaimer (Wirtgen WR 2500 machine) - Motor grader - Compactor (HAMM 2242 padfoot roller and HAMM 2420 smooth-drum vibratory compactor) - Calibrated bulk spreader - Water truck with spray bar 116
127 The total amount of distance to be completed in one day (a segment) was decided to be approximately one-quarter of a mile. The first pulverization pass of the reclaimer was along the outer edge of the roadway. The next pulverization pass was back to the starting point of the segment along the opposite outer edge. Subsequent pulverization passes were inside the previous passes until the complete road width was pulverized once. Then using the same procedure for passes, the chemical stabilizers (fly ash, lime, lime kiln dust, etc.) were spread out and water added if need be. The final mixing pass again occurred in the same manner so as to produce a uniform pulverized mixture of existing pavement materials, chemical admixtures, and water. Following this, a motor grader shaped the reclaimed material in the segment. Initial compaction was then carried out by using a padfoot roller for the segment. Final compaction then followed with a smooth-drum vibratory compactor for the segment. After initial curing, a fog seal was applied to the constructed base course and cured for at least 5 days. After the curing period, the asphalt wearing surface was placed on top of the constructed base course. The roads were then opened to through traffic a few days after the final asphalt layer was placed. 117
128 CHAPTER 4 POST-CONSTRUCTION MONITORING 4.1 Introduction The instrumentation and environmental as well as structural monitoring of Delaware and Warren County pavement test sections are presented in this chapter. Falling Weight Deflectometer (FWD) tests were conducted by ODOT before pavement reclamation and at regular intervals after the FDR of the pavements. 4.2 Pavement Instrumentation Prior to the construction of the pavement sections, specific locations (monitoring stations) were chosen to install structural and environmental monitoring devices in the pavement during pavement rehabilitation. The Warren County pavement had two instrumentation locations, one in the fly ash & lime section and the other in the control (mill and overlay) section (see Figure 4.1). For Delaware County sections, each of the various types pavement sections (Cement & Emulsion, Cement, Emulsion & LKD, Mill and Overlay, Fly Ash & LKD, Fly Ash & Lime) were instrumented at locations shown in Figure 4.2. Figure 4.3 shows the typical planned instrumentation at the monitoring stations. It included the following devices (which were placed under the outside wheel path): - Longitudinal and transverse strain gauges at bottom of asphalt layer (i.e. on top of FDR base layer) - Pressure cell at bottom of stabilized base layer (i.e. on top of unreclaimed base/subgrade) - Pore pressure device (tensiometer) at bottom of stabilized base layer (i.e. on top of unreclaimed base/subgrade) - Two Linear Variable Displacement Transducers (LVDTs) for measuring vertical deflections of pavement - Lysimeter installed within the stabilized base to monitor ground water quality Each sampling site had a concrete box (Figure 4.4), called a pull box, where wiring or tubing from the above instrumentation within the pavement was available for easy access for the collection of data or water samples. During construction of the Warren County pavement, the two pavement sections (fly ash & lime as well as mill and overlay) were instrumented. The control section (mill and overlay) had strain gauges installed on top of the reclaimed base layer and lysimeters in the reclaimed base layer to measure the subsurface water quantity and quality. The strain gauges measured horizontal strains in longitudinal and transverse directions at the bottom of the asphalt layer. In addition to the above devices, the reclaimed section included a Linear Variable Displacement Transducer (LVDT), a pressure cell, and pore pressure (tensiometer) cell. These devices were placed on top of the unreclaimed base/subgrade. The LVDT measures vertical displacement and the pressure 118
129 cell measures the total pressure exerted on the subgrade by traffic. All data measurements from the monitoring devices were collected using analog and digital data collection systems and analyzed. The instrumentation at Warren County pavement sections is documented in Appendix C. For Delaware County pavement sections, the Cement & Emulsion, Cement, Emulsion, and Control (Mill and Overlay) sections were instrumented only with longitudinal and transverse strain gauges at bottom of asphalt layer and lysimeters in the FDR base layer to measure subsurface quality. For Fly Ash & LKD as well as Fly Ash & Lime sections the pavement sections were instrumented with the strain gauges and lysimeters as well as LVDTs, pressure cell, and pore pressure (tensiometer) cell. The instrumentation at Delaware County pavement sections is documented in Appendix D. The monitoring of the above devices along with Falling Weight Deflectometer (FWD) tests by ODOT on a regular basis was intended to monitor the pavement load-deflection behavior, resilient modulus of reclaimed pavement layer, and the base structural layer coefficient, as well as ground water quality. Using these monitoring methods, the serviceability, structural response, and leachate quality of the fly ash sections can be compared with the other sections to assess the pavement performance using various admixtures. 119


130 CCP: Fly Ash & Lime Control: Mill and Overlay Figure 4.1 Instrumentation Sites Warren County S1: Cement & Emulsion S2: Cement S3: Emulsion & LKD S4: Control - Mill and Overlay S5: Fly Ash & LKD S6: Fly Ash & Lime Figure 4.2 Instrumentation Sites Delaware County 120

131 Figure 4.3 Typical Pavement Instrumentation Plan Figure 4.4 Concrete Pull-Box 121

132 4.3 Environmental Monitoring Lysimeter Lysimeters were installed within the FDR base to gather samples of pore water from within the reclaimed base layer to determine possible environmental impacts associated with the use of CCPs in the FDR mixture. A lysimeter is a porous ceramic cup typically used to obtain water from soil. Figure 4.5 shows a typical lysimeter. The lysimeters used in this study were item number 1915S1-A, purchased from Soilmoisture Equipment Corp. The ceramic cup was a 1-bar hi-flow cup (19-28 psi) with a porosity of 45%, pore size of 2.5 µm, and dimensions of: 0.5 outside diameter, wall thickness and 2.5 length. Green polyethylene tubing was used to transfer the sample from the lysimeter to a collection vessel when a vacuum was applied to the system. This polyethylene tubing was purchased from Soilmoisture Equipment Corp. as well. The lysimeters were installed immediately following the FDR of the test sections. The lysimeter was located in the FDR base layer under the outside wheel path. The area around the instrumentation was backfilled to a level several inches above their location and once the correct elevation was reached, the lysimeters were placed with a horizontal orientation into the FDR mixture and surrounded with a water-saturated FDR mixture. A polyethylene tubing was run through PVC piping, to protect it from puncture, to the sampling box. The remainder of the FDR mixture was filled in above the lysimeter to an elevation that was flush with the surrounding FDR base. At locations that did not include fly ash as an additive, lysimeters were placed by drilling a vertical hole using a rotary drill from top of FDR base into the FDR base layer into which the lysimeter was lowered to the desired elevation before being surrounded with saturated FDR material. Figure 4.5 Typical Lysimeter (Soilmoisture Equipment Corp.) 122
133 4.3.2 Hydrology Around Test Sections Figure 4.6 shows a conceptualization of the hydrology of the FDR base material. Horizontal unsaturated flow (1), saturation during wet weather (2), capillary forces (3), pore water pressure changes with vertical distance (4), and asphalt percolation (5) all influence the water content of the FDR base. Saturation during wet weather and asphalt percolation both depend on weather conditions. Horizontal unsaturated flow results from the groundwater movement around the road. Finally, capillary forces and pore water pressure changes occur and can be affected by the pozzolanic reactions occurring within the FDR base material. 1: horizontal unsaturated flow 2: saturation during wet weather 3: capillary forces 4: pore water pressure changes with vertical distance 5: asphalt percolation Figure 4.6 Cross Section of Pavement with Possible Sources of Water It should be noted that at the Warren County test site, the water table was very close to the bottom of the FDR base. Originally, the design reclamation depth was to be 16 inches for Warren County sections. However, due to the high water table in Warren County, the FDR base layer reclamation depth was reduced to 12-inches. The test sections that included fly ash as an additive did not produce any significant amounts of water sample. This suggests that the pozzolanic reaction between the Class F fly ash and lime/lkd reduced the field capacity of the FDR base. This is likely due to the pozzolanic nature of the Class F fly ash in conjunction with the lime or lime kiln dust. The pozzolanic reactions form cementitious material (CSH and CAH) (Daniels and Das, 2006). The reactions that form 123
![the calcium silicate hydrate (CSH) and calcium aluminate hydrate (CAH) when lime and fly are combined are as follows (Daniels and Das, 2006): CaO + H 2 O Ca(OH) 2 (4.1) Ca(OH) 2 Ca 2+ + 2 [OH - ] (4.](/docs-images/73/68992737/images/134-0.jpg "2) Ca 2+ + 2 [OH - ] + SiO 2 CSH (4.3) Ca 2+ + 2 [OH - ] + Al 2 O 3 CAH (4.4) One of the results of this reaction is that the porosity and permeability of the mix will decrease.")
134 the calcium silicate hydrate (CSH) and calcium aluminate hydrate (CAH) when lime and fly are combined are as follows (Daniels and Das, 2006): CaO + H 2 O Ca(OH) 2 (4.1) Ca(OH) 2 Ca [OH - ] (4.2) Ca [OH - ] + SiO 2 CSH (4.3) Ca [OH - ] + Al 2 O 3 CAH (4.4) One of the results of this reaction is that the porosity and permeability of the mix will decrease. As a result, the pore water pressure in these test sections could remain negative since water has not yet been able to penetrate the FDR base layer to fully saturate it. Also, the lower porosity may lead to reduced transport of water through the layer during sampling with the lysimeter Sampling Procedures Groundwater sampling was carried out at each test section on a monthly basis. At each location, a sample collection box contained the wires and tubing necessary to obtain data or samples from the equipment that was built into the road. A Coleman Powermate Pulse 1800EX Generator was used to supply the electricity needed at the sampling sites. Once the cover of the sample collection box had been removed, the green polyethylene tubing that was connected to the lysimeter was inserted through a rubber stopper. Once the tubing had been inserted through the stopper and rinsed with Millipore deionized water to remove any foreign particles, it was placed into a one liter Nalgene Buchner vacuum flask, which had been triple-rinsed with Millipore deionized water. Tubing was attached to the hose barb of the flask and connected to a vacuum pump (Welch, Model No. 2545B-01) capable of producing a vacuum up to approximately 15 psi. The vacuum pump was then attached to the generator that was described above. Figure 4.7 shows a diagram of this general set up. Figure 4.7 General Equipment Set-up During Sampling 124
135 When the set-up for the sampling had been completed, the generator was turned on, followed by the vacuum pump. Sampling then took place for between 1 to 2 hours at each test site. While sampling was occurring, progress would be periodically observed at intervals of approximately 15 minutes. Sampling at each site was determined to be completed when at the one hour mark or beyond no additional sample was observed to have accumulated within the Buchner flask in the previous 15 minutes. At this point, any sample obtained was collected into a 2 oz. Fisher LDPE bottles. Each sample was then labeled with the date and test site location. Samples were also characterized into categories based on the volume attained during the sampling process. This was accomplished through visual observation of the sample within the 2 oz. Fisher LDPE bottles that were used for sample storage. They were then placed in a cooler and kept chilled until placed into a laboratory refrigerator at 4 o C. Once sampling was concluded at one test site, the sampling arrangement was taken apart. The Buchner flask was rinsed thoroughly with Millipore deionized water. The polyethylene tubing was covered with plastic wrap to prevent water from back flowing into the tubing between sampling dates. Finally, the cover for the sample collection box was replaced Monitoring Results Since September 2006, the test sites in Warren and Delaware counties were monitored on approximately a one month basis (Mackos, 2008). Table 4.1 shows the number of samples obtained from each location, and the number of times each location was visited. Samples were most consistently obtained from the Warren County Control Section (5 samples), while a number of sites (D-2, D-5 and D-6) did not produce sufficient water sample to warrant analysis. Appendix E contains data in regards to the approximate amounts of sample collected at each test site. The data in Table 4.1 shows that the control sections and those sections that had emulsion used as one of the additives were most susceptible to water penetration into the FDR base layer. The sections of the road that included lime/lkd and fly ash were less likely to have water in the FDR layer. The Delaware County test sections that had additives of cement and fly ash & LKD were visited fewer times than the remaining test sections. The reason for this was their locations were difficult to access with a generator during wet weather. However, at least 7 sampling trips were made to each test section. The samples obtained were analyzed for both ph and elemental composition. The maximum concentration observed for each of the elements examined is given in Table 4.2. The complete set of data is provided in Appendix E. The lack of data for Site D-2 in Delaware County is due to the lack of sufficient sample size. Furthermore, the Delaware County sites that contained fly ash did not produce a sample of sufficient size to run each of the analysis techniques, but the sample size was sufficient to obtain data in regards to As and Se. Table 4.2 shows a comparison between the maximum concentration obtained from samples at each test section and the Ohio EPA non-toxic criteria. The samples contain concentrations that 125
136 are two to three orders of magnitudes below the non-toxic criteria for As, Ba, Cr, Pb and Se. The non-toxic criteria for Cd is approximately one order of magnitude larger than the maximum concentration of Cd found from each of the test sections. Finally, Hg is below the non-toxic criteria by at least six times. Site Samples Collected Trips W-1 Control 5 12 W-2 4% L, 6% FA 1 12 D-1 Cem. & Emul D-2 Cem. 0 7 D-3 LKD & Emul D-4 Control 2 13 D-5 5% LKD, 5% FA 0 7 D-6 4% L, 6% FA 0 13 Table 4.1 Samples obtained and trips made to each test site In addition, the results listed in Table 4.2 are compared to the United States Environmental Protection Agency drinking water maximum contaminant level (MCLs) for the elements As, Ba, Cd, Cr, Cu, Hg, Pb and Se. It can be seen that each of these elements falls well within the US EPA s MCL for drinking water with the exception of Cd. It is possible that Cd may also be below the MCL for drinking water, however the detection limit was greater than the MCL of µg/ml. Due to the amounts present in the FDR base materials (see Table 2.13), Na, Ca, S and Mg were the main elements contained within samples of the environmental monitoring. When comparing the results in Table 2.13 with those results in Table 4.2, it appears Na was removed at a much higher percentage than the Ca, S and Mg, due to similar amounts being present in the samples while Na has a much lower concentration at first. Those elements which had more than 5% of their original elemental composition present in the field samples were considered to have a higher affinity for the conditions present within the liquid than those conditions within the crystalline structures making up the FDR base layer. This category consisted of Na and S. The next category would be those elements which have between 1 and 5% of the initial values in Table 2.13 being present in the liquid phase as shown in Table 4.2. These elements were Ca, Cd, Cu, K and Si. Finally, those elements with values in Table 4.2 that are less than 1% of the values in Table 2.13 can be characterized being least favorable to the conditions within the liquid phase. These elements were Al, As, Ba, Cr, Fe, Hg, Mg, Mn, Ni, Pb, Se, Sr and Zn. The Warren County test sections were used to compare a control (W-1) directly with a fly ash & lime (W-2) section. In Table 4.2, Ba, K, Mg, S and Zn each have higher concentrations in the samples obtained from W-2 than W-1. Section W-2 contains lower concentrations of Al, Cu, Fe, 126
137 Na and Ni than section W-1. Both sections had approximately equal concentrations of As, Ca, Cd, Cr, Hg, Mn, Pb, Se, Si and Sr. When compared to the initial elemental compositions of each section, there are several differences that can be seen. There is a higher concentration of As, Ba, Cd, Cr, Hg and Zn in the elemental composition of W-1 than W-2. Section W-2 had a higher concentration of Ca, Mn and Sr in its FDR base material s elemental composition. Finally, sections W-1 and W-2 had nearly equivalent elemental compositions for Cu, K and Na. Since the composition of the materials and the concentrations of the samples did not necessarily match, it suggests that the leaching of materials from the FDR base material does not necessarily coincide with the concentrations of elements available within the base material. The Delaware County test sections were used to draw a comparison between the monitored control (D-4) and each of the other sections (D-1, D-2, D-3, D-5 and D-6). The two fly ash sections (D-5 and D-6) only produced enough sample to determine that the As and Se concentrations are equivalent to the control (D-4) section. The elemental compositions of these three sections show that D-5, and to a slight degree D-6, have higher concentrations of As than D-4, but all three sections are nearly equivalent in regards to Se. When the two sections that included emulsion as one of the additives in the FDR base material (D-1 and D-3) were considered, it was found the D-1 and D-3 had higher concentrations of Al, Ba, Ca, Cu, Mg, Na, Ni, S, Si and Sr than D-4. Sections D-1 and D-3 were nearly equal with D-4 when the concentrations of As, Cd, Cr, Fe, Hg, Se and Zn were observed. When compared to the elemental compositions in Table 2.13, Mn and Sr both exist at a higher concentration in D-4 than both D-1 and D-3. Ni and Zn both exist in higher concentration in D-1 (slightly) and D-3 than the control, D-4. Table 4.2 also shows the data for the anions (Cl -, NO 3 - and SO 4 2- ) from each of the test sections where a sufficient amount of sample was obtained. In general, the dominant anion within the FDR base material was SO The sulfate is consistently well above 100 µg/ml. The chloride ion is the next most prevalent in several of the FDR base materials (W-1 and D-4). Both of these sections happen to be the control sections. In the two sections where anion data exists (D-1 and D-3) and additives were included in the construction of the FDR base, there is almost no chloride present. Finally, the nitrate concentrations are the most consistent among each of the test sites. The range of concentrations for nitrate is from approximately µg/ml. The maximum field concentrations observed were compared to TCLP and SPLP results to assess the adequacy of these test methods. Table 4.3 shows the comparisons between the Warren County environmental monitoring data and the TCLP and SPLP protocols. The Ca and S concentrations from the environmental monitoring are resulting in higher concentrations than both the TCLP and SPLP tests predict for the Warren County test site. The SPLP protocol was more accurate in predicting As, Mn, Pb, Se and Zn. The TCLP protocol more accurately predicted Cr, Fe, Ni and Si. They both were equally as effective at determining Cd and Hg. Finally, the predicted values of Ba, Cu, Na, S and Sr by both TCLP and SPLP were significantly different than the results in Table 4.2 and could not be confidently predicted with either test. There does not seem to be a correlation between a change of concentration in one of the leaching procedures and a similar change in the environmental monitoring data. In Table 4.4, when both 127
138 the SPLP and TCLP indicate an increase in concentration of Ca and Na from W-1 to W-2, the environmental monitoring data shows that the Ca does not actually show a significant change and the Na concentration decreases dramatically. The final ph values obtained using the TCLP protocol more accurately predicts the actual ph determined during environmental monitoring. Tables 4.4 and 4.5 show the comparisons between the Delaware County environmental monitoring and both leaching tests. At the Delaware County test site, the data found from the leaching tests and environmental monitoring suggest that both TCLP and SPLP protocols have their usefulness. The TCLP protocol was generally more accurate in predicting the leaching of Cu, Fe, Ni and Sr. The SPLP protocol was more useful in predicting the concentrations of Cd, Cr and Se. It was not conclusive which test could more accurately predict the concentration of the remaining elements (As, Ba, Ca, Mg, Mn, Na, S, Si and Zn). As with the Warren County site, the Delaware County test sections do not seem to show a correlation between the leaching tests and the field samples. As an example in Table 4.4, the concentration of Mg and Ni remain constant for each of the three sites in regards to the leaching test results, but the field sample results show a large degree of variation. As observed with the Warren County results, Ca and Na show the same differences with Delaware County results. Finally, as with the leaching tests performed on the Warren County sites the ph was more accurately predicted by the TCLP protocol than the SPLP protocol. Figure 4.8 shows the trends in Al, Ba, Ca, Cu, Fe, Na, Ni, Si and Sr concentration with time at the Warren County control section (W-1). As Figure 4.8 shows, Al, Ba, Cu, Fe, Na, Ni and Sr have been continuously increasing in concentration over the duration of the sampling period. The concentration of Ca started at an extremely high concentration before quickly falling and essentially leveling off with a slightly positive slope. It is difficult to determine whether Si has reached the point at which the majority of available Si has been leached or the final data point is just an outlier. The trend in regards to Ca is most likely a result of the pozzolanic reactions occurring within the FDR base material. When the road was first constructed, much of the Ca was still available for leaching since it had not yet reacted to form crystalline structures such as calcium silicate hydrate or calcium aluminate hydrate that form during the curing of cement. Once these two compounds began to form the Ca available for leaching dramatically decreased, which would explain the trend seen for Ca in Figure 4.8. The increase that each element is now showing is possibly due to the cementitious reactions within the FDR base material slowing down and the crystalline materials that were formed being slowly stripped away by groundwater which promotes the possible extraction of other elements. There was only one sample collected from the fly ash test section in Warren County (W-2) during November The sample from section W-2 contains slightly more Ca (935 mg/l). It contains significantly more Na (59.5 mg/l), Fe (51.4 µg/l), Si (3360 µg/l), Sr (312 µg/l) and Ba (79.3 µg/l). Each of these values was between approximately 1.33 to 3 times greater than those values obtained from the control test section samples in November
139 Collected Samples Element Warren County Delaware County Control 4% L, 6% FA Cem. & Emul. Cem. LKD & Emul. Control 5% LKD, 5% FA W-1 W-2 D-1 D-2 D-3 D-4 D-5 D-6 EPA MCL Ohio Non- Toxic 4% L, 6% FA Criteria ph ~7.0 ~7.5 ~7.0 - ~7.0 ~8.0 ~6.25 ~7.0 Al < ND As < < Ba Ca Cd <0.010 <0.010 < <0.010 < Cr < < Cu < Fe Hg <0.001 <0.001 < <0.001 < K Mg Mn <0.010 <0.010 < < Mo Na Ni < Pb <0.010 <0.010 < <0.010 < S Se <0.001 < <0.001 <0.001 < Si Sr Zn Cl < < NO SO Units: µg/ml Table 4.2 Maximum concentrations obtained from samples collected at Warren and Delaware test sites 129
140 Control 4% Lime & 6% Fly Ash Element W-1 W-2 Max. Max. Conc. TCLP SPLP Conc. TCLP SPLP ph ~ ~ Al < As < ± <0.001 Ba ± ± ± ±0.016 Ca ± ± ±24 221±24 Cd <0.010 <0.010 <0.010 <0.010 <0.010 <0.010 Cr ±0.001 <0.010 <0.010 <0.010 <0.010 Cu <0.010 <0.010 <0.010 <0.010 <0.010 Fe ±0.005 < ± ±0.001 Hg <0.001 <0.001 <0.001 <0.001 <0.001 <0.001 K Mg ± ± Mn < ±0.564 <0.010 <0.010 <0.010 <0.010 Mo - <0.010 < <0.010 <0.010 Na ± ± ± ±2.9 Ni ± ±0.001 < ±0.003 <0.010 Pb < ± ±0.025 < ± ±0.014 S ± ± ±0.1 Se < <0.001 < <0.001 Si ± ± ± ±0.123 Sr ± ± ± ±0.011 Zn < ± < ±0.003 Units: µg/ml Table 4.3 Comparison of maximum concentrations from environmental monitoring and TCLP and SPLP leachate concentrations for Warren County 130
141 Element Cement & Emulsion LKD & Emulsion Control D-1 D-3 D-4 Max. Conc. TCLP SPLP Max. Conc. TCLP SPLP Max. Conc. TCLP SPLP ph ~ ~ ~ Al ND As ±0.001 < <0.001 <0.001 < <0.001 Ba ± ± ±0.002 < ± ±0.004 Ca ±5 61.0± ±3 7.4± ±4 275±4 Cd <0.010 <0.010 <0.010 < ±0.009 <0.010 <0.010 <0.010 <0.010 Cr 0.02 < ±0.002 < ±0.003 < ±0.008 <0.010 Cu ±0.019 < ± ± ± ±0.022 Fe < < <0.010 Hg <0.001 <0.001 <0.001 <0.001 <0.001 <0.001 <0.001 <0.001 <0.001 K Mg ± ± ± ± ± ±0.017 Mn < ±0.005 < <0.010 <0.010 <0.010 <0.010 <0.010 Mo ±0.001 < <0.010 < ± ±0.002 Na ± ± ± ± ±0.1 Ni ±0.012 < ±0.023 < ±0.011 <0.010 Pb < < < S ± ± ± ± ± ±0.1 Se < < <0.001 Si ± ± ± ± ±0.037 Sr ± < ±0.005 Zn ±0.001 < <0.010 < < ±0.002 Units: µg/ml Table 4.4: Comparison of maximum concentrations from environmental monitoring and TCLP and SPLP leachate concentrations for Delaware County (D-1, D-3 and D-4) 131
142 Element Control 5% LKD & 5% Fly Ash 4% Lime, 6% Fly Ash D-4 D-5 D-6 Max. Conc. TCLP SPLP Max. Conc. TCLP SPLP Max. Conc. TCLP SPLP ph ~ ~ ~ Al As < < <0.001 < ±0.001 Ba ± ± ± ± ± ±0.002 Ca ±4 275±4-1220±6 169±7-1170±8 171±3 Cd <0.010 <0.010 < <0.010 < <0.010 <0.010 Cr ±0.008 < ± ± <0.010 <0.010 Cu ± ± ± ± ± ±0.004 Fe < < <0.010 Hg <0.001 <0.001 < <0.001 < <0.001 <0.001 K Mg ± ± ± ± ±0.4 <0.010 Mn <0.010 <0.010 < ±0.002 < <0.010 Mo ± ± ± ± ± ±0.001 Na ± ± ± ± ±0.1 5±0.1 Ni ±0.011 < ± ± ±0.014 <0.010 Pb < S ± ± ± ± ± Se < <0.001 < < <0.001 Si ± ± ± ± Sr ± ± ±0.004 Zn < ± <0.010 < < ±0.001 Units: µg/ml Table 4.5 Comparison of maximum concentrations from environmental monitoring and TCLP and SPLP leachate concentrations for Delaware County (D-4, D-5 and D-6) 132
143 Concentration (mg/l) /1/ /1/2006 1/1/2007 2/1/2007 3/1/2007 4/1/2007 5/1/2007 6/1/2007 7/1/2007 8/1/2007 9/1/ /1/ /1/ /1/2007 Calcium Sodium Date Concentration (µg/l) Iron Silicon Strontium Date 100 Concentration (µg/l) /1/ /1/2006 1/1/2007 2/1/2007 3/1/2007 4/1/2007 5/1/2007 6/1/2007 7/1/2007 8/1/2007 9/1/ /1/ /1/ /1/2007 Aluminum Barium Copper Nickel Date Figure 4.8 Concentration trend of select elements from the Warren County Control Section 133
144 4.3.5 Geochemical Speciation Modeling Geochemical speciation calculations were performed using Visual Minteq, the maximum concentration data in Table 4.2, and the ph data. The purpose of these calculations was to identify solid phases that are potentially important in controlling levels of inorganic elements in pore water within the FDR base. The supersaturated species that exist in the environmental monitoring samples primarily consisted of solids of Al, Ba, Cu, Fe, Hg, K, Mg and Mn. These supersaturated species included: bixbyite ((Mn 3+,Fe 3+ ) 2 O 3 ), ferrihydrite (Fe 5 O 3 (OH) 9 ), lepidocrocite (δ-feo(oh)), barite (BaSO 4 ), k-jarosite (KFe 3 [(OH) 3 SO 4 ] 2 ), brochanite (Cu 4 SO 4 (OH) 6 ), calomel (Hg 2 Cl 2 ), maghemite and hematite (Fe 2 O 3 ), magnesioferrite (MgFe 2 O 4 ), boehmite and diaspore (AlO(OH)) and gibbsite (Al(OH) 3 ). Therefore, those solid phases may control the leaching that occurs within the FDR base layers. Table 4.6 shows that each of the supersaturated species present in W-2 also exists in W-1, except for Fe(OH) 2.7 Cl 0.3. Since W-1 only consists of the road material, it can be hypothesized that the Fe(OH) 2.7 Cl 0.3 is a result of the lime and fly ash additives. Since the fly ash has a significantly higher concentration of Fe in it s elemental composition than the road sections (Table 2.13), it would follow that there would be a good chance that any additional supersaturated species would include Fe. There is no evidence of a supersaturated phase consisting of As, Ca, Cd, Cr, Mo, Na, Ni, Pb, Se, Si, Sr or Zn Limitations During the duration of this project, limitations were experienced in both the sampling and analysis stages. Sampling was often times limited by the weather conditions. The sampling limitations were dictated by the weather conditions (Either at times of dry weather when samples were not yielded from the test sections or during wet weather when there were certain test sections where it was not possible to complete the sampling procedures). Due to the lack of samples, the analysis stage of the project was limited for two reasons because of the sampling limitations. First, the small sample sizes made it impossible to repeat the analysis. Second, the lack of samples made it difficult to have multiple data sets for each test section. 134
145 Warren County Delaware County Control 4% Lime, 6% Fly Ash Cement & Emulsion LKD & Emulsion Control W-1 W-2 D-1 D-3 D-4 Al(OH)3 (Soil) Al(OH)3 (Soil) Al(OH)3 (am) Barite Al(OH)3 (Soil) Al2O3 Bixbyite Al(OH)3 (Soil) Bixbyite Atacamite Al4(OH)10SO4 Boehmite Al2O3 Cupric Ferrite Bixbyite Alunite Cupric Ferrite Al4(OH)10SO4 Fe(OH)2.7Cl.3 Boehmite Barite Diaspore Alunite Ferrihydrite Brochantite Bixbyite Fe(OH)2.7Cl.3 Barite Ferrihydrite (aged) Cupric Ferrite Boehmite Ferrihydrite Bixbyite Goethite Diaspore Calomel Ferrihydrite (aged) Boehmite K-Jarosite Fe(OH)2.7Cl.3 Cupric Ferrite Gibbsite (C) Brochantite Lepidocrocite Ferrihydrite Diaspore Goethite Cupric Ferrite Maghemite Ferrihydrite (aged) Ferrihydrite Hematite Diaspore Magnesioferrite Gibbsite (C) Ferrihydrite (aged) Lepidocrocite Fe(OH)2.7Cl.3 Goethite Gibbsite (C) Maghemite Ferrihydrite Hematite Goethite Magnesioferrite Ferrihydrite (aged) Lepidocrocite Hematite Gibbsite (C) Maghemite K-Jarosite Goethite Magnesioferrite Lepidocrocite Maghemite Magnesioferrite Hematite K-Jarosite Lepidocrocite Maghemite Magnesioferrite Table 4.6 Supersaturated Species in Test Sections 135
146 4.4 Structural Monitoring Falling Weight Deflectometer (FWD) testing was carried out by the Ohio Department of Transportation (ODOT) prior to reclamation on the Delaware and Warren County pavement sections and then three times a year following completion of reclamation till 3 years postconstruction. The strain gauges, deflection LVDTs, pore pressure transducers, and pressure cells (see Section 4.2) installed within the pavement sections were monitored on a regular basis. This section describes the results from the monitoring of these devices as well as those from FWD testing Falling Weight Deflectometer (FWD) Testing FWD Test Procedure Falling Weight Deflectometer (FWD) non-destructive testing plays an important role in both the design and maintenance of pavements. Using a backcalculation procedure, the FWD test is currently the standard method adopted by US highway agencies to determine the in situ resilient moduli of pavement layers. The backcalculated moduli provide a meaningful indication of pavement layer conditions and can be used to simulate the effect of individual layers on the pavement response under applied load by calculating stresses and strains using analytical layered elastic theory or numerical methods such as finite element analyses. These pavement response data can be used with fatigue or distress models to evaluate damage accumulation under traffic and determine necessary rehabilitation needs. In this study, standard FWD tests were performed on each test pavement section at regular intervals to evaluate the resilient modulus of the stabilized base layer before and after construction, detect any post-reclamation pavement deterioration, and to compare the performance of fly ash based sections with those using other admixtures. A major advantage of the FWD insitu non-destructive testing is that the testing method requires scanning of the entire length of the road at a regular drop interval (0.03 mile for Warren sections and 0.1 mile for Delaware sections) in one traffic direction and then repeating the testing in the other traffic direction with a stagger of one-half of the drop interval. This allows for a detailed scan of the pavement sections along its length unlike the instrumentation installed at one location in each test section (that only gives information about that location and not the entire test section). All the FWD tests in this study were carried out by ODOT using a Dynatest Model 8000 Falling Weight Deflectometer (Figure 4.9). The ODOT FWD equipment is a trailer-mounted device consisting of three major parts: a hydraulic electrical and mechanical system, response sensors and a data acquisition system. The FWD produces a load pulse which simulates the effect of a moving wheel load through the dropping of a weight. The impact load is transmitted to the pavement surface through a loading plate (Figure 4.10). Both load and pavement deflections are measured. The pavement deflects most at the center of the load and less farther away forming a so called deflection basin (or deflection bowl, see Figure 4.11). The deflection is measured 136
147 by a number of sensors (geophones) placed at specified offset distances from the center of the loading plate (see Figure 4.10). The deflections of the sensors closer to the loading plate depend on both the pavement as well as the subgrade conditions while the deflections of the outer sensors depend mostly on the subgrade conditions (Figure 4.11). The data for each weight drop (peak load, deflection values at each sensor, and sensor offset distances from the load, air and surface temperatures) are collected by a data acquisition system and displayed on a portable computer for direct visual inspection, then stored on disk when accepted by the operator. The Dynatest 8000 consists of a series of steel blocks mounted on a vertical shaft on the FWD trailer which is towed by a conventional vehicle (Figure 4.9). Different levels of impact load can be achieved by varying the magnitude of the drop mass and the height of drop. The drop weight is lifted with a hydraulic system to a height that usually ranges from 51 to 510 mm (2 to 20 inch). The weight is dropped on a circular loading plate with a diameter of 300mm (11.8 inch) on a ribbed rubber buffer. The rubber buffer is used to improve uniformity of the impact stress distribution under the loading plate area. The Dynatest 8000 is equipped with seven geophones which are positioned at 0, 20, 30, 46, 61, 91 and 152 cm (0, 8, 12, 18, 24, 36 and 60 inch) away from the center of loading plate (Figure 4.12). Each geophone is supported by a transducerholder connected along a metal bar for precise positioning of the geophones. All the sensors and the hydraulic system are connected to a system processor. In this study, along the pavement length FWD tests were carried out for Delaware County sections at a drop interval of 0.1 mile and for Warren County pavement site at a drop interval of 0.03 mile. The drop locations were chosen to be along the outer wheel path of the highway. For each site, the FWD drop tests were carried out in one pavement traffic direction first and then reversed in the other pavement traffic direction (with a stagger of half the drop interval). At each drop location, three drop load levels of 27kN (6,000 lbf), 40kN (9,000 lbf) and 53.4kN (12,000 lbf) were carried out Back Calculation of Base Layer Resilient Modulus from FWD Data The back calculation procedure for the elastic moduli of the pavement layers from the FWD data is an iterative procedure (Figure 4.12), i.e., the calculation of deflections under the applied load begins with an initial set of seed moduli. The resulting deflections are compared with the measured FWD deflections and the assumed moduli are modified until the calculated deflections converge to the measured deflections within an acceptable error level (Lytton, 1989). The majority of the current back calculation programs are based on multi-layer linear elastic theory neglecting the inertial effects. In a static linear elastic analysis, only two material parameters (elastic modulus and Poisson s ratio) are needed to calculate the deformation. In most cases, Poisson s ratio is assumed. Therefore, only layer moduli are treated as unknowns. In our study, we are primarily interested in the modulus of the stabilized FDR later. Typical resilient modulus values for materials commonly used in highway construction are summarized in Table 4.7. After obtaining the calculated surface deflection basin from the input parameters, the method searches for the set of layer moduli to match the calculated and measured deflection basin within 137
148 some tolerance error. Programs with iterative schemes generally adjust the assumed layer moduli until they produce surface deflections that closely match measured values e.g. MODCOMP (Irwin, 1994). The primary criterion used to measure the performance of a back calculation program is how well the calculated basin matches the measured basin. Several types of convergence schemes or deflection tolerances are used, including: the sum of the squared difference between measured and calculated deflection, the sum of the absolute differences, and sum of the squared relative error where the absolute difference is divided by the measured deflection. In most programs (including MDCOMP that was used in our study), the accuracy of the back calculation is characterized by the Root-Mean-Square (RMS) error between the measured and calculated deflection basin. There are no fixed maximum RMS values for back calculation. Nevertheless, a RMS error less than 3% is usually considered acceptable while 6% is a considered a poor fit (Irwin, 2004). In our work we followed this recommendation. The backcalculation procedures used in this study were based on the standardized procedures (ASTM D5858, FHWA-RD , 1997 and FHWA-RD , 2002) which include the following five major steps: a) Extraction of data needed for back calculation from FWD test files: The pavement surface deflections and the impact loads applied are recorded for each impact. b) Classification of test section and deflection basin data: Three test section classifying procedures were followed in this study: 1) load-response classification; 2) deflection basin classification and 3) site uniformity classification. These procedures are the same standard procedures followed by SHRP and LTPP researchers, and are documented in the reports FHWA-RD and FHWA-RD The load-response was classified as a) linear elastic pavement structures; b) deflection-hardening pavement structures, or c) deflection-softening pavement structures. The deflection basin for asphalt flexible pavements is a Type II normalized deflection basin in which the deflection at each sensor decreases from the loading center to the outermost sensor. This type of deflection basin is distinguished by a significant decrease in measured deflection between two adjacent sensors. The site uniformity classification is carried out to determine the uniformity or variability of the deflections measured along the length of each test section. c) Determination of pavement structure model and inputs: Before performing the layered moduli backcalculation, surface moduli for the pavement sections were calculated. The surface modulus is the equivalent weighted mean modulus of a linear elastic half space calculated from the measured surface deflections based on the Boussinesq s theory. The pavement structural model was then identified as a five layer model with the subgrade below the pavement as an infinite half-space. The Poisson s ratio and seed moduli were determined based on our work previous experience on OCDO APLF project (Wolfe, 2006). Estimating Poisson s ratios and the initial moduli from published sources was assumed to be acceptable because they have been shown to have relatively limited influence on the final results, especially in a linear analysis (Irwin 1994). d) Trial computations and back calculation of deflection data: After obtaining the calculated surface deflection basin from the input parameters, the method searches for 138
149 the set of layer moduli to match the calculated and measured deflection basin within some tolerance error. The primary criterion used to measure the performance of a back calculation program is how well the calculated basin matches the measured basin. In our use of MDCOMP, it used the Root-Mean-Square (RMS) error method in which RMS is the error between the measured and calculated deflection basin. An RMS error less than 3% was considered acceptable while 6% was considered a poor fit. e) Extract and store results in summary tables: Finally the results are extracted and stored in a summary table that shows the predicted moduli of each layer as well as the error. Resilient Modulus Resilient Modulus Poisson's Ratio Poisson's Ratio Material Range (psi) Typical (psi) Range Typical Portland Cement Concrete 3,000,000-6,000,000 4,000, Cement Treated Base 500,000-3,000,000 1,000, Lime Fly Ash Materials 500,000-2,500,000 1,000, Asphalt Cement 100,000-1,000, , Asphalt Treated Base* 100, , , Granular Bases 40, ,000 60, Stiff Clay 7,600-17,000 12, Medium Clay 4,700-12,300 8, Soft Clay 1,800-7,700 5, Very Soft Clay 1,000-5,700 3, (Huang, 1993; *FHWA, 1993) Table 4.7: Typical Modulus Poisson s Ratios for Pavement Materials 139


150 Figure 4.9 ODOT FWD (Dynatest FWD Model 8000) Figure 4.10 Loading Plate and Sensors as seen under the ODOT FWD Model

151 Figure 4.11 Typical Deflection Basin for Asphalt Pavement Subjected to FWD Testing Figure 4.12 Flow Chart of Typical Backcalculation Programs (Lytton 1989) 141
152 Results In this study, FWD tests were carried out longitudinally for Delaware County sections at a drop interval of 0.1 mile (along northbound and south bound lanes) and for Warren County pavement site at a drop interval of 0.03 mile (along westbound and eastbound lanes). For each site, the FWD drop tests were carried out in one pavement traffic direction first and then reversed in the other pavement traffic direction (with a stagger of half the drop interval). Across the pavement width, the drop locations were chosen to be along the outer wheel path of the pavement under test. At each drop location, three drop load levels of 6,000 lbf (27kN), 9,000 lbf (40kN) and 12,000 lbf (53.4kN) were carried out. Pre-reclamation FWD testing on existing pavements was carried out on July 10, 2006 and July 11, 2006 on Delaware and Warren County pavement sections, respectively (as shown in Figures 4.13 and 4.14). After the full depth reclamation of the pavement sections were completed (by August 15, 2006 for Warren County pavements and by October 5, 2006 for Delaware County pavement, the first post-construction FWD testing was carried out on Warren County sections on September 5, 2006 while on Delaware County sections it was carried out on October 26, Thereafter FWD testing was carried out for about 3 years till September 2009 for three times a year (in Spring, Summer, and Fall). Winter FWD testing was not carried out due to frozen pavement conditions and unfavorable weather. The Warren pavement sections (construction completed by August 15, 2006) were FWD monitored for about 3 years post-reclamation on the following dates by ODOT: July 11, 2006 (Pre-reclamation) September 5, 2006 (Fall 2006 soon after reclamation was completed) November 21, 2006 (Fall 2006 after several months of reclamation) April 17, 2007 (Spring 2007) July 3, 2007 (Summer 2007) October 16, 2007 (Fall 2007) April 8, 2008 (Spring 2008) July 22, 2008 (Summer 2008) September 16, 2008 (Fall 2008) April 14, 2009 (Spring 2009) July 14, 2009 (Summer 2009) September 22, 2009 (Fall 2009) The Delaware pavement sections (construction completed by October 5, 2006) were FWD monitored for about 3 years post-reclamation on the following dates by ODOT: July 10, 2006 (Pre-reclamation) October 26, 2006 (Fall 2006 soon after reclamation was completed) April 25, 2007 (Spring 2007) July 30, 2007 (Summer 2007) October 22, 2007 (Fall 2007) 142
153 April 9, 2008 (Spring 2008) July 21, 2008 (Summer 2008) September 25, 2008 (Fall 2008) April 13, 2009 (Spring 2009) July 13, 2009 (Summer 2009) September 21, 2009 (Fall 2009) For the FWD tests carried out at the pavement sites, Figure 4.15 and Figure 4.16 show deflections measured by the FWD tests under the loading plate for 12,000 lbf load drop for Westbound and Eastbound lanes, respectively. It can be seen that prior to reclamation (07/06), the deflections were quite large (ranging from 20 to 75 mils, 1 mil = inch). The average deflection of the pavement sections was about 45 mils. This large deflection of the unreclaimed pavement can be attributed to two adverse factors. First, the pavement itself was quite deteriorated with extensive cracking across its length and width. Secondly, the water table was quite high under the pavement since the pavement was originally constructed by dewatering a wetland area. Soon after reclamation was completed, FWD tests were carried out at three weeks after reclamation (09/06). It can be seen that deflections at 3 weeks after FDR for the control (mill and overlay) section ranged from about 15 to 35 mils with an average deflection of about 25 mils. It can be observed that for the control section the average deflection reduced from about 45 mils to 25 mils immediately after construction and after that for nearly 3 years of monitoring (till 09/09), the deflections of the control section remained similar with usual seasonal variations. For the fly ash & lime section, it can be observed that within three weeks of FDR work the average deflections reduced much more significantly (than control section) to about 15 mils. Following this as the fly ash & lime section cured, the deflection of this section further reduced with curing time. At 3 years of monitoring post FDR work (till 09/09), the deflections were less than about 10 mils. The fly ash & lime sections indicated a much greater reduction in deflection compared to control sections at all curing times. This indicates that the fly ash & lime section has greater stiffness compared to control section (in which the base layer was not reclaimed and only the top few inches of asphalt was replaced with new asphalt layer). For the FWD tests carried out at the pavement sites, Figure 4.17 and Figure 4.18 show deflections measured by the FWD tests under the loading plate for 12,000 lbf load drop for Northbound and Southbound lanes, respectively. It can be seen that prior to reclamation (07/06), the deflections were large (ranging from 15 to 45 mils, 1 mil = inch). The average deflection of the pavement sections was about 30 mils. This is about 2/3 rd of the pre-reclamation deflection of Warren County sections. This is because the subgrade under Delaware county pavements is stronger than that under Warren County pavements. Soon after reclamation was completed, FWD tests were carried out at three weeks after FDR (10/06). It can be seen that deflections at 3 weeks after reclamation for the control (mill and overlay) Section 4 reduced slightly but not significantly. It can be further observed that for up to 3 years of monitoring (till 09/09), the deflections of the control section remained similar with usual seasonal variations. Post-reclamation, the deflections for Section 1 (cement & emulsion) and Section 3 (LKD & emulsion) reduced only slightly while those for Section 2 (cement), Section 5 (fly ash & LKD), and Section 6 (fly ash & lime) reduced significantly. At 3 years of monitoring, fly ash containing 143
154 sections (Section 5 and 6) and cement only section (Section 2) exhibited minimum deflections indicating that they offer greater stiffness compared to sections containing emulsion (Section 1 and 3). Figure 4.19 summarizes the resilient modulus values for the FDR base layer (back-calculated using FWD field data using MODCOMP) for the Warren county pavement sections. It can be seen that control (mill and overlay) section exhibited very low (poor) resilient modulus values and shows no improvement with curing time after reclamation. The fly ash & lime section showed large post-construction increases in stiffness compared to pre-reclamation stiffness values. It can be seen from Figure 4.19 that there is a seasonal variation in the resilient modulus values. The lowest modulus values were obtained during Spring thaw (as expected) with highest moduli during Fall. The fly ash & LKD test section stiffness at about one year of service was very high (exceeded 1,600 ksi). By the second year, the resilient modulus value had dropped but was still above 800 ksi. By the end of the third year, the moduli had dropped to about 400 ksi, which is typical of soil cement. The drop in the resilient modulus values could be because of the saturated nature of the subgrade immediately below the Warren pavement sections. A review of the structural layer coefficients obtained from the resilient modulus values (Table 4.8) indicates that the structural layer coefficient of the fly ash & lime base layer post-reclamation ranges from 0.27 to 0.54 with an average of about 0.35 (which is considered good) while that for the control (mill and overlay) section is much lower (average of about 0.1 which is considered poor). Figure 4.20 shows the resilient modulus values of the FDR base layer for Delaware County pavement for six different test sections. It can be observed that the control (mill and fill) section indicated little or no increase in resilient modulus values as would be expected. The cement & emulsion and LKD & emulsion mixes were not very effective and their performance was much lower than the cement, fly ash & LKD, and fly ash & lime mixes. The cement & emulsion and LKD & emulsion resilient modulus values were much lower than those typically obtained for soil cement. The cement, fly ash & LKD, and fly ash & lime sections exhibited one to two year curing resilient modulus values comparable to open graded cement stabilized aggregates. The cement treatment resulted in a significant increase in resilient modulus within 3 weeks of construction and beyond this curing time the stiffness increase was slow. On the other hand, the fly ash & LKD and fly ash & lime test sections indicated slower shorter-term increase in stiffness but at the end of 36 months of monitored performance, the fly ash & LKD and fly ash & lime stabilized sections had performed similarly to the cement test section. Note that at the end of the 3 year monitoring program, the fly ash & lime section in Delaware county exhibited a much higher modulus value (about 1,300 ksi) compared with Warren pavements (400 ksi). This is attributed to the fact that the subgrade at Warren County site had a water table at or above the base layer while the water table under Delaware pavements was much deeper and the underlying soil had a higher stiffness. A review of the structural layer coefficients obtained from the resilient modulus values (Table 4.9) indicates that the post-reclamation structural coefficient for the a) fly ash & LKD section ranged from 0.35 to 0.45 with an average of about 0.37 (which is considered good), b) fly ash & lime section ranged 0.25 to 0.5 with an average of about 0.40 (which is considered good), c) cement only section ranged from 0.4 to 0.5 with an average of about
155 (which is considered good). It needs to be noted that the control (mill and overlay) section exhibited much lower structural coefficients for the base layer. Overall for the Warren and Delaware county pavement sites, FWD tests conducted up to 3 years after reclamation show that the cement, fly ash & LKD, and fly ash & lime sections exhibited resilient modulus values comparable to soil cement. Cement & emulsion as well as LKD & emulsion treatment did not provide adequate stabilization. The cement treatment resulted in a significant increase in resilient modulus within three weeks of the end of construction but beyond this curing time the stiffness increase was slow. Tests on the fly ash & LKD and fly ash & lime test sections indicated slower short-term increase in stiffness, but the two fly ash stabilized sections 3 years after construction exhibited average resilient modulus values of about 400 ksi to 1,300 ksi Pavement Instrumentation Response Section 4.2 summarizes the instrumentation installed in the pavement sections which included longitudinal and transverse train gauges at bottom of asphalt layer, pressure cell at bottom of stabilized base layer, pore pressure device (tensiometer) at bottom of stabilized base layer, and two LVDTs for measuring vertical deflections of the pavement under traffic loading. Measured observations were compared with values we obtained in previous APLF OCDO Project CDO/D (Wolfe, 2006). In that project, full-scale asphalt sections constructed of CCPs were subjected to repeated wheel loads. None of the CCP enriched asphalt sections failed. The APLF values mentioned in Figures 4.21 to 4.26 are the ranges measured in the APLF project without failure of the asphalt pavements. Figure 4.21 and Figure 4.22 show the longitudinal and transverse strain at bottom of the stabilized FDR layer (i.e. on top of unstabilized base/subgrade) for the six sections of the Delaware pavement. All the sections exhibited longitudinal and transverse strains lower than the maximum values observed in APLF testing. The control, cement & emulsion, and LKD & emulsion sections exhibited highest strains. For Delaware Section 5 stabilized with fly ash & LKD, Figure 4.23 shows the compression of the shallow LVDT for truck speeds of 15 mph and 45 mph. Decrease of speed from 45 to 15 mph increased the LVDT compression slightly but not significantly. However, the amount of compression for both speeds was lower than the maximum values observed in APLF project. Figure 4.24 exhibits similar results for the deep LVDT. The deep LVDT results show that the compression of the pavement (including the unstabilized base / subgrade layer below the FDR layer) is significant and exceeds the measurements on the APLF pavements (which were compacted in place as new construction) unlike these FDR pavements which still have the unstabilized base / subgrade layer below the FDR stabilized base layer. In order to evaluate how much the unstabilized base / subgrade layer compresses, the deep LVDT measurements were subtracted from the shallow LVDT measurement and the results are shown in Figure
156 Comparing this with Figure 4.23 shows that the upper FDR pavement section on loading compresses much less than the lower unstabilized base / subgrade layer as would be expected. The pressure of the stabilized FDR base layer on top of the unstabilized base / subgrade is shown in Figure 4.26 for fly ash & lime and fly ash & LKD sections. It can be seen that for the same speed (45mph) the fly ash & LKD section exhibit lower vertical stress on top of unstabilized layer. While the fly ash and lime section exhibits three times as much vertical stress as the other section, the magnitude of the vertical stress is within the range of working stresses measured for the APLF project in which none of the CCP asphalt sections failed. 146
 14 Warren")
157 Figure 4.13 Delaware FWD Testing on Existing Pavement (prior to reclamation) Figure 4.14 Warren FWD Testing on Existing Pavement (prior to reclamation) 147
158 Deflections in West Bound Lane - Warren County Site Location (miles from start) Section 2 Fly Ash & Lime Section 1 Control 10 Deflection (mils) /06 09/06 11/06 04/07 07/07 10/07 04/08 07/08 09/08 04/09 07/09 09/09 60 Figure 4.15 Warren County Deflections in West Bound Lane for FWD Testing 148
159 Deflections in East Bound Lane - Warren County Site Location (miles from start) Section 2 Fly Ash & Lime Section 1 Control 10 Deflection (mils) /06 09/06 11/06 04/07 07/07 10/07 04/08 07/08 09/08 04/09 07/09 09/ Figure 4.16 Warren County Deflections in East Bound Lane for FWD Testing 149
160 Deflections in North Bound Lane - Delaware Co. Site Location (miles form start) Section 1 Cement & Emulsion Section 2 Cement Section 3 LKD & Emulsion Section 4 Control Section 5 LKD & Fly Ash Section 6 Lime & Fly Ash Deflection (mils) /06 10/06 04/07 07/07 10/07 04/08 07/08 09/08 04/09 07/09 09/09 50 Figure 4.17 Delaware County Deflections in North Bound Lane for FWD Testing 150
161 Deflections in South Bound Lane - Delaware Co. Site Location (miles from start) Section 1 Cement & Emulsion Section 2 Cement Section 3 LKD & Emulsion Section 4 Control Section 5 LKD & Fly Ash Section 6 Lime & Fly Ash Deflection (mils) /06 10/06 04/07R 07/07 10/07R 04/08 07/08 09/08 04/09 50 Figure 4.18 Delaware County Deflections in South Bound Lane for FWD Testing 07/09 09/09 151
162 Elastic Modulus of base layer (ksi) Open graded cement stabilized aggregate Lime stabilized soils or unstabilized dense graded aggregate Soil cement 07/06 - Before FDR 09/06-3 Weeks after FDR 11/06-3 Months after FDR 04/07-8 Months after FDR 07/07-11 Months after FDR 10/07-14 Months after FDR 04/08-20 Months after FDR 07/08-23 Months after FDR 09/08-25 Months after FDR 04/09-32 Months after FDR 07/09-35 Months after FDR 09/09-37 Months after FDR 0 S2, fly ash and lime S1, control Section Figure 4.19 Warren County Resilient Modulus Results from FWD Testing 152
163 Elastic Modulus of base layer (ksi) /06 - Before FDR 10/06-3 Weeks after FDR 04/07-7 Months after FDR 07/07-10 Months after FDR 10/07-13 Months after FDR 04/08-19 Months after FDR 07/08-22 Months after FDR 09/08-24 Months after FDR 04/09-31 Months after FDR 07/09-34 Months after FDR 09/09-36 Months after FDR Open graded cement stabilized aggregate Soil cement Lime stabilized soils or unstabilized dense graded aggregate 0 S1, Cement + Emulsion S2, Cement S3, LKD + Emulsion S4, Control S5, LKD + fly ash S6, Lime + fly ash Section Figure 4.20 Delaware County Resilient Modulus Results from FWD Testing 153
164 Section 1 2 Mill & Fill Lime & Fly Ash Date MR (psi) ai MR (psi) ai 07/06 Before FDR 7, , /06 3 Weeks 4, , /06 3 months 24, , /07 8 months 16, , AASHTO: ai = 0.14*(MR/30,000) 1/3 07/07 11 months 10/07 14 months 04/08 20 months 07/08 23 months 09/08 25 months 04/09 32 months 07/09 35 months 09/09 37 months 4, , , ,742, , , , , , , , , , , , , Table 4.8: Structural Layer Coefficients for Warren County Pavement Sections 154
165 Section Cement & Emulsion Cement LKD & Emulsion Mill & Fill LKD & Fly Ash Lime & Fly Ash Date MR (psi) ai MR (psi) ai MR (psi) ai MR (psi) ai MR (psi) ai MR (psi) ai 07/06 Before FDR 10, , , , , , /06 3 Weeks 364, , , , , , /07 7 months 276, , , , , , /07 10 months 188, , , , , , /07 13 months 375, , , , , ,154, /08 19 months 272, , , , , , /08 22 months 187, , , , , , /08 24 months 309, ,232, , , , ,014, /09 31 months 134, , , , , , /09 34 months 193, ,125, , , , , /09 36 months 370, ,004, , , , ,289, AASHTO: ai = 0.14*(MR/30,000) 1/3 Table 4.9: Structural Layer Coefficients for Delaware County Pavement Sections 155
166 APLF maximum 65 microstain Station 1 - Cement & Emulsion Station 2 - Cement Station 3 - LKD & Emulsion Station 4 - Control Station 5 - LKD & Fly Ash Longitudinal Strain APLF minimum 40 microstain Station 6 - Lime & Fly Ash Time (10-2 sec) Figure 4.21 Longitudinal Strain Data at Delaware County (45 mph, December 2006) 156
167 APLF maximum 75 microstrain Station 1 - Cement & Emulsion Station 2 - Cement Station 3 - LKD & Emulsion Station 4 - Control Station 5 - LKD & Fly Ash Station 6 - Lime & Fly Ash Transverse Strain APLF minimum 65 microstrain Time (10-2 sec) Figure 4.22 Transverse Strain Data at Delaware County (45 mph, December 2006) 157
168 APLF maximum in mph 15 mph APLF minimum in Deflection (in) Time (10-2 seconds) Figure 4.23 Shallow LVDT Data at Delaware County (15 mph vs. 45 mph, December 2006) for Station 5 (LKD and Fly Ash) 158
169 APLF maximum in. 15 mph 45 mph Deflection (in) APLF minimum in Time (10-2 seconds) Figure 4.24 Deep LVDT Data at Delaware County (15 mph vs. 45 mph, December 2006) for Station 5 (LKD and Fly Ash) 159
170 Deflection (in) mph 15 mph Time (10-2 seconds) Figure 4.25 Compression of unreclaimed base/subgrade at Delaware County (15 mph vs. 45 mph, December 2006) for Station 5 (LKD and Fly Ash) 160
171 Range of stresses from APLF St. 5-5% LKD & 5% Fly Ash St. 6-4% Lime & 6% Fly Ash Vertical Stress (kpa) Time (10-2 sec) Figure 4.26 Pressure Cell Data at Delaware County (45 mph, December 2006) 161
172 4.4.3 Limitations The pavement instrumentation could only be installed at one location or site per test section. It is representative primarily of the pavement in its near vicinity. The measurements at a given instrumentation site are only representative of that particular location and may not be representative of the entire section. For this reason, in this project we did not depend primarily on the pavement instrumentation for our evaluating the performance of various sections built using FDR technology. Instead non-destructive Falling Weight Deflectometer (FWD) testing by ODOT by carried out at least three times a year for up to 3 years post FDR construction along the entire length of the test sections. The resilient modulus values back-calculated from the FWD data are representative of the test section under study and provide information for the mechanistic design of pavement structures. It also needs to be noted that the resilient modulus for a given pavement varies seasonally (with lowest values in Spring thaw and highest values in Fall). In this project we have FWD monitored the reclaimed pavement sections for up to 3 years post-construction. As can be seen in Figure 4.27, none of the sections have failed or indicating any signs of distress. Monitoring these sections for at least an additional 2 years is recommended so that a total of 5 years of FWD monitoring can be carried out to assess the long-term performance of the test sections constructed in this project. 162
")

173 Section 1: Cement + Emulsion Section 2: Cement Section 3: LKD + Emulsion Section 4: Control (Mill & Fill) Section 5: Fly Ash + LKD Section 6: Fly Ash + Lime Figure 4.27: Delaware County Pavement Test Sections in
174 4.5 Summary In this chapter, we presented the instrumentation and environmental as well as structural monitoring of Delaware and Warren County pavement test sections. Falling Weight Deflectometer (FWD) tests were conducted by ODOT before pavement reclamation and at regular intervals for up to 3 years after the reclamation of the pavements. Overall for the Warren and Delaware county pavement sites, FWD tests conducted up to 3 years after reclamation show that the cement, fly ash & LKD, and fly ash & lime sections exhibited resilient modulus values comparable to soil cement. Cement & emulsion as well as LKD & emulsion treatment did not provide adequate stabilization. The cement treatment resulted in a significant increase in resilient modulus within three weeks of the end of construction but beyond this curing time the stiffness increase was slow. Tests on the fly ash & LKD and fly ash & lime test sections indicated slower short-term increase in stiffness, but the two fly ash stabilized sections 3 years after construction exhibited average resilient modulus values of about 400 ksi to 1,300 ksi. Monitoring of the instrumentation installed in the pavement sections showed that the measured values for the FDR pavement were within the range of values we measured in the APLF OCDO Project in which none of the CCP asphalt pavement sections failed when tested to 20 years of equivalent highway traffic. In this project we did not depend primarily on the pavement instrumentation for our evaluating the performance of various sections built using FDR technology because the instrumentation at a site is only representative of that location and not the entire section it is located in. Instead non-destructive Falling Weight Deflectometer (FWD) testing by ODOT by carried out at least three times a year for up to 3 years postconstruction along the entire length of the test sections. The resilient modulus values backcalculated from the FWD data are representative of the test section under study and provide information for the mechanistic design of pavement structures. It also needs to be noted that the resilient modulus for a given pavement varies seasonally (with lowest values in Spring thaw and highest values in Fall). In this project we have monitored the reclaimed pavement sections for up to 3 years of FWD monitoring and none of the sections have failed or indicating any signs of distress. Monitoring these sections for at least an additional 2 years is recommended so that a total of 5 years of FWD monitoring can be carried out to assess the long-term performance of the fly ash sections. The environmental monitoring of the test sections at Delaware and Warren county sites revealed that all of the sections met both the US EPA s drinking water MCL and Ohio EPA s non-toxic criteria for As, Ba, Cr, Cu, Hg, Pb and Se. The results also show that when compared to the elemental compositions of the FDR base materials of each section, that just small amounts of each element are being leached from the FDR base layer. The percent difference between the solid phase of the FDR base material and liquid phase of the groundwater samples ranges between ~0.01% - 10%. The single direct comparison between a control section and fly ash & lime section for Warren County indicated that the critical metals that are relevant to the Ohio EPA and US EPA (As, Ba, Cd, Cr, Hg, Pb and Se) all were leached to an equivalent amount. Finally, it was found that a majority of the solids present within the samples consist of hydrates with Al, Fe, Mg and Mn. It is possible that these hydrates are having an effect on the leaching of 164
175 elements from the FDR base layer. Due to the difficulty to obtain water samples from many of the fly ash amended test sections, it is theorized that pozzolanic reactions are continuing to take place and thus decreasing porosity and permeability of the FDR base layers. It is also believed that certain sections (those containing fly ash) have a lower porosity and permeability than other sections (such as control sections) that have produced sufficient amounts of water to be analyzed. 165
176 CHAPTER 5 SUMMARY AND CONCLUSIONS Full depth reclamation (FDR) describes a maintenance process in which the complete depth of the flexible pavement section consisting of the asphalt layer, base, sub-base, and a predetermined amount of the underlying existing subgrade soil are uniformly pulverized, blended with chemical additives (Class F fly ash in combination with lime or lime kiln dust), and compacted to construct a new stabilized base course. An asphalt overlay is then placed over the stabilized base. The objective of this work is to demonstrate the effective use of Class F fly ash in combination with lime or lime kiln dust (LKD) in the full depth reclamation (FDR) of asphalt (flexible) pavements across the state of Ohio. Class F fly ash in itself is not a self-cementing pozzolan. It needs additional lime to undergo a pozzolanic reaction. Hence the need for lime-activated Class F fly ash as a chemical stabilizer for FDR work. It is important to note that fly ash when used in combination with lime or lime kiln dust performs two important functions in FDR work: 1. Fly ash provides the silica and alumina needed for pozzolanic reaction with lime to increase the strength, stiffness, and durability of the stabilized base layer. 2. Fly ash acts as a mineral filler to fill the voids in the granular pulverized pavement mix and hence reduces the permeability of the FDR stabilized base layer. In this study, The Ohio State University in collaboration with two of the fastest growing counties in Ohio, Delaware County & Warren County, designed, constructed, and monitored the performance of full-scale full depth reclamation (FDR) of failing pavements by incorporating lime-activated Class F fly ash. The goal of this research program was to establish field-verified relationships for the service performance, structural, and environmental behavior of FDR pavements constructed using limeactivated fly ash. The project objective and goal was accomplished in a work effort consisting of the laboratory testing and mix design, construction and monitoring of full-scale pavement sections, and outreach. Laboratory testing and strength-based mix design for the for Delaware and Warren County road sections was carried out. Engineering and environmental (chemical composition and leachate potential) properties were investigated in developing mixes in the laboratory that could be implemented at the two full-scale demonstration sites in collaboration with the respective County Engineer s offices. Class F fly ash from Zimmer Power Plant was studied as the CCP admixture for use in FDR construction of asphalt pavements. 166
177 For the Delaware county site, mix designs were carried out for the planned rehabilitation of five types of test sections located along 4 miles of Section Line Road in Delaware County, Ohio. The admixtures for FDR work utilized were cement & emulsion, cement, LKD & emulsion, fly ash & LKD, fly ash & lime and a control section of mill and overlay. The Warren county mix design was carried out for a fly ash & lime section with a control (mill and overlay) section for the planned rehabilitation of 0.37 miles of Long Spurling Road in Warren County, Ohio. Laboratory tests for measuring the engineering properties of the FDR mixes were carried out to develop a strength-based mix design to ensure structural stability of the pavement sections. This resulted in recommendations for the appropriate amount of admixtures to be used during each of the rehabilitation processes as well as construction recommendations. The laboratory leaching tests indicated that none of the leachate concentrations exceeded regulations. Both the SPLP and TCLP tests revealed that the leachate concentrations of As, Ba, Cd, Cr, Hg, Pb and Se were well below the standards set by the Ohio EPA s non-toxic criteria. The concentrations reported from the TCLP test were also well below the concentrations the US EPA has set for characterization of a hazardous material. It was noticed that the TCLP concentrations were generally slightly higher than the concentrations reported by the SPLP test, and the presence of acetate in the TCLP test offers a possible explanation for this trend. Furthermore, it was determined that after comparing the leachate concentration from both TCLP and SPLP to the environmental monitoring samples that one method was not clearly a better regulatory tool than the other. Two full-scale project demonstration sites were chosen in collaboration with the Warren and Delaware County Engineer s Offices. Warren County, near Cincinnati, Ohio, is the second fastest growing county in the state. The Long Spurling Road located in the northeastern part of the county was chosen by the Warren County Engineer's Office for FDR construction. The failing asphalt pavement was 0.37 miles in length, 20 to 21 feet in width with minimal shoulders with a 2-inch asphalt layer on top of 4 to 6 inches of chipsealed pavement. Two sections were constructed at this pavement site: 4-percent lime with 6-percent fly ash, 12-inch stabilization depth (0.28 mile) 5-inch mill and fill (0.09 mile) Delaware County (located 20 miles north of Columbus, Ohio, USA) is the fastest growing county in Ohio. In collaboration with the Delaware County Engineer's Office, a four mile long segment of Section Line Road was selected for FDR reconstruction in Roadway width was 20 feet with minimal shoulders. The asphalt surface thickness ranged from 5.25 to 14 inches (average of inches). The original pavement was underlain by a base course ranging from 1 to 11 inches (average of 5.18 inches) thick. Six types of sections were constructed using the following mixes: Cement & Emulsion: 2-percent cement with 1.6 gallons per square yard emulsion, 8- inch stabilization depth (0.42 mile) Cement Only: 5-percent cement, 12-inch stabilization depth (0.80 mile) 167
178 LKD & Emulsion: 3-percent lime kiln dust with 1.4 gallons per square yard emulsion, 8-inch stabilization depth (0.79 mile) Fly Ash & LKD: 5-percent lime kiln dust with 5-percent fly ash, 8-inch stabilization depth (0.62 mile) Fly Ash & Lime: 4-percent lime with 6-percent fly ash, 8-inch stabilization depth (0.62 mile) Controls: 5-inch mill and overlay (two 0.09-mile sections at the north and south ends of the project, and a 0.14 mile as well as 0.52 mile section near the middle of the project). Class F fly ash from Zimmer Power Plant was utilized in the construction of the Warren and Delaware county pavement sections. The construction work was carried out in Summer of 2006 by Base Construction / Strawser Paving with site QA/QC services provided by EDP Consultants under the respective supervision of the Warren County and Delaware County Engineer s Office. The major equipment used for the full depth reclamation (FDR) of the pavement sections was as follows: - Self-propelled reclaimer (Wirtgen WR 2500 machine) - Motor grader - Compactor (HAMM 2242 padfoot roller and HAMM 2420 smooth-drum vibratory compactor) - Calibrated bulk spreader - Water truck with spray bar The total amount of distance to be completed in one day (a segment) was decided to be approximately one-quarter of a mile. The first pulverization pass of the reclaimer was along the outer edge of the roadway. The next pulverization pass was back to the starting point of the segment along the opposite outer edge. Subsequent pulverization passes were inside the previous passes until the complete road width was pulverized once. Then using the same procedure for passes, the chemical stabilizers (fly ash, lime, lime kiln dust, etc.) were spread out and water added if need be. The final mixing pass again occurred in the same manner so as to produce a uniform pulverized mixture of existing pavement materials, chemical admixtures, and water. Following this, a motor grader shaped the reclaimed material in the segment. Initial compaction was then carried out by using a padfoot roller for the segment. Final compaction then followed with a smooth-drum vibratory compactor for the segment. After initial curing, a fog seal was applied to the constructed base course and cured for at least 5 days. After the curing period, the asphalt wearing surface was placed on top of the constructed base course. The roads were then opened to through traffic a few days after the final asphalt layer was placed. The pavements constructed were instrumented with structural and environmental monitoring devices. Falling Weight Deflectometer (FWD) tests were conducted by ODOT before pavement reclamation and at regular intervals after the FDR of the pavements for up to 3 years after reclamation. Overall for the Warren and Delaware county pavement sites, FWD tests conducted up to 3 years after reclamation show that the cement, fly ash & LKD, and fly ash & lime sections exhibited 168
179 resilient modulus values comparable to soil cement. Cement & emulsion as well as LKD & emulsion treatment did not provide adequate stabilization. The cement treatment resulted in a significant increase in resilient modulus within three weeks of the end of construction but beyond this curing time the stiffness increase was slow. Tests on the fly ash & LKD and fly ash & lime test sections indicated slower short-term increase in stiffness, but the two fly ash stabilized sections 3 years after construction exhibited average resilient modulus values of about 400 ksi to 1,300 ksi. Monitoring of the instrumentation installed in the pavement sections showed that the measured values for the FDR pavements were within the range of values we measured in the APLF OCDO Project in which none of the CCP asphalt pavement sections failed when tested to 20 years of equivalent highway traffic. In this project we did not depend primarily on the pavement instrumentation for our evaluating the performance of various sections built using FDR technology because the instrumentation at a site is only representative of that location and not the entire section it is located in. Instead non-destructive Falling Weight Deflectometer (FWD) testing by ODOT carried out at least three times a year for up to 3 years post FDR construction along the length of the test sections. The resilient modulus values back-calculated from the FWD data are representative of the test section under study and provide information for the mechanistic design of pavement structures. It also needs to be noted that the resilient modulus for a given pavement varies seasonally (with lowest values in Spring thaw and highest values in Fall). In this project we FWD monitored the reclaimed pavement sections for up to 3 years after construction and none of the sections have failed or indicating any signs of distress. Monitoring these sections for at least an additional 2 years is recommended so that a total of 5 years of FWD monitoring can be carried out to assess the long-term performance of the test sections constructed. The environmental monitoring of the test sections at Delaware and Warren county sites revealed that all of the sections met both the US EPA s drinking water MCL and Ohio EPA s non-toxic criteria for As, Ba, Cr, Cu, Hg, Pb and Se. The results also show that when compared to the elemental compositions of the FDR base materials of each section, that just small amounts of each element are being leached from the FDR base layer. The percent difference between the solid phase of the FDR base material and liquid phase of the groundwater samples ranges between ~0.01% - 10%. The single direct comparison between a control section and fly ash & lime section for Warren County indicated that the critical metals that are relevant to the Ohio EPA and US EPA (As, Ba, Cd, Cr, Hg, Pb and Se) all were leached to an equivalent amount. Finally, it was found that a majority of the solids present within the samples consist of hydrates with Al, Fe, Mg and Mn. It is possible that these hydrates are having an effect on the leaching of elements from the FDR base layer. Due to the difficulty to obtain water samples from many of the fly ash amended test sections, it is theorized that pozzolanic reactions are continuing to take place and thus decreasing porosity and permeability of the FDR base layers. It is also believed that certain sections (those containing fly ash) have a lower porosity and permeability than other sections (such as control sections) that have produced sufficient amounts of water to be analyzed. The work presented in this report promotes the use of Ohio coal by providing a positive revenue stream for the large quantities of non-concrete quality fly ash generated from the combustion of coal and currently landfilled in the state. The end users of this technology can reap significant 169
180 cost saving (50% or more) as compared to expensive complete reconstruction of the road section. The procedure is environmentally sound since it recycles existing pavement materials without the need for additional virgin materials in constructing a new road. The replacement of cement with fly ash in FDR work further reduces significantly the CO 2 emissions associated with the use of cement (one ton of fly ash replacing cement will reduce about one ton of CO 2 emissions). A very important contribution of this technology will be the rehabilitation of the decaying road infrastructure in the state thus providing an impetus for economic development by providing for safe and secure means of road transportation of goods and people. 170
181 REFERENCES Agdun-Nur, E.A. (1961), Fly Ash in Concrete An Evaluation, Highway Research Board Bulletin 284, Highway Research Board, National Research Council, Washington, DC. Ahlberg, Harold L. and Ernest J. Barenberg. Pozzolanic Pavements. University of Illinois, Engineering Experiment Station, Bulletin 473, Urbana, Illinois, February, Amaya, P.J., Boiler Slag and Bottom Ash in Asphalt Concrete, Proceedings of the 12th International Symposium on Management and Use of Coal Combustion By-Products. Electric Power Research Institute, Report No. TR , Volume 1, Palo Alto, California, January, 1997b. American Association of State Highway and Transportation Officials Guide specifications for a highway construction. Seventh edition, Washington DC. American Association of State Highway and Transportation Officials (AASHTO), AASHTO, Guide for Design of Pavement Structures, American Association of State Highway and Transportation Officials (AASHTO), AASHTO, Guide for Design of Pavement Structures, Volume 2, American Association of State Highway and Transportation Officials (AASHTO), Standard Specifications for Transportation Materials and Methods of Sampling and Testing, 19 th Edition, Part I: Specifications, Part II: Tests, AASHTO, 1998a. American Association of State Highway and Transportation Officials (AASHTO), Supplement to the AASHTO Design Guide of Pavement Structures, 1998b. American Association of State Highway and Transportation Officials (AASHTO), Guide Specifications for Highway Construction, 1998c. American Association of State Highway and Transportation Officials, AASHTO/AGC/ARTBA Guide Specification for Pozzolanic Stabilized Mixture (PSM) Base Course or Subbase. American Association of State Highway and Transportation Officials, Washington, DC, 1988d. American Association of State Highway and Transportation Officials, AASHTO/AGC/ARTBA Guidelines and Guide Specification for Using Pozzolanic Stabilized Mixture (Base Course or Subbase) and Fly Ash for In-Place Subgrade Soil Modification, ASSHTO- AGC-ARTBA Joint Committee, Subcommittee on New Highway Materials, Task Force 28 Report, 1990a. American Coal Ash Association, Flexible Pavement Manual, Technical Manual, American Coal Ash Association, American Coal Ash Association, Soil and Pavement Base Stabilization with Self-Cementing Coal Fly Ash, American Coal Ash Association, May American Road and Transportation Builders Association, Materials for Stabilization. American Road and Transportation Builders Association, Washington, DC, American Society for Testing and Materials Annul book of ASTM standards, Volume road and paving materials; Vehicle-pavement system. West Conshohocken, Pennsylvania. American Society for Testing and Materials, Annual Book of ASTM Standards, American Society for Testing and Materials, West Conshohocken, Pennsylvania,
182 An Overview of Recycling and Reclamation Methods for Asphalt Pavements; Asphalt Recycling and Reclaiming Association, ARRA, Basic Asphalt Recycling Maual (BARM), Asphalt Recycling and Reclaiming Association & Federal Highway Administration, ARRA, undated, Full Depth Reclamation: A Century of Advancement for the New Millennium, Asphalt Recycling and Reclaiming Association. Asphalt Institute A Basic Asphalt Emulsion Manual. Manual Series No. 19 (MS-21), Second Edition, Lexington, Kentucky, Asphalt Institute, Basic Asphalt Emulsion Manual. Asphalt Institute, Manual Series No. 19, Lexington, Kentucky. Asphalt Recycling and Reclaiming Association and overview of recycling and to reclamation methods for asphalt paving rehabilitation. Brochure, Annapolis, Maryland, Asphalt Recycling and Reclaiming Association Full Depth Reclamation Around the World. brochure, Annapolis, Maryland. Asphalt Recycling and Reclaiming Association Guideline Specifications for Full Depth Reclamation. Annapolis, Maryland. Asphalt Recycling and Reclaiming Association Technical discipline, Cold planing, Hot Recycling, Hot in-place recycling, cold in-place recycling, full depth reclamation. ASTM Designation: D , "Standard Guide for Calculating In Situ Equivalent Elastic Moduli of Pavement Materials Using Layered Elastic Theory", Annual Book of ASTM Standards, 2000, pp Barenberg, Ernest J. and Marshall R. Thompson. Lime-Fly Ash Stabilized Bases and Subbases. National Cooperative Highway Research Program Synthesis of Highway Practice No. 37, Transportation Research Board, Washington, DC, Barenberg, Ernest J. Design and Construction of LFA Pavement from Route 195 in Coffeen, Illinois to CIPS Plant. Report submitted to Central Illinois Public Service Company, Champaign, Illinois, September, Beeghly, J., Recent Experiences with Lime-Fly Ash Stabilization of Pavement Subgrade Soils, Base, and Recycled Asphalt, 2003 International Ash Utilization Symposium, Center for Applied Energy Research, University of Kentucky, Paper #46, Bergeron, G. The Performance of Full-depth Reclamation and Cold In-place Recycling Techniques in Quebec; Proceeding Paper Annual Conference of the Transportation Association of Canada, Calgary, Alberta. Berry, W.H., D.H. Gray, and E. Tons. Use of Coal Ash in Highway Construction: Michigan Demonstration Project. Electric Power Research Institute, Report No. GS-6155, Palo Alto, California, January, Berthelot, C., and Gerbrandt, R., Full-Depth In-Place Recycling and Road Strengthening Systems for Low-Volume Roads: Highway No. 19 Case Study, Transportation Research Record, 1819, pp Better roads Pre-project evaluation aides reclamation. July, Bomag, A United Dominion Company Cold In-Place Recycling. Kewanee, Illinois, Brendel, G. F. and P. E. Glogowski. Ash Utilization in Highways: Pennsylvania Demonstration Project. Electric Power Research Institute, Report No. GS-6431, Palo Alto, California, 172
183 Butalia, T., Wolfe, W. Market opportunities for utilization of Ohio flue gas desulfurization and other coal combustion products; Vol. 2; Technical report; OCDO Grant CDO/R-96-26; The Ohio State University: Columbus, OH, Caterpillar Paving Products Inc. Full Depth Reclamation Manual. Minneapolis, Minnesota, Chapman, J. Stress Model Verification with Reclaimed Asphalt Pavement; Master s Thesis, The Ohio State University, Cheng, C., Hwang, Y., Lenhart, J.J., Walker, H.W. Organic Ligands Influence Leaching Kinetics of Fixated FGD Material; Fuel, Submitted: 3/12/2008. CMI Corporation A Practical Guide to Soil Stabilization & Road Reclamation Techniques. Oklahoma City, Oklahoma, Collins, R.J. and S.K. Ciesielski. Recycling and Use of Waste Materials and Byproducts in Highway Construction, Volumes 1 & 2, National Academy Press, 1993 (Transportation Research Board, National Research Council, Research sponsored by AASHTO in cooperation with FHWA) Collins, R.J., Base Course Construction Using Fly Ash, Seventh Annual International Pittsburgh Coal Conference, Pittsburgh, PA, October, 1990 Conference, Pittsburgh, PA, October, CONSOL Energy News, 1999, CONSOL Energy Produces Aggregates from Coal Combustion By-Products: Product From Pilot Plant Performs Well in Tests, Press release issued on September 2, Crawley, Alfred B. An Evaluation of the Use of Power Plant Pond Ash in Highway Construction. Mississippi State Highway Department, Report No. MSHD-RD , Jackson, Mississippi, February, Cross, S.A. and Fager, G.A., Fly Ash in Cold Recycled Bituminous Pavements, Transportation Research Record, 1486, pp Culley, R. W. and O. H. Smail. Performance of Waste Coat Ash as Highway Subbase Course, Proceedings of the Fifth International Ash Utilization Symposium, U.S. Department of Energy, Report No. METC/SP-79/10, Part 2, Morgantown, West Virginia, Daniels, J.L. and Das, G.P. Leaching Behavior of Lime-Fly Ash Mixtures; Environmental Engineering Science, 23, 1, 2006, DeStazio, T.D., Full Depth Reclamation Improves City and County Roads, Something Old, Something New ( Dick, W. (2006) Flue gas desulfurization (FGD) product as a soil amendment for mine reclamation. The Ohio State University, School of Environment and Natural Resources, Wooster, Ohio. Dick, W., J. Bigham, L. Forster, F. Hitzhusen, R. Lal, R. Stehouwer, S. Traina and W. Wolfe, R. Haefner, G. Rowe, 1998, Land Application Uses of Dry FGD By-Product: Phase 3 Report, The Ohio State University. EDP Consultants, Mix Design: Warren County Long Spurling Road, EDP#05108G, July 2006a. EDP Consultants, Mix Design: Delaware County Section Line Road, EDP#05107G, September 2006b. EDP Consultants, Construction Monitoring: Warren County Long Spurling Road, EDP#05108C, September 2006c. 173
184 EDP Consultants, Construction Monitoring: Delaware County Section Line Road, EDP#05107C, October 2006d. Emery J, Asphalt concrete recycling in Canada. Transportation Research Record 1427, TRB, National Research Council, Washington DC, Environmental Protection Agency. Toxicity Characteristic ; (accessed Mar. 8, 2008). Favretti, P. Resistance to Freeze-Thaw Cycles of Some Asphalt Cold Mixtures, Proceedings, Canadian Technical Asphalt Association, Favretti, P. et al. Deep Cold In-Place Recycling with Cement/Emulsion. Proceedings, Canadian Technical Asphalt Association, Federal Highway Administration (FHWA), User Guidelines for Waste and Byproduct Materials in Pavement Construction, Turner-Fairbank Highway Research Center, FHWA-RD , Federal Highway Administration (FHWA), Notice N , Use of Fly Ash in Portland Cement Concrete and Stabilized Base Construction, January 17, Federal Highway Administration and American Coal Ash Association, Fly Ash Facts for Highway Engineers, FHWA-SA , Federal Highway Administration Recycled Materials in European Highway Environments: Use, Technologies, and Policies, International Technology Exchange Program, U.S. Department of Transportation, Federal Highway Administration, 1993, Engineering and Environmental Aspects of Recycled Materials for Highway Construction, 1993, Volume I: Final Report. FHWA Contract No. DTFH61-92-C Federal Highway Administration, 1994, The Use of Recycled Materials in Highway Construction, Robin L. Schroeder Federal Highway Administration, 1997, User Guidelines for Waste and Byproduct Materials in Pavement Construction, Turner-Fairbank Highway Research Center, FHWA-RD Federal Highway Administration, Soil Stabilization in Pavement Structures. A User's Manual. Volumes 1 and 2. Federal Highway Administration, Report No. FHWA-IP-80-2, Washington, DC, Ferguson, G. Use of Coal Ash in Highway Construction: Kansas Highway Demonstration Project. Electric Power Research Institute, Report No. GS-6460, Palo Alto, California, September, Ferguson, Glenn. "Use of Self-Cementing Fly Ashes as a Soil Stabilization Agent," Fly Ash for Soil Improvement. American Society for Civil Engineers, Geotechnical Special Publication No. 36, New York, New York, FHWA (1997). User Guidelines for Waste and Byproduct Materials in Pavement Construction, Turner-Fairbank Highway Research Center, FHWA-RD FHWA, Techniques for Pavement Rehabilitation, Participants Manual for Training Course, National Highway Institute, Washington, DC, FHWA, Design Pamphlet for the Backcalculation of Pavement Layer Moduli in Support of the 1993 AASHTO Guide for the Design of Pavement Structures, Report No: FHWA-RD , Final Report, Sept
185 FHWA, Long Term Pavement Performance: Back-Calculation of Layer Parameters for LTPP Test Sections, Volume II: Layered Elastic Analysis for Flexible and Rigid Pavements, Report No: FHWA-RD , Final Report, Oct Furrer, G., Stumm, W. The coordination chemistry of weathering: I. Dissolution kinetics of δ- Al 2 O 3 and BeO; Geochim. Cosmoch. Acta, 50, 1986, Guideline Specification for Hot In-Place Recycling; Asphalt Recycling and Reclaiming Association, Halstead, Woodrow J. (1986). Use of Fly Ash in Concrete, National Cooperative Highway Research Program Synthesis of Highway Practice No. 127, Transportation Research Board, Washington, DC. Harrison, R. M. and S. J. Wilson, Chemical Composition of Highway Drainage Waters. I. Major Ions and Selected Trace Metals, Science of the Total Environment, 43(1-2), 63-77, Heath, A., Theyse, H., and Lea, J., Use of Ash in Low-Volume Road Construction in South Africa, Transportation Research Record, v.1, n. 1652, pp , Hidber, P.C., Graule, T.J., Gauckler, L.J. Citric acid- A dispersant for aqueous alumina suspensions; Journal of American Chemical Society, 79, 1996, Hoffman, Gary L., Gaylord Cumberledge, and Amar C. Bhajandas. Establishing a Construction Cutoff Date for Placement of Aggregate-Lime-Pozzolan. Pennsylvania Department of Transportation, Research Report, Huang, Yang H., Pavement Analysis and Design, Prentice Hall, New Jersey, Huffman J E. Update on asphalt recycling, reclamation. Better Roads, October, Huffman, J.E. Full Depth Pavement Reclamation: State-of-the-Practice. Journal Association of Asphalt Paving Technologists, Volume 66, Salt Lake City, Utah, Huffman, J.E. Restoring distress roads FDR can be a valuable rehab technique for cracked pavements. Asphalt Contractor, December, Hunt, Robert D., Larry E. Seiter, Robert J. Collins, Richard H. Miller, and Benjamin S. Brindley. Data Collection and Analysis Pertinent to EPA's Development of Guidelines for Procurement of Highway Construction Products Containing Recovered Materials. Final Report, EPA Contract No , Washington, DC, Hur, J., Schlautman, M.A., Yim, S. Effects of organic ligands and ph on the leaching of copper from brake wear debris in model environmental solutions; Journal of Environmental Monitoring, 6, 2004, Imtiaz Ahmed. Use of Waste Materials in Highway Construction, Report No. FHWA/IN/JHRP- 91/3, Irwin, L.H., communication, Cornell University, Local Roads Program, November Irwin, Lynne (1994). Instructional Guide for Back-Calculation and the Use of MODCOMP3 Version 3.6, Cornell University Local Roads Program, CLRP Publications No Kandhal, P.S. and Mallick, R.B. Pavement Guidelines for State and Local Governments Participant s Reference Book; FHWA-SA ; (accessed Mar. 5, 2008). Kandhal, P.S. and R.B. Mallick Pavement Recycling Guidelines for State and Local Governments. Publication No. FHWA-SA , FHWA, U.S. Department of Transportation, Washington, DC,
186 Kearney, E. and J. Huffman Full-Depth Reclamation Process. Transportation Research Record 1684 TRB, National Research Council, Washington, DC, Kim, A.G. CCB Leaching Summary: Survey of Methods and Results. April Kosson, D.S., van der Sloot, H.A., Sanchez, F., and A.C. Garrabrants (2002) An integrated framework for evaluating leaching in waste management and utilization of secondary materials. Environmental Engineering Science, 19(3): Kost, D.A., Bigham, J.M., Stehouwer, R.C., Beeghly, J.H., Fowler, R., Traina, S.J., Wolfe, W.E., and W.A. Dick (2005) Chemical and physical properties of dry flue gas desulfurization products. Journal of Environmental Quality, 34: Lackovic, K., Johnson, B.B., Angove, M.J., Wells, J.D. Modeling the adsorption of citric acid onto Muloorina illite and related clay minerals; Journal of Colloid Interface Science, 267, 2003, Larrimore, L. and C.W. Pike. Use of Coal Ash in Highway Construction: Georgia Highway Demonstration Project. Electric Power Research Institute, Report No. GS-6175, Palo Alto, California, February, Lewis, AJN and Collings, DC. Cold In Place Recycling: A Relevant Process for Road Rehabilitation and Upgrading; 7th Conference on Asphalt Pavements for Southern Africa, CAPSA, Loudon A.A. & Partners Comparison of Stabilizing Agents Using the Deep Cold In-Place Recycling Process, Kloof, South Africa, undated. Loudon A.A. & Partners Cold Deep In Place Recycling, Technical Recommendations and Application Specifications. Kloof, South Africa, Lytton, R. L., Backcalculation of Pavement Layer Properties, Nondestructive Testing of Pavements and Backalculation of Moduli, ASTM STP 1026, American Society for Testing and Materials, Philadelphia, 1989, pp Mack J. State DOTs update life-cycle cost analysis. Better Roads, July, Mackos, Ryan, Environmental Analysis of Full Depth Reclamation Using Coal Combustion By- Products, MS Thesis, The Ohio State University, 2008 Mallick, R.B., et al., Development of a Rational and Practical Mix Design System for Full Depth Reclaimed (FDR) Mixes, Final Technical Report to University of New Hampshire s Recycled Materials Resource Center, November Mallick, R.B., et al., Evaluation of Performance of Full-Depth Reclamation Mixes, Transportation Research Record, 1809, pp Mallick, R.B., et al., Laboratory Study of Full-Depth Reclamation Mixes, Transportation Research Record, 1813, pp Method 1310b: Extraction Procedure (EP) Toxicity Test Method and Structural Integrity Test; (accessed Mar. 10, 2008). Method 1311: Toxicity Characteristic Leaching Procedure; (accessed Feb. 8, 2007). Method 1312: Synthetic Precipitation Leaching Procedure; (accessed Feb. 8, 2007). Method 3051a: Microwave Assisted Acid Digestion of Sediments, Sludges, Soils and Oils; (accessed May 22, 2008). 176
187 Method 3052: Microwave Assisted Acid Digestion of Siliceous and Organically Based Matrices; (accessed May 22, 2008). Meyers, J. F., Fly-ash as construction material for highways: A manual, FHWA, 1976 Meyers, James F., Raman Pichumani and Bernadette S. Kapples. Fly Ash. A Highway Construction Material. Federal Highway Administration, Report No. FHWA-IP-76-16, Washington, DC, Mohapatra, D., Singh, P., Zhang, W., Pullammanappallil, P. The effect of citrate, oxalate, acetate, silicate and phosphate on stability of synthetic arsenic-loaded ferrihydrite and Alferrihydrite; Journal of Hazardous Materials B124, 2005, Moulton, Lyle K., Roger K. Seals, and David A. Anderson. Utilization of Ash from Coal Burning Power Plants in Highway Construction, Transportation Research Record No. 430, Transportation Research Board, Washington, DC, Ohio Environmental Protection Agency (1997) Management Directive: Division of Labor Regarding Traditional Waste Management Practices and Alternative Waste Disposal Practices, Memorandum for Chiefs of Division of Surface Water and Division of Solid and Infectious Waste Management. Ohio Environmental Protection Agency. Beneficial Use of Nontoxic Bottom Ash, Fly Ash and Spent Foundry Sand, and Other Exempt Waste; Division of Surface Water, Removed April 30, 2003; (accessed February 3, 2008). Portland Cement Association, Soil-Cement Construction Handbook. Portland Cement Association, Skokie, Illinois, Portland Cement Association. Cement-Treated Aggregate Base. Report No. SR221.01S, Skokie, Illinois, Portland Cement Association. Soil-Cement Laboratory Handbook. PCA, Skokie, Illinois, Properties of Dry FGD By-Products, Ninth Annual International Pittsburgh Coal Raza H. An overview of surface rehabilitation techniques for asphalt pavements, instructors guide. Publication No. FHWA-SA , FHWA, U.S. Department of Transportation, Washington DC, Romanoschi, S., Accelerated Testing for Studying Pavement Design and Performance (FY 2002), Final Report, FWHA-KS-03-8, August Rosenmerkel, James (2007). Waukesha County Airport / Crites Field Waukesha, Wisconsin a Case Study, Case Study 15, Full Depth Reclamation, USEPA. Smith, C. L. "Case Histories in Full Scale Utilization of Fly Ash - Fixated FGD Sludge." Proceedings of the Ninth International Ash Utilization Symposium. Electric Power Research Institute, Report No. GS-7162, Volume II, Palo Alto, California, January, Smith, Charles L. "FGD Waste Engineering Properties are Controlled by Disposal Stehouwer, R., Dick, W., Bigham, J., Forster, L., Hitzhusen, F., McCoy, E., Traina, S. and Wolfe, W.E., Haefner, R., 1995, Land Application Uses for Dry FGD By-Products: Phase 1 Report, Electric Power Research Institute, EPRI TR Stehouwer, R., Dick, W., Bigham, J., Forster, L., Hitzhusen, F., McCoy, E., Traina, S., Wolfe, W., Haefner, R., and Rowe, G. (1996) Land application and uses for dry FGD byproducts, phase II report: Columbus, Ohio, The Ohio State University, 302 p. 177
188 Stehouwer, R., W. Dick, J. Bigham, L. Forster, F. Hitzhusen, E. McCoy, S. Traina and W. Wolfe, Haefner, R., Rowe, G., Land Application Uses of Dry FGD By-Products: Phase 2 Report. Electric Power Research Institute, Report # EPRI TR Stewart, B.R, and Kalyoncu, R.S., 1999, Materials Flow in the Production and Use of Coal Combustion Products, 1999 International Ash Utilization Symposium, Lexington, Kentucky, October 18-20, Strategic Highway Research Program, National Research Council Distress identification manual for the long-term pavement performance studies. Publication No. SHRP-LTPP/FR , Washington DC, Stumm, W. Chemistry of the Solid-Water Interface; New York, John Wiley and Sons, Inc., Sullivan J. Pavement recycling executive summary and report. Publication No. FHWA-SA , U.S. Department of Transportation, FHWA, Washington DC, Theriault, Y. Some Laboratory and Field Investigations on Combining Lime or Cement with Foamed Asphalt. Proceedings, Canadian Technical Asphalt Association, Subsequent discussions Proceedings, Canadian Technical Asphalt Association, Thornton, Samuel I. and David G. Parker. Construction Procedures Using Self-Hardening Fly Ash. Federal Highway Administration, Report No. FHWA/AR/80, 004, Washington, DC, Timms, A.G., and Grieb W.E. (1956). Use of Fly Ash in Concrete, Proceedings, Vol. 56, American Society for Testing and Materials, Washington, DC, pp , Togni, Carl, Highway and Related Civil Engineering Use of Coal Combustion Products, Tu, Wei, Evaluation of Full-Scale CCP Pavement Performance using Accelerated Loading Facility, Master s Thesis, Ohio State University, Columbus, Ohio, Turner, R.P., 1976, Status Report on Aggregate-Lime-Fly Ash Base, Ohio Department of Transportation, Columbus, Ohio, August U.S. Department of Transportation, Federal Highway Administration Pavement Recycling Guidelines for Local Governments Reference Manual. Report No. FHWA-SA , Washington, DC, U.S. Department of Transportation, Federal Highway Administration Pavement Maintenance Effectiveness / Innovative Materials Workshop, Participants Handbook, Report No. FHWA-SA , Washington, DC, U.S. Environmental Protection Agency, 1988, Wastes from the Combustion of Coal by Electric Utility Power Plants, Report to Congress, EPA 530-SW , February U.S. Environmental Protection Agency, 1993, Large-Volume Wastes From Coal-Fired Electric Utilities Exempted as Hazardous Wastes, Environmental Fact Sheet, EPA 530-F , August Usmen, M. A. A Critical Review of the Applicability of Conventional Test Methods and Materials Specifications to the Use of Coal-Associated Wastes in Pavement Construction. Ph.D. Dissertation, West Virginia University, Morgantown, West Virginia, Water Quality Standards Program; (accessed Apr. 25, 2008). Wen, H., Tharaniyil, M.P., and Ramme. B., Investigation of Performance of Asphalt Pavement with Fly-Ash Stabilized Cold In-Place Recycled Base Course, Transportation Research Record, 1819, pp
189 Wen, H., Tharniyil, M.P., Ramme, B., Krebs,S. Field performance evaluation of class C fly ash in full-depth reclamation: Case history study; Transportation research record, 2004, Wirtgen GmbH Cold- In-Place Recycling Including Base Rehabilitation, An Economic and Environmentally Friendly Construction Process, brochure, Germany, Wirtgen GmbH Laboratory-scale foamed bitumen plant WLB 10, brochure, Germany, Wirtgen GmbH Wirtgen Cold Recycling Manual. Germany, Wirtgen GmbH Wirtgen Cold Recycling, The method, the equipment and its application. brochure, Germany, Wise, P.W. In Place Full Depth cold Flexible Pavement Reclamation. Conexpo/Con-Agg, Las Vegas, Nevada, Wolfe, W.E, and Beeghly, J.H., 1993, Truck Ramp Construction From Clean Coal Technology Waste Products, Symposium on Recovery and Effective Reuse of Discarded Materials and By-Products for Construction of Highway Facilities, Denver, Colorado, October. Wolfe, W.E. and Cline, J.H., "A Field Demonstration of the Use of Wet and Dry Scrubber Sludges in Engineered Structures," Proceedings, Eleventh American Coal Ash Association Symposium, Orlando, FL, January, Wolfe, W.E., et al., 2006, Full-Scale Testing of Coal Combustion Product Pavement Sections Subjected to Repeated Wheel Loads, Technical Report: OCDO Project CDO/D-00-5, The Ohio State University. Zaniewski, J.P., M.S. Mamlouk Pavement Maintenance Effectiveness - Preventive Maintenance Treatments. Participant's Handbook. Report No: FHWA-SA , Federal Highway Administration, Washington, DC, Zimmer, Frank V. "Fly Ash as a Bituminous Filler," Proceedings of the Second Ash Utilization Symposium. U.S. Bureau of Mines, Information Circular No. 8488, Pittsburgh, Pennsylvania,
190 FINAL PROEJCT BUDGET Ohio Coal Development Office $ 684,026 The Ohio State University $487,310 Industry $1,184,954 Total Project Cost $2,356,290 OCDO funds expended by budget line item are: Salaries and Wages $224,731 Fringe Benefits $36,987 Other Direct Costs $1,007 Materials and Supplies $37,270 Domestic Travel $9,674 Purchased Services $4,910 Subcontracts - F&A $25,000 Subcontracts - No F&A $176,355 F&A $168,092 Total OCDO $684,
191 APPENDICES Appendix A: Construction Costs Appendix B: Papers Presented/Published & Outreach Publicity Articles Appendix C: Warren County Instrumentation Photos Appendix D: Delaware County Instrumentation Photos Appendix E: Environmental Monitoring Data 181
192 Appendix A: Construction Costs 182
193 Delaware County Pavement FDR Costs 183
194 Warren County Pavement FDR Costs 184
195 Appendix B: Papers Presented/Published & Outreach Publicity Articles Papers Presented/Published 1. Tu, W., Zand, B., Wolfe, W. E., and Butalia, T. S., Full-Scale Accelerated Testing of Flexible Pavements Constructed of Coal Combustion Products, 85th TRB (Transportation Research Board) Annual Meeting at Washington DC, January 22 26, 2006 (accepted for publication in the 2006 Journal of the Transportation Research Board) 2. Tu, W., Zand, B., Wolfe, W. E., and Butalia, T., Full-Scale Accelerated Testing of Flexible Pavements Made of Coal Combustion Products, Transportation Research Record, No. 1952, pp , Butalia, T.S., Tu, W., Zand, B., Wolfe, W.E., Accelerated Load Testing of Full-Scale Flexible Pavements Constructed of CCPs under Adverse Environmental Conditions, World of Coal Ash, Covington, Kentucky, May 7-10, Chapman, J., Wolfe, W.E., Butalia, T.S., Zand, B., Tu, W., Full Depth Reclamation of Asphalt Pavements Using Class F Fly Ash, World of Coal Ash, Covington, Kentucky, May 7-10, Tarunjit Butalia, William Wolfe, Reclamation of Asphalt Pavements Using Fly Ash, 32 nd International Technical Conference on Coal Utilization and Fuel Systems, Clearwater, Florida, June 10 15, Tarunjit Butalia, William Wolfe, Full Scale Testing of CCP Pavement Sections Subjected to Repeated Wheel Loads, 24 th Annual International Pittsburgh Coal Conference, Johannesburg, South Africa, September 10-14, William Wolfe, Tarunjit Butalia, Full Depth Reclamation of Asphalt Pavements using Lime Activated Class F Fly Ash, Ohio Transportation Engineering Conference, Columbus, Ohio, October 23-24, Tarunjit Butalia, Dave Goss, Accelerated Load Testing of Full Scale Asphalt and Concrete Pavements Constructed of CCPs, 2007 Geological Society of America Meeting and Exposition, Denver, Colorado, October 28-31, William Wolfe, Tarunjit Butalia, Class F Fly Ash for Full Depth Reclamation, 2008 AEMA-ARRA-ISSA Joint Annual Meeting, San Jose del Cabo, Mexico, February 19-23, Tarunjit S. Butalia, William E. Wolfe, Full Depth Reclamation of Pavements Using Coal Combustion By-products, 10th International Conference on Application of Advanced Technologies in Transportation, Athens, Greece, May 27 31, Wolfe, W., Butalia, T., Walker, W., Semach, A., Howdyshell, J., Full Depth Reclamation (FDR) of Asphalt Pavements Using Lime Activated Class F Fly Ash, 62nd Annual Ohio Transportation Engineering Conference, October 28-29, 2008, Columbus, Ohio 12. Cheng, C., Taerakul, P., Butalia, T., Wolfe, W., Walker, H., Tu, W., Zand, B., Surface runoff from full-scale coal combustion product pavements during accelerated loading, ASCE Journal of Environmental Engineering, vol 134, n , pp Wolfe, W., Butalia, T., Walker, W., Semach, A., Howdyshell, J., Pasini, R., Beneficial Use of Coal Combustion By-Products in the Rehabilitation of Failed Asphalt Pavements, 185
196 Asphalt Recycling and Reclaiming Association Annual Conference, February 17-21, 2009, Indian Wells, California 14. Butalia, T., Wolfe, W., Beneficial Use of Coal Combustion By-products in the Rehabilitation of Failed Asphalt Pavements, International Conference on Energy and Environment, March 19-21, 2009, India 15. Butalia, T., Wolfe, W., Beneficial Use of Coal Combustion By-products in the Rehabilitation of Failed Asphalt Pavements, International Journal of Environmental Science, vol 1, no 2, 2009, pp Wolfe, W., Butalia, T., Walker, H., Howdyshell, J., Semach, A., Pasini, R., Full Depth Reclamation of Asphalt Pavements Using Lime-Activated Class F Fly Ash: Structural Monitoring Aspects, World of Coal Ash, May 4 7, 2009, Lexington, Kentucky 17. Mackos, R., Butalia, T., Wolfe, W., Walker, W., Use of Lime-Activated Class F Fly Ash in the Full-Depth Reclamation of Asphalt Pavements: Environmental Aspects, World of Coal Ash, May 4 7, 2009, Lexington, Kentucky 18. Butalia, T., Wolfe, W., Reclamation of Asphalt Pavements Using Coal Combustion By- Products, Transportation Infrastructure Preservation and Renewal Conference, Transportation Research Board, November 12-13, 2009, Washington, DC. 19. Wolfe, W., Anspaugh, C., Butalia, T., In-situ Reclamation of Flexible Pavements Using Coal Combustion Byproducts, 16 th International Road Federation World Meeting, May 25-28, 2010, Lisbon, Portugal. Outreach Publicity Articles 1. Rehabilitating Asphalt Highways: Coal Fly Ash Used on Ohio Full Depth Reclamation Projects, Asphalt Contractor, February Recycling Innovations: Reuse the Abused, Roads and Bridges, May Ash at Work: Rehabilitating Asphalt Highways, August Better Roads: Using Coal Fly Ash to Reclaim Asphalt Pavements, July USEPA Fact Sheet for Case Study 18: Rehabilitating Asphalt Highways - Coal Fly Ash Used on Ohio Full Depth Reclamation Projects, December OSU News in Engineering: Breaking Ground - Collaboration Brings Eco-friendly Material to Ohio State, Vol. 80, No. 1,

197 Appendix C: Warren County Instrumentation Photos Figure C.1 - FWD Testing Before Construction Figure C.2 - Digging Trench for Pullbox #1 (fly ash & lime section) 187

198 Figure C.3 - Boring Hole for Pullbox #1 Instrumentation Figure C.4 - Placing of Pullbox #1 188


199 Figure C.5 - Layout of Pullbox #2 (Mill and Overlay control section) Instrumentation Figure C.6 - Digging of Pullbox #2 Trench 189


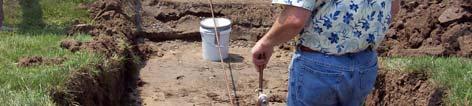


200 Figure C.7 - Pullbox #2 Pore Pressure Instrumentation Figure C.8 - Pullbox #2 190
201 Figure C.9 - Pullbox #2 Instrumentation on top of unreclaimed base/subgrade Figure C.10 - Pullbox #2 Instrumentation 191

202 Figure C.11 - Placing Quickset Mortar into Bored Hole for LVDT Figure C.2 - Hand Compacting Road Base over Pullbox #2 Instrumentation 192
203 Figure C.3 - Pullbox #2 Instrumentation Covered with Road Base Figure C.4 - Filling in Soil around Pullbox #2 193
204 Appendix D: Delaware County Instrumentation Photos Figure D.1 - FWD Testing Prior to Construction Figure D.2 - Instrumentation Layout 194

205 Figure D.3 - Digging Trench for Pullbox Figure D.4 - Placing Pullbox 195


206 Figure D.5 - Placing Base over Pressure Cell Figure D.6 - Trench with Instrument Conduit and Piping 196

207 Figure D.7 Top View of Pullbox Figure D.8 - LVDT and Pressure Cell Caps 197
 on top of FDR")
208 Figure D.9 - Getting ready to Place Strain Gauges Figure D.50 - Strain Gauges (Longitudinal and Transverse) on top of FDR Base 198

209 Figure D.61 - Gently Placing Asphalt over the Strain Gauges Figure D.72 - Light Compaction on Top of Strain Gauges 199
Full-Depth Reclamation of Asphalt Pavements Using Lime-Activated Class F Fly Ash: Structural Monitoring Aspects
 2009 World of Coal Ash (WOCA) Conference - May 4-7, 2009 in Lexington, KY, USA http://www.flyash.info/ Full-Depth Reclamation of Asphalt Pavements Using Lime-Activated Class F Fly Ash: Structural Monitoring
Beneficial Use of Coal Combustion By-products in the Rehabilitation of Failed Asphalt Pavements
 Beneficial Use of Coal Combustion By-products in the Rehabilitation of Failed Asphalt Pavements Tarunjit S. Butalia and William E. Wolfe Abstract This study demonstrates the use of Class F fly ash in combination
Use of Lime Activated Class F Fly Ash for Full Depth Reclamation (FDR) of Asphalt Pavements
 of Asphalt Pavements") Use of Lime Activated Class F Fly Ash for Full Depth Reclamation (FDR) of Asphalt Pavements William Wolfe, Tarunjit Butalia, Harold Walker Ryan Mackos, Gursimran Singh, James Howdyshell The Ohio State
Use of Lime Activated Class F Fly Ash for Full Depth Reclamation (FDR) of Asphalt Pavements William Wolfe, Tarunjit Butalia, Harold Walker Ryan Mackos, Gursimran Singh, James Howdyshell The Ohio State
FULL DEPTH RECLAMATION FOR CITIES AND COUNTIES. OTEC - October 27, 2015
 FULL DEPTH RECLAMATION FOR CITIES AND COUNTIES OTEC - October 27, 2015 OVERVIEW Time + Traffic + Environment = Deterioration Temporary repairs include overlays or mill and fills to extend service life
How to Select the Appropriate Pavement Rehabilitation Option. David Rettner, PE American Engineering Testing, Inc.
 1 How to Select the Appropriate Pavement Rehabilitation Option David Rettner, PE American Engineering Testing, Inc. 2 Pavement Rehabilitation Selection Understanding the Problem 3 Pavement Assessment Pavement
FULL DEPTH RECLAMATION. FDR Candidates STABILIZER DESIGN. Benefits. Benefits LOCAL ROADS PROGRAM What is Full Depth Reclamation (FDR)?
?") FULL DEPTH RECLAMATION Presented to: LOCAL ROADS PROGRAM 2012 What is Full Depth Reclamation (FDR)? Full Depth Reclamation is a pavement rehabilitation technique in which the full flexible pavement section
FULL DEPTH RECLAMATION Presented to: LOCAL ROADS PROGRAM 2012 What is Full Depth Reclamation (FDR)? Full Depth Reclamation is a pavement rehabilitation technique in which the full flexible pavement section
Mix Design Issues for. In-Place Recycling Products
 CIR Definition Mix Design Issues for Cold in-place recycling (CIR) is the on-site recycling process to a typical treatment depth of 3 to 5 inches, using a train of equipment (tanker trucks, milling machines,
Full-Depth Reclamation with Cement
 Full-Depth Reclamation with Cement 28th Annual Regional Local Roads Conference David L. Rettner Sr. Vice President American Engineering Testing, Inc. Design Construction Field Testing Performance Types
Full Depth Reclamation
 Full Depth Reclamation FDR Has Been Around A While 2 3 What is Full Depth Reclamation (FDR)? Full Depth Reclamation is a pavement rehabilitation technique in which the full flexible pavement section and
Stephanie Drain, P.E Midwestern States Regional In-Place Recycling Conference Schaumburg, IL September 11, 2013
 Stephanie Drain, P.E. 2013 Midwestern States Regional In-Place Recycling Conference Schaumburg, IL September 11, 2013 George Papa Bear Halas One of the greatest NFL coaches of all time Coaching career
What is it? What is Granular Base Stabilization ti (GBS)? Emulsion Full Depth Reclamation Process
? Emulsion Full Depth Reclamation Process") Emulsion Full Depth Reclamation and Granular Base Stabilization An Engineered Approach 47 th Idaho Asphalt Conference Rocktober 25 th, 2007 Full Depth Reclamation (FDR) What is it? Rehabilitation technique
Emulsion Full Depth Reclamation and Granular Base Stabilization An Engineered Approach 47 th Idaho Asphalt Conference Rocktober 25 th, 2007 Full Depth Reclamation (FDR) What is it? Rehabilitation technique
Airport Pavement Rehabilitation 2015 Minnesota Airports Conference
 Airport Pavement Rehabilitation 2015 Minnesota Airports Conference St. Cloud, Minnesota April 16, 2015 David L. Rettner, P. E. American Engineering Testing, Inc. Pavement Life Cycle Routine Maintenance
Road Rehabilitation Using Foamed Asphalt
 Road Rehabilitation Using Foamed Asphalt 2008 M&RR Author: Roger Olson Andrew Eller March 2008 INTRODUCTION During the Arab Oil Embargo of 1973, the price of crude oil quadrupled to $12 per barrel. Subsequently
Advantages of Full Depth Recycling
 Definition of FDR re-use existing asphalt, base and subgrade material 6 12 (150 300 mm) to produce a new base course a new wearing surface is applied a stabilizer can be incorporated Advantages of Full
Roadway Base Stabilization Current Practice
 Roadway Base Stabilization Current Practice AGC MNDOT TRANSPORTATION CONSTRUCTION AND GRADING INNOVATIONS FORUM December 6, 2016 OVERVIEW ROAD TYPES BASE STRENGTHENING APPLIES TO ALL KEY CONSIDERATIONS
Full Depth Reclamation
 Design Manual Chapter 5 - Roadway Design 5J - Pavement Rehabilitation Program 5J-3 Full Depth Reclamation A. General Full depth reclamation (FDR) is a pavement rehabilitation technique in which the full
FULL - DEPTH RECYCLING OF ASPHALT PAVEMENTS WITH PORTLAND CEMENT
 FULL - DEPTH RECYCLING OF ASPHALT PAVEMENTS WITH PORTLAND CEMENT Dick Martin Pavement Recycling Specialist Road Recycling Council New England Region What is Full Depth Reclamation? FDR is the rehabilitation
ITEM 252 IN-PLACE FULL DEPTH COLD FLEXIBLE PAVEMENT RECYCLING
 AFTER NOVEMBER 1, 2008 ITEM 252 IN-PLACE FULL DEPTH COLD FLEXIBLE PAVEMENT RECYCLING 252.1 Description. This work shall consist of a stabilized base course composed of a mixture of the existing bituminous
Renae Kuehl, PE, SRF Consulting Group Dan Wegman, PE, Braun Intertec Corporation November 2, 2017
 BASE STABILIZATION GUIDANCE AND ADDITIVE SELECTION FOR PAVEMENT DESIGN Renae Kuehl, PE, SRF Consulting Group Dan Wegman, PE, Braun Intertec Corporation November 2, 2017 Who is the LRRB? Serves local agencies
Design Criteria and Testing for Cold In-Place Recycling. Todd Thomas Technical Services Engineer Colas Solutions, Inc.
 Design Criteria and Testing for Cold In-Place Recycling Todd Thomas Technical Services Engineer Colas Solutions, Inc. August 29, 2012 Presentation Topics CIR description Project selection criteria for
TECHNICAL SPECIFICATION
 TECHNICAL SPECIFICATION ITEM 00252 IN-PLACE FULL DEPTH COLD FLEXIBLE PAVEMENT RECYCLING 252.1 Description. This work shall consist of a stabilized base course composed of a mixture of the existing bituminous
Recycled Base Aggregates in Pavement Applications
 Recycled Base Aggregates in Pavement Applications Jeffrey S. Melton, Ph.D. Outreach Director, Recycled Materials Resource Center jeffrey.melton@unh.edu The Big Picture Sustainability Nexus of major issues
Extraction and Sieve Analysis ( µm minus) Forming Marshall Specimens, Field Method
 Forming Marshall Specimens, Field Method") 3.56 COLD IN-PLACE RECYCLING 3.56.1 GENERAL This specification covers the requirements for Cold In-Place Recycling (CIR) which consists of reclaiming the existing asphalt pavement; sizing the reclaimed
3.56 COLD IN-PLACE RECYCLING 3.56.1 GENERAL This specification covers the requirements for Cold In-Place Recycling (CIR) which consists of reclaiming the existing asphalt pavement; sizing the reclaimed
COLD IN-PLACE RECYCLING (CIR) Starting with what is there i.e. in situ materials
 Starting with what is there i.e. in situ materials") COLD IN-PLACE RECYCLING (CIR) Starting with what is there i.e. in situ materials Definitions: ARRA (Asphalt Recycling/Reclaiming Ass.) Cold In-Place Recycling (CIR) is the on-site recycling process to
COLD IN-PLACE RECYCLING (CIR) Starting with what is there i.e. in situ materials Definitions: ARRA (Asphalt Recycling/Reclaiming Ass.) Cold In-Place Recycling (CIR) is the on-site recycling process to
Full Depth Pavement Reclamation
 Full Depth Pavement Reclamation Delaware County, Ohio Chris Bauserman, PE, PS April 28, 2015 Background Population has increased from 55,000 in 1989 to approximately 200,000 Explosive growth in residential,
Integrated Pavement Solutions
 Integrated Pavement Solutions 1 Product Solutions for Every Paving Need Application Solution Mainline highways Commercial airports General aviation airports PCC pavement Heavy-duty industrial Concrete
Rehabilitation Recommendations for FM 97 in Gonzales County
 Rehabilitation Recommendations for FM 97 in Gonzales County Technical Memorandum TM-14-04 Prepared for Texas Department of Transportation Maintenance Division Prepared by Texas A&M Transportation Institute
VDOT Pavement Recycling Initiative. Andy Babish, P.E. State Materials Engineer
 Andy Babish, P.E. State Materials Engineer Pavement Recycling Initiative Background Goal and Key Components Going Forward 2 Initiative Background - 2008: 3 Full Depth Reclamation trial sections constructed
Puerto Rico. Pavement Preservation Conference and Technology Implementation. US. Department of Transportation Federal Highway Administration
 Puerto Rico Pavement Preservation Conference and Technology Implementation US. Department of Transportation Federal Highway Administration Cold In-Place Asphalt Recycling Overview Michael L. Polak E.J.
PROJECT INFORMATION EVALUATION PROCEDURES
 April 10, 2012 Board of Directors Hunters Ridge Amenities Association, Inc. 422 Hunters Circle Greenville, SC 29617 Attention: Mr. Jerry Miller Mr. Bruce Williams Re: Engineering Evaluation of Existing
BASE CONSTRUCTION MATERIALS A Aggregate
 BASE CONSTRUCTION 2211 AGGREGATE BASE 2211.1 DESCRIPTION This work consists of placing aggregate base. 2211.2 MATERIALS A Aggregate... 3138 Provide the class of aggregate as required by the contract. 2211.3
Geotechnical Exploration and Evaluation Report
 Geotechnical Exploration and Evaluation Report Pavement Coring and Evaluation UNF Parking Lot 3 Jacksonville, Florida CSI Geo Project No.: 71-18-135-23 Prepared by CSI Geo, Inc. 2394 St. Johns Bluff Road
Cold In-Place Recycling with Expanded Asphalt B-335 COLD IN-PLACE RECYCLING WITH EXPANDED ASPHALT OPSS 335
 B-335 COLD IN-PLACE RECYCLING WITH EXPANDED ASPHALT OPSS 335 335.1 GENERAL Use of Cold In-Place Recycled Expanded Asphalt Mix (CIREAM) is recommended by the Regional Geotechnical Section on a work-project
2014 International & Western States In-Place Recycling Conference. Denver, Colorado August 5-7, 2014
 ACTIVITIES 2014 International & Western States In-Place Recycling Conference Denver, Colorado August 5-7, 2014 Stephen A (Steve) Cross, PhD, PE Technical Director Asphalt Recycling & Reclaiming Association
by Michael H. Fleming, ISMF LLC
 PennDOT LTAP technical INFORMATION SHEET #159 W i n t e r / 2 0 1 3 Full-Depth Reclamation A roadway rehabilitation technique using green technology by Michael H. Fleming, ISMF LLC While preparing your
MATERIALS DIVISION MEMORANDUM SIGNATURE:
 MATERIALS DIVISION MEMORANDUM GENERAL SUBJECT: Notice of Revision to Materials Division s Manual of Instructions Chapter VI SPECIFIC SUBJECT: Incorporation of a new section titled as Project Selection
Principles of Soil Stabilization
 Principles of Soil Stabilization by E. J. Y oder, R esearch E ngineer Joint Highway Research Project Purdue University A problem continually facing an engineer is that dealing with procedures and techniques
DIVISION 2500 MISCELLANEOUS METHODS OF TEST
 TABLE OF CONTENTS DIVISION 2500 MISCELLANEOUS METHODS OF TEST SECTION 2501 PART V... 2500-1 PAGE i SECTION 2501 PART V 2501.1 GENERAL In order to properly monitor materials on a project, follow all applicable
Strawser Construction Inc.
 Maximizing Your Limited Road Budget with Pavement Management & Preservation Strawser Construction Inc. State of Ohio Approved Contractor & Manufacturer Columbus, Ohio 1 FHWA Pavement Preservation Guidelines
Glossary of Terms - A -
 Glossary of Terms - A - AASHTO - American Association of State Highway and Transportation Officials. ABRASION - A test for determination of resistance of aggregate to abrasion conducted as per AASHTO Test
Pavement Design Catalogue Development for Pavements in Energy Affected Areas of Texas
 Pavement Design Catalogue Development for Pavements in Energy Affected Areas of Texas Implementation Report IR-15-01 Prepared for Texas Department of Transportation Maintenance Division Prepared by Texas
Pavement Management 101 White Paper
 Pavement Management 101 White Paper Executive Summary: Communities throughout the U.S. are challenged to meet funding needs for maintaining, operating, and improving their roadway systems. The most cost
Reconstructing Pavements Using Full- Depth Reclamation. Matthew Singel
 Reconstructing Pavements Using Full- Depth Reclamation Matthew Singel Introduction Applications Benefits Construction Performance Introduction Definition of Full-Depth Reclamation Method of flexible pavement
KANSAS DEPARTMENT OF TRANSPORTATION SPECIAL PROVISION TO THE STANDARD SPECIFICATIONS, EDITION 2007
 Sheet 1 of 6 KANSAS DEPARTMENT OF TRANSPORTATION SPECIAL PROVISION TO THE STANDARD SPECIFICATIONS, EDITION 2007 Delete SECTION 2501 and replace with the following: SECTION 2501 PART V 2501.1 GENERAL In
MNDOT PAVEMENT DESIGN MANUAL
 MNDOT PAVEMENT DESIGN MANUAL Chapter 9 truction and Rehabilitation Alternates MnDOT Pavement Engineer Date Contents Introduction... 1 900 Existing Pavement-Types... 2 910 Rehabilitation with HMA Overlay
Why Recycle WTE Ash?
 Recycle Florida Today Renewable Energy and Advances in Technology Development of a Waste to Energy Bottom Ash Recycling Program in Pasco County, Florida Why Recycle WTE Ash? Environmental Benefit Offset
KU Design Guidelines APPENDIX II PERMEABLE BITUMINOUS PAVEMENT
 PERMEABLE BITUMINOUS PAVEMENT PART 1: GENERAL 1.01. RELATED DOCUMENTS: A. Drawings and general provisions of Contract, including Special Requirements General Conditions and Division 1 Specifications Sections,
Soil-Cement Technology for Pavements: Different Products for Different Applications
 Soil-Cement Technology for Pavements: Different Products for Different Applications A publication from the Portland Cement Association Compliments of 801 South 71st Avenue Phoenix, AZ 85043 623-936-8800
REUSE YOUR ROADWAY Road Rehabilitation Technology
 Annual Conference Full Depth Reclamation with Cement KRM014 January 28, 2015 REUSE YOUR ROADWAY Road Rehabilitation Technology FDR with Cement James W. Render Jr. National Business Development Manager
Performance of Thin Bituminous Treatments for Low-Volume Roads. Greg Johnson Minnesota Department of Transportation June 25, 2003
 Performance of Thin Bituminous Treatments for Low-Volume Roads Greg Johnson Minnesota Department of Transportation June 25, 2003 Overview Introduction MN Historical Perspective Current Performance Double
Cold-in-Place Recycling
 Design Manual Chapter 5 - Roadway Design 5J - Pavement Rehabilitation Program 5J-2 Cold-in-Place Recycling A. General Cold-in-place recycling (CIR) is the process of recycling an asphalt pavement in-place
EFFECT OF FILLER AND BITUMEN EMULSION TYPE ON SET TIME AND CURE TIME OF SLURRY SEAL
 A5EE-533 EFFECT OF FILLER AND BITUMEN EMULSION TYPE ON SET TIME AND CURE TIME OF SLURRY SEAL Mohammad Reza Ahadi1, Saeed Dalirpour2, Hamid Jahanian Pahlevanloo2 1Transportation Research institute, Road
2501 PART V SECTION 2501 PART V
 SECTION 2501 PART V 2501.1 GENERAL In order to properly monitor materials on a project, follow all applicable procedures as outlined in the KDOT Construction Manual, Part V. This includes, but is not limited
DIVISION 2500 MISCELLANEOUS METHODS OF TEST
 TABLE OF CONTENTS DIVISION 2500 MISCELLANEOUS METHODS OF TEST SECTION 2501 PART V... 2500-1 PAGE i SECTION 2501 PART V 2501.1 GENERAL In order to properly monitor materials on a project, follow all applicable
A. Texas Department of Transportation 2004 Standard Specifications for Construction and Maintenance of Highways, Streets and Bridges (TxDOT).
.") SECTION 32 01 16 ASPHALT OVERLAY PART 1 - GENERAL 1.1 SCOPE OF WORK A. This Section specifies the requirements for scarifying, grinding, sweeping and repair of existing asphalt concrete pavement to establish
SECTION 32 01 16 ASPHALT OVERLAY PART 1 - GENERAL 1.1 SCOPE OF WORK A. This Section specifies the requirements for scarifying, grinding, sweeping and repair of existing asphalt concrete pavement to establish
Determination of Mechanical Properties of Materials Used in WAY-30 Test Pavements
 The Ohio Department of Transportation Office of Research & Development Executive Summary Report Determination of Mechanical Properties of Materials Used in WAY-30 Test Pavements Start date: January 1,
ITEM 404LVT (Low Volume Traffic) ASPHALT CONCRETE Revised June 5, 2015
 ASPHALT CONCRETE Revised June 5, 2015") Notes to Designers: ITEM 404LVT (Low Volume Traffic) ASPHALT CONCRETE Revised June 5, 2015 Here s what s new in this latest revision of 404LVT This revised specification includes the following changes:
Notes to Designers: ITEM 404LVT (Low Volume Traffic) ASPHALT CONCRETE Revised June 5, 2015 Here s what s new in this latest revision of 404LVT This revised specification includes the following changes:
Reclamation Research at VDOT
 Reclamation Research at VDOT Brian Diefenderfer, Ph.D., P.E. Senior Research Scientist PCA FDR Symposium February 10, 2015 3/2/2015 1 Overview Agency methods to begin using FDR Specifications Guidelines
FULL-DEPTH RECLAMATION WITH EXPANDED ASPHALT STABILIZATION
 B331 - FULL-DEPTH RECLAMATION WITH EXPANDED ASPHALT STABILIZATION - OPSS 331 331.1 GENERAL The work of Full-Depth Reclamation with Expanded Asphalt Stabilization consists of in-place full-depth reclamation
DESIGN OF BITUMINOUS MIXTURES
 Test Procedure for DESIGN OF BITUMINOUS MIXTURES TxDOT Designation: Tex-204-F Effective Date: August 2016 1. SCOPE 1.1 Use the methods in this procedure to determine the proper proportions of approved
RECONSTRUCTION OF DISTRESSED PAVEMENTS Full-Depth Rehabilitation (FDR) (Portland cement)
 (Portland cement)") 1.0 DESCRIPTION. RECONSTRUCTION OF DISTRESSED PAVEMENTS Full-Depth Rehabilitation (FDR) (Portland cement) This specification shall govern the process known as Full-Depth Rehabilitation (FDR). FDR consists
1.0 DESCRIPTION. RECONSTRUCTION OF DISTRESSED PAVEMENTS Full-Depth Rehabilitation (FDR) (Portland cement) This specification shall govern the process known as Full-Depth Rehabilitation (FDR). FDR consists
Laboratory Comparison of Crushed Aggregate and Recycled Pavement Material With and Without High Carbon Fly Ash
 Geotech Geol Eng (21) 28:45 411 DOI 1.17/s176-9-93-1 ORIGINAL PAPER Laboratory Comparison of Crushed Aggregate and Recycled Pavement With and Without High Carbon Fly Ash Haifang Wen Justin Warner Tuncer
ISAP 2012 Jones et al: FDR-FA in California 1/12
 ISAP 2012 Jones et al: FDR-FA in California 1/12 Ten Years of Full-Depth Reclamation with Foamed Asphalt in California An Overview of the Research Investigation, Long-Term Performance, and Lessons Learned
Estimated Cost per SY Crack Seal (CR) $ No Change Fog Seal (FS) $ No Change
 $ No Change Fog Seal (FS) $ No Change") OCI Treatment Type Estimated Cost per SY Pavement Life Extension in Years Ride Quality Improvement 100-80 Crack Seal (CR) $0.63 2 No Change 100-80 Fog Seal (FS) $0.70-0.85 3 No Change 100-80 Asphalt Rejuvenators
OCI Treatment Type Estimated Cost per SY Pavement Life Extension in Years Ride Quality Improvement 100-80 Crack Seal (CR) $0.63 2 No Change 100-80 Fog Seal (FS) $0.70-0.85 3 No Change 100-80 Asphalt Rejuvenators
SECTION 2200 PAVING CITY OF BLUE SPRINGS, MISSOURI CONSTRUCTION SPECIFICATIONS
 SECTION 2200 PAVING CITY OF BLUE SPRINGS, MISSOURI CONSTRUCTION SPECIFICATIONS The City of Blue Springs hereby adopts Section 2200 of the Kansas City Metropolitan Chapter of APWA Construction and Material
FULL DEPTH RECLAMATION
 FULL DEPTH RECLAMATION PART 1 - GENERAL 1.01 SECTION INCLUDES Full depth reclamation of asphalt roadways 1.02 DESCRIPTION OF WORK Includes pulverizing and mixing of existing asphalt and underlying materials;
SECTION ASPHALTIC CONCRETE PAVING
 SECTION 02742 ASPHALTIC CONCRETE PAVING PART 1 GENERAL 1.1 SUMMARY A. Includes But Not Limited To 1. Prepare pavement sub-grade as described in Contract Documents to receive pavement base and paving. 2.
7.1 Flexible Pavement Design. 7.2 Rigid Pavement Design TRANSPORTATION SYSTEM ENGINEERING 1, 61360
 7.1 Flexible Pavement Design 7.2 Rigid Pavement Design 1 Highway pavements are divided into two main categories: Flexible -Bituminous concrete Rigid -Portland cement concrete- Flexible pavements usually
Ash Recycling in Pasco County
 Waste to Energy Bottom Ash Recycling at the Pasco County Resource Recovery Facility Timothy Townsend 1, Justin Roessler 1, John Power 2, Jason Gorrie 3 1 University of Florida 2 Pasco County 3 JMG Engineering
Resilient Moduli and Structural Layer Coefficient of Flyash Stabilized Recycled Asphalt Base
 27 World of Coal Ash (WOCA), May 7-1, 27, Northern Kentucky, USA http://www.flyash.info Resilient Moduli and Structural Layer Coefficient of Flyash Stabilized Recycled Asphalt Base Anil Misra 1, Sunil
PAVEMENT MANAGEMENT REPORT 2011
 PAVEMENT MANAGEMENT REPORT 2011 COUNTY OF RIVERSIDE TRANSPORTATION DEPARTMENT PAVEMENT MANAGEMENT REPORT Table of Contents Page Executive Summary Current Total Miles Current Road Network Condition. Current
50 lbs (23 kg) of + #8 (+2.36 mm) material plus 50 lbs (23 kg) of pile run material.
 of + #8 (+2.36 mm) material plus 50 lbs (23 kg) of pile run material.") 5.5 REQUIRED SAMPLE SIZES 1. SCOPE This section covers the size of samples to be submitted to the s and Research Center for testing. The sample sizes listed are minimums and in special cases the Engineer
5.5 REQUIRED SAMPLE SIZES 1. SCOPE This section covers the size of samples to be submitted to the s and Research Center for testing. The sample sizes listed are minimums and in special cases the Engineer
Incorporating Recycling into Pavement Design Where does it Fit?
 Incorporating Recycling into Pavement Design Where does it Fit? AEMA-ARRA-ISSA-PPRA Fall Meeting Niagara Falls, Ontario October 13-15, 2015 David Hein, P. Eng., Principal Engineer Vice-President, Transportation
SHRP2 Renewal Project R23 PAVEMENT RENEWAL SOLUTIONS
 SHRP2 Renewal Project R23 PAVEMENT RENEWAL SOLUTIONS Pavement Design Section Roadway Engineering Group Arizona Department of Transportation December, 2016 ABSTRACT One of the goals for the creation of
Bituminous Pavements and Surfaces
 PART ONE Bituminous Pavements and Surfaces Bituminous pavements and surfaces are composed of compacted aggregate and bitumen. The aggregate transmits the load from the surface to the base, takes the abrasive
IMPLEMENTING FULL DEPTH RECLAMATION BY: HENRY HAWKINS CHAMBERS COUNTY ENGINEER
 IMPLEMENTING FULL DEPTH RECLAMATION BY: HENRY HAWKINS CHAMBERS COUNTY ENGINEER BRIEF HISTORY OF ALABAMA COUNTY ROADS -Alabama Farm to Market Act was passed in 1943 and began in 1946 -One Cent was set aside
ST. TAMMANY PARISH COUNCIL ORDINANCE
 ST. TAMMANY PARISH COUNCIL ORDINANCE ORDINANCE CALENDAR NO: 5563 COUNCIL SPONSOR: DEAN/BRISTER INTRODUCED BY: MR. BELLISARIO ORDINANCE COUNCIL SERIES NO: PROVIDED BY: DEVELOPMENT SECONDED BY: MR. STEFANCIK
Thinlay Asphalt for Pavement Preservation
 Thinlay Asphalt for Pavement Preservation Northwest Pavement Management Conference, Fall 2014 Jim Huddleston, P.E. Executive Director APAO Preservation Treatments need to correct minor surface distresses
U.S. National Overview Cold-In Place- Recycling. Laramie, Wyoming 18 th July 2013
 U.S. National Overview Cold-In Place- Recycling Laramie, Wyoming 18 th July 2013 Why recycle? Correct pavement defects Increase structural capacity Geometry Limited elevation rise or limited width Reuse
THE CHALLENGES AND BENEFITS OF USING RECYCLED ASPHALT PAVEMENT (RAP) MATERIAL
 MATERIAL") THE CHALLENGES AND BENEFITS OF USING RECYCLED ASPHALT PAVEMENT (RAP) MATERIAL Dave Van Deusen, PE, MnDOT Chris DeDene, PhD, PE, AET 2018 Mn Transportation Conference February 28, 2018 2018 American Engineering
THE CHALLENGES AND BENEFITS OF USING RECYCLED ASPHALT PAVEMENT (RAP) MATERIAL Dave Van Deusen, PE, MnDOT Chris DeDene, PhD, PE, AET 2018 Mn Transportation Conference February 28, 2018 2018 American Engineering
Introduction. Contents. 1.1Rigid pavement Pavement Structure
 Contents 01203477 Pavement Structure Introduction Assistant Professor Dr.Weerakaset Suanpaga (D.Eng) Department of civil engineering KASETSART UNIVERSITY 14/06/56 01203477 pavement structure 1 1.Pavement
ANNUAL PROGRESS REPORT (FISCAL YEAR 2008)
") ANNUAL PROGRESS REPORT (FISCAL YEAR 2008) Project Name: Field Performance Monitoring and Modeling of Instrumented Pavement on I 35 in McClain County Item Number: 2200 Duration: October 1, 2007 to September
ANNUAL PROGRESS REPORT (FISCAL YEAR 2008) Project Name: Field Performance Monitoring and Modeling of Instrumented Pavement on I 35 in McClain County Item Number: 2200 Duration: October 1, 2007 to September
Subgrade Soil Support and Stabilization
 Subgrade Soil Support and Stabilization O HARE Airport Modernization Research Project Research Progress Presentation June 30, 2005 Co-PIs: Erol Tutumluer Marshall R. Thompson RA: H.S. Brar Introduction
Center for By-Products Utilization
 Center for By-Products Utilization USE OF COAL COMBUSTION PRODUCTS IN PERMEABLE ROADWAY BASE CONSTRUCTION By Tarun R. Naik, Rudolph N. Kraus, Rafat Siddique, and Paul Ziemkiewicz Report No. CBU-2003-16
A. Texas Department of Transportation 2004 Standard Specifications for Construction and Maintenance of Highways, Streets and Bridges (TxDOT).
.") SECTION 32 12 16 ASPHALT CONCRETE PAVING PART 1 GENERAL 1.1 SCOPE OF WORK A. This Section specifies the requirements for placing a hot laid plant mix asphalt surface course upon either an asphalt stabilized
SECTION 32 12 16 ASPHALT CONCRETE PAVING PART 1 GENERAL 1.1 SCOPE OF WORK A. This Section specifies the requirements for placing a hot laid plant mix asphalt surface course upon either an asphalt stabilized
SPECIAL SPECIFICATION 3157 Cold Processed - Recycled Paving Material (RPM) for Use as Aggregate Base Course
 for Use as Aggregate Base Course") 1993 Specifications SPECIAL SPECIFICATION 3157 Cold Processed - Recycled Paving Material (RPM) for Use as Aggregate Base Course 1. Description. This Item, Cold Processed - Recycled Paving Material (RPM),
1993 Specifications SPECIAL SPECIFICATION 3157 Cold Processed - Recycled Paving Material (RPM) for Use as Aggregate Base Course 1. Description. This Item, Cold Processed - Recycled Paving Material (RPM),
Slurry Seal Quality Construction State-of-the-Practice
 Slurry Seal Quality Construction State-of-the-Practice June 2018 Publication No. XXX Nevada Department of Transportation Maintenance Division, 1263 S. Stewart St. Carson City, NV 89712 This document is
Utility Cut Restoration
 Design Manual Chapter 9 - Utilities 9D - Utility Cut Restoration 9D-1 Utility Cut Restoration A. General Utility cuts are made in existing pavement sections to install a myriad of utilities and to repair
NJ I-295: A Perpetual Pavement Design and Construction Project
 NJ I-295: A Perpetual Pavement Design and Construction Project Presented by: Robert Sauber, Executive Director NJ Asphalt Pavement Assoc. Presented to: AMAP 12 th Annual Meeting February 16, 2011 Rt I-295
Reclamation Guidelines
 Reclamation Guidelines MAAPT 63 rd Asphalt Conference December 7, 2016 Terry Beaudry MnDOT Grading Base, Recycling, and Aggregate Engineer Outline 2 Design and Preliminary Work Construction Production
SECTION ASPHALT PAVING AND SURFACING
 SECTION 02500 ASPHALT PAVING AND SURFACING PART 1 - GENERAL 1.01 WORK INCLUDED A. Traffic control as required to divert vehicular and pedestrian traffic around construction. B. Spreading and compacting
Structural Evaluation of Asphalt Pavements with Full-Depth Reclaimed Base
 Structural Evaluation of Asphalt Pavements with Full-Depth Reclaimed Base Joseph F. Labuz, Principal Investigator Department of Civil Engineering University of Minnesota December 2012 Research Project
Geotechnical Engineering Report
 Geotechnical Engineering Report In-Place Soil Survey North Western Road From West Hall of Fame Avenue to West Lakeview Road Stillwater, Oklahoma June 18, 2 Terracon Project No. 36622 Prepared for: Olsson
STATE OF OHIO DEPARTMENT OF TRANSPORTATION SUPPLEMENTAL SPECIFICATION 874 ULTRATHINBONDED ASPHALT CONCRETE. April 20, 2007
 STATE OF OHIO DEPARTMENT OF TRANSPORTATION SUPPLEMENTAL SPECIFICATION 874 ULTRATHINBONDED ASPHALT CONCRETE April 20, 2007 874.01 Description 874.02 Materials 874.03 Composition 874.04 Equipment 874.05
Environmental Assessment of Foundry Byproducts for Unbound Highway Applications
 Environmental Assessment of Foundry Byproducts for Unbound Highway Applications Craig H. Benson, PhD, PE Recycled Materials Resource Center University of Washington chbenson@u.washington.edu www.recycledmaterials.org
High-Volume Use of High-Carbon Fly Ash
 High-Volume Use of High-Carbon Fly Ash Sponsored by the U.S. Department of Energy (DOE) and in cooperation with the Minnesota Department of Transportation (Mn/DOT), a team consisting of Washington State
Recommended Mix Design Guidelines For Cold Recycling Using Foamed (Expanded) Asphalt Recycling Agent CR202
 Asphalt Recycling Agent CR202") Recommended Mix Design Guidelines For Cold Recycling Using Foamed (Expanded) Asphalt Recycling Agent CR202 8/25/2017 NOTICE It is not intended or recommended that these guidelines be used verbatim within
Recommended Mix Design Guidelines For Cold Recycling Using Foamed (Expanded) Asphalt Recycling Agent CR202 8/25/2017 NOTICE It is not intended or recommended that these guidelines be used verbatim within
APPENDIX A DRAFT PERFORMANCE-BASED MIX DESIGN PROCEDURE FOR POROUS FRICTION COURSE
 APPENDIX A DRAFT PERFORMANCE-BASED MIX DESIGN PROCEDURE FOR POROUS FRICTION COURSE Standard Practice for Permeable Friction Course (PFC) Mix Design AASHTO Designation: 1. SCOPE 1.1 This standard covers
Performance Comparison of Cold in Place Recycled and Conventional HMA Mixes
 IOSR Journal of Mechanical and Civil Engineering (IOSR-JMCE) ISSN: 2278-1684 Volume 4, Issue 1 (Nov-Dec. 2012), PP 27-31 Performance Comparison of Cold in Place Recycled and Conventional HMA Mixes Kamran