Peneliti Ekonomi di Grup Riset Ekonomi (GRE), Direktorat Riset Ekonomi dan Kebijakan Moneter (DKM), Bank Indonesia. Pandangan dalam paper ini
|
|
|
- Melissa Cain
- 6 years ago
- Views:
Transcription
1
2 1 Peneliti Ekonomi di Grup Riset Ekonomi (GRE), Direktorat Riset Ekonomi dan Kebijakan Moneter (DKM), Bank Indonesia. Pandangan dalam paper ini merupakan pandangan penulis dan tidak semata-mata merefleksikan pendapat DKM atau Bank Indonesia. i
3 1
4 2
5 2 Kontribusi perdagangan dunia dihitung dari total ekspor plus impor suatu negara dibagi dengan total ekspor plus impor dunia. 3
6 Indikator Utama Dunia * PDB Dunia % Advanced economies % Euro area % Emerg. & Dev'ing ec. % Berkembang Asia % ASEAN-5 % AS % Jepang % Jerman % Cina % India % Indonesia % Perdagangan dan Harga WTV % Inflasi % Harga Komoditas % Harga minyak % Sumber: IMF-WEO April
7 Pangsa PDB Dunia (%) World Advanced Economies Emerging & Dev. Economies Developing Asia (RHS) Pangsa thd PDB (%) sumber: IMF Indonesia China Singapore (RHS) Malaysia (RHS) sumber: IMF 5
8 % % China Indonesia Investment Net exports Government consumption Investment Net exports Government consumption Private consumption 0.0 Private consumption -5.0 GDP -2.0 GDP Dampak ACFTA terhadap Perdagangan Internasional Indonesia, Ibrahim dkk.,


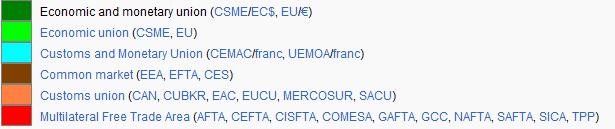
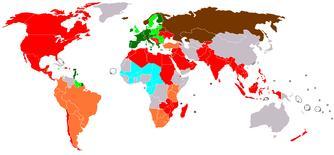
9 Sumber:Wikipedia, last update 19 January
10 Share WX (%) Dev.Asia Middle East West.Hem. Africa Adv. Ec. (RHS) Share WX (%) Korea Singapore Malaysia Thailand Indonesia China (RHS) Intra Regional Trade* Negara Asal Neg. Berkembang Asia ASEAN ASEAN * Pangsa terhadap total ekspor dunia ** Pangsa terhadap total ekspor negara asal Sumber: IMF Trade Directions Statistics, diolah. Tujuan Ekspor** G3 Developing Asia ASEAN+4 ASEAN Indonesia
11 Tujuan Ekspor** Negara Asal AS Euro Jepang Cina India Neg. Berkembang Asia ASEAN ASEAN Indonesia * Pangsa terhadap total ekspor dunia ** Pangsa terhadap total ekspor negara asal Sumber: IMF Trade Directions Statistics, diolah. 9
12 intra-industry trade inter-industry trade S2-5 S2-21 S2-22 S2-25 S2-32 S2-34 S2-41 S2-54 S2-64 S2-88 S Indonesia (2010) intra-industry trade inter-industry trade USA Jepang Dunia
13 11
14 12
15 13
16 14
17 4 Buetre dan Esfahani (2000). Updating an Input Output Table for Use in Policy Analysis. The Australian Journal of Agricultural and Resource Economics. 15
18 Intermediate Demand Total Final Total Negara A B C Int.Output Demand Output A B C Total Int.Input Value Added Total Input Intermediate Demand Negara A B C Total Int.Output Final Demand Total Output A B C Total Int.Input Value Added Total Input Langkah-langkah metode RAS diambil dari presentasi Capilit. E (Asian Development Bank) pada 2 nd Data Review Workshop, tanggal Desember
19 Intermediate Demand Negara A B C A B C Intermediate Demand Negara A B C u 1 u * r 1 = u*/u 1 A B C Intermediate Demand Negara A B C u 1 = u A B C
20 Intermediate Demand Negara A B C A B C v v* s 1 = v*/v Intermediate Demand Negara A B C A B C v* = v Intermediate Demand Negara A B C u 1 = u r 1 = u*/u 1 A B C v* = v s 1 = v*/v
21 19
22 6 Data perdagangan Taiwan tidak tersedia dalam UNCOMTRADE 20
23 21
24 22
25 SUPPLIER SUPPLIER USER Indonesia Malaysia Philippines Singapore Thailand China Taiwan Korea Japan U.S.A. Indonesia Malaysia Philippines Singapore Thailand China Taiwan Korea Japan U.S.A USER Indonesia Malaysia Philippines Singapore Thailand China Taiwan Korea Japan U.S.A. Indonesia Malaysia Philippines Singapore Thailand China Taiwan Korea Japan U.S.A
26 24
27 Backward Linkages - Sector Trade and transport Crude petroleum and natural gas Services Other mining Food, beverage and tobacco Chemical products Other agricultural products Transport equipment Pulp, paper and printing Metal products Forward Linkages -Sector Textile, leather, and the products thereof Timber and wooden products Electricity, gas, and water supply Food, beverage and tobacco Construction Metal products Other manufacturing products Transport equipment Livestock and poultry Machinery
28 26
29 27
30 28
31 29
32 30
33 31
34 32


35 33
36 34
37 35
38 36


39 Sumber: Pula Gabor dan Tuomas A Peltonen (2009). Has Emerging Asia Decoupled? An Analysis of Production and Trade Linkages Using The Asian International Input Output Table. Working Paper Series No. 993 European Central Bank. 37

40 38 Sumber: Pula Gabor dan Tuomas A Peltonen (2009). Has Emerging Asia Decoupled? An Analysis of Production and Trade Linkages Using The Asian International Input Output Table. Working Paper Series No. 993 European Central Bank.
41 Sector Classification of 2000 Asian International Input-Output Table 7 Sector Classification 24 Sector Classification 76 Sector Classification 78 Sector Classification (1995) Code Description Code Description Code Description Code Description INTERMEDIATE SECTORS 001 Agriculture, 001 Paddy 001 Paddy 001 Paddy livestock, 002 Other agricultural products 002 Other grain 007A Other grain forestry 003 Food crops 002 Cassava and fishery 004 Sugar cane and beet 005 Oil parm and coconuts 007B Other food crops 004 Non-food crops 003 Natural rubber 006 Fiber crops 008 Other commercial crops 003 Livestock and poultry 005 Livestock and poultry 009 Livestock and poultry 004 Forestry 006 Forestry 010 Forestry 005 Fishery 007 Fishery 011 Fishery 002 Mining and 006 Crude petroleum and natural gas 008 Crude petroleum and natural gas 012 Crude petroleum and natural gas quarrying 007 Other mining 009 Iron ore 015A Iron ore 010 Other metallic ore 013 Copper ore 014 Tin ore 015B Other metallic ore 011 Non-metallic ore and quarrying 016 Non-metallic ore and quarrying 003 Manufacturing 008 Food, beverage and tobacco 012 Milled grain and flour 018 Milled rice 019 Other milled grain and flour 013 Fish products 021A Fish products 014 Slaughtering, meat products and dairy products 021B Slaughtering and meat products 015 Other food products 017 Oil and fats 020 Sugar 021C Other food products 016 Beverage 022A Beverage 017 Tobacco 022B Tobacco Spinning 023 Spinning Textile, leather, and the products thereof 019 Weaving and dyeing 024 Weaving and dyeing 020 Knitting 025 Knitting 021 Wearing apparel 026 Wearing apparel 022 Other made-up textile products 027 Other made-up textile products 023 Leather and leather products 028 Leather and leather products 010 Timber and wooden products 024 Timber 029 Timber 025 Wooden furniture 030A Furniture 026 Other wooden products 030B Other wooden products 011 Pulp, paper and printing 027 Pulp and paper 031 Pulp and paper 028 Printing and publishing 032 Printing and publishing 012 Chemical products 029 Synthetic resins and fiber 033A Synthetic resins and fiber 030 Basic industrial chemicals 033B Other basic industrial chemicals 031 Chemical fertilizers and pesticides 034 Chemical fertilizers and pesticides 032 Drugs and medicine 035A Drugs and medicine 033 Other chemical products 035B Other chemical products 013 Petroleum and petro products 034 Refined petroleum and its products 036 Refined petroleum and its products 019 Other manufacturing products 035 Plastic products 050A Plastic products 014 Rubber products 036 Tires and tubes 037 Tires and tubes 037 Other rubber products 038 Other rubber products 015 Non-metallic mineral products 038 Cement and cement products 039 Cement and cement products 039 Glass and glass products 040 Glass and glass products 040 Other non-metallic mineral products 041 Other non-metallic mineral products 016 Metal products 041 Iron and steel 042 Iron and steel 042 Non-ferrous metal 043 Non-ferrous metal 043 Metal products 044 Metal products 017 Machinery 044 Boilers, Engines and turbines 045E Engines and turbines 045 General machinery 045C-2 Ordinary industrial machinery 046 Metal working machinery 045B-1 Specialized industrial machinery 045C-2 Ordinary industrial machinery 047 Specialaized machinery 045A Agricultural machinery 045B-2 Specialized industrial machinery 048 Heavy Electrical equipment 045D Heavy Electric machinery 049 Television sets, radios,audios and communication equipment 046A Electronics and electronic products 050 Electronic computing equipment 051 Semiconductors and integrated circuits 052 Other electronics and electronic products 053 Household electrical equipment 046B Other electric machinery and appliance 054 Lighting fixtures, batteries, wiring and others 018 Transport equipment 055 Motor vehicles 047A Motor vehicles 056 Motor cycles 047B-1 Motor cycles and bicycles (Motor cycles) 057 Shipbuilding 048B Shipbuilding 058 Other transport equipment 047B-2 Motor cycles and bicycles (Bicycles) 048A Aircrafts 048C Other transport equipment 019 Other manufacturing products 059 Precision machines 049 Precision machines 060 Other manufacturing products 050B Other manufacturing products 004 Electricity, gas 020 Electricity, gas, and water supply 061 Electricity and gas 051 Electricity, gas and water supply and water supply 062 Water supply 005 Construction 021 Construction 063 Building construction 052A Building construction 064 Other construction 052B Other construction 006 Trade and transport 022 Trade and transport 065 Wholesale and retail trade 053A Wholesale and retail trade 066 Transportation 053B Transportation 007 Services 023 Services 067 Telephone and telecommunication 054A Telephone and telecommunication 068 Finance and insurance 054B Finance and insurance 069 Real estate 054D-1 Other services 070 Education and research 054C Education and research 071 Medical and health service 054D-2 Other services 072 Restraunts 054D-3 Other services 073 Hotel 054D-4 Other services 074 Other services 054D-5 Other services 076 Unclassified 056 Unclassified 024 Public administration 075 Public administration 055 Public administration FINAL DEMAND SECTORS 001 Private consumption 001 Private consumption 001 Private consumption 001 Private consumption 002 Governemtn consumption 002 Governemtn consumption 002 Governemtn consumption 002 Governemtn consumption 003 Gross fixed capital formation 003 Gross fixed capital formation 003 Gross fixed capital formation 003 Gross fixed capital formation 004 Changes in stocks 004 Changes in stocks 004 Changes in stocks 004 Changes in stocks VALUE ADDED SECTORS 001 Wages and salary 001 Wages and salary 001 Wages and salary 001 Wages and salary 002 Operating surplus 002 Operating surplus 002 Operating surplus 002 Operating surplus 003 Depreciation 003 Depreciation 003 Depreciation 003 Depreciation 004 Indirect taxes less subsidies 004 Indirect taxes less subsidies 004 Indirect taxes less subsidies 004 Indirect taxes less subsidies 40
11.F. Taiwan. Hsing-Chun Lin, Lin-Chun Chung and Ruey-Wan Liou. References
 11.F Taiwan Hsing-Chun Lin, Lin-Chun Chung and Ruey-Wan Liou This documentation outlines the main procedure followed by the Directorate-General of Budget, Accounting and Statistics (DGBAS), Executive Yuan,
China. Li Shantong and He Janus Data Source. 2. Sector Classification
 China Li Shantong and He Janus 1 1. Data Source The source of the initial input-output (I-O) table for China is "Input-Output Table of China - 2002 from the Department of National Economy Accounting, State
Hsing-Chun Lin and Shih-Hsun Hsu
 Taiwan Hsing-Chun Lin and Shih-Hsun Hsu 1. Initial Input-Output Table This source of the initial input-output (I-O) table for Taiwan is Input-Output Table of Taiwan-2006 from the Directorate-General of
Journal of Physics: Conference Series. Related content. Recent citations PAPER OPEN ACCESS
 Journal of Physics: Conference Series PAPER OPEN ACCESS An application of input-output analysis in analyzing the impacts of final demands changes on the total outputs of Japanese energy sectors: A further
Turkey. Mustafa Acar The original input-output table
 14.12 Turkey Mustafa Acar 14.12.1 The original input-output table The source table for Turkey s input-output (I/O) table is The Input-Output Structure of the Turkish Economy 1990, published by the State
China. Liu Yu 1 and Li Xiangyang Data Source
 China Liu Yu 1 and Li Xiangyang 2 The China IO table in the GTAP 8 Data Base is constructed from key 2007 IO table published by National Bureau of Statistics of China (NBS) and some other data sources,
Table 1 shows the general form of China 2010 I-O Table:
 China Liu Yu 1 and Jie Chen The original 2010 Input-Output Table doesn t have multi-product sector. After some adjustments, the data tables are reclassified and re-balanced to provide the matrices required
Industries for PI+ v2.2
 1 Forestry, fishing and hunting 113-115 1 Forestry and Logging; Fishing, hunting and trapping 113, 114 1 Forestry and Logging 113 2 Fishing, hunting and trapping 114 2 Support activities for agriculture
14.6. Finland and Sweden. Leena Kerkelä Finland
 14.6 Finland and Sweden Leena Kerkelä 14.6.1 Finland Finland is part of the European Union (EU) countries but for studying country specific issues we built a separate table for Finland and Sweden. For
Detailed Industries for PI + v1.3 Detailed Industries for PI + v1.4
 Detailed Industries for PI + v1.3 Detailed Industries for PI + v1.4 1 Forestry; Fishing, hunting, and Forestry; Fishing, hunting, and 1131,1132,114 1 trapping trapping 1131,1132,114 2 Logging 1133 2 Logging
Soaring Oil Prices Induce Other Energy Product Price Increases And Further Economic Impact in Japan and Korea
 Soaring Oil Prices Induce Other Energy Product Price Increases And Further Economic Impact in Japan and Korea M. Ichihashi, S. Kaneko, * and H. Kim * Hiroshima University Abstract This paper analyzes how
MINISTRY OF PLANNING AND INVESTMENT LAO STATISTICS BUREAU
 Workshop on Energy Statistics for ASEAN Countries Kuala Lumpur, Malaysia 21-23 November 2016 Data Collection On Energy Statistics and Using Data to Establish The Supply and Use Table Sypaseut NAVONGSA
European Union, Trade in goods with ASEAN (Association Of South-East Asian Nations)
") European Union, Trade in goods with ASEAN (Association Of South-East Asian Nations) ASEAN (Association Of South-East Asian Nations) Brunei, Cambodia, Indonesia, Laos, Malaysia, Myanmar, Philippines, Singapore,
European Union, Trade in goods with ASEAN (Association Of South-East Asian Nations) ASEAN (Association Of South-East Asian Nations) Brunei, Cambodia, Indonesia, Laos, Malaysia, Myanmar, Philippines, Singapore,
I. MAIN ECONOMIC INDICATORS OF INDUSTRY
 I. MAIN ECONOMIC INDICATORS OF INDUSTRY MAIN INDICATORS OF INDUSTRY * 1995 Number of establishments 773 1050 1177 1234 1713 1816 2053 Output volume (at current prices), mln. drams 172048.2 261167.6 283484.8
European Union, Trade in goods with ASEAN (Association Of South-East Asian Nations)
") European Union, Trade in goods with ASEAN (Association Of South-East Asian Nations) ASEAN (ASSOCIATION OF SOUTH-EAST ASIAN NATIONS) Brunei, Cambodia, Indonesia, Lao (People's Democratic Republic), Malaysia,
European Union, Trade in goods with ASEAN (Association Of South-East Asian Nations) ASEAN (ASSOCIATION OF SOUTH-EAST ASIAN NATIONS) Brunei, Cambodia, Indonesia, Lao (People's Democratic Republic), Malaysia,
6.1 Direct Requirements Coefficients
 Chapter 6 Data Base Summary: Input-Output Multipliers Betina V. Dimaranan and Robert A. McDougall For many purposes it is useful to know the answer to the following question: If the final demand for a
LITHUANIA CHINA BILATERAL TRADE
 LITHUANIA CHINA BILATERAL TRADE Review 2018.09.11 1 SUMMARY The trade relationship between Lithuania and China is intense in imports of goods, but less so in exports of goods. The share of imports in turnover
European Union, Trade in goods with APEC (Asia Pacific Economic Cooperation)
") European Union, Trade in goods with APEC (Asia Pacific Economic Cooperation) APEC (ASIA PACIFIC ECONOMIC COOPERATION) Australia, Brunei, Canada, Chile, China, Hong Kong, Indonesia, Japan, Malaysia, Mexico,
European Union, Trade in goods with APEC (Asia Pacific Economic Cooperation) APEC (ASIA PACIFIC ECONOMIC COOPERATION) Australia, Brunei, Canada, Chile, China, Hong Kong, Indonesia, Japan, Malaysia, Mexico,
External Backward Linkage and External Forward Linkage in Asian International Input-Output Table. Toshiaki Hasegawa
 The 20 th NFORUM World Conference Firenze, Italy, September 2-9, 2012 External Backward Linkage and External Forward Linkage in Asian International Input-Output Table 1 Toshiaki Hasegawa Faculty of Economics
European Union, Trade in goods with Papua New Guinea
 European Union, Trade in goods with Papua New Guinea Table of Contents pg - Key Figures 2 - / 2017 2 - - AMA/NAMA product Groups 2 - - SITC product Groups 2 - - Top 5 - HS sections 2 - - Top 5 - SITC sections
Raffles Place, , Singapore. ISO 9001: 2015 Quality Management System Certification
 ISO 9001: 2015 Quality Management System Certification EA Code 1 3 5 7 8 9 10 12 14 15 16 17 18 19 20 22 23 24 25 27 28 29 30 31 32 33 34 35 36 37 38 39 Agriculture, forestry and fishing Food products,
Landscape of global agrofood GVCs: the place of China
 Landscape of global agrofood GVCs: the place of China OECD-ATPC-ICTSD Workshop Agro-Food Global Value Chains and Farm Policy: The place of China Dr Jared Greenville, Senior Agriculture Policy Analyst,
European Union, Trade in goods with Brunei
 European Union, Trade in goods with Brunei Table of Contents pg - Key Figures 2 - / 2017 2 - - AMA/NAMA product Groups 2 - - SITC product Groups 2 - - Top 5 - HS sections 2 - - Top 5 - SITC sections 2
European Union, Trade in goods with Thailand
 European Union, Trade in goods with Thailand Table of Contents pg - Key Figures 2 - / 2016 2 - - AMA/NAMA product Groups 2 - - SITC product Groups 2 - - Top 5 - HS sections 2 - - Top 5 - SITC sections
European Union, Trade in goods with Brunei
 European Union, Trade in goods with Brunei Table of Contents pg - Key Figures 2 - / 2017 2 - - AMA/NAMA product Groups 2 - - SITC product Groups 2 - - Top 5 - HS sections 2 - - Top 5 - SITC sections 2
European Union, Trade in goods with Singapore
 European Union, Trade in goods with Singapore Table of Contents pg - Key Figures 2 - / 2017 2 - - AMA/NAMA product Groups 2 - - SITC product Groups 2 - - Top 5 - HS sections 2 - - Top 5 - SITC sections
U.S.-Asia trade: dynamic general equilibrium linkages Robert Koopman, Marinos Tsigas, Zhi Wang (USITC) and Xin Li (Peking University)
 and Xin Li (Peking University)") The Institute for International Economic G2 at GW The 5th Annual Conference on U.S.-China Economic Relations and China s Economic Development October 12, Lindner Commons, Elliott School of International
The Institute for International Economic G2 at GW The 5th Annual Conference on U.S.-China Economic Relations and China s Economic Development October 12, Lindner Commons, Elliott School of International
European Union, Trade in goods with Cambodia
 European Union, Trade in goods with Cambodia Table of Contents pg - Key Figures 2 - / 2017 2 - - AMA/NAMA product Groups 2 - - SITC product Groups 2 - - Top 5 - HS sections 2 - - Top 5 - SITC sections
2008 Census of Industrial Production (NACE Rev 2)
") 30 November 2009 Census of Industrial Production (NACE Rev 2) Early Estimates Other 33% Chemicals 7% Computers 18% Food Products 19% Basic Pharmaceutical 23% Industrial Gross value Wages & Year added salaries
30 November 2009 Census of Industrial Production (NACE Rev 2) Early Estimates Other 33% Chemicals 7% Computers 18% Food Products 19% Basic Pharmaceutical 23% Industrial Gross value Wages & Year added salaries
Schedule of Accreditation issued by United Kingdom Accreditation Service 2 Pine Trees, Chertsey Lane, Staines-upon-Thames, TW18 3HR, UK
 2 Pine Trees, Chertsey Lane, Staines-upon-Thames, TW18 3HR, UK Accredited to ISO/IEC 17021-1:2015 to provide environmental - Unit 6, Gordano Court Gordano Gate Business Park Serbert Close Portishead Bristol
Vertical Specialisation in Trade: the case of Malaysia*
 Preliminary Draft Vertical Specialisation in Trade: the case of Malaysia* Wai-Heng Loke Division of Economics University of Nottingham Ningbo China waiheng.loke@nottingham.edu.cn Abstract: The development
Belarus. Irina Tochitskaya. 1. Source Data
 Belarus Irina Tochitskaya The Belarusian input-output (I-O) table in the GTAP 7 p4 Data Base was constructed from inputoutput tables and some supporting data supplied by the Ministry of Statistics and
PHILIPPINES. Sectoral Activities Department. Agriculture & Fishing. Fig. 1: Employment by Major Economic Activity ('000s),
,") PHILIPPINES 35,000 30,000 25,000 20,000 15,000 10,000 Fig. 1: Employment by Major Economic Activity ('000s), 2001-2008 Agriculture, Hunting and Fishing Mining and Quarrying Electricity, Gas and Water Supply
PHILIPPINES 35,000 30,000 25,000 20,000 15,000 10,000 Fig. 1: Employment by Major Economic Activity ('000s), 2001-2008 Agriculture, Hunting and Fishing Mining and Quarrying Electricity, Gas and Water Supply
Page 1 of 7. Table 2.7 Employment and output by industry, 1998, 2008 and projected Average annual rate of change. Average annual rate of change
 Total(1)(2) 140,563.9 150,931.7 166,205.6 10,367.8 15,273.9 0.7 1.0 17,050.0 21,028.4 27,702.7 2.1 2.8 Nonagriculture wage and salary NA 126,624.7 137,814.8 152,443.5 11,190.1 14,628.7 0.9 1.0 16,784.8
List of CDP-ACS. The full list of classifications for CDP s Activity Classification System (CDP-ACS)
") List of CDP-ACS The full list of classifications for CDP s Activity Classification System (CDP-ACS) Contents Introduction to CDP-ACS... 3 List of CDP-ACS... 4 Page 2 of 10 CDP Worldwide 2018 @cdp www.cdp.net
List of CDP-ACS The full list of classifications for CDP s Activity Classification System (CDP-ACS) Contents Introduction to CDP-ACS... 3 List of CDP-ACS... 4 Page 2 of 10 CDP Worldwide 2018 @cdp www.cdp.net
European Union, Trade in goods with Hong Kong
 European Union, Trade in goods with Hong Kong Table of Contents pg - Key Figures 2 - Imports / Exports 2013 2 - - AMA/NAMA product Groups 2 - - SITC product Groups 2 - - Top 5 - HS sections 2 - - Top 5
European Union, Trade in goods with China
 Union, Trade in goods with China Table of Contents pg Union, Trade with China - Key Figures 2 - / 2017 2 - - AMA/NAMA product Groups 2 - - SITC product Groups 2 - - Top 5 - HS sections 2 - - Top 5 - SITC
European Union, Trade in goods with Angola
 Union, Trade in goods with Angola Table of Contents pg Union, Trade with Angola - Key Figures 2 - / 2018 2 - - AMA/NAMA product Groups 2 - - SITC product Groups 2 - - Top 5 - HS sections 2 - - Top 5 -
THE MACHINERY INDUSTRY OF JAPAN 2008
 00 2009 THE MACHINERY INDUSTRY OF JAPAN 2008 CONTENTS 1. Recent Trends in the Machinery Industry 1-1. Production Trends... 1 1-2. Foreign Trade... 1 2. The Importance of the Machinery Sector in Japanese
European Union, Trade in goods with Cambodia
 European Union, Trade in goods with Cambodia Table of Contents pg - Key Figures 2 - / 2017 2 - - AMA/NAMA product Groups 2 - - SITC product Groups 2 - - Top 5 - HS sections 2 - - Top 5 - SITC sections
This table has been produced by. The State & Regional Fiscal Studies Unit, University of Missouri-Columbia
 Table B-39 NAICS Component 1963 1964 1965 1966 1967 1968 1969 1970 1971 All industry total 607,008 650,513 704,697 767,075 811,782 887,569 962,902 1,012,299 1,097,173 Private industries 534,043 572,138
NACE: Statistical Classification of Economic Activities
 NACE: Statistical Classification of Economic Activities NACE Rev.1 : To use until the 2008 operation included Section A Agriculture, hunting and forestry 01 Agriculture, hunting and related service activities
Non-oil Foreign Merchandise Trade. Through the Ports of Abu Dhabi Emirate. Fourth quarter 2014
 Non-oil Foreign Merchandise Trade Through the Ports of Abu Dhabi Emirate Fourth quarter 2014 Date of Release: February 2015 Table of Contents 2 Index of Tables 3 Introduction 4 Key points 5 Non-oil foreign
European Union, Trade in goods with BRIC
 European Union, Trade in goods with BRIC BRIC Brazil, China, India, Russia Table of Contents pg - Key Figures 2 - / 2016 2 - - AMA/NAMA product Groups 2 - - SITC product Groups 2 - - Top 5 - HS sections
European Union, Trade in goods with New Caledonia
 European Union, Trade in goods with New Caledonia Table of Contents pg - Key Figures 2 - / 2017 2 - - AMA/NAMA product Groups 2 - - SITC product Groups 2 - - Top 5 - HS sections 2 - - Top 5 - SITC sections
European Union, Trade in goods with NAFTA (North American Free Trade Agreement)
") Union, Trade in goods with NAFTA (North American Free Trade Agreement) NAFTA (NORTH AMERICAN FREE TRADE AGREEMENT) Canada, Mexico, USA Table of Contents pg Union, Trade with NAFTA (North American Free
Union, Trade in goods with NAFTA (North American Free Trade Agreement) NAFTA (NORTH AMERICAN FREE TRADE AGREEMENT) Canada, Mexico, USA Table of Contents pg Union, Trade with NAFTA (North American Free
INDONESIA. Manufacturing: Food & Beverages. Sectoral Activities Department
 INDONESIA Manufacturing: Food & Beverages Key Labour Market Indicators (2009) Economically Active Population Total: 113,740,000 13,000 12,500 12,000 11,500 11,000 10,500 10,000 Fig.1: Employment in Manufacturing
European Union, Trade in goods with Angola
 European Union, Trade in goods with Angola Table of Contents pg - Key Figures 2 - / 2017 2 - - AMA/NAMA product Groups 2 - - SITC product Groups 2 - - Top 5 - HS sections 2 - - Top 5 - SITC sections 2
INDONESIA. Sectoral Activities Department. Agriculture. Fig. 1: Employment by Major Economic Activity ('000s)
") INDONESIA 100,000 80,000 60,000 40,000 20,000 2,500,000 2,000,000 1,500,000 1,000,000 500,000 0 0 Fig. 1: Employment by Major Economic Activity ('000s) 2000-2008 2000 2002 2004 2006 2008 Fig. 2: Sectoral
INDONESIA 100,000 80,000 60,000 40,000 20,000 2,500,000 2,000,000 1,500,000 1,000,000 500,000 0 0 Fig. 1: Employment by Major Economic Activity ('000s) 2000-2008 2000 2002 2004 2006 2008 Fig. 2: Sectoral
European Union, Trade in goods with Mozambique
 European Union, Trade in goods with Mozambique Table of Contents pg - Key Figures 2 - / 2017 2 - - AMA/NAMA product Groups 2 - - SITC product Groups 2 - - Top 5 - HS sections 2 - - Top 5 - SITC sections
This table has been produced by. The State & Regional Fiscal Studies Unit, University of Missouri-Columbia
 Table B-39 NAICS Component *1987 1988 1989 1990 1991 1992 All industry total 6,076,695 6,398,624 6,540,047 6,638,210 6,627,809 6,828,525 Private industries 5,195,468 5,492,391 5,612,260 5,690,087 5,677,736
Economic Growth and Information Technology in the U.S. and Japan
 Economic Growth and Information Technology in the U.S. and Japan Dale W. Jorgenson (Harvard University) Koji Nomura (Keio University) Economic and Social Research Institute, Cabinet Office June 25, 2007,
Mapping and identification of the regional potential of the Republic of Moldova
 The European Commission s science and knowledge service Joint Research Centre Mapping and identification of the regional potential of the Republic of Moldova Hugo Hollanders, Lina Stanionyte Launching
European Union, Trade in goods with Asia
 European Union, Trade in goods with Asia ASIA Afghanistan, Armenia, Azerbaijan, Bahrain, Bangladesh, Bhutan, Brunei, Cambodia, China, Gaza + Jericho, Georgia, Hong Kong, India, Indonesia, Iran, Iraq, Israel,
Introductory text and technical notes 335. Table 16.1 Average weekly earnings for each industrial sector 337
 Earnings 16 Introductory text and technical notes 335 Table 16.1 Average weekly earnings for each industrial sector 337 Table 16.2 Average hourly earnings for each industrial sector 338 Table 16.3 Table
The Taiwanese Economy
 The Taiwanese Economy A new dynamic after the Economic Crisis March 22, 2012 1 The Taiwanese economy in a few words Important figures TAIWAN, 5 th ECONOMIC POWER IN ASIA A DYNAMIC ECONOMY 2011 GDP Growth:
European Union, Trade in goods with Bangladesh
 European Union, Trade in goods with Bangladesh Table of Contents pg - Key Figures 2 - / 2017 2 - - AMA/NAMA product Groups 2 - - SITC product Groups 2 - - Top 5 - HS sections 2 - - Top 5 - SITC sections
Schedule of Accreditation issued by United Kingdom Accreditation Service 2 Pine Trees, Chertsey Lane, Staines-upon-Thames, TW18 3HR, UK
 2 Pine Trees, Chertsey Lane, Staines-upon-Thames, TW18 3HR, UK P.O.B 619-182 Taiji Commercial Building No. 211 Bei Si Huan Zhong Lu Haidian District Beijing 100083 P.R. China Contact: Mr Wang Xuefeng Tel:
In the original I-O Table, all transactions are reported in billions of Turkish Lira (TL). 3
. 3") Turkey Mustafa Acar *, Levent Aydın ** 1. The original input-output table The source table for Turkey s Input-Output (I-O) table is The Input-Output Structure of the Turkish Economy 2002, published by
Turkey Mustafa Acar *, Levent Aydın ** 1. The original input-output table The source table for Turkey s Input-Output (I-O) table is The Input-Output Structure of the Turkish Economy 2002, published by
European Union, Trade in goods with OECD (excl EU incl US Virgin Isl)
") European Union, Trade in goods with OECD (excl EU incl US Virgin Isl) OECD (excl EU incl US Virgin Isl) Australia, Canada, Chile, Iceland, Israel, Japan, Mexico, New Zealand, Norway, South Korea, Switzerland,
European Union, Trade in goods with OECD (excl EU incl US Virgin Isl) OECD (excl EU incl US Virgin Isl) Australia, Canada, Chile, Iceland, Israel, Japan, Mexico, New Zealand, Norway, South Korea, Switzerland,
WORLD KLEMS AND ASIA KLEMS
 WORLD KLEMS AND ASIA KLEMS By Dale W. Jorgenson Harvard University First Asia KLEMS Conference Asian Development Bank Institute Tokyo, Japan July 27, 2011 http://economics.harvard.edu/faculty/jorgenson/
Schedule of Accreditation issued by United Kingdom Accreditation Service 2 Pine Trees, Chertsey Lane, Staines-upon-Thames, TW18 3HR, UK
 2 Pine Trees, Chertsey Lane, Staines-upon-Thames, TW18 3HR, UK Accredited to ISO/IEC ISO 17021-1:2015 to provide quality Stocking Lane High Wycombe Buckinghamshire HP14 4ND Contact: Mr Alan Gower Tel:
THE ECONOMIC IMPACT OF INFORMATION TECHNOLOGIES AFTER THE FINANCIAL CRISIS
 THE ECONOMIC IMPACT OF INFORMATION TECHNOLOGIES AFTER THE FINANCIAL CRISIS Dale W. Jorgenson, Harvard University http://economics.harvard.edu/faculty/jorgenson/ Keynote Lecture to the Annual Conference
European Union, Trade in goods with Asia (all countries)
") European Union, Trade in goods with Asia (all countries) Asia (all countries) Afghanistan, Armenia, Azerbaijan, Bahrain, Bangladesh, Bhutan, Brunei, Cambodia, China, Georgia, Hong Kong, India, Indonesia,
European Union, Trade in goods with Asia (all countries) Asia (all countries) Afghanistan, Armenia, Azerbaijan, Bahrain, Bangladesh, Bhutan, Brunei, Cambodia, China, Georgia, Hong Kong, India, Indonesia,
Country Profile Oman
 Country Profile Oman Introduction Location Middle East, bordering the Arabian Sea, Gulf of Oman, and Persian Gulf, between Yemen and the UAE Capital Muscat Area 309,500 sq. km Population 3,424,386 (July
Manufacturing 2016 SECTOR SPOTLIGHT NAICS Report Contents. What is this industry sector? STATISTICS CANADA DEFINITION SECTOR STRUCTURE
 2016 SECTOR SPOTLIGHT NAICS 31-33 Manufacturing Report Contents What is this industry sector? STATISTICS CANADA DEFINITION SECTOR STRUCTURE How does this sector stack up in Ottawa? OTTAWA DASHBOARD HIGHLIGHTS
GUIDANCE FOR THE ACCREDITATION OF HEALTH AND SAFETY MANAGEMENT SYSTEM CERTIFICATION BODIES
 GUIDANCE FOR THE ACCREDITATION OF HEALTH AND SAFETY MANAGEMENT SYSTEM CERTIFICATION BODIES ΕΣΥ GA-H&S/01/02/08-07-2010 1 ΕΣΥ GA-H&S Issue: 01 Revision: 02 Issue Date: 11-07-2003 Revision Date: 08-07-2010
CANADA. Sectoral Activities Department. Wholesale & Retail Trade. Fig. 1: Employment by Major Economic Activity ('000s),
,") CANADA Fig. 1: Employment by Major Economic Activity ('000s), 2000-2008 20,000 18,000 16,000 14,000 12,000 10,000 8,000 6,000 4,000 2,000 0 2000 2002 2004 2006 2008 Agriculture, Forestry, Fishing Mining
CANADA Fig. 1: Employment by Major Economic Activity ('000s), 2000-2008 20,000 18,000 16,000 14,000 12,000 10,000 8,000 6,000 4,000 2,000 0 2000 2002 2004 2006 2008 Agriculture, Forestry, Fishing Mining
European Union, Trade in goods with USA
 Union, Trade in goods with USA Table of Contents pg Union, Trade with USA - Key Figures 2 - / 2018 2 - - AMA/NAMA product Groups 2 - - SITC product Groups 2 - - Top 5 - HS sections 2 - - Top 5 - SITC sections
European Union, Trade in goods with Haiti
 European Union, Trade in goods with Haiti Table of Contents pg - Key Figures 2 - / 2017 2 - - AMA/NAMA product Groups 2 - - SITC product Groups 2 - - Top 5 - HS sections 2 - - Top 5 - SITC sections 2 -
Schedule of Accreditation issued by United Kingdom Accreditation Service 2 Pine Trees, Chertsey Lane, Staines-upon-Thames, TW18 3HR, UK
 2 Pine Trees, Chertsey Lane, Staines-upon-Thames, TW18 3HR, UK Delta 100 Delta Business Park Great Western Way Swindon SN5 7XP Contact: Khairul Bashar Tel: +44 (0)1793 492892 Fax: +44 (0)1793 492692 Email:
European Union, Trade in goods with Iraq
 European Union, Trade in goods with Iraq Table of Contents pg - Key Figures 2 - / 2014 2 - - AMA/NAMA product Groups 2 - - SITC product Groups 2 - - Top 5 - HS sections 2 - - Top 5 - SITC sections 2 -
14.3. Andean countries. Juan Jose Echavarría and Maria Arbeláez Characteristics of the I/O matrix in each country and secondary sources
 14.3 Andean countries Juan Jose Echavarría and Maria Arbeláez This chapter documents the procedure followed in compiling the input-output (I/O) tables for Colombia, Venezuela and "the rest of the Andean
UN List of Industrial Products
 UN List of Industrial Products United Nations Statistics Division Workshop on Classifications, Montevideo, Uruguay, 14-18 March 2005 25/04/2005 1 History UN list of industrial products was developed in
European Union, Trade in goods with Azerbaijan
 European Union, Trade in goods with Azerbaijan Table of Contents pg - Key Figures 2 - / 2016 2 - - AMA/NAMA product Groups 2 - - SITC product Groups 2 - - Top 5 - HS sections 2 - - Top 5 - SITC sections
European Union, Trade in goods with South Korea
 Union, Trade in goods with South Korea Table of Contents pg Union, Trade with South Korea - Key Figures 2 - / 2017 2 - - AMA/NAMA product Groups 2 - - SITC product Groups 2 - - Top 5 - HS sections 2 -
European Union, Trade in goods with South Korea
 European Union, Trade in goods with South Korea Table of Contents pg - Key Figures 2 - / 2016 2 - - AMA/NAMA product Groups 2 - - SITC product Groups 2 - - Top 5 - HS sections 2 - - Top 5 - SITC sections
European Union, Trade in goods with Qatar
 European Union, Trade in goods with Qatar Table of Contents pg - Key Figures 2 - / 2017 2 - - AMA/NAMA product Groups 2 - - SITC product Groups 2 - - Top 5 - HS sections 2 - - Top 5 - SITC sections 2 -
Country Profile Iran
 Country Profile Iran Introduction Location Capital Middle East, bordering the Gulf of Oman, the Persian Gulf, and the Caspian Sea, between Iraq and Pakistan Tehran Area 1,648,195 sq. km Population Independence
European Union, Trade in goods with ACP - Pacific Countries
 European Union, Trade in goods with ACP - Pacific Countries ACP - Pacific Countries Cook Islands, Fiji, Kiribati, Marshall Islands, Micronesia, Nauru, Niue, Palau, Papua New Guinea, Samoa, Solomon Islands,
European Union, Trade in goods with Equatorial Guinea
 Union, Trade in goods with Equatorial Guinea Table of Contents pg Union, Trade with Equatorial Guinea - Key Figures 2 - / 2017 2 - - AMA/NAMA product Groups 2 - - SITC product Groups 2 - - Top 5 - HS sections
The Gross National Product (GNP) is GDP added by net foreign income. National Income is GNP deducted by indirect net taxes (net) and depreciation.
 is GDP added by net foreign income. National Income is GNP deducted by indirect net taxes (net) and depreciation.") M E T A D A T A BASIC INFORMATION 1 Data Category : Gross Domestic Product (GDP) 2 Statistics Disseminator : Statistics Department, Bank Indonesia 3 Address : Jl. M.H. Thamrin No. 2 Jakarta 4 Contact :
M E T A D A T A BASIC INFORMATION 1 Data Category : Gross Domestic Product (GDP) 2 Statistics Disseminator : Statistics Department, Bank Indonesia 3 Address : Jl. M.H. Thamrin No. 2 Jakarta 4 Contact :
European Union, Trade in goods with ACP -- West Africa
 European Union, Trade in goods with ACP -- West Africa ACP -- West Africa Benin, Burkina Faso, Cape Verde, Gambia, Ghana, Guinea, Guinea Bissau, Ivory Coast, Liberia, Mali, Mauritania, Niger, Nigeria,
Kiyoshi Kobayashi (Kyoto University)
") Online Publication Date: 10 March, 2012 Publisher: Asian Economic and Social Society Vietnam Economic Structure Change Based on Input-Output Table (2000-2007) Bui Trinh (National Account Department of
Online Publication Date: 10 March, 2012 Publisher: Asian Economic and Social Society Vietnam Economic Structure Change Based on Input-Output Table (2000-2007) Bui Trinh (National Account Department of
European Union, Trade in goods with Panama
 Union, Trade in goods with Panama Table of Contents pg Union, Trade with Panama - Key Figures 2 - / 2018 2 - - AMA/NAMA product Groups 2 - - SITC product Groups 2 - - Top 5 - HS sections 2 - - Top 5 -
Other unpublished data from the Central Bureau of Statistics of Namibia were used to make adjustments when necessary.
 Namibia Michael Begg and Lelly Nghixulifwa 1. Introduction This document describes the steps behind the creation of the first Input-Output (I-O) table of Namibia for the Global Trade Analysis Project (GTAP)
Producer Price Index in Iran Shahrivar 1397
 (August 23 September 22, 2018) Central Bank of the Islamic Republic of Iran General Directorate of Economic Statistics (August 23 - September 22, 2018) (1395 = 100) Economic Statistics Department www.cbi.ir
GUIDELINES FOR DESCRIBING THE ACCREDITATION SCOPE OF CERTIFICATION BODIES CERTIFYING MANAGEMENT SYSTEMS
 GUIDELINES FOR DESCRIBING THE ACCREDITATION SCOPE OF CERTIFICATION BODIES CERTIFYING MANAGEMENT SYSTEMS Reviewed by: Natalija Jovičić Zarić MSc, Quality Manager (QM) Approved by: Dejan Krnjaić PhD, Director
European Union, Trade in goods with Pakistan
 Union, Trade in goods with Pakistan Table of Contents pg Union, Trade with Pakistan - Key Figures 2 - / 2018 2 - - AMA/NAMA product Groups 2 - - SITC product Groups 2 - - Top 5 - HS sections 2 - - Top
The Real Economy. Chapter-2
 2.1 The Bangladesh economy experienced an impressive growth in FY18, underpinned by strong domestic and external demand, as reflected in buoyant public and private investment and consumption, driven by
European Union, Trade in goods with Botswana
 European Union, Trade in goods with Botswana Table of Contents pg - Key Figures 2 - / 2017 2 - - AMA/NAMA product Groups 2 - - SITC product Groups 2 - - Top 5 - HS sections 2 - - Top 5 - SITC sections
Measuring the Effect of Louisiana Agriculture on the State Economy Through Multiplier and Impact Analysis
 October 1995 Number 849 Measuring the Effect of Louisiana Agriculture on the State Economy Through Multiplier and Impact Analysis By David W. Hughes 1 Table of Contents Introduction... 3 Input-Output Model
European Union, Trade in goods with Israel
 Union, Trade in goods with Israel Table of Contents pg Union, Trade with Israel - Key Figures 2 - Imports / Exports 2013 2 - - AMA/NAMA product Groups 2 - - SITC product Groups 2 - - Top 5 - HS sections
Canadian International Merchandise Trade
 Catalogue no. 65-001-X Vol. 69, no. 9. Canadian International Merchandise Trade. Statistical tables Table 1 Merchandise trade of Canada, balance of payments basis, seasonally adjusted - Current dollars
Canadian International Merchandise Trade
 Catalogue no. 65-001-X Vol. 69, no. 7. Canadian International Merchandise Trade. Statistical tables Table 1 Merchandise trade of Canada, balance of payments basis, seasonally adjusted - Current dollars
Canadian International Merchandise Trade
 Catalogue no. 65-001-X Vol. 69, no. 12. Canadian International Merchandise Trade. Statistical tables Table 1 Merchandise trade of Canada, balance of payments basis, seasonally adjusted - Current dollars
Canadian International Merchandise Trade
 Catalogue no. 65-001-X Vol. 66, no. 9. Canadian International Merchandise Trade. Statistical tables Table 1 Merchandise trade of Canada, balance of payments basis, seasonally adjusted Current dollars Export
European Union, Trade in goods with Ivory Coast
 European Union, Trade in goods with Ivory Coast Table of Contents pg - Key Figures 2 - / 2017 2 - - AMA/NAMA product Groups 2 - - SITC product Groups 2 - - Top 5 - HS sections 2 - - Top 5 - SITC sections
Economic Outlook Update
 ECONOMIC OUTLOOK December 2015 Economic Outlook Update -February 2017- Table of Contents: 1. Global and Regional economy 2. Domestic Outlook 2.1 Primary Industries 2.2 Secondary Industries 2.3 Tertiary