Biogas Energy Management Study Final Submittal
|
|
|
- Walter Neal
- 5 years ago
- Views:
Transcription


1 City of Klamath Falls Spring Street Sewage Treatment Plant Biogas Energy Management Study Final Submittal March 2010
2 Table of Contents Biogas Energy Management Final Report Table of Contents... 1 Section 1 - Executive Summary... 3 Section 2 - Introduction Background Project Goals... 9 Section 3 Fats, Oils, and Grease Receiving Process Description Benefits of FOG Receiving Survey of FOG Availability Large-Scale Sources Small-Scale Sources Recommendation Section 4 Biogas Alternatives Utilization Categories Heat Cogeneration Biomethane Biogas Treatment Hydrogen Sulfide (H 2 S) Moisture Siloxanes Particulates Carbon Dioxide (CO 2 ) Selected Alternatives Biogas Boiler Section 5 Evaluation of Alternatives Economic Analysis Capital Costs Operations and Maintenance Business Case Evaluation Non-Economic Considerations Risk Noise Odors Traffic Emissions Section 6 Grants and Incentives Grants Incentives Grant and Incentive Funding Sensitivity Section 7 Biogas Energy Management Workshop Workshop Recommendation Next Steps
3 Biogas Energy Management Final Report List of Tables 2.1 Spring Street Energy Demands and Costs Klamath Falls Sewage Pumpers Gas Quality Standards Capital Cost Estimates O&M Estimates Net Present Value Analysis Net Present Value Analysis High Energy Prices Sensitivity Net Present Value Analysis High Power Prices Sensitivity Net Present Value Analysis High Fuel Prices Sensitivity Net Present Value Analysis Cost of Money Sensitivity Risk Analysis List of Figures 1.1 Payback Period versus Grant and Incentive Funding Project Overview Anaerobic Digesters Grease Interceptor Biogas Boiler Process Flow Schematic Biogas Boiler Mechanical Site Plan Cogeneration engine Process Flow Schematic Cogeneration Mechanical Site Plan Biomethane Process Flow Schematic Biomethane Mechanical Site Plan Hybrid Process Flow Schematic Hybrid Mechanical Site Plan Status Quo Process Flow Schematic Cogeneration Noise Levels Site Plant Carbon Dioxide Emissions Comparison Payback Period versus Grant and Incentive Funding List of Appendices Appendix A Appendix B Appendix C Appendix D Appendix E Appendix F Appendix G Appendix H Biogas Alternatives Identification Technical Memorandum Vendor Materials Cost Estimates Operations and Maintenance Workshop Materials CNG Vehicle Conversion Grant and Incentive Funding Calculations 2
4 Biogas Energy Management Final Report Section 1 - Executive Summary The City of Klamath Falls (City) is currently generating an average of 42,800 cubic feet of biogas per day at the Spring Street Sewage Treatment Plant (Spring Street). The biogas generated has a raw energy content of approximately 280 kw. By 2030 growth in the plant s service population is expected to increase biogas production to 60,000 cubic feet per day, with a raw energy content of approximately 385 kw. The existing operations practice is to flare all biogas generated with no beneficial use. Flaring is employed, because the facility lacks appropriate utilization equipment. The City has recognized that while flaring biogas is a common and permissible practice, it is not an ideal operation. Specifically, the City has identified the potential to use the biogas as a renewable energy source, providing an environmental and economic benefit to the facility and the surrounding community. To begin to realize this benefit and to further define the appropriate course of action, the City initiated a Biogas Energy Management Study with CDM. The study was financed through a $50,817 grant from the Oregon Economic and Community Development Department and a 27 percent match from the City. The study focused on a comparative evaluation of four biogas utilization alternatives, the feasibility of augmenting the biogas supply through the addition of fats, oils, and greases to the digesters, and assessing the available grants and incentives for biogas utilization projects. The four biogas utilization alternatives investigated were: Biogas Boiler: The existing natural gas boiler, which is in poor condition, is replaced with a new biogas boiler. Biogas treatment to remove hydrogen sulfide (H 2 S), moisture and particulates is also installed. Excess biogas not required for heat production, about 45 percent of biogas generated, is flared. Cogeneration: A 140 kw internal combustion engine is installed to generate heat and power for the facility. Biogas treatment to remove H 2 S, moisture, particulates, and siloxanes is included to prevent equipment deterioration. All available biogas is used by the system, which produces 40 percent of the facility s average power demand and 95 percent of the facility s average heat demand. A new biogas boiler is installed to replace the existing natural gas boiler and provide a backup heat source. Biomethane Generation: A biogas treatment system is installed to remove all the non-methane components of the gas (H 2 S, moisture, particulates, siloxanes and CO 2 ). The product gas is of equivalent quality to natural gas and is termed biomethane. The biomethane is compressed to between 3,000 and 5,000 psig and is dispensed as compressed natural gas (CNG) vehicle fuel. A total of 66 City vehicles are converted to operate on CNG to use the fuel. In addition to the vehicle fueling equipment, a new biogas boiler is installed to replace the existing natural gas boiler. Hybrid: In addition to the equipment installed in the cogeneration alternative, a smaller biomethane and vehicle fueling system capable of servicing 25 3
5 Biogas Energy Management Final Report vehicles is installed. All available biogas is used by the system, which generates 29 percent of the facility s average power demand and 65 percent of the facility s average heat demand. To provide a common basis of comparison, all four alternatives were compared to a Status Quo alternative. The status quo maintains operations as they currently exist at Spring Street, including continued flaring of the biogas, and reliance on their conventional heat, power and vehicle fuel sources. As the existing natural gas boiler is in poor condition and has a limited serviceable life remaining, this alternative also includes the installation of a new natural gas boiler. The alternatives comparison included economic (capital cost, O&M costs, net present values, funding availability) and non-economic considerations (emissions, noise, odor, traffic, operability, risk) and was reported to the City in a workshop on December 4 th, At the conclusion of the workshop, the cogeneration alternative was selected as the recommended biogas utilization alternative for subsequent development. This conclusion was based on the alternative s positive net present value after a 15 year economic period, the number of potential grants and incentives available for cogeneration projects, the potential to reduce carbon dioxide emissions from the City by 500 tons/year (the equivalent to removing approximately 80 vehicles off of the road), the familiarity of the process and the equipment for operations staff, the low risk associated with the alternative, and because the alternative is not anticipated to have a negative visual or noise impact on the surrounding community. Conversely, the biomethane and hybrid alternatives had such high initial capital costs, and comparable or less favorable non-economic benefits that they were not considered for full scale implementation. The recommendation of the cogeneration alternative was further supported by a sensitivity analysis that compared the payback period of the alternatives with the amount of grant or incentive funding secured for the project. No grant or incentive funding has been secured at this time, although potential grants and incentives appropriate and available for biogas projects are identified and discussed within this report. The sensitivity analysis is conveyed in Figure 1.1. The figure shows the payback period in years on the y-axis, and the value of grant or incentive funding on the x-axis. As would be expected, as funding increases, the payback period decreases. This analysis provides a simple metric for determining how an individual grant or incentive could impact the payback for a particular alternative. 4
6 Biogas Energy Management Final Report Figure 1.1: Payback Period versus Grant and Incentive Funding Potential grants and incentive sources for a Spring Street biogas project include the Oregon Business Energy Tax Credit (BETC) program, American Resource and Recovery Act funding, the Oregon State Energy Loan Program, the Oregon Energy Trust, and the Climate Trust. These funding sources, as well as other federal and state grants have been investigated as part of this study to help reduce overall projects costs and reduce the anticipated project payback period. Without funding, the payback period for a cogeneration project is estimated at 15 years. A fats, oils, and grease (FOG) collection program was also investigated for inclusion at Spring Street as part of the Biogas Energy Management Study. A FOG collection and receiving station would provide two key benefits to the facility. FOG would be prevented from entering the collection system where it has the potential to clog lines and cause sanitary sewer overflows, and it would provide an additional organic food source for the digesters. The increased organic loading to the digester would help to increase biogas production at the facility. A survey of sludge pumpers and food service establishment in the area was conducted to determine the quantity and accessibility of FOG available for collection. Based on this survey, it was determined that an inadequate supply of FOG is currently available within the Spring Street service area to sustain a collection program and receiving system. It was estimated that approximately 4,000 gallons of FOG are available for collection each month. Typically, for a city the size of Klamath Falls, it would be expected that approximately 36,000 gallons of dilute FOG would be generated each month. The main reason for 5
7 Biogas Energy Management Final Report the low collection volume is that many food service establishments lack grease interceptors on their sewer laterals, and thus do not have a collection point for their discharged wastes. FOG from these establishments is conveyed through the collection system with the other wastes and remains a potential clogging hazard in the City s collection system infrastructure. If additional food service establishments install grease interceptors, then a FOG collection program could become viable. The City was correct in identifying the available biogas at Spring Street as potential renewable energy source that could provide an economic and environmental benefit to the City and it s residents. Based on the findings of the Biogas Energy Management Study, it is recommended that the City pursue grant and incentive funding for a cogeneration project on an internal combustion engine platform and that the City proceed to the design phase for a cogeneration project. 6
 and a partial match from the City.")

8 Section 2 - Introduction Biogas Energy Management Final Report This report summarizes the work finished under the Biogas Energy Management Study initiated by the City of Klamath Falls. Funding for the study was provided by a grant from the Oregon Economic and Community Development Department (OECDD) and a partial match from the City. The purpose of this study was to identify the most promising biogas utilization technology for application at the Spring Street Sewage Treatment Plant. Four biogas utilization alternatives were identified, developed, and evaluated as part of this work. The augmentation of the biogas supply through the addition of fats, oils and greases to the digesters (i.e., co-digestion) was also investigated. A separate task was included to identify potential grants and economic incentives available to fund the identified alternatives. Figure 2.1 gives an overview of the study s sequence, activities, and deliverables. This report is part of Task 6. Figure 2.1 Project Overview 7

9 Biogas Energy Management Final Report 2.1 Background In the Facilities Plan submitted by CDM on April 30 th 2009, CDM identified the unused biogas generated in the anaerobic digesters at Spring Street as a potential energy and revenue source for the City. The high energy content of the biogas makes it a common renewable energy source at wastewater treatment plants. Typical applications include heat generation and cogeneration, although there is increased interest in generating a product of equivalent quality to natural gas, termed biomethane. Biomethane can be sold back to a natural gas utility or compressed and dispensed as a vehicle fuel. Spring Street currently spends approximately $200,000 a year on power (electricity), natural gas, and geothermal heat. A breakdown of Spring Street s energy demands for a 12-month period between August 2008 and August 2009 is provided in Table 2.1. Energy Source 12-month Demand Units Cost/Unit Cost ($/yr) Electricity 2,491,800 kwh $0.06 $149,135 Natural Gas 11,602 therms $1.33 $15,485 Geothermal 33,370 therms $0.95 $31,786 Total $196,407 Table 2.1 Spring Street Energy Demands and Costs The facility also generates an average of 42,800 cubic feet of biogas per day in their existing mesophilic anaerobic digesters, see Figure 2.2. By the year 2030, the biogas flow is expected to increase to 60,000 cubic feet per day due to growth in the service population of the facility. Figure 2.2 Anaerobic Digesters 8
10 Biogas Energy Management Final Report All biogas generated at Spring Street is flared in a waste gas burner with no beneficial use available at the facility. The energy content of the flared biogas averages 280 kw (230 therms/day). To capture this energy source for beneficial means, the facility will require biogas treatment and biogas utilization equipment. The treatment equipment will increase the quality of the gas prior to utilization and will prevent damage to the downstream equipment. The utilization equipment will convert the biogas fuel to a more readily usable energy product such as heat, power or vehicle fuel. Conceptual designs and evaluations were developed for the four utilization alternatives listed below: Alternative 1: Biogas Boiler Alternative 2: Cogeneration Alternative 3: Biomethane Generation Alternative 4: Hybrid For comparative purposes, conceptual designs were developed to include approximate footprints, potential location and layouts, utility requirements, and capital, operations, and maintenance costs sufficient to develop a business case evaluation. Non-economic considerations such as odors, noise, greenhouse gas emissions, and social acceptance were also considered. An analysis and description of the status quo is also presented as a benchmark for the four alternatives. In addition to biogas utilization technologies, a subtask focusing on the augmentation of the biogas supply through the addition of fats, oils and greases (FOG) to the digesters was also completed. This subtask focused on identifying and quantifying the FOG available within the collection area of Spring Street for potential collection. A discussion of this subtask is covered in Section Project Goals During the project Kickoff Meeting held September 22 nd, 2009, the project team outlined specific project goals to guide this study. The goals were specific to the organization of the study as well to the overall biogas energy management at Spring Street. The identified goals included: Address the payback, financial feasibility, and benefit of biogas utilization for the rate payers/citizens of Klamath Falls Address the fluctuating costs for energy within the context of the business case evaluation Meet the OECDD grant requirements Reduce the greenhouse gas emissions of the City 9
11 Biogas Energy Management Final Report Replace biogas flaring with a beneficial use Address the operational and economic risks associated with each alternative 10

12 Biogas Energy Management Final Report Section 3 Fats, Oils, and Grease Receiving This section of the report discusses fats, oils and grease (FOG) receiving at wastewater treatment plants. Included is a description of the collection and treatment process, the benefits of a FOG program, and an evaluation of a FOG receiving program at Spring Street. 3.1 Process Description FOG collection at wastewater treatment plants is typically carried out with a dedicated receiving and processing system. The system is sized and designed to receive the FOG loads available from the surrounding community and collection system. The most common approach is to receive FOG from licensed sewage and septic haulers, although some wastewater plants will receive larger loads from industrial sources such as salad dressing spoils or fat from rendering plants. Licensed haulers collect FOG from grease removal devices and grease interceptors located on the sewer laterals of facilities with high FOG volumes and or high FOG concentrations within their wastewater. Typically, this includes food service establishments (FSEs), apartment complexes, grocery stores and schools. A grease interceptor is a structural element located on a sewer discharge that collects FOG through density separation. As the wastewater flows through the interceptor, the denser solids settle to the bottom and the floatable oils and grease rise to the top. Baffles and draw off pipes help to retain the FOG within the interceptor and pass a clarified wastewater through to the effluent. A detail of a typical grease interceptor is shown in Figure 3.1. Figure 3.1 Grease Interceptor 11
13 Biogas Energy Management Final Report For a grease interceptor to function properly, regular cleaning is required. If the interceptor is not cleaned, the interceptor can become overloaded with retained solids and FOG. If left unmaintained, FOG will pass through the collection system. A licensed sewage hauler will come and clean the interceptor with a vactor truck at the request of the owner of the interceptor, or as a part of a regular maintenance program as required by a city ordinance. The collected FOG typically has a high water fraction, usually greater than 85 percent, and a variety of solid contaminants. It is not uncommon to have rocks, sand, grit, silverware and glass collected with the FOG from an interceptor. Once collected, the FOG is transported to a local disposal site for treatment and disposal. FOG disposed of at wastewater treatment plants is treated to reduce the water fraction and to remove the unwanted solids. Once treated, FOG is an energy dense waste that can be added to the digestion process to encourage biological activity, resulting in increased biogas production and solids destruction. 3.2 Benefits of FOG Receiving FOG receiving systems provide three key benefits to a wastewater treatment plant, they can: Prevent FOG from entering and accumulating in the collection system. FOG buildup can clog sewer lines and pump stations causing sewer backups and overflows. Maximize the use of existing assets such as digesters and biogas utilization equipment. The addition of FOG to an anaerobic digester can significantly increase biogas production and solids destruction rates. This provides more biogas for use in beneficial means and reduces the quantity of solids requiring downstream processing. Provide a revenue source for the facility. Wastewater treatment plants that provide FOG collection typically receive a tipping fee associated with the collection of the waste. The tipping fee is used to offset operational costs and to provide additional revenue for associated activities. 3.3 Survey of FOG Availability The National Renewable Energy Laboratory and the EPA conducted a survey of 30 urban areas to estimate the average per capita generation of FOG each year in the United States. The study concluded that the average generation was approximately 13 pounds of FOG per capita, per year. Based on this generation rate, an assumed water fraction of 85 percent, and an urban population of 42,000 residents, it was estimated that there is approximately 36,000 gallons of FOG available for collection within Klamath Falls each month. To confirm the availability of FOG in Klamath Falls, two surveys were conducted. The first survey focused on industrial and large- 12
14 Biogas Energy Management Final Report scale sources of FOG, the second survey focused on small-scale sources like local sewage haulers and FSEs Large-Scale Sources A windshield survey of the City and the surrounding area was conducted by CDM to identify potential large-scale sources of FOG and other high strength organic wastes. A windshield survey involves a visual observation of the surrounding area, typically by car, to identify items of interest, i.e., FOG sources. The survey was conducted between September 21 st and 23 rd. No large-scale sources were identified as part of this survey. To further support this conclusion, a line item review of the registered businesses in the Klamath County Chamber of Commerce was also conducted. The line item review did not identify any potential large-scale sources Small-Scale Sources A second survey focusing on small-scale sources of FOG was conducted by Arjen DeHoop, the Pretreatment Program Supervisor at Spring Street. This survey identified four active sewage haulers in the Klamath Falls area. Each of the haulers reported an average collection volume between 750 and 1,250 gallons of dilute FOG per month. A summary table is provided in Table 3.1. Hauler Dilute FOG (gal/month) Hukills 1,250 A-1 Septic 750 American Sanitation 1,250 Modoc Services 750 Total 4,000 Table 3.1 Klamath Falls Sewage Pumpers Based on this information, approximately 4,000 gallons of FOG is available for collection each month within Klamath Falls. This represents just 10 percent of the volume that would be expected based on the EPA study. There are a number of factors that are believed to contribute to this low collection rate: Many FSEs and other potential FOG sources lack grease removal devices and interceptors on their sewer lines. While the existing Sewer Use Ordinance (City Code through 4.186) gives the authority to the City to require interceptors to be installed, many of the FSEs pre-date this ordinance and lack interceptors on their lines. The haulers reported some regular customers that routinely service their interceptors, and many irregular customers that service their interceptors on an as needed basis. As needed is a generous term that applies to customers that service their interceptors because they have experienced some problems in their sewer line due to full interceptors or clogged sewer lines. 13
15 Biogas Energy Management Final Report There is no required maintenance program that stipulates the frequency of cleaning or pumping. FSEs are largely self- regulated for interceptor maintenance, which has allowed large amounts of FOG to discharge to the City s collection system from poorly maintained FOG interceptors. By addressing some of the above issues, the volume of FOG available for collection could be increased. 3.4 Recommendation Based on the low volume of FOG available within the surrounding community, a FOG receiving program is not recommended for implementation at Spring Street. A larger collection volume would be required to justify and fully utilize the upgrades required for a FOG receiving system. However, it is recommended that the City considers methods of reducing the amount of FOG that is being introduced into their collection system. By limiting the FOG entering the system, the City could reduce maintenance associated with FOG buildup and could begin to sequester FOG for future collection and utilization. To minimize the impact on local businesses, a long term FOG management approach is required. Some cities and municipalities have issued codes requiring all newly constructed or modified FSEs to install grease interceptors at the time of construction or at any point when the FSE changes ownership. Additionally, existing FSEs have been given consent decrees for installation of a grease interceptor. The decrees are typically in the range of 15 years to provide enough time to plan for the modification and secure capital. With grease interceptors in place, a FOG receiving and collection system is incorporated into the program to provide the necessary means of disposal and to facilitate collection and utilization at the treatment plant. Treatment facilities with successful approaches to FOG management are listed below for reference: East Bay MUD (California) City of Milbrae (California) City of Torrington (Connecticut) Pinellas County (Florida) 14
16 Section 4 Biogas Alternatives Biogas Energy Management Final Report This section of the report discusses the technologies available for biogas utilization, biogas treatment and the development of four biogas utilization alternatives for the Spring Street facility. 4.1 Utilization Categories Biogas utilization technologies fall into three broad categories: heat generation, combined heat and power generation (cogeneration), and biomethane generation. Within these three categories, different technology platforms exist to generate the identified energy product. By example, cogeneration can be accomplished with an internal combustion engine, a turbine, microturbine, fuel cell, or stirling engine. The platform selected is typically predicated on the desired size, cost, tolerance for risk, compatibility with existing processes and operator preference. The four utilization alternatives selected for this study were selected to encompass each of the three broad utilization categories with the fourth alternative combining all three categories into a single alternative Heat The most common biogas utilization technology is heat generation with a boiler. Heat generated within the boiler is transferred to a plant hot water loop for process demands, such as heating a digester, or space heating demands. This is a common utilization technology because of its relatively low cost and simple operation. Biogas boilers are identical to natural gas boilers, except for a small modification to the burner element. Some boilers are designed with dual fuel burners capable of burning either natural gas or biogas. Typical efficiencies for heat generation in a biogas boiler are approximately 80 to 85 percent Cogeneration Combined heat and power generation or cogeneration uses a combustion technology connected to a generator motor for electrical power production. Waste heat from the production of the power is captured for beneficial use. There are a number of cogeneration technology platforms including internal combustion engines, turbines, microturbines, fuel cells and stirling engines. Cogeneration technologies have combined efficiencies that approach the efficiencies of boilers at approximately 75 percent. Power production is between 25 and 40 percent efficient. Heat capture is between 30 and 40 percent efficient Biomethane Biogas that has been treated to remove the trace contaminants and carbon dioxide is of equivalent quality and composition as natural gas. The upgraded biogas is greater than 95 percent methane and is termed biomethane. Biomethane is most commonly sold back to the natural gas utility or compressed to between 3,000 and 5,000 psig and used as a compressed natural gas (CNG) vehicle fuel. 15
17 Biogas Energy Management Final Report 4.2 Biogas Treatment Biogas treatment is the conditioning of biogas to upgrade its quality prior to utilization. Without proper gas treatment, the gas utilization equipment will experience increased wear, deterioration and maintenance problems. Gas treatment requirements vary by utilization technology and manufacturer, although they typically involve removing a majority of the hydrogen sulfide, moisture, particulate and siloxane contaminants common to biogas. Carbon dioxide removal is also employed in some installations. For this study, the biogas quality requirements were determined based on CDM experience and discussions with the equipment manufacturers. Table 4.1 compares the reported biogas quality at Spring Street with the requirements of specific utilization technologies. In some cases, a more stringent biogas quality than required by the manufacturer was assumed. Table 4.1 Gas Quality Standards Technology/Source CH4 (%) CO2 (%) O2 (%) N2 (%) H2S (ppmv) Siloxane (mg/m 3 ) as Si PM (mg/m 3 ) Pressure (psig) Dew Point ( F) Spring Street Biogas , to 30 N/A Biogas Boiler 2 >40 N/A N/A N/A <1,000 N/A N/A Internal Combustion Engine 3 > 39 N/A N/A N/A 1,500 < 10 < Natural Gas Pipeline 4 > 95 < 3 < 0.2 < 3 < 4 N/A N/A 5 to CNG Vehicle Fuel 5 > 88 < 4 < 1 N/A < 16 N/A N/A 1 Biogas testing data, Spring Street STP. Test performed by Columbia Analytical Services May, conversations with Jeff Shivers, Proctor Sales. Representative for Hurst Boilers. 3 Senergie. Fuel Gas Requirements for G926TI. Provided by Preston Dickerson of Tech3Solutions. 4 Avista Utilities. Requirements for Customer-owend Gas. Provided by Kris Ransom. 5 SAE J161 Fuel Specification for compressed natural gas. 3,000 to 5,000-6 A description of the recommended gas treatment technologies appropriate for application at Spring Street is described in sections through Hydrogen Sulfide (H2S) Hydrogen sulfide can be oxidized biologically in the presence of oxygen or through combustion. In the presence of oxygen and water (condensate) the oxidized sulfur forms sulfuric acid. The acidic condensate can corrode equipment including boiler tubes, exhaust stacks and engine cylinders. Additionally, combusted hydrogen sulfide creates sulfur dioxide, a pollutant emission responsible for acid rain. To prevent equipment corrosion and unnecessary sulfur dioxide emissions, hydrogen sulfide should be removed prior to combustion. 16
18 Biogas Energy Management Final Report An iron sponge hydrogen sulfide removal system is recommended for use at Spring Street. An iron sponge system uses a wood chip media that has been impregnated with ferric oxide to reduce the gaseous hydrogen sulfide to a solid form. The chemical reaction follows the following equation: Fe O H O H S Fe S 2 3 ( s) 2 ( l) 2 ( g) 2 3 ( s) 4 2 ( l) As the reaction consumes the iron sponge media, the media must be regenerated and/or replaced periodically. Regeneration typically occurs once every 6 months to a year depending on the design and operating conditions. Media that has been regenerated two or three times is often replaced. During regeneration, oxygen is bubbled through the system with a continuous flow of water. Water is required to regulate the temperature of the reaction and to wash away any solids that may have accumulated. The oxygen reverses the chemical reaction and generates fresh ferric oxide. Iron sponge systems typically use two vessels in parallel so that gas treatment can be maintained during regeneration events. An iron sponge will achieve an outlet hydrogen sulfide concentration of approximately 5 ppmv Moisture Biogas generated in a mesophilic digester is saturated with water and has a dew point of approximately 98 degrees Fahrenheit. The latent moisture reduces combustion efficiency of utilization equipment and can cause corrosion by forming an acidic condensate or rust. To prevent increased maintenance requirements, moisture is removed prior to utilization. Drip traps, coalescing filters and condensate knockout tanks are simple, low technology methods of removing the condensable water fraction out of the gas. However, they are insufficient by themselves to dry the biogas enough for most biogas utilization equipment. In many cases, a chiller system and/or a desiccant dryer is required for biogas drying prior to utilization. A chiller system is recommended at Spring Street for most alternatives. A chiller produces chilled water that is passed through a gas to water heat exchanger to cool the gas to 40 degrees Fahrenheit or below. Once cooled, water more easily partitions out of the gas phase and is removed via a moisture knockout tank or similar. With moisture removed, the gas is reheated to 55 to 75 degrees Fahrenheit to prevent additional moisture from condensing out of the gas. A desiccant dryer is more appropriate for biogas utilization systems that require gas with a dew point below 40 degrees. A desiccant dryer uses an adsorbent media to strip water out of the gas phase and can achieve a gas with dew point of negative 40 degrees. A desiccant dryer would be required for the biomethane alternative. H O 17
19 Biogas Energy Management Final Report Siloxanes Siloxanes are an emerging contaminant of biogas. They are carbon and silica based chemical compounds that are frequently used in cosmetics and foods to create a creamy consistency. In biogas, siloxanes are a contaminant that create an abrasive and glassy solid similar to sand when combusted. This abrasive material can pit out the components of process equipment and can collect on surfaces leading to reduced equipment efficiency. Assuming biogas testing data verifies the presence of siloxanes within the Spring Street biogas, an adsorption media system is recommended for their removal. An adsorption media, such as activated carbon, will chemically bind the gas phase siloxanes as they pass through a treatment vessel. While the media can be regenerated, it is not typically cost effective to do so. Instead, media is replaced on an annual basis. Two vessels in parallel are typically installed to provide gas treatment during media replacement Particulates A one micron filter is used in a biogas treatment to remove particulates in the gas stream. Particulates can carry over from the digestion process or can be introduced by the media used for other gas treatment processes such as siloxane removal. Removing particulates is important to preserve utilization equipment and to prevent their discharge in the exhaust stream Carbon Dioxide (CO2) Carbon dioxide removal is only employed when a natural gas quality product is desired. For the biogas flow available at Spring Street, there is a single commercially available technology for the removal of carbon dioxide. The system is a pressure swing adsorption (PSA) unit. A PSA uses a specialized media and a bank of pressure vessels that cycle between atmospheric and medium pressure (120 psig). Carbon dioxide adsorbs onto the media under pressure, and desorbs at atmospheric conditions. By cycling through the pressure gradient, i.e., a pressure swing, the carbon dioxide is purged from the gas and the methane fraction is allowed to pass through the system and exit as a purified stream. 4.3 Selected Alternatives By combining gas utilization equipment with appropriate gas treatment equipment, four biogas alternatives were selected for development. Each alternative was developed to the conceptual level and evaluated on economic (capital cost, O&M costs, net present value, funding availability) and non-economic considerations (emissions, noise, odor, traffic, operability, risk). All four of the alternatives are located in the grassy area to the northwest of the digesters. This space has few buried utilities and infrastructure, has good site access 18

20 Biogas Energy Management Final Report and does not infringe upon any space reserved for future modifications. Additionally, this location is between the current digesters and the space identified for future digesters. An expansion of the digestion complex would not require relocating the gas treatment and utilization system. The only modification required to use this area is a relocation of the existing biogas piping, flow meter and moisture knockout tank from the southeast of the digesters to the northwest Biogas Boiler A new 390 kw (40 bhp) firebox boiler with a dual fuel burner capable of burning natural gas or biogas is installed in place of the existing 350 kw (36 bhp) flexible tube natural gas boiler within the digester control building. Biogas treatment to remove moisture, particulates and hydrogen sulfide is installed on the northwest of the digesters. The hot water loop that currently exists between the existing boiler and the digester sludge heat exchanger is extended to provide heating for the administration building. A process flow schematic of this alternative is shown in Figure 4.1. Figure 4.1 Biogas Boiler Process Flow Schematic A new 40 bhp boiler is sufficiently sized to meet the average and peak process and space heat demands of the facility through the year The boiler would use approximately 55 percent of the biogas generated at the facility, with the remaining flared off or available for other uses. Natural gas and geothermal purchases would be eliminated except during peak demand and maintenance periods on the biogas boiler system. The footprint required for the biogas treatment system is approximately 40 x 12 with a maximum height of 12. These dimensions are for the hydrogen sulfide vessels, the 19
21
22 Biogas Energy Management Final Report conditioning skid, which includes a biogas blower and chilling heat exchanger, and the chiller. A 10 envelope separating the chiller from the biogas handling equipment is included to comply with NFPA 820, which regulates wastewater treatment plants and specifies separation distances from explosive environments. Additional details on the gas treatment system are available within the Unison Systems quote included in Appendix B. The footprint for the boiler is estimated at 5 x 8. This includes the boiler itself as well as the peripheral trim and gas train. Additional details on the biogas boiler are available within the Proctor Sales Inc. quote included in Appendix B. The major scope of supply required for this alternative includes the following: (2) 6 diameter x 10 straight side, dished top and bottom H 2 S vessels 450 cubic feet of SulfaTreat iron sponge media 45 scfm biogas blower Glycol chiller Dual stage biogas heat exchanger Gas Treatment Control Panel NEMA 4X 40 bhp Firebox Boiler Dual fuel biogas/natural gas burner Boiler Control Panel Hot water circulation pump Interconnecting piping and appurtenances Operations and maintenance for the biogas boiler system includes changing out or regenerating the hydrogen sulfide media annually, and cleaning out of filters and drip traps as needed. If the biogas treatment system fails, boiler corrosion could occur and tube replacement could be necessary. A mechanical site plan showing the recommended layout for the major pieces of the mechanical equipment is shown in Figure
23 Biogas Energy Management Final Report Cogeneration Two cogeneration platforms were considered for this study, microturbines and internal combustion engines. The other cogeneration platforms including stirling engines and fuel cells are not cost competitive with these platforms and lack the installation history to be considered proven technologies for biogas applications. A brief discussion of the microturbine and internal combustion engine technology follows: Microturbines Microturbines are analogous to jet airplane engines. They use a pressurized gas feed (approximately 75 psig) and a high volume of excess air to achieve a very efficient combustion. Historically, microturbines have dominated the cogeneration market at wastewater treatment plants with installations less than 500 kw. Manufacturers purport minimal gas cleaning is required, limited to the removal of moisture, particulates and siloxanes. Based on CDM experience, treatment for hydrogen sulfide is also required. Internal Combustion Engines Internal combustion engines are analogous to car engines. They use a low pressure gas feed with a precise fuel-to-air combustion ratio. Historically, internal combustion engines have dominated the cogeneration market at wastewater treatment plants with installations greater than 500 kw. This market share was primarily because internal combustion engines were not available smaller than 500 kw. With new engines targeting the smaller sized market, internal combustion engines are beginning to be seen more frequently in installations less than 500 kw. Manufacturers typically require gas cleaning removal of moisture, particulates, hydrogen sulfide and siloxanes. To determine the cogeneration platform that was most appropriate for application at Spring Street, a preliminary survey of microturbine installations and analysis comparing the two technologies was performed. Based on this survey, it was determined that an internal combustion engine is the preferred platform. Key findings of the survey are listed below: Operations staff at Spring Street are more familiar with the internal combustion engine technology. A microturbine would likely require a service package, while an internal combustion engine could be maintained by staff on site with appropriate training. The gas treatment requirements for microturbines and internal combustion engines are equivalent. Both technologies require the removal of hydrogen sulfide 1, siloxanes, moisture and particulates. However, a microturbine requires a higher gas feed pressure, 75 psig, compared with the internal 1 Microturbines manufacturers report a high tolerance for hydrogen sulfide. However, a survey of municipalities indicated better performance when hydrogen sulfide was removed. Additionally, gas treatments manufacturers recommend hydrogen sulfide removal if siloxane removal is also required. Siloxane removing media lacks specificity in its treatment capacity and can be fouled by hydrogen sulfide. This allows siloxanes to pass through treatment. 21
24 Biogas Energy Management Final Report combustion engine, 1 psig. The high feed pressure increases the capital, and operations and maintenance costs of the gas treatment equipment for the microturbine. The capital costs for the microturbine and internal combustion engine are comparable, but the internal combustion engine has a higher electrical producing efficiency, which brings the cost of power production down. Both the microturbine and the internal combustion engine generate emissions that are believed to fall within the range that would be required by the Oregon Department of Environmental Quality. Based on this survey, a 140 kw internal combustion engine was selected for the cogeneration alternative development at Spring Street. A 140 kw engine will require 51,700 cubic feet of biogas per day to run at full capacity; this is 20 percent more than is currently produced at Spring Street. The 20 percent excess capacity will provide Spring Street with sufficient capacity for peak biogas production and the expected gas production from population growth. To accommodate gas production in excess of 51,700 cubic feet per day, the alternative is being developed for expansion with an additional engine as needed. The cogeneration system uses a containerized engine-generator set to provide sound attenuation and weather protection. The cogeneration system incorporates gas treatment for hydrogen sulfide, moisture, particulates and siloxanes. Waste heat from the engine s exhaust and jacket water is captured for use in digester and space heating. The existing hot water loop is extended between the engine set, the existing sludge heat exchanger and to the administration building. Backup heat is provided by the existing geothermal system and a new biogas boiler. The biogas boiler could be eliminated if it is determined that the geothermal system can provide year round back up heating. The cogeneration system is expected to produce enough electricity to offset approximately 40 percent of the average power demand and enough heat to offset 95 percent of the average geothermal and natural gas demand. A process flow schematic of this alternative is shown in Figure

25 Biogas Energy Management Final Report Figure 4.3 Cogeneration Engine Process Flow Schematic The footprint required for the biogas treatment and cogeneration system is approximately 50 x 35 with a maximum height of 12. These dimensions are for the hydrogen sulfide vessels, the conditioning skid, the siloxane vessels, chiller and cogeneration unit. Space has been reserved for a second engine set. Equipment has been layed out to avoid buried infrastructure and to comply with NFPA 820. The major scope of supply required for this alternative includes the following: (2) 6 diameter x 10 straight side, dished top and bottom H 2 S vessels 450 cubic feet of iron sponge media 45 scfm biogas blower Glycol chiller Dual stage biogas heat exchanger (2) 18 diameter x 6 straight side siloxane vessels Gas Treatment Control Panel NEMA 4X 40 bhp Firebox Boiler Dual fuel biogas/natural gas burner for the boiler Boiler Control Panel Hot water circulation pump Interconnecting piping and appurtenances Containerized Engine Package Waste Heat Radiators Engine Control Panel 23
26 Biogas Energy Management Final Report Operations and maintenance requirements for the biogas treatment system include media regeneration and change out of both iron sponge media and siloxane scrubber media, cleaning out of filters and drip traps, and routine maintenance checks. The cogeneration system will require oil and gasket changes, replacement of piston rings and minor service overhauls every 10,000 hours and major service overhauls every 25,000 hours. Additional details on the cogeneration system operations and maintenance requirements are available within the Tech3Solutions quote included in Appendix B. A mechanical site plan showing the recommended layout for the major pieces of the mechanical equipment is shown in Figure
27
28 Biogas Energy Management Final Report Biomethane Generation Two biomethane technologies were considered for this study, including selling the excess gas back to the utility, and the generation of a CNG vehicle fuel. A brief discussion of each technology follows: Utility Sell Back In a utility sell back, a generator of biomethane sells their excess gas to the natural gas utility as part of a supply and purchase agreement. Typical agreements include minimum and maximum generation rates as well as quality guarantees. Utility sell backs are uncommon at wastewater treatment plants due to the low volume of biogas generated there. The Renton South Plant in Renton, Washington is the only known wastewater treatment plant that sells biomethane back to a utility in the United States. Sell back agreements with landfills and dairies are much more common due to the large volume of biogas available at these sites. A utility sell back was not selected for development at Spring Street. Avista, the natural gas utility, has not accepted biomethane from an external source to date and is still developing a program to receive biomethane, including minimum quality and quantity guidance, and pricing structures. As development and implementation of Avista s biomethane receiving program is expected to extend beyond the implementation schedule for the biogas utilization alternative of choice, a connection with the utility is not expected at this time. However, Avista has voiced support for the City s biogas program and has offered to help where possible. Given that a biomethane receiving program is in development, the biomethane alternative at Spring Street was developed to accommodate future connection to the utility. Vehicle Fuel Generation Biomethane that is compressed to between 3,000 and 5,000 psig can be used as a vehicle fuel in vehicles equipped to operate on CNG. CNG vehicles operate using the same basic components of a traditional gasoline vehicle with the exception that they require a high pressure fuel system, a special fuel injection system and hardened cylinders to withstand the higher heat of combustion associated with CNG fuel. The gas is stored at high pressures to limit the size of fuel tanks and to extend vehicle range. CNG vehicles come in two different configurations: dedicated CNG vehicles and dual-fuel CNG vehicles which can utilize both gasoline and CNG fuel. Details regarding the vehicle conversion process, and a list of vehicles suitable for conversion has been included in Appendix F. To accommodate a biomethane CNG system, Spring Street requires biogas treatment to remove the non-methane portion of their biogas, a CNG fueling system, and a fleet of vehicles capable of operating on CNG fuel. A CNG fueling system includes a gas dryer, high pressure compressor, high pressure storage, and fueling system. A process flow schematic of this alternative is shown in Figure 4.5. Note that a biogas boiler is included in this alternative to provide s heating for the digesters and also space heating needs. 25

29 Biogas Energy Management Final Report Figure 4.5 Biomethane Process Flow Schematic The proposed biomethane system including the biogas boiler would utilize 100 percent of the biogas generated at Spring Street and would produce the equivalent of 140 gallons of gasoline per day in the first year of operation. This is enough fuel to sustain 66 vehicles. For this alternative, it is assumed that the all vehicles converted would be part of the City s fleet. The footprint required for this alternative is 40 x 20 with a maximum height of 12 for the gas treatment system, and 20 x 15 with a maximum height of 8 for the vehicle fueling system. The gas handling system has been laid out in accordance with NFPA 820. The vehicle fueling system has been laid out in accordance with NFPA 52, 57 and 59A, which regulates separation distances for vehicle fueling infrastructure. The system is designed to meet the CNG fuel specification J1616 of the Society of Automotive Engineers including requisite quality and pressure. The dispensing equipment is designed for fast fill applications and is capable of filling a vehicle in approximately 3 minutes. A secondary connection to the natural gas line has been included to provide a redundant source independent of the biogas. Specific details on the fueling system can be found in the quote and materials provided within Appendix B. The major scope of supply required for this alternative includes the following: (2) 6 diameter x 10 straight side, dished top and bottom H 2 S vessels 450 cubic feet of iron sponge media 45 scfm biogas blower Glycol chiller 26
30 Dual stage biogas heat exchanger (2) 18 diameter x 6 straight side siloxane vessels Gas Treatment Control Panel NEMA 4X 40 bhp Firebox Boiler Dual fuel biogas/natural gas burner for the boiler Boiler Control Panel Hot water circulation pump Interconnecting piping and appurtenances 45 scfm PSA Carbon Dioxide Removal System Natural Gas Desiccant Dryer 5,000 psig CNG compressor (40 hp, 75 scfm, 208 VAC) 5,000 psig CNG storage cascade (35,000 scf) Fuel Management System (Controller, Dispenser, Filter) Biogas Energy Management Final Report Operation and maintenance requirements for the gas treatment system are similar to the other alternative requirements. Operations and maintenance for the CNG fueling system will require routine service checks and oil changes on the compressors, replacement of gaskets and fittings, and major overhauls every 3,000 hours of operation. For this alternative a service contract has been assumed for maintenance of the CNG fueling system. A mechanical site plan showing the recommended layout for the major pieces of mechanical equipment is shown in Figure
31

32 Biogas Energy Management Final Report Hybrid A hybrid alternative combining the three previous biogas alternatives has been included to provide Spring Street with a biogas system that is capable of flexing and growing to meet the facility needs, the market conditions, and changing energy prices as they develop. The proposed system utilizes a biogas fueled boiler, an internal combustion engine cogeneration system, and a smaller biomethane system sized at 10 scfm. The small biomethane system is of sufficient size to fuel 25 vehicles and would receive priority for biogas utilization. The cogeneration system is sized at 140 kw and will generate enough power to offset average demand by 29 percent, and enough heat to offset average demand by 65 percent. A process flow schematic of this alternative is shown in Figure 4.7. Figure 4.7 Hybrid Process Flow Schematic This alternative has the largest footprint requirement of all the alternatives. A 50 x 35 area is required for the gas treatment and cogeneration engines. An additional 20 x 15 area is required for the vehicle fueling equipment. The maximum height of equipment associated with this alternative is approximately 12. The major scope of supply required for this alternative includes the following: (2) 6 diameter x 10 straight side, dished top and bottom H 2 S vessels 450 cubic feet of SulfaTreat iron sponge media 45 scfm biogas blower Glycol chiller Dual stage biogas heat exchanger (2) 18 diameter x 6 straight side siloxane vessels 29
33 Biogas Energy Management Final Report Gas Treatment Control Panel NEMA 4X 40 bhp Firebox Boiler Dual fuel biogas/natural gas burner Boiler Control Panel Hot water circulation pump Interconnecting piping and appurtenances 10 scfm PSA Carbon Dioxide Removal System Natural Gas Desiccant Dryer 5,000 psig CNG compressor (40 hp, 75 scfm, 208 VAC) 5,000 psig CNG storage cascade (35,000 scf) Fuel Management System (Controller, Dispenser, Filter) Containerized Engine Package Waste Heat Radiators Engine Control Panel Operations and maintenance requirements for this alternative combine the operations and maintenance requirements of the other three alternatives. A mechanical site plan showing the recommended layout for the major pieces of the mechanical equipment is shown in Figure
34

35 Biogas Energy Management Final Report Status Quo To provide a common basis for comparison, a status quo alternative was developed. The status quo alternative assumes continued flaring of the biogas and reliance on the conventional sources for heat, power and vehicle fuel. The status quo alternative requires a capital outlay for the replacement of the existing natural gas boiler, which is in poor condition and will require replacement within 5 years. A process flow schematic of the status quo alternative is shown in Figure 4.9. Figure 4.9 Status Quo Process Flow Schematic The major scope of supply required for the status quo includes the following: 40 bhp Firebox Boiler Dual fuel biogas/natural gas burner Boiler Control Panel Hot water circulation pump Interconnecting piping and appurtenances A dual fuel biogas/natural gas burner was assumed for this alternative to provide flexibility for later modification to accept treated biogas. Specifying a dual fuel burner as opposed to a natural gas burner has nominal cost implications. 31
36 Biogas Energy Management Final Report Section 5 Evaluation of Alternatives This section of the report discusses the economic and non-economic considerations for each alternative. The economic considerations include capital, operations and maintenance costs, and business case evaluation. The non-economic considerations include risk, noise, odors, traffic and social considerations. 5.1 Economic Analysis Capital Costs Conceptual level capital cost estimates were developed for each identified alternative, including the status quo. The capital cost estimate is the installed cost of each alternative and includes the construction and engineering fees. Capital costs were developed based on vendor quotes for major pieces of equipment and standard installation factors for other materials, site work, and fees. Where possible, the estimated cost was compared with recently constructed projects to confirm the developed estimate. The capital cost estimates for the four alternatives and the status quo are shown in Table 5.1. Alternative Capital Cost Status Quo $410,000 Biogas Boiler $730,000 Cogeneration $1,770,000 Biomethane $2,940,000 Hybrid $2,640,000 Table 5.1 Capital Cost Estimate The capital cost estimates show that there is a significant cost associated with installation of biogas utilization equipment. The hybrid alternative, which combines the three utilization technologies, is less expensive than the biomethane alternative. The reason for this is that the smaller biomethane gas treatment system included within the hybrid alternative is significantly less expensive than the larger biomethane gas treatment system of the biomethane alternative. The smaller system provides 22 percent of the treatment capacity of the larger system at approximately 15 percent of the cost. Capital cost estimates are shown in Appendix C Operations and Maintenance Operations and maintenance costs for each alternative were developed and include the labor, materials, and energy requirements (power, heat, vehicle fuel) of the selected alternatives. Where applicable, e.g., the biomethane alternative, service and maintenance contracts were assumed for certain larger pieces of equipment. For the biomethane and hybrid alternatives, the costs of converting and maintaining a vehicle fleet to operate on CNG were carried as an operational and maintenance cost. 33
37 Biogas Energy Management Final Report Each alternative carried the cost of fueling 66 vehicles. For the status quo, biogas boiler, and cogeneration alternatives, the fuel cost was for petroleum based fuel. For the biomethane alternative, fueling was assumed to come from the biomethane CNG supply. For the hybrid alternative, 25 vehicles were assumed to be fueled with biomethane CNG and 41 vehicles were assumed to be fueled with petroleum based fuel. Fueling costs were carried for each alternative to ensure a level basis of comparison. The common operations and maintenance costs for the four alternatives and the status quo for the first year of operations are shown in Table 5.2 in 2009 dollars. The first year of operation is assumed to be Alternative O&M Status Quo $390,000 Biogas Boiler $350,000 Cogeneration $300,000 Biomethane $260,000 Hybrid $270,000 Table 5.2 O&M Estimate Details of the operations and maintenance cost estimates are provided in Appendix D Business Case Evaluation To combine the capital, operations and maintenance cost into a single economic metric, a net present value (NPV) analysis of the biogas alternatives was performed. Because the funding method and economic life of the project is unknown, the net present value analysis was performed for a 5-year, 10-year, 15-year and 20-year period. Periods longer than this were not considered because they were assumed to extend beyond the life of the mechanical equipment. For this report, a discount rate of 5 percent and an inflation rate of 2.5 percent were assumed. The status quo was the base case scenario and had a NPV of $0. Table 5.3 summarizes the net present values for the four alternatives. Values shown in parentheses and in red are negative and represent project periods that would cost more than the status quo alternative. Values shown in black are positive and represent project periods that would have a cost savings for Spring Street. In a net present value analysis, the transition from a negative value to a positive value is the payback period of the project. The payback period of the alternatives has been provided in the last column of Table 5.3 for reference. 34
38 Biogas Energy Management Final Report Alternative 5 Years 10 Years 15 Years 20 Years Payback Biogas Boiler ($80,000) $90,000 $270,000 $430,000 8 years Cogeneration ($730,000) ($360,000) $0 $340, years Biomethane Generation ($1,960,000) ($1,470,000) ($1,340,000) ($870,000) > 20 years Hybrid ($1,540,000) ($1,110,000) ($810,000) ($410,000) > 20 years Table 5.3 Net Present Value Analysis It should be noted that the above analysis includes no grant or incentive funding and represents the net present values if the City bore the entire project costs. Based on this analysis, only the biogas boiler and the cogeneration alternatives look viable for further development. However, this assessment is predicated on the assumption that energy prices will inflate at the normal inflation rate of 2.5 percent. To investigate how the price of energy could influence the preferred alternative, three different energy based sensitivities were performed. A fourth sensitivity was conducted to see how the price of money influenced the net present values. This sensitivity changed the discount rate used for the net present value calculation. High Energy Prices In this sensitivity the inflation rate for energy commodities including power (electricity), natural gas, geothermal, and vehicle costs were inflated at 5 percent. All other costs were inflated at the normal inflation rate of 2.5 percent. The results of this sensitivity are in Table 5.4: Alternative 5 Years 10 Years 15 Years 20 Years Payback Biogas Boiler ($50,000) $190,000 $450,000 $740,000 7 years Cogeneration ($660,000) ($150,000) $420,000 $1,020, years Biomethane Generation ($1,870,000) ($1,200,000) ($800,000) $50, years Hybrid ($1,460,000) ($860,000) ($310,000) $430, years Table 5.4 Net Present Value Analysis High Energy Prices Sensitivity High Power Prices In this sensitivity the inflation rate for power was raised to 10 percent for the first five years, 5 percent for the next five years, and 2.5 percent for the last 10 years of the business case evaluation. All other costs were inflated at the normal inflation rate of 2.5 percent. These inflation rates were selected by the project team as part of the workshop on December 4 th, The results of this sensitivity are in Table 5.5: Alternative 5 Years 10 Years 15 Years 20 Years Payback Biogas Boiler ($80,000) $90,000 $250,000 $410,000 8 years Cogeneration ($670,000) ($170,000) $340,000 $800, years Biomethane Generation ($1,990,000) ($1,550,000) ($1,480,000) ($1,060,000) > 20 years Hybrid ($1,510,000) ($1,010,000) ($620,000) ($120,000) > 20 years Table 5.5 Net Present Value Analysis High Power Prices Sensitivity 35
39 Biogas Energy Management Final Report High Fuel Prices In the third sensitivity, normal inflation was kept at 2.5 percent, but the inflation rate for vehicle fuel was raised to 5 percent. The results of this sensitivity are in Table 5.6: Alternative 5 Years 10 Years 15 Years 20 Years Payback Biogas Boiler ($80,000) $90,000 $270,000 $430,000 8 years Cogeneration ($730,000) ($360,000) $0 $330, years Biomethane Generation ($1,860,000) ($1,180,000) ($770,000) $70, years Hybrid ($1,500,000) ($1,010,000) ($620,000) ($110,000) >20 years Table 5.6 Net Present Value Analysis High Fuel Prices Sensitivity Based on the sensitivity analysis, the biogas boiler and the cogeneration alternative are still the preferred options for further development. In each sensitivity, the biogas boiler and cogeneration alternative had the significantly higher (more positive) net present values and shorter payback periods. Cost of Money In the forth sensitivity, the discount rate was reduced to 2.5 percent to investigate how the price of money impacts the net present values of the alternatives. With interest and inflation rates near historical lows, are becoming more and more common in business case evaluations The results of this sensitivity are in Table 5.7: Alternative 5 Years 10 Years 15 Years 20 Years Payback Biogas Boiler ($80,000) $150,000 $400,000 $680,000 7 years Cogeneration ($780,000) ($300,000) $230,000 $790, years Biomethane Generation ($2,130,000) ($1,490,000) ($1,280,000) ($490,000) >20 years Hybrid ($1,670,000) ($1,110,000) ($670,000) $20, years Table 5.7 Net Present Value Analysis Cost of Money Sensitivity Based on the sensitivity analysis, the biogas boiler and the cogeneration alternative are still the preferred options for further development. In each sensitivity, the biogas boiler and cogeneration alternative had the significantly higher (more positive) net present values and shorter payback periods. 5.2 Non-Economic Considerations Risk Four key risk factors were identified for the biogas utilization alternatives as part of the Kickoff Meeting on September 22 nd, The identified risk factors were: Familiarity of Technology: The level of understanding and experience of the Spring Street staff with the proposed gas treatment and utilization technologies. 36
40 Biogas Energy Management Final Report Ease of Operation: The ease of operation of the proposed system including required worker attention and interface with plant control system. Flexibility of Operation: The ability of the alternative to adjust to changing energy demands and biogas supplies. i.e., can the alternative ramp up and down based on demand? Stability of the Energy Market: The relative volatility of the cost of the energy product produced by the biogas utilization system. i.e., the stability of power and heat costs for the cogeneration system, or the relative uncertainty associated with vehicle fuel prices. For each risk factor, the alternatives were scored from 1 to 5 with 5 being the highest and best score. A tabular comparison of these risk factors is provided in Table 5.8. Alternative Familiarity of Technology Ease of Operation Flexibility of Operation Stability of Energy Market Status Quo Biogas Boiler Cogeneration Biomethane Hybrid Table 5.8 Risk Analysis Total In the risk scoring, the biomethane system scored poorly. The low score is attributed to the complexity of the system, the unfamiliarity of the technologies employed, and the volatility of the vehicle fuel market. By comparison, the biogas boiler and cogeneration systems have much simpler gas treatment systems, use technologies that are familiar to operations staff, and generate energy products that have a much more predictable rate structure. Natural gas and power markets are near historical lows and are expected to rise. By using the current low natural gas and power rates in the economic analysis of the alternatives, a conservative estimate of the economic impact of the alternatives has been provided and the risk associated with these alternatives has been reduced Noise None of the alternatives are expected to significantly impact the noise levels for the surrounding community or for the operations and maintenance staff at Spring Street. Each alternative was developed to comply with OSHA regulations for worker comfort and safety and include sound attenuation to limit noise levels at the facility. For the cogeneration system a site plan showing the expected sound levels has been provided in Figure
41

42 5.2.3 Odors Biogas Energy Management Final Report None of the alternatives are expected to negatively impact odor generation at Spring Street. The gas treatment and utilization system are closed to the atmosphere and have no odors associated with them Traffic The biomethane and hybrid alternatives would increase vehicle traffic to and from the treatment plant. Between 5 and 10 additional vehicles per day would be visiting the treatment plant to refuel, which would increase traffic in the immediate area, including Spring Street and the potential 3 rd Street extension Emissions The carbon dioxide emissions associated with each alternative were totaled to provide a relative comparison of the alternatives. Estimates of carbon dioxide emissions use the fuel specific emission factors provided by the U.S. EPA in AP-42 Fifth Edition, as well as the reported emissions for the Klamath Falls power plant in the EPA egrid database. For each alternative, emissions were totaled for all fossil fuel derived energy sources including petroleum-based vehicle fuel, natural gas, and electricity. The results of the analysis are shown in Figure 5.2. Figure 5.2 Carbon Dioxide Emissions Comparison 41
43 Biogas Energy Management Final Report Based on this analysis, it can be seen that the biogas boiler alternative has little impact on the total carbon dioxide emissions associated with Spring Street. The reason for this is that the biogas boiler alternative is only offsetting natural gas purchases at the plant, which have historically been relatively small. Conversely, the cogeneration, biomethane and hybrid alternatives, which offset larger quantities of fossil fuel-based energy, offset between 500 and 800 tons of carbon dioxide a year. This is equivalent to removing between 80 and 130 vehicles off the road 42
44 Biogas Energy Management Final Report Section 6 Grants and Incentives As part of this project, CDM performed a continual review of grants and incentives that could provide financial assistance to the identified alternatives. A complete list of the grants and incentives reviewed is contained within Appendix E. This section contains a discussion of the most promising grants and incentives identified. 6.1 Grants Oregon Energy Trust Value: Varies. The Energy Trust provides funding to make renewable energy projects cost competitive with conventional sources. Project funding covers the above market costs over a 10 to 15-year project lifecycle. Deadlines: Continuous. Description: The Oregon Energy Trust provides funding to public and private ventures to generate renewable energy that reduce the amount of power purchased from the electrical utility. In exchange for the project funding, the Energy Trust purchases the rights to the Renewable Energy Credits associated with the project. The Energy Trust uses the credits to meet it renewable energy generation requirements and to promote its activities. The exact purchase agreement varies by project. Discussion: Preliminary discussions with the program administrator suggest that the cogeneration project would be eligible for the program. The City would want to consider how it would approach a program that takes ownership of the Renewable Energy Credits and if it would be willing to enter into such an agreement. The City should contact the City of Portland Bureau of Environmental Services (BES) to discuss how an Energy Trust grant impacts a cogeneration project. BES recently received Energy Trust funding for their Columbia Boulevard cogeneration system. Recommendation: This program should be considered as a potential funding source. The Climate Trust Value: Varies. Project funding covers the above market costs over a 10 to 15-year project lifecycle for projects that reduce greenhouse gas emissions. Deadlines: Continuous. Description: The Climate Trust provides funding to public and private ventures to reduce greenhouse gas emissions. In exchange for the project funding, the Climate Trust purchases the rights to emissions offsets associated with the project. The exact purchase agreement varies by project. Discussion: Peter Weisberg of the Climate Trust was contacted to discuss the eligibility of the biogas alternatives for funding. Based on conversations with Mr. Weisberg, it was determined that the identified projects are not eligible for Climate Trust funding. The Climate Trust does not fund small-scale power producing projects or projects that offset less than 50,000 metric tons of carbon dioxide over their project life. The identified alternatives at Spring Street would offset between 10,000 to 15,000 metric tons of carbon dioxide over their project life. Recommendation: N/A. Not eligible. USDA Rural Energy for America Program (REAP) Generation Grant Value: Up to 25% of project costs or $500,000 whichever is less 43
45 Biogas Energy Management Final Report Deadlines: Continuous. Description: USDA funds projects to promote energy efficiency and renewable energy in rural areas. Discussion: The USDA favors applications seeking $20,000 or less. Applicants seeking funding in excess of $20,000 are encouraged to apply for the guaranteed loan program. Recommendation: Submit application. 6.2 Incentives USDA Rural Energy for America Program (REAP) Guaranteed Loan Value: Value varies based on program size: 85% (maximum) guarantee on loans up to $600,000 80% (maximum) guarantee on loans from $600,000 to $5 million 70% (maximum) guarantee on loans from $5 to 10 million 60% (maximum) guarantee on loans from $10 to 25 million Deadlines: Continuous. Description: The USDA provides guaranteed loans for renewable energy projects in rural areas. By guaranteeing the loan, the interest rate on the loan is reduced. The lower interest rate helps to reduce overall project costs. Recommendation: Consider as a potential funding source. American Resource and Recovery Act Funding / State Revolving Funds Value: Varies by award type (low interest loan, loan forgiveness) Deadlines: Continuous. Description: ARRA and SRF funding is targeted at projects that provide a substantial benefit to the environment and require financial assistance to be constructed. For the year 2010, 20 percent of ARRA funds are earmarked for green projects. Funds are distributed based on a scored application. Discussion: CDM and the City have met with State representatives to discuss the needs at Spring Street and to discuss the application process. The City is in the process of resubmitting their application to secure funding for the various upgrades required at Spring Street. Recommendation: Continue to pursue ARRA/SRF funding for the identified plant upgrades. Oregon Business Energy Tax Credit (BETC) Value: Up to 50 percent of eligible project costs Deadlines: Continuous. Must apply for credit before capital outlay for project is initiated Description: The Oregon Department of Energy offers tax credits to help offset the costs associated with energy conservation projects. The program is opened to public and private organizations. Public organizations must work with a Pass-through Option. In the Pass-through Option, the tax exempt project owner transfers a tax credit to a pass-through partner in return for a lump-sum cash payment upon completion of a project. The lump-sum cash payment is typically between 65 and 90 percent of the tax credit value. 44
46 Biogas Energy Management Final Report Discussion: Based on conversations with program administrators, the cogeneration project would qualify for this credit as a renewable energy project. However, only project costs associated with power production would be eligible. Project costs associated with heat capture, typically between 5 and 10 percent of total costs, would likely not be eligible as the project would be offsetting geothermal heat. The application for this credit is contained within Appendix G. Recommendation: An application for this tax credit should be submitted immediately. Oregon State Energy Loan Program Value: Low interest loan Deadlines: Continuous. Description: The Oregon Department of Energy offers low interest loans to public and private ventures that will save energy, generate renewable energy, use recycled materials, and use alternative fuels. The rate of the loan is based on the bond rate issued by the Department of Energy and is project specific. Discussion: Preliminary discussions with the program administrator suggest that a loan rate in the range of 5 percent is likely. A more definitive rate could be established based on further discussions and negotiations with the program administrators. Recommendation: This program should be considered as a potential funding source. 6.3 Grant and Incentive Funding Sensitivity To estimate how grant and incentive funding could impact the payback period of the identified alternatives, a sensitivity was performed. The sensitivity analysis is conveyed in Figure 6.1. The figure shows the payback period in years on the y-axis, and the value of grant or incentive funding on the x-axis. As would be expected, as funding increases, the payback period decreases. This analysis provides a simple metric for determining how an individual grant or incentive could impact the payback for a particular alternative. 45
47 Biogas Energy Management Final Report Figure 6.1 Payback Period versus Grant and Incentive Funding 46
48 Biogas Energy Management Final Report Section 7 Biogas Energy Management Workshop 7.1 Workshop On December 4 th, 2009 a Biogas Energy Management Workshop was held at the Klamath Falls Department of Public Works with representatives from the City and CDM in attendance. The workshop was well attended with representatives from operations, collection system, engineering and management. The goal of the workshop was to present and evaluate the conceptual designs and cost estimations for the biogas utilization alternatives and arrive at a recommendation to pursue for full-scale development. This goal was readily achieved through a review of the economic and non-economic considerations presented within this report. 7.2 Recommendation Based on the material presented in the workshop, the cogeneration alternative was recommended for full-scale development. The cogeneration alternative provides numerous benefits to the Spring Street facility. The cogeneration alternative: Provides the ability to utilize 100 percent of the biogas generated at Spring Street Reduces the average external power demand by 40 percent and the average external heat demand by 95 percent Has a positive net present value in a 15 year economic period. Is eligible for grant and incentive funding Is a proven, low risk technology Reduces carbon dioxide emissions at Spring Street by 500 tons/year Does not have a negative noise, odor or visual impact on the surrounding community Conversely, the biomethane and hybrid alternatives had such high initial capital costs, and comparable or less favorable non-economic benefits that they were not considered for full-scale implementation. The biogas boiler alternative is considered a viable alternative, but it did not meet the project goals to fully utilize the biogas energy source by itself. Meeting minutes documenting the discussions that took place at the Biogas Energy Management Workshop are included in Appendix C of this report. 47
49 Biogas Energy Management Final Report 7.3 Next Steps The City was correct in identifying the available biogas as potential renewable energy source that could provide an economic and environmental benefit to Spring Street. Based on the findings of the Biogas Energy Management Study, it is recommended that the City pursue grant and incentive funding for a cogeneration project on an internal combustion engine platform and that the City proceed to the design phase for a cogeneration project. 48
50 Appendix A Biogas Alternatives Identification Technical Memorandum
51 Memorandum To: From: Jeff Fritz Janelle Rogers Cale McPherson Date: October 15 th, 2009 Subject: Biogas Alternatives Identification Introduction and Background The City of Klamath Falls initiated a Biogas Energy Management Study to identify, define and develop the means and methods to obtain the greatest benefit from their existing anaerobic digesters and biogas at the Spring Street Sewage Treatment Plant (Spring Street). This study builds off of work previously developed by CDM in the Facilities Plan submitted April 30 th 2009, which identified the unused biogas at Spring Street as a potential source of revenue and energy for the City. Under Tasks 2 and 3 of the Biogas Energy Management Study, CDM updated the information on the biogas and energy system at Spring Street to reflect the most recent calendar year and market conditions including power, geothermal and natural gas rates. Based on these parameters, four general biogas utilization alternatives were identified: hot water boiler fuel, combined heat and power generation (cogeneration), biomethane/vehicle fuel generation, and a hybrid alternative combining utilization technologies. The intent of this memorandum is to summarize the development of the alternatives to date, and to identify potential conflicts and issues with the identified alternatives. This memo is organized into the following sections: biogas and energy system, biogas alternatives, and conclusions and next steps. Biogas and Energy System Current Operations According to data provided by Spring Street, the facility is generating an average 42,800 cubic feet of biogas per day. Growth in service population are expected to increase biogas production to 60,000 cubic feet per day by 2030, while additional modifications to the digestion process, including improvements to the heating and mixing system and addition of fats, oils and greases (FOG), could help to double production by the year Energy demands at Spring Street vary seasonally based on ambient temperature, flows and loads and the availability of the geothermal system. Figure 1 depicts the energy demands for 2008 in common units as well as the relative energy value of the biogas fuel generated.
52 Figure 1: Spring Street Energy Profile 2008 The energy profile illustrates that there is an average of 280 kw of biogas fuel available at Spring Street and that the average power demand is approximately 285 kw. The heat demand shows the most seasonal variation due to changes in the source of heat used and the areas heated. Heat demands at Spring Street consist of primary digester heating and space heating loads. Due to piping and pumping limitations, the secondary digester is unheated, and the primary digester is only heated when the dewatering equipment is not operational. For nine months of the year, typically November through July, the heat demand is supplied by the City-owned geothermal system. When the geothermal system is shut down for maintenance, typically August through October, Spring Street relies on a flexible-tube boiler for heat. The boiler is fired with natural gas and is used only to maintain digester heating. There are no means for recovering heat from the boiler for space heating as the boiler heat loop is contained entirely within the digester control building, and is completely separate from the space heating loop. The sharp decline in total heat demand illustrated in Figure 1 is the result of unheated building spaces when relying on the boiler for heat. By applying standard system efficiencies for biogas utilization alternatives provided by equipment manufacturers, it is possible to quantify the potential energy of a biogas utilization technology relative to the facility s demand for that energy product. Table 1 compares the 2

53 potential output of a system at Spring Street with the average demand for the energy product for the year Table 1: Biogas Alternatives Energetic Output System Biogas Conversion Efficiency Potential Biogas Output Actual 2008 Avg. Demand Units Potential Contribution of Biogas, 2008 CHP - Microturbine Electricity 29% kwe 28% Heat 62% kwth 128% CHP - Internal Combustion Engine Boiler Electricity 35% kwe 33% Heat 55% kwth 117% Biogas Boiler 80% kwth 166% Biomethane Re-Sale 90% kw 739% Vehicle Fuel 90% 180 N/A GGE 1 N/A 1 Based on average biogas production numbers for Based on billing invoices for GGE or Gasoline Gallon Equivalent is the energy equivalent of 1 gallon of gasoline: 114,100 BTUs/gallon Biogas Alternatives Dual Fuel Hot Water Boiler The existing boiler is in poor condition due to its age, 23 years, as well as from corrosion experienced while being fired with untreated biogas. The untreated biogas formed an acidic condensate which deteriorated the boiler and exhaust stack. The existing boiler is shown in Figure 2. The boiler is only fired with natural gas under current operations. Figure 2: Existing Boiler To provide a beneficial use for the biogas, limit purchases of natural gas, and supply a reliable hot water system, it is recommended that a replacement boiler with an expanded hot water system that extends to adjacent buildings be installed. This system should be sized to supply the peak heat demand of both digesters and building spaces at the build out condition of Based on the historical space heating demand and the theoretical heat demand of the mesophilic digesters, a new 350 kw (36 boilerhp) is recommended for installation in place of the existing boiler. To take advantage of the available biogas the new boiler should be designed for dual fuel (biogas and natural gas) and have biogas treatment to remove hydrogen sulfide and moisture to prevent corrosion. A firebox 3
54 boiler is recommended to replace the flexible-tube boiler given its reduced capital cost, robust material of construction, and simplified maintenance for routine events such as tube change out. Table 2 shows key design criteria of the proposed system compared with the existing system. Installation Type Table 2: Hot Water Boiler Design Criteria Size, kw (b-hp) Pressure, psig Fuel Space Heating Gas Treatment Existing Flexible Tube 353 (36) 30 Natural Gas No No Recommended Firebox 392 (40) 30 Dual Fuel Yes Yes Preliminary engineering suggests that new boiler would be approximately 5 x 8 including the peripheral trim and gas train. The boiler footprint is estimated at 3.5 x 5. While larger than the existing boiler, a review of available drawings indicates sufficient space exists within the control building and through the entrances to accommodate this piece of equipment. Due to site restrictions on the southeast side of the digesters, and to accommodate future process expansion and other utilization alternatives, the gas treatment has been located on the northwest side of the digester buildings. This is shown in Figure 3. Figure 3: Hot Water Boiler and Gas Treatment Locating the treatment equipment on northwest side of the digester buildings will require relocating the biogas flow meter and condensate knockout tank, and re-routing the existing biogas piping for the flare and the boiler. The preliminary capital cost estimate for the boiler not including installation, piping, instrumentation, gas treatment, and other appurtenances is $95,000. 4
55 Cogeneration Combined heat and power production is a common biogas utilization technology. Benefits are its ability to generate two valuable energy products, accommodate varying biogas flows, handle varying heat and power demands, and utilize nearly all of the biogas generated by a treatment plant. For treatment plants with cogeneration potentials less than 300 kw, like Spring Street, the most common platform in the United States is the microturbine; in Europe it is the internal combustion engine. The main reason for this difference is the availability of product offerings and manufacturers. The physical, mechanical and electrical site requirements for a microturbine or internal combustion engine cogeneration systems are nearly identical. Given this, the cogeneration alternative could be developed on either platform and still maintain the flexibility to accommodate a transition to the other technology in the full scale design. A microturbine was originally identified for the Spring Street cogeneration alternative; however, based on information collected during the preliminary phase of this project, it is recommended that the cogeneration alternative now be developed on an internal combustion platform. The reasons for this are as follows: Small scale internal combustion engines are now available within the United States from multiple manufacturers. Operations staff at Spring Street are more familiar with the internal combustion engine technology. A microturbine would likely require a service package, while an internal combustion engine could be maintained by staff on site with appropriate training. The gas treatment requirements for microturbines and internal combustion engines are equivalent. Both technologies require the removal of hydrogen sulfide 1, siloxanes, moisture and particulates. However, a microturbine requires a higher gas feed pressure, 75 psig, compared with the internal combustion engine, 1 psig. The high feed pressure increases the capital, and operations and maintenance costs of the gas treatment equipment for the microturbine. The capital costs for the microturbine and internal combustion engine packages are comparable, but the internal combustion engine has a higher electrical producing efficiency, which brings the cost of power production down. Both the microturbine and the internal combustion engine generate emissions that are believed to fall within the range that would be required by the Oregon Department of Environmental Quality. The microturbine s air emissions are superior to the internal combustion engines. 1 Microturbines are reported to have a high tolerance for hydrogen sulfide. However, a survey of municipalities indicated better performance when hydrogen sulfide was removed. Additionally, the microturbine manufacturer recommends hydrogen sulfide removal if siloxane removal is also required. The siloxane removing media lacks specificity in its treatment capacity and can be fouled by hydrogen sulfide. This allows siloxanes to pass through treatment. When in the combustion gas, the abrasive nature of siloxanes pits out the microturbine equipment. 5
56 A comparison of the two platforms is provided in Table 3. The costs shown do not include gas treatment equipment, piping, installation or appurtenances. Platform Microturbine I.C. Engine Operating Range 50% to 100% 60% to 100% Table 3: Cogeneration Platform Comparison Gas Feed, psig 75 to 90 Rated Power, kw Capital Cost 1 $/kw Potential Electricity Output, kw e 2 NO x, ppmv 15% O 2 CO, ppmv 15% O $206,600 $1, $260,000 $1, Capital cost is for engine generator package only. Does not include gas treatment, piping, installation or appurtenances 2 Based on two 65 kw microturbines The cogeneration alternative is sized to provide capacity to utilize all of the available biogas with excess capacity to grow. A 140 kw engine will require 51,700 cubic feet per day to run at full capacity; this is 20 percent more than is currently produced at Spring Street. The 20 percent excess capacity will provide Spring Street with sufficient capacity for peak gas production and the expected gas production from population growth. To accommodate gas production in excess of 51,700 cubic feet per day, as can be expected from modifications to the digestion system, the alternative is being developed for expansion with an additional engine as needed. The cogeneration system will use packaged engine-generator sets that provide sound attenuation and weather protection. The sets will not require a dedicated cogeneration facility. The recommended location of the cogeneration system is to the northwest of the existing digesters. This will place them close to the biogas source, it will accommodate other process activities such as the biogas fueled boiler operation. It is also amenable to the recommended digestion expansion described in the 2009 Facilities Plan, and it is in an easily accessible area which will facilitate construction and operations. The proposed location is shown in Figure 4. 6
57 Figure 4: Cogeneration Alternative The proposed cogeneration system is not impacted by the planned solar panel project on the roof of the composting facility. The two projects would both contribute to reducing Spring Street s power purchases from the utility. Based on the most recent information from the solar power vendor, Advanced Energy Systems, the project is expected to reduce power purchases from the utility by 10 percent over the year, with a max month reduction of 15 percent. The cogeneration system is expected to contribute to reducing power purchases by approximately 33 percent. The combined benefit of the two projects would reduce power purchases from the utility by 43 percent over the year based on 2008 operations data. Biomethane Generation By removing the non-methane fraction of biogas, (including hydrogen sulfide, moisture, particulates, siloxanes and carbon dioxide) the biogas is upgraded to a quality equivalent to natural gas termed biomethane or renewable natural gas. Once upgraded, the biomethane can be used interchangeably with natural gas as a fuel for boilers, cogeneration systems or as vehicle fuel in vehicles equipped to operate on compressed natural gas (CNG). However, since removal of the carbon dioxide fraction requires a significant capital and operational investment, and boilers and cogeneration systems can operate efficiently and effectively on biogas, biomethane generation is typically reserved for installations that will either use the biomethane as a vehicle fuel or sell their upgraded biomethane back to the utility or third party. The Spring Street biomethane alternative will focus on generation of vehicle fuel for City vehicles, including on-site utilization. Distribution and utilization by an offsite third party, such as the Basin Transit Authority or Waste Management, will be considered as a subset alternative with a bulk transport truck used to deliver the gas to the offsite party. Selling biomethane to the utility, Avista, or using the utility s infrastructure to wheel and transport the biomethane to a third party is not considered viable at this time. Avista has not accepted biomethane from an external source to date and is still developing a program to receive 7
58 biomethane including minimum quality and quantity guidance, and pricing structures. As development and implementation of Avista s biomethane receiving program is expected to extend beyond the implementation schedule for the biogas utilization alternative of choice, a connection with the utility is not expected at this time. However, Avista has voiced support for the City s biogas program and has offered to help where possible. Given that a biomethane receiving program is in development, the biomethane alternative at Spring Street will be developed to accommodate future connection to the utility. The key feature of the biomethane alternative is the treatment of the biogas to natural gas quality. Table 4 below shows characteristics of the biogas generated at Spring Street as well as the natural gas delivered by Avista. Table 4: Biogas and Natural Gas Quality Source CH 4, (%) CO 2, (%) O 2, (%) N 2, (%) H 2 S, (ppmv) Siloxane (mg/m 3 as Si) Moisture High Heating Value, (BTU/ft 3 ) Temp., F Pressure Spring Street Biogas Avista Natural Gas Saturated > 95 < 3 < 0.2 < 3 < 3.75 N/A 15 F dew point > 985 < 120 7" Water Column 5-60 psig Two methods for upgrading the biogas at Spring Street are being investigated: a pressure swing adsorption unit (PSA), and a water tower scrubber. The selected gas treatment method will be determined based on discussions with vendors, including the availability of their product, and capital and operational requirements. A brief description of the two gas treatment alternatives is contained in the appendix. A biomethane system at Spring Street that utilized all of the available biogas would have the ability to produce the equivalent of 180 gallons of gas per day. This quantity of gas exceeds the vehicle fueling demands for the wastewater division and would be sufficient to support or contribute to the activities of another division or vehicle fleet. Use of biomethane as a vehicle fuel requires the following components: Vehicles equipped to operate on CNG with original equipment from the manufacturer or through vehicle conversions installed at the time of purchase A biogas purification system capable of producing biomethane quality gas A 4,000 to 5,000 psig natural gas (biomethane) compressor A desiccant drier for post compression fuel drying 8
59 High pressure CNG storage vessels CNG fueling equipment with card reader for usage tracking Operations and maintenance staff to ensure reliable performance of CNG vehicles and refueling infrastructure A secondary connection to the natural gas utility to provide additional fueling capacity during peak demand and when the biogas system is unavailable The proposed location for this equipment is on the northwest side of the existing digesters. This location positions the biomethane and vehicle fueling equipment in an open area of sufficient size to meet the requirements of NFPA 820 and NFPA 52, which regulate classification of areas with biogas fuel and separation distances for CNG fueling infrastructure. This location is also amenable to the potential digestion expansion recommended within the 2009 Facilities Plan, as well as to the biogas boiler fuel alternative that could be installed in conjunction with this alternative. To accommodate vehicle fueling activities, a paved access with a vehicle fueling island capable of servicing two vehicles simultaneously is recommended. The proposed layout is shown in Figure 5. Figure 5: Biomethane and CNG Fueling Layout For Spring Street or the City of Klamath Falls to use the available biogas as vehicle fuel, a small CNG fleet will need to be developed. Development of a CNG fleet is typically done in phases, as older vehicles are retired and newer vehicles are purchased and put into service. For heavy duty-vehicles such as garbage trucks and buses, the vehicle can typically be 9
60 purchased equipped for operation on CNG direct from the manufacturer. For medium and light duty vehicles, the vehicle must be purchased and converted. Conversion of vehicles to operate on CNG is regulated by the U.S. Environmental Protection Agency (EPA). The EPA has regulatory jurisdiction over vehicle conversion because converting a vehicle s engine to operate on an alternative fuel will impact the vehicle s emissions and the onboard diagnostic system designed to monitor a vehicle s emissions. While CNG vehicle conversion kits are readily available for all types of makes and models of vehicles, only a limited number of these kits hold EPA certifications, most notably those produced by the Baytech Corporation and BAF Technologies. Conversion kits that lack this certification, while often significantly cheaper, cannot be legally installed in vehicles that will be used on public roads. Further, these vehicles would not be eligible for the Qualified Alternative Fuel Motor Vehicle (QAFMV) tax credit allotted under Section 30B(e)(5) of the IRS tax code. Vehicle conversion kits that are approved by the EPA are done so on a yearly basis for specific makes and models of vehicles. Once the kit is approved, the kit manufacturer will team up with local dealerships and installers to retrofit new vehicles to meet consumer demand. The conversion cost for a vehicle can vary substantially depending on the vehicle make and model; however, they typically start in the $12,000 to $18,500 range. For instance, conversion of a 2009 Ford F-150 or F-250 was quoted at $17,500 plus $975 for delivery. While this cost is substantial, it should be noted that tax credits are available to help offset the cost. In 2009, the tax credit for a converted Ford F-150 would be $11,600, for a net conversion cost of $6,875 ($17,500 + $975 - $11,600 = $6,875). For tax exempt entities, such as the City of Klamath Falls, the tax credit is usually realized through a purchase and selling agreement with the supplying vehicle dealership which will reflect the tax credit in a reduced vehicle cost. The number and types of vehicles currently approved for conversion by the EPA is limited and changes yearly. A list of the vehicles and manufacturers currently holding EPA certifications for the year 2009 has been included in the appendix for reference. A preliminary review of the vehicles owned by the City suggests that approximately 90 vehicles would be candidates for replacement with a CNG vehicle when a new vehicle is purchased. Most of these vehicles are the Ford F-150, F-250 and F-350 models. Hybrid Alternative A hybrid alternative combining the three previous biogas alternatives has been included to provide Spring Street with a biogas system that is capable of flexing and growing to meet the facility needs as well as market conditions and changing energy prices as they develop. The proposed system would utilize a biogas fueled boiler, an internal combustion engine cogeneration system, and a small biogas scrubber. The system would be capable of purifying a portion of the gas generated at Spring Street, approximately 14,000 cubic feet per day, to biomethane quality for use as vehicle fuel. The proposed system would be constructed in a similar layout to the biomethane alternative as shown in Figure 6. 10
61 Figure 6: Hybrid Alternative Layout The vehicle fueling infrastructure of the hybrid alternative may be downsized for this alternative assuming that a smaller fleet would be developed for the reduced biomethane flows. The size of the fueling equipment infrastructure will be determined in the subsequent phase of this project. Conclusion and Next Steps Based on City comments and review, the four alternatives will be developed and evaluated to determine which alternative represents the most viable option for the City. The next steps in the process are: Confirm the equipment pricing, configuration and sizing for each alternative Determine the most cost effective and appropriate technology for biomethane generation Confirm locations and tie-in points with utility infrastructure for the cogeneration alternative Confirm alternatives conform to applicable fire codes, such as NFPA 820 and NFPA 52 Develop detailed process flow diagrams Develop plans and sections as appropriate for the alternatives Perform preliminary cost estimate of alternatives Perform economic analysis of alternatives to determine net present values 11
62 Determine environmental and social impacts of alternatives Develop and evaluate a FOG receiving system to augment biogas production Determine and evaluate appropriate funding and financing alternatives Communicate results to the City 12

63 Appendix Pressure Swing Adsorption (PSA) The PSA is a carbon dioxide removal technology that is operated in series with other gas treatment technologies such as an iron sponge, a gas chiller and coalescing filter, a particulate filter and activated carbon vessel for hydrogen sulfide, moisture, particulates, and siloxane removal respectively. The PSA utilizes a specialized media and a bank of pressure vessels which cycle between low and medium pressure (120 psig). Carbon dioxide adsorbs onto the media under pressure, and desorbs at atmospheric conditions. By cycling through the pressure gradient, i.e., a pressure swing, the carbon dioxide is purged from the gas enabling the methane fraction to flow through and exit as a purified stream. A photo of an installed PSA is shown in Figure A. Figure A: Pressure Swing Adsorption Water Tower Scrubber Relative to methane, impurities in biogas dissolve relatively easily in water, especially under medium to high pressure. A water tower scrubber uses a pressure vessel and media packing to encourage dissolution of the carbon dioxide, hydrogen sulfide, and siloxanes into water by maximizing the contact time of the water and impurities. The scrubber operates at a pressure (between 200 and 300 psig) that preferentially selects for the removal of the impurities. Typically, a water tower system will compress and introduce biogas at the base of a tall randomly packed vessel, approximately 25 feet in height, and compress and distribute water at the top of the vessel for a countercurrent flow. A purified methane stream exits out of the top of the vessel and a carbonated waste water stream exits out the base. The waste water stream can either be recycled through the system after flashing off the impurities, or can be sent on for treatment typically with discharge into the secondaries or DAFT. 13
64 As the purification process is water based, a gas chiller and moisture knockout tank is required downstream for gas drying. For applications with high hydrogen sulfide concentrations, an iron sponge may be required upstream of the inlet biogas compressor to preserve the mechanical components. 14
65 Appendix B Vendor Materials
66 Boiler Information

67 Proctor Sales, Inc SW 95 th Ave., Suite 3370 Wilsonville, OR Phone: 503/ Fax: 503/ Engineered Products for Combustion and Process Applications October 2, 2009 CDM Engineers Inc. Seattle, Washington Attention: Reference: Mr. Cale McPherson Klamath Falls WWTP Boiler Replacement Project Cale: I have parpared this budgetary proposal using a Hurst Series 100 Firebox boiler with a Webster Engineering JBS series burner as a base. Included in this proposal is pricing for Bryan CL150-30psi Watertube boiler as a comparison for your use. Following are the design parameters per my understanding. Design Conditions: Boiler Manufacturer Hurst Bryan Boiler Model Series 100 CL150W Boiler Type Firebox Watertube Boiler Horsepower 40 HP 37 HP Boiler Design 30 PSIG 30 PSIG Burner Manufacturer Webster Webster Burner Model JBGG-07 JBGG-07 Burner Fuels N. Gas/D. Gas N. Gas/D. Gas Burner Natural Gas Supply Pressure 140 /7 140 /7 Burner Digester Gas Supply Pressure 7 7 Burner Heat Input (max) 1,673,000 BTU/hr 1,500,000 BTU/hr Burner Heat Input (min) 580,000 BTU/hr 500,000 BTU/hr Burner Turndown (fuel input) 3:1 3:1 Burner Motor Voltage 480v/3p/60h 480v/3p/60h Burner Firing Rate Control parallel positioning parallel positioning Applicable Codes CSD-1, UL CSD-1, UL Site Elevation 4200 FASL 4200 FASL NEMA Classification Indoors, NEMA 1/12 Indoors, NEMA 1/12
68 CDM Engineers Klamath Falls, Oregon WWTP Proposal js1 October 2 nd 2009 The boiler and burner will be factory assembled and wired to the extent possible to allow shipping via truck carrier. The boiler/burner assembly will include the following trim: - Supply and return shutoff valves. - Boiler drain valve. - Low Water cutoff float or relay type. - Low fire hold switch to protect boiler from thermal shock. - Operating and High Temperature Control switches. - Boiler mounted air vent valve. - Boiler combination pressure/temperature gauge - Water flow proving switch. - Boiler side mounted Burner Management and Combustion Control System by Autoflame. - Two Separate Fuel trains, piped and wired. - Digester gas fuel train to be stainless steel. - Stainless Steel Drip trap on digester fuel train - Flame Arester provided on digester fuel train Items not included: - Boiler stack - Circulating pumps - Equipment start-up (quoted as an option) Clarifications: - It is assumed that operating temperature will be between 175 F and 190 F. - Water return differential temperature should not be greater than 40 F (Hurst Boiler only). If the return temperature is greater than 30 F delta, or below 175 F then a circulating pump will be required and is not included in this proposal. Budgetary price for One (1) Hurst Series 100 Firebox boiler w/gordon-piatt burner, FOB Coolidge, GA, per the items noted above is: $90, Estimated shipping cost from Coolidge, GA to Klamath Falls, Oregon is:.....$5, Budgetary price for One (1) Bryan CL180W Flextube boiler w/gordon-piatt, FOB Peru, IN, per the items noted above is:.. $94,, Estimated shipping cost from Peru, IN to Klamath Falls, Oregon is:...$5, Start-up estimated for ten (10) days straight time (eight hour days) on site is: $12, I hope this budget proposal is found to be acceptable, should you have any questions or if by oversight I have missed anything I can be reached at (503) or on my cell at (503) Best Regards, Jeffrey L. Shivers Jeffrey L. Shivers Industrial Sales

69 THREE PASS FIREBOX PACKAGED BOILERS HURST PERFORMANCE BOILERS SERIES 100 Capacities From 7.4 to 650 BHP 248 to MBTU/HR. LOW PRESSURE FIREBOX DESIGN BASED ON 5 Sq. Ft./BHP. 15 PSI-steam 30 PSI-water 60 PSI Water Optional Designed, constructed and stamped in accordance with the requirements of the ASME Boiler Codes. UL Approved Forced Draft Boilers Inspected and registered with the National Board of Boiler & Pressure Vessel Inspectors.

70 C 1" CONNECTION (FOR OPTIONAL SECOND LWCO PROBE) Q J 1" WATER COLUMN CONNECTION D 12"X16" MANWAY ON 91.6 HP. & LARGER SAFETY VALVE CONNECTIONS P A B N 1 3/4" 1" WATER COLUMN CONNECTION 3/4" CONTROL CONNECTIONS G F WASHOUT WASHOUT FURNACE ACCESS ON 40 HP. & LARGER O R K L WASHOUT M BOILER SPECIFICATIONS (ALL DIMENSIONS ARE IN INCHES) E BOILER HORSEPOWER / MODEL NO GROSS OUTPUT STEAM OUTPUT FIRING RATE, GAS FIRING RATE, #2 OIL FIRING RATE, #5 & #6 OIL OTAL HEATING SURFACE ADIANT HEATING SURFACE URNACE VOLUME URNACE HEAT RELEASE A WIDTH WITHOUT TRIM B WIDTH WITH TRIM C IDTH WITH GAS TRAIN D BOILER LENGTH E OVERALL LENGTH F HEIGHT WITHOUT TRIM G HEIGHT WITH TRIM H BASE HEIGHT I UPPLY SIZE J SUPPLY LOCATION K ETURN SIZE L RETURN LOCATION M DRAIN SIZE N STACK DIAMETER O.D. O STACK HEIGHT P REAR SMOKEBOX DEPTH Q FRONT SMOKEBOX DEPTH R BOILER FIRETUBE DIAMETER HIPPING WEIGHT ATER CAPACITY ATER CAPACITY OILER HORSEPOWER / MODEL NO. RIGHT SIDE VIEW FROM F,000 BTU/CF 40,000 BTU 50,000 BTU 1 H 1 H 1 H T. R. F. F. W APPROX. W/ STD. BURNER S 30-WTR. & 15-STM. N R 30-WTR. N S. W ( HOT/WATER). W ( STEAM). B 4 CONNECTIONS 4 & SMALLER ARE FEMALE THREAD, LARGER SIZES ARE 150 LB. FLANGES. FRONT SIDE VIEW MBH LB/HR CF GP GP SQ. FT SQ. FT CU. FT MBH/CU. FT IN A IN B IN C IN D IN E IN / / / / / / / / / 8 F IN G IN 2 1 5/ 8 1 5/ 8 1 5/ 8 1 5/ 8 1 5/ 8 1 5/ 8 1 5/ 8 1 5/ 8 1 5/ 8 H I I IN 13 1/ / / / / / / 2 J I K IN 6 1/ / 4 6 1/ 4 6 3/ 8 6 3/ 8 6 3/ 8 L IN / 4 1 1/ 4 1 1/ 4 1 1/ 4 M IN N IN 42 3/ / / / / / / / / / 8 O IN 9 7/ / / / / / / / / / 4 P IN / / / 4 Q IN R LBS GALS GALS H
71 THREE PASS WET BACK PACKAGED FIREBOX BOILERS Series 100 CUT-AWAY VIEW FULLY TRIMMED & PIPED DISCHARGE NOZZLE SAFETY RELIEF VALVE HINGED ACCESS DOORS 3rd WATER BACKED FURNACE FULLY AUTOMATED FORCE DRAFT BURNER 1st Pass 2nd WATER BACKED FURNACE INSPECTION MAN WAY W/ FLAME SITE PORT (40 HP. & UP) RETURN NOZZLE A / / / / A B B C C D / / / / / / / / / / / / / / 2 D E E F 78 3/ / / / / / / / / / / / / / 4 F G / / / G H 1 5/ 8 1 5/ 8 1 5/ 8 1 5/ 8 1 5/ 8 1 5/ 8 1 5/ 8 1 5/ 8 1 5/ 8 1 5/ / 8 8 1/ 8 8 1/ 8 8 1/ 8 H I I J 36 1/ / / / / / / / / / / / / / / / / 4 J K K L 6 3/ 8 6 3/ 8 6 3/ 8 6 3/ 8 6 3/ 8 6 3/ / / / / / / / 4 L M 1 1/ 2 1 1/ 2 1 1/ 2 1 1/ 2 1 1/ M N N O 62 1/ / / / / / / / / / / / / / / / / 8 O P 15 3/ / / / / / / / / / / / / / / / / 4 P Q 10 1/ / / / / / / / / / / / / / / 4 Q R R DIMENSIONS SUBJECT TO CHANGE WITHOUT NOTICE. CERTIFIED DRAWINGS AVAILABLE UPON REQUEST.

72 THREE PASS FIREBOX PACKAGED BOILERS Efficient 3-Pass Design Flexibility Gas, Oil, Heavy Oil, and Combination Gas/Oil ASME Code Constructed & Stamped for 15 PSI Steam/30 Water Registered with the National Board of Boiler Inspectors Competitively Priced, Easily Maintained, Designed for Efficiency Large Furnace Volume for Ultimate Combustion Efficiency Unified Refractory Base Floor Steel Skids and Lifting Eyes Low Heat Release - 5 Sq. Ft./HP. Factory Insulated 2 Mineral Wool Factory Jacketed & Painted Easy Access to Fireside Surfaces Ample Waterside Cleanout Openings Fully Automatic Operation U.L. Listed, Forced Draft Burners Wet Back Construction U.L. Listed Controls & Trim Factory Test Fired Flame Observation Ports Front & Rear STANDARD FEATURES SERIES 100 All units are factory packaged with operating controls, relief valves, burner and fuel train. Installation is made simple in that only service connections are needed to place in operation. Flexible burner systems are available for firing natural gas, LP gas, #2 oil, heavy oil, or combinations. High density 2 mineral wool insulation assures lower radiant heat loss. In addition to meeting the requirements of U.L., burner systems are optionally available to meet the requirements of FM, IRI, MILITARY and others. STEAM TRIM: Steam pressure gauge with syphon and test-cock; combination low water cut-off and pump control (or feeder); auxiliary low water cut-off with manual reset; water column gauge glass set and drain valve; ASME safety relief valve(s); operating and high limit pressure control. WATER TRIM Combination pressure and temperature gauge; low water cut-off control with manual reset; ASME relief valve(s); operating and high limit temperature controls. hurstboiler.com P. O. Drawer Highway 319 N. Coolidge, Georgia Toll Free: Tel: (229) Fax.(229) info@hurstboiler.com Represented by: Revised 06/03
73 Cogeneration Information
74 McPherson, Cale From: Sent: To: Cc: Subject: Attachments: Preston Dickerson Thursday, October 08, :10 AM McPherson, Cale RE: Minimum Gas Specs Requirements Data-Sheet-G926TI.pdf; G926 Drawings.PDF; G926 Drawings w-o-cover.pdf Hi Cale After reviewing the job, we will give you the preliminary estimate as follows: 140 kw electrical unit with 222 kw thermal power housed in an sound shielded ISO container with separate insulated control room: $260, kw electrical unit with 222 kw thermal power stand alone unit in an insulated sound shield box for indoor installation: $230,000 This price includes : commissioning and start up of the unit by our technicians training of the plants staff all manuals, documentation & certification testing of the unit at our facility before shipping all freight dump heat radiator unit If you need any more information please let me know. I am also attaching drawings of the unit and a datasheet for your client. We have not included a service contract for the unit but can do so if you would like. Regards, Preston From: McPherson, Cale [mailto:mcphersonca@cdm.com] Sent: Wednesday, October 07, :26 PM To: Paul Tower Cc: Preston Dickerson; Seth Tower Subject: RE: Minimum Gas Specs Requirements Currently there is not a Buy America clause on what you will propose, but it is expected that the project will require external funding and that a buy America clause is a possibility. Please assume that no Buy America clause will exist for this project. Thanks for asking. Cale A. McPherson CDM 1
75 Cogeneration Units (CHP) Natural Gas Biogas Our products and services Company data Product range Technical data sheets Tech3Solu ons, Tech 3 Solutions, Inc. US Distribution Office: 7301 SW 57th Court, Suite 400 South Miami, FL (305)


76 About us In addition, we manufacture equipment for gas purification, lubricating oil units and special equipment as required by our clients. All the connections are located at one end of the CHP module. The sound hood is supported on the substructure and keeps noise emissions We use industrial engines from LIEBHERR. and MWM Brazil SEnergie GmbH is an experienced company with decentralized energy technology and bio-energy as its core competences. We develop, plan, project and build the complete plant and equipment ourselves and make systematic use of synergies for the benefit of our clients. We combine the extensive experience in plant and equipment construction possessed by the wellknown Stulz-Group with the exceptional qualifications of our staff, the members of which can call upon many years of practical know-how with cogeneration units. They ensure that we live up to our own high standards of plant and equipment safety and reliability. The head offices, construction and manufacturing of our plants are located in Heitersheim nearby Freiburg, South Germany. Residence of Sales and Service is Engen, right between Black Forest and the Lake of Constance. SEnergie builds, supplies and operates turnkey CHPs and provides a full and prompt maintenance service over Germany and Europe. The product program consists of cogeneration units (CHP) with ratings from to 280 kwel, using sewage gas, biogas or natural gas as fuel. that have proved their worth many thousands of times over. The CHP peripherals consist of standard industrial components from reputable manufacturers, for example SIEMENS, NEWAGE, BOSCH, APROVIS, HEINZMANN, GRUND- FOS etc., which carry a guarantee of continuing spare parts availability for many years. These components meet our high requests providing a high overallquality and guarantee the reliability of our plants. With the aid of the modularelement system, various engines can be installed on only four different chassis, to cover a broad performance range from to 280 kwel and with sewage gas, biogas, natural gas or liquefied gas as the fuel. About the SEnergie-CHPs: Engine and generator are mounted on a substantial base frame into which the exhaust heat exchanger, exhaust silencer, plate-type heat exchanger with mixing valve, cooling and hot water pumps, expansion tank and auxiliary oil tank are integrated. down to a pleasant level of approximately 70 db(a). The hood does not have to be detached for maintenance work to be carried out. The doors can be folded up into a compact space and swung out by 180 degrees. There are no intermediate supports or struts to interfere with access to the equipment. Our standard specification includes the add-on module control system, using SIEMENS S7 technology with a touch panel that can be equipped to perform higher-level functions if required. The control and power stages are housed in the addon switchgear cabinets, but separate, standalone control cabinets can also be supplied. All modules are run in complete form on out test rig and calibrated before delivery. 1/2009, SEnergie GmbH Tech 3 Solutions, Inc. US Distribution Office:
77 product range of CHPs with gas engine Biogas and Natural Gas G 924 T LIEBHERR 60 kw G 924 T LIEBHERR 70 kw 60 Hz HZ G TI TI LIEBHERR LIEBHERR kw kw 60 HZ G 924 TI LIEBHERR 90 kw 60 Hz G T TE LIEBHERR kw 60 HZ G TI T LIEBHERR LIEBHERR kw kw 60 HZ G 926 T LIEBHERR 115 kw 60 Hz G TI T LIEBHERR kw 60 HZ 926 TI LIEBHERR 140 kw 60 Hz G 9408 TI LIEBHERR 270 kw 60 HZ G 926 TE LIEBHERR 150 kw G 926 TIE LIEBHERR 175 kw G 926 AGR LIEBHERR 190 kw Tech 3 Solutions, Inc. US Distribution Office:
78 Technical data and dimension 60 Hz LIEBHERR G 924 CHP Model fuel Pe eta el. Qth QB VG Weight G 924 T Lean-burn turboengine Biogas 70 kw 33,9% 114 kw 207 kw 33,2 m³/h kg G 924 TI Lean-burn turboengine Biogas 90 kw 34,5% 143 kw 261 kw 33,2 m³/h kg with intercooling in cooling water cycle Pe: Electrical power eta: Electrical efficiency Coloration: Qth: Thermal power (kw) Engine RAL 3020 traffic red Exhaust temperature for natural gas and propane gas: 120 C Generator RAL 5002 ultramarine blue Exhaust temperature for sewage gas: 150 C Sound hood RAL 5002 ultramarine blue Exhaust temperature for biogas: 180 C Base frame RAL 7035 light grey QB: Input power:(kw), tolerance + 5 % Switch gear cabinet RAL 7035 light grey VG: Volumetric flow rate (m³n/h) BG: Biogas, CH4 = 65%, HU 6,23 kwh/m³n Power acc. to ISO ICFN = blocked ISO-standard-power Generator power at cos phi = 1,0 Bore / stroke 122 / 142 mm Airborne sound (in 1 m distance) 70 db(a) exhaust gas emissions: (biogas) Pressure of gas mbar NOx < 500 mg/m³n at O2 = 5 % Specified Lubrication Consumption max. 0,3 g/kwh CO < 1000 mg/m³n at O2 = 5 % Temperatures heating system 70 / 85 C RPM Voltage /min 120/208 V,277/480 V 3Phase, 60 Hz Subjects to alterations State: January 2009 Tech 3 Solutions, Inc. US Distribution Office:
79 Technical data and dimension 60 Hz LIEBHERR G 926 CHP Model fuel Pe eta el. Qth QB VG Weight G 926 T Lean-burn turboengine Biogas 115 kw 34,1% 186 kw 337 kw 54,2 m³/h kg G 926TI Lean-burn turboengine Biogas 140 kw 34,7% 222 kw 404 kw 64,8 m³/h kg with intercooling in cooling water cycle Pe: Electrical power eta: Electrical efficiency Coloration: Qth: Thermal power (kw) Engine RAL 3020 traffic red Exhaust temperature for natural gas and propane gas: 120 C Generator RAL 5002 ultramarine blue Exhaust temperature for sewage gas: 150 C Sound hood RAL 5002 ultramarine blue Exhaust temperature for biogas: 180 C Base frame RAL 7035 light grey QB: Input power:(kw), tolerance + 5 % Switch gear cabinet RAL 7035 light grey VG: Volumetric flow rate (m³n/h) BG: Biogas, CH4 = 65%, HU 6,23 kwh/m³n Power acc. to ISO ICFN = blocked ISO-standard-power Generator power at cos phi = 1,0 Bore / stroke 122 / 142 mm Airborne sound (in 1 m distance) 70 db(a) exhaust gas emissions: (biogas) Pressure of gas mbar NOx < 500 mg/m³n at O2 = 5 % Specified Lubrication Consumption max. 0,3 g/kwh CO < 1000 mg/m³n at O2 = 5 % Temperatures heating system 70 / 85 C RPM Voltage /min 120/208 V,277/480 V 3Phase, 60 Hz Subjects to alterations State: January 2009 Tech 3 Solutions, Inc. US Distribution Office:
80 Technical data and dimension 60 Hz LIEBHERR G 9408 CHP Model fuel Pe eta el. Qth QB VG Weight G 9408T Lean-burn turboengine Biogas 220 kw 34,4% 352 kw 639 kw 102,6 m³/h kg G 9408 TI Lean-burn turboengine Biogas 270 kw 34,7% 428 kw 779 kw 125,1 m³/h kg with intercooling in cooling water cycle Pe: Electrical power eta: Electrical efficiency Coloration: Qth: Thermal power (kw) Engine RAL 3020 traffic red Exhaust temperature for natural gas and propane gas: 120 C Generator RAL 5002 ultramarine blue Exhaust temperature for sewage gas: 150 C Sound hood RAL 5002 ultramarine blue Exhaust temperature for biogas: 180 C Base frame RAL 7035 light grey QB: Input power:(kw), tolerance + 5 % Switch gear cabinet RAL 7035 light grey VG: Volumetric flow rate (m³n/h) BG: Biogas, CH4 = 65%, HU 6,23 kwh/m³n Power acc. to ISO ICFN = blocked ISO-standard-power Generator power at cos phi = 1,0 Bore / stroke 135 / 150 mm Airborne sound (in 1 m distance) 70 db(a) exhaust gas emissions: (biogas) Pressure of gas mbar NOx < 500 mg/m³n at O2 = 5 % Specified Lubrication Consumption max. 0,3 g/kwh CO < 1000 mg/m³n at O2 = 5 % Temperatures heating system 70 / 85 C RPM Voltage /min 120/208 V,277/480 V 3Phase, 60 Hz Subjects to alterations State: January 2009 Tech 3 Solutions, Inc. US Distribution Office:


81 Technical Data CHP with EGR- (Exhaust-gas recirculation-) Technology Model fuel Pe eta el. Qth QB VG Weight G 6.12 EGR MWM R6-Cylinder Natural gas 100 kw 37,1% 140 kw 270 kw 26,7 m³/h kg turbocharged Exhaust-gas recirculation EGR Three-way catalytic converter G 926 EGR LIEBHERR R6-Cylinder Natural gas 190 kw 38,3% 253 kw 496 kw 38,7 m³/h kg turbocharged Biogas 190 kw 38,3% 235 kw 496 kw 93,1 m³/h Exhaust-gas recirculation EGR Sewage gas 190 kw 38,3% 253 kw 496 kw 49,1 m³/h Three-way catalytic converter For operating with special gases which have a high degree of contamination a desulphurisation and a gas cleaning is required G 9408 EGR LIEBHERR V8-Cylinder Natural gas 330 kw 39,0% 428 kw 845 kw 83,7 m³/h kg turbocharged Exhaust-gas recirculation EGR Three-way catalytic converter Pe: Electrical power eta: Electrical efficiency Coloration: Qth: Thermal power (kw) Engine RAL 3020 traffic red Exhaust temperature for natural gas and propane gas: 120 C Generator RAL 5002 ultramarine blue Exhaust temperature for sewage gas: 150 C Sound hood RAL 5002 ultramarine blue Exhaust temperature for biogas: 180 C Base frame RAL 7035 light grey QB: Input power:(kw), tolerance +- 5 % Switch gear cabinet RAL 7035 light grey VG: Volumetric flow rate (m³n/h) KG: Sewage gas, CH4 = 65%, HU 6,23 kwh/m³n Power acc. to ISO /DIN 6271 EG: Natural gas, HU 10,10 kwh/m³n ICFN = blocked ISO-standard-power BG: Biogas, HU 5,33 kwh/m³n Generator power at cos phi = 1,0 Airborne sound (in 1 m distance) 70 db(a) Pressure of gas mbar exhaust gas emissions: TA-Luft (sewage-/biogas) Specified Lubrication Consumption max. 0,3 g/kwh NOx < 50 mg/m³n at O2 = 5 % Temperatures heating system 70 / 85 C CO < 150 mg/m³n at O2 = 5 % Revolutions per minute Voltage /min 3 x 400 V / 50Hz Subjects to alterations State: November, 2008 The EGR- Technology Exhaust gas recirculation technology allows for a portion of exhaust gas to be reused. The cooled exhaust gas is recirculated to the intake system and allows a high power density with a very good electrical coefficient of performance (C.O.P.) together with low pollutant emissions. Tech 3 Solutions, Inc. US Distribution Office:
82 dimension CHP with EGR- (Exhaust-gas recirculation-) Technology dimension G 926 EGR dimension G 9408 EGR Tech 3 Solutions, Inc. US Distribution Office:
83 Technical Newsletter No. 09 Minimum requirements of combustion gases Dated 09/2005 Combustion gases are the gas mixtures which are suitable for the operation of gas engines and which are classified according to composition, calorific value and knock resistance. The knock resistance is evaluated by the methane number (MN) whereas MN = 100 (knock-resistant) is defined for methane (CH 4 ) and MN = 0 (prone to knocking) is defined for hydrogen (H 2 ). Gases with irregular or low methane number bear the risk of knocking and thus the risk of mechanical and thermal load with possible resulting damages. The methane number of the combustion gas mixture is formed by several components whereas the main components are: - methane - CH 4 as the main component of conventional combustion gas for gas engines especially in case of diverse natural gases. - hydrogen - H 2 reduces the methane number of the gas mixture considerably. Is primarily existent in combustion gases such as low-temperature carbonisation gases and gases from coke ovens and furnaces. - Higher hydrocarbons - C n H m with n>1 and m>4 i.e. hydrocarbons above methane which are often very unstable and thus prone to knocking. - Inert gases - N 2 and CO 2 which are not actively involved in combustion but do increase the methane number of a gas mixture whereas CO 2 has three times the impact of N 2. For the evaluation of gases with regard to their suitability as combustion gases, substances associated with gas also play a vital role. Although they (mostly) do not directly influence the actual combustion process, they must absolutely be considered for the reliable operation of the engine and the unit. These substances associated with gas are released during the generation of gas in wastewater treatment plants, landfills and biogas plants. Minerals, halogens, metals, heavy metals, etc. form a compound with hydrocarbons. Depending on their amount and bad impact, these substances associated with gas must be filtered out of the combustion gas before they enter the engine. Minimum requirements of combustion gases for gas engines Property Abbr. Unit of measure Limit Comment Calorific value (minimum calorific value) Hu [kwh/m³n] > 4 Methane number MN >= 80 (70) Sulphur content (total) orr H 2 S content Chlorine content (total) Fluorine content (total) Total of chlorine and fluorine S H 2 S Cl F (Cl+F) [mg/m³n CH 4 ] [Vol%/m³n CH 4 ] [mg/m³n CH 4 ] [mg/m³n CH 4 ] [mg/m³n CH 4 ] < < 0,15 < 100 < 50 < 100 Ammoniac NH 3 [mg/m³n CH 4 ] < 30 Due to increased maintenance we recommend values < 500 mg/m³. Oil vapours (>C5) (>C5) [mg/m³n CH 4 ] < 400 Dust content Grain size [mg/m³n CH 4 ] [µm] < Silicon (organic) Si [mg/m³n CH 4 ] < 10 Humidity (relative) [%] < 80 Attention: in case of Si > 5 mg/m³n you must observe metal abrasion when making oil analyses At lowest air temperature. Please absolutely avoid condensation in the gas controlled system. Gas temperature C > 10 <40 Minimum pressure ahead of the gas controlled system Gas pressure fluctuations P [mbar] [%] > 20 ± 10 Of the adjusted value at a fluctuation frequency of < 10/h Page 1 of 2

84 Technical Newsletter No. 09 Project-related requirements The failure to comply with the required minimum properties of the combustion gas or its contamination with not specified substances will result in a reduction of the service life of the engine and its component parts. The standard maintenance periods for the operation of the engine according to the specifications as detailed in the standard maintenance plan are partly fallen below significantly and have no reference value at all. If the provided combustion gas does not meet the above mentioned minimum properties or if the combustion gas contains additional side products which are not specified and if we did not approve the precise combustion gas analysis in written form, all warranty claims against us expire. It is generally necessary to present a gas analysis (not older than 2 weeks) before commissioning and to enclose it to the commissioning protocol. After commissioning, a gas analysis must be made three times a year and the compliance with the minimum properties must be checked. In case of warranty, all gas analyses must be provided. For component parts of the unit, the corresponding manufacturer document must be considered. If catalytic converters and/or exhaust gas heat exchangers are used, the appropriate manufacturer standard for the permitted gas composition and exhaust gas temperature must be considered. Sample taking and gas analysis Must be accomplished according to applied standards and guidelines. The following represents a choice: Analysis parameter Method Main components with the identification of the calorific value DIN A (O 2, CO 2, N 2, CH 4 ) DIN EN H8 (Wickbold combustion) Total of chlorine, fluorine, sulphur DIN EN (ionic chromatography) Hydrosulphide DIN ; VDI 3486, sheet 2 Silicon-organic compounds VDI 3865 sheet 4 /(GC-MS) and halogens Further components if required: Ammoniac Remaining oil content Relative humidity According to our experiences, a reliable analysis of silicon and silicon-organic compounds cannot be accomplished with all prevalent samplings. Silicon is very reactive and sticks to the surface of gas collecting tubes and Linde bags. Only the in-situ sampling by means of gas scrubbing using an adequate medium forms the basis for a reliable analysis of these important components. Do not save here. SEnergie GmbH - H. Lorenz - Page 2 of 2
85 Biogas Treatment System

86 Page 1 of 7 BUDGET PROPOSAL PROJECT INFORMATION Date: February 12, 2010 Cale McPherson CDM rd Avenue, Suite 1100 Seattle, WA Project Name: Unknown 45scfm Budget Proposal Mr. McPherson, Unison Solutions, Inc. is pleased to provide you with this budgetary proposal for a Gas Conditioning System for your 45scfm Project. This proposal includes all the engineering, technician labor, fabrication, CAD design services and materials to construct a complete gas conditioning system. EQUIPMENT/SUB-SYSTEMS Hydrogen Sulfide Removal System Hydrogen Sulfide Removal Inlet Moisture/Particulate Filter Hydrogen Sulfide Removal Vessels Compression/Moisture Removal System Blower Inlet Moisture/Particulate Filter Gas Blower Dual Core Heat Exchanger Glycol Chiller (Located in an Unclassified Area) Gas Recirculation Siloxane Removal System Siloxane Removal Vessels Siloxane Removal Final Particulate Filter Control System Electrical Control Panel (Located in an Unclassified Area) SYSTEM DESCRIPTION The gas conditioning system will consist of a hydrogen sulfide removal inlet moisture/particulate filter, hydrogen sulfide removal media vessels, compression/moisture removal skid, glycol chiller skid and a remote mounted electrical control panel. The gas will first enter through a hydrogen sulfide inlet moisture/particulate filter and then go into the hydrogen sulfide removal vessels. After the hydrogen sulfide is removed from the gas it will go through a blower inlet moisture/particulate filter before entering the rotary lobe blower where the gas will be compressed to 15 WC, then go through a dual core heat Design and content included in this document is proprietary and remains the property of Unison Solutions, Inc.
87 Page 2 of 7 exchanger. The heat exchanger will use the hot gas from compression to reheat the cold gas which uses chilled glycol to cool the gas to 40ºF. After the gas is chilled it is reheated to 80ºF. After the gas drying stage the gas will be sent to the siloxane removal vessels. After the siloxanes are removed the gas will go through a final particulate filter then be delivered to the end use equipment.. SYSTEM DESIGN CONDITIONS System Requirements Gas Flow 45 scfm Inlet Gas Conditions Discharge Gas Conditions Inlet Gas Pressure 7 WC Discharge Gas Pressure 15 WC Inlet Gas Temperature 98 ºF Discharge Gas Temperature 80 ºF Relative Humidity 100 % Dew Point Temperature 40 ºF Methane % Maximum Hydrogen Sulfide 5 ppmv Carbon Dioxide % Maximum Siloxane N/D Hydrogen Sulfide 1,500 ppmv Particulate Removal 3 micron Siloxane 1,000 ppbv SYSTEM DETAILS Hydrogen Sulfide Removal System - Inlet Electric Actuated Butterfly Valve - Butterfly valve with cast iron body, stainless steel disk and stem, and viton seats. Butterfly valve shall be lug style. - Type 7 explosion proof actuator. - Spring return closed upon power loss. - Hydrogen Sulfide Removal Inlet Moisture/Particulate Filter - Mounted upstream of the hydrogen sulfide removal media vessel. - 99% removal of 3micron and larger particulates and liquid droplets. - Materials of construction will be 304L stainless steel # ANSI B16.5 inlet and outlet connections. - Fasteners will be Grade 5 zinc plated steel. - Cleanable polypropylene structured mesh element. - ΔP gauge across the filter element. - Sight glass for liquid level indication. - Level switch above the condensate drain to warn of failure. - Bottom drain with no gas loss drip trap, manual bypass, strainer and piping. - Hydrogen Sulfide Removal Media Vessel - 7 diameter x 12 straight side, dished top and bottom vessels. - Vessel rated for 15psig pressure and 2psig vacuum. - Materials of construction will be 304L stainless steel # ANSI B16.5 side inlet and outlet connections. - Fasteners will be Grade 5 zinc plated steel. - Vessel equipped with a 30 top manway. - Vessel equipped with a 30 side manway. - Internal supports and grating for media. - Pressure relief valve included. - Two (2) top vents with stainless steel ball valves. - Bottom manual condensate drain with stainless steel ball valves. - Vessel will be free-standing on four (4) 304/304L stainless steel legs. Design and content included in this document is proprietary and remains the property of Unison Solutions, Inc.
88 Page 3 of 7 - Vessel will be equipped with a top mounted work platform. Platform and hand rails will be powder-coated carbon steel. Access ladder will be galvanized steel. - Hydrogen Sulfide Removal Media - Each vessel charged with SulfaTreat media. - SulfaTreat media to be loaded into hydrogen sulfide removal vessel by installation contractor. - Controls - All controls for the hydrogen sulfide removal system will be built into the electrical control panel for the complete gas conditioning system. - See Control System for details about the electrical control panel. - Instrumentation - Inlet pressure transmitter. - Inlet pressure gauge. - Inlet RTD (Resistance Temperature Detector). - Inlet temperature gauge. - High level switch at hydrogen sulfide removal inlet moisture/particulate filter condensate drain. - Differential pressure gauge across the hydrogen sulfide removal inlet moisture/particulate filter. - Piping - Piping from the hydrogen sulfide removal inlet moisture/particulate filter to the hydrogen sulfide removal media vessel will be provided. - All piping 2 inches and smaller may be threaded or 150# ANSI B16.5 flanged, but threaded piping shall be a minimum of Schedule All piping 2 inches and larger shall be welded with 150# ANSI B16.5 flanged connections. - Fabricated in accordance with ASME B Fasteners shall be Grade 5 zinc plated steel. - Valves - All valves 3 inches and larger will be butterfly valves with cast iron bodies, stainless steel disk and stem, and Viton seats. Butterfly valves will be lug style. - All valves 2-1/2 inches and smaller will be ball valves. - Ball valves 1 and smaller shall have NPT threaded connections. Bodies and balls shall be 316 stainless steel. Packing or seats will be PTFE. - Ball valves 1-1/2 and larger shall have 150# flanged connections. Bodies and balls shall be 316 stainless steel. Packing or seats will be PTFE. Compression/Moisture Removal System - Blower Inlet Moisture/Particulate Filter - Mounted upstream of the gas blower. - 99% removal of 3micron and larger particulates and liquid droplets. - Materials of construction will be 304L stainless steel # ANSI B16.5 side inlet and outlet connections. - Fasteners will be Grade 5 zinc plated steel. - Cleanable polypropylene structured mesh element. - ΔP gauge across the filter element. - Sight glass for liquid level indication. - Level switch above the condensate drains to warn of failure. - Bottom drain with no gas loss drip trap, manual bypass, strainer and piping. - Gas Blower - Belt driven 5Hp 480V, 3pH, 60Hz EXP electric motor. Design and content included in this document is proprietary and remains the property of Unison Solutions, Inc.
89 Page 4 of 7 - VFD for blower motor to account for varying flows. - Cast iron casing. - Inlet and discharge flex connectors. - Discharge silencer. - Discharge check valve. - Discharge pressure safety valve. - Dual Core Heat Exchanger - Within the heat exchanger, the gas will be cooled to 40ºF and re-heated to 80ºF. - Aluminum fins on stainless steel tubes. - Mounted in single 304 stainless steel housing. - All condensation generated during cooling will be removed inside the heat exchanger housing. - Level switch mounted on the housing to warn of drain failure. - RTD mounted on the housing to verify the coldest temperature that the gas reaches. - Bottom drain with no gas loss drip trap, manual bypass, strainer and piping. - Glycol Chiller - UL labeled NEMA 4 control panel - Fused disconnect. - Touch screen HMI. - Allen Bradley PLC for refrigeration circuit control. - Ethernet communication with gas conditioning system electrical control panel. Air cooled condenser unit. - Condenser poly-coated for corrosion resistance F glycol delivery temperature. - VFD controlled refrigeration circuit capable of reduced capacity staging. - VFD glycol circulation pump sized for 100% capacity. - Powder coated support structure. - Copper lines heresite coated. - Stainless steel evaporator. - R-507 Refrigerant with no phase out date. - Glycol Chiller to utilize Propylene Glycol. - Gas Recirculation - A modulating butterfly valve will be provided to allow excess gas to flow from the discharge of the system back to the inlet. - Controls - All controls for the compression/moisture removal system will be built into the electrical control panel for the complete gas conditioning system. - See Control System for details about the electrical control panel. - Instrumentation - High level switches at each condensate drain. - Differential pressure gauge across the blower inlet moisture/particulate filter. - RTD s at each temperature change point. - RTD to monitor glycol temperature. - Temperature gauges at each temperature change point. - Pressure gauges at each pressure change point. - High blower discharge pressure transmitter. - Delivery pressure transmitter. - Piping - All piping shall be minimum Type 304/304L schedule 10S stainless steel in IPS standard sizes. Design and content included in this document is proprietary and remains the property of Unison Solutions, Inc.
90 Page 5 of 7 - All piping 2 inches and smaller may be threaded or 150# ANSI B16.5 flanged, but threaded piping shall be a minimum of Schedule All piping 2 inches and larger shall be welded with 150# ANSI B16.5 flanged connections. - Fabricated in accordance with ASME B Fasteners shall be Grade 5 zinc plated steel. - Valves - All valves 3 inches and larger shall be butterfly valves with cast iron bodies, stainless steel disk and stem, and Viton seats. Butterfly valves shall be lug style. - All valves 2-1/2 inches and smaller shall be ball valves. - Ball valves 1 inch and smaller shall have NPT threaded connections. Bodies and balls shall be 316 stainless steel. Packing or seats will be PTFE. - Ball valves 1-1/2 inches and larger shall have 150# flanged connections. Bodies and balls shall be 316 stainless steel. Packing or seats will be PTFE. - Check valves 2 inch and smaller shall be ball type, stainless steel and have NPT threaded connections. Check valves 2-1/2 inches and larger shall be spring loaded, stainless steel, with a Viton seat. Valves will be inserted in the pipeline between two flanges. - Skid Base - All components except the hydrogen sulfide removal system, siloxane removal system, glycol chiller and electrical control panel will be mounted on a single skid. - All components mounted, piped and wired on skid. - Electrical components pre-wired to one of two junction boxes on edge of skid. - Condensate drains piped to common connection on edge of skid. - Conduit to be rigid aluminum. - Semi-gloss black powder coated. Siloxane Removal System - Siloxane Removal Media Vessels - 18 diameter x 8 straight side, dished top and bottom vessels. - Materials of construction will be 304L stainless steel # ANSI B16.5 side inlet and outlet connections. - Fasteners will be Grade 5 zinc plated steel. - Internal septas for even gas distribution through media. - Elliptical manway on top of each vessel. - Pressure relief valves included. - Bottom manual condensate drain with stainless steel ball valves. - Vessels will be free-standing on four (4) 304/304L stainless steel legs. - Platform and hand rails will be powder-coated carbon steel. Access ladder will be galvanized steel. - Test/purge ports with valves on the inlet and exit of each vessel. - Siloxane Removal Media - Initial charge of SAG Media is supplied. - The media is specifically engineered for removal of siloxanes and similar contaminants from landfill and digester gas sources. - Siloxane Removal Final Particulate Filter - Mounted downstream of the siloxane removal vessels. - 99% removal of 3micron and larger particulates and liquid droplets. - Materials of construction will be 304L stainless steel # ANSI B16.5 side inlet and outlet connections. - Fasteners will be Grade 5 zinc plated steel. Design and content included in this document is proprietary and remains the property of Unison Solutions, Inc.
91 Page 6 of 7 - Cleanable polypropylene structured mesh element. - Bottom manual condensate drain with stainless steel ball valve. - Piping - Lead/Lag piping between siloxane removal media vessels shall be provided by manufacturer. - All piping 2 inches and smaller may be threaded or 150# ANSI B16.5 flanged, but threaded piping shall be a minimum of Schedule All piping 2 inches and larger shall be welded with 150# ANSI B16.5 flanged connections. - Fabricated in accordance with ASME B Fasteners will be Grade 5 zinc plated steel. Control System - Electrical Control Panel - Electrical Control Panel will be shipped loose for remote installation. - Electrical Control Panel will require a 480V, 3ph, 60Hz feed. - UL 508A listed, 5kA Short Circuit rating. - UL Type 4 panel, painted carbon steel. - Fused Disconnect. - Allen Bradley, CompactLogix PLC. - Human interface via touch screen. - Ethernet data link. - Instrument wiring to terminate at terminal strips inside electrical panel. DELIVERY SCHEDULE - Submittals delivered 4 weeks after receipt of down payment. - Equipment delivery 18 to 20 weeks after submittal approval. - Delivery is subject to confirmation at the time of order placement and/or submittal approval. PRICING SUMMARY - Price includes all labor and expenses associated with the construction of the packaged system. - Prices do not reflect any taxes that may be applicable and are valid for 30 days. - Price is F.O.B. Dubuque, IA Shipping costs not included. Hydrogen Sulfide Removal System...$55, SulfaTreat Media (Purchased Directly by Customer)..$8, Compression/Moisture Removal System.$185, Siloxane Removal System...$32, Start-up or commissioning services $1,200 per day per technician plus travel/expenses PRICE DOES NOT INCLUDE - Start-up or commissioning: $1,200 per Unison technician per day plus expenses. - An electrical control panel or glycol chiller for use in a classified area. - Heat trace or freeze protection as needed. Design and content included in this document is proprietary and remains the property of Unison Solutions, Inc.
92 Page 7 of 7 - Any field/installation work. PAYMENT SCHEDULE - 30% upon order acceptance. - 30% at midpoint of construction. - 30% upon equipment delivery. - 10% upon site acceptance not to exceed 180 days from shipment. - Net 30 days on all payments. ASSUMPTIONS WARRANTY - The skid will be considered a Class I, Division 1 area around all gas components V, 3ph, 60Hz power is available. - All wiring between the hydrogen sulfide removal system, compression/moisture removal skid, siloxane removal system, glycol chiller and the remote mounted electrical control panel will be by others. - All piping between the hydrogen sulfide removal system, moisture removal/compression skid, siloxane removal system and glycol chiller will be by others. - Customer or installation contractor will be responsible for filling all electrical seals on the skid and on any conduits entering or leaving the classified area. Filling should be done after startup and commissioning. - Freeze protection provided by others. - Glycol chiller and electrical control panel will be in a non-classified area. - Unison has the right to charge a monthly storage fee for systems that are completed on schedule but are being held at the factory due to customer delays. Unison Solutions, Inc. will warrant all workmanship and materials in conformance with the attached Warranty Statement. Warranty is valid for 18 months from the time the equipment is shipped from Unison s factory or 12 months from the date of startup, whichever occurs first. Thank you for giving Unison Solutions the opportunity to propose our services. If you have any questions or require additional information, please contact me at your convenience. Sincerely, Tony Schilling Unison Solutions, Inc Chavenelle Road Dubuque, IA Phone: Fax: Cell: Design and content included in this document is proprietary and remains the property of Unison Solutions, Inc.
93 WARRANTY STATEMENT Unison Solutions, Inc. (Unison) is committed to providing quality products and services to its customers. As a demonstration of this commitment, Unison offers the following warranty on its products. Grant of Warranty: Unison provides this warranty for its equipment under the terms and conditions which are detailed herein. This warranty is granted to the person, corporation, organization, or legal entity (Owner), which owns the equipment on date of start-up. This warranty applies to the owner during the warranty period, and is not transferable. Warranty Coverage: Equipment that is determined by Unison to have malfunctioned during the warranty period under normal use solely as a result of defects in manufacturing workmanship or materials shall be repaired or replaced at Unison s option. Unison s liability under this warranty to the Owner shall be limited to Unison s decision to repair or replace, at its factory or in the field, items deemed defective after inspection at the factory or in the field. Warranty Exclusions: All equipment, parts and work not manufactured or performed by Unison carry their own manufacturer s warranty and are not covered by this warranty. Unison s warranty does not override, extend, displace or limit those warranties. Unison s only obligation regarding equipment, parts and work manufactured or performed by others shall be to assign to the Owner whatever warranty Unison receives from the original manufacturer. Unison does not warrant its products from malfunction or failure due to shipping or storage damage, deterioration due to exposure to the elements, vandalism, accidents, power disturbances, or acts of nature or God. This warranty does not cover damage due to misapplication, abuse, neglect, misuse, improper installation, or lack of proper service and/or maintenance, nor does it cover normal wear and tear. This warranty does not apply to modifications not specifically authorized in writing by Unison or to parts and labor for repairs not made by Unison or an authorized warranty service provider. This warranty does not cover incidental or consequential damages or expenses incurred by the Owner or any other party resulting from the order, and/or use of its equipment, whether arising from breach of warranty, non-conformity to order specifications, delay in delivery, or any loss sustained by the Owner. No agent or employee of Unison has any authority to make verbal representations or warranties of any goods manufactured and sold by Unison without the written authorization signed by an authorized officer of Unison. Unison warrants the equipment designed and fabricated to perform in accordance with the specifications as stated in the proposal for the equipment and while the equipment is properly operated within the site specific design limits for that equipment. Any alterations or repair of Unison s equipment by personnel other than those directly employed by, or authorized by Unison shall void the warranty unless otherwise stated under specific written guidelines issued by Unison to the Owner. This warranty does not cover corrosion or premature wear or failure of components resulting from the effects caused by siloxanes, hydrogen sulfide or volatile organic contaminants in excess of the design limits. The design limit is based on site specific data provided by the Owner prior to the proposal for the equipment. Owner shall be responsible for all maintenance service, including, but not limited to, lubricating and cleaning the equipment, replacing expendable parts, making minor adjustments and performing operating checks, all in accordance with the procedures outlined in Unison s maintenance literature. Unison does not warrant the future availability of expendable maintenance items. Warranty Period: This Unison warranty is valid for 18 months from the time the equipment is shipped from Unison s factory or 12 months from the date of startup, whichever occurs first. Repairs During Warranty Period: All warranty claim requests must be initiated with a Return Material Authorization (RMA) number for processing and tracking purposes. The RMA number shall be issued to the Owner upon claim approval and/or field inspection. When field service is deemed necessary in order to determine a warranty claim, the costs associated with travel, lodging, etc. shall be the responsibility of the Owner except under prior agreement for a field inspection. This warranty does not include reimbursement of any costs for shipping the equipment or parts to Unison or an authorized service establishment, or for labor and/or materials required for removal or reinstallation of equipment or parts in connection with a warranty repair. This warranty covers only those repairs that have been conducted by Unison or by a Unison authorized warranty service provider, or by someone specifically authorized by Unison to perform a particular repair or service activity. All component parts replaced under the terms of this warranty shall become the property of Unison. UNISON ASSUMES NO OTHER WARRANTY FOR ITS EQUIPMENT, EITHER EXPRESS OR IMPLIED, INCLUDING ANY IMPLIED WARRANTY OF MERCHANTABILITY, FITNESS FOR ANY PARTICULAR PURPOSE, OR NONINFRINGEMENT, OR LIABILITY FOR ANY INCIDENTAL OR CONSEQUENTIAL DAMAGE Chavenelle Road Dubuque, IA Ph: Fax: Unison Solutions, Inc. WARRANTY STATEMENT
94 Biomethane System (Large)


95 CDM Seattle, WA Quotation No.: BIOGAS UPGRADING PLANT 5, 2009 PURE INNOVATIONS QuestAir Technologies Inc. is an ISO9001 Registered Company QuestAir Technologies Inc Russell Ave. Phone (604) Burnaby Fax (604) British Columbia V5J 4R8 CANADA Copyright QuestAir Technologies Inc All rights reserved. No part of this document may be reproduced, stored in a retrieval system, or transmitted in any other form or by any means, electronic, mechanical, photocopying, recording, or otherwise, without the prior written permission of QuestAir Technologies Inc., Burnaby, British Columbia, Canada. QuestAir is a trademark of QuestAir Technologies Inc.
96 BIOGAS UPGRADING PLANT October 5, 2009 Attn: Cale McPherson CDM rd Avenue, Suite 1100 Seattle, WA Phone: (206) RE: Budgetary Proposal to Upgrade Waste Biogas Hi Cale, Thank you for your intere st in Que stair s bio gas pu rification te chnology. At the pro cess condition s provided, we are pleased to provide you with ou r budgetary level estimates of unin stalled capital and operating ex penditures fo r a bio gas u pgrading system for the t hree fe ed flo w rate s p rovided. A summary of the capital and annual operating expenditures are as follows: Case 1 (45 SCFM) CAPEX: $ 670,000 USD OPEX/yr: $ 42,000 USD The biogas upgrading system includes the following major equipment: Pretreatm ent Siloxane removal process PSA feed compressor(s) to 150 psig Post compressor treatment Ques tair PSA(s) The PSA exhaust blower to achieve 83% overall CH4 recovery The advantages of our Anaerobic Digester Biogas Upgrading System are: Low Annual Operating Expenditure Minimal operating power requirement needed, offering l ess installe d capital and le ss mai ntenance expenditure fo r utility-based equipment. Small Footprint Re quirement T he Bioga s Purification S ystem is ex tremely compact using modular skid-mount equipment. The core pro cess utilizes QuestAir s proprietary fas t-cycle PSA Te chnology that allows ves sel sizes to be 5-15 times smaller than conventional PSA. As a result, the compact design allows efficient use of space to meet layout restrictions or constraints. Robust Operation and Availability QuestAir s proprietary PSA rotary valve requires an overhaul service once every 5 years (with an inspection once every 2.5 years). The high reliability of the PSA system (with prov en >99% availability) provides continuous operation with minimum downtime for maintenance requirements. Ease of O peration & Installa tion The Biog as Purifi cation System employs QuestAir s propriety fast-cycle rota ry valves technology, which eli minates the need for complex PL C alg orithms and p rogramming. Tu rndown conditi ons can be easily controlled and process upsets can be quickly resolved with rotary valve c ycle s peed adjustments. Fas t-cycle PSA tec hnology al lows the plant t o reac h steady s tate conditions muc h fas ter than conventional PSAs, thereby allowing you to maximiz e performance with changing process parameters. QuestAir Technologies Inc. QB Business Confidential -1-10/02/2009
97 BIOGAS UPGRADING PLANT We are pleased to submit our feasibility study in the following format: Section 1: Technical Components Section 2: Financial Analysis The biogas upgrading system performance specs shown below (Section 1.1 ) are estimates based on past experience and testing at similar conditions. We trust that we have interpreted your requirements correctly. Yours sincerely, Sean Mezei Manager, Global Sales Mojgan Kavoosi Sales Engineer QuestAir Technologies Inc. QB Business Confidential -2-10/02/2009
98 BIOGAS UPGRADING PLANT TABLE OF CONTENTS SECTION 1: TECHNICAL COMPONENTS 1.0 Introduction 1.1 Design Basis 1.2 Process Description 1.3 Process Flow Diagram 1.4 Major Equipment List 1.5 Scope of Work 1.6 Purchaser Scope of Supply SECTION 2: FINANCIAL ANALYSIS 2.1 Capital Expenditure 2.2 Operating Expenditure 2.3 Credit Terms 2.4 Terms of Payment 2.5 Conditions of Contract QuestAir Technologies Inc. QB Business Confidential -3-10/02/2009
99 BIOGAS UPGRADING PLANT 1.0 INTRODUCTION This b udgetary prop osal i s for the e ngineering, p rocurement, and fabri cation of a turn key Biogas Upgrading Plant using QuestAir s proprietary fast-cycle pressure swing adsorption ( PSA ) technology. Waste biogas undergoes a recovery processing procedure which includes pressurization and drying, pre-treatment, carbon dioxide removal, and pressurization. The final product produced from upgrading biogas is known as biomethane. Biomethane can be injected into local natu ral gas pipeline grids for residential and commercial uses. Mo re simply, biomethane can also be redirect into the ov erall plant process for combined heat and power usage. The plant s control sy stem allows sim ple ope ration and prod uction rate cha nges from a n operator interface terminal. Biomethane p roduct con ditions, fl ow, purity, utility consu mption, items of supply, and services to be performed by QuestAir are further defined in this proposal. About QuestAir M-3200/M-3100 PSA Technology QuestAir s M-3200/M-3100 purifies methane-containing gas streams to high purity methane, suitable for suppl ementing existing natural gas supplies. T he M-3200/M optimized PSA process and proprietary rotary valve technology deliver higher efficiency than conventional PSA systems in a more compact, cost effective package. About QuestAir Technologies Inc. QuestAir Te chnologies, In c. is a devel oper a nd su pplier of p roprietary gas purification systems for several large international markets, in cluding existing markets such as oil refining, biogas production and natural gas processing, and emerging markets such as fuel cell power plants and fuel cell vehicle refueling stations. QuestAir is based in Burnaby, British Columbia and its shares trade on the Toronto Stock Exchange under the symbol QAR. QuestAir Technologies Inc. QB Business Confidential -4-10/02/2009
100 BIOGAS UPGRADING PLANT 1.1 DESIG N BASIS Stated performance is based on the Purchaser providing the stated nominal feed gas composition with deviations of not more than ±2.5% relative change. Tables represent the mass balance for the major component of the PSA system. Case 1: SCFM Feed Flow S T R E A M KG/H - MOL% F L O W S 1 TOTAL FEED 2 TOTAL PRODUCT 3 TOTAL EXHAUST PROCESS STREAM PROCESS CONDITIONS PHYSICAL PROPERTIES STREAM COMPOSITION METHANE CH % % % CARBON DIOXIDE CO % % % NITROGEN N % % % OXYGEN O % % HYDROGEN SULFITE H2S 34.0 <50 ppm WATER H2O 18.0 Saturated TOTAL FLOW RATE NOMINAL KG/H SCFM NCMH C TEMPERATURE PRESSURE DENSITY VISCOSITY MOLECULAR WEIGHT NOMINAL MW F kpa(a) maximum NOMINAL BARG maximum PSIG KG/ACM LB/CFT cp G/MOL maximum PROCESS PERFORMANCE Methane Recovery: Nominal Product Flow: Expected 83% 37 NCMH Plant Turndown: 100% to 30% of nominal production Capacity PROCESS CONDITIONS a. Exhaust & Product Temperatures: ±10 o C from Feed Temperature expected but highly dependant on ambient Temperature. b. Water: Design basis of 100% relative humidity (RH) with zero liquid water in feed gas to the PSA. c. Flow units of NCMH are at 0 C and KPa(a). Flow units of SCFM are at 15.6 C and 14.7 PSIA. d. Zero particulate matter over 0.5 micron in size in feed stream. QuestAir Technologies Inc. QB Business Confidential -5-10/02/2009
101 BIOGAS UPGRADING PLANT 1.2 PROCESS DESCRIPTION Pretreatment System (Module 1) consists of the equipment re quired to boo st pressure, pre-cool, remove water, and filte r the biogas. The module starts with the customers plant boundary biogas tie in flange and ends with first flange to Module 03. Feed Ga s Compressio n System (Module 3) consists of the eq uipment required to comp ress, lubricate the compressor, separate oil from the gas, cool the gas, and cool the oil. This module will consist of a screw compressor. The module starts with the first flange from Module 01 and ends with the first flange to Module 04. Post Fee d G as Compression Treatme nt System (M odule 4) removes condensate, oil, a nd any particulate m atter from the feed gas after comp ression. This module al so contains sacrificial media for removal of silo xanes. Th e module starts with the la st flange fro m Module 03 and ends with the first flange of Module 06. First Stage PSA System (Module 6) consists of a PSA to remov e CO2 from the feed gas. The module includes a product surge tank, and all controls for the PSA. The module starts with the first flange from Module 04 and ends with first flange to Module 08. Exhaust Blower (Module 8) includes the exhaust blowers required for regenerating the PSA skids. This mo dule s sta rts with the first flange from m odules 06 an d end s with the cu stomer plant boundary tie in flange (if selected). QuestAir Technologies Inc. QB Business Confidential -6-10/02/2009
102 BIOGAS UPGRADING PLANT 1.3 PROCESS FLOW DIAGRAM QuestAir Technologies Inc. QB Business Confidential -7-10/02/2009
103 BIOGAS UPGRADING PLANT 1.4 EQUIPMENT LIST EQUIPMENT MODULE COMPONENTS PRETREATMENT SYSTEM MODULE 1 Inlet Process Gas Coalescer/Scrubber Inlet Process Gas Filter Inlet Process Air Cooler Inlet Feed Gas Knockout Drum Oxygen Analyzer FEED COMPRESSOR(S) MODULE 3 Compressor After Cooler Compressor Motor Compressor Heater Elements Compressor Oil Cooler Compressor Oil Filter Compressor Oil Pump Compressor Oil Strainer Compressor Compressor Package Compressor NEMA 12 Starter Compressor Suction Strainer Oil Separator POST-COMPRESSOR TREATMENT MODULE 4 Dryer Beds Package Unit Dryer Coalescing Filter Dryer Particulate After Filter Process Gas Coalescer/Scrubber Process Gas Filter Siloxane Removal Beds Siloxane Removal Media Bed Septa Post Bed Particulate Filter PSA SYSTEM MODULE 6 QuestAir PSA Product Gas CO2 Analyzer EXHAUST BLOWER(S) MODULE 8 First Stage Exhaust Vacuum Blower Vacuum Pump Air Oil Cooler Vacuum Pump Coolant Pump Vacuum Pump Coolant Tank Vacuum Blower Motor First Stage NEMA 12 Starter INSTRUMENT AIR PACKAGE -- Instrument Air Coalescing Filter Instrument Air Compressor Instrument Air Compressor Air Filter Instrument Air Compressor Oil Filter Instrument Air Compressor Package Instrument Air Compressor Receiver Tank Instrument Air Dryer Instrument Air Particulate Filter Methane Gas Detector QuestAir Technologies Inc. QB Business Confidential -8-10/02/2009
104 BIOGAS UPGRADING PLANT 1.5 SCOPE OF WORK Project Engineering - Process Eng ineering, Mech anical & Stru ctural/civil En gineering, El ectrical & Controls Design Process Engineering 1. Process Model Development / Process Flow Diagrams (Heat & Mass Balances) 2. Piping & Instrumentation Diagrams 3. Equipment List / Instrument Lists 4. Equipment / Instrument Specification Sheets 5. Battery Limit and Tie-In Point Lists 6. Emission / Utility Flow Schemes & List 7. Line Sizing and Line List 8. Maintenance Schedule 9. Hazard & Operability Studies & Reviews 10. Mechanical & Vendor Data Book (1 Electronic Copy)* 11. Operating & Maintenance Manual (1 Electronic Copy)* *NOTE: Additional Copies Can Be Provided as Options. Mechanical Engineering 1. General and Skid Arrangement Drawings 2. Above Ground Interconnecting Piping Isometric Drawings 3. Piping Detail Design Calculations & Insulation Details (if Required) 4. Pipe Supports 5. Specification and Design for any Expansion Joints, Flexible Hoses, Spring Supports, etc. 6. Strength Calculations per ASME 7. Mechanical Calculations and Approvals to Meet Local Government/Design Codes (Limited) Structural/Civil Engineering 1. Plant Foundation Plot Plan and Equipment Arrangement 2. Plant Equipment/Skid Loading Data and Diagrams Electrical Engineering 1. Electrical Single Line Diagrams for Power Distribution 2. Electrical Schematic Wiring Diagrams 3. Electrical Design Drawings Aboveground Conduit/Cable Trays Wire, Cable, Conduit, & Cable Tray sizing 5. Plant Cable Schedule for PSA 6. Plant Interconnecting Wiring Diagrams 7. Instrument Termination & Hook-Up Details 8. Terminal Block Diagrams & Hook-Up Details Controls Design 1. Instrument & Panel Cabinet Layout 2. Instrument Loop Diagrams 3. Instrument Physical Detail Drawings Mounting and Support Instrument Location Instrument Data Sheets 4. Power Requirements for Local Panels 5. Alarms, Trips, and Interlock Lists QuestAir Technologies Inc. QB Business Confidential -9-10/02/2009
105 BIOGAS UPGRADING PLANT Procurement & Fabrication Fabrication a nd/or Procur ement, han dling, and sh ipping of all required eq uipments. C ompleted mo dule skids th at i nclude all inter connecting piping, electric al w iring, instruments, valves, and I/O panels. Equipment Fabrication 1. Fabricate/Procure Equipment 2. Fabricate Piping 3. Initial Charges of All Catalysts and Adsorbents 4. Initial Charge of Lubricants Instrumentation Equipment 1. Procure All Instrumentation 2. Procure All Control, Safety, and Relief Valves 3. Procure All Required Material (for Instrument Installation) 4. Plant Instrument Wiring to Junction Boxes/Panels Electrical Equipment 1. Procure All Equipment Motors/ Drivers 2. Procure & Fabricate Local Control Stations 3. Plant Emergency Shutdown Buttons QuestAir Technologies Inc. QB Business Confidential /02/2009
106 BIOGAS UPGRADING PLANT 1.6. PURCHASER SCOPE OF SUPPLY PURCHASER SCOPE OF SUPPLY GENERAL Construction (site, foundation, and facilities) Installation (civil, electrical & mechanical work for site & facilities) Concrete foundation as required. Area classification electrical drawings Electrical drawings physical drawings, mounting details and location drawings) MCC design and system load calculation requirements Electrical calculations and approvals to meet local government/design codes Control design (PLC/DCS specifications, software configuration & graphics, analyzer specifications, control philosophy & control logics diagrams) Wiring from primary instruments & junction boxes to control panel Procure breakers, motor starters, and transformers Procure isolation transformer for control power Pay all taxes, fees, duties, or any other costs of a similar nature. Provide an accessible, level site for the plant installation, free of underground and above ground obstructions. Provide engineering, permits, construction and installation for the facility (site). Provide power and other utilities. Provide chemicals and lubricants as required. Provide operator and maintenance personnel for training during the commissioning, start-up, and operating phase of the project. Provide piping to tie in feed gas, product gas, exhaust gas, condensate, and safety relief valves. Disposal or collection of all waste streams (exhaust, condensate, etc.). Any faculty design support and reviews Any site evaluation, process hazard studies, risk assessment studies (e.g. HAZOP) TESTING Pressure testing of connected system. Correct connection of electrical components. Control System and I/O checkouts for facility I/O. Correct programming of control logics (supplied by QuestAir) including fail-safe protection trip. ADMINISTRATIVE Project Development (project management, local and design code requirement assessment, risk mitigation and planning, certification planning & compliance) Training program development** Permits, licenses and approvals. Fire protection systems. Any item not detailed in this document. Cons umables. ** Available for additional cost QuestAir Technologies Inc. QB Business Confidential /02/2009
107 BIOGAS UPGRADING PLANT SECTION 2: FINANCIAL ANALYSIS 2.1 CAPITAL EXPENDITURE SCOPE OF SUPPLY & EXPENDITURE Major Equipment Module 1 (Pretreatment) Module 3 (Feed gas Compression) Module 4 (Post Feed Gas Compression) Module 6 (First Stage PSA System) Module 8 (Exhaust Blower) Instrument Air Controls Includ PRICE ($ USD) Included Included Included Included Included Included ed Comments Engineering Major Equipment Subtotal: $500,000 Engineering (Process, Mechanical, Structural & Electrical) Procurement & Fabrication Project Development & Management Facilities Engineering Included Included By Purchaser By Purchaser Engineering Subtotal: $170,000 Construction, Installation, Commission, Start Up & Testing Installation Construction Commission, Start Up & Testing By Purchaser By Purchaser Price to be Determined at Firm Proposal Stage TOTAL UNINSTALLED CAPITAL EXPENDITURE: $670,000 QuestAir Technologies Inc. QB Business Confidential /02/2009
108 BIOGAS UPGRADING PLANT Documentation Operating & Maintenance Manual Mechanical & Vendor Data Book Freight & Transportation One Electronic Copy in English Additional Electronic Copies Printed Copies One Electronic Copy in English Additional Electronic Copies Printed Copies Delivery Time after receipt of first milestone payment Freight (Covered transport required) of all major equipment skids Load and T ransport from Design ated Pick-u p Locati on to S ite. Crated Packaging Provided by QuestAir. Insurance Included $300 ea. $1,000 ea. Included $300 ea. $1,000 ea months Ex-works Standard US Locations By Purchaser Taxes and duties are extra. This proposal is valid for a period of one (1) month. The systems will be ready to ship at the proposed delivery time above. Although every effort is ma de at t he q uotation stag e to i nclude the m ost acceptable materials an d latest designs for our products, QuestAir reserves the right to alter, modify, or change these systems as necessary to conform to its latest designs at the time of order. Any changes will be conveyed to the Purchaser. Should the Purch aser requir e an y modification, a lteration, or chan ge, sup plier reserves the right to adj ust the proposal prices or deliveries accordingly. QuestAir Technologies Inc. QB Business Confidential /02/2009
109 BIOGAS UPGRADING PLANT 2.2 OPERATING EXPENDITURE Statement of Operating Cost/Year (all numbers stated in $USD) Major Operating Expenditure per Year* Case 1 (37 NCMH) Feed Compressor(s) Power $ 24,000 PSA System(s) - Power $ 3,000 First Stage Vacuum Compressor - Power $ 8,000 Sulfur Pretreatment Media General Utilities Maintenance (Labour & Parts) Included Included Included TOTAL OPERATING EXPENDITURE/YR: $ 42,000 **Electricity cost assumed to be $0.05D/kWh NOTES: 1) The accuracy of the cost estimates stated above are +/-25% and valid for one (1) month from the date stated above. QuestAir Technologies Inc. QB Business Confidential /02/2009
110 BIOGAS UPGRADING PLANT 2.3 CREDIT TERMS Credit is approved for Purchaser to the Terms of Payment (Section 2.4), subject to ongoing review. 2.4 TERMS OF PAYMENT Payment Schedule: Payment Due: 15% (fifteen): due with order 40% (forty): due with equipment order 20% (twenty): due upon plant engineering being completed 20% (twenty): on readi ness to shi p (i nspection at Q uestair at Pu rchaser s option) 5% (five) of equipment price: after plant turn-over o r 90 days after shi pping whi chever occurs first (from Factory) Commissioning price: billed separately after service is rendered Payment Details: Late payment charges are 2% per month. All payments are to be considered non-refundable deposits. In the event that payment is not received within 30 days of the above terms, QuestAir has the option to terminate this Agreement. Customer is responsible for any storage fees if shipping is delay greater than 10 business days unless agreed to upon by all parties. 2.5 CONDITIONS OF CONTRACT Conditions Any purchase order issued by Purcha ser in respect of this Proposal will be subject to acceptance by QuestAir and the terms and conditions of this Proposal, and, in the event of any inconsistency between this Proposal and the pu rchase order, this Proposal will govern unless QuestAir expressly consents in writing to a term of the p urchase order overriding this Proposal. If any purchase ord er introduces a term or condition not cove red by thi s P roposal, the n su ch term o r co ndition shall not bin d QuestAir unless QuestAir expressly consents in writing to such term or condition Standard Conditions: QuestAir Technologies General Terms and Conditions of Sale shall apply where not specified in this proposal. QuestAir Technologies Inc. QB Business Confidential /02/2009
111 CNG Fueling System
112 Bid Number A FUELING STATION PROPOSAL 03/02/09 1. ANGI NG50E Compressor $ 64,900 each 50 scfm Flow 9 psig Inlet Pressure (24GGE/hr) 4500 psig Discharge 40 Bhp, 208VAC, 1800 rpm Motor ANGI Control System Weather-Proof Enclosure On-skid Motor Starters and Control Transformer Field Connection (Site Materials) 2a. Xebec Dryer, Model STR18NGX-Autodew or Equal $ 40,289 Stock Model Regen Single Tower 2b. Xebec Dryer, Model STV18NGX-Autodew or Equal $ 14,257 Stock Model Basic Single Tower 3. ANGI Series II Dispenser, each $ 29,500 each Dual Hose, 3/8 x12 Long NGV 1 Type II Nozzles or Equal (1) LCD Display with Backlight per Hose White Powder Coated Steel Enclosure & Steel Pit Frame Approved for Weights and Measures 4. 3-Pack Storage Assembly, 36,000 5,000 psig $ 115, Fuel Management System, EJ Ward RT System $ 13,768 Magnetic Swipe Cards, Qty 100 Optional Credit Card Access, Printer, and Server Software $ 8, Pneumatic Priority Panel with ESD (manual set points) $ 9, ANGI Hose Post Assembly, each $ 3,785 each Dual Hose Manual Isolation Valve and Pressure Gauge NGV1 Type II Nozzles With 3-Way Swagelok Ball Valve 1/4" Twin Synflex CNG Hose x 16 Long With Snap-Tite Inline Breakaways Heavy Duty Hose Retractor Rigid 2 Steel Post With Exhaust Rain Cap and Steel Base Weldment 8. Pneumatic Time Fill Panel with Buffer Bottle $ 5, Site ESD Valve & (3) Site ESD Pushbuttons $ 2, Start-up and Training (one tech, two days on site) $ 7, Shipping to WA $ 8,250 Optional Items: 1. Upgrade compressor to 50 hp motor $ 2,800 each 75 scfm Flow 13 psig Inlet Pressure (36GGE/hr) Terms: Valid for 45 days. Prices do not include any applicable taxes. This quotation serves in conjunction with ANGI's standard terms, conditions, and warranty. This quotation does not include any civil work, installation, underground piping, site electrical, permitting, bonding, or site design; equipment listed above only.
113 Bid Number A DOMESTIC TERMS, CONDITIONS, AND WARRANTY ANGI agrees to sell to Purchaser equipment described and listed in the Proposal (hereinafter "equipment," "goods" and/or services ) subject to the following terms and conditions. 1. PAYMENT. Purchaser shall pay to ANGI 30% of the total purchase price as a down payment with written purchase order, 30% of the total purchase price upon notice of the commencement of assembly, 30% of the total purchase price upon notice of the completion of testing, and 10% of the total purchase price net-60 days from the date of shipment or place of title transfer. All shipments shall be F.O.B. origination. All sums not paid when due shall bear interest at 1-1/2% per month (or the highest applicable legal rate) until paid, and further, in case this matter shall be turned over for collection, or same has to be collected upon demand of an attorney, the Purchaser agrees to pay reasonable attorney's fees and other costs of collection. 2. TAXES. The price does not include any present or future Federal, State, or local property, license, privilege, sales, use, excise, gross receipts or other like taxes or assessments which may be applicable to, measured by, imposed upon or result from this transaction or any services performed in connection therewith. Such taxes may be itemized separately to Purchaser, who shall make prompt payment to ANGI. ANGI will accept a valid exemption certificate from Purchaser, if applicable. If such exemption certificate is not recognized by the governmental taxing authority involved, Purchaser agrees to promptly reimburse ANGI for any taxes covered by such exemption certificate which ANGI is required to pay. 3. DOCUMENTATION. ANGI shall provide Purchaser with the data documentation which is specifically identified in the quotation. Additional copies of data documentation or requests for unique data documentation that will cause ANGI additional expense will be made available to Purchaser at additional cost. 4. ORDER CHANGES. Order changes made after ANGI's acceptance of the order will be requoted and submitted to Purchaser for approval. Purchaser's changes that affect the specifications or configurations of the goods or otherwise affect the scope of the order shall be submitted, in writing, by Purchaser and shall become binding only if approved, in writing, by ANGI. All charges and shipping delays resulting from such changes shall be solely determined by ANGI and shall be binding upon Purchaser. 5. WARRANTY. ANGI hereby warrants that the equipment delivered hereunder shall be free of defects in material and workmanship appearing within ONE YEAR from the date the equipment is placed into service or eighteen months from availability to ship; whichever comes first. Purchaser must give written notice of any defect covered by this warranty to ANGI within eighteen (18) months of availability to ship. For any defect covered by this warranty, ANGI shall repair or replace the equipment. Repairs or replacement parts are warranted for 90 days from the date that the repaired or replaced products are shipped from the factory or until termination of the original warranty, whichever is longer. This warranty does not cover labor costs and other contingent expenses for the diagnosis of defects or for removal and reinstallation of the equipment. Such repair or replacement shall be Purchaser's exclusive remedy for breach of this Agreement or negligence.
114 Bid Number A This warranty does not extend to any equipment which has been (a) subject to misuse, neglect, accidents, Acts of God, or causes of a similar nature; (b) repaired or altered by anyone other than ANGI, without ANGI's prior approval; (c) improperly installed by anyone other than ANGI or someone under its direction or (d) to consumable parts or materials such as filter elements, seals, belts, fuses, and overload. This warranty does not extend to components such as motors and drive engines that are separately covered by a warranty issued by their respective manufacturers. This warranty is in lieu of all other warranties expressed or implied. EXCEPT TO THE EXTENT PROHIBITED BY APPLICABLE LAW, THIS IS THE ONLY WARRANTY GIVEN FOR THE SALE OF PRODUCTS OR SERVICES. NO WARRANTIES OF MERCHANTABILITY AND FITNESS FOR PARTICULAR PURPOSE SHALL APPLY. IN NO EVENT WILL ANGI BE LIABLE FOR CONSEQUENTIAL OR INCIDENTAL DAMAGES RESULTING FROM THE PURCHASE OR USE OF ANGI PRODUCTS, OR RESULTING FROM ANY DELAYS OR FAILURE OF PERFORMANCE OF ANGI UNDER ANY AGREEMENT, OR RESULTING FROM ANY SERVICES FURNISHED BY ANGI. This warranty may not be modified, amended, or otherwise changed except by a written document properly executed by ANGI. For warranty issues contact: Customer Service ANGI International, LLC. 15 Plumb Street Milton, WI, USA Phone: Fax: service@angiinternational.com Web site: 6. TECHNICAL ASSISTANCE. ANGI shall provide technical manuals, drawings and/or instructional materials with the equipment purchased hereunder. Unless the sale is of equipment only, ANGI shall provide the services of such number of technicians as may in its sole discretion be required to assist in start-up and in training of Purchaser's employees in installation, operation, and maintenance of the equipment purchased hereunder. Such technicians shall be provided on an advisory basis only. Purchaser acknowledges that the technical materials supplied are proprietary to ANGI and that the goods manufactured by ANGI are based upon patents, trade secrets, confidential and proprietary information developed by, and the exclusive property of, ANGI and its affiliates. Purchaser agrees (i) not to grant access to third parties for inspection, measurement, disassembly or other activities conducted with an intent or purpose to assist in the manufacture of similar products, and (ii) restrict access to service manuals and drawings to those with a legitimated need for such access.
115 Bid Number A 7. PURCHASER'S DUTIES FOR EQUIPMENT. Purchaser shall within thirty (30) days after the shipping date of the goods have the facilities, including all necessary mechanical and/or electrical supply hook-ups, completed in accordance with all applicable governmental codes, regulations, and ordinances so as to permit start-up of the refueling equipment. All charges and delays resulting from failure to comply shall be solely determined by ANGI and shall be binding upon Purchaser. The Purchaser shall also be responsible for providing a telephone line to each compressor controls system, prior to startup of the equipment. 8. CANCELLATION BY PURCHASER. Subject to compliance with this section, Purchaser may suspend or terminate all or any part of this order at any time for its sole convenience by written notice to ANGI. Upon termination pursuant to this Article, an equitable adjustment and payment shall be made by agreement between Purchaser and ANGI for the reasonable value of the work invested prior to termination. This equitable adjustment shall include amounts compensating ANGI for its actual cost of labor and materials, and for reasonable overhead and profit. 9. TIME OF PERFORMANCE. Shipping dates are approximate and are based on prompt receipt by ANGI of all necessary information from Purchaser. 10. CONTINGENCIES. ANGI shall not be responsible for any failure to perform due to causes beyond its control. These causes shall include but not be restricted to fire, storm, flood, earthquake, explosion, accidents, acts of the public enemy, war, rebellion, insurrection, sabotage, epidemic quarantine restrictions, labor disputes, labor shortages, transportation embargoes, failure or delays in transportation, inability to secure raw materials or machinery for the manufacture of the goods, acts of God, acts of the Federal Government, or any agency thereof, acts of any state or local government or any agency thereof, and judicial action. Similar causes shall excuse Purchaser for failure to take goods ordered by Purchaser, other than those already in transit or specially fabricated and not readily salable to other buyers. 11. LAW. The validity, performance, and construction of these terms and conditions and any sale made hereunder shall be governed by the laws of the State of Wisconsin, USA without regard to its conflicts of law. 12. ASSIGNS. Any contract made hereunder shall be binding upon and inure to the benefit of the successors and assigns of the entire business and good will of either ANGI or Purchaser or of that part of the business of either used in the performance of such contract, but shall not be otherwise assignable.

116 QUALITY MANAGEMENT CERTIFICATE Bid Number A
117
118

119
120
121
122
123
124
125
126
127 Biomethane System (Small)
128 CDM Seattle, WA USA M-3300 PROTOTYPE METHANE PURIFICATION PSA SYSTEM Quotation No.: QB081670A May 15, 2009 QuestAir Technologies Inc. is an ISO9001 Registered Company QuestAir Document Number: Revision: 0 Date of Issue: November 2006 QuestAir Technologies Inc Russell Ave. Phone (604) Burnaby Fax (604) British Columbia V5J 4R8 CANADA Copyright QuestAir Technologies Inc All rights reserved. No part of this document may be reproduced, stored in a retrieval system, or transmitted in any other form or by any means, electronic, mechanical, photocopying, recording, or otherwise, without the prior written permission of QuestAir Technologies Inc., Burnaby, British Columbia, Canada. QuestAir is a trademark of QuestAir Technologies Inc.
129 M-3300 METHANE PURIFICATION PSA SYSTEM May 15, 2009 Attn: Pat Evans rd Avenue, Suite 1100 Seattle, WA Tel: (206) Fax: (206) QuestAir Quotation Number: QB081670A RE: BUDGET PROPOSAL FOR QUESTAIR M-3300 PROTOTYPE PSA UNIT Dear Pat, We thank you for your interest in QuestAir s PSA technology. At the process conditions provided, we are pleased to propose a QuestAir M-3300 prototype at a price of $65,000 USD. We are pleased to submit our budgetary proposal in the following format: Section 1: System Components Section 2: Financial Proposal Section 3: General Terms and Conditions of Sale The unique advantages of the QuestAir M-3300 system are: 1. QuestAir s Patented Rotary Valve Design produces the most compact PSA purifiers (5-15 times smaller than conventional PSA s). 2. The Fully Assembled & Tested PSA Module requires no field assembly and comes loaded with adsorbent. 3. Proven Reliable Rotary Valve technology has a long life and requires minimal maintenance. 4. High-Efficiency Process using QuestAir s PSA cycle reduces operating costs. 5. Adjustable Cycle Speed with Simple Control maximizes performance with changing process parameters. QuestAir M-3300 performance specs shown below (Section 1.1) are estimates based on past experience and testing at similar conditions. We trust that we have interpreted your requirements correctly. Yours sincerely, Nelson Chan Sales Manager QuestAir Technologies Inc. QB081670A Business Confidential -1-15/05/2009
130 M-3300 METHANE PURIFICATION PSA SYSTEM SECTION 1: SYSTEM COMPONENTS 1.1 DESIGN BASIS Stated performance is based on the Purchaser providing the stated nominal feed gas composition with deviations of not more than 2.5% relative change, and provided the stated maximum exhaust pressure is not exceeded: PROCESS STREAM PROCESS CONDITIONS PHYSICAL PROPERTIES S T R E A M F L O W S KG/H - MOL% TOTAL FEED STREAM COMPOSITION MW TOTAL PRODUCT TOTAL EXHAUST METHANE CH % % % CARBON DIOXIDE CO % % % WATER H2O 18.0 SATURATED % % % TOTAL FLOW RATE NOMINAL KG/H SCFM ACFM NCMH ACMH TEMPERATURE NOMINAL C F kpa(a) maximum PRESSURE NOMINAL BARG maximum PSIG maximum DENSITY KG/ACM LB/CFT VISCOSITY cp MOLECULAR WEIGHT G/MOL PROCESS PERFORMANCE Methane Recovery: Nominal Product Flow: Overall Pressure Drop: Expected 75% 7.3 NCMH 10 PSID PROCESS CONDITIONS a. Exhaust & Product Temperatures: ±10 o C from Feed Temperature expected but highly dependant on ambient Temperature. b. Water: Design basis of 100% relative humidity (RH) with zero liquid water in feed gas to the PSA. c. Flow units of NCMH are at 0 C and KPa(a). Flow units of SCFM are at 15.6 C and 14.7 PSIA. d. Zero particulate matter over 0.5 micron in size in the feed stream. QuestAir Technologies Inc. QB081670A Business Confidential -2-15/05/2009
131 M-3300 METHANE PURIFICATION PSA SYSTEM 1.2 STANDARD FEATURES & SPECIFICATIONS STANDARD FEATURES & SPECIFICATIONS FEATURES 1. Patent-Protected, Rotary Valve Design for Robust & Reliable Operation 2. Compact & Modular Design with Pre-loaded Adsorbents for Quick & Simple Installations in Space-Restricted Layouts 3. Stainless Steels, Electro-plated Metals, and Powder-Coating used throughout the PSA for Inhibiting Corrosion 4. Efficient Design Using QuestAir s Advanced Nine-Bed PSA Cycle with Triple Equalizations 5. Single Input Cycle Speed Controls Product Flow and Purity 6. Minimal Start-Up Time to Full Load Conditions MECHANCIAL Maximum Operating Pressure: System Design Pressure (MAWP): System Test Pressure: Internal Relief Set Pressure: Casing Max. Operating Pressure: Casing Relief Set Pressure: 1.2 MPaG (175 psig) 1.6 MPaG (235 psig) 1.4 MPaG (200 psig) 1.6 MPaG (235 psig) 0.07 MPaG (10 psig) 0.1 MPaG (14.9 psig) MINIMUM MAXIMUM Operating Ambient Temperature: 4 C (40 F) 48 C (118 F) Process Operating Temperature: 4 C (40 F) 60 C (140 F) Control Panel Operating Temperature: -10 C (14 F) 50 C (122 F) Storage Temperature: -20 C (-4 F) 48 C (118 F) ELECTRICAL PROTECTION RATING ELECTRICAL POWER SUPPLY Variable Speed Drive (VSD) 380 VAC / 10A / 60 Hz or -- located in Control Panel* (CP1): 220 VAC / 10A / 50 Hz UL Certified Motor: Non-Sparking (AEX-nA) Power supply from CP1 Proximity Switch: Intrinsically Safe (AEX-ia) Power supply from customer s IS barrier through JB1 Junction Box JB2 Flameproof (AEX-d) 24 VDC (loop-power) & 220 VAC/50 Hz from Customer *CP1 to be installed in a non-classified area. DESIGN CODES & SPECIFICATIONS Class 1, Division 2, Group D, T3 as per National Electrical UL Hazardous Area Classification: Code (NEC); Class 1, Zone 2, Group IIA, T3 as per International Electrical Code (IEC) Control Panel: Degrees of Protection by Enclosure (IEC 60529) Power Consumption: 2 Amps (10 Amps max.) Adsorbent Beds: Cyclic calculation to QuestAir Standard Engineering Practice; internally contained and relieved Piping: Tubing and Swagelok connections International Building Code (IBC) 2003; Sec Seismic: Seismic Factors: 1.5G lateral and 3.0 G vertical QuestAir Technologies Inc. QB081670A Business Confidential -3-15/05/2009
132 M-3300 METHANE PURIFICATION PSA SYSTEM STANDARD FEATURES & SPECIFICATIONS (cont.) CERTIFICATIONS UL/cUL Listed Industrial Control Panel: UL Certified Electrical Components: GENERAL ARRANGEMENT Plot Plan: Required Foundation: Adsorbent Beds Quantity: 9 Bed Diameter: 3 Inches UL File: E234283; Project: 03CA03717; Date ; Type L Certification North American Model Only 0.76m x 0.91m x 2.24m high (2.5 x 3.0 x 7.33 high) Concrete pad or level structural steel and vertical support for fixing the top bracket, to be provided by Purchaser Weight: 1020 lbs (463 kgs). Connection Size/Type Feed: 1/2 inch Tubing. Exhaust: 3/4 inch Tubing Product: 1/2 inch Tubing. Vent: 2-1/2 inch NPT Note: All dimensions, weights and sizes shown here are for information purposes only and may vary depending on model capacity and options. Standard general arrangement, instruments, and components are provided for in this proposal. INCLUDED EQUIPMENT Included Equipment: R.O.P. OPTION This package includes all equipment necessary for safe, long-term manually controlled operation of the PSA. No additional customer components are required. Customer is responsible for assembly of all rest of plant items. A detail description of the included equipment and options is given below: QuestAir Technologies Inc. QB081670A Business Confidential -4-15/05/2009
133 M-3300 METHANE PURIFICATION PSA SYSTEM REQUIRED EQUIPMENT STANDARD OPTION R.O.P. OPTION AUTOMATIC CONTROLS OPTION ITEM/DEVICES INCLUDED BY QUESTAIR H-3300 GENERAL One tested, fully assembled PSA module including: (Nine) Factory-filled Adsorbent Beds Motor, Gearbox, and proximity switch Variable Speed Drive (3 x 24 VDC and 1 x 4-20 ma signals) and control panel Feed, Product, Exhaust and Vent Connections (One) Casing Pressure Safety Valve (Nine) Internal Bed Pressure Safety Valves for fire case safety relief Terminal Boxes Base stand Provision for Lifting by Forklift External Casing Low-point manual drain and connection for N 2 Purge DOCUMENTATION Three Electronic Copies of the Installation, Operating, & Maintenance Manual (in English) FEED LINE (ITEMS SHIPPED LOOSE, PIPING BY CUSTOMER) Manual Isolation Valve Explosion-Proof Solenoid Isolation Valve controlled by Purchaser s PLC (PLC Programming approved by QuestAir) Pressure Gauge and Isolation Ball Valve Particulate/Coalescing Filter (0.5 micron) Auto-float Stainless Steel Liquid Drain Trap including 3-way T-Port Isolation Valve PRODUCT LINE (ITEMS SHIPPED LOOSE, PIPING BY CUSTOMER) Manual Isolation Valve (Solenoid Isolation Valve for Automatic Control option) Explosion-Proof Solenoid Isolation Valve controlled by Purchaser s PLC (PLC Programming approved by QuestAir) Pressure Gauge and Isolation Ball Valve Stainless Steel In-Line Spring-Assisted Check Valve Product Direct-Operated Back-Pressure Valve (sized for ~3 PSID of the nominal product pressure (as per section 1.1) before discharge to battery limits) EXHAUST (ITEMS SHIPPED LOOSE, PIPING BY CUSTOMER) Manual Stainless Steel Isolation Ball Valve Pressure Gauge and Isolation Ball Valve Pressure Safety Valve from Casing to Vent Check Valve from Casing to Exhaust QuestAir Technologies Inc. QB081670A Business Confidential -5-15/05/2009
134 M-3300 METHANE PURIFICATION PSA SYSTEM 1.3 MAINTENANCE Prior to delivery, the M-3300 will be pressurized with helium to ensure containment, checked for bed rotation and synchronization, tested for mechanical operation, and tested for other electrical connections. A summary of the recommended spare parts and maintenance intervals are provided below as a general guideline. A detailed inspection and preventive maintenance chart is provided in the Installation, Operation, and Maintenance manual. MAINTENANCE PERIODIC INSPECTION (10 minutes / inspection) Periodic inspection is recommended for preventative maintenance. Motor, gearbox, and valves are inspected for irregular noises, leaks, and obvious degradation of connections (e.g. grounding, electrical, brackets). Coalescing filter is inspected and condensate is drained at various collection points. Inspection intervals will vary from every 2-3 days to weeks depending on the severity of service and environmental conditions. 2.5 YEAR SERVICE (2 day / 2.5 years) 2.5 Year Service of the complete system is recommended for optimal performance tuning and overall system adjustment. Internal components of the rotary bed system are inspected for wear. Instruments and equipment, if applicable, are tested and checked for accuracy. Filter element is replaced as required. All motor, gearbox, and mechanical couplings are lubricated and/or oil changed as required. Recommended 2.5 Year Service is to be done by QuestAir approved personnel. 5 YEAR SERVICE (2 day / 5 years) Various internal components of the rotary bed system are replaced, cleaned, and / or corrected for alignment, including O-rings, seals, screws, stators, etc. The 5-year service is to be done by QuestAir approved personnel only. 1.4 ENVIRONMENTAL ASPECTS The unit will not produce any gaseous or liquid effluent other than the Product and Exhaust gases (and moisture condensate from feed gas in some installations). Solid effluents will consist of used filter cartridges only. The Purchaser is to dispose effluents in satisfactory manner and in compliance with all applicable laws including environmental laws. Purchaser covenants and agrees with QuestAir to indemnify QuestAir against all liabilities, claims, demands, actions, causes of action, damages, losses, costs or expenses (including legal fees and disbursements) suffered or incurred by QuestAir by reason of or arising out of Purchaser s breach of this covenant. QuestAir Technologies Inc. QB081670A Business Confidential -6-15/05/2009
135 M-3300 METHANE PURIFICATION PSA SYSTEM SECTION 2: FINANCIAL PROPOSAL 2.1 PRICE AND COST SCHEDULE QuestAir Scope of Supply & Price: SCOPE OF SUPPLY & PRICE STANDARD FEATURES & SPECIFICATIONS (as defined in Section 1.2) PRICE ($ USD) M-3300 PSA System Included OPTIONS (not included in total price unless stated) NOTES & EXCEPTIONS Rest of Plant (R.O.P.) Option Included Assembly of Custom Option: Feed Compressor Package for 10 SCFM flow to the PSA. Commissioning support for this option is not included and based on daily rate terms as per Section $ R.O.P. components and piping by Three Electronic Copies in English Included CDM Installation, Operating, & Additional Electronic Copies $100 ea. Maintenance Manuals Printed Copies $200 ea. FREIGHT & TRANSPORTION Delivery Time after receipt of first milestone payment Industrial Packaging Freight (Covered transport required) Insurance TOTAL UNIT PRICE: $65, weeks Included Ex-works QuestAir By Purchaser Taxes and duties are extra. Minimum order is 1 unit(s). This proposal is valid for a period of six (6) month. The unit will be ready to ship at the proposed delivery time above, provided the purchaser has approved all QuestAir supplied drawings and equipment by week 4 for custom orders. Although every effort is made at the quotation stage to include the most acceptable materials and latest designs for our products, QuestAir reserves the right to alter, modify, or change these systems as necessary to conform to its latest designs at the time of order. Any changes will be conveyed to the Purchaser. Should the Purchaser require any modification, alteration, or change, supplier reserves the right to adjust the proposal prices or deliveries accordingly. QuestAir Technologies Inc. QB081670A Business Confidential -7-15/05/2009
136 M-3300 METHANE PURIFICATION PSA SYSTEM Product Support: PRODUCT SUPPORT COMMISSIONING BY QUESTAIR $USD 6,000 (travel & expenses billed separately) Length of time estimated for commissioning is 4 days (not including travel time) by a QuestAir Commissioning Engineer. The total time for this service is 6 days including travel. Should the times allowed for the above be exceeded, due to default on the part of the Purchaser or their sub-suppliers, or otherwise outside of QuestAir s control, our normal daily rates apply: $CAD 1,400 per day plus expenses including transport, accommodation and per diem, based on an 8 hour day, 6 day week, Monday to Saturday. SERVICES BY QUESTAIR The daily rate for non-warranty service on the QuestAir M-3300 system is as follows: $CAD 1,400 per day plus expenses including transport, accommodation and per diem, based on an 8 hour day, 6 day week, Monday to Saturday. 2.2 PURCHASER SCOPE OF SUPPLY PURCHASER SCOPE OF SUPPLY EQUIPMENT Level concrete pad for foundation and anchor bolting. Piping and fittings for connection to PSA. PSA exhaust collection system to provide PSA exhaust pressure of Section 1.1. Overpressure protection for feed conditions above design conditions in Section 1.1. Control system interface/signals as required by QuestAir PSA control logic. Provision for gradual feed pressurization used on initial start-up. Utilities Hook up, nitrogen purge (for maintenance) by Purchaser. Electrical Components Housing: Variable Speed Drive (supplied) and disconnect (not supplied) to be installed and housed in the Purchaser s electric control panel or in a nearby non-classified electrical area. Electrical Wiring: Junction box supplied by the Purchaser. The Purchaser is responsible for completion of wiring to main control panel in a manner required by applicable codes. Any connection from control panel to Purchaser PLC, DCS or other. Site preparation, off-loading and installation. Any PSA equipment integration, site evaluation, process hazard studies, risk assessment studies (e.g. FMEA, HAZOP) Interconnecting piping/tubing with R.O.P. or Automatic Controls Options. TESTING Pressure testing of connected system. Correct rotation of motor. Correct connection of electrical components. Control System and I/O checkouts Correct programming of control logics (supplied by QuestAir) including fail-safe protection trip. QuestAir Technologies Inc. QB081670A Business Confidential -8-15/05/2009
137 M-3300 METHANE PURIFICATION PSA SYSTEM PURCHASER SCOPE OF SUPPLY (cont.) ADMINISTRATIVE Permits, licenses and approvals. Fire protection systems. Any item not detailed in this document. Consumables. 2.3 CREDIT TERMS: Credit is approved for Purchaser to the Terms of Payment (Section 2.4), subject to ongoing review. 2.4 TERMS OF PAYMENT Payment Schedule: Payment Due: 40% (forty) of equipment price: due with order 40% (forty) of equipment price: on readiness to ship (inspection at QuestAir at Purchaser s option) 20% (twenty) of equipment price: 30 days after shipping (from QuestAir site) Commissioning price: billed separately after service is rendered Payment Details: Late payment charges are 2% per month. All payments are to be considered non-refundable deposits. In the event that payment is not received within 30 days of the above terms, QuestAir has the option to terminate this Agreement. 2.5 CONDITIONS OF CONTRACT: Conditions Any purchase order issued by Purchaser in respect of this Proposal will be subject to acceptance by QuestAir and the terms and conditions of this Proposal, and, in the event of any inconsistency between this Proposal and the purchase order, this Proposal will govern unless QuestAir expressly consents in writing to a term of the purchase order overriding this Proposal. If any purchase order introduces a term or condition not covered by this Proposal, then such term or condition shall not bind QuestAir unless QuestAir expressly consents in writing to such term or condition Standard Conditions: QuestAir Technologies General Terms and Conditions of Sale shall apply where not specified in this proposal. QuestAir Technologies Inc. QB081670A Business Confidential -9-15/05/2009
138 M-3300 METHANE PURIFICATION PSA SYSTEM SECTION 3: GENERAL TERMS AND CONDITIONS OF SALE Shall constitute a part of QuestAir s standard sale agreement 3.0 Definitions: Goods : All the agreed upon items and associated ancillary equipment that constitutes due fulfillment of this project Supply : To organize, design, manufacture, purchase, expedite, assemble, and test all the Goods F.O.B., at QuestAir s premises, in either fully assembled, partially assembled or fully dismantled form Transport : To organize and provide suitable transport for the delivery of all the Goods from QuestAir s premises to the Purchaser s site Inspection : To witness, by a Purchaser s authorized representative, suitable factory testing at the QuestAir s premises of all Goods Installation : To set out, place in position, line up, and connect up all Goods to other installations or equipment, and to plant services provided, using the Purchaser s installation team Commissioning : To provide a commissioning engineer, or other such suitably qualified person, for the tuning of mechanical and electrical components and putting the Goods in operational mode to allow commercial and/or testing use. 3.1 Prices: Unless otherwise specified by QuestAir, QuestAir s price for the Goods shall remain in effect for two months after the date of QuestAir s quotation or acceptance of the order for the Goods, whichever is delivered first, provided an unconditional, complete authorization for the immediate manufacture and shipment of Goods is received and accepted by QuestAir within such time period. 3.2 Delivery and Documentation: All shipping dates are approximate and are based upon QuestAir s prompt receipt of all necessary information from the Purchaser to properly process the order. Unless otherwise specified by QuestAir, the Purchaser shall pay transportation and handling expenses. Delivery to carrier shall constitute passage of risk of loss to the Purchaser irrespective of arrangements for transportation or insurance charges. 3.3 Shortage: The Purchaser must inspect Goods promptly upon receipt and must submit any claim for shortage within thirty days after receipt or any such claim shall be waived. 3.4 Cancellation by Purchaser: If Purchaser cancels this agreement or refuses delivery of the Goods, the Purchaser shall be liable for and shall pay to QuestAir all expenses incurred or committed to by QuestAir prior to cancellation and QuestAir s profit to the same extent as if the Purchaser had accepted delivery of the finished Goods. 3.5 Force Majeure: QuestAir shall not be liable for delays in performance or for non-performance due to acts of God, war, riot, fire, labour troubles, unavailability of materials, components, or labour, explosion, accident, storm, flood, earthquake, compliance with governmental requests, laws, regulations, orders or actions, or unforeseen circumstances or causes beyond QuestAir s reasonable control. 3.6 Operational and Process Performance Testing Testing will be performed in the following steps: QuestAir Technologies Inc. QB081670A Business Confidential /05/2009
139 M-3300 METHANE PURIFICATION PSA SYSTEM Mechanical Inspection and Operational Test (a) A Mechanical Checkout and Operational Test will be performed on the Goods at QuestAir s factory prior to shipment. (b) No fluids processing will be performed during this step. (c) Purchaser representatives will be invited to see this test. Their travel and living expenses will be at the Purchaser's charge. (d) The test will be deemed successful if QuestAir s Quality Department ensures all components of the Goods are present, properly installed and operational according to the Scope of Supply in Section Process Performance Test (a) A Process Performance Test will be performed at Purchaser s site under QuestAir representative s supervision following Goods installation, systems checkout and start-up to prove achievement of the guaranteed performance criteria. (b) Purchaser will give fifteen (15) days of advance notice to the QuestAir representative of the Process Performance Test starting day. Such test starting date must be within ninety (90) days after delivery of the Goods. QuestAir will send qualified personnel to assist with the test. If the Purchaser fails to make the system available for Process Performance Test with ninety (90) days, the system will be deemed successfully complete and accepted by the Purchaser. The Purchaser will take over the Scope of Supply and the Purchaser will release QuestAir from Process Guarantee. If no process guarantee is provided with the final quotation, then the process acceptance is deemed complete upon start-up. (c) Purchaser must provide all specified utilities and site requirements. Fluids, manpower, energy and analysis will be at Purchaser s charge. Analysis of the gas purity will be performed at a mutually acceptable test facility. Any flow measurement, purity analysis or other equipment required to accurately determine process performance will be at Purchaser s charge. The performance test will be subject to the accuracy limitations of those instruments. The Purchaser will provide calibration certificates and accuracy specifications for the instruments required, to the satisfaction of QuestAir, prior to the Performance Test. (d) A twenty-four (24) hour or shorter mutually agreed test period of continuous operation test will be performed and all operating characteristics will be recorded and presented in report form to Purchaser. This test will be deemed successful if the process guarantee conditions specified in section 1 are met. (e) If conditions exist at the site beyond parties control that prevent the successful performance of the test, parties will mutually agree to a different test schedule. (f) Upon completion of a successful Process Performance Test, both parties will sign a certificate of successful performance of the Process Performance Test; and the Purchaser will take over the Scope of Supply and the Purchaser will release QuestAir from Process Guarantee. (g) In case the Goods fail to reach the guaranteed performance by reasons for which QuestAir is responsible, QuestAir s sole responsibility shall be, at its option either, (i) commence actions to carry out, on a best effort basis, at his own costs and within 1 (one) month after the Process Performance Test or such other time as the parties shall agree to, all remedial works that are necessary to achieve the guaranteed performance in a further Process Performance Test or (ii) refund the purchase price paid by Purchaser. 3.7 Warranty: QuestAir warrants the Goods against defects in workmanship or materials under normal use for six months from date of commissioning or twelve months from date of shipment, whichever is earlier. All replacements or repairs necessitated by inadequate preventive maintenance, or by normal wear and usage, or by fault of the Purchaser, or by unsuitable power sources or by attack or deterioration under unsuitable environmental conditions, or by abuse, accident, alteration, misuse, improper installation, modification, repair, storage or handling, or any other cause not the fault of QuestAir ( Non-warranty Repairs ) are not covered by this Limited Warranty, and shall be at Purchaser s expense. The Purchaser shall ship the Goods by pre-paid freight to QuestAir for any warranty repairs. All costs of dismantling, reinstallation and freight and the time and expenses of QuestAir s personnel for site travel, equipment freight and non-warranty repairs shall be borne by Purchaser unless accepted in writing by QuestAir. QuestAir s sole responsibility shall be, at its option, to repair or replace and install free of charge any parts or equipment found to be defective, up to a maximum of 50% of the purchase price, or refund the full purchase price paid by the Purchaser. Goods repaired and parts replaced during the warranty period shall be in warranty for the remainder of the original warranty period or ninety (90) days, whichever is longer. THE FOREGOING WARRANTIES AND REMEDIES ARE EXCLUSIVE AND EXPRESSLY IN LIEU OF ALL OTHER WARRANTIES EXPRESSED OR IMPLIED; AND QUESTAIR MAKES NO REPRESENTATION OR WARRANTY, EXPRESS OR IMPLIED, AS TO THE FITNESS OF A PARTICULAR PURPOSE OR MERCHANTABILITY OF THE GOODS Equipment Access After providing reasonable notice to the Purchaser, QuestAir personnel must have access to the purchaser site to collect performance data and samples during the warranty period. 3.8 Limitation of Remedy and Liability: QUESTAIR SHALL NOT BE LIABLE FOR DAMAGES CAUSED BY DELAY OR PERFORMANCE. THE SOLE AND EXCLUSIVE REMEDY FOR BREACH OF WARRANTY HEREUNDER SHALL BE LIMITED TO REPAIR, CORRECTION OR REPLACEMENT UNDER THE LIMITED WARRANTY CLAUSE IN SECTION 3.7. IN NO EVENT, REGARDLESS OF THE FORM OF THE CLAIM OR CAUSE OF ACTION (WHETHER BASED IN CONTRACT, INFRINGEMENT, NEGLIGENCE, STRICT LIABILITY, OTHER TORT OR OTHERWISE), SHALL QUESTAIR S LIABILITY TO PURCHASER EXTEND TO INCLUDE INCIDENTAL, CONSEQUENTIAL OR PUNITIVE DAMAGES. THE TERM CONSEQUENTIAL DAMAGES SHALL QuestAir Technologies Inc. QB081670A Business Confidential /05/2009
140 M-3300 METHANE PURIFICATION PSA SYSTEM INCLUDE, BUT NOT BE LIMITED TO, LOSS OF ANTICIPATED PROFITS, LOSS OF USE, LOSS OF REVENUE, AND COST OF CAPITAL. 3.9 Installation: The Purchaser shall be responsible for receiving, storing, installing, starting up, and maintaining all Goods. QuestAir shall provide a quotation for services to assist the Purchaser in these functions if requested Product Support: QuestAir s policy is that functionally interchangeable replacement parts will be available during the time a standard product is offered for sale. In addition, either repair capability, or functionally equivalent parts will be available for at least five years from the last date of product availability. No guarantee of parts availability, repair capability, or functionally equivalent goods is offered for goods manufactured by others and supplied with QuestAir s Goods Taxes and Duties: QuestAir s prices do not include amounts for any duties or sales, use, excise, or similar taxes. The Purchaser shall pay, in addition to QuestAir s prices, the amount of any present or future such tax and duty applicable to the sale or use of the Goods or, in lieu of such payment, provide QuestAir with a tax exemption certificate and/or duty clearance acceptable to the appropriate authorities. The Purchaser covenants and agrees with QuestAir to indemnify QuestAir against all liabilities, claims, demands, actions, causes of action, damages, losses, costs or expenses (including legal fees and disbursements) suffered or incurred by QuestAir by reason of or arising out of Purchaser s breach of this covenant Insurance: The Purchaser shall provide and maintain insurance on the Goods in an amount not less than their full insurable value, with loss payable to QuestAir and the Purchaser, as their interests may appear, from the date that risk of loss passes to the Purchaser until such time as title passes to the Purchaser and the Purchaser pays the full purchase price to QuestAir Labeling: Each of the Goods utilized by the Purchaser shall have a label affixed thereto identifying it as manufactured or developed by QuestAir and containing such proprietary, copyright, patent, trademark, design right, trade secret and all other proprietary rights, legends and alpha-numeric codes as QuestAir considers appropriate. The Purchaser shall ensure that such label remains affixed to such Goods, shall replace such label if it is destroyed, removed or becomes unreadable and in no event shall the Purchaser claim that the Goods or any component thereof has been developed by the Purchaser Milestone Payments: Unless otherwise provided in QuestAir s written quotation, the Purchaser shall make periodic milestone payments. Invoices shall be issued by QuestAir and paid by the Purchaser based upon the following Milestones: Milestone 1: 40% of price upon acceptance of order by QuestAir. Milestone 2: 40% of price upon notice of availability to ship. Milestone 3: 20% of price 30 days after delivery of Goods by QuestAir. All payments are non-refundable and due within 15 days of the invoice date. An interest charge of 2% per month will be assessed on late payments Purchaser Supplied Data: To the extent that QuestAir has relied upon any specifications, information, representation of operating conditions or other data supplied in writing by the Purchaser to QuestAir in the selection or design of the Goods and the preparation of QuestAir s quotation, and in the event that actual operating conditions or other conditions differ from those represented by the Purchaser and relied upon by QuestAir, any warranties or other provisions contained herein which are affected by such conditions shall be null and void, unless otherwise mutually agreed upon in writing Storage: The Purchaser agrees to pay QuestAir a storage charge of 1% of the total purchase price per month, or prorated portion thereof for a part of a month, for Goods not authorized for shipment by the Purchaser within fourteen (14) days following either the specified delivery date or the date the Purchaser is notified that same are ready for shipment, whichever is later Title (a) Purchaser agrees to grant to QuestAir such security interests in the Goods and to execute such other documents as may be desirable for QuestAir to obtain a perfected first ranking charge over the Goods as security for the payment of all monies owing to QuestAir by the Purchaser and performance of all obligations of the Purchaser under this agreement. (b) It will be a default if the Purchaser fails to make any payment due under this Agreement or any other agreement between the Purchaser and QuestAir when due. (c) Until QuestAir has been paid in full for the Goods in accordance with this Agreement, title to the Goods shall remain exclusively in QuestAir. QuestAir Technologies Inc. QB081670A Business Confidential /05/2009
141 M-3300 METHANE PURIFICATION PSA SYSTEM (d) Purchaser acknowledges receipt of a copy of this Agreement and waives all rights to receive from QuestAir a copy of any financing statement, financing change statement, or verification statement filed at any time at the Personal Property Registry or other similar registry in respect of this Agreement. (e) In the event of default of this Agreement or in the payment of any sums due to QuestAir as aforesaid, QuestAir may exercise any and all remedies afforded to secured parties by Part 5 of the Personal Property Security Act or other similar statutes, including seizure of the Goods Proprietary Rights (a) QuestAir shall defend at its own expense any legal proceeding brought against the Purchaser and pay those damages finally awarded against the Purchaser in such proceeding, to the extent that it is based on a claim that the Goods in the form delivered to the Purchaser constitutes an infringement of any valid patent trademark, copyright, trade secret or other third-party proprietary right held under the law of the country in which the Site is located. The Purchaser shall notify QuestAir promptly in writing of any claim of infringement. (b) QuestAir shall have no liability or obligation to the Purchaser hereunder with respect to any patent, trademark, copyright, trade secret or other third-party proprietary right infringement or claims thereof based upon (i) unauthorized modifications of the Goods, (ii) any claim of patent, trademark, copyright, trade secret or other third-party proprietary right infringement in which the Purchaser or any affiliate or purchaser of Purchaser has an interest or license. (c) In the event that any of the Goods is held to constitute infringement or the use thereof is enjoined, QuestAir may at its option and at its own expense, as the exclusive remedy to the Purchaser therefor, either, (i) procure for the Purchaser the right to continue using such Goods, or (ii) replace such Goods with non-infringing Goods of equivalent quality and performance or, (iii) modify such Goods so that it is non-infringing, or (iv) accept return of such Goods. (d) The foregoing states the entire liability of QuestAir with respect to infringement of patents, trademarks, copyrights, trade secrets, or other third-party proprietary rights by any Goods delivered under this Agreement. (e) The sale acceptance of the any Goods to the Purchaser by QuestAir shall not confer on the Purchaser a license under any patent, trademark, copyright, trade secret or other proprietary rights of QuestAir, and shall not confer on the Purchaser a license to reproduce, redesign, modify, create derivative works from, reverse engineer, disassemble or reverse assemble the Goods General Provisions: (a) These terms and conditions, and the documents to which they are attached, constitute the entire agreement between the parties regarding the sale and purchase of the Goods and/or services to be performed and no other promises or agreements shall be of any force or effect unless mutually agreed upon in writing. (b) In the case of contradictory terms or conditions of sale between this document and the attached documents which constitute the entire agreement, the terms or conditions of the attached documents shall take priority. (c) These terms shall be binding upon and shall accrue to the benefit of the parties hereto and their respective assigns and successors in interest; provided, however, neither party may assign this agreement, or any of its interests herein, without the prior written consent of the other party. (d) No action, regardless of form, may be brought by either party more than two (2) years after the cause of the action has accrued. (e) The laws of the Province of British Columbia, Canada shall govern the validity, interpretation, and performance of this agreement. Canadian Courts shall adjudicate all disputes and all judgements shall be binding and final. (f) Purchaser represents and warrants that Goods supplied hereunder are not to be used in nuclear applications, including, without limitation, any nuclear power generation facility. QuestAir Technologies Inc. QB081670A Business Confidential /05/2009
142 Appendix C Cost Estimates
143 Cost Estimate Klamath Falls Biogas Energy Management Report Status Quo Quantity Units $/unit Total, $ Site Construction Demo/Remove Existing 36 bhp boiler 1 ea $4,000 $4,000 Demo Hot Water Piping 50 lf $10 $500 Demo/Remove Existing Biogas Piping 100 lf $20 $2,000 Trench 300 lf $50 $15,000 Re-Sod disturbed area 1000 sf $3 $3,000 Pipe penetration in existing CMU wall 4 ea $750 $3,000 Concrete Slab on slab foundation - New 40 bhp boiler 1.5 cy $700 $1,050 Finishes Paintings & Coatings Allowance 1 ls $3,000 $3,000 Equipment Firebox Boiler 1 ea $95,000 $95,000 Firebox Boiler Install 1 ls $14,250 $14,250 Expansion Tank 1 ea $6,000 $6,000 Expansion Tank Install 1 ls $1,200 $1,200 Hot Water Circulation Pump 1 ea $6,500 $6,500 Hot Water Circulation Pump Install 1 ea $1,300 $1,300 Special Construction - Process Instrumentation & Controls I&C Allowance 1 ls $7,500 $7,500 Mechanical 4" Hot Water Supply and Return 600 lf $40 $24,000 1" Chilled Water System 100 lf $23 $2,300 1/2" Chilled Water System 50 lf $18 $900 Standard Fittings and Insulation allowance 1 ls $10,000 $10,000 Electrical Electrical Allowance 1 ls $7,500 $7,500 Total Direct Costs $208,000 Marked Up Direct Costs Field Office Overhead 10% $20,800 Home Office Overhead 5% $11,440 Contingencies 30% $68,640 Margin 10% $30,888 Builder's All Risk Insurance 1% $3,398 Liability Insurance 2% $6,795 Bond 2% $6,795 Escalation to Mid Point Construction 1% $3,568 Design and Construction Services 15% $54,049 Total Direct Costs $414,373
144 Cost Estimate Klamath Falls Biogas Energy Management Report Biogas Boiler Quantity Units $/unit Total, $ Site Construction Demo/Remove Existing 36 bhp boiler 1 ea $4,000 $4,000 Demo Hot Water Piping 50 lf $10 $500 Demo/Remove Existing Biogas Piping 100 lf $20 $2,000 Trench 300 lf $50 $15,000 Re-Sod disturbed area 1000 sf $3 $3,000 Pipe penetration in existing CMU wall 7 ea $750 $5,250 Concrete Slab on grade foundation - Knockout Tank, Flow Meter 2 cy $700 $1,400 Slab on grade foundation - H2S Vessels Skid 6 cy $700 $4,200 Slab on grade foundation - Conditioning Skid 2 cy $700 $1,400 Slab on grade foundation - Chiller 2 cy $700 $1,400 Slab on slab foundation - New 40 bhp boiler 1.5 cy $700 $1,050 Thermal & Moisture Protection Freeze Protection/Heat Tracing Allowance 1 ls $5,000 $5,000 Finishes Paintings & Coatings Allowance 1 ls $3,000 $3,000 Equipment Iron Sponge 1 ea $64,170 $64,170 Iron Sponge Install 1 ls $9,626 $9,626 Chiller - 1/2 Ton 1 ea $5,000 $5,000 Chiller Insall 1 ls $1,000 $1,000 Gas Conditioning Skid (HEX and Blower) 1 ea $25,000 $25,000 Gas Conditioning Skid Install 1 ls $3,750 $3,750 Firebox Boiler 1 ea $95,000 $95,000 Firebox Boiler Install 1 ls $14,250 $14,250 Expansion Tank 1 ea $6,000 $6,000 Expansion Tank Install 1 ls $1,200 $1,200 Hot Water Circulation Pump 1 ea $6,500 $6,500 Hot Water Circulation Pump Install 1 ea $1,300 $1,300 Special Construction - Process Instrumentation & Controls I&C Allowance 1 ls $12,500 $12,500 Mechanical 8" Digester Gas Piping (Low Pressure) 150 lf $100 $15,000 2" Scrubbed Digester Gas Piping (Low Pressure) 150 lf $75 $11,250 4" Hot Water Supply and Return 600 lf $40 $24,000 1" Chilled Water System 100 lf $23 $2,300 1/2" Chilled Water System 50 lf $18 $900 Standard Fittings and Insulation allowance 1 ls $10,000 $10,000 Electrical Electrical Allowance 1 ls $12,500 $12,500 Total Direct Costs $368,446 Marked Up Direct Costs Field Office Overhead 10% $36,845 Home Office Overhead 5% $20,265 Contingencies 30% $121,587 Margin 10% $54,714 Builder's All Risk Insurance 1% $6,019 Liability Insurance 2% $12,037 Bond 2% $12,037 Escalation to Mid Point Construction 1% $6,319 Design and Construction Services 15% $95,740 Total $734,008
145 Cost Estimate Klamath Falls Biogas Energy Management Report Cogeneration Quantity Units $/unit Total, $ Site Construction Demo/Remove Existing Biogas Piping 100 lf $20 $2,000 Trench 200 lf $50 $10,000 Re-Sod disturbed area 800 sf $3 $2,400 Pipe penetration in existing CMU wall 2 ea $750 $1,500 Concrete Slab on grade foundation - Knockout Tank, Flow Meter 2 cy $700 $1,400 Slab on grade foundation - H2S Vessels Skid 6 cy $700 $4,200 Slab on grade foundation - Conditioning Skid 2 cy $700 $1,400 Slab on grade foundation - Chiller 2 cy $700 $1,400 Slab on grade foundation - Siloxane Skid 1.5 cy $700 $1,050 Slab on grade foundation - Engines 15 cy $700 $10,500 Thermal & Moisture Protection Freeze Protection/Heat Tracing Allowance 1 ls $10,000 $10,000 Finishes Paintings & Coatings Allowance 1 ls $6,000 $6,000 Equipment Iron Sponge 1 ea $64,170 $64,170 Iron Sponge Install 1 ls $9,626 $9,626 Gas Treatment System 1 ea $217,400 $217,400 Gas Treatment System Install 1 ls $32,610 $32, kw Containerized I.C Engine Generator Package 1 ea $260,000 $260, kw Containerized I.C Engine Generator Package Install 1 ls $39,000 $39,000 Firebox Boiler 1 ea $95,000 $95,000 Firebox Boiler Install 1 ls $14,250 $14,250 Hot Water Circulation Pump 1 ea $6,500 $6,500 Hot Water Circulation Pump Install 1 ea $1,300 $1,300 Expansion Tank 1 ea $6,000 $6,000 Expansion Tank Install 1 ls $1,200 $1,200 Special Construction - Process Instrumentation & Controls I&C Allowance 1 ls $22,500 $22,500 Conveying Systems NOT USED $0 Mechanical 8" Digester Gas Piping (Low Pressure) 150 lf $100 $15,000 2" Scrubbed Digester Gas Piping (Low Pressure) 250 lf $75 $18,750 2" Hot Water Supply and Return 250 lf $30 $7,500 1" Chilled Water System 100 lf $23 $2,300 1/2" Chilled Water System 100 lf $18 $1,800 Standard Fittings and Insulation allowance 1 ls $15,000 $15,000 Electrical Electrical Allowance 1 ls $20,000 $20,000 Total Direct Costs $901,756 Marked Up Direct Costs Field Office Overhead 10% $90,176 Home Office Overhead 5% $49,597 Contingencies 30% $297,579 Margin 10% $133,911 Builder's All Risk Insurance 1% $14,730 Liability Insurance 2% $29,460 Bond 2% $29,460 Escalation to Mid Point Construction 1% $15,467 Design and Construction Services 13% $203,078 Total $1,765,213
146 Cost Estimate Klamath Falls Biogas Energy Management Report Biomethane Quantity Units $/unit Total,$ Site Construction Demo/Remove Existing Biogas Piping 100 lf $20 $2,000 Trench 200 lf $50 $10,000 Re-Sod disturbed area 800 sf $3 $2,400 Pipe penetration in existing CMU wall 2 ea $750 $1,500 Concrete Slab on grade foundation - Knockout Tank, Flow Meter 2 cy $700 $1,400 Slab on grade foundation - H2S Vessels Skid 6 cy $700 $4,200 Slab on grade foundation - Conditioning Skid 2 cy $700 $1,400 Slab on grade foundation - Chiller 2 cy $700 $1,400 Slab on grade foundation - Siloxane Skid 1.5 cy $700 $1,050 Slab on grade foundation - PSA Skid 2 cy $700 $1,400 Slab on grade foundation - CNG Compresssor Skid 4 cy $700 $2,800 Slab on grade foundation - CNG Storage pad 4 cy $700 $2,800 Slab on grade foundation - CNG Dispenser 1.5 cy $700 $1,050 Thermal & Moisture Protection Freeze Protection/Heat Tracing Allowance 1 ls $15,000 $15,000 Finishes Paintings & Coatings Allowance 1 ls $10,000 $10,000 Equipment Iron Sponge 1 ea $64,170 $64,170 Iron Sponge Install 1 ls $9,626 $9,626 QuestAir Gas Scrubber/Sweetener - 45 cfm 1 ea $670,000 $670,000 QuestAir Gas Scrubber/Sweetener Install 1 ls $134,000 $134,000 Hanson Tank 150 psi Gas Storage 3 ea $10,000 $30, psi Gas Storage Install 3 ls $2,000 $6,000 NG Dessicant Dryer 1 ea $14,257 $14,257 NG Dessicant Dryer Install 1 ls $2,851 $2,851 ANGI CNG 5000 psi compressor - 40 hp, 75 scfm, 208 VAC 1 ea $67,700 $67,700 ANGI CNG 5000 psi compressor Install 1 ls $13,540 $13,540 ASME CNG Storage Cascade (35,000 scf) 1 ea $90,600 $90,600 ASME CNG Storage Cascade Install 1 ls $13,590 $13,590 Fuel Management System (Controller, dispenser, filter, etc.) 1 ea $67,938 $67,938 Fuel Management System Install 1 ls $10,191 $10,191 Firebox Boiler 1 ea $95,000 $95,000 Firebox Boiler Install 1 ls $14,250 $14,250 Hot Water Circulation Pump 1 ea $6,500 $6,500 Hot Water Circulation Pump Install 1 ea $1,300 $1,300 Expansion Tank 1 ea $6,000 $6,000 Expansion Tank Install 1 ls $1,200 $1,200 Special Construction - Process Instrumentation & Controls I&C Allowance 1 ls $25,000 $25,000 Mechanical 8" Digester Gas Piping (Low Pressure) 150 lf $100 $15,000 2" Scrubbed Digester Gas Piping (Low Pressure) 250 lf $75 $18,750 2" Hot Water Supply and Return 300 lf $30 $9,000 1" Chilled Water System 100 lf $23 $2,300 1/2" Chilled Water System 100 lf $18 $1,800 1/2" High pressure gas line 250 lf $35 $8,750 3/8" High pressure gas line 50 lf $35 $1,750 Standard Fittings and Insulation allowance 1 ls $15,000 $15,000 Electrical Electrical Allowance 1 ls $25,000 $25,000 Total Direct Costs $1,499,463 Marked Up Direct Costs Field Office Overhead 10% $149,946 Home Office Overhead 5% $82,470 Contingencies 30% $494,823 Margin 10% $222,670 Builder's All Risk Insurance 1% $24,494 Liability Insurance 2% $48,987 Bond 2% $48,987 Escalation to Mid Point Construction 1% $25,718 Design and Construction Services 13% $337,683 Total $2,935,242
147 Cost Estimate Klamath Falls Biogas Energy Management Report Hybrid Quantity Units $/unit Total, $ Site Construction Demo/Remove Existing Biogas Piping 100 lf $20 $2,000 Trench 200 lf $50 $10,000 Re-Sod disturbed area 800 sf $3 $2,400 Pipe penetration in existing CMU wall 2 ea $750 $1,500 Concrete Slab on grade foundation - Knockout Tank, Flow Meter 2 cy $700 $1,400 Slab on grade foundation - H2S Vessels Skid 6 cy $700 $4,200 Slab on grade foundation - Conditioning Skid 2 cy $700 $1,400 Slab on grade foundation - Chiller 2 cy $700 $1,400 Slab on grade foundation - Siloxane Skid 1.5 cy $700 $1,050 Slab on grade foundation - PSA Skid 2 cy $701 $1,402 Slab on grade foundation - CNG Compresssor Skid 4 cy $702 $2,808 Slab on grade foundation - CNG Storage pad 4 cy $703 $2,812 Slab on grade foundation - CNG Dispenser 1.5 cy $700 $1,050 Thermal & Moisture Protection Freeze Protection/Heat Tracing Allowance 1 ls $20,000 $20,000 Finishes Paintings & Coatings Allowance 1 ls $12,500 $12,500 Equipment Iron Sponge 1 ea $64,170 $64,170 Iron Sponge Install 1 ls $9,626 $9,626 Gas Treatment System 1 ea $217,400 $217,400 Gas Treatment System Install 1 ls $32,610 $32, kw Containerized I.C Engine Generator Package 1 ea $260,000 $260, kw Containerized I.C Engine Generator Package Install 1 ls $39,000 $39,000 QuestAir Gas Scrubber/Sweetener - 10 cfm 1 ea $90,000 $90,000 QuestAir Gas Scrubber/Sweetener Install 1 ls $13,500 $13,500 Hanson Tank 150 psi Gas Storage 1 ea $10,000 $10, psi Gas Storage Install 1 ls $2,000 $2,000 NG Dessicant Dryer 1 ea $14,257 $14,257 NG Dessicant Dryer Install 1 ls $2,851 $2,851 ANGI CNG 5000 psi compressor - 40 hp, 75 scfm, 208 VAC 1 ea $67,700 $67,700 ANGI CNG 5000 psi compressor Install 1 ls $13,540 $13,540 ASME CNG Storage Cascade (35,000 scf) 1 ea $90,600 $90,600 ASME CNG Storage Cascade Install 1 ls $18,120 $18,120 Fuel Management System (Controller, dispenser, filter, etc.) 1 ea $67,938 $67,938 Fuel Management System Install 1 ls $13,588 $13,588 Firebox Boiler 1 ea $95,000 $95,000 Firebox Boiler Install 1 ls $14,250 $14,250 Hot Water Circulation Pump 1 ea $6,500 $6,500 Hot Water Circulation Pump Install 1 ea $1,300 $1,300 Expansion Tank 1 ea $6,000 $6,000 Expansion Tank Install 1 ls $1,200 $1,200 Special Construction - Process Instrumentation & Controls I&C Allowance 1 ls $30,000 $30,000 Mechanical 8" Digester Gas Piping (Low Pressure) 150 lf $100 $15,000 2" Scrubbed Digester Gas Piping (Low Pressure) 250 lf $75 $18,750 2" Hot Water Supply and Return 300 lf $30 $9,000 1" Chilled Water System 100 lf $23 $2,300 1/2" Chilled Water System 100 lf $18 $1,800 1/2" High pressure gas line 250 lf $35 $8,750 3/8" High pressure gas line 50 lf $35 $1,750 Standard Fittings and Insulation allowance 1 ls $15,000 $15,000 Electrical Electrical Allowance 1 ls $30,000 $30,000 Total Direct Costs $1,349,422 Marked Up Direct Costs Field Office Overhead 10% $134,942 Home Office Overhead 5% $74,218 Contingencies 30% $445,309 Margin 10% $200,389 Builder's All Risk Insurance 1% $22,043 Liability Insurance 2% $44,086 Bond 2% $44,086 Escalation to Mid Point Construction 1% $23,145 Design and Construction Services 13% $303,893 Total $2,641,532
148 Appendix D Operations and Maintenance
149 Klamath Falls Facilities Plan Economic Evaluation O&M LCC Design/Construction years-> OPERATIONAL YEARS ->>> Units Biogas Flow - escalated each year based on population projections Average scfd 42,468 43,000 43,890 44,618 45,359 46,112 46,877 47,655 48,447 49,251 50,068 50,899 51,744 52,603 53,477 54,364 55,267 56,184 57,117 58,065 59,029 60,009 61,005 62,017 63,047 Average Biomethane (large) scfd 14,960 15,125 15,460 15,717 15,978 16,243 16,513 16,787 17,065 17,349 17,637 17,930 18,227 18,530 18,837 19,150 19,468 19,791 20,120 20,454 20,793 21,138 21,489 21,846 22,209 Average Biomethane (small) scfd 6,205 6,205 6,205 6,205 6,205 6,205 6,205 6,205 6,205 6,205 6,205 6,205 6,205 6,205 6,205 6,205 6,205 6,205 6,205 6,205 6,205 6,205 6,205 6,205 6,205 Yearly economic factors - escalated each year for inflation CNG Vehicle Conversion Cost $/vehicle ($6,500) ($6,663) ($6,829) ($7,000) ($7,175) ($7,354) ($7,538) ($7,726) ($7,920) ($8,118) ($8,321) ($8,529) ($8,742) ($8,960) ($9,184) ($9,414) ($9,649) ($9,891) ($10,138) ($10,391) ($10,651) ($10,917) ($11,190) ($11,470) ($11,757) Electric power rate $/kwh ($0.060) ($0.061) ($0.063) ($0.064) ($0.066) ($0.067) ($0.069) ($0.071) ($0.072) ($0.074) ($0.076) ($0.078) ($0.080) ($0.082) ($0.084) ($0.086) ($0.088) ($0.091) ($0.093) ($0.095) ($0.097) ($0.100) ($0.102) ($0.105) ($0.108) Operator salary $/hours ($37.00) ($37.93) ($38.87) ($39.84) ($40.84) ($41.86) ($42.91) ($43.98) ($45.08) ($46.21) ($47.36) ($48.55) ($49.76) ($51.00) ($52.28) ($53.59) ($54.93) ($56.30) ($57.71) ($59.15) ($60.63) ($62.14) ($63.70) ($65.29) ($66.92) Geothermal $/therm ($0.95) ($0.974) ($0.998) ($1.023) ($1.049) ($1.075) ($1.102) ($1.129) ($1.157) ($1.186) ($1.216) ($1.246) ($1.278) ($1.310) ($1.342) ($1.376) ($1.410) ($1.446) ($1.482) ($1.519) ($1.557) ($1.596) ($1.635) ($1.676) ($1.718) Natural Gas $/therm ($1.38) ($1.415) ($1.450) ($1.486) ($1.523) ($1.561) ($1.600) ($1.640) ($1.681) ($1.723) ($1.767) ($1.811) ($1.856) ($1.902) ($1.950) ($1.999) ($2.049) ($2.100) ($2.152) ($2.206) ($2.261) ($2.318) ($2.376) ($2.435) ($2.496) Fuel Costs $/gal ($2.75) ($2.819) ($2.889) ($2.961) ($3.035) ($3.111) ($3.189) ($3.269) ($3.351) ($3.434) ($3.520) ($3.608) ($3.698) ($3.791) ($3.886) ($3.983) ($4.082) ($4.184) ($4.289) ($4.396) ($4.506) ($4.619) ($4.734) ($4.853) ($4.974) Siloxane Scrubber Media $/lb ($2.00) ($2.05) ($2.10) ($2.15) ($2.21) ($2.26) ($2.32) ($2.38) ($2.44) ($2.50) ($2.56) ($2.62) ($2.69) ($2.76) ($2.83) ($2.90) ($2.97) ($3.04) ($3.12) ($3.20) ($3.28) ($3.36) ($3.44) ($3.53) ($3.62) H 2S Scubber Media $/cf ($18.76) ($19.23) ($19.71) ($20.20) ($20.71) ($21.23) ($21.76) ($22.30) ($22.86) ($23.43) ($24.02) ($24.62) ($25.23) ($25.86) ($26.51) ($27.17) ($27.85) ($28.55) ($29.26) ($29.99) ($30.74) ($31.51) ($32.30) ($33.11) ($33.93) Cogen 1,000 hour maintenance $/event ($208) ($213) ($219) ($224) ($230) ($235) ($241) ($247) ($253) ($260) ($266) ($273) ($280) ($287) ($294) ($301) ($309) ($316) ($324) ($333) ($341) ($349) ($358) Cogen 3,000 hour maintenance $/event ($615) ($630) ($646) ($662) ($678) ($695) ($713) ($731) ($749) ($768) ($787) ($806) ($827) ($847) ($868) ($890) ($912) ($935) ($959) ($983) ($1,007) ($1,032) ($1,058) Cogen 25,000 hour maintenance $/event ($3,950) ($4,049) ($4,150) ($4,254) ($4,360) ($4,469) ($4,581) ($4,696) ($4,813) ($4,933) ($5,057) ($5,183) ($5,313) ($5,445) ($5,582) ($5,721) ($5,864) ($6,011) ($6,161) ($6,315) ($6,473) ($6,635) ($6,801) Cogen 45,000 hour maintenance $/event ($34,018) ($34,869) ($35,741) ($36,634) ($37,550) ($38,489) ($39,451) ($40,437) ($41,448) ($42,484) ($43,546) ($44,635) ($45,751) ($46,895) ($48,067) ($49,269) ($50,501) ($51,763) ($53,057) ($54,384) ($55,743) ($57,137) ($58,565) Status Quo Capital Costs Capital Outlay $ ($414,373) Heat Geothermal Based Annual Geothermal therm/yr 32,011 32,542 33,082 33,631 34,190 34,757 35,334 35,921 36,517 37,123 37,739 38,366 39,003 39,650 40,308 40,977 41,658 42,349 43,052 43,767 44,493 45,232 45,983 46,746 47,522 Base Annual Natural Geothermal $/yr ($30,410) ($31,688) ($33,019) ($34,406) ($35,852) ($37,358) ($38,928) ($40,563) ($42,268) ($44,043) ($45,894) ($47,822) ($49,831) ($51,925) ($54,107) ($56,380) ($58,749) ($61,217) ($63,789) ($66,469) ($69,262) ($72,172) ($75,204) ($78,364) ($81,657) Labor hr/yr Labor $/yr ($1,924) ($1,972) ($2,021) ($2,072) ($2,124) ($2,177) ($2,231) ($2,287) ($2,344) ($2,403) ($2,463) ($2,524) ($2,588) ($2,652) ($2,719) ($2,787) ($2,856) ($2,928) ($3,001) ($3,076) ($3,153) ($3,232) ($3,312) ($3,395) ($3,480) Natural Gas Boiler Base Annual Natural Gas therm/yr 11,096 11,280 11,467 11,658 11,851 12,048 12,248 12,451 12,658 12,868 13,082 13,299 13,520 13,744 13,972 14,204 14,440 14,680 14,923 15,171 15,423 15,679 15,939 16,204 16,473 Base Annual Natural Gas Demand $/yr ($15,312) ($15,956) ($16,626) ($17,325) ($18,053) ($18,811) ($19,602) ($20,425) ($21,283) ($22,177) ($23,109) ($24,080) ($25,092) ($26,146) ($27,245) ($28,389) ($29,582) ($30,825) ($32,120) ($33,470) ($34,876) ($36,341) ($37,868) ($39,459) ($41,117) Labor hr/yr Labor $/yr ($962) ($986) ($1,011) ($1,036) ($1,062) ($1,088) ($1,116) ($1,144) ($1,172) ($1,201) ($1,231) ($1,262) ($1,294) ($1,326) ($1,359) ($1,393) ($1,428) ($1,464) ($1,500) ($1,538) ($1,576) ($1,616) ($1,656) ($1,698) ($1,740) Power Base Annual Power kwh/day 6,879 6,993 7,109 7,227 7,347 7,469 7,593 7,719 7,847 7,978 8,110 8,245 8,382 8,521 8,662 8,806 8,952 9,101 9,252 9,405 9,562 9,720 9,882 10,046 10,212 Base Annual Power Cost $/yr ($149,395) ($155,672) ($162,212) ($169,027) ($176,129) ($183,529) ($191,240) ($199,275) ($207,648) ($216,372) ($225,463) ($234,936) ($244,806) ($255,092) ($265,810) ($276,978) ($288,615) ($300,741) ($313,377) ($326,543) ($340,263) ($354,559) ($369,456) ($384,978) ($401,153) Fueling Base Vehicles Base Fuel Demand gpd Base Fuel Cost $/yr $0 $0 $0 $0 ($158,254) ($164,903) ($171,831) ($179,051) ($186,573) ($194,412) ($202,580) ($211,092) ($219,961) ($229,203) ($238,832) ($248,867) ($259,323) ($270,219) ($281,572) ($293,402) ($305,729) ($318,575) ($331,960) ($345,907) ($360,440) Total - Including Above ($805,846) ($407,866) ($424,947) ($442,745) ($461,288) ($480,609) ($500,741) ($521,717) ($543,572) ($566,344) ($590,071) ($614,794) ($640,553) ($667,393) ($695,359) ($724,498) ($754,859) ($786,494) ($819,456) ($853,801) ($889,587) Present Value 2009 ($662,971) ($982,545) ($1,299,648) ($1,614,298) ($1,926,516) ($2,236,321) ($2,543,732) ($2,848,769) ($3,151,450) ($3,451,795) ($3,749,821) ($4,045,547) ($4,338,992) ($4,630,174) ($4,919,110) ($5,205,818) ($5,490,317) ($5,772,623) ($6,052,754) ($6,330,727) ($6,606,559) Cost Estimate O&M Biogas Utilization_rev6.xlsx 3/15/2010 MGT (CDM-PTL) O&M LCC Page 1
150 Klamath Falls Facilities Plan Economic Evaluation O&M LCC Design/Construction years-> OPERATIONAL YEARS ->>> Units Biogas Flow - escalated each year based on population projections Average scfd 42,468 43,000 43,890 44,618 45,359 46,112 46,877 47,655 48,447 49,251 50,068 50,899 51,744 52,603 53,477 54,364 55,267 56,184 57,117 58,065 59,029 60,009 61,005 62,017 63,047 Average Biomethane (large) scfd 14,960 15,125 15,460 15,717 15,978 16,243 16,513 16,787 17,065 17,349 17,637 17,930 18,227 18,530 18,837 19,150 19,468 19,791 20,120 20,454 20,793 21,138 21,489 21,846 22,209 Average Biomethane (small) scfd 6,205 6,205 6,205 6,205 6,205 6,205 6,205 6,205 6,205 6,205 6,205 6,205 6,205 6,205 6,205 6,205 6,205 6,205 6,205 6,205 6,205 6,205 6,205 6,205 6,205 Yearly economic factors - escalated each year for inflation CNG Vehicle Conversion Cost $/vehicle ($6,500) ($6,663) ($6,829) ($7,000) ($7,175) ($7,354) ($7,538) ($7,726) ($7,920) ($8,118) ($8,321) ($8,529) ($8,742) ($8,960) ($9,184) ($9,414) ($9,649) ($9,891) ($10,138) ($10,391) ($10,651) ($10,917) ($11,190) ($11,470) ($11,757) Electric power rate $/kwh ($0.060) ($0.061) ($0.063) ($0.064) ($0.066) ($0.067) ($0.069) ($0.071) ($0.072) ($0.074) ($0.076) ($0.078) ($0.080) ($0.082) ($0.084) ($0.086) ($0.088) ($0.091) ($0.093) ($0.095) ($0.097) ($0.100) ($0.102) ($0.105) ($0.108) Operator salary $/hours ($37.00) ($37.93) ($38.87) ($39.84) ($40.84) ($41.86) ($42.91) ($43.98) ($45.08) ($46.21) ($47.36) ($48.55) ($49.76) ($51.00) ($52.28) ($53.59) ($54.93) ($56.30) ($57.71) ($59.15) ($60.63) ($62.14) ($63.70) ($65.29) ($66.92) Geothermal $/therm ($0.95) ($0.974) ($0.998) ($1.023) ($1.049) ($1.075) ($1.102) ($1.129) ($1.157) ($1.186) ($1.216) ($1.246) ($1.278) ($1.310) ($1.342) ($1.376) ($1.410) ($1.446) ($1.482) ($1.519) ($1.557) ($1.596) ($1.635) ($1.676) ($1.718) Natural Gas $/therm ($1.38) ($1.415) ($1.450) ($1.486) ($1.523) ($1.561) ($1.600) ($1.640) ($1.681) ($1.723) ($1.767) ($1.811) ($1.856) ($1.902) ($1.950) ($1.999) ($2.049) ($2.100) ($2.152) ($2.206) ($2.261) ($2.318) ($2.376) ($2.435) ($2.496) Fuel Costs $/gal ($2.75) ($2.819) ($2.889) ($2.961) ($3.035) ($3.111) ($3.189) ($3.269) ($3.351) ($3.434) ($3.520) ($3.608) ($3.698) ($3.791) ($3.886) ($3.983) ($4.082) ($4.184) ($4.289) ($4.396) ($4.506) ($4.619) ($4.734) ($4.853) ($4.974) Siloxane Scrubber Media $/lb ($2.00) ($2.05) ($2.10) ($2.15) ($2.21) ($2.26) ($2.32) ($2.38) ($2.44) ($2.50) ($2.56) ($2.62) ($2.69) ($2.76) ($2.83) ($2.90) ($2.97) ($3.04) ($3.12) ($3.20) ($3.28) ($3.36) ($3.44) ($3.53) ($3.62) H 2S Scubber Media $/cf ($18.76) ($19.23) ($19.71) ($20.20) ($20.71) ($21.23) ($21.76) ($22.30) ($22.86) ($23.43) ($24.02) ($24.62) ($25.23) ($25.86) ($26.51) ($27.17) ($27.85) ($28.55) ($29.26) ($29.99) ($30.74) ($31.51) ($32.30) ($33.11) ($33.93) Cogen 1,000 hour maintenance $/event ($208) ($213) ($219) ($224) ($230) ($235) ($241) ($247) ($253) ($260) ($266) ($273) ($280) ($287) ($294) ($301) ($309) ($316) ($324) ($333) ($341) ($349) ($358) Cogen 3,000 hour maintenance $/event ($615) ($630) ($646) ($662) ($678) ($695) ($713) ($731) ($749) ($768) ($787) ($806) ($827) ($847) ($868) ($890) ($912) ($935) ($959) ($983) ($1,007) ($1,032) ($1,058) Cogen 25,000 hour maintenance $/event ($3,950) ($4,049) ($4,150) ($4,254) ($4,360) ($4,469) ($4,581) ($4,696) ($4,813) ($4,933) ($5,057) ($5,183) ($5,313) ($5,445) ($5,582) ($5,721) ($5,864) ($6,011) ($6,161) ($6,315) ($6,473) ($6,635) ($6,801) Cogen 45,000 hour maintenance $/event ($34,018) ($34,869) ($35,741) ($36,634) ($37,550) ($38,489) ($39,451) ($40,437) ($41,448) ($42,484) ($43,546) ($44,635) ($45,751) ($46,895) ($48,067) ($49,269) ($50,501) ($51,763) ($53,057) ($54,384) ($55,743) ($57,137) ($58,565) Alternative 1 - Biogas Boiler Capital Costs Capital Outlay $ ($734,008) Grant $ $ - Biogas Treatment H 2S Scrubber Conditioning Skid Heat Biogas Boiler Power Fueling Media cf Media $/yr ($6,062) ($6,213) ($6,369) ($6,528) ($6,691) ($6,858) ($7,030) ($7,206) ($7,386) ($7,570) ($7,760) ($7,954) ($8,152) ($8,356) ($8,565) ($8,779) ($8,999) ($9,224) ($9,454) ($9,691) ($9,933) ($10,181) ($10,436) ($10,697) ($10,964) Labor hr/yr Labor $/yr ($444) ($455) ($466) ($478) ($490) ($502) ($515) ($528) ($541) ($554) ($568) ($583) ($597) ($612) ($627) ($643) ($659) ($676) ($692) ($710) ($728) ($746) ($764) ($783) ($803) Blower Power kw Blower Power Cost $/yr ($1,556) ($1,595) ($1,635) ($1,676) ($1,717) ($1,760) ($1,804) ($1,849) ($1,896) ($1,943) ($1,992) ($2,041) ($2,092) ($2,145) ($2,198) ($2,253) ($2,310) ($2,367) ($2,427) ($2,487) ($2,549) ($2,613) ($2,679) ($2,746) ($2,814) Chiller Power kw Chiller Power Cost $/yr ($1,556) ($1,595) ($1,635) ($1,676) ($1,717) ($1,760) ($1,804) ($1,849) ($1,896) ($1,943) ($1,992) ($2,041) ($2,092) ($2,145) ($2,198) ($2,253) ($2,310) ($2,367) ($2,427) ($2,487) ($2,549) ($2,613) ($2,679) ($2,746) ($2,814) Labor hr/yr Labor $/yr ($296) ($303) ($311) ($319) ($327) ($335) ($343) ($352) ($361) ($370) ($379) ($388) ($398) ($408) ($418) ($429) ($439) ($450) ($462) ($473) ($485) ($497) ($510) ($522) ($535) Biogas Demand (fuel) therm/yr 49,663 50,487 51,325 52,177 53,044 53,924 54,819 55,729 56,654 57,595 58,551 59,523 60,511 61,515 62,536 63,575 64,630 65,703 66,793 67,902 69,029 70,175 71,340 72,524 73,728 Biogas Utilized scfd 23,219 23,604 23,996 24,394 24,799 25,211 25,630 26,055 26,488 26,927 27,374 27,829 28,291 28,760 29,238 29,723 30,216 30,718 31,228 31,746 32,273 32,809 33,354 33,907 34,470 Labor hr/yr Labor $/yr ($1,924) ($1,972) ($2,021) ($2,072) ($2,124) ($2,177) ($2,231) ($2,287) ($2,344) ($2,403) ($2,463) ($2,524) ($2,588) ($2,652) ($2,719) ($2,787) ($2,856) ($2,928) ($3,001) ($3,076) ($3,153) ($3,232) ($3,312) ($3,395) ($3,480) Base Annual Power kwh/day 6,879 6,993 7,109 7,227 7,347 7,469 7,593 7,719 7,847 7,978 8,110 8,245 8,382 8,521 8,662 8,806 8,952 9,101 9,252 9,405 9,562 9,720 9,882 10,046 10,212 Base Annual Power Cost $/yr ($149,395) ($155,672) ($162,212) ($169,027) ($176,129) ($183,529) ($191,240) ($199,275) ($207,648) ($216,372) ($225,463) ($234,936) ($244,806) ($255,092) ($265,810) ($276,978) ($288,615) ($300,741) ($313,377) ($326,543) ($340,263) ($354,559) ($369,456) ($384,978) ($401,153) Base Vehicles Base Fuel Demand gpd Base Fuel Cost $/yr ($134,233) ($139,114) ($145,749) ($151,873) ($158,254) ($164,903) ($171,831) ($179,051) ($186,573) ($194,412) ($202,580) ($211,092) ($219,961) ($229,203) ($238,832) ($248,867) ($259,323) ($270,219) ($281,572) ($293,402) ($305,729) ($318,575) ($331,960) ($345,907) ($360,440) Total - Including Above ($1,081,457) ($361,825) ($376,799) ($392,397) ($408,644) ($425,568) ($443,196) ($461,559) ($480,688) ($500,613) ($521,368) ($542,989) ($565,511) ($588,972) ($613,411) ($638,869) ($665,390) ($693,016) ($721,795) ($751,774) ($783,004) Present Value 2008 ($889,717) ($1,173,217) ($1,454,390) ($1,733,259) ($2,009,845) ($2,284,170) ($2,556,254) ($2,826,118) ($3,093,783) ($3,359,269) ($3,622,595) ($3,883,782) ($4,142,849) ($4,399,816) ($4,654,701) ($4,907,523) ($5,158,301) ($5,407,054) ($5,653,800) ($5,898,556) ($6,141,340) Cost Estimate O&M Biogas Utilization_rev6.xlsx 3/15/2010 MGT (CDM-PTL) O&M LCC Page 2
151 Klamath Falls Facilities Plan Economic Evaluation O&M LCC Design/Construction years-> OPERATIONAL YEARS ->>> Units Biogas Flow - escalated each year based on population projections Average scfd 42,468 43,000 43,890 44,618 45,359 46,112 46,877 47,655 48,447 49,251 50,068 50,899 51,744 52,603 53,477 54,364 55,267 56,184 57,117 58,065 59,029 60,009 61,005 62,017 63,047 Average Biomethane (large) scfd 14,960 15,125 15,460 15,717 15,978 16,243 16,513 16,787 17,065 17,349 17,637 17,930 18,227 18,530 18,837 19,150 19,468 19,791 20,120 20,454 20,793 21,138 21,489 21,846 22,209 Average Biomethane (small) scfd 6,205 6,205 6,205 6,205 6,205 6,205 6,205 6,205 6,205 6,205 6,205 6,205 6,205 6,205 6,205 6,205 6,205 6,205 6,205 6,205 6,205 6,205 6,205 6,205 6,205 Yearly economic factors - escalated each year for inflation CNG Vehicle Conversion Cost $/vehicle ($6,500) ($6,663) ($6,829) ($7,000) ($7,175) ($7,354) ($7,538) ($7,726) ($7,920) ($8,118) ($8,321) ($8,529) ($8,742) ($8,960) ($9,184) ($9,414) ($9,649) ($9,891) ($10,138) ($10,391) ($10,651) ($10,917) ($11,190) ($11,470) ($11,757) Electric power rate $/kwh ($0.060) ($0.061) ($0.063) ($0.064) ($0.066) ($0.067) ($0.069) ($0.071) ($0.072) ($0.074) ($0.076) ($0.078) ($0.080) ($0.082) ($0.084) ($0.086) ($0.088) ($0.091) ($0.093) ($0.095) ($0.097) ($0.100) ($0.102) ($0.105) ($0.108) Operator salary $/hours ($37.00) ($37.93) ($38.87) ($39.84) ($40.84) ($41.86) ($42.91) ($43.98) ($45.08) ($46.21) ($47.36) ($48.55) ($49.76) ($51.00) ($52.28) ($53.59) ($54.93) ($56.30) ($57.71) ($59.15) ($60.63) ($62.14) ($63.70) ($65.29) ($66.92) Geothermal $/therm ($0.95) ($0.974) ($0.998) ($1.023) ($1.049) ($1.075) ($1.102) ($1.129) ($1.157) ($1.186) ($1.216) ($1.246) ($1.278) ($1.310) ($1.342) ($1.376) ($1.410) ($1.446) ($1.482) ($1.519) ($1.557) ($1.596) ($1.635) ($1.676) ($1.718) Natural Gas $/therm ($1.38) ($1.415) ($1.450) ($1.486) ($1.523) ($1.561) ($1.600) ($1.640) ($1.681) ($1.723) ($1.767) ($1.811) ($1.856) ($1.902) ($1.950) ($1.999) ($2.049) ($2.100) ($2.152) ($2.206) ($2.261) ($2.318) ($2.376) ($2.435) ($2.496) Fuel Costs $/gal ($2.75) ($2.819) ($2.889) ($2.961) ($3.035) ($3.111) ($3.189) ($3.269) ($3.351) ($3.434) ($3.520) ($3.608) ($3.698) ($3.791) ($3.886) ($3.983) ($4.082) ($4.184) ($4.289) ($4.396) ($4.506) ($4.619) ($4.734) ($4.853) ($4.974) Siloxane Scrubber Media $/lb ($2.00) ($2.05) ($2.10) ($2.15) ($2.21) ($2.26) ($2.32) ($2.38) ($2.44) ($2.50) ($2.56) ($2.62) ($2.69) ($2.76) ($2.83) ($2.90) ($2.97) ($3.04) ($3.12) ($3.20) ($3.28) ($3.36) ($3.44) ($3.53) ($3.62) H 2S Scubber Media $/cf ($18.76) ($19.23) ($19.71) ($20.20) ($20.71) ($21.23) ($21.76) ($22.30) ($22.86) ($23.43) ($24.02) ($24.62) ($25.23) ($25.86) ($26.51) ($27.17) ($27.85) ($28.55) ($29.26) ($29.99) ($30.74) ($31.51) ($32.30) ($33.11) ($33.93) Cogen 1,000 hour maintenance $/event ($208) ($213) ($219) ($224) ($230) ($235) ($241) ($247) ($253) ($260) ($266) ($273) ($280) ($287) ($294) ($301) ($309) ($316) ($324) ($333) ($341) ($349) ($358) Cogen 3,000 hour maintenance $/event ($615) ($630) ($646) ($662) ($678) ($695) ($713) ($731) ($749) ($768) ($787) ($806) ($827) ($847) ($868) ($890) ($912) ($935) ($959) ($983) ($1,007) ($1,032) ($1,058) Cogen 25,000 hour maintenance $/event ($3,950) ($4,049) ($4,150) ($4,254) ($4,360) ($4,469) ($4,581) ($4,696) ($4,813) ($4,933) ($5,057) ($5,183) ($5,313) ($5,445) ($5,582) ($5,721) ($5,864) ($6,011) ($6,161) ($6,315) ($6,473) ($6,635) ($6,801) Cogen 45,000 hour maintenance $/event ($34,018) ($34,869) ($35,741) ($36,634) ($37,550) ($38,489) ($39,451) ($40,437) ($41,448) ($42,484) ($43,546) ($44,635) ($45,751) ($46,895) ($48,067) ($49,269) ($50,501) ($51,763) ($53,057) ($54,384) ($55,743) ($57,137) ($58,565) Alternative 2 - Cogeneration Capital Costs Capital Outlay $ ($1,765,213) Grant $ $ - Biogas Treatment H 2S Scrubber Conditioning Skid Siloxane Scrubber Media cf Media $/yr ($6,062) ($6,213) ($6,369) ($6,528) ($6,691) ($6,858) ($7,030) ($7,206) ($7,386) ($7,570) ($7,760) ($7,954) ($8,152) ($8,356) ($8,565) ($8,779) ($8,999) ($9,224) ($9,454) ($9,691) ($9,933) ($10,181) ($10,436) ($10,697) ($10,964) Labor hr/yr Labor $/yr ($444) ($455) ($466) ($478) ($490) ($502) ($515) ($528) ($541) ($554) ($568) ($583) ($597) ($612) ($627) ($643) ($659) ($676) ($692) ($710) ($728) ($746) ($764) ($783) ($803) Blower Power kw Blower Power Cost $/yr ($1,556) ($1,595) ($1,635) ($1,676) ($1,717) ($1,760) ($1,804) ($1,849) ($1,896) ($1,943) ($1,992) ($2,041) ($2,092) ($2,145) ($2,198) ($2,253) ($2,310) ($2,367) ($2,427) ($2,487) ($2,549) ($2,613) ($2,679) ($2,746) ($2,814) Chiller Power kw Chiller Power Cost $/yr ($1,556) ($1,595) ($1,635) ($1,676) ($1,717) ($1,760) ($1,804) ($1,849) ($1,896) ($1,943) ($1,992) ($2,041) ($2,092) ($2,145) ($2,198) ($2,253) ($2,310) ($2,367) ($2,427) ($2,487) ($2,549) ($2,613) ($2,679) ($2,746) ($2,814) Labor hr/yr Labor $/yr ($296) ($303) ($311) ($319) ($327) ($335) ($343) ($352) ($361) ($370) ($379) ($388) ($398) ($408) ($418) ($429) ($439) ($450) ($462) ($473) ($485) ($497) ($510) ($522) ($535) Media cf Media $/yr ($2,577) ($2,642) ($2,708) ($2,775) ($2,845) ($2,916) ($2,989) ($3,064) ($3,140) ($3,219) ($3,299) ($3,382) ($3,466) ($3,553) ($3,642) ($3,733) ($3,826) ($3,922) ($4,020) ($4,120) ($4,223) ($4,329) ($4,437) ($4,548) ($4,662) Labor hr/yr Labor $/yr ($444) ($455) ($466) ($478) ($490) ($502) ($515) ($528) ($541) ($554) ($568) ($583) ($597) ($612) ($627) ($643) ($659) ($676) ($692) ($710) ($728) ($746) ($764) ($783) ($803) Cogen Engine Operations Engine Rating kwe Biogas Demand (fuel) scfd 54,344 54,344 54,344 54,344 54,344 54,344 54,344 54,344 54,344 54,344 54,344 54,344 54,344 54,344 54,344 54,344 54,344 54,344 54,344 54,344 54,344 54,344 54,344 54,344 54,344 Biogas Supply (fuel) scfd 42,468 43,000 43,890 44,618 45,359 46,112 46,877 47,655 48,447 49,251 50,068 50,899 51,744 52,603 53,477 54,344 54,344 54,344 54,344 54,344 54,344 54,344 54,344 54,344 54,344 Electric Power kwe Thermal Power kwth Radiator hp Glycol Pump hp Lube Oil Pump hp ,000 hour maintenance events events/yr ,000 hour maintenance events $/yr ($1,914) ($1,962) ($2,011) ($2,062) ($2,113) ($2,166) ($2,220) ($2,276) ($2,332) ($2,391) ($2,450) ($2,512) ($2,575) ($2,639) ($2,705) ($2,773) ($2,842) ($2,913) ($2,986) ($3,060) ($3,137) 3,000 hour maintenance events events/yr ,000 hour maintenance events $/yr ($1,885) ($1,933) ($1,981) ($2,030) ($2,081) ($2,133) ($2,187) ($2,241) ($2,297) ($2,355) ($2,414) ($2,474) ($2,536) ($2,599) ($2,664) ($2,731) ($2,799) ($2,869) ($2,941) ($3,014) ($3,090) 25,000 hour maintenance events events/yr ,000 hour maintenance events $/yr ($1,454) ($1,491) ($1,528) ($1,566) ($1,605) ($1,645) ($1,686) ($1,729) ($1,772) ($1,816) ($1,862) ($1,908) ($1,956) ($2,005) ($2,055) ($2,106) ($2,159) ($2,213) 213) ($2,268) 268) ($2,325) ($2,383) 45,000 hour maintenance events events/yr ,000 hour maintenance events $/yr ($6,957) ($7,131) ($7,310) ($7,492) ($7,680) ($7,872) ($8,069) ($8,270) ($8,477) ($8,689) ($8,906) ($9,129) ($9,357) ($9,591) ($9,831) ($10,077) ($10,328) ($10,587) ($10,851) ($11,123) ($11,401) Parasitic Power Cost $/yr ($1,867) ($1,914) ($1,962) ($2,011) ($2,061) ($2,112) ($2,165) ($2,219) ($2,275) ($2,332) ($2,390) ($2,450) ($2,511) ($2,574) ($2,638) ($2,704) ($2,772) ($2,841) ($2,912) ($2,985) ($3,059) ($3,136) ($3,214) ($3,295) ($3,377) Labor hr/yr Labor $/yr ($2,886) ($2,958) ($3,032) ($3,108) ($3,186) ($3,265) ($3,347) ($3,431) ($3,516) ($3,604) ($3,694) ($3,787) ($3,881) ($3,978) ($4,078) ($4,180) ($4,284) ($4,391) ($4,501) ($4,614) ($4,729) ($4,847) ($4,968) ($5,093) ($5,220) Heat Biogas Boiler Power Fueling Heat demand not met by cogen therm/yr 1,566 1,796 1,619 1,645 1,673 1,700 1,729 1,757 1,787 1,816 1,846 1,877 1,908 1,940 1,972 2,029 3,124 4,237 5,369 6,519 7,688 8,877 10,086 11,315 12,564 Base Biogas Demand scfd ,461 1,981 2,510 3,048 3,595 4,150 4,715 5,290 5,874 Labor hr/yr Labor $/yr $0 $0 $0 $0 $0 $0 $0 $0 $0 $0 $0 $0 $0 $0 $0 ($697) ($714) ($732) ($750) ($769) ($788) ($808) ($828) ($849) ($870) Power demand not met by cogen kwh/day 4,253 4,335 4,396 4,469 4,543 4,618 4,695 4,773 4,852 4,933 5,014 5,098 5,182 5,268 5,356 5,446 5,592 5,741 5,892 6,045 6,202 6,360 6,522 6,686 6,852 Base Annual Power Cost $/yr ($92,370) ($96,489) ($100,295) ($104,509) ($108,900) ($113,475) ($118,243) ($123,211) ($128,388) ($133,782) ($139,403) ($145,260) ($151,363) ($157,722) ($164,349) ($171,294) ($180,289) ($189,707) ($199,567) ($209,888) ($220,692) ($231,999) ($243,831) ($256,213) ($269,169) Base Vehicles Base Fuel Demand gpd Base Fuel Cost $/yr ($134,233) ($139,114) ($145,749) ($151,873) ($158,254) ($164,903) ($171,831) ($179,051) ($186,573) ($194,412) ($202,580) ($211,092) ($219,961) ($229,203) ($238,832) ($248,867) ($259,323) ($270,219) ($281,572) ($293,402) ($305,729) ($318,575) ($331,960) ($345,907) ($360,440) Total - Including Above ($2,064,102) ($310,907) ($323,416) ($336,437) ($349,991) ($364,100) ($378,787) ($394,075) ($409,990) ($426,558) ($443,806) ($462,498) ($483,008) ($504,406) ($526,731) ($550,022) ($574,321) ($599,671) ($626,116) ($653,703) ($682,482) Present Value 2009 ($1,698,142) ($1,941,746) ($2,183,084) ($2,422,183) ($2,659,071) ($2,893,773) ($3,126,315) ($3,356,723) ($3,585,021) ($3,811,234) ($4,035,386) ($4,257,855) ($4,479,127) ($4,699,197) ($4,918,065) ($5,135,727) ($5,352,183) ($5,567,430) ($5,781,468) ($5,994,295) ($6,205,911) Cost Estimate O&M Biogas Utilization_rev6.xlsx 3/15/2010 MGT (CDM-PTL) O&M LCC Page 3
152 Klamath Falls Facilities Plan Economic Evaluation O&M LCC Design/Construction years-> OPERATIONAL YEARS ->>> Units Biogas Flow - escalated each year based on population projections Average scfd 42,468 43,000 43,890 44,618 45,359 46,112 46,877 47,655 48,447 49,251 50,068 50,899 51,744 52,603 53,477 54,364 55,267 56,184 57,117 58,065 59,029 60,009 61,005 62,017 63,047 Average Biomethane (large) scfd 14,960 15,125 15,460 15,717 15,978 16,243 16,513 16,787 17,065 17,349 17,637 17,930 18,227 18,530 18,837 19,150 19,468 19,791 20,120 20,454 20,793 21,138 21,489 21,846 22,209 Average Biomethane (small) scfd 6,205 6,205 6,205 6,205 6,205 6,205 6,205 6,205 6,205 6,205 6,205 6,205 6,205 6,205 6,205 6,205 6,205 6,205 6,205 6,205 6,205 6,205 6,205 6,205 6,205 Yearly economic factors - escalated each year for inflation CNG Vehicle Conversion Cost $/vehicle ($6,500) ($6,663) ($6,829) ($7,000) ($7,175) ($7,354) ($7,538) ($7,726) ($7,920) ($8,118) ($8,321) ($8,529) ($8,742) ($8,960) ($9,184) ($9,414) ($9,649) ($9,891) ($10,138) ($10,391) ($10,651) ($10,917) ($11,190) ($11,470) ($11,757) Electric power rate $/kwh ($0.060) ($0.061) ($0.063) ($0.064) ($0.066) ($0.067) ($0.069) ($0.071) ($0.072) ($0.074) ($0.076) ($0.078) ($0.080) ($0.082) ($0.084) ($0.086) ($0.088) ($0.091) ($0.093) ($0.095) ($0.097) ($0.100) ($0.102) ($0.105) ($0.108) Operator salary $/hours ($37.00) ($37.93) ($38.87) ($39.84) ($40.84) ($41.86) ($42.91) ($43.98) ($45.08) ($46.21) ($47.36) ($48.55) ($49.76) ($51.00) ($52.28) ($53.59) ($54.93) ($56.30) ($57.71) ($59.15) ($60.63) ($62.14) ($63.70) ($65.29) ($66.92) Geothermal $/therm ($0.95) ($0.974) ($0.998) ($1.023) ($1.049) ($1.075) ($1.102) ($1.129) ($1.157) ($1.186) ($1.216) ($1.246) ($1.278) ($1.310) ($1.342) ($1.376) ($1.410) ($1.446) ($1.482) ($1.519) ($1.557) ($1.596) ($1.635) ($1.676) ($1.718) Natural Gas $/therm ($1.38) ($1.415) ($1.450) ($1.486) ($1.523) ($1.561) ($1.600) ($1.640) ($1.681) ($1.723) ($1.767) ($1.811) ($1.856) ($1.902) ($1.950) ($1.999) ($2.049) ($2.100) ($2.152) ($2.206) ($2.261) ($2.318) ($2.376) ($2.435) ($2.496) Fuel Costs $/gal ($2.75) ($2.819) ($2.889) ($2.961) ($3.035) ($3.111) ($3.189) ($3.269) ($3.351) ($3.434) ($3.520) ($3.608) ($3.698) ($3.791) ($3.886) ($3.983) ($4.082) ($4.184) ($4.289) ($4.396) ($4.506) ($4.619) ($4.734) ($4.853) ($4.974) Siloxane Scrubber Media $/lb ($2.00) ($2.05) ($2.10) ($2.15) ($2.21) ($2.26) ($2.32) ($2.38) ($2.44) ($2.50) ($2.56) ($2.62) ($2.69) ($2.76) ($2.83) ($2.90) ($2.97) ($3.04) ($3.12) ($3.20) ($3.28) ($3.36) ($3.44) ($3.53) ($3.62) H 2S Scubber Media $/cf ($18.76) ($19.23) ($19.71) ($20.20) ($20.71) ($21.23) ($21.76) ($22.30) ($22.86) ($23.43) ($24.02) ($24.62) ($25.23) ($25.86) ($26.51) ($27.17) ($27.85) ($28.55) ($29.26) ($29.99) ($30.74) ($31.51) ($32.30) ($33.11) ($33.93) Cogen 1,000 hour maintenance $/event ($208) ($213) ($219) ($224) ($230) ($235) ($241) ($247) ($253) ($260) ($266) ($273) ($280) ($287) ($294) ($301) ($309) ($316) ($324) ($333) ($341) ($349) ($358) Cogen 3,000 hour maintenance $/event ($615) ($630) ($646) ($662) ($678) ($695) ($713) ($731) ($749) ($768) ($787) ($806) ($827) ($847) ($868) ($890) ($912) ($935) ($959) ($983) ($1,007) ($1,032) ($1,058) Cogen 25,000 hour maintenance $/event ($3,950) ($4,049) ($4,150) ($4,254) ($4,360) ($4,469) ($4,581) ($4,696) ($4,813) ($4,933) ($5,057) ($5,183) ($5,313) ($5,445) ($5,582) ($5,721) ($5,864) ($6,011) ($6,161) ($6,315) ($6,473) ($6,635) ($6,801) Cogen 45,000 hour maintenance $/event ($34,018) ($34,869) ($35,741) ($36,634) ($37,550) ($38,489) ($39,451) ($40,437) ($41,448) ($42,484) ($43,546) ($44,635) ($45,751) ($46,895) ($48,067) ($49,269) ($50,501) ($51,763) ($53,057) ($54,384) ($55,743) ($57,137) ($58,565) Alternative 3 - Biomethane Capital Costs Capital Outlay $ ($2,935,242) Grant $ $ - Biogas Treatment H 2S Scrubber Conditioning Skid Siloxane Scrubber Media cf Media $/yr ($6,062) ($6,213) ($6,369) ($6,528) ($6,691) ($6,858) ($7,030) ($7,206) ($7,386) ($7,570) ($7,760) ($7,954) ($8,152) ($8,356) ($8,565) ($8,779) ($8,999) ($9,224) ($9,454) ($9,691) ($9,933) ($10,181) ($10,436) ($10,697) ($10,964) Labor hr/yr Labor $/yr ($444) ($455) ($466) ($478) ($490) ($502) ($515) ($528) ($541) ($554) ($568) ($583) ($597) ($612) ($627) ($643) ($659) ($676) ($692) ($710) ($728) ($746) ($764) ($783) ($803) Blower Power kw Blower Power Cost $/yr ($1,556) ($1,595) ($1,635) ($1,676) ($1,717) ($1,760) ($1,804) ($1,849) ($1,896) ($1,943) ($1,992) ($2,041) ($2,092) ($2,145) ($2,198) ($2,253) ($2,310) ($2,367) ($2,427) ($2,487) ($2,549) ($2,613) ($2,679) ($2,746) ($2,814) Chiller Power kw Chiller Power Cost $/yr ($1,556) ($1,595) ($1,635) ($1,676) ($1,717) ($1,760) ($1,804) ($1,849) ($1,896) ($1,943) ($1,992) ($2,041) ($2,092) ($2,145) ($2,198) ($2,253) ($2,310) ($2,367) ($2,427) ($2,487) ($2,549) ($2,613) ($2,679) ($2,746) ($2,814) Labor hr/yr Labor $/yr ($296) ($303) ($311) ($319) ($327) ($335) ($343) ($352) ($361) ($370) ($379) ($388) ($398) ($408) ($418) ($429) ($439) ($450) ($462) ($473) ($485) ($497) ($510) ($522) ($535) Media cf Media $/yr ($3,222) ($3,302) ($3,385) ($3,469) ($3,556) ($3,645) ($3,736) ($3,830) ($3,925) ($4,023) ($4,124) ($4,227) ($4,333) ($4,441) ($4,552) ($4,666) ($4,783) ($4,902) ($5,025) ($5,150) ($5,279) ($5,411) ($5,546) ($5,685) ($5,827) Labor hr/yr Labor $/yr ($444) ($455) ($466) ($478) ($490) ($502) ($515) ($528) ($541) ($554) ($568) ($583) ($597) ($612) ($627) ($643) ($659) ($676) ($692) ($710) ($728) ($746) ($764) ($783) ($803) PSA - CO 2 Removal Feed Compressor Power kw PSA Power kw st Stage Compressor Power kw Power Cost $/yr ($19,306) ($19,789) ($20,283) ($20,790) ($21,310) ($21,843) ($22,389) ($22,949) ($23,522) ($24,111) ($24,713) ($25,331) ($25,964) ($26,614) ($27,279) ($27,961) ($28,660) ($29,376) ($30,111) ($30,864) ($31,635) ($32,426) ($33,237) ($34,068) ($34,919) Labor hr/yr Labor $/yr ($1,924) ($1,972) ($2,021) ($2,072) ($2,124) ($2,177) ($2,231) ($2,287) ($2,344) ($2,403) ($2,463) ($2,524) ($2,588) ($2,652) ($2,719) ($2,787) ($2,856) ($2,928) ($3,001) ($3,076) ($3,153) ($3,232) ($3,312) ($3,395) ($3,480) CNG Fueling Equipment Operations Compressor Power hp Dryer Power hp Dispenser Power hp Runtime hrs/yr 2,190 2,190 2,190 2,190 2,190 2,190 2,190 2,190 2,190 2,190 2,190 2,190 2,190 2,190 2,190 2,190 2,190 2,190 2,190 2,190 2,190 2,190 2,190 2,190 2,190 Base Annual Power Cost $/yr ($3,656) ($3,748) ($3,841) ($3,937) ($4,036) ($4,137) ($4,240) ($4,346) ($4,455) ($4,566) ($4,680) ($4,797) ($4,917) ($5,040) ($5,166) ($5,295) ($5,428) ($5,564) ($5,703) ($5,845) ($5,991) ($6,141) ($6,295) ($6,452) ($6,613) Labor hr/yr Labor $/yr ($3,848) ($3,944) ($4,043) ($4,144) ($4,247) ($4,354) ($4,463) ($4,574) ($4,688) ($4,806) ($4,926) ($5,049) ($5,175) ($5,305) ($5,437) ($5,573) ($5,712) ($5,855) ($6,002) ($6,152) ($6,305) ($6,463) ($6,625) ($6,790) ($6,960) Sevice Call $/yr $0 $0 $0 ($6,461) $0 $0 $0 ($7,132) $0 $0 $0 ($7,872) $0 $0 $0 ($8,689) $0 $0 $0 ($9,591) $0 Heat Geothermal Based Annual Geothermal therm/yr 32,011 32,542 33,082 33,631 34,190 34,757 35,334 35,921 36,517 37,123 37,739 38,366 39,003 39,650 40,308 40,977 41,658 42,349 43,052 43,767 44,493 45,232 45,983 46,746 47,522 Base Annual Natural Geothermal $/yr ($30,410) ($31,688) ($33,019) ($34,406) ($35,852) ($37,358) ($38,928) ($40,563) ($42,268) ($44,043) ($45,894) ($47,822) ($49,831) ($51,925) ($54,107) ($56,380) ($58,749) ($61,217) ($63,789) ($66,469) ($69,262) ($72,172) ($75,204) ($78,364) ($81,657) Labor hr/yr Labor $/yr ($962) ($986) ($1,011) ($1,036) ($1,062) ($1,088) ($1,116) ($1,144) ($1,172) ($1,201) ($1,231) ($1,262) ($1,294) ($1,326) ($1,359) ($1,393) ($1,428) ($1,464) ($1,500) ($1,538) ($1,576) ($1,616) ($1,656) ($1,698) ($1,740) Biogas Boiler Power Fueling Base Annual Natural Gas therm/yr 11,096 11,280 11,467 11,658 11,851 12,048 12,248 12,451 12,658 12,868 13,082 13,299 13,520 13,744 13,972 14,204 14,440 14,680 14,923 15,171 15,423 15,679 15,939 16,204 16,473 Base Biogas Demand scfd 5,188 5,274 5,361 5,450 5,541 5,633 5,726 5,821 5,918 6,016 6,116 6,218 6,321 6,426 6,532 6,641 6,751 6,863 6,977 7,093 7,211 7,330 7,452 7,576 7,702 Labor hr/yr Labor $/yr ($1,924) ($1,972) ($2,021) ($2,072) ($2,124) ($2,177) ($2,231) ($2,287) ($2,344) ($2,403) ($2,463) ($2,524) ($2,588) ($2,652) ($2,719) ($2,787) ($2,856) ($2,928) ($3,001) ($3,076) ($3,153) ($3,232) ($3,312) ($3,395) ($3,480) Base Annual Power kwh/day 6,879 6,993 7,109 7,227 7,347 7,469 7,593 7,719 7,847 7,978 8,110 8,245 8,382 8,521 8,662 8,806 8,952 9,101 9,252 9,405 9,562 9,720 9,882 10,046 10,212 Base Annual Power Cost $/yr ($149,395) ($155,672) ($162,212) ($169,027) ($176,129) ($183,529) ($191,240) ($199,275) ($207,648) ($216,372) ($225,463) ($234,936) ($244,806) ($255,092) ($265,810) ($276,978) ($288,615) ($300,741) ($313,377) ($326,543) ($340,263) ($354,559) ($369,456) ($384,978) ($401,153) Base Vehicles Vehicle Conversion Cost $/yr $0 $0 $0 $0 ($473,802) ($8,062) ($8,400) ($8,753) ($9,121) ($9,504) ($9,904) ($10,320) ($10,753) ($11,205) ($715,050) ($12,167) ($12,678) ($13,210) ($13,765) ($14,344) ($14,946) ($15,574) ($16,229) ($16,911) ($17,621) Base Fuel Demand gpd Base Fuel Cost $/yr Total - Including Above ($3,670,917) ($280,088) ($290,986) ($308,781) ($314,108) ($326,368) ($339,120) ($359,515) ($366,180) ($380,530) ($1,098,832) ($418,859) ($427,140) ($443,945) ($461,427) ($488,304) ($498,536) ($518,222) ($538,703) ($569,604) ($582,185) Present Value 2009 ($3,020,072) ($3,239,529) ($3,456,667) ($3,676,112) ($3,888,712) ($4,099,092) ($4,307,282) ($4,517,483) ($4,721,385) ($4,923,188) ($5,478,173) ($5,679,652) ($5,875,330) ($6,069,021) ($6,260,754) ($6,453,992) ($6,641,885) ($6,827,897) ($7,012,053) ($7,197,499) ($7,378,016) Cost Estimate O&M Biogas Utilization_rev6.xlsx 3/15/2010 MGT (CDM-PTL) O&M LCC Page 4
153 Klamath Falls Facilities Plan Economic Evaluation O&M LCC Design/Construction years-> OPERATIONAL YEARS ->>> Units Biogas Flow - escalated each year based on population projections Average scfd 42,468 43,000 43,890 44,618 45,359 46,112 46,877 47,655 48,447 49,251 50,068 50,899 51,744 52,603 53,477 54,364 55,267 56,184 57,117 58,065 59,029 60,009 61,005 62,017 63,047 Average Biomethane (large) scfd 14,960 15,125 15,460 15,717 15,978 16,243 16,513 16,787 17,065 17,349 17,637 17,930 18,227 18,530 18,837 19,150 19,468 19,791 20,120 20,454 20,793 21,138 21,489 21,846 22,209 Average Biomethane (small) scfd 6,205 6,205 6,205 6,205 6,205 6,205 6,205 6,205 6,205 6,205 6,205 6,205 6,205 6,205 6,205 6,205 6,205 6,205 6,205 6,205 6,205 6,205 6,205 6,205 6,205 Yearly economic factors - escalated each year for inflation CNG Vehicle Conversion Cost $/vehicle ($6,500) ($6,663) ($6,829) ($7,000) ($7,175) ($7,354) ($7,538) ($7,726) ($7,920) ($8,118) ($8,321) ($8,529) ($8,742) ($8,960) ($9,184) ($9,414) ($9,649) ($9,891) ($10,138) ($10,391) ($10,651) ($10,917) ($11,190) ($11,470) ($11,757) Electric power rate $/kwh ($0.060) ($0.061) ($0.063) ($0.064) ($0.066) ($0.067) ($0.069) ($0.071) ($0.072) ($0.074) ($0.076) ($0.078) ($0.080) ($0.082) ($0.084) ($0.086) ($0.088) ($0.091) ($0.093) ($0.095) ($0.097) ($0.100) ($0.102) ($0.105) ($0.108) Operator salary $/hours ($37.00) ($37.93) ($38.87) ($39.84) ($40.84) ($41.86) ($42.91) ($43.98) ($45.08) ($46.21) ($47.36) ($48.55) ($49.76) ($51.00) ($52.28) ($53.59) ($54.93) ($56.30) ($57.71) ($59.15) ($60.63) ($62.14) ($63.70) ($65.29) ($66.92) Geothermal $/therm ($0.95) ($0.974) ($0.998) ($1.023) ($1.049) ($1.075) ($1.102) ($1.129) ($1.157) ($1.186) ($1.216) ($1.246) ($1.278) ($1.310) ($1.342) ($1.376) ($1.410) ($1.446) ($1.482) ($1.519) ($1.557) ($1.596) ($1.635) ($1.676) ($1.718) Natural Gas $/therm ($1.38) ($1.415) ($1.450) ($1.486) ($1.523) ($1.561) ($1.600) ($1.640) ($1.681) ($1.723) ($1.767) ($1.811) ($1.856) ($1.902) ($1.950) ($1.999) ($2.049) ($2.100) ($2.152) ($2.206) ($2.261) ($2.318) ($2.376) ($2.435) ($2.496) Fuel Costs $/gal ($2.75) ($2.819) ($2.889) ($2.961) ($3.035) ($3.111) ($3.189) ($3.269) ($3.351) ($3.434) ($3.520) ($3.608) ($3.698) ($3.791) ($3.886) ($3.983) ($4.082) ($4.184) ($4.289) ($4.396) ($4.506) ($4.619) ($4.734) ($4.853) ($4.974) Siloxane Scrubber Media $/lb ($2.00) ($2.05) ($2.10) ($2.15) ($2.21) ($2.26) ($2.32) ($2.38) ($2.44) ($2.50) ($2.56) ($2.62) ($2.69) ($2.76) ($2.83) ($2.90) ($2.97) ($3.04) ($3.12) ($3.20) ($3.28) ($3.36) ($3.44) ($3.53) ($3.62) H 2S Scubber Media $/cf ($18.76) ($19.23) ($19.71) ($20.20) ($20.71) ($21.23) ($21.76) ($22.30) ($22.86) ($23.43) ($24.02) ($24.62) ($25.23) ($25.86) ($26.51) ($27.17) ($27.85) ($28.55) ($29.26) ($29.99) ($30.74) ($31.51) ($32.30) ($33.11) ($33.93) Cogen 1,000 hour maintenance $/event ($208) ($213) ($219) ($224) ($230) ($235) ($241) ($247) ($253) ($260) ($266) ($273) ($280) ($287) ($294) ($301) ($309) ($316) ($324) ($333) ($341) ($349) ($358) Cogen 3,000 hour maintenance $/event ($615) ($630) ($646) ($662) ($678) ($695) ($713) ($731) ($749) ($768) ($787) ($806) ($827) ($847) ($868) ($890) ($912) ($935) ($959) ($983) ($1,007) ($1,032) ($1,058) Cogen 25,000 hour maintenance $/event ($3,950) ($4,049) ($4,150) ($4,254) ($4,360) ($4,469) ($4,581) ($4,696) ($4,813) ($4,933) ($5,057) ($5,183) ($5,313) ($5,445) ($5,582) ($5,721) ($5,864) ($6,011) ($6,161) ($6,315) ($6,473) ($6,635) ($6,801) Cogen 45,000 hour maintenance $/event ($34,018) ($34,869) ($35,741) ($36,634) ($37,550) ($38,489) ($39,451) ($40,437) ($41,448) ($42,484) ($43,546) ($44,635) ($45,751) ($46,895) ($48,067) ($49,269) ($50,501) ($51,763) ($53,057) ($54,384) ($55,743) ($57,137) ($58,565) Alternative 4 - Hybrid Capital Costs Capital Outlay $ ($2,641,532) Grant $ $ - Biogas Treatment H 2S Scrubber Conditioning Skid Siloxane Scrubber Media cf Media $/yr ($6,062) ($6,213) ($6,369) ($6,528) ($6,691) ($6,858) ($7,030) ($7,206) ($7,386) ($7,570) ($7,760) ($7,954) ($8,152) ($8,356) ($8,565) ($8,779) ($8,999) ($9,224) ($9,454) ($9,691) ($9,933) ($10,181) ($10,436) ($10,697) ($10,964) Labor hr/yr Labor $/yr ($444) ($455) ($466) ($478) ($490) ($502) ($515) ($528) ($541) ($554) ($568) ($583) ($597) ($612) ($627) ($643) ($659) ($676) ($692) ($710) ($728) ($746) ($764) ($783) ($803) Blower Power kw Blower Power Cost $/yr ($1,556) ($1,595) ($1,635) ($1,676) ($1,717) ($1,760) ($1,804) ($1,849) ($1,896) ($1,943) ($1,992) ($2,041) ($2,092) ($2,145) ($2,198) ($2,253) ($2,310) ($2,367) ($2,427) ($2,487) ($2,549) ($2,613) ($2,679) ($2,746) ($2,814) Chiller Power kw Chiller Power Cost $/yr ($1,556) ($1,595) ($1,635) ($1,676) ($1,717) ($1,760) ($1,804) ($1,849) ($1,896) ($1,943) ($1,992) ($2,041) ($2,092) ($2,145) ($2,198) ($2,253) ($2,310) ($2,367) ($2,427) ($2,487) ($2,549) ($2,613) ($2,679) ($2,746) ($2,814) Labor hr/yr Labor $/yr ($296) ($303) ($311) ($319) ($327) ($335) ($343) ($352) ($361) ($370) ($379) ($388) ($398) ($408) ($418) ($429) ($439) ($450) ($462) ($473) ($485) ($497) ($510) ($522) ($535) Media cf Media $/yr ($2,577) ($2,781) ($2,850) ($2,922) ($2,995) ($3,069) ($3,146) ($3,225) ($3,305) ($3,388) ($3,473) ($3,560) ($3,649) ($3,740) ($3,833) ($3,929) ($4,027) ($4,128) ($4,231) ($4,337) ($4,446) ($4,557) ($4,671) ($4,787) ($4,907) Labor hr/yr Labor $/yr ($444) ($455) ($466) ($478) ($490) ($502) ($515) ($528) ($541) ($554) ($568) ($583) ($597) ($612) ($627) ($643) ($659) ($676) ($692) ($710) ($728) ($746) ($764) ($783) ($803) PSA - CO 2 Removal Feed Compressor Power kw PSA Power kw st Stage Compressor Power kw Power Cost $/yr ($7,089) ($7,266) ($7,447) ($7,634) ($7,824) ($8,020) ($8,221) ($8,426) ($8,637) ($8,853) ($9,074) ($9,301) ($9,533) ($9,772) ($10,016) ($10,266) ($10,523) ($10,786) ($11,056) ($11,332) ($11,615) ($11,906) ($12,204) ($12,509) ($12,821) Labor hr/yr Labor $/yr ($1,924) ($1,972) ($2,021) ($2,072) ($2,124) ($2,177) ($2,231) ($2,287) ($2,344) ($2,403) ($2,463) ($2,524) ($2,588) ($2,652) ($2,719) ($2,787) ($2,856) ($2,928) ($3,001) ($3,076) ($3,153) ($3,232) ($3,312) ($3,395) ($3,480) CNG Fueling Equipment Operations Compressor Power hp Dryer Power hp Dispenser Power hp Runtime hrs/yr 1,460 1,460 1,460 1,460 1,460 1,460 1,460 1,460 1,460 1,460 1,460 1,460 1,460 1,460 1,460 1,460 1,460 1,460 1,460 1,460 1,460 1,460 1,460 1,460 1,460 Base Annual Power Cost $/yr ($1,660) ($1,701) ($1,744) ($1,787) ($1,832) ($1,878) ($1,925) ($1,973) ($2,022) ($2,073) ($2,124) ($2,178) ($2,232) ($2,288) ($2,345) ($2,404) ($2,464) ($2,525) ($2,588) ($2,653) ($2,719) ($2,787) ($2,857) ($2,929) ($3,002) Labor hr/yr Labor $/yr ($3,848) ($3,944) ($4,043) ($4,144) ($4,247) ($4,354) ($4,463) ($4,574) ($4,688) ($4,806) ($4,926) ($5,049) ($5,175) ($5,305) ($5,437) ($5,573) ($5,712) ($5,855) ($6,002) ($6,152) ($6,305) ($6,463) ($6,625) ($6,790) ($6,960) Sevice Call $/yr $0 $0 $0 ($6,461) $0 $0 $0 ($7,132) $0 $0 $0 ($7,872) $0 $0 $0 ($8,689) $0 $0 $0 ($9,591) $0 Cogen Engine Operations Engine Rating kwe Biogas Demand (fuel) scfd 54,344 54,344 54,344 54,344 54,344 54,344 54,344 54,344 54,344 54,344 54,344 54,344 54,344 54,344 54,344 54,344 54,344 54,344 54,344 54,344 54,344 54,344 54,344 54,344 54,344 Biogas Supply (fuel) scfd 28,068 28,600 29,490 30,218 30,959 31,712 32,477 33,255 34,047 34,851 35,668 36,499 37,344 38,203 39,077 39,964 40,867 41,784 42,717 43,665 44,629 45,609 46,605 47,617 48,647 Electric Power kwe Thermal Power kwth Radiator hp Glycol Pump hp Lube Oil Pump hp ,000 hour maintenance events events/yr ,000 hour maintenance events $/yr ($1,914) ($1,962) ($2,011) ($2,062) ($2,113) ($2,166) ($2,220) ($2,276) ($2,332) ($2,391) ($2,450) ($2,512) ($2,575) ($2,639) ($2,705) ($2,773) ($2,842) ($2,913) ($2,986) ($3,060) ($3,137) 3,000 hour maintenance events events/yr ,000 hour maintenance events $/yr ($1,885) ($1,933) ($1,981) ($2,030) ($2,081) ($2,133) ($2,187) ($2,241) ($2,297) ($2,355) ($2,414) ($2,474) ($2,536) ($2,599) ($2,664) ($2,731) ($2,799) ($2,869) ($2,941) ($3,014) ($3,090) 25,000 hour maintenance events events/yr ,000 hour maintenance events $/yr ($1,454) ($1,491) ($1,528) ($1,566) ($1,605) ($1,645) ($1,686) ($1,729) ($1,772) ($1,816) ($1,862) ($1,908) ($1,956) ($2,005) ($2,055) ($2,106) ($2,159) ($2,213) ($2,268) ($2,325) ($2,383) 45,000 hour maintenance events events/yr ,000 hour maintenance events $/yr ($6,957) ($7,131) ($7,310) ($7,492) ($7,680) ($7,872) ($8,069) ($8,270) ($8,477) ($8,689) ($8,906) ($9,129) ($9,357) ($9,591) ($9,831) ($10,077) ($10,328) ($10,587) ($10,851) ($11,123) ($11,401) Parasitic Power Cost $/yr ($1,867) ($1,914) ($1,962) ($2,011) ($2,061) ($2,112) ($2,165) ($2,219) ($2,275) ($2,332) ($2,390) ($2,450) ($2,511) ($2,574) ($2,638) ($2,704) ($2,772) ($2,841) ($2,912) ($2,985) ($3,059) ($3,136) ($3,214) ($3,295) ($3,377) Labor hr/yr Labor $/yr ($3,848) ($3,944) ($4,043) ($4,144) ($4,247) ($4,354) ($4,463) ($4,574) ($4,688) ($4,806) ($4,926) ($5,049) ($5,175) ($5,305) ($5,437) ($5,573) ($5,712) ($5,855) ($6,002) ($6,152) ($6,305) ($6,463) ($6,625) ($6,790) ($6,960) Heat Geothermal Power Fueling Heat demand not met by cogen therm/yr 5,970 6,001 5,704 5,568 5,429 5,288 5,144 4,998 4,850 4,700 4,546 4,391 4,232 4,071 3,908 3,742 3,572 3,401 3,226 3,048 2,868 2,684 2,497 2,308 2,115 Base Annual Geothermal $/yr ($5,672) ($5,844) ($5,693) ($5,696) ($5,693) ($5,683) ($5,668) ($5,645) ($5,614) ($5,576) ($5,529) ($5,473) ($5,407) ($5,332) ($5,246) ($5,148) ($5,038) ($4,916) ($4,780) ($4,629) ($4,464) ($4,283) ($4,084) ($3,868) ($3,634) Labor hr/yr Labor $/yr ($481) ($493) ($505) ($518) ($531) ($544) ($558) ($572) ($586) ($601) ($616) ($631) ($647) ($663) ($680) ($697) ($714) ($732) ($750) ($769) ($788) ($808) ($828) ($849) ($870) Power demand not met by cogen kwh/day 5,144 5,225 5,286 5,359 5,433 5,509 5,585 5,663 5,742 5,823 5,905 5,988 6,073 6,159 6,246 6,335 6,425 6,517 6,611 6,706 6,802 6,900 7,000 7,102 7,205 Base Annual Power Cost $/yr ($111,706) ($116,308) ($120,610) ($125,331) ($130,243) ($135,352) ($140,667) ($146,195) ($151,946) ($157,930) ($164,154) ($170,630) ($177,367) ($184,377) ($191,670) ($199,258) ($207,153) ($215,369) ($223,917) ($232,811) ($242,067) ($251,698) ($261,721) ($272,151) ($283,004) Base Vehicles Vehicle Conversion Cost $/yr $0 $0 $0 $0 ($183,992) $0 $0 $0 $0 $0 $0 $0 $0 $0 ($235,526) $0 $0 $0 $0 $0 $0 $0 $0 $0 $0 Base Fuel Demand gpd Base Fuel Cost $/yr ($96,799) ($101,911) ($107,265) ($112,870) ($118,739) ($124,882) ($131,312) ($138,041) ($145,084) ($152,454) ($160,165) ($168,233) ($176,673) ($185,502) ($194,738) ($204,397) ($214,499) ($225,064) ($236,111) ($247,662) ($259,739) Total - Including Above ($3,107,765) ($293,690) ($305,611) ($324,483) ($330,944) ($344,398) ($358,406) ($380,123) ($388,177) ($403,988) ($655,978) ($445,467) ($455,444) ($474,031) ($493,384) ($522,226) ($534,522) ($556,374) ($579,128) ($612,415) ($627,498) Present Value 2009 ($2,556,766) ($2,786,879) ($3,014,931) ($3,245,535) ($3,469,531) ($3,691,534) ($3,911,564) ($4,133,814) ($4,349,965) ($4,564,209) ($4,895,522) ($5,109,799) ($5,318,444) ($5,525,262) ($5,730,273) ($5,936,936) ($6,138,391) ($6,338,097) ($6,536,072) ($6,735,457) ($6,930,024) Cost Estimate O&M Biogas Utilization_rev6.xlsx 3/15/2010 MGT (CDM-PTL) O&M LCC Page 5
154 Appendix E Workshop Materials


155 Biogas Energy Management City of Klamath Falls, OR January 12 th, 2009 Agenda Overview of Biogas Study Alternatives Review Economic Analysis Non-Economic Considerations Grants and Incentives Conclusion and Recommendation 1
 Overview Energy Profile 2008 All values energy demand, except biogas.")
156 Project Goals Reduced O&M costs for STP Beneficial use of biogas Reduced carbon footprint Reduced criteria pollution emissions Success Factors Address payback, financial feasibility and benefit to ratepayers Address risks of alternatives Meet grant parameters (Oregon Economic and Community Development Department) Overview Energy Profile 2008 All values energy demand, except biogas. Biogas is a supply 2

157 Overview Energy Profile 2008 There is approximately 275kW of biogas available for beneficial use All values energy demand, except biogas. Biogas is a supply Overview Alternatives Identification What does 275 kw of biogas get you? System Biogas Conversion Efficiency Potential Output Actual 2008 Avg. Demand Cogeneration (Microturbine Platform) Units Potential Contribution by Biogas, 2008 Electricity 29% kwe 28% Heat 40% kwth 83% Cogeneration (Internal Combustion Engine Platform) Electricity 35% kwe 33% Heat 40% kwth 83% Biogas Boiler Biogas Boiler 80% kwth 166% Biomethane Re-Sale 83% kw 622% Vehicle Fuel 83% 190 N/A GGE N/A 3


158 Overview Microturbine vs Internal Combustion Engine Platform Operating Range Gas Feed, psig Rated Power, kwe Capital Cost 1 $/kw Potential Power, kwe Microturbine 50% to 100% 75 to $206,600 $1, I.C. Engine 60% to 100% $260,000 $1, Does not include added cost of gas treatment Source: Capstone Microturbine Source: Tech3 Solutions Alternative Review Status Quo Heat Geothermal as Primary Natural Gas as Secondary Existing boiler in poor condition, will require replacement Power Pacific Power as Primary AES Solar Installation as Secondary Provide 9.5% of demand Vehicle Fuel Assumed fleet of 66 vehicles (best case scenario) 4


159 Alternative 1 Biogas Boiler New 40 bhp (390 kw) firebox boiler Biogas treatment for moisture, particulates, H 2 S New HWS and HWR piping to heat building spaces Installed in place of existing Uses 55 percent of available biogas Meets 100 percent of average heat demand Source: Proctor Sales Alternative 1 Biogas Boiler 5

160 Alternative 1 Biogas Boiler Alternative 2 Cogeneration New 140 kwe containerized I.C. cogeneration engine New firebox biogas boiler Biogas treatment for moisture, particulates, H 2 S, siloxanes New HWS and HWR piping to heat building spaces and digester Spaced reserved for additional unit Provides 40 percent of facilities power and 95 percent of facilities average heat demand Source: Tech3 Solutions 6


161 Alternative 2 - Cogeneration Alternative 2 - Cogeneration 7


162 Alternative 3 - Biomethane New Biomethane and Vehicle Fueling System 140+ GGE/day (66 vehicles) New Firebox Biogas Boiler Biogas treatment for moisture, particulates, H 2 S, siloxanes, CO 2 Fast-Fill Fill Fueling Station Backup supply from Avista Card Reader for tracking High Pressure CNG storage Source: QuestAir Alternative 3 - Biomethane 8


163 Alternative 3 - Biomethane New 140 kwe containerized I.C. cogeneration engine New Firebox Biogas Boiler Biogas treatment for moisture, particulates, H 2 S, siloxanes New HWS and HWR piping to heat building spaces and digester Small CO 2 removal system- 55 GGE/day (25 vehicles) Alternative 4 - Hybrid Smaller CNG fueling system 65 percent power, 27 percent heat demands 9
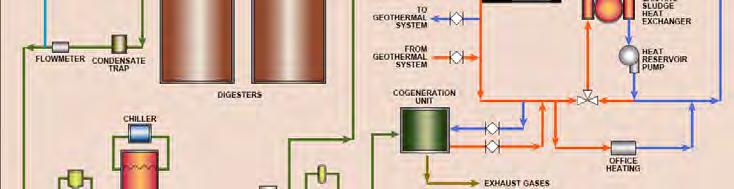


164 Alternative 4 - Hybrid Alternative 4 - Hybrid 10
165 FOG Receiving Grease Haulers in Klamath Falls Hukills A 1 Septic American Sanitation Modoc Services Limited Collection Collection between 3,000 5,000 gallon/month Generation estimated at 35,000 gallon/month Many FSEs lack interceptors or collectors Without substantial source, receiving isn t viable Economic Analysis Cost of Production Alternative Capital Cost Status Quo $400,000 Biogas Boiler $760,000 Cogeneration $1,770,000 Biomethane $2,970,000 Hybrid $2,650,000 Burdened Project Cost: Includes field, home office overhead, contingency, margin, risk insurance, liability insurance, bond, escalation to midpoint construction, design and construction services 11
166 Economic Analysis Net Present Value Option 5 year 10 year 15 year 20 year Biogas Boiler ($120,000) $40,000 $210,000 $360,000 Cogeneration ($740,000) 000) ($350,000) 000) $0 $310, Biomethane ($2,030,000) ($1,560,000) ($1,450,000) ($990,000) Hybrid ($1,540,000) ($1,090,000) ($760,000) ($340,000) Based on 2.5% inflation, 5% discount rate Includes fueling costs for 66 vehicles Does not include any incentives, grants or credits Option Biogas Boiler Breakeven 9 years Cogeneration 15 years Biomethane > 20 Hybrid > 20 Boiler Non-Economic Considerations Operations & Risks Familiar operation Media regeneration once a year Provides space heating Low risk (NG rate already low, dual fuel technology) Cogeneration Relatively simple operation Service packages available Media regeneration once or twice a year Low risk (power rates stable, NG rate already low) Biomethane Unfamiliar technologies Specialized knowledge and service required Media regeneration once or twice a year Higher risk (volatile fuel prices) 12
167 Non-Economic Considerations - Emissions 2,000 CO2 Emissions, tons/yr 1,500 1, Status Quo Biogas Boiler Cogeneration Biomethane Hybrid Non-Economic Consideration Social Acceptance & Odors Odors N/A Noise Cogeneration 70 3feet, 50 feet Biomethane - Truck traffic Traffic Biomethane and Hybrid increase traffic along Spring Street Social No barriers noted Economic justification is key 13

168 Grants and Incentives Source Type Amount Deadlines Comments ARRA/SRF Loan/Grant up to 50% Jan. 8th, May 14th, Sep. 10th Oregon SELP Loan upto $20 million at 5% Continuous Oregon Energy Trust Grant Above market costs Continuous Sell "green tags" Oregon DOE BETC US DOE IRS Tax Credit 35 to 50% of project costs Tax Credit $0.50/gallon Continuous Expires Dec. 31st, renewal expected Pass through portion being reevaluated Per gallon generated US DOE IRS Tax Credit $50,000 Expires Dec. 31st, renewal expected Installation of Alternative Fueling Station Thank you Janelle Rogers Cale McPherson 14
169 Economic Analysis Net Present Value High Energy Prices Sensitivity Option 5 year 10 year 15 year 20 year Biogas Boiler ($90,000) $130,000 $380,000 $670,000 Cogeneration ($660,000) 000) ($150,000) 000) $390, $940, Biomethane ($1,940,000) ($1,300,000) ($920,000) ($110,000) Hybrid ($1,450,000) ($840,000) ($280,000) $480,000 Based on 2.5% inflation, 5% inflation of energy prices, 5% discount rate Includes fueling costs for 66 vehicles Does not include any incentives, grants or credits Option 5 year 10 year 15 year 20 year Biogas Boiler ($120,000) $40,000 $210,000 $360,000 Cogeneration ($740,000) ($350,000) $0 $310,000 Biomethane ($2,030,000) ($1,560,000) ($1,450,000) ($990,000) Hybrid ($1,540,000) ($1,090,000) ($760,000) ($340,000) Economic Analysis Net Present Value High Power Prices Sensitivity Option 5 year 10 year 15 year 20 year Biogas Boiler ($120,000) $30,000 $180,000 $340,000 Cogeneration ($670,000) 000) ($170,000) 000) $310, $740, Biomethane ($2,050,000) ($1,660,000) ($1,610,000) ($1,210,000) Hybrid ($1,500,000) ($990,000) ($590,000) ($80,000) Based on 2.5% inflation & 10% for 5 years, 5% for 5 years, 2.5% for 10 years for power, 5% discount rate Includes fueling costs for 66 vehicles Does not include any incentives, grants or credits Option 5 year 10 year 15 year 20 year Biogas Boiler ($120,000) $40,000 $210,000 $360,000 Cogeneration ($740,000) ($350,000) $0 $310,000 Biomethane ($2,030,000) ($1,560,000) ($1,450,000) ($990,000) Hybrid ($1,540,000) ($1,090,000) ($760,000) ($340,000) 15
170 Economic Analysis Net Present Value High Vehicle Fuel Prices Sensitivity Option 5 year 10 year 15 year 20 year Biogas Boiler ($120,000) $40,000 $210,000 $370,000 Cogeneration ($740,000) ($350,000) $0 $320,000 Biomethane ($1,930,000) ($1,270,000) ($880,000) ($40,000) Hybrid ($1,500,000) ($980,000) ($570,000) ($30,000) Based on 2.5% inflation, 5% inflation of vehicle fuel, 5% discount rate Includes fueling costs for 66 vehicles Does not include any incentives, grants or credits Option 5 year 10 year 15 year 20 year Biogas Boiler ($120,000) $40,000 $210,000 $360,000 Cogeneration ($740,000) ($350,000) $0 $310,000 Biomethane ($2,030,000) ($1,560,000) ($1,450,000) ($990,000) Hybrid ($1,540,000) ($1,090,000) ($760,000) ($340,000) Economic Analysis Grant Funding/Incentive Sensitivity 16
171 Economic Analysis Present Value Option 5 year 10 year 15 year 20 year Status Quo ($2,110,000) ($4,040,000) ($6,140,000) ($8,420,000) Biogas Boiler ($2,200,000) ) ($3,910,000) 000) ($5,760,000) 000) ($7,750,000) ) Cogeneration ($2,770,000) ($4,190,000) ($5,750,000) ($7,480,000) Biomethane ($4,050,000) ($5,340,000) ($7,060,000) ($8,530,000) Hybrid ($3,560,000) ($4,880,000) ($6,420,000) ($7,940,000) Based on 2.5% inflation, 5% discount rate Includes fueling costs for 66 vehicles 17
172 Appendix F CNG Vehicle Conversion
173 CNG Vehicle Conversion Conversion of vehicles to operate on CNG is regulated by the U.S. Environmental Protection Agency (EPA). The EPA has regulatory jurisdiction over vehicle conversion because converting a vehicle s engine to operate on an alternative fuel will impact the vehicle s emissions and the onboard diagnostic system designed to monitor a vehicle s emissions. While CNG vehicle conversion kits are readily available for all types of makes and models of vehicles, only a limited number of these kits hold EPA certifications, most notably those produced by the Baytech Corporation and BAF Technologies. Conversion kits that lack this certification, while often significantly cheaper, cannot be legally installed in vehicles that will be used on public roads. Further, these vehicles would not be eligible for the Qualified Alternative Fuel Motor Vehicle (QAFMV) tax credit allotted under Section 30B(e)(5) of the IRS tax code. Vehicle conversion kits that are approved by the EPA are done so on a yearly basis for specific makes and models of vehicles. Once the kit is approved, the kit manufacturer will team up with local dealerships and installers to retrofit new vehicles to meet consumer demand. The conversion cost for a vehicle can vary substantially depending on the vehicle make and model; however, they typically start in the $12,000 to $18,500 range. For instance, conversion of a 2009 Ford F-150 or F-250 was quoted at $17,500 plus $975 for delivery. While this cost is substantial, it should be noted that tax credits are available to help offset the cost. In 2009, the tax credit for a converted Ford F-150 would be $11,600, for a net conversion cost of $6,875 ($17,500 + $975 - $11,600 = $6,875). For tax exempt entities, such as the City of Klamath Falls, the tax credit is usually realized through a purchase and selling agreement with the supplying vehicle dealership which will reflect the tax credit in a reduced vehicle cost. The number and types of vehicles currently approved for conversion by the EPA is limited and changes yearly. A list of the vehicles and manufacturers currently holding EPA certifications for the year 2009 has been included for reference. A preliminary review of the vehicles owned by the City suggests that approximately 90 vehicles would be candidates for replacement with a CNG vehicle when a new vehicle is purchased. Most of these vehicles are the Ford F-150, F-250 and F-350 models.
174 Guide to Available Natural Gas Vehicles and Engines a listing of Light-, Medium- and Heavy-Duty Vehicles and/or Engines available directly from Original Equipment Manufacturers (OEM) or via Qualified System Retrofitters Using EPA-/CARB-Certified Systems from Small Volume OEMs (SVM) updated 7/22/2009 Read page 2 "How to Use This Guide" before proceeding further
175 How to Use This Guide On the following pages, NGVAmerica has assembled information about vehicles and/or engines that have been certified by the US Environmental Protection Agency (EPA) and/or California Air Resources Board (CARB) to operate on natural gas, either as (1) dedicated vehicles - spark-ignited engine operates on natural gas only, (2) bi-fuel vehicles - spark-ignited engine operates on either compressed natural gas (CNG) or gasoline, but not both at same time, or (3) dual-fuel vehicles - compression-cycle engine operates primarily on natural gas but uses diesel as ignition "pilot".* Generally, CARB has more stringent emissions and on-board diagnostics (OBD) compliance requirements than EPA. Other differences between the two sets of standards is that EPA classifies vehicles under 8500 pounds GVW as light duty and those over as heavy-duty while CARB's light duty classification goes up to 10,000 pounds. While most states require certification to EPA statndards, a growing number of states are opting to adopt CARB standards for new registered vehicles. Check with your state officials to determine whether CARB standards for aftermarket vehicles have been adopted in your state; otherwise EPA standards apply. This Guide's list of light -duty vehicles includes those manufactured at the factory by traditional Original Equipment Manufacturers (OEMs) such as American Honda, and those retrofit with EPA- or CARB-certified engine systems after leaving the factory using systems made by Small Volume Original Equipment Manufacturers (SVMs). Furthermore, SVM engine retrofit systems may be installed before placing the vehicle into active service or afterward. System installations are usually handled by the SVMs themselves or their Qualified System Retrofitters. Note that, unlike the unregulated "conversion kits" that were available from dozens of manufacturers in the late-1970s through the mid-1990s, all gaseous fuel engine systems on the market today are engineered and tested to comply with the same tough CARB and/or EPA emissions performance requirements as the large automobile manufacturers. Also note that EPA and CARB certifications of light-duty vehicle retrofit systems are for specific model years and installation time-periods. Only ACTIVE CERTIFICATIONS are listed on the chart starting on page 3. Some SVMs also hold certifications from previous years but these may not have been "carried forward" as required by EPA if the installation time period for the model year for which the cert was issued has now passed. Those interested in converting an existing vehicle should check with the SVMs about whether these prior year certifications have been renewed. Most have not been carried forward more than a year or two from the original model year in which they were issued. The Guide's list of medium- and heavy-duty engines is sorted by engine size (defined by displacement) and - for the Otto-cycle (gasoline) based engines - the vehicle chassis to which those engine retrofit systems apply (per EPA and CARB rules concerning modifications to gasoline-based engines). For the diesel-based engine platforms, we have attempted to list the OEM or Distributor OEM (DOEM) relationships to which they apply but readers are advised that these engines are also permitted to be field-retrofit by engine-system integrators to additional platforms. Contact the engine manufacturer to get a full listing of available applications.. *When new engines are EPA- or CARB-certified to run on hydrogen (H2) or hydrogen-cng blends (generically referred to as "HCNG"), these engines will be added to the listing. As of this revision of the guide (1/1/2009), H2 and HCNG engines were being tested/monitored in various field RD&D trials but none had yet been certified for general commercial sale. This Guide is a work product of NGVAmerica and not an official government document - any omissions or errors are inadvertent. If notified of errors or omissions, NGVAmerica will do its best to verify certifications and correct this listing as quickly as possible.
176 Engine/Vehicle Certifications (Vehicles over 14,000# GVWR) BAF Technologie See Light-Duty Vehicle charts for additional listings by BAF Technologies 6.8L V-10 (spark-ignited) Dedicated CNG retrofit of Ford gasoline engine with CARB/EPA certifications covering: MY'08, 09 E450 series cutaway chassis for shuttles, box trucks, etc. (See also - chart of vehicles up to 14,000# for more BAF Technologies retrofit system certifications) Baytech CorporatSee Light-Duty Vehicle charts for additional listings by Baytech Corporation 6.0L HD (spark-ignited) Dedicated and bi-fuel CNG retrofit of GM gasoline engine with CARB/EPA certifications covering: MY '09 Chevrolet W4500 "cab-over" truck chassis; Isuzu NPR HD "cabover" truck chassis; Workhorse W42 walk-in van chassis (over 14,000#) Dedicated CNG retrofit of GM gasoline engine with CARB/EPA certifications covering : G4500 cutaway; (See also - chart of vehicles up to 14,000# for more Baytech Corporation retrofit system certifications for 6.0L GM engine) 8.1L (spark-ignited) Dedicated CNG and bi-fuel retrofit of GM gasoline engine with CARB/EPA certifications covering: MY '07 (if low mileage), '08 and '09 C4500/5500 cutaway chassis; C4500/5500/6500/7500/8500 Topkick/Kodiak conventional truck chassis; Workhorse W62 walk-in van chassis. Cummins Westport Inc 5.9L B Gas Plus(spark-ignited) Dedicated natural gas engine based on Cummins ISB diesel platform; HP; medium-duty applications such as shuttles, buses, delivery trucks, walk-in vans, yard spotters, and street sweepers. Ex: Freightliner Custom Chassis Corp (FCCC) MT45/MT55 walk-in van chassis and MB55 shuttle bus chassis (upfit by multiple vendors); Buses by Blue Bird, Optima, El Dorado National; Sweepers by Tymco, Elgin, Allianz-Johnston and Schwarze (various models).this engine is slated to remain in production thru Dec 31, L ISL G (spark-ignited) Dedicated natural gas engine based on Cummis ISL diesel platform; 2010-compliant (.2 NOx and.01pm): HP ratings of 250, 260, 280, 300, 320; replaced CWI's C Gas Plus and L Gas Plus engine lines in June Available in: LCF refuse trucks by Peterbilt, Crane-Carrier, Autocar, American LaFrance Condor and Mack; Type D/4 school buses by Thomas Built (Saf-T-Liner HDX) and Blue Bird (All American RE); transit buses by New Fklyer, NABI and Orion; work trucks (Sterling "L" setback 113 tractor trucks ordered by Jan 1, 2009; Freightliner M2 tractor trucks available June 2009 and M2 112 straight truck orders taken year-end 2009); port "yard hostlers" by Ottawa and Capacity. Generally, CWI does not repower existing diesel vehicles, and instead, sells thru bus and truck OEMs and their dealers. There are exceptions to this general rule including some transit applications - contact your dealer or your regional CWI sales manager for more information. Emission Solutions Inc 7.6L NG Phoenix (spark ignited) Dedicated natural gas engine based on International-Navistar DT466 (# valve) diesel platform, remanufactured to natural gas operational specifications; EPA-/CARBcertified 2010-compliant at.2nox and.01pm; 260 HP, 730 ft-lb torque; Engine/fuel system change-out for existing diesel International DT466-equipped school buses, medium-/medium-heavy-duty and heavy-duty cutaway shuttles and work trucks. Also EPA-/CARB-certified 2010-compliant for repower of International-Navistar MaxxForce DT (#316, # valve) version of same engine with 300Hp and 860 ft.-lb torque. (Additional development/ certifications in process for Phoenix 9.3L 350Hp and 1200 ft,.lb torque based on MaxxForce 10 diesel platform) Westport Innovations 15L GX (compression ignited) Dual-fuel High Pressure Direct Injection (HPDI) system engine runs on 95% natural gas with 5% diesel pilot fuel; The GX is based on Cummins ISX diesel platform; CARB/EPA-certified, available up to 450Hp configuration for HD work truck and line-haul applications (including OEM installation by Kenworth in May 2009 and Peterbilt June 2009);
177 Spark-Ignited Natural Gas (SING) Vehicles Up to 14,000# (Active Certifications Only) Page 1 (Engine/vehicle listings below refer to EPA and/or CARB certificate holders; some companies listed below may also install other SVM's systems) Small Volume OEM (SVM) Vehicles (CONVERSIONS VIA SVMs AND/OR THEIR QUALIFIED SYSTEM RETROFITTERS) Baytech Corporation BAF Technologies Fuel Tek Corporation IMPCO Technologies Natural Drive Altech-Eco Bi-Fuel /Ded. EPA (E)/ CARB (C) Model Year(s) Bi-Fuel /Ded. Engine Make Model GM3.5L Chevy Impala Bi-Fuel E 08/09 Ded. E 08/09 GM3.9L Chevy Impala Bi-Fuel E 08/09 Ded. E 08/09 GM4.8L Chevy Express pasenger/cargo Van G1500 Bi-Fuel E 08/09 GM4.8L Chevy Express Passenger/Cargo Van G2500 B-Fuel E 09 GM4.8L Chevy Express Passenger/Cargo Van G2500 Ded. E/C 09 GM5.3L Chevy Silverado C/K1500 2WD/4WD pick-up Bi-Fuel E 09 GM5.3L Chevy Tahoe C/K1500 2WD/4WD Bi-Fuel E 09 GM5.3L Chevy Avalanche Bi-Fuel E 09 GM5.3L Chevy Suburban Bi-Fuel E 09 GM6.0L Chevy Express Passenger/Cargo Van G1500 Bi-Fuel E 07/08/09 GM6.0L Chevy Express Passenger/Cargo Van G2500 Bi-Fuel E 09 Bi-Fuel E 07/08/09 GM6.0L Chevy Express Passenger/Cargo Van G2500 Ded. E/C 09 GM6.0L Chevy Express Passenger/Cargo Van G3500 Bi-Fuel E 09 Bi-Fuel E 07/08/09 GM6.0L Chevy Express Passenger/Cargo Van G3500 Ded. E/C 09 GM6.0L Chevy Express Cutaway G3500 Bi-Fuel E 09 GM6.0L Chevy Express Cutaway G3500 Ded. E/C 09 GM6.0L Chevy Express Cutaway G4500 (14,200# GVWR) Ded. E/C 09 GM6.0L Chevy Silverado C/K1500 2WD/4WD pick-up Bi-Fuel E 07/08/09 GM6.0L Chevy Silverado C/K2500 HD 2WD/4WD pick-up Bi-Fuel E 09 Bi-Fuel E 07/08/09 GM6.0L Chevy Silverado C/K2500 HD 2WD/4WD pick-up Ded. E/C 09 GM6.0L Chevy Silverado C/K3500 2WD/4WD pick-up Bi-Fuel E 09 Bi-Fuel E 07/08/09 GM6.0L Chevy Silverado C/K3500 2WD/4WD pick-up Ded. E/C 09 GM6.0L Chevy Silverado C/K2500HD 2WD/4WD cab-chassis Bi-Fuel E 09 Bi-Fuel E 07/08/09 GM6.0L Chevy Silverado C/K2500 HD 2WD/4WD cab-chassis Ded. E/C 09 GM6.0L Chevy Silverado C/K3500 HD 2WD/4WD cab-chassis Bi-Fuel E 09 Bi-Fuel E 07/08/09 GM6.0L Chevy Silverado C/K3500 HD 2WD/4WD cab-chassis Ded. E/C 09 GM6.0L Chevy W3500 cab-over truck chassis Bi-Fuel E 9 GM6.0L Chevy W3500 cab-over truck chassis Ded. E/C 08/09 GM4.8L GMC Savana Passenger/Cargo Van G1500 Bi-Fuel E 08 GM4.8L GMC Savana passenger/cargo Van G2500 Bi-Fuel E 09 GM4.8L GMC Savana passenger/cargo Van G2500 Ded. E/C 09 GM5.3L GMC Sierra C/K WD/4WD Bi-Fuel E 09 GM5.3L GMC Yukon, Yukon XL Bi-Fuel E 09 GM6.0L GMC Savana Passenger/Cargo Van G1500 Bi-Fuel E 07/08/09 GM6.0L GMC Savana passenger/cargo Van G2500 Bi-Fuel E 09 Bi-Fuel E 07/08/09 GM6.0L GMC Savana passenger/cargo Van G2500 Ded. E/C 09 GM6.0L GMC Savana Passenger/Cargo Van G3500 Bi-Fuel E 09 Bi-Fuel E 07/08/09 GM6.0L GMC Savana Passenger/Cargo Van G3500 Ded. E/C 09 GM6.0L GMC Savana Cutaway G3500 Bi-Fuel E 09 Continued on next page EPA (E)/ CARB (C) Model Year(s) Bi-Fuel /Ded. EPA (E)/ CARB (C) Model Year(s) Bi-Fuel /Ded. EPA (E)/ CARB (C) Model Year(s) Bi-Fuel /Ded. EPA (E)/ CARB (C) Model Year(s) Bi-Fuel /Ded. EPA (E)/ CARB (C) Model Year(s)
178 Spark-Ignited Natural Gas (SING) Vehicles Up to 14,000# (Active Certifications Only) Page 2 (Engine/vehicle listings below refer to EPA and/or CARB certificate holders; some companies listed below may also install other SVM's systems) Small Volume OEM (SVM) Vehicles (continued) (CONVERSIONS VIA SVMs AND/OR THEIR QUALIFIED SYSTEM RETROFITTERS) Baytech Corporation BAF Technologies Fuel Tek Corporation IMPCO Technologies Natural Drive Altech-Eco Bi-Fuel /Ded. EPA (E)/ CARB (C) Engine Make Model GM6.0L GMC Savana Cutaway G3500 Ded. E/C 09 GM6.0L GMC Savana Cutaway G4500 (14,200# GVWR) Ded. E/C 09 GM6.0L GMC Sierra C1500HD Bi-Fuel E 07/08/09 GM6.0L GMC Sierra C/K2500 HD 2WD/4WD pick-up Bi-Fuel E 09 Bi-Fuel E 07/08/09 GM6.0L GMC Sierra C/K2500 HD 2WD/4WD pick-up Ded. E/C 09 GM6.0L GMC Sierra C/K3500 2WD/4WD pick-up Bi-Fuel E 09 Bi-Fuel E 07/08/09 GM6.0L GMC Sierra C/K3500 2WD/4WD pick-up Ded. E/C 09 GM6.0L GMC Sierra C/K2500HD 2WD/4WD cab-chassis Bi-Fuel E 09 Bi-Fuel E 07/08/09 GM6.0L GMC Sierra C/K2500HD 2WD/4WD cab-chassis Ded. E/C 09 GM6.0L GMC Sierra C/K3500HD 2WD/4WD cab-chassis Bi-Fuel E 09 Bi-Fuel E 07/08/09 GM6.0L GMC Sierra C/K3500HD 2WD/4WD cab-chassis Ded. E/C 09 GM6.0L GMC W3500 cab-over truck chassis Bi-Fuel E 09 GM6.0L GMC W3500 cab-over truck chassis Ded. E/C 08/09 GM6.0L Isuzu NPR cab-over truck chassis (up to 14,000#) Bi-Fuel E 09 GM6.0L Isuzu NPR cab-over truck chassis (up to 14,000#) Ded. E/C/ 08/09 GM6.0L Workhorse W42 walk-in/step-van truck (up to 14,000#) Bi-Fuel E/C 09 GM6.0L Workhorse W42 walk-in/step-van truck (up to 14,000#) Ded. E/C 08/09 Model Year(s) Bi-Fuel /Ded. EPA (E)/ CARB (C) Model Year(s) Bi-Fuel /Ded. EPA (E)/ CARB (C) Model Year(s) Bi-Fuel /Ded. EPA (E)/ CARB (C) Model Year(s) Bi-Fuel /Ded. EPA (E)/ CARB (C) Model Year(s) Bi-Fuel /Ded. EPA (E)/ CARB (C) Model Year(s) Ford2.0L Ford Focus Bi-Fuel E 08/09 Ford2.0L Ford Focus Ded. E 08/09 Ford2.3L Ford Fusion Bi/Ded E 09 Ford4.6L Ford Crown Victoria Ded. E/C 07/08/09 Ford5.4L Ford Expedition Ded. E/C 08/09 Ford5.4L Ford F 150 pick-up + cab-chassis Ded. E/C 08/09 Ford5.4L Ford F 250 pick-up + cab-chassis Ded. E/C 08/09 Bi-Fuel E 08 Ford5.4L Ford F350 pick-up + cab-chassis (up to 13K GVWR) Ded. E/C 08/09 Bi-Fuel E 08 Ford5.4L Ford E-150 Passenger/Cargo Van Bi-Fuel E 08 Ford5.4L Ford E-250 Passenger/Cargo Van Ded. E/C 08/09 Bi-Fuel E 08 Ford5.4L Ford E-350 Passenger/Cargo Van/Club Wagon Ded. E/C 07/08/09 Bi-Fuel E 08 Ford6.8L Ford E-450 Cutaway (may exceed 14,000#) Ded. E/C 08/09 Ford4.6L Lincoln Town Car Ded. E/C 07/08/09 Ford5.4L Lincoln Navigator Ded. E/C 08/09 Ford2.3L Mercury Milan Bi/Ded E 09 Ford4.6L Mercury Grand Marquis Ded. E/C 07/08/09 Original Equipment Manufacturer (OEM) Vehicles (NO CONVERSIONS) Engine Make Model ( ) () Bi-Fuel /Ded. EPA (E)/ CARB (C) Honda 1.8L Honda Civic GX Ded. E/C Model Year(s)
179 Contacts Company Address Name Telephone Altech-Eco 101 Fair Oaks Road, Arden, NC Par Neiburger American Honda Motor Co Torrance Blvd, MS 100-3C-3A, Torrance, CA Eric Rosenberg BAF Technologies 2415 Beatrice Street, Dallas, TX Bill Calvert Baytech Corporation PO Box 1148, Los Altos, CA Richard Turner Cummins Westport Inc West 75th Ave., #101, Vancouver, BC V6P 6G2 Jeff Campbell Emission Solutions Inc Central Circle, Ste 106, McKinney TX Jim Moore FuelTek Conversion Corp 5660 E. 58th Avenue, Unit B, Commerce City, CO Holly Biggers IMPCO Technologies 3030 South Susan Street, Santa Ana, CA Jim Sherouse NaturalDrive 3134 West Lewis - Suite 44, Phoenix, AZ John Mitton john@naturaldrive.com Westport Innovations 1750 West 75th Ave., #101, Vancouver, BC V6P 6G2 Jonathan Burke jburke@westport.com. SEE ALSO for more information PLEASE, DO NOT CONTACT HONDA FOR CONVERSION SYSTEMS - THEY OFFER AN OEM VEHICLE ONLY PLEASE, DO NOT CONTACT NGVAMERICA TO ASK WHY A RETROFIT SYSTEM IS NOT AVAILABLE FOR YOUR MAKE/MODEL YEAR (WE DO NOT CONTROL/INFLUENCE OEM's/SVM's R&D AND EPA/CARB CERTIFICATION DECISIONS) PLEASE, DO NOT CALL/ NGVAMERICA QUESTIONING EPA/CARB CERTIFICATION REQUIREMENTS AND COSTS. WE DO NOT REPRESENT EPA NOR CARB. WE INFORM PROSPECTIVE PURCHASERS OF THE APPLICABLE LAWS AND REQUIREMENTS For more information, please contact:.
180 Appendix G Grant and Incentive Funding
181 State or Federal PROGRAM NAME REFERENCE # DEADLINE TOTAL FUNDING AWARD FLOOR/ CEILING ELIGIBLE APPLICANTS ELIGIBLE PROJECTS Cost- Sharing AGENCY CONTACT Biogas Boiler Eligible? Cogeneration Eligible? Biogas CNG Vehicle Fuel Eligible? Hybrid Eligible? Federal Alternative Fuel Excise Tax Credit State Business Energy Tax Credit Continuous. Rolling application period N/A Under current A tax credit in the amount of law, this $0.50 per gallon is available incentive expires for alternative fuels December 31, 2009, except in the case of the credit for liquefied hydrogen, which expires Upto 50% of eligible project costs Does not specify Upto 50% of eligible project costs A tax incentive is available for Compressed natural gas (based on 121 cubic feet), liquefied natural gas, alternative fuel that is sold for use liquefied petroleum gas, liquefied hydrogen, P-Series fuel, liquid fuel derived or used as a fuel to operate a from coal through the Fischer-Tropsch process, and compressed or liquefied gas motor vehicle. Tax exempt entities derived from biomass. such as state and local governments that dispense qualified fuel from an on-site fueling station for use in vehicles qualify for the incentive. Eligible entities must be registered with the Business and public agencies. Taxexempt entites must use a pass- energy efficiency projects Renewable energy projects that use solar, wind, hydro, biomass (biogas). High through partner. A pass through partner purchases the tax credit with a lump sum cash payment Y Y U.S. Department of rogs/view_ind_fed.php/afdc/319/0 Treasury Oregon Department of CONS/BUS/BETC.shtml Energy NO - Does not meet project specifications NO - Does not meet project specifications YES NO - Does not meet project specifications No YES No YES State Climate Trust Continuous. Rolling application period Costs above the market rate for energy Costs above the market rate for energy Public and private ventures Projects must offset a minimum of 50,000 metric tons of carbon dioxide over their project life. Y The Climate Trust Peter Weisberg (503) x207 No No No No Federal Federal Federal Federal Business Energy Investment Tax Credit (ITC) Energy Efficient Commercial Buildings Tax Deduction EPA 2010 State Innovation Grants Federal Loan Guarantees for Projects that Employ Innovative Energy Efficiency, i Renewable Energy and Advanced Transmission and Distribution Technologies N/A credits are The credit is equal to 30% of available for the project costs for most eligible systems technologies. The credit is placed in service equal to 10% of the cost of on or before projects involving December 31, geothermal heat pumps, 2016 microturbines and CHP systems. N/A Expires Deductions are taken in the year when construction is completed. N/A The 2010 State Innovation Grant Competition will open soon. DE-FOA Rolling, every 60 days, first round due 9/14/09; last round due 8/24/10 $0.30-$1.80 per square foot served by energy efficient systems Does not specify Commercial, Industrial, Utility Solar Water Heat, Solar Space Heat, Solar Thermal Electric, Solar Thermal Process Heat, Photovoltaics, Wind, Biomass, Geothermal Electric, Fuel Cells, Geothermal Heat Pumps, CHP/Cogeneration, Solar Hybrid Lighting, Direct Use Geothermal, Microturbines Does not specify Commercial, Builder/Developer, State Government, Fed. Government, (Deductions associated with tax-exempt buildings are transfered to the designer) $1.4 to $0.8 million $375,000 to $50,000 State environmental agencies or an agency in a state with a redelegated permitting authority from the primary state agency (e.g., a regional water or air quality management board) $8.5 billion 80% of project costs; program focuses on projects over $25 million Commercial, Industrial, Nonprofit, Schools, Local Government, State Government, Agricultural, l Institutional, Any non-federal entity Cogeneration systems up to 50 MW in capacity that exceed 60% energy efficiency are eligible for this tax credit. CHP systems that use biomass for 90% of the energy source can have an energy efficiency less than 60%, but the credit may be reduced for less-efficient systems. The cogeneration system must be operational in the first year in which the credit is taken. Taxpayers eligible for Equipment Insulation, Water Heaters, Lighting, Lighting Controls/Sensors, Chillers, Furnaces, Boilers, Heat pumps, Air conditioners, Caulking/Weatherstripping, Duct/Air sealing, Building Insulation, Windows, Doors, Siding, Roofs, Comprehensive Measures/Whole Building A tax deduction of $1.80 per square foot is available to owners of new or existing buildings who install (1) interior lighting; (2) building envelope, or (3) heating, cooling, ventilation, or hot water systems that reduce the building s total energy and power cost by 50% or more in comparison to a building meeting minimum requirements set by ASHRAE Standard The deduction is limited to Projects that promote the testing of innovative approaches in state permitting programs that strive to create a more performance-based regulatory system, promote environmental stewardship and beyond-compliance business operation, and/ or promote a culture of creative environmental problem solving. To date, the program has supported projects primarily in three strategic focus areas: application of the Environmental Results Programs (ERP) model, demonstrations of various types of permitting integration including the integration of Environmental Management Systems (EMS) into permitting requirements, and performance-based environmental leadership programs similar to the National Environmental Performance Track (PT) program. Has been used in the past at Biomass, Geothermal, Solar, Wind, Hydropower and Efficient Electricity Transmission, Distribution and Storage manufacturing or stand-alone projects that t incorporate "New or Significantly ifi Improved Technologies" that t are not commercial technologies in general use. Technologies are considered in general use if they have been installed and operating for five years in three or more commercial applications. Applicable projects must commence construction by September 30, 2011 and must create or retain jobs in the US Y IRS U.S. Department of Treasury s/incentive.cfm?incentive_code= US02F cludes/incentive2.cfm?incentive_ Code=US40F&State=federal&cur rentpageid=1&ee=1&re=1 N EPA nts/currentcompetition.htm Y DOE ren-energy-sol.pdf YES YES NO - Does not meet project specifications YES - if equipment meets eligibility requirements, although it may only be a partial deduction YES - if equipment meets eligibility requirements, although it may only be a partial deduction NO - Does not meet project specifications YES YES - if equipment meets eligibility requirements, although it may only be a partial deduction YES YES YES YES YES YES YES YES
182 Federal Federal Global Climate Change Mitigation Incentive Fund (GCCMIF) IRS - Clean Renewable Energy Bonds N/A N/A Applications for GCCMIF assistance on a continuing basis by applying under the appropriate EDA federal funding opportunity (FFO) $250 million comes out at the beginning of the fiscal year budget allocation (on Oct. 1) and lasts until Sept 30 or until funds run out. First come, first serve, so it's important to apply as soon after Oct. 1 as possible. No deadline 0% interest bond typically specified by the between $50,000 and $10 law, however million applications are due on August 4, 2009 for the current round of bonds no floor or ceiling, but projects have in State and local governments, the past typically been awarded $1-1.5 utilities, possibly industrial. Priority million a piece given to distressed communities Project Type: Renewable energy Energy efficiency Reuse/recycling/restoration Green building Project Output: Development and/or manufacture of a green end-product Greening of an existing function or process Creation or renovation of a green building Does not specify State and local governments Eligible technologies include solar thermal electric, photovoltaics, landfill gas, wind, biomass, hydroelectric, geothermal electric, municipal solid waste, hydrokinetic power, anaerobic digestion, tidal energy, wave energy, and ocean thermal. Available to public entities, or borrowers, that pay back the principal of the bond, while the bondholder recieves tax credits instead of interest from the borrower. Borrowers must apply to the IRS for a bond allocation. The bond must be issued within 3 years of recieving notification of an approved allocation. Y US Department of Commerce- Economic Development Administratio n (EDA) /documents/eda_gccmif.pdf Robin Cooley 1835 Assembly Street, Suite 1075 Columbia, SC T: (803) rcooley@eda.doc.gov Y IRS pdf YES YES YES YES YES YES YES YES Federal IRS - Qualified Energy Conservation Bonds N/A None set by the law 0% interest bond that varies based on state and local population Does not specify State and local governments Eligible technologies include solar thermal electric, photovoltaics, landfill gas, wind, biomass, hydroelectric, geothermal electric, municipal solid waste, hydrokinetic power, anaerobic digestion, tidal energy, wave energy, and ocean thermal. Similar to CREBs in that borrowers pay back the principal of the bond, while the bondholder recieves tax credits instead of interest from the borrower. QECBs are different from CREBs in that the bond volume was allocated to each state based on population and then each state is suppose to allocation to local municipalities. ARRA increased the allowable bond volume to $3.2 billion. In April 2009, IRS provided interim guidance on the program and bond allocations. Y IRS YES YES YES YES Federal Recovery Act - Energy Efficiency and Conservation Block Grants - Formula Grants (EECBG) Federal U.S. Department of Treasury - Renewable Energy Grants State Oregon Incentives and Laws Alternative Fuel Production and Infrastructure Tax Credit DE-FOA /10/2009 (revolving annually) N/A 1-Oct-11 The grant is equal to 30% of the project costs for most technologies. The grant is equal to 10% of the cost of projects involving geothermal heat pumps, microturbines and CHP systems. Reference none Oregon Revised Statutes , , , and State Alternative Fuel Loans Reference Oregon Revised Statutes none $2.744 billion Allocated by population State and local governments, territories and Indian Tribes Does not specify Commercial, Industrial, Agricultural The applicant is not a federal, state or local government, or any political subdivision, agency or instrumentality thereof; an organization that is described in section 501(c) of the IRC and is exempt from tax under section 501(a) of the IRC; or an entity 1) Be a trade, business, or rental property owner with a business site in Oregon or be an Oregon nonprofit organization, tribe, or public entity that partners with an Oregon business or resident; 2) Own or be the contract buyer of the project; and 3) Use the equipment or lease it to another person or business in Creating and implementing strategies to: reduce fossil fuel emissions in a manner that is environmentally sustainable and that maximizes benefits for local and regional communities; reduce total energy use of eligible entities and improve energy efficiency in the building sector, the transportation sector, and other appropriate sectors. Implement programs that: 1. Contribute to meaningful and sustainable market transformation (are broadly replicable and scalable and/or bring a significant benefit to other units of local government and State-recognized Indian tribes through the successful execution of an outcome or deliverable) 2. Highly leverage DOE financial assistance to achieve significant energy and cost savings Solar Water Heat, Solar Space Heat, Solar Thermal Electric, Solar Thermal Process Heat, Photovoltaics, Landfill Gas, Wind, Biomass, Hydroelectric, Geothermal Electric, Fuel Cells, Geothermal Heat Pumps, Municipal Solid Waste, CHP/Cogeneration, Solar Hybrid Lighting, Hydrokinetic, Anaerobic Digestion, Tidal Energy, Wave Energy, Ocean Thermal, Microturbines This cash grant may be taken instead of receiving the Investment Tax Credit (ITC) or the Renewable Electricity Production Tax Credit (PTC). Grants are available for systems placed in service in 2009 or 2010, or for projects that initiate construction in 2009 or 2010 that are placed in service by January 1, Business owners and others who invest in alternative fuel production and fueling infrastructure projects in Oregon may be eligible for a tax credit of up to 50% of eligible project costs through the Business Energy Tax Credit. Some projects (e.g., propane, compressed natural gas, liquefied natural gas) may only qualify for a tax credit of 35% of eligible costs. The tax credit is filed over five years. For projects with eligible costs of $20,000 or less, the tax credit may be taken in one year. Unused credits can be carried forward up to eight years. Non-profit organizations, schools, and other public entities that do not have an Oregon tax liability may receive the credit for an eligible project but must "pass-through" or transfer their project eligibility to a pass-through partner in exchange for a lump- The Oregon Department of Energy offers a loan program for energy efficiency, renewable resource, and alternative fuel projects. Eligible alternative fuel projects include fuel production facilities, dedicated feedstock production, fueling stations, and fleet vehicles. The program issues Oregon general obligation bonds to provide funds for the loans. Loan recipients must complete a loan application and pay a loan application fee. N DOE ault.html Y Dept of Treasury State of Oregon 03.shtml rogs/view_all.php/or/0 Oregon Rick Wallace Department of Biofuels Coordinator Energy Oregon Department of Energy Phone (503) x366 Fax (503) rick.wallace@state.or.us ns YES YES YES YES YES YES YES YES NO - does not meet project specifications NO - does not meet project specifications YES NO - does not meet project specifications YES YES YES YES State Small-Scale Energy Loan Program none Loans are available to individuals, businesses, schools, cities, counties, special districts, i t state t and federal agencies, public corporations, cooperatives, tribes, and non-profits. In June 2005, the passage of Senate Bill 735 Use recycled materials to create products; expanded the program to allow projects proposed by Use alternative fuels; and intergovernmental entities as well The program offers low-interest loans for projects that: Save energy; Produce energy from renewable resources such as water, wind, geothermal, solar, biomass, waste materials or waste heat; Oregon Department of s/incentive.cfm?incentive_code= Energy OR04F&re=1&ee=1 1 YES YES YES YES
183 Federal State Recovery Act: Community Renewable Energy Deployment Energy Trust - Large-Scale Renewable Energy Program DE-FOA Sep 03, 2009 DOE anticipates making up to four awards under this FOA with total cumulative DOE funding available estimated to be $21.45 million. Applicants may request up to $21.45 million in DOE funding. Applicant cost share of 50% of total project costs is required. Ceiling (i.e., the maximum amount for an individual award made under this announcement): $ million Floor (i.e., the minimum amount for an individual award made under this announcement): $5 million none ~$4 million annually Energy Trust will pay up to 50% of costs associated with these activities and can provide additional assistance on other aspects of projects, as well. Generally, Energy Trust will contribute a maximum of around $40,000 for development assistance activities. eligibility for award is restricted to state and local governments, Indian Tribes and Tribal Energy Resource Development Organizations or Groups. Funding under this grant program is available for a variety of purposes, including grant writing, feasibility studies, or technical assistance with design, permitting, or utility interconnection electric or thermal energy generated from solar, wind, biomass, landfill gas, ocean (including tidal, wave, current, and thermal), geothermal, or new hydroelectric generation capacity achieved from increased efficiency or additions of new capacity at an existing hydroelectric project, as defined in EPAct Energy Trust of Oregon offers cash incentives and development assistance for renewable energy projects that are 20 megawatts (MW) or less in capacity. Y US DOE Golden Field office onnect/publicpages/publicsearc h/public_opportunities.aspx Publicpurpose charge collected from Portland General Electric and Pacific Power customers YES - if funding is renewed for 2010 NO - does not meet project specifications YES - if funding is renewed for 2010 YES - if power is delivered to either Portland General Electric or Pacific Power YES - if funding is renewed for 2010 NO - does not meet project specifications YES - if funding is renewed for 2010 NO - does not meet project specifications Federal Federal Federal Federal Alternative Fuel Infrastructure Tax Credit Assisted Housing Stability and Energy and Green Retrofit Clean Energy Application Centers N/A The credit expires December 31, 2010, for all fuel types other than hydrogen fueling The credit amount is up to 30% of the cost, not to exceed $30,000, for equipment placed into service before January 1, The credit amount is up to 50% not to exceed $50,000, for equipment placed into service on or after January 1, Does not specify Alternative fueling station owners Qualified alternative fuels are natural gas, liquefied petroleum gas, hydrogen, electricity, E85, or diesel fuel blends containing a minimum of 20% biodiesel. HUD-RA-01 2/16/ None Owners of properties receiving project-based assistance pursuant to section 202 of the Housing Act of 1959 (12 U.S.C ), section 811 of the Cranston- Gonzalez National Affordable Housing Act (42 U.S.C. 8013, or Section 8 of the United States Housing Act of 1937 as amended (42 U.S.C. 1437f). DE-FOA Annually, Check program open and close dates for applications $3 million anticipated, 8 awards between 1.2 and 2 million None All entities are eligible to apply. First-time applicants only For energy and green retrofit investments in property, ensure the maintenance and preservation of property, continued operation and maintenance of energy efficiency technologies, and timely expenditure of funds. combined heat and power (CHP), district energy, waste heat recovery, and other clean energy systems as solutions to the energy issues facing our nation. Regional Application Centers (RACs) promote the development of CHP technology applications offering local, individualized solutions to customers on project-specific support along with providing end user education and outreach. The creation of Clean Energy Application Centers will replace the RACs, expanding their activities beyond CHP to include district energy systems, waste heat recovery, and other clean energy systems as funding becomes available. Department of Labor Recovery SGA-DFA-PY-08- TBA TBA TBA Research, labor exchange, and job training projects that prepare workers for Act Competitive Grant Opportunities 13 careers in energy efficiency and renewable energy. Y N U.S. Department of rogs/view_ind_fed.php/afdc/351/0 Treasury US John Prusch; Department of Housing and Urban Development Y, at least US 20% of the Department of total Energy (DOE)- allowable Office of costs of Energy the project Efficiency and (i.e., the Renewable sum of the Energy Governme (EERE) nt share, N ncing/business.html NO - Does not meet project specifications YES - if the property is eligible under the project description YES - if the funding is renewed for 2010 Department of TBA MAYBE - Labor emphasis is placed on job creation and training NO - Does not meet project specifications YES - if the property is eligible under the project description YES - if the funding is renewed for 2010 MAYBE - emphasis is placed on job creation and training YES - if the fueling stations are constructed before next year NO - Does not meet project specifications YES - if the funding is renewed for 2010 MAYBE - emphasis is placed on job creation and training MAYBE YES - if the property is eligible under the project description YES - if the funding is renewed for 2010 MAYBE - emphasis is placed on job creation and training Federal Developing and Enhancing Workforce Training Programs for the Electric Power Sector (Topic A) Smart Grid Workforce Training (Topic B) N/A 11/30/2009 $100 million Topic A projects- Up to $750,000. The required cost share is 20%, but 10% will be considered for academic institutions. Topic B projects- Up to $5 million. The required cost share is 50%. Companies, non-profits, institutions of higher education, and local and state governments Federal funds shall NOT be used to support construction of training facilities (e.g. building infrastructure). The period of performance will be up to 3 years. Y DOE Smart%20Grid_Workforce%20Tr aining_de-foa _Final%20(2).pdf MAYBE - emphasis is placed on job creation and training MAYBE - emphasis is placed on job creation and training MAYBE - emphasis is placed on job creation and training MAYBE - emphasis is placed on job creation and training
184
185 Oregon Business Energy Tax Credit Application for Preliminary Certification for Renewable Energy Resource Equipment Manufacturing Facility Business owners of facilities used to manufacture equipment, machinery, or other products that will be used exclusively for renewable energy resource facilities may be eligible for a state tax credit. The tax credit is 50 percent of eligible facility costs. If issued, the tax credit is claimed over five years (10 percent per year). The maximum eligible system cost for a renewable energy manufacturing facility shall not exceed $40 million in a single calendar year. Eligible system costs will be determined by the Oregon Department of Energy. Eligible Applicants An eligible applicant (a facility owner) must meet the following three requirements: 1. Be a trade, business or property owner of a business site in Oregon or 2. Be the owner or be the contract buyer of the facility and 3. Use the facility to manufacture equipment or materials that will be used exclusively for renewable energy resource generation/harvesting. Pass-through Option Facility owners may pass-through or transfer their 50 percent tax credit facility eligibility to a pass-through partner in exchange for a lump-sum cash payment. The Oregon Department of Energy determines the rate that is used to calculate the cash payment. Both the facility owner and pass-through partner must sign the Application for Final Certification for Pass-through Facilities before a Final Certification is issued to the pass-through partner. The same review, rules and standards apply to facilities approved under the Pass-through Option as those using the regular Business Energy Tax Credit Program. Please note: There may be tax implications to using the Pass-through Option. Please consult your tax preparer. Timing The Oregon Department of Energy must receive the Application for Preliminary Certification for renewable energy manufacturing facilities BEFORE the facility owner financially commits to start the construction of the facility. For example, an owner must apply before purchasing equipment or signing a contract. If a facility owner starts a facility and then decides to apply for the tax credit, the owner must submit a written request for a waiver with the application. The waiver request and application must be sent within 90 days of the facility start date and must demonstrate an extenuating business circumstance that caused the delay in the application. Under extraordinary circumstances, the Director of the Department of Energy may extend the waiver period. Work on the facility must begin within five years of the approval date of the Preliminary Certificate or within five years of the approval date of any changes to the facility. A facility owner must receive a Final Certificate before the credit can be claimed on an Oregon tax return or a passthrough option is exercised. OVER 1 05/08 ODOE CF-191
186 Confidential Information and Disclosure The State of Oregon's Public Records Law (ORS et seq.) (PRL) applies to tax credit applications submitted to the Oregon Department of Energy. The law states every person has a right to inspect any public record of a public body, subject to certain exceptions. Trade secrets and confidential business records information may be exempt from disclosure. Certain information, including trade secrets (ORS (2) and confidential submissions (ORS (4)), may be exempt from disclosure under exemptions to the PRL. Please consult your legal counsel to determine whether these or other exemptions could apply to your application. Mark on each page any information that you believe are trade secrets, business records or that is otherwise protected under the PRL and that you request to be kept confidential. Marking information does not guarantee that it will be kept confidential. The Director of the Oregon Department of Energy will make any decisions regarding public disclosure of information contained in this application in accordance with the Oregon Public Records Law. Under certain circumstances, as set out in ORS (1), the personal safety exemption to the PRL, the Oregon Department of Energy is authorized to withhold your address, phone number and electronic mail address. If you want to claim this exemption under the PRL, please contact the Oregon Department of Energy prior to sending in your application for a Business Energy Tax Credit. Please consult your legal counsel to determine whether this exemption applies to you. The Oregon Department of Energy does not endorse any company that requests application information and does not sell this information as a mailing list. Before the facility begins: 1. A facility owner must complete the Application for Preliminary Certification for Renewable Energy Manufacturing Facility. The applicant must send the signed form, supporting documentation, and payment for review charges to the Oregon Department of Energy before the project begins. Incomplete applications will not be accepted. Note: If using Microsoft WORD version of the application, check the Web site to ensure the latest version is being used. (Dates are in the lower right-hand corner.) 2. A facility owner may start construction of the facility when they receive a Preliminary Certificate. A facility owner may start construction of the facility before receiving a Preliminary Certificate, however, there is no guarantee the facility will be approved. 3. If vital characteristics of the facility change after receiving the Preliminary Certificate, the facility owner should submit a signed, written, detailed description of the changes to the facility and energy savings estimates. An increase in cost only does not qualify as a facility change. If the Oregon Department of Energy approves a facility change, a facility owner may be required to pay an additional review charge. OVER 2 05/08 ODOE CF-191
187 After the facility is complete: 1. A facility owner should apply to the Oregon Department of Energy for final certification when the facility is completed. If facility costs are $50,000 or more, an owner must send a letter from a certified public accountant (not permanently employed by the facility owner) stating that the CPA has reviewed the facility costs. If facility costs are less than $50,000, the facility owner should send copies of the dated invoices, canceled checks or receipts that are marked paid. 2. The Oregon Department of Energy will review the final application and may issue a Final Certificate. Under no circumstances can the Oregon Department of Energy approve more than 10 percent above the amount of estimated facility costs shown on the Preliminary Certificate unless the preliminary certificate was amended in writing and received approval before completion of the facility. The sum of all financial incentives and the tax credit may not exceed the total eligible facility costs. 3. A tax credit recipient may file the tax credit over five years (10 percent per year). If the eligible facility costs are $20,000 or less, a tax credit recipient may file for the tax credit in one year. A tax credit recipient may begin claiming the tax credit the year the facility is finished or the year the Oregon Department of Energy issues the Final Certificate. Questions? For questions on claiming the tax credit, contact the Oregon Department of Revenue ( or call For questions concerning a facility, call the Oregon Department of Energy at (toll-free in Oregon) or (503) (Salem), or visit our Web site ( 3 05/08 ODOE CF-191
188 Business Energy Tax Credit Application for Preliminary Certification Renewable Energy Resource Equipment Manufacturing Facility Are you eligible? For office use only Yes No Application #: Have you submitted this application before financially committing to start this energy facility? (e.g. signing a contract, ordering equipment, etc.) If no, did you attach a request for a waiver Date received: Do you intend to use the Pass-through Option? *The Pass-through Option will allow you to transfer your tax credit facility eligibility to another business or individual (a passthrough partner) in exchange for a lump-sum payment. The payment amount is calculated using the pass-through rate. To use the Pass-through Option, check the Yes box above, complete this application form and send the form to the Oregon Department of Energy. There may be tax implications to using the Pass-through Option. Please consult your tax preparer. 1. Facility owner information (We will send all correspondence to this person.) Facility owners name: Tax I.D. # or SSN*: Facility/project name: Phone: Mailing address: City/state/zip: Business activity or SIC: Contact person for facility (Who can answer technical questions about the facility?) Title: Phone: Company/organization CPA or CFO: (If interested in Pass-through Option) Title: Phone: *OAR authorizes the Oregon Department of Energy to use your federal tax identification or social security number as an identification number in maintaining internal records and may be shared with the Oregon Department of Revenue to establish the identity of an individual in order to administer state tax law. OVER 3 05/08 ODOE CF-191
189 2. Architect, engineer, contractor for facility Firm name: Contact person: Address Phone: City/state/zip 3. Facility site Site address: City: County: Zip: Total square footage of this facility 4. Estimated construction or installation dates Estimated start date: Estimated completion date: 5. May the Oregon Department of Energy publicize your facility? Yes No 6. How did you learn of the Business Energy Tax Credit Program? Associate Advertisement Workshop Utility Vendor Other: ODOE Staff 7. Renewable Energy Manufacturing Category What renewable energy resource will your product be used exclusively for: Solar Wind Hydro Biomass Ocean wave Geothermal Alternative fuels 8. Tax credit essential to the facility Is the allowance of the tax credit essential to your decision to expand or locate your facility in Oregon? Yes No OVER 4 05/08 ODOE CF-191
190 9. Facility or Project Description Attach a document that describes in detail your project. The attached document should contain the following sections in narrative form: 1. Overview Describe in general what your company intends to do. Include a) An overview of the facility b) The timeline and critical path actions c) Quantity of materials produced d) Resources needed, and e) Long-term project plans for expansion or further development. 2. Product and facility Describe in detail what will be manufactured, researched, or developed and why the product will be used exclusively for a renewable energy resource facility. Describe in detail why the facility is used solely for renewable energy manufacturing. 3. Jobs Describe the minimum level of direct employment that will be provided by the facility during each of the tax years in which the tax credit will be claimed and describe the anticipated average annual direct employment during each of those years, including the number of average hourly and annual wages of employees by employment classifications by geographic location. The applicant must also describe actions it will take to achieve cultural diversity in its work force. 4. Financial viability Identify the projected facility construction costs. Break this down in by project appropriate components (e.g. design, construction, equipment, training, research, startup, land, etc.) Demonstrate your financial ability to construct and operate the proposed facility through documentation such as independent credit ratings; credit references, including letters from banks or other financial institutions attesting to the applicant s credit worthiness; and other documentation. 5. Likelihood of success Demonstrate that the facility will achieve long-term success by documenting the qualifications, capabilities and experience of the applicant in the construction and operation of such facilities and the long-term commercial viability of the renewable energy resource equipment that will be manufactured. 6. Essential characteristics If an applicant is applying for a preliminary certification for a facility qualifying under the same specific facility definition under OAR as any other facility which the applicant has received preliminary or final certification, the applicant must demonstrate that the facility has distinct essential characteristics or the facility will be considered as one facility subject to the facility cost limitation imposed under OAR (1)(a). Address the essential characteristics of the manufacturing facility including, but not limited to the following criteria: a) How is the land, structures, buildings, installations, excavations, machinery, equipment or devices that have been subject in whole or in part to the facility cost limitation of OAR (1)(a)(A) distinct from a facility that has received preliminary or final certification? b) What is the purpose or end-use product of the facilities and how are those purposes or enduse applications distinct? c) What are the applicable permits, licenses or site certificates and will those permits, licenses or site certificates and how are those permits, licenses or site certificates distinct? d) Where and how closely are the facilities located, including supporting facilities such as access roads, substations, water or discharge lines, perimeter fencing, storage or parking 5 05/08 ODOE CF-191
191 areas, and how are the facilities distinct? e) What will be the construction agreements or arrangements and how are those agreements or arrangements distinct construction agreements? f) What are the operating characteristics and will the facilities have distinct operating characteristics? g) What will be the financing arrangements and how are the financing arrangements distinct? 7. Other Provide any additional information which you believe will aid in the Oregon Department of Energy in favorably reviewing the application. 10. Business Energy Tax Credit review charge Applications will not be reviewed until the review charge is paid in full. Eligible Project Cost (From your budget narrative #9) x.0060 = $ Minimum payment required is $30; the maximum payment required is $75,000. Make check payable to the Oregon Department of Energy and include with this application. You may also pay by Visa or MasterCard. I want to pay by Visa/MasterCard. Please contact me at this phone number:. If all or a portion of your application is denied, or if a change in your project results in lower costs, a portion up to 75 percent of this payment may be refunded within two years of pre-certification. If you add to your approved project, you must send a written description of the additions and the costs to be eligible for a tax credit. If the Oregon Department of Energy approves the additional eligible costs, an additional payment may be required. For more information, see Oregon Administrative Rule (2). OVER 6 05/08 ODOE CF-191
192 11. Project Owner Preliminary Statement 1. I understand that Oregon Department of Energy approval and certification of my project is for tax credit purposes only. The Oregon Department of Energy does not guarantee or in any way ensure the performance of any equipment, the quality of any system or the reliability of any dealer. 2. I agree that the project will comply with all local, state and federal requirements. I will obtain all necessary permits. 3. I will permit the Oregon Department of Energy or its agents to inspect the project at its discretion to make sure the project qualifies for the tax credit. I understand that if I give false information about the project, or if I refuse to permit the Oregon Department of Energy to inspect the project, I will not get the tax credit. 4. I understand that this tax credit application is a public record and that the Oregon Department of Energy may be required by law to disclose information in this tax credit application to the public on request. I have marked any information that I request be kept confidential. I understand that marking information does not guarantee that it will be kept confidential and that the Director of the Oregon Department of Energy will make any decisions regarding public disclosure of information contained in this application in accordance with the Oregon Public Records Law. 5. I understand that the Oregon Department of Energy does not endorse any company that requests information on this application and does not sell information as a mailing list. 6. I hereby release the State of Oregon and its commissions, agencies, officers, employees, contractors, and agents, and agree to defend and indemnify the foregoing from and against any claims, demands, or costs (including attorney and expert witness fees at trial and on appeal) arising from or in any way related to the Oregon Department of Energy s issuance or failure to issue any pre-certification or final certification for a Business Energy Tax Credit, or any party s inability to obtain a Business Energy Tax Credit. 7. I understand that the sum of all financial incentives and the tax credit can not exceed the total eligible project cost. 8. I have enclosed a check to the Oregon Department of Energy or will pay by Visa or MasterCard for the review charge. 9. I verify that the project owner does not restrict membership, sales, or services on the basis of race, color, creed, religion, national origin, sexual preference or gender. 10. I have completed this form to the best of my knowledge. 11. I certify that I am the project owner or the authorized agent. I have read and agree with the terms, conditions of the Project Owner Preliminary Statement. Signature: Title: Print Name: Date: Send completed application with payment to: Oregon Department of Energy, 625 Marion St. NE Salem, OR If you have questions, call: (toll-free in Oregon). 7 05/08 ODOE CF-191
193 Energy Trust Preliminary Application
194 Form 920A Initial Application Renewable Energy Programs Biopower To be completed by Applicant Attach pages, as needed, to answer each question. On this form, refer to the attachment. On each attachment, please identify the section and question numbers for each answer provided. Section 1 Applicant Information A. Project Name B. Submission Date (m/d/yy) C. Provide a brief project description, including the type and source of fuel, and the conversion technology you will use. Enter information for the company or organization that may enter into an agreement with the Energy Trust of Oregon, Inc. if this application were to be selected for further review and negotiations. D. Company or Organization E. Applicant Contact F. Applicant Address G. Telephone cell office home H. Fax City State Zip I. J. Website K. Business Classification Corporation Individual/Sole Proprietor Partnership Other (specify below) L. Please indicate your self-direction status as of the date this application is submitted: Not currently eligible to self direct. Eligible to self-direct but not currently self-directing. (I am paying the public purpose charge.) Eligible to self-direct and currently self-directing. (I am not paying the public purpose charge.) M. List any documents that are attached to provide project detail. Attach additional sheets if you want to provide longer answers than this form accommodates. You need not attach lengthy documents to this Initial Application: Additional documentation which may include feasibility and technical details, as well as financial pro formas, will be requested for projects that are invited to submit a Full Application. Please keep a copy of this document for your records. Form 920A v Return completed form to: Page 1 of 5 Renewable Energy Programs Biopower 851 SW Sixth Avenue, Suite 1200, Portland, Oregon Fax energytrust.org
195 Form 920A Initial Application Renewable Energy Programs Biopower To be completed by Applicant Attach pages, as needed, to answer each question. On this form, refer to the attachment. On each attachment, please identify the section and question numbers for each answer provided. Section 2 Project Information A. Site Address City State OR Zip B. New Installation C. Projected Operating Date D. Estimated Life of Project Expansion or Modification of Existing System years E. Site control I own the site Sale is pending I lease the site now I will lease the site Project easements and rights of access will be granted over the project life, without the need for purchase or lease. F. Has a feasibility study been performed for the proposed project? If yes, please attach a copy of the feasibility study to this application. G. I have detailed technical specifications for this project. Yes No Date (m/dd/yy) If you do not own the site, and do not plan to purchase it, describe the length and terms of your lease: Yes If yes, please indicate when they were developed, and by whom. Contact Company Telephone H. I have bids and/or pricing for this project. Company Valid Through From Equipment Manufacturer or Distributor From Contractor I. Electrical Generation Installed Generating Capacity 1 MW Net Output MW Annual Availability Factor 2 % Capacity Factor 3 % Estimated Electricity Generated MWh per Year J. The Project Will Be net metered. Produce power solely for on-site consumption. Will not be net metered, but will be grid-connected. Produce some power for on-site consumption, and some for sale to utility. Produce power solely for sale to utility. No 1 Indicate generating capacity in Megawatts (MW), using the form 0.XXX MW for smaller capacity projects. 2 Availability ( A ) is defined as annual project operating hours as a percentage of total hours in a year. annual project operating hours A = 8,760 hours 3 Capacity Factor ( CF ) is another measure of project performance and is calculated as the ratio of actual (or estimated) energy produced to the energy production resulting from operation at full-rated power every hour of the year. annual energy production ( MWh) CF = power rating ( MW ) 8,760 hours Please keep a copy of this document for your records. Form 920A v Return completed form to: Page 2 of 5 Renewable Energy Programs Biopower 851 SW Sixth Avenue, Suite 1200, Portland, Oregon Fax energytrust.org
196 Form 920A Initial Application Renewable Energy Programs Biopower To be completed by Applicant Attach pages, as needed, to answer each question. On this form, refer to the attachment. On each attachment, please identify the section and question numbers for each answer provided. Section 3 Utility Information A. Pacific Power Account Numbers Rate Schedule Portland General Electric (PGE) Account Numbers B. Customer Class Agricultural Residential Industrial or other large customers (over 1 MW) Small Commercial (under 30 kw) Medium Commercial (30 kw to 1 MW) Other (specify below) Public (government, schools) C. Describe the general options for utility interconnection, and the status of your interconnection plan: Rate Schedule D. I have contacted the utility to discuss interconnection options. Yes No Utility Representative Name Utility Representative Telephone Fill out items E and F only if you intend to sell power to a utility. E. I intend to sell power to a utility, but I do not yet have a power sales contract. I have contacted the appropriate utility about obtaining one. Yes No Utility Representative Name Utility Representative Telephone F. In a few sentences, summarize the status of your project s acquisition of a Power Purchase Agreement. Section 4 Project Cost On an additional sheet, provide as much detail as you are able about expected project development costs and project operating expenses. A. Estimated installed cost of project, including all up-front charges. $ B. Estimated annual operating and maintenance costs. (Please include all costs: do not net out tax credits or other offsets.) $ Section 5 Financial Information A. List all legal or administrative proceedings pending, and those concluded adverse to your firm within the last 5 years, which relate to procurement or performance of any public or private contracts. B. In a few sentences, describe the development organization s experience financing, developing and managing projects of the scale and complexity anticipated. Indicate whether sufficient owner equity is available to support project financing. Please keep a copy of this document for your records. Form 920A v Return completed form to: Page 3 of 5 Renewable Energy Programs Biopower 851 SW Sixth Avenue, Suite 1200, Portland, Oregon Fax energytrust.org
197 Form 920A Initial Application Renewable Energy Programs Biopower To be completed by Applicant Attach pages, as needed, to answer each question. On this form, refer to the attachment. On each attachment, please identify the section and question numbers for each answer provided. C. Has the applicant organization, its predecessors, if any, or any principal of the firm been insolvent or declared bankrupt within the past 5 years? If yes, explain. Yes No D. I have a financial pro-forma for this project. Yes No E. Oregon Department of Energy s (ODOE) State Energy Loan Program has been contacted. Yes No F. I have contacted ODOE concerning the Oregon Business Energy Tax Credit. Yes No G. The project qualifies for Federal incentives. Yes No If yes, please indicate program or programs. H. Oregon DEQ has been contacted about project qualification for a Pollution Control Tax Credit. Yes No I. Describe the types and amounts of liability, business and equipment insurance coverage to be provided by applicant for this project, including: whether such coverage is on a comprehensive or commercial form; whether such coverage is on a claims made or occurrence basis; all endorsements excluding coverage of any nature, if any; and specific and aggregate limits. Section 6 Terms and Conditions No Commitment This application does not constitute an offer to enter into a contract with the Energy Trust, nor does it commit Energy Trust to enter into a contract or similar undertaking with the Applicant or any organization associated with the Applicant Energy Trust reserves the right to suspend or modify the application process or to issue a new application that would supersede and replace this one. Any commencement of negotiations in connection with this application does not signify a commitment by Energy Trust to execute a contract or to continue discussions with respect to the Applicant s organization. Any party involved in these negotiations can terminate contact at any time and for any reason. Energy Trust is under no obligation to pursue this application, or to disclose to the Applicant any information concerning its disposition of, or action on, the Application. Any recommendations or conclusions from this application process concerning the Applicant shall not constitute a right (property or otherwise). No binding obligation shall be created unless Energy Trust or its representative and the concerned parties execute a binding agreement. Any awards made by the Energy Trust as a result of this application will be subject to the terms of a definitive written agreement between the parties. Confidentiality Applications may be reviewed by any Energy Trust employee, Board member, or contractor. If Energy Trust uses an outside party to help review the application, it will require that party to sign a confidentiality agreement. Subject to litigation or other legal disclosure requirements, Energy Trust will not otherwise disclose information submitted in this application. Waiver of Claims Applicant waives any right it may have to bring any claim, whether in damages or equity, against Energy Trust, Energy Trust s Board of Directors, Energy Trust s Renewable Advisory Council, Energy Trust s agents, employees, or contractors with respect to any matter arising out of any process associated with this application. Please keep a copy of this document for your records. Form 920A v Return completed form to: Page 4 of 5 Renewable Energy Programs Biopower 851 SW Sixth Avenue, Suite 1200, Portland, Oregon Fax energytrust.org
198 Form 920A Initial Application Renewable Energy Programs Biopower To be completed by Applicant Attach pages, as needed, to answer each question. On this form, refer to the attachment. On each attachment, please identify the section and question numbers for each answer provided. Section 7 Applicant Certification and Signature I hereby certify that: 1. Applicant is duly authorized to submit this proposal and the undersigned is authorized by the Applicant to submit this application to Energy Trust on Applicant s behalf; 2. The information provided by Applicant in this application, and any other related documents delivered to Energy Trust, is true, accurate and complete to the best of Applicant s knowledge; 3. Applicant has read, understands and agrees to all of the terms and conditions as set forth in this application; 4. Applicant understands and accepts that the approval or rejection of this application is within the sole discretion of Energy Trust; 5. Applicant understands and accepts that all costs associated with completing this application are the sole responsibility of Applicant and that the application and all materials submitted with it shall become the property of Energy Trust and shall not be returned to the Applicant; 6. Applicant authorizes Energy Trust to contact references and to investigate the business financial credit history of the Applicant, its affiliates, and all associated partners, principals and management and authorizes the release of all said information to Energy Trust; 7. Applicant has included in this application all information necessary to ensure that the statements herein do not in whole or in part mislead Energy Trust as to any material fact; and 8. Applicant will report immediately in writing to Energy Trust any changes to the information contained herein at any time while this application is under consideration. Applicant Name Authorized Representative (printed) (printed) Title Signature Date Please keep a copy of this document for your records. Form 920A v Return completed form to: Page 5 of 5 Renewable Energy Programs Biopower 851 SW Sixth Avenue, Suite 1200, Portland, Oregon Fax energytrust.org
199 Appendix H Calculations
200 CLIENT KLAMATH FALLS PROJECT COMPUTED BY Cale McPherson PROJECT Biogas Energy Management DATE CHECKED DATE DETAIL Emission Estimate, Engine CHECKED BY PAGE NO. 1 of Generator Information Exhaust Flow: Nm 3 /hr, dry standard Engine Make: Senergie Fuel Flow: 1.34 MMBTU/hr Engine Model: G926TI Fuel Type: Digester Gas Engine Rating at 100% Load: 140 kw (electrical output) 188 hp 197 bhp (brake hp) Engine Operating Hours: 8760 hrs/yr Fuel H 2 S Content: 50 ppmv Uncontrolled Emission Factors (from GE Jenbacher) Pollutant Emission Rate Reference Source Uncontrolled NOx Emission Rate: 500 mg/nm 5% O2 Equipment Data sheet provided by Preston Dickerson (Tech3 Solutions) Uncontrolled CO Emission Rate: 1000 mg/nm 5% O2 Equipment Data sheet provided by Preston Dickerson (Tech3 Solutions) Uncontrolled VOC Emission Rate: 1.00 g/hp-hr Spec provided by Preston Dickerson (Tech3 Solutions) Uncontrolled PM10 Emission Rate: 35 mg/nm 5% O2 conversation with Preston Dickerson (Tech3 Solutions) Uncontrolled PM2.5 Emission Rate: 10 mg/nm 5% O2 conversation with Preston Dickerson (Tech3 Solutions) Uncontrolled SOx Emission Rate: lb/mmbtu Stoichiometric combustion of H 2 S in fuel (50 ppm) Uncontrolled NOx Emissions (as NO 2 ) 500 mg NOx 8760 hours Nm 3 1 pound 1 ton tons tons 1 Nm 3 x x x x = % year 1 hr 4.54E+05 mg 2000 pounds year year Uncontrolled CO Emissions 1000 mg CO 8760 hours Nm 3 1 pound 1 ton tons tons 1 Nm 3 x x x x = % year 1 hr 4.54E+05 mg 2000 pounds year year Uncontrolled VOC Emissions (as NMHC) 1 grams VOC 8760 hours 188 hp 1 pound 1 ton = tons tons 1 hp-hr x x x x % year 1 engine gram 2000 pounds year year Uncontrolled PM10 Emissions 35 mg PM hours Nm 3 1 pound 1 ton tons tons 1 Nm 3 x x x x = % year 1 hr 4.54E+05 mg 2000 pounds year year Uncontrolled PM2.5 Emissions 10 mg PM hours Nm 3 1 pound 1 ton tons tons 1 Nm 3 x x x x = % year 1 hr 4.54E+05 mg 2000 pounds year year Uncontrolled SOx Emissions (as SO 2 ) Control Efficiency Controlled Emissions lb SOx 1.34 MMBTU 8760 hours 1 ton tons tons 1 MMBTU x x x = % hour 1 year 2000 pounds year year
201 CLIENT KLAMATH FALLS PROJECT COMPUTED BY Cale McPherson PROJECT Biogas Energy Management DATE CHECKED DATE DETAIL Emission Estimate, Boiler CHECKED BY PAGE NO. 1 of Boiler Information Boiler Make: Boiler Fuel 586 BTU/ft 3 Boiler Model: Fuel Type: Digester Gas Boiler Rating at 100% Load: 36 boiler hp Boiler Operating hours 8760 hrs/yr Fuel H 2 S Content: 50 ppmv Uncontrolled Emission Factors (from GE Jenbacher) Pollutant Emission Rate Reference Source Uncontrolled NOx Emission Rate: 23.4 ppm % O2 Manufacturer test data, 3% oxygen - per Jeff Shivers (Proctor Sales) Uncontrolled CO Emission Rate: 25.9 ppm % O2 Manufacturer test data, 3% oxygen - per Jeff Shivers (Proctor Sales) Uncontrolled SOx Emission Rate: lb/mmbtu Stoichiometric combustion of H 2 S in fuel (50 ppm) Uncontrolled NOx Emissions (as NO 2 ) Control Controlled Efficiency Emissions 36 bhp kw MMBTU/hr 0.02 lb NOx 8760 hours 1 ton tons tonnes x x x x x = % boiler 1 bhp 1 kw 1 MMBTU 1 year 2000 lb year year Uncontrolled CO Emissions 36 MW kw MMBTU/hr 0.03 lb CO 8760 hours 1 ton tons tonnes x x x x x = % boiler 1 bhp 1 kw 1 MMBTU 1 year 2000 lb year year Uncontrolled SOx Emissions (as SO 2 ) 36 MW kw MMBTU/hr lb SOx 8760 hours 1 ton tons tonnes x x x x x = % boiler 1 bhp 1 kw 1 MMBTU 1 year 2000 lb year year NOTE: No data available for PM10, PM2.5 and VOCs
202 CLIENT KLAMATH FALLS PROJECT COMPUTED BY Cale McPherson PROJECT Biogas Energy Management DATE CHECKED DATE DETAIL FOG Projections CHECKED BY PAGE NO. 1 of Klamath Falls FOG Characteristics Population Total: 42,000 Population Sewered: 28,000 Source Rate Notes Source Yellow Grease: 8.74 lbs/capita/yr Not used in FOG Wiltsee, G. Urban Waste Grease Resource Assessment, NREL/SR , November 1 Brown Grease/FOG: lbs/capita/yr FOG Wiltsee, G. Urban Waste Grease Resource Assessment, NREL/SR , November 1 Water %: 0.85 percent H2O in collected FOG FOG %: 0.15 percent FOG in collected FOG FOG Projection in Klamath Falls lb FOG 42,000 people 1 yr 1.00 lb Dilute FOG 1 gal dilute FOG gal dilute FOG x x x x = 36,679 1 capita*yr 1 12 month 0.15 lb FOG 8.34 lb Dilute FOG year


203
Biogas Opportunities: From Fuel to Flame
 Biogas Opportunities: From Fuel to Flame Matt Krumenauer Senior Policy Analyst Oregon Department of Energy Paul Suto, P.E. Supervising Engineer Bureau of Environmental Services Paul.Suto@portlandoregon.gov
Reduce Grid Required Energy to Utilize Your Wastewater Treatment Facility
 Reduce Grid Required Energy to Utilize Your Wastewater Treatment Facility Joseph C. Cantwell, Science Applications International Corporation ABSTRACT Communities with wastewater treatment facilities have
Turnkey Landfill Gas Processing Solutions
 1 Turnkey Landfill Gas Processing Solutions BIOFerm Energy Systems Thursday, October 05, 2017 2 BIOFerm Energy Systems Background Headquarters Madison, WI U.S.A. Established 2007 Turnkey Services Gas upgrading
Demonstration of Fuel Cells to Recover Energy from Landfill Gas Phase III. Demonstration Tests, and Phase IV. Guidelines and Recommendations
 United States National Risk Management Environmental Protection Research Laboratory Agency Cincinnati, OH 45268 Research and Development EPA/600/SR-98/002 March 1998 Project Summary Demonstration of Fuel
Greenlane Biogas Gas Cleanup Technology. Developments and Key Considerations.
 Greenlane Biogas Gas Cleanup Technology. Developments and Key Considerations. Cash Cow. RNG for Transportation in Washington. University Place, July 16 th, 2013 www.americanbiogascouncil.org Our Company
The Philadelphia Water Department s Cogeneration Project: Transforming Biogas to Energy
 The Philadelphia Water Department s Cogeneration Project: Transforming Biogas to Energy Presentation Overview Project Goals and Objectives Biogas Beneficial Use Options PWD Cogeneration Facility Project
GROWING SUSTAINABLE COMMUNITIES CONFERENCE Dubuque, Iowa. Landfill Biogas Treatment and Utilization
 GROWING SUSTAINABLE COMMUNITIES CONFERENCE Dubuque, Iowa Landfill Biogas Treatment and Utilization October 12, 2011 Unison Solutions, Inc. Overview Biogas Compression/Treatment System Design and Fabrication
Biogas A Wet Gas Environment for Thermal Flow Meters
 Application Note Complex Technology Made Simple Biogas A Wet Gas Environment for Thermal Flow Meters A Stark Comparison Between Thermal Flow Meters Kurz Instruments, Inc. Summary In a recent project and
Converting Digester Gas to Steam and Electricity at the Blue Plains AWTF
 Converting Digester Gas to and Electricity at the Blue Plains AWTF Michael B. Shafer, PE - Black & Veatch International Company Kent A. Lackey, PE - Black & Veatch International Company ABSTRACT DC is
A Simple and Energy Efficient Approach to Cleaning Biogas
 A Simple and Energy Efficient Approach to Cleaning Biogas Sid Arora, P.E., MMSD Lindsey Busch, P.E., Carollo Engineers Rudy Kilian, P.E., Carollo Engineers Sean Snyder, Unison Solutions CSWEA WI Section
Las Gallinas Valley Sanitation District Biogas Utilization Evaluation. LGVSD Board Meeting Presentation April 24, 2014
 Las Gallinas Valley Sanitation District Biogas Utilization Evaluation LGVSD Board Meeting Presentation April 24, 2014 1 Introductions 2 Agenda/Meeting Objectives Project Vision Scope of Work Overview of
Using Methane Gas to Produce Electricity and Thermal Energy
 Using Methane Gas to Produce Electricity and Thermal Energy Presented by: Stephen J. Chippas, PE Regional Chief Executive Robert W. Hunt Company American Public Power Association Engineering & Operations
Comprehensive Biosolids and Bioenergy Planning Authors: Cameron Clark* 1, Irina Lukicheva 1, Anna James 1, Kathy Rosinski 1, Dave Parry 1
 Comprehensive Biosolids and Bioenergy Planning Authors: Cameron Clark* 1, Irina Lukicheva 1, Anna James 1, Kathy Rosinski 1, Dave Parry 1 1 CH2M *Email: Cameron.Clark@ch2m.com KEYWORDS: biosolids, bioenergy,
An application for: Swana 2012 Landfill Gas Utilization Excellence Award. Prince William County Sanitary Landfill. Submitted By:
 An application for: Swana 2012 Landfill Gas Utilization Excellence Award Prince William County Sanitary Landfill Submitted By: Solid Waste Division Department of Public Works Prince William County 5 County
Digester Gas Utilization and Cogeneration. Tom Mossinger, P.E.
 Digester Gas Utilization and Cogeneration Tom Mossinger, P.E. Presentation Outline 1. Energy Management What is the big deal? 2. Cogeneration at WWTP s a. Technology and related operational issues b. Recovering
Role of Entrant s Firm. »» Final Design»» Completion of Funding. »» Engineering Services During Applications. »» Plant Startup and Filtration
 ROLE OF OTHERS For the design focus of the project, key partners included:»» Mortenson Construction, Contractor»» Jacobs, Contract Plant Operator»» Portland Engineering and Controls, I&C The City of The
Frequently Asked Questions
 Why is the City doing this project? The wastewater treatment plant at Post Point is designed to remove solids from our sewage so the water can be cleaned before discharging it into Bellingham Bay. Currently
Why Codigestion? Increase biogas energy production. Reduce fossil fuel consumption. Reduce operating / energy costs. Minimize carbon footprint
 From Parry et al., 2009 Why Codigestion? Increase biogas energy production Reduce fossil fuel consumption Reduce operating / energy costs Minimize carbon footprint Increase the plant s value to the community
Understanding Design Codes and Standards for Biogas Systems
 Understanding Design Codes and Standards for Biogas Systems Co-Authors: Shayla Allen Water Resources Arcadis U.S., Inc. Regina Hanson Product Marketing Manager Varec Biogas Understanding Design Codes and
List of Tables... iii. List of Figures... iii. List of Appendices... iii. Executive Summary... ES. Section 1: Background
 Table of Contents List of Tables... iii List of Figures... iii List of Appendices... iii Executive Summary... ES Section 1: Background... 1-1 1.1 Introduction...1-1 1.2 Background...1-1 1.3 Acknowledgements...1-2
EVALUATION OF ENERGY RECOVERY OPTIONS FOR CONVERSION OF AEROBIC DIGESTERS TO ANAEROBIC DIGESTION
 EVALUATION OF ENERGY RECOVERY OPTIONS FOR CONVERSION OF AEROBIC DIGESTERS TO ANAEROBIC DIGESTION Jody B. Barksdale, P.E MWH; Juan R. Oquendo, P.E. MWH; Bruce A. Petrik, P.E. - MWH ABSTRACT. The threshold
Digester Gas Utilization at SWRP Where Should the Biogas Go?
 Digester Gas Utilization at SWRP Where Should the Biogas Go? Steve McGowan, P.E., BCEE Malcolm Pirnie The Water Division of Arcadis MWRD Monthly Seminar Series Oct 28 th, 2011 Project Contributors Tom
Energy & Emissions Strategic Plan. Executive Summary. Encina Wastewater Authority. April Prepared for
 Energy & Emissions Strategic Plan Executive Summary April 2011 Prepared for Encina Wastewater Authority Executive Summary Section 1: Introduction The Encina Wastewater Authority (EWA) is a Joint Powers
Biogas Do s & Don ts MWEA. June 2016
 Biogas Do s & Don ts MWEA June 2016 Unison Solutions, Inc. Overview Company founded on January 1, 2000 Located in Dubuque, Iowa 38 Employees (10 Engineers) 45,000 sq. ft. Manufacturing Facility 243 systems
Inland Empire Dairy Manure to Energy Cow Power Renewable Energy Program. April 2007
 Inland Empire Dairy Manure to Energy Cow Power Renewable Energy Program April 2007 IEUA s Service Area is in Southern California 2 IEUA Profile: Municipal Water Agency IEUA is a public water and wastewater
MOLECULAR GATE TECHNOLOGY FOR (SMALLER SCALE) LNG PRETREATMENT
 LNG PRETREATMENT") MOLECULAR GATE TECHNOLOGY FOR (SMALLER SCALE) LNG PRETREATMENT Presented at the 2010 Gas Processors 89 th Annual Convention Austin, TX March, 2010 Michael Mitariten, P.E. Guild Associates, Inc. Dublin,
MOLECULAR GATE TECHNOLOGY FOR (SMALLER SCALE) LNG PRETREATMENT Presented at the 2010 Gas Processors 89 th Annual Convention Austin, TX March, 2010 Michael Mitariten, P.E. Guild Associates, Inc. Dublin,
ES.1 Solids Master Planning Background and Goals
 Executive Summary The Arlington County Water Pollution Control Plant (WPCP) treats incoming wastewater flows for residents, businesses, and government agencies in the Arlington County sewer service area
Becoming a Net Energy Producer with Surplus Power to Sell
 Becoming a Net Energy Producer with Surplus Power to Sell May 12, 2015 John Hake Resource Recovery Supervisor Presentation Overview Setting the Baseline Surplus Capacity Provides Opportunity The Vision
Organics to Energy Program
 Organics to Energy Program From Waste Management to Resource Management City of Tacoma Environmental Services Department James Parvey, PE, LEED AP jparvey@cityoftacoma.org Program Overview Utilize excess
Leveraging An Agency s Assets. Anaerobic Co-Digestion FOG, Food Waste and More
 Leveraging An Agency s Assets Anaerobic Co-Digestion FOG, Food Waste and More Anaerobic Co-Digestion Energy CO 2 Use existing WWTP Infrastructure CH 4 CO 2 Stripping CNG Wastewater Sludge CO 2 Heat CNG
Atlantic Treatment Plant Combined Heat and Power (CHP) February 1, 2017
 February 1, 2017") Atlantic Treatment Plant Combined Heat and Power (CHP) February 1, 2017 Presenter Rick Raike Chief of Electrical and Energy Management 2 Outline This presentation will provide a brief discussion of the
Atlantic Treatment Plant Combined Heat and Power (CHP) February 1, 2017 Presenter Rick Raike Chief of Electrical and Energy Management 2 Outline This presentation will provide a brief discussion of the
Evaluation of Energy Recovery Options for Conversion of Aerobic Digesters to Anaerobic Digestion
 Evaluation of Energy Recovery Options for Conversion of Aerobic Digesters to Anaerobic Digestion Jody B. Barksdale, Juan R. Oquendo, and Bruce A Petrik his article discusses a case study in Florida for
APPENDIX A. 1. Background. 1.1 Existing Facilities. Page 1
 APPENDIX A PRELIMINARY TECHNICAL SPECIFICATIONS FOR BIOSOLIDS MANAGEMENT SERVICES JEA Buckman Residuals Management Facility 1. Background JEA is seeking biosolids management services from experienced biosolids
Biogas Treatment Systems
 Biogas Treatment Systems Biogas treatment system allows for purification of biogas up to biomethane condition (complete analog of natural gas with methane concentration in the range of 90-97%). After treatment
Anaerobic: without oxygen Anaerobic organisms or anaerobes: organisms that do not require oxygen for growth
 Anaerobic Digestion Biomass + Bacteria + Time = Biogas Definitions: Anaerobic: without oxygen Anaerobic organisms or anaerobes: organisms that do not require oxygen for growth May react negatively or
Why consider AD? Definitions: What can be digested? 8/8/2016
 Anaerobic Digestion Biomass + Bacteria + Time = Biogas Definitions: Anaerobic: without oxygen Anaerobic organisms or anaerobes: organisms that do not require oxygen for growth May react negatively or die
Energy Optimized Resource Recovery Project Presented By: Curtis Czarnecki, P.E.
 Kenosha Wastewater Treatment Plant Energy Optimized Resource Recovery Project Presented By: Curtis Czarnecki, P.E. Kenosha Water Utility March 22, 2016 WWTP Service Area Overview Population: 110,000 Service
Turning Gas into Green Conversion of LFG to Renewable Natural Gas Vehicle Fuel
 Building lifetime relationships with our clients and employees. Biogas Turning Gas into Green Conversion of LFG to Renewable Natural Gas Vehicle Fuel Garth R. Bowers, PE Cornerstone Environmental Group,
WEF Residuals and Biosolids Conference *To whom correspondence should be addressed.
 What s the Best Use of Your Digester Gas? Well, it Depends Ian McKelvey 1 *, Eron Jacobson 1, Peter Zemke 1, John Smyth 2 1 Brown and Caldwell, 701 Pike St, Suite 1200, Seattle, WA 98101 2 King County
PRESSURE SWING ADSORPTION NITROGEN GENERATION SYSTEM. GDN2 Series
 PRESSURE SWING ADSORPTION NITROGEN GENERATION SYSTEM GDN2 Series GARDNER DENVER NITROGEN GENERATORS Where is Nitrogen Used? In many applications, oxygen is the enemy. Oxygen can cause food to spoil, rubber
Chemicals. BestPractices Plant-Wide Assessment Case Study
 Chemicals BestPractices Plant-Wide Assessment Case Study Industrial Technologies Program Boosting the productivity and competitiveness of U.S. industry through improvements in energy and environmental
Tech Byte 11: Benefits of Filtration for Open Cooling Tower Systems
 The need for filtration of any cooling tower system is somewhat understood and accepted by most building professionals and plant operating engineers. However, for some, that need is finally driven home
Grandville CWP Electrical Generation What s possible? Todd Wibright, Superintendent, City of Grandville CWP
 Grandville CWP Electrical Generation What s possible? Todd Wibright, Superintendent, City of Grandville CWP Grandville CWP Egg Shaped Anaerobic Digester and Bio-Gas Cogeneration What we did How it works
REHABILITATION AND OPTIMIZATION OF ANAEROBIC DIGESTION MIXING SYSTEMS
 REHABILITATION AND OPTIMIZATION OF ANAEROBIC DIGESTION MIXING SYSTEMS by Rebecca Schaefer, P.E Joe Gorgan, P.E. WATERCON 2012 March 19, 2012 Presentation Outline Existing Digester Mixing Systems New Digester
Sometimes Being Faced With A Challenge Can Lead To Greater Opportunities
 Sometimes Being Faced With A Challenge Can Lead To Greater Opportunities Making the Case for Energy Savings Performance Contracting at the Opequon Water Reclamation Facility Frederick-Winchester Service
Customer-Owned Distributed Methane Interconnection Issues
 Customer-Owned Distributed Methane Interconnection Issues CO 2 CO 2 CH 4 CH 4 WIDRC Project: Development of a Strategy Paper on Customer-Owned Renewable Natural Gas Interconnection Issues The key to utilizing
Biogas upgrading, compression and utilization as an alternative to CHP
 Biogas upgrading, compression and utilization as an alternative to CHP Dr. Alfons Schulte-Schulze Berndt April, 1 Company, Technology and Products 2 Biogas production and utilization routes 3 4 4 Quality
Got Organic Waste? You ve got gas potential which can be beneficially used
 Got Organic Waste? You ve got gas potential which can be beneficially used 2012 Works Blazing New Trails in Sustainability Dodge City, Kansas March 28 2012 Speaker: Dennis Fenn, SVP Co Author: Mike Michels,
Green Energy Guild Molecular Gate Technology. Digester Gas Treatment for Energy Production / Pipeline Gas Production from WWTP Digester Gas
 Green Energy Guild Molecular Gate Technology Digester Gas Treatment for Energy Production / Pipeline Gas Production from WWTP Digester Gas The Ohio Water Environment Association 2009 BioSolids Systems
Southside Wastewater Treatment Plant Renewable Energy Leasing Project
 City of Dallas Water Utilities Department Southside Wastewater Treatment Plant Renewable Energy Leasing Project Presented to the TEC September 8, 2008 Southside Wastewater Treatment Plant Renewable Energy
Environmentally Friendly and Efficient
 Biogas Treatment H 2 S Removal - Extraction of Siloxanes Dehumidification Cost-Effective and Intelligent Biogas Conditioning Solutions Best In Class Technologies Biogas Treatment & Conditioning especially
Chapter 2: Description of Treatment Facilities
 2020 Facilities Plan Treatment Report 2.1 Introduction Chapter 2: Description of Treatment Facilities This chapter defines the Milwaukee Metropolitan Sewerage District (MMSD) service area. It also describes
Making Waste Productive. Creating Energy from Waste
 Making Waste Productive Creating Energy from Waste 1 Creating Energy Inputs from Current Waste Outputs Organic material (waste) can be converted into energy (methane) through a process called anaerobic
About the RRC. February
 Resource Recovery Centre (RRC) and Conveyance Pipe About the RRC Siting of the RRC Resource Recovery and Biosolids Management Odour, Noise, Traffic and Safety About the Residual Solids Pipe Spill Protection
Biogas Cogeneration System Sizing and Payback Based on Weekly Patterns of Anaerobic Digestion and Biosolids Dryer Operation
 Biogas Cogeneration System Sizing and Payback Based on Weekly Patterns of Anaerobic Digestion and Biosolids Dryer Operation ABSTRACT J.C. Kabouris, PhD, PE 1 ; CH2M HILL R. Forbes, PE, CH2M HILL T.G. Shea,
This presentation covers process steam energy reduction projects supported by the Ameren Illinois ActOnEnergy program.
 This presentation covers process steam energy reduction projects supported by the Ameren Illinois ActOnEnergy program. 1 2 Before we get started, here are four questions to find out what you already know
Farm Digesters and Digestion 101 by Mark Moser
 Farm Digesters and Digestion 101 by Mark Moser A Promising Solution - Anaerobic Digestion Technology Anaerobic digestion is one of the few manure treatment options that reduces the environmental impact
DTE Biomass Energy Renewable Natural Gas Project Development
 DTE Biomass Energy Renewable Natural Gas Project Development California Dairy Sustainability Summit November 28, 2018 DTE Biomass Energy Background Product Flow and Plant Layout 2 DTE Biomass Energy is
Item Hydrogen Gas Plant
 Item 6530. Hydrogen Gas Plant Hydro-Chem Hydrogen Generating Plant 90,000 scfh @ 200 psig. Purity 99.99% Hydrogen generating plant engineered by Hydro-Chem built in 1980. Design capacity is 90,000 scfh
VILLAGE OF ALGONQUIN 2014 WASTEWATER FACILITY PLAN UPDATE EXECUTIVE SUMMARY
 EXECUTIVE SUMMARY EXECUTIVE SUMMARY INTRODUCTION AND BACKGROUND The Village of Algonquin, located along the Fox River in McHenry County, provides wastewater collection and treatment services to the entire
What is District Energy
 A Special Review of District Energy & Integrated Distributed Energy presented to prepared by October 2010 SECTION ONE What is District Energy Technology? What is District Energy Technology? District Energy
(c) Tertiary Further treatment may be used to remove more organic matter and/or disinfect the water.
 Tertiary Further treatment may be used to remove more organic matter and/or disinfect the water.") ENERGY FROM SEWAGE Introduction - Sewage treatment, that is, the physical, chemical and biological processes used to clean industrial and domestic wastewater, has improved significantly over the past 20
ENERGY FROM SEWAGE Introduction - Sewage treatment, that is, the physical, chemical and biological processes used to clean industrial and domestic wastewater, has improved significantly over the past 20
Micro-Turbine Systems for Energy Production from Agricultural and Food Waste
 Micro-Turbine Systems for Energy Production from Agricultural and Food Waste Unison Solutions Overview Turnkey waste-to-energy systems Biogas compression/treatment system design and fabrication (Siloxane,
E N Power Generation
 Power Generation EN Tailor-made attitude at the service of energy As in Italian haute couture, the main focus of our work is to meet our customers requirements. We listen to needs, take measurements and
Making Wastewater Reclamation More Sustainable
 PAG Environmental Planning Advisory Committee (EPAC) Making Wastewater Reclamation More Sustainable Jackson Jenkins, Director Pima County Regional Wastewater Reclamation Department (RWRD) September 7,
MAXIMIZING BENEFITS WHILE MINIMIZING RISKS OF ADDING ALTERNATIVE FEEDSTOCK SOURCES
 MAXIMIZING BENEFITS WHILE MINIMIZING RISKS OF ADDING ALTERNATIVE FEEDSTOCK SOURCES BY Adam Bogusch AND Jeff Keller Considering adding alternative feedstocks to enhance the production of renewable biogas
Landfill Gas Direct Use in Industrial Facilities
 Landfill Gas Direct Use in Industrial Facilities Al Hildreth, General Motors Corporation, Worldwide Facilities Group, 2005 ABSTRACT Municipal solid waste landfills are the largest source of human-related
Natural Gas Processing Unit Modules Definitions
 Natural Gas Processing Unit Modules Definitions Alberta Climate Change Office Draft Version 1.0 December 2018 1 2 3 4 5 6 7 8 9 10 11 12 14 15 16 17 18 19 20 21 22 23 24 25 26 27 28 29 30 31 32 33 34 35
Codigestion Case Studies Enhancing Energy Recovery From Sludge
 Codigestion Case Studies Enhancing Energy Recovery From Sludge Dale Gabel, PE, BCEE MWRD PWO Seminar 1 May 23, 2012 What is Codigestion? Direct addition of high-strength organic wastes to municipal wastewater
Environment & Power Systems International. VOCGEN /CHP Feasibility Screening Data Form. Level 1 Feasibility Analysis
 VOCGEN /CHP Feasibility Screening Data Form VOCGEN /CHP Gensets and Systems (VOCGEN /CHP) can provide significant economic benefits to certain users. Whether VOCGEN /CHP can be economically beneficial
E2Tech Distributed Generation. Forum. Portland, ME. Dan Kelley-Vice President Energy & Power Engineering. Portland, ME
 E2Tech Distributed Generation Dan Kelley-Vice President Energy & Power Engineering Portland, ME Forum Portland, ME COMMITMENT & INTEGRITY DRIVE RESULTS Executive Summary Distributed Generation electric
ORGANICS RECOVERY ALTERNATIVES
 ORGANICS RECOVERY ALTERNATIVES Strive for Sustainability Conference May 18-21, 2014 George Bevington, Gerhardt LLC What does SSO mean? Wastewater Acronym: Bad phrase Environment Negative SSO = Sanitary
Overview of Biogas Technology
 Contents: 1-1. What are the Components of a Biogas System? 1 1-1.1 Manure Collection...1 1-1.2 Digester Types...2 1-1.3 Effluent Storage...3 1-1.4 Gas Handling...4 1-1.5 Gas Use...4 1-2. Benefits of Biogas
CITY OF BOISE. page 1 INTRA-DEPARTMENT CORRESPONDENCE. Date: October 26, Public Works Commission. Matt Hightree, Scott Canning, Paul Wakagawa
 CITY OF BOISE To: From: Public Works Commission Matt Hightree, Scott Canning, Paul Wakagawa INTRA-DEPARTMENT CORRESPONDENCE Date: October 26, 27 Subject: Energy Consumption at Major Facilities Managed
The Energy and Carbon Footprint of Water Reclamation and Water Management in Greater Chicago
 METROPOLITAN WATER RECLAMATION DISTRICT OF GREATER CHICAGO The Energy and Carbon Footprint of Water Reclamation and Water Management in Greater Chicago Joseph Kozak, PhD, PE Catherine O Connor, O PhD,
Myths and Facts. Myth: The Seaterra Program will not provide a high level of treatment for our wastewater.
 On April 7, 2014, Esquimalt council voted not to approve the CRD s request for changes to the zoning of the McLoughlin Point site for the Wastewater Treatment Plant. This decision does not change the requirement
2!g&, Landfill Gas Utilization Alternatives Study. Oneida Herkimer Solid Waste Management Authority. Regional Landfill. March 2009
 Oneida Herkimer Solid Waste Management Authority 2!g&, Regional Landfill Landfill Gas Utilization Alternatives Study March 2009 irton omiidice, PC. Engineers Environmental 5< tenti^ts Planner* i andu:ape
Methane Utilization at Coquitlam Landfill: Opportunities and challenges at an old, closed landfill
 Methane Utilization at Coquitlam Landfill: Opportunities and challenges at an old, closed landfill Harvey Choy (presenter) Solid Waste Department, Metro Vancouver Other contributors: Genevieve Tokgoz,
Ordinance 896 EXHIBIT B FOG SEPARATOR REQUIREMENTS
 Ordinance 896 EXHIBIT B FOG SEPARATOR REQUIREMENTS EXH B.001 GENERAL PROVISIONS A. Applicability This Exhibit B to Ordinance 896 sets forth uniform requirements for Food Service Establishments (FSEs) and
City of Toronto Solid Waste Management Services
 City of Toronto Solid Waste Management Services 8 th Canadian Waste Resource Symposium BIOGAS UTILIZATION: Disco Road Organics Processing Facility Carlyle Khan, Director Infrastructure Development & Asset
Landfill Biogas (LFG) Technology Applications
 Technology Applications") Landfill Biogas (LFG) Technology Applications Agenda LFG Utilization - General Direct Use Medium BTU Direct Use High BTU Electricity Production Combined Heat and Power 2 Why Use Biogas (LFG)? Local, available
Landfill Biogas (LFG) Technology Applications Agenda LFG Utilization - General Direct Use Medium BTU Direct Use High BTU Electricity Production Combined Heat and Power 2 Why Use Biogas (LFG)? Local, available
Desulfurization, to each project its unique solution
 Desulfurization, to each project its unique solution Desulfurization, To Each Project its Unique Solution R. Garcia Cano, R.M. van der Kloet, B. Bakker, J. Langerak, H. Dekker, E.H.M. Dirkse DMT Clear
Pinellas County Utilities (PCU) operates
 operates") FWRJ Biogas Cogeneration System Sizing and Payback Based on Weekly Patterns of Anaerobic Digestion and Biosolids Dryer Operation John Kabouris, Bob Forbes, Tim Shea, Mike Engelmann, and Jim Delaney Pinellas
FWRJ Biogas Cogeneration System Sizing and Payback Based on Weekly Patterns of Anaerobic Digestion and Biosolids Dryer Operation John Kabouris, Bob Forbes, Tim Shea, Mike Engelmann, and Jim Delaney Pinellas
WEAO STUDENT DESIGN COMPETITION 2019 PROJECT STATEMENT
 Water Environment Association of Ontario Young Professionals Committee and Student Design Competition Sub-Committee and the Ontario Ministry of the Environment and Climate Change in Collaboration with
Problem Statement WWTP. Biosolids Management. Biosolids 2 5/14/2013. Anaerobic Co-Digestion of FOG: Pilot Demonstration at BCUA
 Anaerobic Co-Digestion of FOG: Pilot Demonstration at BCUA Problem Statement Air Emissions NEW JERSEY WATER ENVIRONMENT ASSOCIATION SPRING CONFERENCE ATLANTIC CITY May 14, 013 Raw Wastewater WWTP Treated
Technology Description (TD) for. Biogas Upgrading Technologies
 for. Biogas Upgrading Technologies") Contact Information: Technology Description (TD) for Biogas Upgrading Technologies Name of institution: NeoZeo AB TECHNOLOGY/ EQUIPMENT SUPPLIER Name of contact Person: Dr. Petr Vasiliev Street: Villa
Contact Information: Technology Description (TD) for Biogas Upgrading Technologies Name of institution: NeoZeo AB TECHNOLOGY/ EQUIPMENT SUPPLIER Name of contact Person: Dr. Petr Vasiliev Street: Villa
Start Up and Performance of the Durham AWWTF Brown Grease Receiving and Cogeneration Facilities. Dan Garbely WSA FOG Forum 2016
 Start Up and Performance of the Durham AWWTF Brown Grease Receiving and Cogeneration Facilities Dan Garbely WSA FOG Forum 2016 Agenda Project Background Systems Overview Brown Grease Facility Cogeneration
State of the Art (SOTA) Manual for Stationary Gas Turbines
 Manual for Stationary Gas Turbines") State of the Art (SOTA) Manual for Stationary Gas Turbines Original Date: July 1997 Revision Date: November 1999 State of New Jersey Department of Environmental Protection Air Quality Permitting Program
State of the Art (SOTA) Manual for Stationary Gas Turbines Original Date: July 1997 Revision Date: November 1999 State of New Jersey Department of Environmental Protection Air Quality Permitting Program
TECHNOLOGIES ADDING VALUE ON BIOGAS TAIYO NIPPON SANSO CORPORATION NOX / GASALAM. Biogas Asia Pacific Forum June 2013 Kuala Lumpur, Malaysia
 TECHNOLOGIES ADDING VALUE ON BIOGAS TAIYO NIPPON SANSO CORPORATION NOX / GASALAM Biogas Asia Pacific Forum 12-14 June 2013 Kuala Lumpur, Malaysia 1 Brief Introduction of Taiyo Nippon Sanso Found in 1910
APPA 2017 Fuels 1. Energy Fuel Types Fuel consumption What fuels are we using? What are we using it for?
 Barry Mielke, PE South Dakota State University Energy Fuel Types Fuel consumption What fuels are we using? What are we using it for? APPA 2017 Fuels 1 As defined by your science teacher, Energy is the
Sulfur Tail Gas Thermal Oxidizer Systems By Peter Pickard
 Sulfur Tail Gas Thermal Oxidizer Systems By Peter Pickard Introduction SRU s (Sulfur Recovery Units) are critical pieces of equipment in refineries and gas plants. SRUs remove sulfur compounds from certain
BIOGAS PURIFICATION AND UTILIZATION. ENVE 737 Anaerobic Biotechnology for Bio-energy Production
 BIOGAS PURIFICATION AND UTILIZATION ENVE 737 Anaerobic Biotechnology for Bio-energy Production 1 Biogas Utilization 2 Biogas Utilization Production of Heat & Steam Electricity Production o o o Internal
Co-Digestion of food wastes at wastewater treatment plants. Alice Varkey, PEng Senior Engineer Mike Muffels, MSc PEng Senior Engineer June 2016
 Co-Digestion of food wastes at wastewater treatment plants Alice Varkey, PEng Senior Engineer Mike Muffels, MSc PEng Senior Engineer June 2016 Overview of presentation Introduction Example co-digestion
Chapter 5 Existing Wastewater Facilities
 Chapter 5 Existing Wastewater Facilities \\7348101\TOC.doc CHAPTER 5 Existing Wastewater Facilities 5.1 INTRODUCTION Lacey s wastewater utility serves over 21,000 acres (33 square miles) of residential
ImprovIng energy efficiency with chp: how to evaluate potential cost savings
 technical article ImprovIng energy efficiency with chp: how to evaluate potential cost savings Combined heat and power modules based on natural gas-fueled reciprocating engines promise increased energy
Wastewater Treatment clarifier
 Wastewater Treatment Pretreatment During pretreatment, items would normally be removed that would hinder the further processes of treatment. Items commonly removed include roots, rags, cans, or other large
PERMIT TO OPERATE SILVER CLOUD CT., MONTEREY, CA TELEPHONE (831) FAX (831)
 FAX (831)") FFR MONTEREY BAY UNIFIED AIR POLLUTION CONTROL DISTRICT PERMIT TO OPERATE 24580 SILVER CLOUD CT., MONTEREY, CA 93940 TELEPHONE (831) 647-9411 FAX (831) 647-8501 15018 OPERATION UNDER THIS PERMIT MUST BE
FFR MONTEREY BAY UNIFIED AIR POLLUTION CONTROL DISTRICT PERMIT TO OPERATE 24580 SILVER CLOUD CT., MONTEREY, CA 93940 TELEPHONE (831) 647-9411 FAX (831) 647-8501 15018 OPERATION UNDER THIS PERMIT MUST BE
! Overview of Waste-to-Energy! Waste Sources and Quantities! Waste-to-Energy Drivers and Benefits! West Lafayette Case Study. !
 ! Overview of Waste-to-Energy! Waste Sources and Quantities! Waste-to-Energy Drivers and Benefits! West Lafayette Case Study Project Development Digester Performance Biosolids Production Substrate Experience
Lessons learnt from Installation (Action B1-B3)
") Outotec Sweden AB SludgeIsBioFuel (LIFE12 ENV/SE/000359) LIFE Deliverable, Lessons learnt from Installation (Action B1-B3) Rev. Revision Description Prepared Checked Approved Date 1 Report RJo Dr TS Dr
Outotec Sweden AB SludgeIsBioFuel (LIFE12 ENV/SE/000359) LIFE Deliverable, Lessons learnt from Installation (Action B1-B3) Rev. Revision Description Prepared Checked Approved Date 1 Report RJo Dr TS Dr
Polishing Ponds. Biosolids Storage. Ammonia Removal. Digesters. Thickeners. Pretreatment. Final Clarifiers. Primary Clarifiers.
 Wastewater Treatment Facility (2012) Polishing Ponds Biosolids Storage Ammonia Removal Digesters Thickeners Pretreatment Primary Clarifiers Activated Sludge Final Clarifiers OVERVIEW Whenever a home, business,