Clark University Greenhouse Gas Emissions Update: 2016
|
|
|
- Ira Skinner
- 5 years ago
- Views:
Transcription
1 Clark University Greenhouse Gas Emissions Update: 2016 Clark University s total greenhouse gas emissions in 2016 were 13,368 metric tons of carbon dioxide equivalents, a small increase from 2015 which was in turn an increase over Two years is insufficient to label as a trend, however since 2009 our emissions have previously been steadily decreasing. Background In June 2007 President Bassett signed the American College and University Presidents Climate Commitment (ACUPCC), making Clark University a charter signatory to an exciting initiative aimed at mobilizing the resources of colleges and universities in efforts to reduce greenhouse gas emissions. The core goal of the commitment is to achieve climate neutrality with net zero greenhouse gas emissions, also known as carbon neutrality. The Clark University Environmental Sustainability Task Force (CUES) accepted the task of developing a Climate Action Plan with mitigation strategies to lead the University toward its goal of climate neutrality. In December of 2009 Clark University released the Climate Action Plan (CAP), detailing strategies for the University to reduce its greenhouse gas emissions. The plan sets two goals: an interim goal of reducing emissions to 20 percent below 2005 baseline levels by 2015 (to 16,357.4 MTCO2e), and the ultimate goal of carbon neutrality by the year The CUES Task Force retained responsibility for recording and reporting on Clark s emissions. In 2014 the CUES Task Force commissioned an update to assess viability of CAP strategies (i.e. changes in technology or University environment), and to recommend additional strategies with incremental goals; the update was not adopted and the CAP remains as published. The Task Force has not convened since 2014 pending the appointment of a Chair and Task Force members by President David Angel. The CAP interim goal set for 2015, 16,357.4 MTCO2e, was achieved in 2010, one year after the CAP was released. It has not been exceeded since. Achieving the significantly more ambitious goal of carbon neutrality by 2030 requires willingness on the part of all members of the Clark University community to recognize and invest in mitigation action as an institutional and personal priority, and to make the trade-offs required. Methodology In order to effectively manage carbon footprint and emission reduction strategies, data for a Greenhouse Gas (GHG) Emissions Inventory has been collected annually since (GHG inventories from prior years use actual and estimated data). Data is gathered from a range of campus entities and we utilize the Campus Carbon Calculator (CCC) created by Clean Air-Cool Planet (CA-CP) to calculate our emissions inventory. Once a leading non-profit organization and a standard in the field, CA-CP closed its doors in late All support operations for the Campus Carbon Calculator have been transferred to the University of New Hampshire Institute for Sustainability as of The ACUPCC was also replaced in 2014; Second Nature is the non-profit organization that currently monitors greenhouse gas reporting and manages the interests of the former ACUPCC. In the Inventory, inputs are recorded for Scope 1 sources (on-site combustion, such as boilers and vehicle use); Scope 2 sources (off-site combustion, such as purchased electricity) and certain Scope 3 sources (other combustion such as commuting) according to ACUPCC guidelines. The six greenhouse gases inventoried are those included in the Kyoto Protocol: carbon dioxide (CO2), methane (CH4), nitrous oxide (N2O), hydro fluorocarbons (HFCs), perfluorocarbons (PFC), and sulfur hexafluoride (SF6). Of these six, CO2 (produced during the combustion of all fossil fuels) and to a much lesser degree HFCs (gases that are used in refrigerants and air conditioners) have been shown to be the primary gases emitted on campus. For ease of understanding and comparison, all gases are converted to a common measure: 1
2 carbon dioxide equivalents, CO2e. The CCC uses updated emissions factors to determine the amount of metric tons of carbon dioxide equivalent (MTCO2e) added to the atmosphere by campus operations across all inventoried inputs. The results of past inventories have been reported to ACUPCC and shared with University administration via the annual Climate Action Plan (CAP) Update. The annual CAP Updates are also available at Sustainable Clark ( Revisions and Updates to the CCC; Impact on Data Due to the evolving nature of greenhouse gas emission factor science, Clark University consistently utilizes the most current version of the CCC for charts and data analysis in the annual CAP Update. Therefore, previous Updates may show annual or category data points that differ from the current Update; included charts will reflect this. Clark s interim goal was based on 2005 emissions and the standards at the time, as were the benchmarks and mitigation strategies in the CAP; our interim goal therefore remains unchanged at 16,357.4 MTCO2e. The 2016 greenhouse gas emissions inventory uses version 9.0 of the Campus Carbon Calculator (CCC), in which emissions factors have been updated to reflect the most recent available data from EPA, E- GRID, DOE, IPCC and other public data sources. Many standards are retroactive and almost all of Clark s past data stored in the CCC from is affected by various updates. Even small changes in the factors will add up over time and retroactively. For example, updates in CCC version 7.0 (2013) impacted Clark s recorded data retroactively to CCC version 6.85 (2012) included over 40 substantial updates. CCC version 6.7 (2011) included EPA revisions for certain emissions- producing activities which impacted CO2 equivalency calculations retroactive to For full list of CCC updates as well as more information on the CCC: Benchmarking It should be noted in all data comparisons that 2014 is considered a benchmark-normal year. Weather patterns were typical and therefore the amount of heating and cooling produced on campus (Scope 1) can be termed average is also a benchmark-normal year in regards to campus operations; the co-generation engine operated throughout the year with normal inputs and there were no major renovation projects (Scope 2). As unforeseen or scheduled operational events occur to influence production capacity and as other factors (including changes in technology, population or footprint) influence Clark s demand for energy it is important to recognize that improving Clark s core energy efficiency and energy consumption practices will be measured against 2014 as a benchmark of normal per capita and per square foot energy usage. 2

3 2016 Emissions Data: Overview Total GHG emissions in 2016 were 13,368.1 MTCO2e. This represents an increase of 2 percent from total 2015 GHG emissions of 13,123.2 MTCO2e. Net GHG emissions in 2016 after offsets were 13,357.8 MTCO2e, an increase of 2 percent versus 13,112.9 MTCO2e in The CAP Update details some of the probable causes for the difference year-to-year. If and when all else is held constant, emissions will change in proportion to personal energy use. However, yearto-year differences in weather, sourcing and other conditions beyond University control will impact on- campus generated emissions from energy production and campus fleet. External factors also beyond our control will effect emissions from purchased electricity and personal transportation. As climate instability increases it is ever more important to manage those University practices that do fall within our sphere of influence to offset what is beyond our control. Below is a chart showing the trend over time in Clark s greenhouse gas emissions, measured in MMTCO2e Clark's Emissions MMTC0 2 e Total Greenhouse Gas Emissions in thousands of MTCO2e Year Emissions: Percent by Scope & Sector The largest source of Clark s greenhouse gas emissions is Scope 1: fuel consumed by Clark s power plant, boilers, and cogeneration engine to produce both electricity and heat. This Scope is primarily two Sectors: Cogeneration and Boilers. It comprised 65.4% of all emissions in 2016; in 2015 the same Sectors were 62.7% of all emissions. Our Scope 2 emissions derive entirely from the operations of the electric utility (National Grid) from which Clark 3
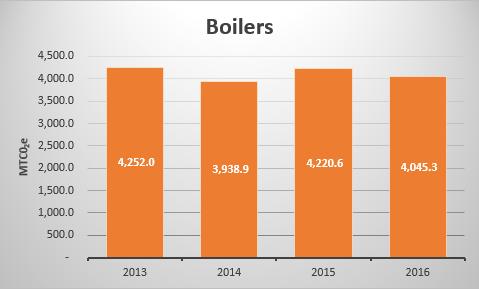
4 MTC0 2 e purchases electricity for needs not served by the cogeneration plant. This Sector is termed Purchased Electricity and comprised 4.8% of all emissions in 2016 compared to 5.6% in 2015, 1.6% in 2014 and up to 30% prior to Clark s partnership with Solar Flair; more on this beneficial arrangement below. The second largest emissions source is Scope 3, also primarily two Sectors: fuel used in employee commute and University sponsored air travel. This Sector comprised 28.8% in 2016 compared to 27.3% in 2015, a slight increase. Scope 3 has continued to increase over time in the absence of institutionally managed solutions for transportation. Lesser emissions sources in Scopes 1 and 3 include refrigerants, utility-based transmission and distribution losses, waste to energy (incineration), and campus fleet; all 2% or less. Below are charts of emissions by 2016 MTCO2e per sector and by sector percentage of total, as well as charts of individual sector emissions data from It is useful to recognize overall trends within each sector, bearing in mind that the scales differ. 14, ,165.1 Clark's Emissions by Usage Sector MTC0 2 e 12, , , , , , , , , , , , , , ,045.3 Air Travel Faculty/Staff Comuting Purchased Electricity Campus Fleet Boilers 4, , , , , ,695.3 Cogeneration Plant

5 The chart below indicates percent-of-total emissions for the major contributing sectors. Clark's Emissions by Usage Sector Percent of Total % Cogeneration Plant 15% 5% 35 Boilers Campus Fleet Purchased Electricity Faculty/Staff Comuting Air Travel 30% The series of charts below, while at varying scales, indicate the specific volume and therefore overall trend of individual contributing sectors from All measures are in MTCO2e; totals per year are found in the stacked bar chart above. 5


6 \ 6


7 Explanations: Scope 1, On-Site Combustion from Co-Generation and Boilers The cogeneration engine was not operating for three months in 2016 but for the balance of the year operated at peak efficiency. This is not dissimilar to 2015 when the co-gen was also out of operation for several months. However, the emissions from both co-generated electricity and co-generated steam (for heating and cooling) are larger in 2016 than 2015, attributable to increased demand and an extended heating season in the spring of Emissions derived from boiler operations are relatively stable. Explanations: Scope 2, Purchased Electricity While Clark s cogeneration plant provides most of the electricity for central campus, we purchase electricity for several reasons: to supply buildings that are not connected to the co-gen, to supply excess demand outside of co-gen capacity, and when the co-gen is not operational. We purchased 100% of all demanded electricity during the period that the cogeneration engine was non-operative in
8 Other Impacts: Scope 2 Solar Flair: 2016 marked the second full year of our partnership with Solar Flair providing Clark solar energy credits through what is known as an alternative PPA. In 2016, the solar production credit accounted for 48% of Clark s total purchased electricity as measured in kwh, and enabled us to decrease our reported emissions by this amount. This is nearly identical to Solar Flair s farms are operating at full build-out production capacity. Therefore, any additional decreases in Scope 2 emissions will require that Clark commit to comprehensive energy efficiency, targeted management of consumption practices, or additional renewable energy sources. (For a full explanation of Clark s arrangement with Solar Flair and National Grid, please see the CAP Update 2014). Alumni and Student Engagement Center Solar Array: Clark s new building was opened in August The rooftop solar array can produce up to 50% of the building s electricity demand as designed. Because the building is all-electric (heating and cooling as well as lighting, equipment and appliances) and is not connected to the co-gen, electricity demand in excess of on-site solar production will be Scope 2, purchased electricity; those emissions are included in the 2016 total. ASEC is expected to receive LEED Platinum certification and includes a number of energy efficient features, some of which are engineered systems (i.e. programmed occupancy sensors) and others of which are user-dependent (i.e. manually closing shades). However, the building interior design and specifications were altered at a later date which may make it less energy-efficient overall. With less than five months operation and pending meter adjustments we will not include more detailed ASEC data (i.e. % of solar in total demand) in this Update. Excess Production: The cogeneration engine runs consistently at optimum load and produces more electricity than campus can use during low-demand hours. This kwh excess production is returned to the electric utility grid without any offsetting credit, and Clark incurs the full burden of production-based emissions without actually using all of the electricity. The 2016 amount is approximately 6.6% of total production, or 387 MTCO2e. The University is close to the end of negotiations with National Grid to establish net metering, in which Clark would receive payment for the excess electricity transferred to the grid. However, under this agreement we would still include any produced emissions in our reporting. Explanations: Scope 3, Commute and Travel Scope 3 increased 3% in 2016 versus Daily (vehicle) commute emissions increased while the air travel emissions decreased. Neither study abroad nor student commute is included in Clark s version of the greenhouse gas emissions inventory. To calculate emissions from daily commuting we assume a fulltime employee annual mileage based on survey data rather than actual recorded mileages, and extrapolate with full-time and part-time employee data provided by the institution. As noted previously, until and unless there are University-supported solutions to the single-driver commute, such as offset incentives, carpooling and shuttle programs, or telecommuting, this emissions source will continue to increase. To calculate air travel emissions, we use industry-accepted average cost-per-mile standards and actual University travel expenses. (Although based on assumptions, the calculation method has remained consistent year to year and therefore provides a valuable metric). Air travel produces a large amount of emissions due to the magnified effects of fuel combustion at high altitudes, so even a small change in directly-financed air travel has a significant effect on Scope 3 emissions. Institutional solutions include incentivized carbon offsets, changing behavior to travel less frequently or more efficiently, and electronic 8
9 options such as video conferencing. Certainly air travel for necessary conferences, recruitment and other institutional functions is vital to the continued success of Clark University. As is the case with faculty and staff commute, this data will not change significantly until viable alternatives are enacted. Energy Use on Campus The Climate Action Plan s goals and mitigation strategies, including energy management strategies, are expressed in MTCO2e. There is a direct relationship between fossil fuel combustion to support energy consumption and MTCO2e. Technology-dependent strategies that reduce energy consumption (for example lighting efficiency, mechanical system upgrades) will reduce MTCO2e although they may be offset by other nontechnological increases such as a larger population or physical space footprint. For example, by 2013 Clark had completed a program of large-scale technology-based energy and lighting improvements, and although we can track building-specific energy usage data it is challenging to isolate a specific technology impact due to other input variables. Non-technological mitigation strategies (for example personal energy conservation practices, maximizing use of space) are harder to quantify than technology strategies but in the long run equally significant in managing Clark s energy consumption patterns as they will have a long term and aggregate effect. At this time there are no plans for additional comprehensive improvements in energy systems or efficiency, although incremental projects are on-going. We measure electrical energy and thermal (heating) energy. Electricity Actual total campus electrical load (Scope 1 electricity produced in the co-gen plus Scope 2 purchased electricity) of 12,638,642 kwh presented a 2.6% increase compared to 2015, which was a 7.8% increase over The electrical load in 2016, less the solar credits, equates to 2,980 MTCO2e. The campus load has increased steadily since 2012, due to a variety of factors including increased population, additional personal and academic electronic use, and hotter summers requiring more air conditioning. Heat Clark s 2016 thermal energy use for heating was similar to 2015, at 6,406 MTCO2e. This measure has remained relatively constant since 2012; until and unless there is University support for lower ambient temperatures and reduced set points or an investment in our control technology, it is likely to vary along with seasonal temperature variations, University space use and closure practices, and population. Therms As there is a direct relationship between energy consumption and MTCO2e created, it is helpful to examine the energy-related greenhouse gas inventory data in terms of a standard unit of energy measurement: therms. This is expressed in million British thermal units, or MMBtu s, and is in common use when evaluating energy output or overall usage regardless of source. Scopes 1, 2 and 3 can all be expressed in therms to indicate energy across sectors. An energy consumption profile differs from an emissions profile; it evens out the impact of different Kyoto Protocol gasses to a common measure. The calculations are based on EPA standards in use and derived from the CCC. In the charts below, kwh, fossil fuel in gallons and natural gas are expressed in MMBtu s to provide a comparative analysis of actual energy consumption across sectors and across time. 9
10 MMBTU Clark's Emissions by Usage Sector, 2016 Therms - MMBtu 90,000 70,000 50,000 30,000 88,312 76,076 10,000 1,657 14,571 27,391 9,239-10,000 Cogeneration Plant Boilers Campus Fleet Purchased Electricity Faculty/Staff Comuting Air Travel 100,000 Clark's Therms by Usage Sector ,000 60,000 40,000 20, Cogeneration Plant Boilers Campus Fleet Purchased Electricity Faculty/Staff Comuting Air Travel MMBtu Cogeneration Plant 105, ,581 80,209 88,312 Boilers 77,951 73,174 78,338 76,076 Campus Fleet 2,394 2,251 2,035 1,657 Purchased Electricity 9,949 9,253 16,090 14,571 Faculty/Staff Commuting 18,258 15,849 21,672 27,391 Air Travel 5,952 9,272 10,830 9,239 10
11 Conclusion Greenhouse gas emissions for 2016 are similar to the previous year, with a 2% increase that cannot be directly attributed to a particular causal factor was a landmark year in our Climate Action Plan, the year of our interim goal to reduce emissions 20% below baseline. This interim goal was actually achieved in 2010 and has not been exceeded since. The University has no other interim goals between now and our commitment to net zero emissions by Where are we in relation to our next and ultimate goal? As of 2016, Clark has reduced total emissions by 17.2% over the 2005 baseline. Much of that reduction has occurred from CAP mitigation strategies and large-scale investments implemented in From 2009 until 2016, Clark has reduced total emissions 14.8% percent while our physical footprint, use of electronics, and student population has grown. To put this seemingly impressive statistic into the larger context, however, if we continue the same rate of emissions reduction and hold all else constant in a business as usual strategy, by 2030 we will have reduced emissions by 26% percent over baseline but still be less than halfway to our ACUPCC commitment and carbon neutrality goal. There is much uncertainty in looking 16 years ahead. Taking advantage of future developments in technology may provide exponential reductions. Our long-established practice of efficiency upgrades and retrofits as appropriate and affordable will continue to have incremental impact. A number of strategic initiatives explored in the CAP and in other avenues but not yet enacted may prove significant if implemented, while voluntary behavior change can aggregate and show results over time. Perhaps re-visiting the CAP with updated mitigation strategies will be successful. The purchase of carbon offsets is a last resort, but unless we aggressively move to enact all of the above and go beyond our to-date annual rate of emissions reductions, Clark will be forced to enter the carbon offset market to meet its 2030 Climate Action goal. Scope 3 has emerged as the true and as yet unaddressed challenge. Scope 1 or 2 can be directly impacted by investments in operations-based technology and efficiency solutions. Scope 3 on the other hand requires softresource investment in policy and institutional support for broad behavioral change. For example, University commitment to well-monitored programs and institutional incentives for alternatives such as telecommuting, shuttle service, supported car and van pools, managed parking, or personal carbon offsets combined with a mandate toward whole-campus engagement could reduce Scope 3 emissions. Clark is not alone in struggling with Scope 3 realities. Although we have reached and to date retained our interim goal, it is clear that business as usual for the next 14 years will not achieve the goal of the Climate Action Plan without relying on the carbon offset market mechanism. Continued expansion of the University combined with continuing unstable weather patterns make achieving our 2030 goal of carbon neutrality extremely challenging without addressing significant behavioral, habitual and technological inputs as a community, and without investing in them financially, operationally and personally. Clark s Climate Action Plan provides a roadmap to effectively achieve our Climate Commitment goals, however there is still much to be accomplished that will require the commitment and ingenuity of the entire Clark community if we are to meet our goals of climate neutrality - net zero emissions - by As the Clark University Environmental Task Force has noted in several reports, the lowhanging fruit has been captured via CAP mitigation strategies and while operations-based investments in technology will continue, to truly impact our emissions a whole-campus approach that includes every employee with high levels of administrative support and direction to ask for significant behavior change, as well as changing long-held habitual and institutionally-condoned practices, will be necessary before
Clark University Greenhouse Gas Emissions Update: Clark University Still on Track for Emissions and Carbon Neutrality Interim Goal.
 Clark University Greenhouse Gas Emissions Update: 2014 Clark University Still on Track for Emissions and Carbon Neutrality Interim Goal Background In June 2007 President Bassett signed the American College
Clark University Greenhouse Gas Emissions Update: Clark University on Track for Emissions and Carbon Neutrality Goals.
 Clark University Greenhouse Gas Emissions Update: 2013 Clark University on Track for Emissions and Carbon Neutrality Goals Background In June 2007 President Bassett signed the American College and University
Clark University Greenhouse Gas Emissions Update: Clark University on Track for Carbon Reduction and Carbon Neutrality Goals.
 Clark University Greenhouse Gas Emissions Update: 2012 Clark University on Track for Carbon Reduction and Carbon Neutrality Goals Background In June 2007 President Bassett signed the American College and
Clark University on Track for Carbon Reduction and Carbon Neutrality Goals
 Clark University Greenhouse Gas Emissions Update: 2010 Clark University on Track for Carbon Reduction and Carbon Neutrality Goals Background In June 2007 President Bassett signed the American College and
College of Lake County Sustainability Center
 ~ 1 ~ Climate Action Plan College of Lake County College of Lake County Sustainability Center ~ 2 ~ Table of Contents I. Introduction...3 A. CLC s Climate Commitment... 3 B. Executive Summary... 4 C. CLC
CAMPUS EMISSIONS 37,749.6
 CAMPUS EMISSIONS As a signatory of the American College and University s Presidents Climate Commitment (ACUPCC), Radford University has conducted its first publically available greenhouse gas (GHG) inventory.
UH Carbon Footprint Katrina Wamble -Sustainability Task Force
 UH Carbon Footprint 2010 -Katrina Wamble -Sustainability Task Force 21 February 2011 Approach http://www.cleanair-coolplanet.org/toolkit/inv-calculator.php v. 6.3 Copyright Clean Air - Cool Planet, 2008
Ten years and moving forward... Inventory of Greenhouse Gas Emissions University of Missouri St. Louis. Commitment to Climate Action
 Inventory of Greenhouse Gas Emissions 2002-2012 University of Missouri St. Louis Commitment to Climate Action The University of Missouri St. Louis signed the American College and University President s
NORTHERN VIRGINIA COMMUNITY COLLEGE GREENHOUSE GAS INVENTORY JULY 2011-JUNE 2016
 NORTHERN VIRGINIA COMMUNITY COLLEGE GREENHOUSE GAS INVENTORY JULY 2011-JUNE 2016 Publication date: November 2018 Table of Contents EXECUTIVE SUMMARY... 1 INTRODUCTION AND METHODS... 2 FINDINGS... 3 DATA
Davidson College Climate Action Planning Process Greenhouse Gas Emissions Primer
 Davidson College Climate Action Planning Process Greenhouse Gas Emissions Primer Greenhouse Gases What are greenhouse gases? Greenhouse gases are a group of gases present in the atmosphere both naturally
Climate Action Plan. University of Toledo Public Meeting #1 April 24, 2013
 Climate Action Plan University of Toledo Public Meeting #1 April 24, 213 Brooke Mason Interim Sustainability Specialist brooke.mason@utoledo.edu 419-53-142 Alexa Orr SEED CAP Intern alexandra.orr@rockets.utoledo.edu
2007 UW-Stevens Point Greenhouse Gas Inventory
 Summary of Approach and Findings for the 2007 University of Wisconsin-Stevens Point Greenhouse Gas Inventory 2007 UW-Stevens Point Greenhouse Gas Inventory Submitted by the University of Wisconsin- Stevens
Greenhouse Gas. Emissions Report. December 2011
 Greenhouse Gas Emissions Report December 211 EXECUTIVE SUMMARY This report summarizes the greenhouse gas (GHG) emissions inventory for the University of Saskatchewan (UofS) campus through fiscal years
Annual Greenhouse Gas Emissions Inventory Update for FY 2017 (September 20, 2017)
") Annual Greenhouse Gas Emissions Inventory Update for FY 2017 (September 20, 2017) Background and Overview Bowdoin College committed to become carbon-neutral by the year 2020 and released a detailed implementation
Annual Greenhouse Gas Emissions Inventory Update for FY 2017 (September 20, 2017) Background and Overview Bowdoin College committed to become carbon-neutral by the year 2020 and released a detailed implementation
QUEEN S UNIVERSITY GREENHOUSE GAS INVENTORY REPORT 2017
 QUEEN S UNIVERSITY GREENHOUSE GAS INVENTORY REPORT 2017 September 2018 INTRODUCTION In 2010, Queen s University signed the University and College Presidents Climate Change Statement of Action for Canada,
Energy Use and the University of Kentucky Info Sheet and Frequently Asked Questions
 Energy Use and the University of Kentucky Info Sheet and Frequently Asked Questions Students, faculty and staff of the University of Kentucky are increasingly interested in the status of our environment,
Baseline Carbon Footprint
 Baseline Carbon Footprint June 2008 Temporal Boundary June 2007 thru May 2008 Prepared by The Loyalton Group A Sodexo Education Partner Contents 1. Cover 2. Contents 3. Basic Terminology 4. Strategic Focus
GHG EMISSIONS INVENTORY AT USU
 GHG EMISSIONS INVENTORY AT USU To assess the impact an organization imposes on the climate, a thorough evaluation of its carbon footprint is necessary. A greenhouse gas (GHG) emissions inventory identifies,
Radford University s 2016 Greenhouse Gas Inventory July 1, 2015 June 30, 2016
 Radford University s 2016 Greenhouse Gas Inventory July 1, 2015 June 30, 2016 Summary Radford University conducts an annual inventory of its greenhouse gas emissions. The process collects data about emissions
Introduction to Greenhouse Gas Accounting
 Introduction to Greenhouse Gas Accounting New to GHG accounting? Start here. 1. Setting Boundaries 2. Keeping a Collection Journal 3. Collecting Data a. Institutional Data b. What are Scopes? c. Scope
Non-State and Subnational Action Guidance
 NewClimate Institute, World Resources Institute, CDP, The Climate Group Non-State and Subnational Action Guidance Guidance for integrating the impact of non-state and subnational mitigation actions into
QUEEN S UNIVERSITY GREENHOUSE GAS EMISSIONS INVENTORY SUMMARY 2015
 QUEEN S UNIVERSITY GREENHOUSE GAS EMISSIONS INVENTORY SUMMARY 2015 INTRODUCTION In 2010, Queen s University signed onto the University and College Presidents Climate Change Statement of Action for Canada,
City of Tacoma Community and Municipal Greenhouse Gas Emissions Inventory
 City of Tacoma Community and Municipal Greenhouse Gas Emissions Inventory 2012 12/18/13 Table of Contents List of Figures and Tables ii Overview 3 Methodology 5 Emissions from Municipal Operations 7 Incorporating
SAINT JOHN S UNIVERSITY COLLEGEVILLE, MN GREENHOUSE GAS EMISSIONS INVENTORY REPORT
 SAINT JOHN S UNIVERSITY COLLEGEVILLE, MN GREENHOUSE GAS EMISSIONS INVENTORY REPORT 2009-2010 REPORT ISSUE DATE: JANUARY 2010 EXECUTIVE SUMMARY The Office of Sustainability at Saint John s University (SJU)
The University of Connecticut Climate Action Plan:
 The University of Connecticut Climate Action Plan: Guiding the Path toward Carbon Neutrality Table of Contents Section 1: The UConn Climate Action Planning Process... 1 14 The University of Connecticut...
2011 & 2012 Queen s University Greenhouse Gas (GHG) Inventory
 Inventory") 2011 & 2012 Queen s University Greenhouse Gas (GHG) Inventory Summary Queen s University completes annual GHG inventories as part of the ongoing commitment to reduce GHG emissions and address climate change
2011 & 2012 Queen s University Greenhouse Gas (GHG) Inventory Summary Queen s University completes annual GHG inventories as part of the ongoing commitment to reduce GHG emissions and address climate change
Greenhouse Gas Emissions Inventory 2015
 Greenhouse Gas Emissions Inventory 2015 Introduction Measuring Greenhouse Gas & Climate Impact at Tulane Since 2006, Tulane University has conducted an annual Greenhouse Gas (GHG) emissions inventory,
Greenhouse Gas (GHG) Emissions Inventory Fiscal Year 2011
 Emissions Inventory Fiscal Year 2011") Greenhouse Gas (GHG) Emissions Inventory Fiscal Year 2011 Prepared by the Office of Sustainability for the Environmental Advisory Council Page 1 of 9 Environmental Advisory Council Members Kyle Altmann
Greenhouse Gas (GHG) Emissions Inventory Fiscal Year 2011 Prepared by the Office of Sustainability for the Environmental Advisory Council Page 1 of 9 Environmental Advisory Council Members Kyle Altmann
Tulane University 2013 & 2014 Greenhouse Gas Emissions Inventory
 Tulane University 2013 & 2014 Greenhouse Gas Emissions Inventory Introduction As the urgency of climate change increases, it is crucial that major institutions take responsibility for their contribution
Greenhouse Gas Inventory University of North Carolina at Wilmington
 Greenhouse Gas Inventory University of North Carolina at Wilmington August 2017 Acknowledgements This report was prepared by graduate student Daniel Pate with the help of methodologies developed by The
Seventh Biennial Report on Progress toward Greenhouse Gas Reduction Goals
 Report to the Joint Standing Committee on Environment and Natural Resources 128 th Legislature, Second Session Seventh Biennial Report on Progress toward Greenhouse Gas Reduction Goals January 2018 Contact:
Annual Greenhouse Gas Emissions Inventory Update for FY 2016 (October 7, 2016)
") Annual Greenhouse Gas Emissions Inventory Update for FY 2016 (October 7, 2016) Background and Overview Bowdoin College committed to become carbon-neutral by the year 2020 and released a detailed implementation
Annual Greenhouse Gas Emissions Inventory Update for FY 2016 (October 7, 2016) Background and Overview Bowdoin College committed to become carbon-neutral by the year 2020 and released a detailed implementation
Energy and Climate. Energy and Climate. Summary of Activities and Performance
 Energy and Climate Society s patterns of energy use may represent the single greatest environmental impact, with central importance for the economy and consequences for human health. There is a link to
PARK CITY MUNICIPAL CORPORATION 1990 & 2007 CARBON INVENTORY BASELINE ASSESSMENT
 EXECUTIVE SUMMARY C6 PARK CITY MUNICIPAL CORPORATION 1990 & 2007 CARBON INVENTORY BASELINE ASSESSMENT Executive Summary Park City Municipal Corporation 1990 & 2007 Carbon Inventory Baseline Assessment*
Greenhouse Gas Emissions Inventory FY 11
 Summary Greenhouse Gas Emissions Inventory FY 11 The Fiscal Year 2011 Greenhouse Gas Inventory details greenhouse gasses (GHG) emitted by Hobart and William Smith Colleges (HWS) during the 2011 fiscal
The Lynn University Carbon Footprint and Analysis. Baseline Report. December, Prepared by Frank Lucas and Alex Keller
 1 The Lynn University Carbon Footprint and Analysis Baseline Report December, 17 2012 Prepared by Frank Lucas and Alex Keller 2 Table of Contents I. Executive Summary 3 II. Introduction 7 III. Methods
CLIMATE ACTON PLANNING & MITIGATION: Base Year 2016 Greenhouse Gas Inventory Results
 CLIMATE ACTON PLANNING & MITIGATION: Base Year 2016 Greenhouse Gas Inventory Results Taking Action on Climate Change The City of St. Petersburg is taking bold action to reduce its contributions to global
U.S. Emissions
 PSEG Voluntary Greenhouse Gas Emissions Inventory 2000 2006 U.S. Emissions Public Service Enterprise Group (PSEG) 80 Park Plaza Newark, NJ 07102 www.pseg.com October 2007-1- Printed on Recycled Paper Table
DuPage County Energy & Emissions Profile
 DuPage County Energy & Emissions Profile Prepared for: DuPage County Green Government Council Joy Hinz, Environmental Specialist Submitted by: CNT Energy and the Center for Neighborhood Technology November
University of New Hampshire Durham Campus
 University of New Hampshire Durham Campus Greenhouse Gas Emissions Inventory 1990-2000 Executive Summary A collaborative project of the UNH Office of Sustainability Programs and Clean Air - Cool Planet
Washtenaw Community College Greenhouse Gas Inventory
 2014 Washtenaw Community College Greenhouse Gas Inventory Prepared by: Dale Petty Executive Summary This report on the greenhouse gas emissions of Washtenaw Community College has been prepared in support
Greenhouse Gas Emissions Inventory A comparative survey of emissions from year 2006 through 2009
 Spring Greenhouse Gas Emissions Inventory A comparative survey of emissions from year 2006 through 2009 Photo courtesy of Appalachian State University Photo courtesy of Appalachian State University Appalachian
GREENHOUSE GAS INVENTORY FY 2015 UPDATE
 GREENHOUSE GAS INVENTORY FY 2015 UPDATE OVERVIEW Temple University (Temple) has prepared a greenhouse gas (GHG) inventory program in support of its participation in Second Nature s Climate Commitment.
Independent Accountants Review Report
 KPMG LLP Suite 1900 440 Monticello Avenue Norfolk, VA 23510 Independent Accountants Review Report The Board of Directors : We have reviewed the accompanying Statement of Greenhouse Gas Emissions of Norfolk
CHE 670 Sustainability
 CHE 670 Sustainability Seminar GHG Calculators David A. Carter Kansas State University Pollution Prevention Institute January 6, 2010 ``I think you should be more explicit here in step two...'' EPA Greenhouse
Greenhouse Gas Assessment / EYP Architecture and Engineering P.C.
 Greenhouse Gas Assessment 2009-2010 / EYP Architecture and Engineering P.C. a project of the EYP Planet program Content Prepared By: The Green Roundtable 38 Chauncy Street Boston, MA 02111 / EYP Architecture
GREENHOUSE GAS EMISSIONS INVENTORY FOR THE UNIVERSITY OF WYOMING: Fiscal Year 2014
 GREENHOUSE GAS EMISSIONS INVENTORY FOR THE UNIVERSITY OF WYOMING: Fiscal Year 2014 by Julia Scott For The Campus Sustainability Committee of the University of Wyoming And The American College and University
GREENHOUSE GAS EMISSIONS INVENTORY FOR THE UNIVERSITY OF WYOMING: Fiscal Year 2013
 GREENHOUSE GAS EMISSIONS INVENTORY FOR THE UNIVERSITY OF WYOMING: Fiscal Year 2013 by Divantha Ekanayake For The Campus Sustainability Committee of the University of Wyoming And The American College and
GMC Greenhouse Gas Emissions Inventory FY 2015
 GMC Greenhouse Gas Emissions Inventory FY 2015 Overview Green Mountain College s (GMC) sustainability office completed the school s fifth greenhouse gas (GHG) emissions inventory in August of 2015. This
Terrie Boguski Harmony Environmental, LLC Kansas State University. January 2010
 Terrie Boguski Harmony Environmental, LLC Kansas State University January 2010 What are Greenhouse Gases? Gases that allow sunlight to enter the atmosphere freely. When sunlight strikes the Earth s surface,
Strategies for measuring and reducing your carbon footprint
 Strategies for measuring and reducing your carbon footprint Mayra Portalatin, LEED AP O + M Project Manager, Facility Engineering Associates, PC SESSION NO.: T1.24 TUESDAY, MARCH 15, 2011 ROOM NO.: 324
University of Maryland University College Climate Action Plan Progress Update. January 2014
 University of Maryland University College Climate Action Plan Progress Update January 2014 Coordinated and Written by: Cora Lee Gilbert Director of Sustainability and Contract Services, University of Maryland
APPENDIX B: CITY OF RED LODGE BASELINE INVENTORY
 APPENDIX B: CITY OF RED LODGE BASELINE INVENTORY CITY OF RED LODGE BASELINE ASSESSMENT October 2017 An Energy Use, Cost & Greenhouse Gas Emissions Inventory of City Government Operations Kathryn Eklund
GREENHOUSE GAS INVENTORY FY 2016 UPDATE
 GREENHOUSE GAS INVENTORY FY 2016 UPDATE OVERVIEW Temple University (Temple) has prepared a greenhouse gas (GHG) inventory program in support of its participation in Second Nature s Climate Commitment.
BENCHMARKING & DISCLOSURE REPORT
 BENCHMARKING & DISCLOSURE REPORT DRAFT COPY SUBJECT PROPERTY: Property Name: Property Address: Property Type: Gross Square Footage (SF): Office 6 - Pre ECM 69 New Street New York, NY 10004 Office - Large
An Energy Use and Emissions Inventory
 Cedarville University DigitalCommons@Cedarville Science and Mathematics Faculty Presentations Department of Science and Mathematics 6-26-2011 An Energy Use and Emissions Inventory Mark A. Gathany Cedarville
TI Corporate Citizenship Topic Brief. Climate change
 TI Corporate Citizenship Topic Brief Why it matters At TI, we take climate change seriously. We want to do our part to protect the environment in which we live and work. We invest in controls to reduce
Cornell University Ithaca Greenhouse Gas (GHG) Emissions Inventory Fiscal Year 2012
 Emissions Inventory Fiscal Year 2012") Cornell University Ithaca Greenhouse Gas (GHG) Emissions Inventory Fiscal Year 2012 Prepared by: Cornell University Energy & Sustainability Department 129 Humphreys Service Building Ithaca, NY 14850 January
Cornell University Ithaca Greenhouse Gas (GHG) Emissions Inventory Fiscal Year 2012 Prepared by: Cornell University Energy & Sustainability Department 129 Humphreys Service Building Ithaca, NY 14850 January
Corporate Emissions Assessment Protocol
 Corporate Emissions Assessment Protocol For the measurement, management, and reduction of organisations greenhouse gas emissions 1 1 Version 1_4 2 Part 1: Requirements The Carbon Trust About the Carbon
GHG. Richey Student Researcherr. Steven. For
 Illinois State University 100 North University Street Normal, IL 61761-4402 2010 ISU ACUPCC GHG G Inventory Prepared by: Steven Richey Student Researcherr Major: Renewable Energy spriche@ilstu.edu Supervised
Sustainability: The Next Step Estimating the University of Wisconsin Green Bay s Carbon Footprint
 Sustainability: The Next Step Estimating the University of Wisconsin Green Bay s Carbon Footprint Chapter 1 Scope 1 Direct sources of GHG emissions from sources that are owned or controlled by the university
SUSTAINABILITY An Energy & Emissions Case Study
 SUSTAINABILITY An Energy & Emissions Case Study 1 Energy & Emissions Case Study WASHINGTON UNIVERSITY IN ST. LOUIS has a history of responsibly investing resources to increase the efficiency of our operations
2025 Carbon Neutrality Planning Framework
 carbon neutrality initiative 2025 Carbon Neutrality Planning Framework A report to inform greenhouse gas emission reduction strategies December 2016 (minor update August 2017) Physical and Environmental
PLU 2011 GHG Inventory Report
 Executive Summary Education in the 21 st century must take seriously the environmental and social challenges threatening our world. Pacific Lutheran University has dedicated itself to becoming a just,
GHG Inventory. Executive Summary
 2007 08 GHG Inventory Executive Summary This report is the first annual update to the Macalester College Greenhouse Gas Emissions Audit conducted by the Environmental Studies Senior Seminar in Spring 2008.
Swarthmore College Greenhouse Gas Inventory Report. Clara Changxin Fang Environmental Sustainability Coordinator March 2012
 Swarthmore College 2005-2010 Greenhouse Gas Inventory Report Clara Changxin Fang Environmental Sustainability Coordinator March 2012 1 Table of Contents ACKNOWLEDGEMENTS... 3 2005-2010 GREENHOUSE GAS INVENTORY...
University Presidents Climate Commitment (AUPCC), pledging to achieve climate
, pledging to achieve climate") 12RDSC07 Project Title: A Cap-and-Trade Scheme for RIT Commuters 1. Problem Statement As climate change awareness grows, several U.S. colleges and universities are tracking their greenhouse gas (GHG) emissions
12RDSC07 Project Title: A Cap-and-Trade Scheme for RIT Commuters 1. Problem Statement As climate change awareness grows, several U.S. colleges and universities are tracking their greenhouse gas (GHG) emissions
Table TSD-A.1 Source categories included under Section 202 Section 202 Source IPCC Sector IPCC Source Category Greenhouse Gases
 Technical Support Document Section 202 Greenhouse Gas Emissions Roadmap to Annex This Annex describes greenhouse gas emissions information from Section 202 source categories. The Annex provides an overview
President s Sustainability Steering Committee
 Adopted Feb. 16, 2011 Introduction Remarkable improvements in utility operations and efficiency have allowed the University to double its size since 1977 with no increase in total energy consumption. Based
Independent Accountants Report
 KPMG LLP Suite 2100 1003 Bishop Street Honolulu, HI 96813-6400 Independent Accountants Report The Board of Directors CA Inc.: We have reviewed the accompanying Statement of Greenhouse Gas Emissions for
GREENHOUSE GAS EMISSIONS INVENTORY FOR THE UNIVERSITY OF WYOMING Fiscal Year 2015
 GREENHOUSE GAS EMISSIONS INVENTORY FOR THE UNIVERSITY OF WYOMING Fiscal Year 2015 By Jay Quintanilla For The Campus Sustainability Committee of the University of Wyoming And The American College and University
prepared by the 1913 North Broad Street Philadelphia, PA Office of Sustainability 04 May 2011
 TEMPLE UNIVERSITY GREENHOUSE GAS INVENTORY PROGRAM F ISCAL Y EAR 2010 UPDATE prepared by the Office of Sustainability 1913 North Broad Street Philadelphia, PA www.temple.edu/sustainability 04 May 2011
2 nd Greenhouse Gas Inventory Report
 2 nd Greenhouse Gas Inventory Report September 15, 2010 Office of University Sustainability GoGreen.FIU.edu Ali Dutton adutton@fiu.edu Table of Contents 2 Executive Summary 3 Scope One Emissions: Fleet
UCSF Sustainability Baseline Assessment: Carbon Footprint Analysis. Final Issue Date: March 21, 2010
 UCSF Sustainability Baseline Assessment: Carbon Footprint Analysis Final Issue Date: March 21, 2010 Carbon Footprint Analysis Background This chapter of the Sustainability Assessment focuses on UCSF s
Climate Action Planning
 County of Albemarle: Climate Action Planning Climate action plans outline the specific activities that an institution will undertake to reduce greenhouse gas (GHG) emissions. Climate action plans are informed
Greenhouse Gas Emissions. Climate Change: Taking Action for the Future
 Greenhouse Gas Emissions Climate Change: Taking Action for the Future The energy industry across the United States is undergoing a major transformation by seeking lower-carbon energy sources while meeting
Energy Efficient Environmental Solutions
 COMPLETE ENVIRONMENTAL SOLUTIONS Energy Efficient Environmental Solutions OUR MISSION It is our goal to maximize our clients competitive edge by improving overall performance and profitability with cost
Overview of GHG Inventory Management & Reporting. Alex Carr, Director of Special Projects Ryan Cassutt, Program Associate
 Overview of GHG Inventory Management & Reporting Alex Carr, Director of Special Projects Ryan Cassutt, Program Associate April 24, 2018 Agenda Introduction to TCR Overview of GHG accounting Benefits of
Full Name Unit/Department Phone Lauren Reilly
 Proposal Details G Hendrix Section 1: Summary Information * Project Title: Reducing USF's GHG Emissions Campus-Wide * Duration (months): 12 * Total Budget ($): $50,000.00 * Requested SGEF Funds ($): $50,000.00
Minnesota State University, Mankato. Carbon Footprint Update Report
 Minnesota State University, Mankato Carbon Footprint Update Report May 16, 2017 Prepared for the Environmental Committee by Louis Schwartzkopf Gary Urban Ron Fields ii Table of Contents Executive Summary...
Roadmap to Carbon Neutrality. October 30, 2008
 Roadmap to Carbon Neutrality October 30, 2008 Overview Climate change and buildings BC policy context and legislative requirements Emissions management & financial risk Getting to carbon neutral Strategies,
GREENHOUSE GAS INVENTORY
 GREENHOUSE GAS INVENTORY UNIVERSITY of NORTH CAROLINA WILMINGTON August 2014 2 LETTER FROM THE CHIEF SUSTAINABILITY OFFICER As North Carolina s coastal university, the University of North Carolina Wilmington
SAIF Corporation Greenhouse Gas Inventory. Tracy Meyer 03/24/2010
 Tracy Meyer 03/24/2010 Table of Contents Executive summary... 3 Methodology... 3 summary information... 4 6 Scope I emissions... 7 Fleet... 7 Natural gas... 8 Fugitive refrigerants... 8 Diesel generator
Japan s National Greenhouse Gas Emissions in Fiscal Year 2012 (Final Figures) <Executive Summary>
 <Executive Summary>") Japan s National Greenhouse Gas Emissions in Fiscal Year 2012 (Final Figures) Concerning the estimation of the final figures: final figures means the figures officially submitted to
Japan s National Greenhouse Gas Emissions in Fiscal Year 2012 (Final Figures) Concerning the estimation of the final figures: final figures means the figures officially submitted to
Step by Step Instructions for the Using Sustainable Jersey Spreadsheet Tool to Calculate a Municipal Carbon Footprint
 Step by Step Instructions for the Using Sustainable Jersey Spreadsheet Tool to Calculate a Municipal Carbon Footprint Inventory methods that municipalities can use to calculate their municipal carbon footprint
Environmental Analysis, Chapter 4 Consequences, and Mitigation
 Environmental Analysis, Chapter 4 4.6 Climate Change This section summarizes the existing climate and greenhouse gas (GHG) conditions in the project area, and the potential impacts of the proposed alternatives,
IPCC reports are published regularly and become a reference for the formulation of public policies and for use by experts and students.
 Extended Abstract Carvalho, João Paulo Andrade Ferreira de Carvalho; Romanel, Celso (advisor); Ana Ghislane (co-advisor). Greenhouse gases emissions management of PUC-Rio, Gávea Campus: Inventory of emissions
Conservation and Demand Management Plan
 Conservation and Demand Management Plan 2014-2019 Introduction Ontario Regulation 397/11 under the Green Energy Act 2009 requires public agencies municipalities, municipal service boards, school boards,
GREENHOUSE GAS INVENTORY Fiscal Year 2014
 GREENHOUSE GAS INVENTORY Fiscal Year 2014 Kennesaw State University (KSU) has conducted its fourth environmental inventory of greenhouse gas emissions. The inventory includes a carbon footprint analysis
BACKGROUND DATA COMPILATION. December 20, 2016
 OBG There s a way December 20, 2016 Ms. Patricia Beaumont Director, Facilities Support Operations University of Rochester 271 East River Road Rochester, New York 14627 RE: Dear Ms. Beaumont: Greenhouse
JANUARY//2010. Climate Action Plan
 JANUARY//2010 Climate Action Plan Acknowledgements // Committee on Environmental Responsibility Marianne Nolan Cowan 92, Associate Director of Alumni and Parent Programs, Office of College Advancement
4.9 Greenhouse Gas Emissions
 4.9 4.9.1 Introduction This section describes the affected environment and environmental consequences related to greenhouse gas emissions (GHG) from operation of the NEPA Alternatives. Information in this
Skidmore College Greenhouse Gas Inventory 2013
 1 Skidmore College Greenhouse Gas Inventory 2013 Introduction This inventory quantifies the greenhouse gas (GHG) emissions attributed to college-related activities during Skidmore s fiscal year 2013 (June
Kim Dirks Tyson Foods, Inc.
 Kim Dirks Tyson Foods, Inc. Annual reporting of greenhouse gas (GHG) emissions to USEPA is now a regulatory requirement Several deadlines to be met in 2010 if this applies to you First report is due March
Greenhouse Gas Permitting Training Mike Gordon, Dave Talley US EPA-Region III
 Greenhouse Gas Permitting Training Mike Gordon, Dave Talley US EPA-Region III GHG Overview PSD Permitting for Sources of GHGs GHGs are pollutants that trap heat in the atmosphere and are associated with
CITY AND COUNTY OF DENVER CLIMATE ACTION PLAN
 CITY AND COUNTY OF DENVER CLIMATE ACTION PLAN EXECUTIVE SUMMARY 2015 EXECUTIVE SUMMARY Over the past decade, rapid climate change has become the most defining concern of the 21st century. Global emissions
CHAPTER 2. Greenhouse Gas Emission Inventories, Forecasts, and Targets
 CHAPTER 2 Greenhouse Gas Emission Inventories, Forecasts, and Targets CLIMATE ACTION PLAN GHG EMISSION INVENTORIES, FORECASTS, AND TARGETS CHAPTER 2 2.1 INTRODUCTION This chapter summarizes our community
JANUARY//2010. Climate Action Plan
 JANUARY//2010 B A T E S C O L L E G E Acknowledgements // Committee on Environmental Responsibility Marianne Nolan Cowan 92, Associate Director of Alumni and Parent Programs, Office of College Advancement