Coke gasification with and without hydrogen and its effects on coke microtexture and Minerals
|
|
|
- Nora Owen
- 5 years ago
- Views:
Transcription


1 University of Wollongong Research Online University of Wollongong Thesis Collection University of Wollongong Thesis Collections 2017 Coke gasification with and without hydrogen and its effects on coke microtexture and Minerals Hao Zhang Recommended Citation Zhang, Hao, Coke gasification with and without hydrogen and its effects on coke microtexture and Minerals, Doctor of Philosophy thesis, School of Mechanical, Materials, Mechatronic and Biomedical Engineering, University of Wollongong, Research Online is the open access institutional repository for the University of Wollongong. For further information contact the UOW Library:


2 COKE GASIFICATION WITH AND WITHOUT HYDROGEN AND ITS EFFECTS ON COKE MICROTEXTURE AND MINERALS A thesis submitted in fulfilment of the requirements for the degree of Doctor of Philosophy from University of Wollongong by Hao Zhang (B.Eng., M.Eng.) School of Mechanical, Materials, Mechatronic and Biomedical Engineering University of Wollongong, Australia 2017
3 Certification I, Hao Zhang, declare that this thesis, submitted in fulfilment of the requirements for award of Doctor of Philosophy, in the School of Mechanical, Materials, Mechatronic and Biomedical Engineering, University of Wollongong, Australia, is wholly my own work unless otherwise referenced or acknowledged. The document has not been submitted for qualifications at any other academic institution. Hao Zhang Signature: October, 2017 i
4 Acknowledgements This project was supported by BlueScope, BHP Billiton and Australian Research Council (ARC Linkage Project LP ). The University of Wollongong (UOW) is acknowledged for providing International Postgraduate Tuition Award. The Commonwealth contribution is also acknowledged for providing Australian Government Research Training Program Scholarship. I am indebted to HPS and Graduate Research School for ensuring the maximum degree of objectivity in my thesis examination. Besides, I would like to thank Dr. Harold Rogers, Prof. Oleg Ostrovski, Dr. Peter Austin and Dr. Xing Xing for their advice in the project. Particularly, I should thank Dr. Guangqing Zhang for the opportunity to prove that I am able to complete a PhD thesis independently with minimum supervision. I would like to express my gratitude to Mr. Andrew Scobie from UOW Workshop for his assistance in building the experimental setups, and also to Mr. Matthew Franklin and Mr. Greg Tillman for the training on me in the labs. The Electron Microscopy Center for providing the SEM/EDS instrument is greatly appreciated. I also want to thank those friendly and talented people that I have worked with, especially Dr. Jingxiu Wang, Dr. Zhe Wang, Dr. Xiang Li, Dr. Ray Longbottom, Dr. Ay Ching Hee, Ms. Apsara Jayasekara, and Ms. Ai Nguyen. Last but not least, I would not be able to complete my PhD degree without the ii
5 unconditional love and support from my family all the time. You are the greatest blessing to me. iii
6 Abstract The blast furnace process is the dominant ironmaking route in the steel industry because of its high efficiency and productivity. Coke is a key material that performs several important roles in the blast furnace operation. Gasification is regarded as one of the most important reactions leading to coke degradation in the blast furnace. There is an increasing trend to reduce the consumption of expensive coke by injecting cheaper auxiliary fuels through the tuyeres. At high injection rates, coke quality becomes more pertinent. Coke reactivity towards gasification, a critical parameter in characterizing coke quality, is directly affected by coke properties. On the other hand, as a result of the higher pulverized coal injection rate, the H 2 content in modern blast furnaces is significantly higher than before. The aims of this project were to determine the influence of H 2 on the reaction kinetics of coke gasification, correlate the reactivity of coke gasification with coke properties, and reveal the influence of gasification on coke microtexture and minerals. The reaction kinetics of the gasification of a metallurgical coke was investigated using a thermogravimetric analyzer (TGA) in the temperature range of K, particle size of μm, and CO 2 content of 5-20 vol% in CO 2 -CO-N 2 and CO 2 -CO-H 2 -N 2 gas mixtures. The temperatures and gas compositions were selected to simulate the range found in the lower regions of the blast furnace. The results show that the gasification rate in the presence of H 2 was higher than that without H 2 at lower iv
7 temperatures. However, the enhancing effect of H 2 diminished with temperature increase. Two temperature zones corresponding to chemical reaction controlled regime and diffusion controlled regime were identified. The reaction transitioned from chemical reaction control to diffusion control at 1467 K for gasification without H 2 in comparison to 1364 K with H 2. It indicates that diffusion became the controlling step at a lower temperature in the H 2 -containing gas mixture due to the generation of H 2 O through water-gas shift reaction. Along with increasing gasification rate with temperature, the gasification became controlled by the diffusion of CO 2, which was further demonstrated by the gasification rate that decreased with increasing particle size and the reaction order that approached 1 with temperature increase. The gasification reactions of five metallurgical cokes were studied using a TGA at 1273 and 1673 K in CO 2 -CO-N 2 and CO 2 -CO-H 2 -N 2 gas mixtures. The results show that these cokes showed different reactivities in the gasification reactions. For all the cokes, the reaction rate in the presence of H 2 was higher than that without H 2 at 1273 K. However, the relative reactivity of these cokes was not changed. The enhancing effect of H 2 was negligible at 1673 K for all the cokes, which is due to the diffusion resistance that plays a major role at higher temperatures. Properties that potentially influence coke reactivity including ash content, catalytic index, surface area and crystallite size were measured and correlated with reactivity. The results indicate that reactivity had a good correlation with ash content, catalytic index and crystallite size. The effect of surface area on coke reactivity was marginal. Coke reactivity was positively affected by v
8 catalytic index but inversely affected by ash content. Although crystallite size inversely affected reactivity, the reaction rate at the initial stage was more predominantly influenced by the mineral matter. Therefore, the influence of surface area and crystallite size was overshadowed by the impact of ash content and catalytic index at the initial stage of reaction. The microtexture, minerals and their interactions of a metallurgical coke during gasification reactions were investigated using scanning electron microscopy/energy dispersive spectroscopy (SEM/EDS) by analyzing exactly the same sites of coke surface before and after reactions. The results indicate that most inert maceral-derived component (IMDC) had a greater propensity to react with CO 2 than reactive maceralderived component (RMDC). A portion of the carbon in mineral-carrying IMDC was removed as a result of the reaction with CO 2 leaving minerals, primarily aluminosilicates, more pronounced. However, the reactivity of IMDC was found to be similar to RMDC in some cases. The physical features of the alumino-silicates in the coke were barely altered but bound with alkalis during the reaction. The Fe-containing phases were highly active and had strong interactions with the surrounding carbon matrix. Voids were formed in the carbon matrix associated with the Fe-containing phases as a result of the catalytic carbon-gas reactions. The Mg and Ca-containing phases reacted with the surrounding alumino-silicates and transformed into slag globules. Metallic iron dispersed in the voids or attached on the slag globules was formed as a result of the reduction of iron sulphate or sulphide while sulphur was released as vapour. vi
9 Table of Contents Certification... i Acknowledgements... ii Abstract... iv Table of Contents... vii List of Figures... xi List of Tables... xvi 1 General Introduction Literature Review Blast furnace Overview of blast furnace ironmaking Blast furnace structure Metallurgical coke Roles of coke in blast furnace Coke degradation in blast furnace Coke characterization Physical properties Chemical properties Microtexture Microstructure vii
10 2.3.5 Mineral matter Coal properties influencing coke properties Coke gasification Reaction mechanism and kinetics Factors affecting gasification rate Summary and objectives Experimental Raw materials and pre-treatments Experimental setups and procedures Sample characterization Ash analysis Surface area Crystallite size Microscopic analysis Data Analysis Gasification of Metallurgical Coke in CO 2 -CO-N 2 with and without H Introduction Materials and methods Materials Experimental setup and procedure Data analysis viii
11 4.3 Results and discussion Effects of temperature on coke gasification with and without H Effects of CO 2 content on coke gasification with and without H Effects of particle size on coke gasification with and without H Role of H 2 in coke gasification Conclusions Gasification of Different Cokes with and without H 2 - Relating Reactivity to Coke Properties Introduction Materials and methods Materials Gasification procedure Reactivity Catalytic index, surface area and crystallite size Results and discussion Reactivities of different cokes Coke properties affecting reactivity Correlation of coke reactivity with coke properties Conclusions Influence of Gasification on Coke Microtexture and Minerals Introduction ix
12 6.2 Materials and methods Materials Experimental setup and procedure Results and discussion Influence of gasification on coke microtexture Influence of gasification on coke minerals Conclusions Conclusions and Recommendations for Further Work Conclusions Recommendations References x
13 List of Figures Figure 1.1 World crude steel production... 1 Figure 2.1 Schematic of the blast furnace structure Figure 2.2 Scheme of temperature distribution and chemical reactions along the height of a blast furnace Figure 2.3 Schematic view of the tuyere region of a quenched blast furnace Figure 2.4 Variation in the void fractions of ores, sinters and spheres of two particle size fractions with different size ratios (V t is the total volume of the particles; V s and V l are the volumes of the small and large particles with diameters of d s and d l, respectively; ԑ and ԑ m are the void fractions of the uniform sized bed and the mixed bed) Figure 2.5 Variation in iron output with different size distributions of coke and ore.. 20 Figure 2.6 Development of coke HMS from the wharf to the tuyere Figure 2.7 Schematic of the drum test equipment Figure 2.8 Reaction apparatus for CSR test Figure 2.9 I-type coke tumbler Figure 2.10 Relationship between CRI and CSR Figure 2.11 Main factors influencing CSR index Figure 2.12 The nomenclature and classification methods of coke microtexture Figure 2.13 (a) Structure of graphite crystal; (b) Concepts of L c and L a Figure 2.14 Curve fitting of the Raman spectrum for coke xi
14 Figure 2.15 Model of coke matrix structure Figure 2.16 XRD patterns of four LTA samples Figure 2.17 Relationship between coal structural parameters and volatile matter Figure 2.18 Major mineral transformations that occur upon heating Figure 2.19 Schematic representation of three zones of gas-carbon reaction Figure 2.20 Equilibrium constants for carbon-gas reactions Figure 2.21 Correlation between L c and G fraction for carbonaceous materials subject to annealing temperatures from 1100 to 1500 o C Figure 2.22 Conversion of chars under pressures from 0.1 to 3.0 MPa in pure CO 2 at 1000 o C Figure 2.23 Effect of pressure on gasification rate of different chars Figure 2.24 Change of initial gasification rate of coal char with partial pressure of gasifying agents Figure 2.25 Variation of conversion time for steam gasification of petroleum coke.. 60 Figure 2.26 Influence of particle size on gasification rate of coal char Figure 2.27 Relationship between the total iron, potassium and sodium in amorphous phase and the initial apparent rate Figure 2.28 Published mechanisms for potassium catalyzed CO 2 gasification Figure 2.29 Correlation of the coke apparent reaction rate with the crystalline size Figure 2.30 Variations of specific surface area as a function of the isothermal reaction temperature xii
15 Figure 3.1 Schematic of the experimental setup in Chapter 4 and Figure 3.2 Schematic of the experimental setup in Chapter Figure 4.1 Schematic of the experimental setup Figure 4.2 Carbon conversion vs time for coke gasification at different temperatures in CO 2 -CO-N 2 gas mixture Figure 4.3 Carbon conversion vs time for coke gasification at different temperatures in CO 2 -CO-H 2 -N 2 gas mixture Figure 4.4 Arrhenius plots for coke gasification in CO 2 -CO-N 2 and CO 2 -CO-H 2 -N 2 gas mixtures Figure 4.5 Carbon conversion vs time for coke gasification in CO 2 -CO-N 2 gas mixture with different CO 2 contents Figure 4.6 Carbon conversion vs time for coke gasification in CO 2 -CO-H 2 -N 2 gas mixture with different CO 2 contents Figure 4.7 lnr 0 vs lnp CO2 for coke gasification in CO 2 -CO-N 2 gas mixture Figure 4.8 lnr 0 vs lnp CO2 for coke gasification in CO 2 -CO-H 2 -N 2 gas mixture Figure 4.9 Carbon conversion vs time for gasification of coke with different particle sizes (μm) in CO 2 -CO-N 2 gas mixture Figure 4.10 Carbon conversion vs time for gasification of coke with different particle sizes (μm) in CO 2 -CO-H 2 -N 2 gas mixture Figure 4.11 Change in equilibrium content of H 2 O in CO 2 -CO-H 2 -N 2 gas mixture at different temperatures xiii
16 Figure 5.1 Schematic of the experimental setup Figure 5.2 Carbon conversion vs time for gasification of different cokes at 1273 K 112 Figure 5.3 Carbon conversion vs time for gasification of different cokes at 1673 K 112 Figure 5.4 XRD spectra of different cokes Figure 5.5 Correlation of initial gasification rate at 1273 K in CO 2 -CO-N 2 gas mixture with surface area (S), crystallite size (L c ), ash content (A) and catalytic index (CI). 117 Figure 5.6 Correlation of initial gasification rate at 1273 K in CO 2 -CO-H 2 -N 2 gas mixture with surface area (S), crystallite size (L c ), ash content (A) and catalytic index (CI) Figure 5.7 Secondary electron images of (a) the unreacted coke surface and (b) the reacted coke surface from Chapter Figure 5.8 Correlation of initial gasification rate at 1273 K in CO 2 -CO-N 2 gas mixture with crystallite size (L c ), ash content (A) and catalytic index (CI) Figure 5.9 Correlation of initial gasification rate at 1273 K in CO 2 -CO-H 2 -N 2 gas mixture with crystallite size (L c ), ash content (A) and catalytic index (CI) Figure 6.1 Schematic of the experimental setup Figure 6.2 Optical microscope image on Site 1 of the unreacted coke Figure 6.3 SE image on Site 1 of the unreacted coke Figure 6.4 SE image on Site 1 of the reacted coke Figure 6.5 EDS patterns of C, Al and Si on Site 1 of the unreacted coke Figure 6.6 EDS patterns of C, Al and Si on Site 1 of the reacted coke xiv
17 Figure 6.7 SE image on Site 2 of the unreacted coke Figure 6.8 SE image on Site 2 of the reacted coke Figure 6.9 EDS patterns of C, Al and Si on Site 2 of the unreacted coke Figure 6.10 EDS patterns of C, Al and Si on Site 2 of the reacted coke Figure 6.11 BSE image of an alumino-silicates aggregate on Site 3 of the unreacted coke Figure 6.12 BSE image of an alumino-silicates aggregate on Site 3 of the reacted coke Figure 6.13 BSE image of an alumino-silicates aggregate on Site 4 of the unreacted coke Figure 6.14 BSE image of an alumino-silicates aggregate on Site 4 of the reacted coke Figure 6.15 EDS patterns of Al, Si, Na and K on Site 3 of the unreacted coke Figure 6.16 EDS patterns of Al, Si, Na and K on Site 3 of the reacted coke Figure 6.17 EDS patterns of Al, Si, Na and K on Site 4 of the unreacted coke Figure 6.18 EDS patterns of Al, Si, Na and K on Site 4 of the reacted coke Figure 6.19 BSE image of disseminated minerals on Site 5 of the unreacted coke Figure 6.20 BSE image of disseminated minerals on Site 5 of the reacted coke Figure 6.21 BSE image of disseminated minerals on Site 6 of the unreacted coke Figure 6.22 BSE image of disseminated minerals on Site 6 of the reacted coke xv
18 List of Tables Table 2.1 Mechanism of coke degradation in blast furnace Table 2.2 Basic parameters of four drum tests Table 2.3 Required range of chemical properties of blast furnace coke Table 2.4 U. S. Steel classification of coke microtexture Table 2.5 Mineral phase compositions in four LTA samples Table 2.6 Elemental composition (wt%) as oxides in crystalline and amorphous forms in coke Table 2.7 Activation energy at constant partial pressures of CO Table 3.1 Proximate and ultimate analyses of the coke samples Table 3.2 Compositions of the reactant gas mixtures in Chapter 4 (vol%) Table 3.3 Ash analyses of the coke samples (wt%) Table 4.1 Proximate and ultimate analyses of coke A Table 4.2 Compositions of the reactant gas mixtures (vol%) Table 4.3 Effect of temperature on the initial rate of gasification in gas mixtures with and without H Table 4.4 Effect of CO 2 content on the initial rate of gasification in gas mixtures with and without H Table 4.5 Reaction orders at different temperatures in gas mixtures with and without H xvi
19 Table 4.6 Effect of particle size on the initial rate of gasification in gas mixtures with and without H Table 5.1 Proximate and ultimate analyses of the five cokes Table 5.2 Ash analyses of the five cokes (wt%) Table 5.3 Initial gasification rate of the five cokes at 1273 and 1673 K in gas mixtures with and without H 2 (s -1 ) Table 5.4 Catalytic index, surface area and crystallite size of the five cokes Table 6.1 Proximate and ultimate analyses of coke A Table 6.2 Ash analysis of coke A (wt%) xvii
20 1 General Introduction Iron is the most commonly used metal in the world. Steel, of which iron is the key ingredient, accounts for nearly 95% of the usage of all metals. As shown in Figure 1.1, in 2015, the world steel industry produced over 1.6 billion tonnes of crude steel, and the world pig iron production was over 1.1 billion tonnes, which had grown by about 41% in the past decade, representing the huge global demand for iron [1]. Figure 1.1 World crude steel production [1]. While low-temperature and high-oxygen furnaces are being investigated as the next generation of ironmaking facilities, ironmaking is still dominated by the blast furnace process. Coke is an important raw material in blast furnace ironmaking, which has four 1
21 major roles as: (1) a fuel that provides heat for the endothermic reactions and the melting of slag and metal, (2) a reducing agent that produces gases for the reduction of iron oxides, (3) a permeable support through the burden column, and (4) a source of carbon for carburization. To reduce the consumption of expensive coke, some cheaper auxiliary fuels such as pulverized coal, natural gas and oil are injected through the tuyeres to replace a portion of coke [2-4]. Due to the relatively low price and abundant reserve of coal in comparison with other fossil fuels, nearly half of blast furnaces in the world use pulverized coal injection [5]. Coke is subjected to significant thermal and mechanical stresses as well as chemical reactions with gases (CO 2, CO, H 2 and H 2 O) in the blast furnace. At low coke rate operations, coke quality becomes more pertinent as less coke is available to perform its roles. Because of the higher pulverized coal injection rate, the H 2 content in modern blast furnaces is significantly higher than before. H 2 not only contributes to the indirect reduction of iron oxides, but also leads to a significant increase in H 2 O in the blast furnace gases [6]. The reaction of coke with H 2 O was shown to be much faster than that with CO 2 by many researchers, thus accelerating the reaction rate and affecting its strength [6-9]. Additionally, the reaction with H 2 O was found to be primarily confined to the surface of coke lumps, while the reaction with CO 2 penetrated to a greater depth [10]. Major reactions relevant to coke in the blast furnace include gasification, graphitization and carburization, etc. Among all the reactions, gasification has drawn the most 2
22 attention due to its significant impact on coke degradation and fines generation in the blast furnace [11]. Coke gasification, also known as the Boudouard reaction or the solution loss reaction, represents the endothermic reaction of coke carbon with CO 2 [12]: CO C 2CO (1.1) 2( g) ( s) ( g) A better understanding of coke gasification and its impact on coke degradation is of great importance for the success of modern blast furnace operations. Moreover, kinetic analysis is crucial to understanding the behaviour and mechanism of the gasification reaction. The reaction kinetics of coke gasification was found to be affected by temperature, pressure, gas composition, and coke properties [6]. Numerous studies have been carried out regarding the effects of gasification on coke strength, pore structure, optical texture as well as fines generation [13-16]. However, previous studies on coke gasification were mainly focused on pure CO 2 and H 2 O atmospheres [6,12,17,18]. The gasification reaction of metallurgical coke in the presence of H 2 has not received wide coverage in the literature, and the role of H 2 in the gasification process is poorly understood. Reactivity towards gasification reaction is one of the most important parameters used to evaluate the performance of coke in the blast furnace. The reactivity of coke is controlled by the coal properties and the coking conditions, but is most directly determined by the coke properties. Therefore, a better understanding of the coke properties affecting its reactivity is necessary. Different models have been developed to predict coke reactivity [19-22]. Most of these prediction models are based on coal 3
23 properties such as vitrinite reflectance, inertinite content and alkali index. Correlation models of coke reactivity based on coke properties are rarely seen in the literature. Due to the strong impact of the carbon-based components (microtexture) on coke strength and reactivity, the degradation of coke in the blast furnace is highly related to the modification of its microtexture caused by gasification and exposure to high temperatures [23]. Thus, a great interest has been paid to the microtexture of coke by many researchers who have developed their own terminology and classification schemes in their studies [24,25]. Generally, coke microtexture can be divided into two components, i.e., the inert maceral-derived component (IMDC) and the reactive maceral-derived component (RMDC). IMDC is formed from infusible macerals and RMDC is from fusible macerals during carbonization. IMDC and RMDC have been found to behave differently in terms of strength, reactivity, and graphitization [26]. IMDC is often regarded to be more reactive than RMDC in many references [27,28]. However, RMDC was found to react more easily with CO 2 than IMDC in the blast furnace due to the catalytic effect of alkalis in a recent study [29]. Due to the close relationship between coke carbon and mineral matter, coke minerals could affect the strength and reactivity of coke in many ways such as the formation of cracks and weak spots in the coke matrix and the catalyzing reactions by catalytic mineral phases [30-34]. Additionally, the blast furnace environment such as high temperatures and recirculating alkalis could also affect coke gasification and thus its degradation. Therefore, it is crucial to gain a better understanding of the coke minerals 4
24 and their interactions with coke carbon matrix under blast furnace conditions. Current understandings of the mineral matter in coke are largely based on the oxide analysis of coke ash, which have not taken into account the fact that coke minerals are present in various sizes, distributions, and associations with carbon matrix [35]. The X-ray diffraction (XRD) can only identify crystalline phases. However, more than 60% of the inorganic matter of the original cokes is present in glassy or amorphous phases [11]. Microscopic approaches have also been applied to the investigations of coke microtexture and minerals [11,35-37]. However, previous microscopic analyses on the changes in coke microtexture and minerals were mainly conducted by observing different areas of different samples before and after reactions, which are difficult to interpret due to the heterogeneous nature of cokes. The PhD thesis is composed of 7 chapters. Chapter 1 gives a general introduction of the thesis. The literature review in Chapter 2 consists of an overview of blast furnace ironmaking and the blast furnace structure, the roles of metallurgical coke and its degradation in the blast furnace, coke characterization, coke gasification and the factors affecting the gasification rate, as well as the objectives of the research project based on the literature review. Chapter 3 describes the experimental details, including the raw materials and the pre-treatments for different studies, two experimental setups and procedures for the gasification of cokes in the forms of particles and cylindrical pellets, sample characterization, and data analysis methods. Chapter 4-6 presents the main contribution to the thesis. 5
25 Chapter 4 studied the gasification of a metallurgical coke using a thermogravimetric analyzer (TGA) in the temperature range of K, particle size of μm, and CO 2 content of 5-20 vol% in CO 2 -CO-N 2 and CO 2 -CO-H 2 -N 2 reactant gas mixtures. The influence of H 2 on the reaction kinetics of coke gasification has been determined. Besides, the role of H 2 in coke gasification process has been discussed and the mechanism of H 2 affecting the reaction rate has been clarified. Chapter 5 investigated the gasification of five different cokes at 1273 and 1673 K in CO 2 -CO-N 2 gas mixtures with and without H 2 using a TGA. Coke properties that potentially influence coke reactivity including ash content, catalytic index, surface area and crystallite size were measured and correlated with reactivity. The effects of these coke properties on reactivity have been assessed. Moreover, correlations of coke reactivity with these coke properties have been established. In Chapter 6, the carbon textures (microtexture) and minerals of coke were examined using scanning electron microscopy/energy dispersive spectroscopy (SEM/EDS) by analyzing exactly the same sites of coke surface before and after reactions. The influence of gasification on coke microtexture (IMDC and RMDC) and the transformations of coke minerals were determined. Besides, the interactions between coke minerals and carbon matrix during the reaction were also discussed. Finally, the main conclusions and recommendations for further work are summarized in Chapter 7. 6
26 The outcomes of the project provided significant evidence and guidelines for improving coke quality, enhancing blast furnace efficiency and reducing ironmaking cost, thus contributing to the sustainable development of both coal and steel industries. 7
27 2 Literature Review 2.1 Blast furnace Overview of blast furnace ironmaking While low-temperature and high-oxygen furnaces are being developed as the next generation of ironmaking facilities, the blast furnace process is still the dominant route for iron production, not only for the high productivity but also due to the high efficiency of heat utilization. A large modern blast furnace is capable of producing 3-4 million tonnes of hot metal per year [38]. Blast furnace is a counter-current flow heat exchanger and reactor, which makes the overall process extremely efficient with a remarkable heat utilization extent of 85-90% [39]. The efficiency of the blast furnace is generally expressed as the gas utilization, which is the percentage of CO that is transformed to CO 2, as expressed in the following equation [38]: CO 2 CO 100% (2.1) (CO+CO 2) Raw materials used in the blast furnace mainly consist of iron ores, fuels, and fluxes. Iron ores are the source of iron which is mainly present as oxides (hematite and magnetite). The ores are used either directly as raw ores or mostly as sinters or pellets nowadays. Metallurgical coke is the main source of heat and reducing gas for ores smelting and reduction. The fluxes with the principle components of CaO and MgO are 8
28 charged in pre-fluxed sinters or as limestone and dolomite to flux the silica and alumina impurities of ores and coke to produce a fluid slag with a low melting point (~1600 K). In the blast furnace, iron ores are reduced and transformed into hot metal, and the gangue of the ore burden and the ash of the coke and coal form slag. Hot metal and liquid slag do not mix because of their density difference, so the pig iron can be separated from the slag and tapped from the furnace. The heat is supplied by the combustion of coke and auxiliary fuels with hot blast blown into the furnace via the tuyeres. Heat is transferred from the gas to the burden and oxygen from the burden to the gas during gas ascends while burden and coke descend through the furnace [40-42] Blast furnace structure A blast furnace has a typical conical shape, which can be divided into five major zones according to the states and reactions of ore burden and coke. As shown in Figure 2.1, the zones from the top down are: stack zone, cohesive zone, dripping zone, raceway zone, and hearth zone. 9
![Figure 2.1 Schematic of the blast furnace structure [38]. The stack zone is filled with alternating layers of coke and ore burden. The reduction starts at about 500 o C [43].](/docs-images/84/89128050/images/29-0.jpg "The first step is the reduction of haematite to magnetite by CO (Reaction 2.2). Then the magnetite is further reduced to wustite in the temperature range from 600 to 900 o C (Reaction 2.3).")
29 Figure 2.1 Schematic of the blast furnace structure [38]. The stack zone is filled with alternating layers of coke and ore burden. The reduction starts at about 500 o C [43]. The first step is the reduction of haematite to magnetite by CO (Reaction 2.2). Then the magnetite is further reduced to wustite in the temperature range from 600 to 900 o C (Reaction 2.3). From 900 to 1100 o C, wustite is reduced to iron (Reaction 2.4). However, the reduction of wustite to iron is limited in this zone due to the limitation of CO in the rising gas and thermodynamics. These reactions are called indirect reduction and the overall reaction is mildly exothermic. Indirect reduction generates energy which raises the temperature of the burden [44,45]. The heat generated from the reduction of wustite is slight, which compensates the heat loss of the furnace wall, forming an isothermal zone or thermal reserve zone. Besides CO, H 2 also contributes to the indirect reduction, especially when temperature is above 900 o C (Reaction 2.5). H 2 is more reactive than CO and enhances the reaction kinetics by the 10
30 water-gas shift reaction (Reaction 2.6). 3Fe 2 O 3 + CO 2Fe 3 O 4 + CO 2 (2.2) Fe 3 O 4 + CO 3FeO + CO 2 (2.3) FeO + CO Fe + CO 2 (2.4) FeO + H 2 Fe + H 2 O (2.5) H 2 O + CO CO 2 + H 2 (2.6) As shown in Figure 2.2, the top gas consists of 10-20% CO 2, 20-30% CO, a small amount of H 2 and moisture, and the rest being N 2 [39]. Usually the top gas temperature is maintained above 100 C to avoid water condensation. 11
31 Figure 2.2 Scheme of temperature distribution and chemical reactions along the height of a blast furnace [39]. In the cohesive zone, the burden starts to soften and stick together, becoming nearly impermeable for gas. Thus, most of the gas can only pass through the coke slits. The temperature range in this zone is from 1100 to 1400 o C. As the temperature is above 1000 o C, CO 2 produced by the reduction of the remaining wustite is thermodynamically unstable and reacts with carbon of the coke to produce extra CO (Reaction 2.7). Reaction 2.7, known as gasification reaction, Boudouard reaction or solution loss reaction, is highly endothermic. The overall reaction is called direct reduction (Reaction 12
32 2.8) which is endothermic in contrast to indirect reaction [46,47]. The blast furnace is able to work efficiently by combining the direct and the indirect reductions. About a third of the oxygen in the burden is removed by the direct reduction, and the other twothirds are removed by the indirect reduction [38]. In addition, H 2 O formed in the furnace also reacts with carbon of the coke to produce H 2 and CO (Reaction 2.9). The reaction of coke with H 2 O is much faster than that with CO 2 [6-9]. CO 2 + C 2CO (2.7) FeO + C Fe + CO (2.8) H 2 O + C H 2 + CO (2.9) In the dripping zone, the burden melts and drips downward. Since coke is the only solid phase in this zone, it plays a vital role in providing permeability for both ascending gas and descending liquids. Direct reduction continues in the dripping zone when the slag phase is in contact with coke. The temperature in this zone is from 1400 to 1500 o C. In the raceway zone, hot blast is blown into the furnace through tuyeres. A huge amount of heat is generated in the raceway from the combustion of coke and other auxiliary fuels injected into the furnace along with the blast [48]. The heat leads to a high raceway adiabatic flame temperature (RAFT) in the range from 2000 to 2400 o C. In addition, the oxygen in the blast gasifies the carbon of coke to generate the reducing gas of CO. Heat generated in the raceway zone is used to melt the burden and CO is used to drive the reduction reactions in the blast furnace. 13
33 The hearth zone is where the hot metal and slag are collected. The hot metal and slag can be tapped out separately via the tapholes because of their density difference in liquid state. Meanwhile, the hot metal is carburized by coke, which causes further consumption of coke [49]. The temperature of the hot metal when it is tapped out is about 1500 o C. There is a closely-packed central coke column called deadman or stagnant coke zone in the hearth as shown in Figure 2.3. The coke column can float on the liquid iron in the hearth or reach the hearth floor. Some slag and iron are entrapped in the interstices of the coke and drained out during tapping. The raceway coke separates from the deadman coke by a bird s nest zone in which the proportions of fine coke and slag rapidly increase. The permeability of the deadman zone is critical to the efficiency and productivity of a blast furnace. 14
![Figure 2.3 Schematic view of the tuyere region of a quenched blast furnace [50]. 2.2 Metallurgical coke 2.2.1 Roles of coke in blast furnace Coke is a porous carbonaceous material made from carbonization of coals by heating to around 1100 o C in the absence of oxygen.](/docs-images/84/89128050/images/34-0.jpg "The structure of coke is generally described as pores with a wide range of size as well as various carbon-based components or textures comprising the pore walls.")
34 Figure 2.3 Schematic view of the tuyere region of a quenched blast furnace [50]. 2.2 Metallurgical coke Roles of coke in blast furnace Coke is a porous carbonaceous material made from carbonization of coals by heating to around 1100 o C in the absence of oxygen. The structure of coke is generally described as pores with a wide range of size as well as various carbon-based components or textures comprising the pore walls. In the blast furnace process, coke is charged into the furnace together with iron-bearing ore burden and fluxes from the top of the furnace. Coke is one of the most important but probably the most expensive raw materials used in the process. To reduce the consumption of expensive coke, some cheaper auxiliary 15
35 fuels such as pulverized coal, natural gas and oil are injected through the tuyeres to replace a portion of coke [2-4]. Due to the relatively low price and abundant reserve of coal in comparison with other fossil fuels, nearly half of blast furnaces in the world use pulverized coal injection [5]. At high injection rate, coke quality becomes more pertinent as less coke is available to perform its important roles [4]. The four major roles of coke in the blast furnace ironmaking process are summarized as follows [51]: (1) It is a fuel that supplies heat for the thermal requirements of the endothermic reactions and the melting of slag and metal; (2) It is as a reducing agent that produces CO gas for the reduction of iron oxides; (3) It provides a mechanical support to the burden column and the permeability for both ascending gas and descending liquids; (4) It is a source of carbon for carburizing the hot metal Coke degradation in blast furnace Coke is subjected to significant degradation in the blast furnace due to thermal, physical and chemical effects, which is a long-standing issue in blast furnace operations. During its descent from stack zone through cohesive zone, dripping zone, raceway zone to hearth zone in the furnace, coke undergoes physical impacts such as mechanical stress and abrasion, chemical reactions such as gasification, alkali attack, graphitization, carburization and combustion, and exposure to high temperatures. All these effects combining together lead to the degradation of coke in the blast furnace. The trend of the 16
36 low coke rate in the modern blast furnace operations results in a reduced thickness of the coke layer in the stack and cohesive zones as well as an increased residence time of coke in the lower furnace region. When the coal injection rate doubles from 100 kg/t hot metal, the residence time of coke in the furnace can increase by over 30% [39]. This increased residence time renders coke to longer physical, chemical and thermal impacts, which makes the degradation more severe. The degradation of coke weakens its strength and boosts the fines generation. Consequently, the liquid and gaseous permeability deteriorates, thus negatively affecting the efficiency of the blast furnace operations. Table 2.1 summarizes the mechanism of coke degradation in different zones of the blast furnace. Table 2.1 Mechanism of coke degradation in blast furnace. Zone Cause Effect Stack zone Mechanical stress, abrasion Particle size decreases slightly Cohesive and dripping zones Raceway zone Mechanical stress, abrasion, gasification, graphitization, alkali attack a, ash reactions b Mechanical stress, abrasion, combustion, graphitization Strength decreases; Particle size decreases; Permeability deteriorates Strength decreases sharply; Particle size decreases sharply; Hearth zone Dissolution Consumption 17
37 a: alkali attack causes coke degradation due to the strong impact of alkali vapors on coke carbon matrix and minerals, the catalytic effect on gasification reaction, and the formation of intercalation compounds. b: ash reactions cause coke degradation due to the reactions between coke carbon and some mineral phases in coke ash. 2.3 Coke characterization Physical properties Size distribution The particle size and distribution of the raw materials are the decisive factors for the permeability in a blast furnace. This is mainly attributed to their close relationship with voidage. Figure 2.4 shows the variation in the void fractions of raw materials of two particle size fractions with different size ratios. It can be obviously noted that the voidage is minimum when the volume fraction of small particles is in the range of 30-40%, and increases on either side as the volume fraction of small particles increases or decreases approaching more uniformity of the size distribution. It can also be seen that the voidage is markedly larger when the ratio d s /d l is closer to 50%. It indicates that the best voidage and permeability are achieved when the size distribution of raw materials is most uniform [39]. Additionally, for a better permeability and a higher iron output, the coke size should be compatible with the ore size. Figure 2.5 gives an example of the effects of the size distributions of coke and ore on the iron output. As displayed in the figure, the iron output increases as the fraction of the coke size of mm increases and the size 18
38 distribution of ore becomes narrower. The iron output with the ore size of 9-50 mm is higher than that with the ore size of 9-75 mm. When the ore size is too broad (9-150 mm) compared to the coke size, the iron output decreases with the increase in the fraction of the coke size of mm [39]. Figure 2.4 Variation in the void fractions of ores, sinters and spheres of two particle size fractions with different size ratios (V t is the total volume of the particles; V s and V l are the volumes of the small and large particles with diameters of d s and d l, respectively; ԑ and ԑ m are the void fractions of the uniform sized bed and the mixed bed) [39]. 19
39 Figure 2.5 Variation in iron output with different size distributions of coke and ore [39]. The initial coke distribution is a function of the coal blend and the coking conditions. During carbonization in the coke ovens, fissures in the coke occur due to stresses arising from different contraction rates in the adjacent coke layers. The fissures determine the size distribution of the product coke via breakage along the lines in the subsequent handling process, although not all of the fissures cause breakage at this early stage. Internal fissures remain in the coke particles and cause further breakage under mechanical loads during transport and charging. This process is called stabilization. Stabilization lowers the particle size of the coke, but the resulting particles are less prone to further breakage. It is shown by research that harmonic mean size (HMS), the size of uniform balls with the same total surface as the original coke size mixture, gives the highest correlation with the resistance to the gas flow [38]. A typical development of coke HMS from the wharf to the tuyere is illustrated in Figure 2.6. The proper size distribution of coke can be attained by screening and crushing before 20
 Drum test Coke mechanical strength is traditionally measured by drum test. Figure 2.")
40 charging into the blast furnace. However, the coke particles will further degrade due to physical, chemical and thermal factors during their descent through the furnace. Hence, the coke strength, i.e., the resistance to breakage and abrasion, is considered important to prevent an excessive generation of coke fines caused by degradation in the blast furnace. Figure 2.6 Development of coke HMS from the wharf to the tuyere [38] Strength (1) Drum test Coke mechanical strength is traditionally measured by drum test. Figure 2.7 shows a schematic of the drum test equipment. The degree of crushing after drum test is taken as the index of coke strength. According to different test standards, the drum test can be divided into four methods: MICUM, IRSID, ASTM and JIS. The basic parameters of these four methods are presented in Table
![Figure 2.7 Schematic of the drum test equipment [38]. Table 2.2 Basic parameters of four drum tests [52].](/docs-images/84/89128050/images/41-0.jpg "Parameters MICUM IRSID ASTM JIS Sample size > 63 mm > 63 mm 2-3 in > 50 mm Sample weight 50 kg 50 kg 22 lb 10 kg Drum size 1 1 m 1 1 m 36 38 in 1.5 1.")
41 Figure 2.7 Schematic of the drum test equipment [38]. Table 2.2 Basic parameters of four drum tests [52]. Parameters MICUM IRSID ASTM JIS Sample size > 63 mm > 63 mm 2-3 in > 50 mm Sample weight 50 kg 50 kg 22 lb 10 kg Drum size 1 1 m 1 1 m in m Rotations or 150 Speed 25 rpm 25 rpm 24 rpm 15 rpm Sieve size 40 and 20 mm 20 and 10 mm 1.06 and in 15 mm Strength indices M40 M10 I20 I10 Stability factor Hardness factor MICUM and IRSID, which use the same equipment, are widely employed to assess coke strength in Europe. 100 rotations at 25 rpm are applied in the MICUM test while 500 rotations at 25 rpm are applied in the IRSID test. After the rotations, the fraction of 22
42 the residue above 40 mm, called M40, and that through 10 mm, called M10, are taken as the coke strength indices of the MICUM test; the fraction of the residue above 20 mm, called I20, and that through 10 mm, called I10, are taken as the coke strength indices of the IRSID test. The tumbler test method standardized by ASTM is used to measure coke strength in the USA rotations at 24 rpm are applied in this test. The fraction of the residue on the 1.06 in sieve, called stability factor, and that on the in sieve, called hardness factor, are taken as the coke strength indices of the ASTM Tumbler test. JIS test is often used to determine coke strength in Japan and Australia. Two different rotations, 30 and 150, are applied in the JIS test. The rotating speed used is 15 rpm, which is much slower than those used in the other three test methods. The indices of the JIS test are the fraction of the residue on the 15 mm after 30 rotations ( ) and that after 150 rotations ( ). (2) Tensile strength Coke mechanical strength is also represented by tensile strength using diametric compression test. Coke sample for the diametric compression test is drilled into cylindrical cores using a core drill and then cut into cylinders of a fixed thickness. A compressive load is applied across a diameter of the cylinder until the fracture occurs along this diameter. The tensile strength, σ, is calculated by the following equation [53-58]: 2W = (2.10) Dt where W is the applied load, D and t are the diameter and thickness of the cylinder, 23
43 respectively. Dividing the tensile strength into the matrix strength factor and the porous structure factor, the effects of coal properties on the coke tensile strength were examined by Sato et al. [54]. The matrix strength was determined based on the carbon structure estimated by XRD and the porous structure was evaluated by optical microscopy and image analysis. Results showed that the coke matrix strength was determined by the coal rank and tended to be stronger for lower rank coal; the porous structure depended on coking properties and improved as the maximum fluidity and the swelling number of the coal increased. (3) CSR test Although the tests on coke mechanical strength provide a useful measurement of its resistance to breakage and abrasion, they are conducted at ambient temperature and hardly take the blast furnace conditions into account [22]. To overcome this drawback, a test method combining the coke reactivity and postreaction strength was introduced by the Nippon Steel Corporation (NSC) in the 1970s. The NSC method is described in a report published by the British Carbonization Research Association (BCRA) [59]. Now it has been adopted as an ASTM standard test method (ASTM D ) [60]. Two indices, coke reactivity index (CRI) and coke strength after reaction (CSR), are determined in this method. 200-g coke sample is put in a reaction vessel which is placed into an electric furnace as shown in Figure 2.8 where gasification takes place in an atmosphere of CO 2 gas at 1100 o C for 2 h. Subsequently, it is subject to 600 revolutions at 20 rpm in an I-type tumbler as shown in Figure 2.9. The weight loss after reaction determines the CRI, and the weight of the 24
![sample remaining above the 9.5-mm sieve after sieving the tumbled coke determines the CSR. Their calculation equations are as follows [60]: CRI A B 100 (2.11) A C CSR 100 (2.](/docs-images/84/89128050/images/44-0.jpg "12) B where A is the original sample weight before reaction, B is the sample weight after reaction, C is the sample weight after tumbling and sieving. Figure 2.")
44 sample remaining above the 9.5-mm sieve after sieving the tumbled coke determines the CSR. Their calculation equations are as follows [60]: CRI A B 100 (2.11) A C CSR 100 (2.12) B where A is the original sample weight before reaction, B is the sample weight after reaction, C is the sample weight after tumbling and sieving. Figure 2.8 Reaction apparatus for CSR test [60]. 25
45 Figure 2.9 I-type coke tumbler [60]. The two indices determined in the NSC method, CRI and CSR, are found to be highly correlated. As shown in Figure 2.10, Menendez et al. [19] demonstrated the direct relationship between CRI and CSR for a series of coke samples made from single coals of different ranks and from complex coal blends. Figure 2.10 Relationship between CRI and CSR [19]. 26

46 Generally, a low CRI and a high CSR are desirable to prevent coke from excessive gasification which tends to cause coke degradation and impair its permeability. As shown in Figure 2.11, CSR is influenced by several factors, such as coal rank, coal rheology, coal composition, and coking conditions. Among these factors, coal rank is considered as the dominant one [61]. Nakamura et al. [62] analyzed the operating data from NSC and suggested that CSR is dependent about 30% on the coking conditions and 70% on the coal or coal blend. Although coking conditions, such as bulk density, coking time, pressure, temperature, and heating rate, have been found to influence coal properties to some extent, the selection of coal or coal blend is the most important factor that should be considered for making coke of good properties. Figure 2.11 Main factors influencing CSR index [22] Chemical properties Carbon is the dominant chemical constituent in coke and the foundation of the roles that coke plays in the blast furnace. Besides carbon, impurities exist in coke, affecting its performance in the blast furnace in many ways. Such impurities include moisture, 27
47 volatile matter, ash (including alkalis), sulphur, phosphorous, etc. The typical requirements for the chemical properties of blast furnace coke in Europe are summarized by Leonard et al. [63], as shown in Table 2.3. Table 2.3 Required range of chemical properties of blast furnace coke [63]. Chemical properties Required range (wt%) Moisture 1-6 Volatile matter < 1.0 Ash 8-12 Alkalis < 0.3 Sulphur Phosphorous Moisture is a direct result of the quenching step, and the moisture content of coke is dependent on the way in which coke is quenched after taken out of the coking ovens. Driving off the moisture demands extra heat which consumes a larger amount of fuel. High and variable moisture content increases the coke rate and impairs the stability of blast furnace operations. Hence, the moisture content of coke should be minimized and constant for the stable operation with lower fuel consumption. It can be kept at a very low level by strict regulation of the quenching conditions. The moisture content of the blast furnace coke usually ranges from 1 to 6 wt% [63]. The volatile matter in the coking coal is mostly driven off in the carbonization process. But even perfectly carbonized coke still contains a small amount of volatile matter which comes from absorbed gases such as oxygen, carbon dioxide and water vapor. 28
48 Excessive volatile matter may give rise to operational problems in the cleaning of blast furnace gas. The required volatile matter content of blast furnace coke is usually less than 1 wt% [63]. Coke ash notably affects the performance of the blast furnace by virtue of both its amount and composition largely because of its direct relationship with the production of slag. Minerals in the coke ash relate to the reactions with gas, metal and slag [64,65]. Alkalis in the coke ash, especially potassium and sodium, have a detrimental effect on blast furnace operation since they act as effective catalysts for gasification, thus dramatically deteriorating coke strength and accelerating coke degradation [66-68]. The ash content of blast furnace coke usually ranges from 8 to 12 wt% [63]. Values higher than 10 wt% are acceptable if the chemical composition is appropriate. Sulphur carried by coke accounts for the majority of the sulphur brought into the blast furnace by the raw materials. Sulphur-bearing minerals in coke ash are pyrrhotite, wurtzite, Cu-Fe-S phase, CaS, and BaS [69]. The sulphur content of coke is an important quality index since it exerts a considerable impact on the quality of slag and hot metal. In the blast furnace, most of the sulphur is removed by slag, while the rest is either removed by top gas and flue dust or enters hot metal [39] Microtexture As a result of the recognition of the significant influence of the microtexture on coke strength and reactivity, the two most critical parameters that characterize the coke quality, a great interest has been paid to coke microtexture by many researchers who have developed their own terminology and classification schemes in their studies, which 29
49 differ from each other while certain similarities and overlaps exist in many terms they use. A comparison of the nomenclature and classification methods these researchers have developed for coke microtexture is presented in Figure Figure 2.12 The nomenclature and classification methods of coke microtexture [24]. 30
50 Among these classification methods, U. S. Steel has given the most comprehensive one with a detailed description of the appearance and origin of different carbon forms using a system of coal petrography [70]. As listed in Table 2.4, this classification of carbon forms consists of two major categories, i.e., binder phase and filler phase. The reactive entities (vitrinite, exinite, resinite, and reactive semifusinite) in coal soften in the carbonization process and serve as a binder. The inert entities (inert semifusinite, fusinite, micrinite, macrinite, and inertodetrinite) do not soften in the carbonization process and serve as a filler incorporated by reactive entities or macerals [71-73]. The binder phase carbon forms are based on the rank of the parent coals as determined by vitrinite reflectance. The vitrinoid type (V-type) concept introduced by U. S. Steel [74,75] is used to correlate V-types with coke carbon forms. These binder phase is further categorized into isotropic, incipient anisotropic, circular anisotropic, lenticular anisotropic, and ribbon anisotropic forms by the domain shape, size and degree of anisotropism. In addition to the binder phase, filler phase carbon forms are also related to the maceral composition and mineral matter in the parent coals. These carbon or mineral forms are the materials that do not soften in the carbonization process and are incorporated by the reactive entities or binder phase carbons in the coke produced. The filler phase carbons are further categorized into organic inorganic and miscellaneous inerts by size, color, relative appearance, and association with other carbon forms. 31
51 Table 2.4 U. S. Steel classification of coke microtexture [71]. Binder phase Domain dimensions Coal rank vitrinoid Relation of length Width (μm) type (L) and width (W) Isotropic 0.0 None 7 Incipient (anistropic) 0.5 L = W 7-8 Circular (anistropic) Fine circular L = W 8-9 Medium circular L = W 9 Coarse circular L < 2W Lenticular (anistropic) Fine lenticular W L < 4W Medium lenticular W < L < 4W 13 Coarse lenticular W < L 4W 14 Ribbon (anistropic) Fine ribbon L > 4W 15 Medium ribbon L > 4W 16 Coarse ribbon L > 4W Filler phase Size (μm) Precursors Organic inerts Fine < 50 Micrinite, macrinite, inertodetrinite Coarse > 50 Semifusinite, fusinite, macrinite Miscellaneous inerts Oxidized coal Oxidized coal Brecciated coal Brecciated coal Noncoking vitrinite High/low rank vitrinite Inorganic inerts Fine < 50 Various types and sizes of mineral Coarse < 50 matter 32
52 In general, coke microtexture can be divided into two components, i.e., the inert maceral-derived component (IMDC) and the reactive maceral-derived component (RMDC). IMDC and RMDC have been found to behave differently in terms of strength, reactivity, graphitization and dissolution [10]. The IMDC and RMDC are also referred to as isotropic and anisotropic carbons. Isotropic carbons exhibit optical properties that are the same in all direction when viewed under an optical microscope using mutually exclusive polarized light. On the contrary, anisotropic carbons exhibit optical properties of different values when viewed under an optical microscope using mutually exclusive polarized light [76]. The anisotropic carbons can be further divided into certain subclasses according to different shapes (e.g., granular, aciculate, ligulate, circular, lenticular, ribbon, flow-like) and sizes (e.g., very fine, fine, medium, coarse) which are related to the rank and type of the parent coals directly. The nature of the parent coal is the decisive factor controlling the carbonization process and thus, is the key to determining the formation and composition of the coke microtexture. The microtexture of coke has proved to be of close relevance to coke performance in the blast furnace. Marsh et al. [77] considered the coke microtexture to be composed of isotropic carbon and anisotropic carbon in the form of mosaics and flow-type anisotropy, and concluded that the interlocked, randomly oriented mosaic anisotropic carbon was more resistant to fracture and crack propagation than the flowtype anisotropic carbon or the isotropic carbon. Moreland et al. [78,79] established equations derived using textural compositions obtained by polarized light microscopy (PLM) and scanning electron microscopy (SEM) to predict the tensile strength of cokes made from multi-component blends with adequate precision. It was indicated from the magnitude of the strength terms that the granular- and striated-flow and the coarse- and 33
53 medium-mosaic textural components were related to high coke strength. Andriopoulos et al. [80] found that the hardness and Young s modulus of IMDC were higher than those of RMDC. Xing et al. [81-84] also found that the initial fracture toughness of IMDC was slightly lower than that of RMDC, and the deterioration of RMDC caused by annealing was more severe than that of IMDC. Xing et al. [85] also concluded that the extent of graphitization was more pronounced in RMDC than that in IMDC based on Raman spectroscopic measurement Microstructure In the past, the carbon structure of carbonaceous materials used to be characterized by maceral analysis and reflectance measurements which were not able to distinguish different carbon types. Afterwards, advanced analytical techniques such as X-ray diffraction and Raman spectroscopy have been increasingly developed to characterize the carbon structure [86]. The carbon structure of coke can be represented by a vast number of small hexagonal crystallites in a turbostratic structure. The investigations on the carbon structure of coke are often derived from graphite structure [87]. Graphitic structure is described as a regular, vertical stacking of hexagonal aromatic layers, as shown in Figure 2.13(a). Each carbon atom within the basal plane is linked through covalent bonding (sp 2 ) to three carbon atoms. But the van der Waals bonding across the planes is very weak and can easily be broken by external forces. The crystallite size can be represented by the average stack height (L c ) and width (L a ), which are illustrated in Figure 2.13(b). L c and L a can be calculated based on the (002) carbon peak and the (10) carbon peak respectively on the XRD pattern by the Sherrer s equation [51,88,89]: 34
54 L ca / A (2.13) B cos where A is a constant for the corresponding carbon plane, λ is the X-ray wavelength, B and θ are the corresponding full width at half maximum (FWHM) and the Bragg angle for the (002) peak and the (10) peak. Figure 2.13 (a) Structure of graphite crystal; (b) Concepts of L c and L a [87]. L c and L a are widely used to determine the effects of thermal treatment on the carbon structure of coke. The sharper and narrower (002) and (10) carbon peaks mean higher L c and L a values, so the larger growth of the crystallite size, higher ordering of carbon structure, and greater graphitization degree. The L c values for coke typically range from 1.5 to 4.0 nm, and those for graphite are over 10 nm. Kawakami et al. [86] studied the evolution of coke carbon structure when annealing in a temperature range of 1273 to 2473 K in a bench-scale reactor. The results showed that L c and L a did not change visibly up to 1873 K, but followed by a significant enlargement with further temperature increase. Legin-Kolar et al. [90] measured L c of 35
55 different kinds of coke after heat treatment from 1200 to 2400 o C. L c distinctly increased as the temperature went higher for all cokes. Gupta et al. [4] proposed the graphitization degree, represented by L c value, as a suitable indicator to estimate the temperature profile of the tuyere region in the blast furnace, and obtained a temperature calibration curve by plotting L c value of the heated cokes against temperature. Lundgren et al. [51] carried out an investigation on the L c of cokes heated in the laboratory and those extracted from the experimental blast furnace. Three data processing approaches were tried to compute the L c value. In the uncorrected approach, the total peak width as observed was used for L c computation; in Method I, contributions of the overlapping peaks to intensity were removed through deconvolution; in Method II, only the symmetric part of the deconvoluted peaks was used. As a result, the highest L c value was obtained with Method II, but the gap between Method I and II was narrowed with temperature increase. As the graphitization degree of coke increases to a rather high level, irregular graphite crystals can be observed in SEM images, the most common forms of which are flakelike and hexagonal prism-like crystals or their combinations [4,23]. Raman peak of the graphite-like materials is generally known to occur at 1580 cm -1. This peak, also known as G band, is related to the energy of sp 2 bonding and is assigned to the normal graphite structure [91]. In less ordered carbonaceous materials, Raman peaks are often observed at 1360 cm -1 and 1620 cm -1. These two peaks, known as D and D bands, are believed to originate from defect structure of graphite. But only two broad peaks appear near 1600 cm -1 and 1360 cm -1 for coke. These peaks are designated as G* and D* bands, respectively. After curve fitting, the G* and D* bands can be 36
56 deconvoluted into four peaks: G*, D*, R 1 and R 2, as shown in Figure The R 1 peak appears from 1510 to 1527 cm -1 and R 2 from 1239 to 1280 cm -1, respectively. These two peaks are assigned to the so-called turbostratic or random structure [92]. Upon annealing, G* and D* bands will become sharper. When annealing temperature reaches a certain high level, G* band will eventually split into two peaks, and the spectrum becomes similar to that of synthetic graphite [93]. Based on the Raman spectrum, coke graphitization degree can be quantitatively calculated as the ratio of the area of G peak to the total area [94,95]. Kawakami et al. [92] found that the G fraction started to increase slightly from 1373 K and remarkably from 2033 K. Xing et al. [81] also demonstrated the increase in G fraction as annealing temperature rose from 1673 to 2273 K, approaching the G fraction of the highly ordered pyrolytic graphite (HOPG). Figure 2.14 Curve fitting of the Raman spectrum for coke [87]. 37
57 Pores in the coke have a wide range of sizes from less than 1 nanometer to several hundred millimeters. They can be divided into three types according to their radius sizes: micropores ( nm to nm), mesopores ( nm to nm) and macropores (> nm). The total porosity includes the empty spaces between different carbon microtextures, large pores (macropores) formed by the release of volatile matter during carbonization and fissures produced by internal stress of cokes [96]. The porosity of coke is determined by the coal rank, maximum fluidity and macerals. Low rank coals with good fluidity make cokes with high porosity and large pore size, while medium rank coals generate less porous cokes with smaller pore size [96]. As shown in Figure 2.15, a model of coke matrix structure can be imagined by transmission electron microscopy (TEM) [97]. Coke has a porous structure, each pore wall being made up of a molecular orientation domain (MOD). The polyaromatic structural units are locally oriented in parallel. The size of the MOD can vary from less than 50 nanometers up to tens of micrometers. The mean size of the MOD is determined by the chemical composition of the parent coals, especially the O/H ratio: the higher the O/H ratio, the smaller the MOD. 38
![Figure 2.15 Model of coke matrix structure [97]. 2.3.5 Mineral matter Typically, the mineral matter content in cokes is about 8-12% [63].](/docs-images/84/89128050/images/58-0.jpg "The mineralogical composition of coke is different from that of the coal since decompositions of some mineral matter and reactions between minerals occur during carbonization.")
58 Figure 2.15 Model of coke matrix structure [97] Mineral matter Typically, the mineral matter content in cokes is about 8-12% [63]. The mineralogical composition of coke is different from that of the coal since decompositions of some mineral matter and reactions between minerals occur during carbonization. The strength and reactivity of coke in the blast furnace are affected by mineral matter in many ways such as the formation of cracks and weak spots in the coke matrix and the catalyzing reactions by catalytic mineral phases [30-34]. It is complicated to characterize the coke minerals due to the heterogeneous nature of coke. Current understandings of the mineral matter in coke are largely based on the oxide analysis of coke ash, which have not taken into account the fact that coke minerals are present in various sizes, distributions and associations with carbon matrix 39
59 [35]. XRD has been applied to identify and estimate coke minerals quantitatively. However, XRD can only identify crystalline phases. But more than 60% of the inorganic matter of the original cokes is present in glassy or amorphous phases [11]. Besides, the specimen needs to be prepared carefully to minimize the effect of ashing on coke mineralogy. Recently, radio-frequency oxygen plasma ashing at low temperature has been used to remove the carbon with minimal change of the mineral phases (low temperature ashing, LTA) [17,33,98,99]. Using this ashing method, Grigore et al. [17] investigated four different cokes and listed their mineral compositions (Table 2.5). Figure 2.16 shows the XRD pattern of the four LTA samples. It shows that both the nature and abundance of the mineral phases varied between different cokes. The following mineral phases were present in all four coke samples: quartz (SiO 2 ), mullite (Al 6 Si 2 O 13 ), fluorapatite (Ca 5 (PO 4 ) 3 F), rutile (TiO 2 ), anatase (TiO 2 ), iron phosphate (FePO 4 ), metallic iron (Fe), pyrrhotite (Fe 1-x S), oldhamite (CaS), jarosite ((K,H 3 O)Fe 3 (SO 4 ) 2 (OH) 6 ) and bassanite (CaSO 4 0.5H 2 O). The following mineral phases were found in some of the samples: cristobalite (SiO 2 ), leucite (KAlSi 2 O 6 ), hematite (Fe 2 O 3 ), magnetite (Fe 3 O 4 ), wustite (FeO), akermanite (Ca 2 Mg 2 Si 2 O 7 ), brookite (TiO 2 ), diopside (CaMgSi 2 O 6 ), aluminium oxide (Al 2 O 3 ), coquimbite (Fe 2 (SO 4 ) 3 9H 2 O) and spinel (MgAl 2 O 4 ). Quartz, mullite and fluorapatite were the major crystalline phases. The rest accounted for less than 2% of the ash content with two exceptions in Coke F, jarosite (4.3%) and pyrrhotite (4%). Although LTA proves to be a good way to prepare coke samples with minimal effect of ashing on the mineral 40
60 change, some minerals can still be altered in the ashing process. Some oxidized mineral forms (bassanite, coquimbite and jarosite) that were not present in the raw cokes were found to be generated during this procedure, most likely from oldhamite and pyrrhotite. Figure 2.16 XRD patterns of four LTA samples [17]. The mineral matter is present in coke ash as both crystalline and amorphous forms. The elemental composition as oxides present in crystalline and amorphous forms is presented in Table 2.6. The percentage of the oxides of the elements in the amorphous form was determined from the difference between the total percentage of the oxides of the elements from the ash analysis and the percentage of the oxides of the elements in the crystalline form. The elements in this table were shown mostly in the amorphous form with a few exceptions. Iron and potassium were mostly present in amorphous alumino-silicate phase, calcium is completely accounted by the crystalline phase, while sodium exists only in the amorphous phase [17]. 41
61 Sakurovs et al. [33] also carried out quantitative characterization of mineral matter in commercial cokes using LTA method. It was concluded that most of the mineral matter in the coke existed as amorphous alumino-silicates that comprised partially decomposed clays and other materials which became structure-less as a result of the removal of constitutional water and volatiles upon heating. This material was unlikely to have been through a molten intermediate stage but was caused by solid state transformations, since the maximum temperature to which the cokes were exposed was below the melting point of these minerals. There was no sign of the existence of strongly reduced phases such as carbides. Mineral matter such as carbonates, clays (except some illite), goyazites and feldspars, was thermally unstable so was absent in the coke. Illite was considered to decompose above 750 o C [100]. Bassanite and jarosite were considered as artifacts of the LTA process because of the oxidation of calcium and iron sulfides. Bassanite can also form from the organic sulfur and calcium. Bassanite and jarosite may also form in the quenching process of cokes as hematite [101]. 42
62 Table 2.5 Mineral phase compositions in four LTA samples [17]. Mineral phase Chemical formula B C F G Akermanite Ca 2 Mg 2 Si 2 O Alumina Al 2 O Anatase TiO Brookite TiO Cristobalite SiO Diopside CaMgSi 2 O Fluorapatite Ca 5 (PO 4 ) 3 F Hematite Fe 2 O Iron Fe Iron phosphate FePO Leucite KAlSi 2 O Magnetite Fe 3 O Mullite Al 6 Si 2 O Oldhamite CaS Pyrrhotite Fe 1-x S Quartz SiO Rutile TiO Spinel MgAl 2 O Wustite FeO Amorphous Phase
63 Table 2.6 Elemental composition (wt%) as oxides in crystalline and amorphous forms in coke [17]. SiO 2 Al 2 O 3 Fe 2 O 3 CaO MgO TiO 2 Na 2 O K 2 O P 2 O 5 SO 3 BaO SrO Coke B Total Crystalline form Amorphous form Coke C Total Crystalline form Amorphous form Coke F Total Crystalline form Amorphous form Coke G Total Crystalline form Amorphous form
64 2.4 Coal properties influencing coke properties Coke properties depend on the parent coal properties such as coal rank, macerals and mineral matter. With the increase in coal rank, coal can be divided into four major groups: peat, lignite, bituminous coal and anthracite. Coal rank is assessed according to the volatile matter content, vitrinite reflectance or carbon content. Coal rank increases with decreasing volatile matter content, increasing vitrinite reflectance and increasing carbon content [84]. Coal rank has a direct influence on coke microtexture and microstructure. As coal rank increases, the coal becomes more aromatic and polymerized, thus increasing the size and content of anisotropic carbon [96]. According to a study on four Australian black coals ranging in rank from semi-anthracite to bituminous coal by Lu et al. [88], the crystallite height (L c ) decreased with increasing volatile matter content, i.e., decreasing coal rank (Figure 2.17). The dependence of coke microstructure on parent coal rank is reported by Rouzaud et al. [97]. A low-rank coal makes a coke with small MOD (~5 nm) while a high-rank coal makes a coke with big MOD (~ 20 µm). 45
65 Figure 2.17 Relationship between coal structural parameters and volatile matter [88]. The term maceral was first introduced by Stopes [102] as the smallest microscopically observable units in coal. Macerals are the coalified remains of plant tissues or plantderived substances existing at the time of peat formation. The macerals can be divided into three main groups: liptinite, inertinite and vitrinite. Vitrinite is the major maceral in coal, which softens and melts during coking process. Liptinite evaporates during coking process, which makes it difficult to be traced in the resulting coke. The reflectance of liptinite is the lowest compared with inertinite and vitrinite. Most inertinite in coal remains its original properties during coking process. The reflectance of inertinite is the lowest among the three groups [84]. During carbonization, most inertinite does not fuse and forms the IMDC in the coke, while fusible macerals (vitrinite, liptinite, and a small part of the inertinite) form the RMDC in the coke. In coal, the most abundant minerals are quartz, feldspars, carbonates, sulfates and clays. Besides, there are minor minerals including phosphates, titanium minerals, and 46
66 alumino-carbonates [84]. Some minerals in coal undergo decomposition and transformation while the others remain unchanged during carbonization, all of which result in the mineral matter in the resulting coke. Quartz, apatite and titanium dioxide experience little or no change during carbonization and maintain their original phases in the resulting coke [84]. Alumino-silicates in coke are formed from the decomposition of clays such as kaolinite and illite [11]. As shown in Figure 2.18, amorphous metakaolinite is formed from kaolinite at approximately 450 C, and meta-kaolinite decomposes to cristobalite and mullite at approximately 950 C [103]. Metallic iron is formed by the decomposition of pyrrhotite or the reduction of iron oxide [104]. Figure 2.18 Major mineral transformations that occur upon heating [103]. 2.5 Coke gasification Reaction mechanism and kinetics Among all the reactions relevant to coke in the blast furnace, gasification has drawn the most attention due to its significant impact on coke degradation and fines generation. 47
67 Coke gasification, also known as the Boudouard reaction or the solution loss reaction, represents the endothermic reaction of coke carbon with CO 2 [12]: C + CO 2 2CO H = kj/mol (2.14) The above reaction is often interpreted by the following oxygen-exchange mechanism [105]: CO 2 CO + (O) (2.15) C f + (O) CO + C(O) (2.16) CO (CO) (2.17) where C f is the available active sites and C(O) is the occupied site. Following the Langmuir-Henshelwood theory, the reaction rate, R c, is expressed as: R c kp 1 CO2 1 k P k P (2.18) 2 CO 3 CO2 where k 1, k 2 and k 3 are the rate constants, P CO and P CO2 are the partial pressures of CO and CO 2, respectively. Ignoring the inhibiting effect of CO, the rate in regard to CO 2 concentration is approximately first order at low pressures but approaches zero order at higher pressures. Blackwood and Ingeme [106] added two steps taking into account the inhibiting effect of CO: 48
68 C(CO) + CO 2 2CO + CO (2.19) CO + C(CO) C f + CO 2 (2.20) and R c becomes as follows: R k N P k N P / (1 k P k P ) (2.21) 2 c 1 t CO 4 t CO 2 CO 3 CO where N t is the total number of the active carbon sites. Kajitani et al. [107] used two reaction rate equations for the CO 2 gasification, i.e., nth order and L-H type reaction rate equations. In the nth order reaction rate equation, the overall char gasification rate is proportional to the nth power of the partial pressure of CO 2 and follows the Arrhenius equation: E/ RT n Rc A0e PCO (2.22) 2 where A 0 is the frequency factor, E is the activation energy, T is the temperature, R is the universal gas constant, P CO2 is the partial pressure of CO 2, and n is the reaction order. For the purpose of explaining the variation in the dependence of partial pressure on the gasification rate, the L-H type rate equation was proposed [92]: R c k P S 1 k P k P 1 CO CO CO k P CO (2.23) where S is the surface area per unit volume, which is defined as: S S (1 x ) 1 ln(1 x ) (2.24) 0 49
69 (1 ) 4 L S 0 0 (2.25) 0 where L 0 and ԑ 0 are the pore length and porosity, respectively. Steps involved in the gasification reaction of coke are as follows [12]: (1) Mass transport of the reactant gas (CO 2 ) and the product gas (CO) across the gas film around the coke particle. (2) Mass transport of the reactant gas (CO 2 ) from the external surface to the reaction site through pores and the mass transport of the product gas (CO) from the reaction site to the particle surface through pores. (3) Chemical reactions on the reaction site including the adsorption of the reactant gas (CO 2 ) to the carbon surface and the desorption of the product gas (CO) from the carbon surface. An Arrhenius approach, which is based on the Arrhenius equation, is usually used to define three zones of gas-carbon reaction related to the above-mentioned steps (Figure 2.19). In Zone I, the rate of chemical reaction at low temperatures is low, so the diffusion rate of the gaseous reactant is sufficient to compensate the consumption of the reactant. The reaction rate is controlled by step (3). The activation energy is the true activation energy in this zone. Zone II is an intermediate zone, where the reaction rate is controlled by both steps (2) and (3). The apparent activation energy in this zone is significantly lower than the true activation energy. In zone III, step (1) becomes the rate 50
70 controlling step at very high temperatures. The apparent activation energy in this zone is very low. The hatched areas represent the transition between ideal zones. The true activation energy of coke gasification reported in the literature varies widely in the range from 120 to 270 kj/mol [ ]. There is no consensus about the transition temperature between zones. The activation energy and transition temperature depends on the physical and chemical properties of the materials and the reaction conditions such as gas composition, gas flow rate, pressure and apparatus [111]. Figure 2.19 Schematic representation of three zones of gas-carbon reaction [12] Factors affecting gasification rate The reaction rate of coke gasification is relatively slow and easy to measure. The relative reaction rate of gasification under identical conditions is reported as the 51
71 reactivity [19]. Reactivity is one of the most important parameters used to evaluate the performance of coke in the blast furnace. The reactivity of coke is controlled by coal properties and coking conditions, but is most directly determined by coke properties. Besides, the gasification rate for carbonaceous materials is also affected by the reaction conditions such as temperature, pressure, gas composition and particle size. Therefore, the reaction rate of gasification is affected by multiple factors Temperature It is obvious that the rate of a reaction depends on the reaction temperature. Temperature is one of the most important kinetic parameters to the gasification of carbonaceous materials, as it affects the thermodynamics and kinetics of the reaction. Thermodynamically, the endothermic gasification reaction is favorable at higher temperatures as is seen in Figure 2.20, which presents equilibrium constants for carbongas reactions [112]. Kinetically, according to the Arrhenius equation, gasification rate increases with temperature, especially in the low temperature zone where the reaction rate is controlled by the intrinsic chemical reaction. The effect of temperature becomes less significant in the high temperature zone, since the reaction rate is primarily controlled by the mass transport. 52
72 Figure 2.20 Equilibrium constants for carbon-gas reactions [112]. On the other hand, temperature also affects gasification through its influence on the microstructure of carbonaceous materials. It is generally known that carbonaceous materials with higher graphitization degree exhibit lower reactivity. At high temperatures, the graphitization degree of coke increases as indicated by the crystalline size (L c/a ) based on XRD and G fraction based on Raman spectra. As reported by Xing [84], in the temperature range of 700 to 1100 C, the L c value marginally changed with annealing temperature. When temperature increased from 1100 C to 1500 C, a significant growth of L c was observed. The G fraction in the Raman spectra of cokes exhibited a similar behavior. A correlation was made between the G fraction and the L c 53
73 in the temperature range of 1100 to 1500 C, as shown in Figure Graphitization by annealing at high temperatures increased both the crystallite size and the G fraction in the Raman spectra. Figure 2.21 Correlation between L c and G fraction for carbonaceous materials subject to annealing temperatures from 1100 to 1500 o C [84]. Liu et al. [113] studied the gasification activities of three kinds of Binxian chars at o C under atmospheric pressure by TGA, and noted that the gasification rates of the chars all increased with rising temperature. However, Senneca et al. [114] studied the relevance of thermal treatment to the char reactivity with CO 2 through TGA, and found that increasing the temperature of thermal treatment negatively affected the gasification rate of the char, which is associated with the transformation in the turbostratic structure and the inorganic constitution caused by annealing. The reduction of reactivity might be caused by the formation of low-crystallinity or amorphous phases embodying calcium 54
74 as a constitution. The gasification rate control mechanism is found to be different at different ranges of temperature. Gulbransen et al. [115] pointed out that below 1350 o C the reaction followed a chemical controlled reaction mechanism in which the reaction occurs uniformly throughout the graphite structure with a high heat of activation of 88±5 kcal/mol, while above 1400 o C the reaction followed an external gas diffusion controlled mechanism. The rate of reaction is proportional to the flow rate but is not a linear function at constant pressure. At 1400 o C, an increase in the flow by a factor of 4.65 led to an increase in the reaction rate by a factor of At 1500 o C, an increase in the flow by a factor of 5.3 led to an increase in the reaction rate by a factor of 3.9. It indicates that a simple diffusion model is not sufficient to explain the kinetics of the gas diffusion controlled reaction Pressure Pressure affects gasification reaction directly by changing the partial pressure and indirectly by changing the transport rate. Blackwood and Ingeme [106] investigated the reactions of purified carbon with CO 2 over a pressure range of 1 to 40 atm and concluded that the reactivity was enhanced with the increase in gas pressure. 55
75 Messenbock et al. [116] conducted transient conversion experiments of a bituminous char under pressures from 0.1 to 3.0 MPa in pure CO 2 atmosphere at 1000 o C. As shown in Figure 2.22, the extents of char conversion for all pressures increased linearly in the first 20 s, and then more slowly for further gasification. At 60 s, the extents of char conversion were 24, 65.2, 78.6, and 86 wt% at pressures of 0.1, 1.0, 2.0, and 3.0 MPa, respectively. The incremental conversion became smaller at progressively higher pressures, indicating the saturation of this effect. Figure 2.22 Conversion of chars under pressures from 0.1 to 3.0 MPa in pure CO 2 at 1000 o C [116]. Adanez et al. [117] carried out a study of the initial gasification rates of Spanish lignite char under pressures from 0.5 to 3.0 Mpa in pure CO 2 at 1000 o C. As shown in Figure 2.23, a diminishing sensitivity to pressure variation was observed at progressively 56
76 higher pressures. Figure 2.23 Effect of pressure on gasification rate of different chars [117] Gas composition Kajitani et al. [7] analyzed the influence of gas composition (partial pressure) on the reaction rate of gasification of a coal char using a pressurized drop tube furnace (PDTF) at a high temperature and a thermogravimetry (TG) at a low temperature. As shown in Figure 2.24, the reaction rate changed with the partial pressure of the H 2 O (steam) or CO 2 when temperature and total pressure were set at 1300 C and 0.5 MPa, respectively. They found the reaction rate proportional to the 0.73 power of CO 2 partial pressure and to the 0.86 power of steam partial pressure in the PDTF experiments. The experiments using TG at low temperatures showed the reaction rate proportional to the 0.54 power of CO 2 partial pressure and to the 0.68 power of oxygen partial pressure. 57
77 Figure 2.24 Change of initial gasification rate of coal char with partial pressure of gasifying agents [7]. Sha et al. [118] investigated the effects of operating pressure on coal gasification. They found the C-H 2 O and C-CO 2 reactions similar to each other. Their reaction rates increased with increasing partial pressure of H 2 O and CO 2 up to MPa, and then seemed to have a zero order with respect to the partial pressure of reacting gases. The kinetic equation for the reaction with steam at 850 o C can be expressed as: 0.130PHO PH O PH PCO (2.26) 2 W The kinetic equation for the reaction with CO 2 at 900 o C can be expressed as: 0.137P 2 W CO P CO PCO 2 (2.27) 58
78 Everson et al. [111] analyzed the reaction rate of CO 2 -N 2 gas mixtures with a high ash char and obtained the reaction order with respect to CO 2 partial pressure as There is no consensus in the literature on the magnitude of the order as they are obtained with different samples at different pressures and temperatures. The activation energy was also obtained at constant partial pressures of CO 2 as listed in Table 2.7. The average activation energy was 235 (±37) kj/mol for CO 2 concentrations higher than 20%. Table 2.7 Activation energy at constant partial pressures of CO 2 [111]. CO 2 (mol%) Activation energy, E (kj/mol) Particle size Zhang et al. [110] studied the reactivity for steam gasification of petroleum coke with different sizes. As shown in Figure 2.25, they found that the time for a complete conversion was shorter for smaller coke particles. The difference of completion time between the small particles was not as significant as that between the large particles. Samples with smaller sizes may have higher surface area to provide more chances to contact with the gasifying agents. 59
![Kajitani et al. [107] investigated the influence of particle size on the CO 2 gasification rate of coal char. Two different particle sizes, i.e., 20 and 44 μm, were tested using PDTF and TG at constant CO 2 partial pressure of 0.](/docs-images/84/89128050/images/79-0.jpg "2 MPa. As shown in Figure 2.26, the intrinsic reaction rate showed no difference between different particle sizes in the low temperature zone.")
79 Kajitani et al. [107] investigated the influence of particle size on the CO 2 gasification rate of coal char. Two different particle sizes, i.e., 20 and 44 μm, were tested using PDTF and TG at constant CO 2 partial pressure of 0.2 MPa. As shown in Figure 2.26, the intrinsic reaction rate showed no difference between different particle sizes in the low temperature zone. In contrast, the reaction rate of 20-μm char was shown to be higher than that of 44-μm char in the high temperature zone. This indicates that the pore diffusion plays a more important role in the high temperature zone. Figure 2.25 Variation of conversion time for steam gasification of petroleum coke [110]. 60
![Figure 2.26 Influence of particle size on gasification rate of coal char [107]. 2.5.2.5 Mineral matter Ash content and ash composition have been considered as important properties in determining coke reactivity.](/docs-images/84/89128050/images/80-0.jpg "The ash content from the proximate analysis of coke was found to be a good indicator of coke reactivity by Vogt et al. [119].")
80 Figure 2.26 Influence of particle size on gasification rate of coal char [107] Mineral matter Ash content and ash composition have been considered as important properties in determining coke reactivity. The ash content from the proximate analysis of coke was found to be a good indicator of coke reactivity by Vogt et al. [119]. But the impact of ash content on coke reaction rate was shown to be little in a study reported by Duval et al. [27]. Ash composition was found to be another important parameter in coke reactivity [17,120]. Iron, calcium, potassium and sodium oxides are known to act as catalysts in the gasification process [121]. The roles of coke ash in the gasification reaction are complex. Some ash minerals catalyze the gasification. However, the reaction may be hindered by molten ash, which covers the surface and blocks the pores 61
81 at high temperatures. The actual impact of mineral matter is dependent on gasification temperature, gas composition and the properties of the mineral matter such as content, composition, size, and distribution through the coke matrix. The mineral forms and their amounts in the ash affect the reactivity of coke. Iron, calcium and potassium oxides are identified as catalysts in gasification process [17]. But iron, calcium and potassium are normally not present in coke as oxides only. Potassium can be found in coke as leucite. Above 1132 o C, potassium is partly transferred to the gas phase under blast furnace conditions, and the rest of it occurs as molten phase [122]. Calcium can be often found in coke as alumino-silicates (e.g., akermanite, diopside, and apatite) [17]. After decomposition at high temperatures, it can form CaS if sulphur is available in the system [69]. Metallic iron is considered as a very efficient catalyst in the gasification reaction. Pyrrhotite and hematite presented in coke are also found to catalyze the gasification reaction [17]. According to Grigore et al. [17], it was concluded that coke reactivity tended to increase with a larger total amount of catalysts in crystalline phase. The amorphous material was unlikely to account for the difference in reaction rate. Figure 2.27 shows the relationship between the total iron, potassium and sodium in amorphous phase and the initial apparent rate. 62
82 Figure 2.27 Relationship between the total iron, potassium and sodium in amorphous phase and the initial apparent rate [17]. Many researches have tried to explain the mechanisms of the catalyzed gasification of carbon with CO 2, which is summarized in Figure 2.28 [123]. Taylor and Neville [124] were among the first to work on the mechanism of the catalyzed gasification of carbon with CO 2. They found that the catalytic increase in reactivity was due to an enhanced adsorption of CO 2. Fox and White [125] reported that chemical reaction was not the rate-determining step, the increase in the reaction rate was a result of an increase in the mass transfer rate. The Na-metal evaporated into the bulk gas phase because of its high vapor pressure. The Na 2 CO 3 was drawn back to the carbon surface after reaction with CO 2. The catalyst acted as a pump between the carbon surface and the bulk gas phase. Long and Sykes [126] explained the mechanism of catalysis in terms of electronic interaction between carbon and catalyst. They proposed that covalent M-C bonds were 63
83 formed from a non-stoichiometric oxide with excess metal, which weakened the aromatic character and accelerated the reaction. McKee et al. [127] suggested a kinetic scheme comprising three elementary reactions: K 2 CO 3 + 2C = 2K + 3CO (2.28) 2K + CO 2 = K 2 O + CO (2.29) K 2 O + CO 2 = K 2 CO 3 (2.30) Yokoyama et al. [128] suggested that only metal and K 2 O were involved in the catalytic cycle. A possible involvement of intercalation compounds has often been proposed [129]. Wen [130] reported a detailed mechanism following the McKee mechanism but assumed intercalation compounds rather than alkali metal. Mims and Pabst [131,132] proposed that surface complexes of potassium phenolate type were the active species. Then they drew the conclusion that the active species contained 4-5 potassium ions [133]. Catalysis was assumed to occur due to a combination of CO 2 dissociation equilibrium and a rate-determining decrease by carbon. Wigmans [134] presented a detailed scheme embracing surface complexes, metal and metal oxide in various forms by combining the mechanisms of McKee, Wen, and Mims and Pabst. The relative abundance of different species was assumed to rely on the surface composition and the reaction conditions. Kapteijn and Cerfontain [135] formulated the elementary steps of catalysis as: 64
84 [K x O y ] + CO 2 = [K x O y+1 ] + CO (2.31) [K x O y+1 ] + C = K x O y + CO (2.32) The reaction rate was proportional to the concentration of [K x O y+1 ] species and governed by the oxidation power of the gas phase. Spiro et al. [136] suggested that a hydride-hydroxide cycle was necessary in char gasification in addition to the classical McKee cycle due to the high hydrogen levels in char in comparison to graphite. Wood et a1. [137] concluded that the carbonate transformed into a molten layer of nonstoichiometric oxides with excess metal, which acted as an oxygen transfer medium between the carbon surface and the gas phase. Figure 2.28 Published mechanisms for potassium catalyzed CO 2 gasification [123]. 65
85 Microtexture and microstructure Coke microtexture and microstructure are also important factors of coke properties that affect the coke reactivity. Many researches have consistently demonstrated that the isotropic microtexture reacts more readily than the anisotropic microtexture [ ]. Fujita et al. [139] compared the relative reactivity of four optical textures of metallurgical cokes and established their relationship as: flow-typed anisotropic texture < mosaic anisotropic texture < isotropic texture < inerts. Sharma et al. [140] made nine coke samples of different coal blend using stamp charging technology to study the effects of coke microtexture on CRI and CSR. With an increase in isotropic carbon, M10 index deteriorates and CRI increases. Moreover, an increase in anisotropic carbon has a positive effect whereas an increase in isotropic carbon has a negative effect on CSR. They put forward two reasons for the lower reactivity of the anisotropic carbon: a lower surface area of the carbon available for reaction and a lower intrinsic reactivity for the molecules that constitute the anisotropic carbon. Crawford et al. [141] gave an explanation for the higher reactivity of the isotropic carbon, attributing this phenomenon to the larger surface area and smaller bulk density of the isotropic carbon in comparison with the anisotropic carbon. On the other hand, some researchers pointed out the crucial role that the reaction conditions play in the reactivity, indicating an inverse trend that the anisotropic carbon is more reactive with CO 2 than the isotropic carbon in the presence of alkalis [142,143]. It is also noteworthy that anisotropic carbon exhibits a greater tendency of conversion to graphite than isotropic carbon at a high temperature, resulting in a higher carbon dissolution rate into liquid metal [144]. 66
86 Schapiro and Gray [145] analyzed the relative reactivity of different carbon forms based on the U. S. Steel classification. For the high-volatile-coal-derived binder phase carbons, the isotropic shows a high reactivity, the incipient anisotropic shows a high to intermediate reactivity, and the circular anisotropic shows an intermediate to low reactivity. Low-volatile coals produce ribbon anisotropic carbons which exhibit low to intermediate reactivity. The medium-volatile coals generate lenticular anisotropic carbons which exhibit the lowest reactivity. Filler phase carbons which consist of organic inerts, miscellaneous inerts, and inorganic inerts all exhibit high reactivity. The filler carbon of smaller size is less reactive than that of coarse size as it is enveloped in the binder phase and thickens the coke walls. IMDC has been regarded to have a greater reactivity than RMDC in many references although the mechanisms proposed in these references were not exactly consistent. Grigore et al. [28] considered the concentration of catalytic iron phases and micropore surface area as the major factors that made IMDC more reactive than RMDC. Huang et al. [146] suggested that the difference in the reactivity of IMDC and RMDC is partly attributable to the crystallinity of the carbonaceous structure. Kashiwaya and Ishi [85] proposed that the gasification reaction proceeds preferentially on the specified crystallographic planes, and that the rate of gasification was slower in the basal plane and faster in the prismatic plane. As shown in Figure 2.29, according to Gupta et al. [4], with increasing degree of graphitization, represented by the crystalline size (L c ), the apparent reaction rate of coke decreased, which confirms the reciprocal relationship between the ordering of carbon 67
87 structure and reactivity. Figure 2.29 Correlation of the coke apparent reaction rate with the crystalline size [4]. The reaction rate with CO 2 is determined not only by intrinsic reactivity of carbon but also by pore accessibility. Pore characteristics and pore surface area play an important role when the reaction rate is slow. Larger specific surface area and higher porosity enhance the diffusion of CO 2 into the inner part of coke and promote the gasification process. Patrick and Stacey [56,57] correlated coke reactivity not only with porosity volume but also with pore size, number of pores and pore wall size. They noted that reactivity increases with increasing volume of the pores, mean pore size and number of pores, and decreasing pore wall size. Adschiri and Furusawa [147] found that the conversion rates per unit surface area of all the char samples from 1073 to 1273 K were nearly constant over the higher range of conversion (X > 0.4), while the conversion rates as well as the surface area of these 68
88 chars obviously changed with conversion. Thus the conversion rates of these chars were shown to be almost proportional to the surface area in the gasification process. The conversion rates per unit surface area in the lower range of conversion (X < 0.4) were shown to be relatively higher than those in the higher conversion range. This might be explained by the underestimated surface area by the nitrogen adsorption. Nevertheless, the surface area determined by nitrogen adsorption technique has proved to be a useful parameter as it can describe the dynamic change in the gasification rate with increasing conversion though it is not the true surface area involved in the gasification reaction. Gupta et al. [62], however, claimed that the micropore surface area of coke is not fully responsible for its reactivity, which was found to increase consistently with increasing bed temperature of the EBF. The increasing coke reactivity was due to recirculating minerals such as alkalis instead of micropore surface area. Zamalloa and Utigard [148] illustrated how the specific surface area varied when coke and graphite samples were reacted with CO 2 isothermally at temperatures from 1173 to 1523 K. As shown in Figure 2.30, the specific surface area of petroleum coke decreased as the reaction temperature increased. In contrast, the specific surface area of breeze coke and graphite increased with temperature increase. The increase in surface area is attributed to the way the active surface area measured by BET changes as carbon is consumed during gasification. As for breeze coke particles, their texture is characterized by: i) pores larger than 10 μm serving as transport pores, and ii) extensive 69
89 macroporosity distribution in the range of 1 to l0 μm. The variation in their morphological features is attributed to the continuous variation in the ratio of active surface area to total surface area caused by pore enlargement and coalescence. Hence, a higher reactivity to CO 2 can be expected as micropore enlargement is conspicuous as a result of carbon consumption. Figure 2.30 Variations of specific surface area as a function of the isothermal reaction temperature [148]. 2.6 Summary and objectives From the literature review, coke gasification has a significant impact on coke performance in the blast furnace. The H 2 content in modern blast furnaces is much higher than before due to the higher pulverized coal injection rate. However, previous 70
90 studies on coke gasification are mainly focused on pure CO 2 and H 2 O atmospheres. The gasification reaction of metallurgical coke in the presence of H 2 has not received wide coverage in the literature, and the role of H 2 in the gasification process is poorly understood. In Chapter 4 of the thesis, coke gasification was studied at different temperatures, particle sizes, and CO 2 contents in CO 2 -CO-N 2 gas mixtures with and without H 2. The objectives were to determine: (1) the effects of temperature, CO 2 content and particle size on coke gasification kinetics; (2) the influence of H 2 on coke gasification; and (3) the mechanism of H 2 affecting the gasification reaction. Additionally, reactivity is one of the most important parameters used to evaluate the performance of coke in the blast furnace. The reactivity of coke is controlled by the coal properties and the coking conditions, but is most directly determined by the coke properties. Therefore, a better understanding of the coke properties affecting its reactivity is of great importance. In Chapter 5 of the thesis, gasification of five different cokes was investigated in CO 2 -CO-N 2 gas mixtures with and without H 2. Coke properties that potentially influence coke reactivity including ash content, catalytic index, surface area and crystallite size were measured and correlated with reactivity. The aims were to determine: (1) the reactivities of five different cokes at different temperatures with and without H 2 ; (2) the effects of coke properties on coke reactivity. Moreover, microscopic approaches have been used by some researchers in their studies on coke carbon textures (microtexture) and minerals. However, current microscopic 71
91 analyses on the changes in coke microtexture and minerals are mainly conducted by observing different areas of different samples before and after reactions, which are difficult to interpret due to the heterogeneous nature of cokes. In Chapter 6 of the thesis, the microtexture and minerals of coke were investigated by analyzing exactly the same sites of coke surface before and after reactions. The objectives were to determine: (1) the influence of gasification on coke microtexture (IMDC and RMDC); (2) the influence of gasification on the transformations of coke minerals; (3) the interactions between coke minerals and carbon matrix during the reaction. 72
92 3 Experimental 3.1 Raw materials and pre-treatments Five metallurgical coke samples described in the thesis are identified as: Coke A, B, C, D and E. Coke A was produced in a coke oven battery, while Coke B, C, D and E were produced in a pilot oven from different coal blends. Coke A was used for the study on the gasification of metallurgical coke in CO 2 -CO-N 2 gas mixtures with and without H 2 (Chapter 4) and the study on the influence of gasification on coke microtexture and minerals (Chapter 6). Coke A, B, C, D and E were used for the study on the gasification of different cokes with and without H 2 - relating reactivity to coke properties (Chapter 5). The proximate and ultimate analyses of the five coke samples are provided in Table 3.1. Table 3.1 Proximate and ultimate analyses of the coke samples. Coke Proximate analysis (wt%, ad) Ultimate analysis (wt%, daf) Moisture Volatile matter Ash Fixed carbon C H N S O d A B C D E ad: air dry; daf: dry ash-free; d: by difference. 73
93 These samples received in the form of lumps were crushed and sieved into particles for the experiments in Chapter 4 and 5. Three particle size ranges were used in Chapter 4: , , and μm. The particle size range used in Chapter 5 was from 500 to 1000 μm. Coke samples with small particles in a narrow particle size range were used (1) to have enough number of particles from different coke lumps so that the representative results can be obtained; (2) to have minimal effect of diffusion in the kinetic study so that the chemical reactivity can be demonstrated by the experimental data. The cylindrical coke pellets were prepared by drilling cores from the coke lumps and facing the cylindrical ends for experiments in Chapter 6. The pellet size was 8-mm diameter by 10-mm height. The top circular surface of the unreacted pellets was polished on a polishing machine (Struers Tegram) before being examined by scanning electron microscopy/energy dispersive spectroscopy (SEM/EDS). The pellets were not mounted by resin because they needed to be reacted in the furnace so that the same sites of the top surface can be examined by SEM/EDS again after reaction and compared with the unreacted ones. 3.2 Experimental setups and procedures The gasification experiments in Chapter 4 and 5 were carried out on a purpose-built TGA system illustrated in Figure 3.1. In each experiment, 0.10±0.01 g of coke particles were put in a silicon carbide crucible (10 mm-id) suspended from an electronic balance and placed into an alumina tube reactor (26 mm-id) in a graphite furnace. Prior to heating, the reactor was evacuated and purged with N 2 for 20 min. Then, the samples 74
94 were heated in a pure N 2 atmosphere to the target temperature at a heating rate of 10 K/min. After the temperature stabilized, N 2 was replaced by the reactant gas mixture (CO 2 -CO-N 2 or CO 2 -CO-H 2 -N 2 ) at a total flow rate of 2 L/min. The gasification continued at atmospheric pressure for 120 min unless the samples were fully gasified in a shorter time, after which the samples were cooled to ambient temperature in pure N 2. Sample mass was automatically recorded at 1 s intervals by an electronic balance connected to a computer. Figure 3.1 Schematic of the experimental setup in Chapter 4 and 5. The reaction temperature range used in Chapter 4 was from 1173 to 1873 K. The reaction temperatures used in Chapter 5 were 1273 and 1673 K. The gas mixtures used in the experiments were obtained by mixing individual high purity gases. The gas compositions were controlled by changing the flow rates of individual gases with mass flow controllers (Aalborg DFC) while maintaining a constant total flow rate. The compositions of the gas mixtures used in Chapter 4 are presented in Table 3.2. These 75
95 levels of gas compositions were selected to simulate the range found in the blast furnace between the thermal reserve zone and the active coke zone [14]. In Chapter 5, the composition of the CO 2 -CO-N 2 mixture was 10-vol% CO 2, 40-vol% CO, and 50-vol% N 2 ; the composition of the CO 2 -CO-H 2 -N 2 mixture was 10-vol% CO 2, 40-vol% CO, 10- vol% H 2, and 40-vol% N 2. Table 3.2 Compositions of the reactant gas mixtures in Chapter 4 (vol%). Reactant gas mixture CO 2 CO H 2 N CO 2 -CO-N CO 2 -CO-H 2 -N The experimental setup in Chapter 6 is illustrated in Figure 3.2. The coke pellet was put in an alumina reactor inserted into a vertical furnace for gasification reaction. The reactor consists of a gas ducting tube and a sheath. The pellet was located at the bottom of the gas ducting tube on an alumina plinth to support the pellet. A type B thermocouple was inserted through the gas ducting tube with the tip located above the pellet so that the temperature of the top surface of the pellet can be monitored. Prior to 76
96 heating, the reactor was purged with N 2 for 20 min. Then, the sample was heated in a pure N 2 atmosphere to 1473 K with a heating rate of 10 K/min. After the temperature stabilized, N 2 was replaced by the CO 2 -CO-N 2 gas mixture with a total flow rate of 1 L/min. The gasification was run for 15 min to achieve a reaction extent of about 10%, after which the sample was cooled to ambient temperature in pure N 2. The reaction extent was limited to 10% in order to maintain the basic morphology of the coke surface so that the reacted sample could be compared with the unreacted one. The gas composition used in the chapter (10 vol% of CO 2, 40 vol% of CO, and 50 vol% of N 2 ) was obtained by controlling the flow rates of individual gases with mass flow controllers (Aalborg DFC). Figure 3.2 Schematic of the experimental setup in Chapter 6. 77
97 3.3 Sample characterization Ash analysis The ash compositions of the coke samples were obtained by X-ray fluorescence (XRF) and the results are presented in Table 3.3. Based on the ash compositions of the coke samples in Table 3.3, a catalytic index, defined as the content of catalytic minerals in the coke ash, can be calculated using Equation (3.1) (wt%): CI = [Fe 2 O 3 ]+[CaO]+[K 2 O]+[Na 2 O] (3.1) Table 3.3 Ash analyses of the coke samples (wt%). Coke A B C D E SiO Al 2 O Fe 2 O CaO MgO Na 2 O K 2 O TiO Mn 3 O
98 P 2 O SO BaO SrO ZnO V 2 O Surface area The Brunauer-Emmett-Teller (BET) surface area of the coke samples was determined from gas adsorption isotherms using N 2 as adsorptive with a Micromeritics TriStar 3020 Analyzer Crystallite size The coke samples were milled and analyzed by a GBC-MMA X-ray diffractometer (XRD) with a Cu-Kα radiation (35 kv, 28.5 ma) as the X-ray source. Samples were scanned with 2θ in the range of 10 to 50 at a scanning rate of 1 /min. The shape of the (002) carbon peak of the XRD spectrum can be used as an indication of the crystallite size. The crystallite size, L c, was calculated using the Scherrer s equation [51,88,89] on the (002) carbon peak of the obtained XRD spectra: L c 0.89 cos (3.2) 79
99 where λ is the wavelength of the X-ray source ( Å for Cu-Kα radiation), β is the full width at half maximum intensity of the (002) peak, and θ is the corresponding Bragg angle Microscopic analysis The microscopic analysis was conducted by a Leica DMRM optical microscope and a JOEL JSM-6490LV SEM equipped with an EDS (Accelerating voltage: 15 kv, Spot size: 60 nm). Secondary electron (SE) mode was used to observe the topography of the carbon matrix, and backscattered electron (BSE) mode was used with EDS to examine the coke minerals and their interactions with carbon. 3.4 Data analysis The time N 2 is replaced by the reactant gas mixture is set as the beginning time of gasification. The carbon conversion is defined as [18]: X m m m 0 t 100% (3.3) c0 where m 0 and m c0 are the mass of the sample after being heated to the reaction temperature (g) and the corresponding mass of carbon in the sample at the beginning of gasification (g), and m t is the mass of the sample at a particular reaction time (g). The volatile matter was lost while the sample was heated to the reaction temperatures, so was not counted in the above masses. 80
100 The initial rate of gasification R 0 (s -1 ), defined as the change rate of carbon conversion with time (dx/dt), was determined from a linear correlation of X and t within the initial period up to 5% carbon conversion. This range of carbon conversion was used to ensure a high linear correlation coefficient (R 2 ~1) when the number of the experimental data was sufficient to be representative. The change of gasification rate was negligible within such a small range of conversion increment. R 0 is correlated with the gas compositions as follows [149]: R0 kf ( P, P ) (3.4) co2 H2 where k is the reaction rate constant (s -1 ), and f(p CO2, P H2 ) is a function of the partial pressures of CO 2 and H 2. The reaction rate constant depends on the temperature according to the Arrhenius equation [150]: k k e Ea / RT 0 (3.5) where k 0 is the pre-exponential factor (s -1 ), E a is the activation energy (J/mol), R is the universal gas constant (J/(mol K)), and T is the reaction temperature (K). Then R 0 can be expressed as: R k e f P P (3.6) E a / RT 0 0 ( co, ) 2 H2 The apparent activation energy of the reaction can be determined by the correlation between the initial reaction rate and temperature under constant partial pressures of CO 2 and H 2 by taking the natural logarithm of Equation (3.6): ln R ln[ k f ( P, P )] E / RT (3.7) 0 0 co2 H2 a 81
101 Under constant H 2 partial pressure, R 0 is correlated with CO 2 partial pressure: n R0 kp co 2 (3.8) where n is the reaction order. The above equation can be used to determine the reaction order in the following format: ln R0 ln k nln P co 2 (3.9) 82
102 4 Gasification of Metallurgical Coke in CO 2 -CO-N 2 with and without H Introduction In the blast furnace ironmaking process, there is an increasing trend to reduce the consumption of expensive coke by injecting cheaper auxiliary fuels through the tuyeres to replace a portion of coke [2-4]. Due to the relatively low price and abundant reserve of coal in comparison with other fossil fuels, nearly half of blast furnaces in the world use pulverized coal injection [5]. Coke is subjected to significant thermal and mechanical stresses as well as chemical reactions with gases (CO 2, CO, H 2 and H 2 O) in the blast furnace. At low coke rate operations, coke quality becomes more pertinent as less coke is available to perform its roles. Due to the higher pulverized coal injection rate, the H 2 content in modern blast furnaces is significantly higher than before. H 2 not only contributes to the indirect reduction of iron oxides, but also leads to a sharp increase in H 2 O in the blast furnace gases [6]. The reaction of coke with H 2 O was shown to be much faster than that with CO 2 by many researchers, thus accelerating the reaction rate and affecting its strength [6-9]. Additionally, the reaction with H 2 O was found to be primarily confined to the surface of coke lumps, while the reaction with CO 2 penetrated to a greater depth [10]. 83
103 Major reactions relevant to coke in the blast furnace include gasification, graphitization and carburization, etc. Among all the reactions, gasification has drawn the most attention due to its significant impact on coke degradation and fines generation in the blast furnace [11]. A better understanding of coke gasification and its impact on coke degradation is of great importance for the success of modern blast furnace operations. Moreover, kinetic analysis is crucial to understanding the behaviour and mechanism of the gasification reaction. The reaction kinetics of coke gasification was found to be affected by temperature, pressure, gas composition, and coke properties [6]. Numerous studies have been carried out regarding the effects of gasification on coke strength, pore structure, optical texture as well as fines generation [13-16]. However, previous studies on coke gasification were mainly focused on pure CO 2 and H 2 O atmospheres [6,12,17,18]. The gasification reaction of metallurgical coke in the presence of H 2 has not received wide coverage in the literature, and the role of H 2 in the gasification process is poorly understood. In this chapter, coke gasification experiments were conducted using a thermogravimetric analyzer (TGA) in the temperature range of K, particle size of μm, and CO 2 content of 5-20 vol% in CO 2 -CO-N 2 and CO 2 -CO-H 2 -N 2 gas mixtures. The temperatures and gas compositions were selected to simulate coke degradation conditions in the blast furnace between the thermal reserve zone and the active coke zone. The higher CO 2 content used in the experiments than the lower 84
104 regions of a blast furnace was to achieve enough gasification extent comparable to that in the blast furnace. The aims of the chapter were to determine: (1) the effects of temperature, CO 2 content and particle size on coke gasification kinetics; (2) the influence of H 2 on coke gasification; and (3) the mechanism of H 2 affecting the gasification reaction. 4.2 Materials and methods Materials Coke A was used in the experiments described in this chapter. The coke particles were prepared by crushing the coke lumps and sieving them into different particle size ranges between 200 and 2000 μm. The proximate and ultimate analyses are provided in Table 4.1. Table 4.1 Proximate and ultimate analyses of coke A. Proximate analysis (wt%, ad) Ultimate analysis (wt%, daf) Moisture Volatile matter Ash Fixed carbon C H N S O d ad: air dry; daf: dry ash-free; d: by difference Experimental setup and procedure 85
105 The gasification experiments in this chapter were carried out on a purpose-built TGA system illustrated in Figure 4.1. In each experiment, 0.10±0.01 g of coke particles were put in a silicon carbide crucible (10 mm-id) suspended from an electronic balance and placed into an alumina tube reactor (26 mm-id) in a graphite furnace. Prior to heating, the reactor was evacuated and purged with N 2. Then, the samples were heated in a pure N 2 atmosphere to the target temperature at a heating rate of 10 K/min. After the temperature stabilized, N 2 was replaced by the reactant gas mixture (CO 2 -CO-N 2 or CO 2 -CO-H 2 -N 2 ) at a total flow rate of 2 L/min. The gasification continued at atmospheric pressure for 120 min unless the samples were fully gasified in a shorter time, after which the samples were cooled to ambient temperature in pure N 2. Sample mass was automatically recorded at 1 s intervals. The temperature range used in the chapter was from 1173 to 1873 K. The coke particle size ranges tested were , , and μm. The compositions of the gas mixtures are presented in Table 4.2. Figure 4.1 Schematic of the experimental setup. 86
106 Table 4.2 Compositions of the reactant gas mixtures (vol%). Reactant gas mixture CO 2 CO H 2 N CO 2 -CO-N CO 2 -CO-H 2 -N Data analysis The time N 2 is replaced by the reactant gas mixture is set as the beginning time of gasification. The carbon conversion is defined as [18]: X m m m 0 t 100% (4.1) c0 where m 0 and m c0 are the mass of the sample after being heated to the reaction temperature (g) and the corresponding mass of carbon in the sample at the beginning of gasification (g), and m t is the mass of the sample at a particular reaction time (g). The volatile matter was lost while the sample was heated to the reaction temperatures, so was not counted in the above masses. 87
107 The initial rate of gasification R 0 (s -1 ), defined as the change rate of carbon conversion with time (dx/dt), is determined from a linear correlation of X and t within the initial period up to 5% carbon conversion. R 0 is correlated with the gas compositions as follows [149]: R0 kf ( P, P ) (4.2) co2 H2 where k is the reaction rate constant (s -1 ), and f(p CO2, P H2 ) is a function of the partial pressures of CO 2 and H 2. The reaction rate constant depends on the temperature according to the Arrhenius equation [150]: k k e Ea / RT 0 (4.3) where k 0 is the pre-exponential factor (s -1 ), E a is the activation energy (J/mol), R is the universal gas constant (J/(mol K)), and T is the reaction temperature (K). Then R 0 can be expressed as: R k e f P P (4.4) E a / RT 0 0 ( co, ) 2 H2 The apparent activation energy of the reaction can be determined by the correlation between the initial reaction rate and temperature under constant partial pressures of CO 2 and H 2 by taking the natural logarithm of Equation (4.4): ln R ln[ k f ( P, P )] E / RT (4.5) 0 0 co2 H2 a Under constant H 2 partial pressure, R 0 is correlated with CO 2 partial pressure: n R0 kp co 2 (4.6) 88
108 X (%) where n is the reaction order. The above equation can be used to determine the reaction order in the following format: ln R0 ln k nln P co 2 (4.7) 4.3 Results and discussion Effects of temperature on coke gasification with and without H 2 Figure 4.2 and Figure 4.3 present the variations of carbon conversion with time during coke gasification at different temperatures in CO 2 -CO-N 2 and CO 2 -CO-H 2 -N 2 gas mixtures. It is shown that the carbon conversion within the same reaction time increased with temperature in both gas atmospheres K 1273 K 1373 K 1473 K 1573 K 1673 K 1773 K 1873 K Time (s) Figure 4.2 Carbon conversion vs time for coke gasification at different temperatures in CO 2 -CO-N 2 gas mixture. 89
109 X (%) K 1273 K 1373 K 1473 K 1573 K 1673 K 1773 K 1873 K Time (s) Figure 4.3 Carbon conversion vs time for coke gasification at different temperatures in CO 2 -CO-H 2 -N 2 gas mixture. As shown in Table 4.3, the initial rate of gasification also increased with temperature. From 1173 to 1873 K, the initial rate of gasification increased by approximately 390 times for gasification in CO 2 -CO-N 2 but only 35 times for gasification in CO 2 -CO-H 2 - N 2. It clearly demonstrates that temperature had a greater effect on the gasification of coke without H 2 than that with H 2. The reaction rate in the presence of H 2 was higher than that without H 2 at lower temperatures. The reaction rate with H 2 in the gas mixture was 11.2 and 8.90 times higher than without H 2 at 1173 and 1273 K. At higher temperatures, the effect of H 2 on coke gasification diminished. The effect became negligible when temperature was over 1573 K. This is attributed to the diffusion resistance which plays a major role at higher temperatures. It is consistent with previous findings that diffusion resistance becomes the dominant factor controlling the 90
110 gasification rate at high temperatures [107, ]. Table 4.3 Effect of temperature on the initial rate of gasification in gas mixtures with and without H 2. Temperature (K) R 0 (s -1 ) CO 2 -CO-N 2 CO 2 -CO-H 2 -N 2 Ratio Figure 4.4 shows the Arrhenius plots for coke gasification reactions in CO 2 -CO-N 2 and CO 2 -CO-H 2 -N 2 gas mixtures. For both gas mixtures, there was a clear change in the slope of the Arrhenius plot, showing a transition of the reaction rate controlling step, that is, from chemical reaction controlled regime at low temperatures (Zone I) to diffusion controlled regime at high temperatures (Zone II). There was not an obvious transition zone representing a mixed controlled regime between the two zones in comparison with the three zones of gas-carbon reactions presented in the literature [154]. This might be attributed to the big temperature intervals (100 K) used in this study. 91
111 Based on the intersection of the regression lines, the transition temperature between the two temperature zones was 1467 K for gasification without H 2 and 1364 K for that with H 2. The lower transition temperature for the reaction in H 2 -containing gas mixture than in H 2 -free gas mixture is attributed to the fact that reaction was faster with H 2 than that without H Zone II CO 2 -CO-H 2 -N 2 Zone I lnr Zone II Zone I CO 2 -CO-N /T (K -1 ) Figure 4.4 Arrhenius plots for coke gasification in CO 2 -CO-N 2 and CO 2 -CO-H 2 -N 2 gas mixtures. After linear regression of the Arrhenius plot separately within two zones, the apparent activation energy was obtained using Equation (4.5). For gasification in CO 2 -CO-N 2 gas mixture, the apparent activation energy was and 55.4 kj/mol in Zone I and Zone II, respectively. The former was close to the true activation energy of the intrinsic reaction, while the latter was only about 20% of the true activation energy. For gasification in CO 2 -CO-H 2 -N 2 gas mixture, the apparent activation energy decreased to 92
112 176.4 kj/mol in Zone I and 40.9 kj/mol in Zone II, respectively, both being smaller than the corresponding values in CO 2 -CO-N 2 mixture. The addition of H 2 into the system reduced the activation energy of the intrinsic reaction in Zone I. Applying the Chapman- Enskog equation and the mixing rule of gas diffusion in multicomponent mixture [155], it can be estimated that the addition of 10-vol% H 2 in the gas mixture increases the CO 2 diffusivity by 9% in Zone II. The activation energy of coke gasification reported in the literature varies widely in the range from 120 to 270 kj/mol in Zone I [ ]. It is associated with the physical and chemical properties of the materials and the experimental conditions [111]. In general, the activation energy obtained in this study is within the range in the literature Effects of CO 2 content on coke gasification with and without H 2 Figure 4.5 and Figure 4.6 present the variations of carbon conversion with time during coke gasification in CO 2 -CO-N 2 and CO 2 -CO-H 2 -N 2 mixtures with different CO 2 contents. The initial rates of gasification are presented in Table 4.4. In both gas atmospheres, the initial rate of gasification and the carbon conversion at the same reaction time increased with increasing CO 2 content. The initial gasification rate in CO 2 -CO-H 2 -N 2 was significantly higher than that in CO 2 -CO-N 2 at 1273 and 1473 K, while the difference was negligible at 1673 K. This is consistent with the results from Section which reflected the negligible effect of H 2 at temperatures over 1573 K. 93
113 X (%) X (%) K 5% 1273 K 10% 1273 K 15% 1273 K 20% 1473 K 5% 1473 K 10% 1473 K 15% 1473 K 20% 1673 K 5% 1673 K 10% 1673 K 15% 1673 K 20% Time (s) Figure 4.5 Carbon conversion vs time for coke gasification in CO 2 -CO-N 2 gas mixture with different CO 2 contents K 5% 1273 K 10% 1273 K 15% 1273 K 20% 1473 K 5% 1473 K 10% 1473 K 15% 1473 K 20% 1673 K 5% 1673 K 10% 1673 K 15% 1673 K 20% Time (s) Figure 4.6 Carbon conversion vs time for coke gasification in CO 2 -CO-H 2 -N 2 gas mixture with different CO 2 contents. 94
114 Table 4.4 Effect of CO 2 content on the initial rate of gasification in gas mixtures with and without H 2. Temperature (K) CO 2 content (%) R 0 (s -1 ) CO 2 -CO-N 2 CO 2 -CO-H 2 -N According to Equation (4.7), the reaction orders with respect to CO 2 content at different temperatures can be obtained by plotting lnr 0 as a function of lnp CO2 as shown in Figure 4.7 and Figure 4.8, and the results are summarized in Table 4.5. The reaction order with respect to CO 2 content at 1273 K was 0.33 in the gas mixture with H 2 and 0.40 without H 2, respectively. At 1473 and 1673 K, the reaction order became similar 95
115 with and without H 2, both approaching 1 as temperature increased. It indicates that gasification became controlled by the diffusion of CO 2 as temperature increased K 1473 K 1673 K -9 lnr lnp CO2 Figure 4.7 lnr 0 vs lnp CO2 for coke gasification in CO 2 -CO-N 2 gas mixture K 1473 K 1673 K lnr lnp CO2 Figure 4.8 lnr 0 vs lnp CO2 for coke gasification in CO 2 -CO-H 2 -N 2 gas mixture. 96
116 Table 4.5 Reaction orders at different temperatures in gas mixtures with and without H 2. Temperature (K) CO 2 -CO-N 2 CO 2 -CO-H 2 -N 2 n Effects of particle size on coke gasification with and without H 2 Figure 4.9 and Figure 4.10 present the variations of carbon conversion with time during coke gasification with different particle sizes in CO 2 -CO-N 2 and CO 2 -CO-H 2 -N 2 mixtures. The initial rates of gasification are presented in Table 4.6. With other conditions unchanged, the initial rate of gasification and the carbon conversion at the same reaction time decreased with increasing particle size in both gas atmospheres. At 1273 K, the maximum difference in the initial gasification rates between coke particle size ranges of and μm was only 4.26% for gasification without H 2. In comparison, the maximum difference increased to 13.0% at 1473 K and further increased to 27.4% at 1673 K. The variation tendency of the maximum difference for gasification in H 2 -containing gas mixture was similar to that without H 2, also increasing with the increase in temperature. The increasing effect of particle size on gasification rate demonstrates that the internal diffusion played an increasingly important role with 97
117 temperature increase, which is congruous with the finding reported by Kajitani et al. [107]. Table 4.6 Effect of particle size on the initial rate of gasification in gas mixtures with and without H 2. R 0 (s -1 ) Temperature (K) Particle size (μm) CO 2 -CO-N 2 Max difference (%) CO 2 -CO- H 2 -N 2 Max difference (%)
118 X (%) X (%) 1173 K K K K K K K K K Time (s) Figure 4.9 Carbon conversion vs time for gasification of coke with different particle sizes (μm) in CO 2 -CO-N 2 gas mixture K K K K K K K K K Time (s) Figure 4.10 Carbon conversion vs time for gasification of coke with different particle sizes (μm) in CO 2 -CO-H 2 -N 2 gas mixture. 99
119 4.3.4 Role of H 2 in coke gasification The carbon conversion and initial rate of gasification were higher in CO 2 -CO-H 2 -N 2 in comparison with those in CO 2 -CO-N 2, which is due to the involvement of H 2 in coke gasification via the following reactions: CO H CO H O (4.8) 2( g) 2( g) ( g) 2 ( g) C H O CO H (4.9) ( s) 2 ( g) ( g) 2( g) The water-gas shift reaction (Reaction (4.8)) forms water vapor which then reacts with coke to regenerate H 2 (Reaction (4.9)). The gasification rate of coke with H 2 O was shown to be much faster than that with CO 2 [6-9]. The equilibrium content of H 2 O in CO 2 -CO-H 2 -N 2 gas mixture at different temperatures is shown in Figure A significant amount of H 2 O can be formed in all of the H 2 -containing gas mixtures over the temperature range used in the study. As shown in Figure 4.11, the equilibrium H 2 O content in the gas phase increased with temperature. However, the enhancement of H 2 on gasification diminished with temperature increase and became negligible above 1573 K (Table 4.3), because the diffusion of CO 2 and H 2 O in the gas phase towards the reaction interface became the controlling step. According to Figure 4.4, even though the transition temperature between the two zones decreased due to the presence of H 2 in the gas mixture, the corresponding gasification rates at the transition temperatures were close. This means that the effect of H 2 addition in the gas mixture mainly lies in 100
120 H 2 O content (%) accelerating the chemical reaction rather than the diffusion of CO 2 and H 2 O in the gas phase, which is associated with the relatively low content of H 2 and high content of CO used in the study % CO 2 10% CO 2 15% CO 2 20% CO Temperature (K) Figure 4.11 Change in equilibrium content of H 2 O in CO 2 -CO-H 2 -N 2 gas mixture at different temperatures. 4.4 Conclusions In this chapter, the gasification kinetics of a metallurgical coke was studied using a TGA at different temperatures, particle sizes and CO 2 contents in CO 2 -CO-N 2 gas mixtures with and without H 2. Based on the results and discussion, the following conclusions are drawn: (1) The results from coke gasification at different temperatures, particle sizes and CO 2 contents show that the reaction rate of coke gasification increased with increasing 101
121 temperature, decreasing particle size and increasing CO 2 content. (2) The results from coke gasification at different temperatures show that the gasification reaction in the presence of H 2 was faster than that without H 2 at lower temperatures. As temperature increased, the effect of H 2 diminished, and became negligible at temperatures above 1573 K. (3) The Arrhenius plots for coke gasification reactions in CO 2 -CO-N 2 and CO 2 -CO-H 2 - N 2 gas mixtures show that the reaction transitioned from chemical reaction controlled regime to diffusion controlled regime at 1467 K for gasification in CO 2 - CO-N 2 while at 1364 K for that in CO 2 -CO-H 2 -N 2, indicating that diffusion became the controlling step at a lower temperature in the H 2 -containing gas mixture. (4) For gasification in CO 2 -CO-N 2 gas mixture, the apparent activation energy was and 55.4 kj/mol in Zone I and Zone II, respectively. For gasification in CO 2 - CO-H 2 -N 2 gas mixture, the apparent activation energy decreased to kj/mol in Zone I and 40.9 kj/mol in Zone II, respectively, both being smaller than the corresponding values in CO 2 -CO-N 2 mixture. It indicates that the addition of H 2 into the system reduced the apparent activation energy of the gasification reaction. (5) According to the results from the gasification of coke with different particle sizes and CO 2 contents, the diffusion control of CO 2 at higher temperatures was also demonstrated by the decreasing gasification rate with increasing particles size and 102
122 the reaction order approaching 1 as temperature increased. 103
123 5 Gasification of Different Cokes with and without H 2 Relating Reactivity to Coke Properties 5.1 Introduction The reaction rate of coke gasification under certain conditions (e.g., temperature, pressure, and gas composition) is reported as the reactivity of coke [19]. Reactivity is one of the most important parameters used to evaluate the performance of coke in the blast furnace. The reactivity of coke is controlled by the coal properties impacting the product coke and the coking conditions, but is most directly determined by the coke properties. Therefore, a better understanding of the coke properties affecting its reactivity is of great importance. Ash content and composition have been considered as important factors in determining coke reactivity [17,120]. The ash content from the proximate analysis of coke was found to be a good indicator of coke reactivity by Vogt et al. [119]. But the impact of ash content on coke reaction rate was shown to be small in a study reported by Duval et al. [27]. The roles of coke ash in the gasification reaction are complex. Some ash minerals catalyze the gasification. However, the reaction may be hindered by molten ash, which covers the surface and blocks the pores at high temperatures. The actual impact of mineral matter is dependent on gasification temperature, gas composition and 104
124 the properties of the mineral matter such as content, composition, size, and distribution through the coke matrix [156]. In addition, the reactivity of coke has also been considered to be affected by other properties such as carbon structure, pore surface area and microtexture [15]. Crystallite size has been widely used in the investigations on the carbon structure of coke. A larger crystallite size indicates a greater degree of graphitization and a higher ordering of carbon structure [26]. X-ray diffraction (XRD) studies by Xing et al. [81] indicated that the crystallite size of coke increased with increasing annealing temperature from 1673 to 2273 K. As reported by Gupta et al. [4], the degree of graphitization showed an inverse correlation with the apparent reactivity of coke. The reactivity of coke was found to increase as surface area increased according to Vogt et al. [157]. The reactivities of different microtextures of coke are dissimilar, which is explained by their difference in the ordering of carbon structure, the pore surface area, and the content of catalytic minerals according to Huang et al. [146]. Different models have been developed to predict coke reactivity [20-22]. Most of these prediction models are based on coal properties such as vitrinite reflectance, inertinite content and alkali index. Correlation models of coke reactivity based on coke properties are rarely seen in the literature. In this chapter, gasification experiments of five cokes were conducted using a thermogravimetric analyzer (TGA) at 1273 and 1673 K in CO 2 -CO-N 2 gas mixtures 105
125 with and without H 2. Properties including ash content, catalytic index, surface area and crystallite size were measured and correlated with reactivity. The aims of the chapter were to determine: (1) the reactivities of five different cokes at different temperatures with and without H 2 ; (2) the effects of coke properties including ash content, catalytic index, surface area and crystallite size on coke reactivity. 5.2 Materials and methods Materials Five metallurgical coke samples (Coke A, B, C, D and E) were used in the experiments described in this chapter. The samples received in the form of lumps were crushed and sieved into a particle size range of 500 to 1000 μm for experiments. The proximate and ultimate analyses of the five coke samples are provided in Table 5.1. Their ash analyses are provided in Table
126 Table 5.1 Proximate and ultimate analyses of the five cokes. Coke Proximate analysis (wt%, ad) Ultimate analysis (wt%, daf) Moisture Volatile matter Ash Fixed carbon C H N S O d A B C D E ad: air dry; daf: dry ash-free; d: by difference. Table 5.2 Ash analyses of the five cokes (wt%). Coke A B C D E SiO Al 2 O Fe 2 O CaO MgO Na 2 O K 2 O TiO Mn 3 O P 2 O
127 SO BaO SrO ZnO V 2 O Gasification procedure The gasification experiments in this chapter were carried out on a purpose-built TGA system illustrated in Figure 5.1. In each experiment, 0.10±0.01 g of coke particles were placed in a silicon carbide crucible (10 mm-id) suspended from an electronic balance and placed into an alumina tube reactor (26 mm-id) in a graphite furnace. The reactor was evacuated and purged with N 2 prior to heating. Subsequently, the samples were heated in a pure N 2 atmosphere to the target temperature at a heating rate of 10 K/min. After the temperature stabilized, N 2 was replaced by the reactant gas mixture (CO 2 -CO- N 2 or CO 2 -CO-H 2 -N 2 ) at a total flow rate of 2 L/min. The gasification continued at atmospheric pressure for 120 min unless the samples were fully gasified in a shorter time, after which the samples were cooled to ambient temperature in pure N 2. Sample mass was automatically recorded at 1 s intervals. The reaction temperatures used in the chapter were 1273 and 1673 K. The composition of the CO 2 -CO-N 2 mixture was 10- vol% CO 2, 40-vol% CO, and 50-vol% N 2. The composition of the CO 2 -CO-H 2 -N 2 mixture was 10-vol% CO 2, 40-vol% CO, 10-vol% H 2, and 40-vol% N

128 Figure 5.1 Schematic of the experimental setup Reactivity As the time N 2 is replaced by the reactant gas mixture is set as the beginning time of gasification. The carbon conversion is defined as [18]: X m m m 0 t 100% (5.1) c0 where m 0 and m c0 are the mass of the sample after being heated to the reaction temperature (g) and the corresponding mass of carbon in the sample at the beginning of gasification (g), and m t is the mass of the sample at a particular reaction time (g). The volatile matter was lost while the sample was heated to the reaction temperatures, so was not counted in the above masses. 109
129 The initial rate of gasification R 0 (s -1 ), defined as the change rate of carbon conversion with time (dx/dt), was determined from a linear correlation of X and t within the initial period up to 5% carbon conversion Catalytic index, surface area and crystallite size Iron, calcium, potassium and sodium oxides are known to act as catalysts in the gasification process [121]. Based on the ash compositions of the coke samples presented in Table 5.2, a catalytic index, defined as the content of catalytic minerals in the coke ash, can be calculated using Equation (5.2) (wt%): CI = [Fe 2 O 3 ]+[CaO]+[K 2 O]+[Na 2 O] (5.2) The Brunauer-Emmett-Teller (BET) surface area of the coke samples was determined from gas adsorption isotherms using N 2 as adsorptive with a Micromeritics TriStar 3020 Analyzer. The coke samples were milled and analyzed by a GBC-MMA X-ray diffractometer with a Cu-Kα radiation (35 kv, 28.5 ma) as the X-ray source. Samples were scanned with 2θ in the range of 10 to 50 at a scanning rate of 1 /min. The shape of the (002) carbon peak of the XRD spectrum can be used as an indication of the crystallite size. The crystallite size, L c, was calculated using the Scherrer s equation [51,87-89] on the (002) carbon peak of the obtained XRD spectra: 110
130 L c 0.89 cos (5.3) where λ is the wavelength of the X-ray source ( Å for Cu-Kα radiation), β is the full width at half maximum intensity of the (002) peak, and θ is the corresponding Bragg angle. 5.3 Results and discussion Reactivities of different cokes Figure 5.2 and Figure 5.3 present the variations of carbon conversion with time during gasification of different cokes at 1273 and 1673 K in CO 2 -CO-N 2 and CO 2 -CO-H 2 -N 2 gas mixtures. It can be seen that different cokes showed different reactivities in the gasification reaction. The carbon conversion during coke gasification with H 2 in the gas mixture was significantly higher than that without H 2 at 1273 K for all the cokes. At 1673 K, the carbon conversion in H 2 -containing gases was still higher than in H 2 -free gases, but the difference was not pronounced. 111
131 X (%) X (%) 50 A CO 2 -CO-H 2 -N 2 B CO 2 -CO-H 2 -N 2 40 C CO 2 -CO-H 2 -N 2 D CO 2 -CO-H 2 -N 2 30 E CO 2 -CO-H 2 -N 2 A CO 2 -CO-N 2 B CO 2 -CO-N 2 20 C CO 2 -CO-N 2 D CO 2 -CO-N 2 E CO 2 -CO-N Time (s) Figure 5.2 Carbon conversion vs time for gasification of different cokes at 1273 K A CO 2 -CO-H 2 -N 2 B CO 2 -CO-H 2 -N 2 C CO 2 -CO-H 2 -N 2 D CO 2 -CO-H 2 -N 2 E CO 2 -CO-H 2 -N 2 A CO 2 -CO-N 2 B CO 2 -CO-N 2 C CO 2 -CO-N 2 D CO 2 -CO-N 2 E CO 2 -CO-N Time (s) Figure 5.3 Carbon conversion vs time for gasification of different cokes at 1673 K. The initial gasification rate of different cokes at 1273 and 1673 K in gas mixtures with and without H 2 was calculated and the results are summarized in Table 5.3. The sequence of reactivity of these five cokes was: D > B ~ C > E > A. The reaction rate in the presence of H 2 was significantly higher than that without H 2 at 1273 K. The ratio of 112
132 the reaction rate with H 2 to without H 2 in the gas mixture was in the range of 8.75 to 8.93 for different cokes. Although the presence of H 2 in the gas mixture significantly promoted the reaction rates of all the cokes, the relative reactivity (sequence of reactivity) of these cokes was not changed. The enhancing effect of H 2 on the reaction rate is due to the involvement of H 2 through the following reactions: CO H CO H O (5.4) 2( g) 2( g) ( g) 2 ( g) C H O CO H (5.5) ( s) 2 ( g) ( g) 2( g) The water-gas shift reaction (Reaction (5.4)) forms water vapor which then reacts with coke to regenerate H 2 (Reaction (5.5)). The gasification rate of coke with H 2 O was shown to be much faster than that with CO 2 [6-9]. Table 5.3 Initial gasification rate of the five cokes at 1273 and 1673 K in gas mixtures with and without H 2 (s -1 ). Coke 1273 K 1673 K Ratio CO 2 -CO-N 2 CO 2 -CO-H 2 -N 2 CO 2 -CO-N 2 CO 2 -CO-H 2 -N 2 Ratio A B C D E
133 At 1673 K, the reaction rates with H 2 and without H 2 in the gas mixtures were similar, indicating that the effect of H 2 on coke gasification was negligible at 1673 K. This is due to the diffusion resistance that plays a major role at higher temperatures. It is congruous with others findings that diffusion resistance becomes the dominant factor controlling the gasification rate at high temperatures [107, ] Coke properties affecting reactivity The XRD spectra with profiles of the (002) carbon peaks of Coke A, B, C, D and E are illustrated in Figure 5.4. The peaks at 20.8 and 26.6 o were assigned to quartz in the coke ash. The peaks of quartz in Figure 5.4 were obvious for all the cokes except Coke C. According to the ash analyses of these cokes (Table 5.2), the Si content (51.5 wt%) in the ash of Coke C was not significantly lower than the other cokes. However, the Al content (38.5 wt%) in the ash of Coke C was higher than the other cokes. It can be inferred that Si in the ash of Coke C was predominantly present as amorphous aluminosilicates (most likely meta-kaolinite) rather than quartz [158]. This explains why the quartz peaks in the XRD spectrum of Coke C were significantly weaker in comparison with the other cokes. The crystallite size of different cokes in the study was calculated by Equation (5.3) and the results are presented in Table 5.4. The sequence of crystallite size of these cokes was: A > B > D > C > E. Coke A with the largest crystallite size had the lowest reactivity. However, Coke E with the smallest crystallite size had the second lowest reactivity. 114
134 Intensity E D C B A Figure 5.4 XRD spectra of different cokes. Table 5.4 Catalytic index, surface area and crystallite size of the five cokes. Coke Catalytic index Surface area (m 2 /g) Crystalline size (Å) A B C D E The catalytic index of different cokes in the study was obtained from Table 5.2 using Equation (5.2) and the results are summarized in Table 5.4. The sequence of catalytic index of these cokes was: D > E > A > B > C. The results of BET surface area of these cokes are also presented in Table 5.4. The sequence of surface area of these cokes was: D > B > E > C > A. The surface area of Coke A was only m 2 /g, which was obviously smaller than the other cokes. Correspondingly, the reactivity of Coke A was 115
135 the lowest among these cokes. But the difference between Coke A and the other cokes in reactivity was much less significant than that in surface area. This means that the reactivity of the cokes was affected by multiple factors Correlation of coke reactivity with coke properties An attempt was made to correlate the results of the initial gasification rate in Table 5.3 with ash content, catalytic index, surface area and crystallite size in Table 5.2 and 5.4. The initial gasification rate at 1273 K in gas mixtures with and without H 2 is the chemical reaction rate according to the Arrhenius plots presented in Chapter 4. So it can be used to represent the reactivity of the cokes because it excludes the influence of diffusion. The crystallite size grows with increasing temperature when coke descends through the furnace. But the increase in crystallite size proves to be marginal at temperatures below 1673 K [81]. Ash content and catalytic index were used to represent the influence of mineral matter on coke reactivity as minerals in the coke can physically affect its reactivity by covering the coke surfaces and pore walls, and catalytic minerals (Fe, Ca, K and Na) were active at high temperatures and exert catalytic effects on coke reactivity [26]. Thus, the correlation of coke reactivity in CO 2 -CO-N 2 gas mixture with ash content, catalytic index, surface area and crystallite size is presented in Figure 5.5 by empirical Equation (5.6): R 0 = 21.0 S 0.04 L c exp[-7.70a(1-ci)] (5.6) where A and CI represent ash content and catalytic index, S is surface area, and L c is crystallite size. It shows a good correlation with a correlation coefficient (R 2 ) of
136 Initial gasification rate (10-6 s -1 ) The correlation of coke reactivity in CO 2 -CO-H 2 -N 2 gas mixture with ash content, catalytic index, surface area and crystallite size is presented in Figure 5.6 by empirical Equation (5.7): R 0 = 23.3 S 0.03 L c exp[-7.84a(1-ci)] (5.7) It also shows a good correlation with a correlation coefficient (R 2 ) of *S 0.04 *L c *exp[-7.70*a*(1-ci)] R 2 = Figure 5.5 Correlation of initial gasification rate at 1273 K in CO 2 -CO-N 2 gas mixture with surface area (S), crystallite size (L c ), ash content (A) and catalytic index (CI). 117
137 Initial gasification rate (10-5 s -1 ) *S 0.03 *L c *exp[-7.84*a*(1-ci)] R 2 = Figure 5.6 Correlation of initial gasification rate at 1273 K in CO 2 -CO-H 2 -N 2 gas mixture with surface area (S), crystallite size (L c ), ash content (A) and catalytic index (CI). According to Equation (5.6) and Equation (5.7), reactivity was positively affected by catalytic index and inversely affected by ash content. This might be attributed to the fact that an increase in the content of catalytic minerals in coke ash leads to a stronger catalytic influence on coke gasification and an increase in ash content can reduce the active surface available for gas-solid reactions [26,36]. The effect of crystallite size on reactivity appeared to be inverse according to Equation (5.6) and Equation (5.7). This is because a larger crystallite size means a higher ordering of carbon structure which is more stable with regard to CO 2 reaction. It consists with the findings in the literature that the relationship between the ordering of carbon structure and reactivity is reciprocal [4]. In comparison with ash content and catalytic index, the effect of crystallite size is relatively small. The small influence of crystallite size of the 118
138 raw cokes on the initial reaction rate was also reported by Grigore [96] who claimed that the influence of crystallite size was overshadowed by other factors. Theoretically, larger coke surface area provides more reaction sites for the chemical reaction of carbon with CO 2, thus promotes the gasification rate. However, the effect of surface area was shown to be marginal in this study. When other factors remain the same, a significant increase in surface area from m 2 /g (Coke A) to m 2 /g (Coke D) only increases the reaction rate by 12.5% (Equation (5.6)) and 9.3% (Equation (5.7)). This is congruous with others conclusions that surface area does not indicate the reactivity when catalytic minerals are presented [159,160]. Grigore [96] also found that pore surface area only slightly affected the reaction rate at the initial stage, but the effect became stronger at higher conversion levels. Figure 5.7 gives an example of the selective reaction on the carbon sites associated with catalytic minerals, which was found to be general for the sample. The catalytic effect of minerals on this site was only related to the iron sulphate or sulphide in the upper middle part, while the alumino-silicate grain in the lower left part did not react. It indicates that the reaction does not take place uniformly on the coke surface but preferentially occurs on locations associated with catalytic minerals which have a heterogeneous distribution through the coke matrix. The marginal effect of surface area can be explained by the predominant influence of mineral matter at the initial stage of reaction when there is a good contact between carbon matrix and catalysts. 119
139 (a) (b) Figure 5.7 Secondary electron images of (a) the unreacted coke surface and (b) the reacted coke surface from Chapter 6. Ignoring the effect of surface area, the correlations of coke reactivity in CO 2 -CO-N 2 and CO 2 -CO-H 2 -N 2 mixtures with ash content, catalytic index and crystallite size are presented in Figure 5.8 and Figure 5.9 by empirical Equation (5.8) and Equation (5.9), respectively: R 0 = 49.9 L c exp[-9.48a(1-ci)] (5.8) R 0 = 43.4 L c exp[-9.12a(1-ci)] (5.9) Figure 5.8 and Figure 5.9 show that coke reactivity was well correlated with ash content, catalytic index and crystallite size following Equation (5.8) (R 2 = ) and Equation (5.9) (R 2 = ). It further confirms that surface area only had a marginal effect on the reactivity of the cokes. 120
140 Initial gasification rate (10-6 s -1 ) In summary, the effect of surface area on coke reactivity was marginal in this study. Although crystallite size affected reactivity, the reaction rate at the initial stage was more predominantly influenced by the mineral matter. Therefore, the influence of surface area and crystallite size was overshadowed by the impact of ash content and catalytic index at the initial stage of reaction *L c *exp[-9.48*a*(1-ci)] R 2 = Figure 5.8 Correlation of initial gasification rate at 1273 K in CO 2 -CO-N 2 gas mixture with crystallite size (L c ), ash content (A) and catalytic index (CI). 121
141 Initial gasification rate (10-5 s -1 ) *L c *exp[-9.12*a*(1-ci)] R 2 = Figure 5.9 Correlation of initial gasification rate at 1273 K in CO 2 -CO-H 2 -N 2 gas mixture with crystallite size (L c ), ash content (A) and catalytic index (CI). 5.4 Conclusions In this chapter, the gasification reactions of five cokes were investigated using a TGA at 1273 and 1673 K in CO 2 -CO-N 2 gas mixtures with and without H 2. Coke properties including ash content, catalytic index, surface area and crystallite size were measured and correlated with reactivity. Based on the results and discussion, the following conclusions are drawn: (1) The results from the gasification of different cokes show that the five cokes exhibited different reactivities in the gasification reactions. The sequence of their reactivities was: D > B ~ C > E > A. (2) The results from the gasification of different cokes show that the gasification 122
142 reaction in the presence of H 2 was faster than that without H 2 at 1273 K for all the cokes. However, the relative reactivity of these cokes was not changed. The enhancing effect of H 2 was negligible at 1673 K for all the cokes, which is due to the diffusion resistance that plays a major role at higher temperatures. (3) The correlations of the initial gasification rate at 1273 K in CO 2 -CO-N 2 and CO 2 - CO-H 2 -N 2 gas mixtures with the coke properties indicate that the coke reactivity correlated well with ash content, catalytic index and crystallite size. (4) The correlation equations indicate that the reactivity was positively affected by catalytic index and inversely affected by ash content. Crystallite size showed an inverse effect on coke reactivity. But the effect was relatively small in this study since it was overshadowed by the influence of ash content and catalytic index at the initial stage of reaction. (5) The effect of surface area on coke reactivity was marginal, which is because the reaction did not take place uniformly on the coke surface but preferentially occurred on the sites associated with catalytic minerals. 123
143 6 Influence of Gasification on Coke Microtexture and Minerals 6.1 Introduction Due to the strong impact of the carbon-based components (microtexture) on coke strength and reactivity, the degradation of coke in the blast furnace is highly related to the modification of its microtexture caused by gasification and exposure to high temperatures. Thus, a great interest has been paid to the microtexture of coke by many researchers who have developed their own terminology and classification schemes in their studies [27,28,71,74]. Generally, coke microtexture can be divided into two components, i.e., the inert maceral-derived component (IMDC) and the reactive maceral-derived component (RMDC). IMDC is formed from infusible macerals and RMDC is from fusible macerals during carbonization [71,102]. IMDC and RMDC have been found to behave differently in terms of strength, reactivity, and graphitization [26]. IMDC is often regarded to be more reactive than RMDC in many references [27,28]. However, RMDC was found to react more easily with CO 2 than IMDC in the blast furnace due to the catalytic effect of alkalis in a recent study [29]. Due to the close relationship between coke carbon and mineral matter, coke minerals could affect the strength and reactivity of coke in many ways such as the formation of 124
144 cracks and weak spots in the coke matrix and the catalyzing reactions by catalytic mineral phases [30-34]. Additionally, the blast furnace environment such as high temperatures and recirculating alkalis could also affect coke gasification and thus its degradation. Therefore, it is crucial to gain a better understanding of the coke minerals and their interactions with coke carbon matrix under blast furnace conditions. Current understandings of the mineral matter in coke are largely based on the oxide analysis of the coke ash, which has not taken into account the fact that coke minerals are present in various sizes, distributions, and associations within the carbon matrix [35]. The X-ray diffraction (XRD) can only identify crystalline phases. However, more than 60% of the inorganic matter of the original cokes is present in glassy or amorphous phases [11]. Microscopic approaches have also been applied to the investigations of coke microtexture and minerals [11,35-37]. However, previous microscopic analyses on the changes in coke microtexture and minerals were mainly conducted by observing different areas of different samples before and after reactions, which are difficult to interpret due to the heterogeneous nature of cokes. In this chapter, the microtexture and minerals of coke were investigated using scanning electron microscopy/energy dispersive spectroscopy (SEM/EDS) by analyzing exactly the same sites of coke surface before and after reactions. The aims of the chapter were to determine: (1) the influence of gasification on coke microtexture (IMDC and RMDC); (2) the influence of gasification on the transformations of coke minerals; (3) the 125
145 interactions between coke minerals and carbon matrix during the reaction. 6.2 Materials and methods Materials Coke A was used in the experiments described in this chapter. The cylindrical coke pellets were prepared by drilling cores from the coke lumps and facing the cylindrical ends. The pellet size was 8-mm diameter by 10-mm height. The proximate and ultimate analyses are provided in Table 6.1. The ash analysis is provided in Table 6.2. Table 6.1 Proximate and ultimate analyses of coke A. Proximate analysis (wt%, ad) Ultimate analysis (wt%, daf) Moisture Volatile matter Ash Fixed carbon C H N S O d ad: air dry; daf: dry ash-free; d: by difference. Table 6.2 Ash analysis of coke A (wt%). SiO 2 Al 2 O 3 Fe 2 O 3 CaO MgO Na 2 O K 2 O TiO Mn 3 O 4 P 2 O 5 SO 3 BaO SrO ZnO V 2 O The top circular surface of the unreacted pellets was polished on a polishing machine (Struers Tegram) before being examined by SEM/EDS. It should be noted that the 126
146 pellets were not mounted by resin because they needed to be reacted in the furnace so that the same sites of the top surface can be examined by SEM/EDS again after reaction and compared with the unreacted ones Experimental setup and procedure As illustrated in Figure 6.1, the coke pellet was put in an alumina reactor inserted into a vertical furnace for gasification reaction. The reactor consists of a gas ducting tube and a sheath. The pellet was located at the bottom of the gas ducting tube on an alumina plinth to support the pellet. A type B thermocouple was inserted through the gas ducting tube with the tip located above the pellet so that the temperature of the top surface of the pellet can be monitored. Prior to heating, the reactor was purged with N 2. Then, the sample was heated in a pure N 2 atmosphere to 1473 K with a heating rate of 10 K/min. After the temperature stabilized, N 2 was replaced by the CO 2 -CO-N 2 gas mixture with a total flow rate of 1 L/min. The gasification was run for 15 min to achieve a reaction extent of about 10%, after which the sample was cooled to ambient temperature in pure N 2. The reaction extent was limited to 10% in order to maintain the basic morphology of the coke surface so that the reacted sample could be compared with the unreacted one. The gas composition used in this chapter was 10-vol% CO 2, 40-vol% CO, and 50-vol% N 2. H 2 was not involved in this chapter since the change trend of microtexture and minerals during the reaction with H 2 in the system did not show an obvious difference to that without H
 mode was used to observe the topography of the carbon matrix, and backscattered electron (BSE) mode was used with EDS to examine the coke minerals and their interactions with")
147 The analyses were conducted by a Leica DMRM optical microscope and a JOEL JSM- 6490LV SEM equipped with an EDS (Accelerating voltage: 15 kv, Spot size: 60 nm). Secondary electron (SE) mode was used to observe the topography of the carbon matrix, and backscattered electron (BSE) mode was used with EDS to examine the coke minerals and their interactions with carbon. Figure 6.1 Schematic of the experimental setup. 6.3 Results and discussion Influence of gasification on coke microtexture According to the analyses on over 30 sites on the coke pellets, most inert maceralderived components (IMDC) were shown to have a greater propensity to react with CO 2 128
148 than reactive maceral-derived components (RMDC), but exceptions existed. Two typical sites, Site 1 and 2, were selected here to demonstrate the two different cases. Figure 6.2 and Figure 6.3 illustrate the optical microscope image and the secondary electron image of the unreacted and reacted coke on Site 1. IMDC was marked as the area within the dotted border line, and the surrounding area was RMDC. The carbon matrix of the unreacted coke was relatively compact with a continuous surface of IMDC and RMDC. Minerals contained within the IMDC grain appeared as discontinuous laminar bodies (originally under depositional control) while the mineral bodies within the RMDC were distributed irregularly. The minerals showed dark in the optical microscope image (Figure 6.2) and grey in the secondary electron image (Figure 6.3). After reaction, as shown in Figure 6.4, the surface was etched to different extents. The depth of penetration of the reaction on IMDC was greater than that on RMDC. After a portion of carbon was reacted, the laminated structure of the minerals within the IMDC body became more pronounced. For the RMDC, the texture of the surface suggests penetration along sub-domain boundaries controlled by the mosaic leaflet size associated with a mosaic size up to 5 μ and the other fine microtextural types incorporated in the fused mass. 129


149 Figure 6.2 Optical microscope image on Site 1 of the unreacted coke. Figure 6.3 SE image on Site 1 of the unreacted coke. 130

150 Figure 6.4 SE image on Site 1 of the reacted coke. Figure 6.5 and Figure 6.6 illustrate the EDS mapping patterns of C, Al and Si of the unreacted and reacted coke on Site 1. The abundance distributions of Al and Si indicate that the mineral phases within the IMDC body were alumino-silicates. The carbon content on this site was reduced from 88.9 wt% before reaction to 77.5 wt% after reaction. As presented in Figure 6.6, a larger proportion of carbon was removed from IMDC than RMDC after reaction, which is consistent with the greater depth of etching on IMDC than RMDC shown in Figure 6.4. The Al and Si within the IMDC body appeared to be more abundant than those before reaction, which might be because that the electron beam interaction volume encompassed a higher proportion of minerals due to the enhanced removal of carbon. 131


. After reaction, the surface became etched (Figure 6.8).")


151 Figure 6.5 EDS patterns of C, Al and Si on Site 1 of the unreacted coke. Figure 6.6 EDS patterns of C, Al and Si on Site 1 of the reacted coke. Figure 6.7 and Figure 6.8 illustrate the secondary electron images of the unreacted and reacted coke on Site 2. Like Site 1, IMDC was marked as the area within the dotted border line. The unreacted coke exhibited a compact surface with a continuous surface of IMDC and RMDC (Figure 6.7). After reaction, the surface became etched (Figure 6.8). Unlike the above-mentioned trend on Site 1, the severities of reaction on IMDC and RMDC were similar. Figure 6.9 and Figure 6.10 illustrate the EDS mapping patterns of C, Al and Si of the unreacted and reacted coke on Site 2. The carbon content on this site was reduced from 84.7 wt% before reaction to 78.5 wt% after reaction. A small portion of carbon was removed from both IMDC and RMDC after reaction. The abundance of Al and Si in the IMDC body did not change significantly before and after 132
152 reaction, which was different from Site 1. Figure 6.7 SE image on Site 2 of the unreacted coke. 133


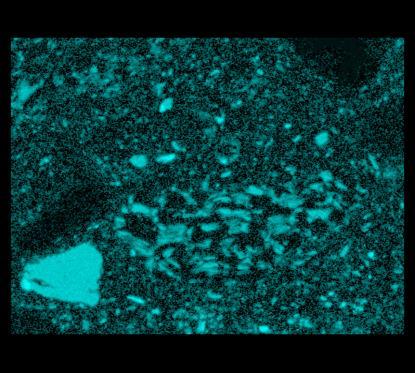
153 Figure 6.8 SE image on Site 2 of the reacted coke. Figure 6.9 EDS patterns of C, Al and Si on Site 2 of the unreacted coke. 134
 gave a high definition to the loci of reaction.")


154 Figure 6.10 EDS patterns of C, Al and Si on Site 2 of the reacted coke. From Figure 6.4 and Figure 6.8, the grain boundaries (mosaic unit boundaries within RMDC, boundaries between carbons and minerals, and generally between IMDC and RMDC) gave a high definition to the loci of reaction. Apart from microtexture, the reactivity of coke carbon is affected by other factors such as carbon orders, minerals and pores. Grigore et al. [28] proposed that the major factors that make the IMDC more reactive than RMDC are the concentration of catalytic iron phases and micropores. In this study, as the IMDC bodies on Site 1 and 2 were similar in terms of minerals and pores, the difference in their reactivity might be attributed to different carbon orders Influence of gasification on coke minerals In this study, the majority of the coke minerals were found to be alumino-silicates. The minerals existed in a wide variety of sizes, distributions and associations. Figure 6.11 illustrates a typical large mineral aggregate surrounded by small fines disseminated within the carbon matrix on Site 3. Figure 6.13 illustrates another mineral aggregate and some fine minerals included in pores on Site 4. Generally, the aggregate and coarse 135
![minerals were composed of alumino-silicates or silica. Silica in the coke was most likely present as trydimite [161]. The fine minerals included in pores were normally metallic iron or iron oxides.](/docs-images/84/89128050/images/155-1.jpg "The physical features of the alumino-silicates and silica in the reacted coke (Figure 6.12 and Figure 6.14) were marginally changed in comparison with the unreacted coke (Figure 6.11 and Figure 6.13).")
155 minerals were composed of alumino-silicates or silica. Silica in the coke was most likely present as trydimite [161]. The fine minerals included in pores were normally metallic iron or iron oxides. The physical features of the alumino-silicates and silica in the reacted coke (Figure 6.12 and Figure 6.14) were marginally changed in comparison with the unreacted coke (Figure 6.11 and Figure 6.13). Figure 6.11 BSE image of an alumino-silicates aggregate on Site 3 of the unreacted coke. 136

156 Figure 6.12 BSE image of an alumino-silicates aggregate on Site 3 of the reacted coke. 137

157 Figure 6.13 BSE image of an alumino-silicates aggregate on Site 4 of the unreacted coke. 138
 and combined with little alkali elements (0.1wt% K and 0.1wt% Na).")
158 Figure 6.14 BSE image of an alumino-silicates aggregate on Site 4 of the reacted coke. The spectra from EDS point analyses presented in Figure 6.11 and Figure 6.13 show that the alumino-silicates on Site 3 and 4 were with low Si/Al ratios (~1) and combined with little alkali elements (0.1wt% K and 0.1wt% Na). This indicates that the aluminosilicates were derived from kaolinite clay in the parent coals. Kaolinite was dehydrated in the coking process to form the amorphous meta-kaolinite [11]. Figure 6.15 and Figure 6.17 illustrate the EDS mapping patterns of Al, Si, Na and K on Site 3 and 4. Although the meta alumino-silicates are regarded as less reactive phases, it can be seen 139
.")


159 that the chemical compositions of them were slightly modified after reaction in terms of their alkali levels (Figure 6.16 and Figure 6.18). K and Na appeared to be mobile and bound with the meta alumino-silicates during the reaction. The alkalization of meta alumino-silicates can also be demonstrated by the spectra from EDS point analyses presented in Figure 6.12 (1.0wt% K and 0.6wt% Na) and Figure 6.14 (2.1wt% K and 0.5wt% Na). Figure 6.15 EDS patterns of Al, Si, Na and K on Site 3 of the unreacted coke. 140


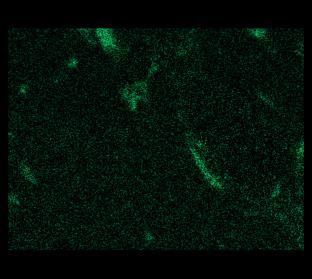
160 Figure 6.16 EDS patterns of Al, Si, Na and K on Site 3 of the reacted coke. Figure 6.17 EDS patterns of Al, Si, Na and K on Site 4 of the unreacted coke. 141
![Figure 6.18 EDS patterns of Al, Si, Na and K on Site 4 of the reacted coke. The alkali reacted phase of silicates in the blast furnace coke has been reported by Kerkkonen [158].](/docs-images/84/89128050/images/161-1.jpg "In the blast furnace, the meta alumino-silicates in the coke react with alkali recirculation in the reducing atmosphere.")

161 Figure 6.18 EDS patterns of Al, Si, Na and K on Site 4 of the reacted coke. The alkali reacted phase of silicates in the blast furnace coke has been reported by Kerkkonen [158]. In the blast furnace, the meta alumino-silicates in the coke react with alkali recirculation in the reducing atmosphere. Then the alkali silicates are gradually dissolved into the slag and removed from the furnace. The Fe-containing phases appeared to be the most active phases in this coke and had strong interactions with the carbon matrix. Fe-containing phases were observed above the IMDC body on Site 2 (Figure 6.7). The EDS spectrum presented in Figure 6.7 suggests that they might be iron sulphate or sulphide. As shown in Figure 6.8, a void was formed after reaction on the carbons associated with the Fe-containing phases as a result of the catalytic carbon-gas reactions. Iron in the forms of sulphate or sulphide was 142
162 reduced to metallic iron dispersed in the void (Figure 6.8). This means that iron played a major role in the reactions. In contrast, the alumino-silicate phase on the left of this site was marginally modified after reaction and showed little interaction with the carbon matrix. Similar trends were found on other sites. As shown in Figure 6.19 and Figure 6.20, a void was observed above the existing pore due to the Fe-containing phases, while the calcium phosphate phase (most likely apatite) on the left of this site was retained after reaction. The Mg and Ca-containing phases reacted with the surrounding aluminosilicates and transformed into a slag silicate globule, while iron in the forms of sulphate or sulphide was reduced to metallic iron dispersed in the void and sulphur was released as vapour (Figure 6.20). As shown in Figure 6.21 and Figure 6.22, a void was also formed after reaction due to the Fe-containing phases while the tridymite on the right of this site was retained. The Mg-containing phases also reacted with alumino-silicates and transformed into a slag silicate globule. Microscopic spherules (< 1 μm) of metallic iron attached on the surface of the slag globule were formed as a result of the reduction of iron sulphate or sulphide (Figure 6.22). Slag silicate and iron spherules in the broken small coke taken from a blast furnace have been reported by Kerkkonen [158] pointing out that the main breakage abrasion has taken place below the cohesive zone while the coke is being washed by metal spherules. 143

163 Figure 6.19 BSE image of disseminated minerals on Site 5 of the unreacted coke. 144

164 Figure 6.20 BSE image of disseminated minerals on Site 5 of the reacted coke. 145

165 Figure 6.21 BSE image of disseminated minerals on Site 6 of the unreacted coke. 146

166 Figure 6.22 BSE image of disseminated minerals on Site 6 of the reacted coke. 147
Pyrometallurgy of iron is still the most important pyrometallurgical process economically.
 1 Pyrometallurgy of iron is still the most important pyrometallurgical process economically. Prehistorically, iron was prepared by simply heating it with charcoal in a fired clay pot. Coke is coal that
Coke microstructure and strength under blast furnace conditions
 University of Wollongong Research Online Faculty of Engineering and Information Sciences - Papers: Part A Faculty of Engineering and Information Sciences 2013 Coke microstructure and strength under blast
Improvement in Blast Furnace Reaction Efficiency Through the Use of Catalyst-doped Highly Reactive Coke
 UDC 669. 162. 263 : 662. 749. 2 Improvement in Blast Furnace Reaction Efficiency Through the Use of Catalyst-doped Highly Reactive Coke Seiji NOMURA* 1 Shinroku MATSUZAKI* 1 Masaaki NAITO* 1 Hiroyuki AYUKAWA*
CHAPTER-6: SUMMARY AND CONCLUSIONS
 CHAPTER-6: SUMMARY AND CONCLUSIONS 190 6. SUMMARY AND CONCLUSIONS 6.1 Summary of laboratory test work Based on the entire laboratory test work, findings are summarized as following; 6.1.1 Characterization
Investigating the Effect of Coal Mineral Matter on Blast Furnace Coal Injection
 Investigating the Effect of Coal Mineral Matter on Blast Furnace Coal Injection 12 th ECCRIA Conference 5-7 th September 2018 Julian Herbert (3 rd Year PhD Student) Supervisors: Richard Marsh, Julian Steer
COKE REACTIVITY UNDER BLAST FURNACE CONDITION AND IN THE CSR/CRI TEST. Abstract
 COKE REACTIVITY UNDER BLAST FURNACE CONDITION AND IN THE CSR/CRI TEST Maria Lundgren 1, Bo Björkman 1, Lena Sundqvist Ökvist 2 1 Luleå University of Technology, SE-971 87 Luleå, Sweden 2 MEFOS, Box 812,
EFFECT OF LIMESTONE ADDITION ON THE METALLURGICAL PROPERTIES OF IRON ORE PELLETS
 1 EFFECT OF LIMESTONE ADDITION ON THE METALLURGICAL PROPERTIES OF IRON ORE PELLETS CASR SEMINAR Mikko Iljana Doctoral student, M.Sc. (Tech.) Research Group of Process Metallurgy University of Oulu CONTENTS
WF VAN DER VYVER
 DETERMINATION OF FACTORS INFLUENCING THE DEGREE OF REDUCTION DISINTEGRATION IN NORTHERN CAPE LUMP ORE AND THE ROLE OF GANGUE MINERALS IN THE PROPAGATION OF CRACKS WF VAN DER VYVER Dissertation submitted
Complexity (Reactions & Phase Changes) in Blast
 in Blast") Complexity (Reactions & Phase Changes) in Blast Furnace ASHOK K, Scientist, CSIR-NML, Jamshedpur - India 2 ½ hours General Facts about BF Solid particles / burden descends down. Gases / reducing gas mixture
Complexity (Reactions & Phase Changes) in Blast Furnace ASHOK K, Scientist, CSIR-NML, Jamshedpur - India 2 ½ hours General Facts about BF Solid particles / burden descends down. Gases / reducing gas mixture
Improvement in Blast Furnace Reaction Efficiency through the Use of Highly Reactive Calcium Rich Coke
 , pp. 316 324 Improvement in Blast Furnace Reaction Efficiency through the Use of Highly Reactive Calcium Rich Coke Seiji NOMURA, Hiroyuki AYUKAWA, 1) Hisatsugu KITAGUCHI, 2) Toshihide TAHARA, 3) Shinroku
Gasification and Reduction Behavior of Iron Ore-Carbon Composite under High Pressure
 , pp. 1778 1784 Gasification and Reduction Behavior of Iron Ore-Carbon Composite under High Pressure Zhou QI, Taichi MURAKAMI* and Eiki KASAI Graduate School of Environmental Studies, Tohoku University,
PYROMETALLURGY OF IRON
 Kwame Nkrumah University of Science & Technology, Kumasi, Ghana Pyrometallurgy of Iron Common sources of iron-bearing ores: PYROMETALLURGY OF IRON Oxide Ores Stoicheometry Iron Content (wt%) Magnetite
Laboratory Investigations of the Electrical Resistivity of Cokes and Smelting Charge for Optimizing Operation in Large Ferrochrome Furnaces
 Southern African Pyrometallurgy 2006, Edited by R.T. Jones, South African Institute of Mining and Metallurgy, Johannesburg, 5-8 March 2006 Laboratory Investigations of the Electrical Resistivity of Cokes
Acceleration of Carburization and Melting of Reduced Iron in Iron Ore Carbon Composite Using Different Types of Carbonaceous Materials
 ISIJ International, Vol. 57 (2017), ISIJ International, No. 11 Vol. 57 (2017), No. 11, pp. 1928 1936 Acceleration of Carburization and Melting of Reduced Iron in Iron Ore Carbon Composite Using Different
Slags in Production of Manganese Alloys
 Slags in Production of Manganese Alloys Oleg OSTROVSKI 1* and Douglas SWINBOURNE 2 1)School of Materials Science and Engineering, The University of New South Wales, Sydney, 2052, Australia 2)School of
Blast Furnace Coke Properties and the Influence on Off-gas Dust
 LICENTIATE T H E S I S Blast Furnace Coke Properties and the Influence on Off-gas Dust Maria Lundgren Blast Furnace Coke Properties and the Influence on Off-gas Dust Maria Lundgren Licentiate Thesis Luleå
Development of the Process for Producing Pre-reduced Agglomerates
 Development of the Process for Producing Pre-reduced Agglomerates JFE TECHNICAL REPORT No. 13 (May 9) MACHIDA Satoshi *1 SATO Hideaki * TAKEDA Kanji *3 Abstract: The Japanese steel industry, accounting
Development of a metallurgical coke analogue to Investigate the effects of coke mineralogy on coke reactivity
 University of Wollongong Research Online Faculty of Engineering - Papers (Archive) Faculty of Engineering and Information Sciences 2012 Development of a metallurgical coke analogue to Investigate the effects
DEVELOPMENT OF BLENDED CEMENT FROM ACTIVATED AND SINTERED FLY ASH
 CHAPTER 6 DEVELOPMENT OF BLENDED CEMENT FROM ACTIVATED AND SINTERED FLY ASH 6.1. Activated Sintered Flyash as blending material for cement. Investigations have been made to develop flyash-blended cements
An Application of Coke Microstructure and Microtexture to Indonesian Coal
 6 China Steel Technical Report, No. An 28, Application pp.6-12, of (2015) Coke Microstructure and Microtexture to Indonesian Coal An Application of Coke Microstructure and Microtexture to Indonesian Coal
Macrostrength and pore structure of coke subjected to gasification and annealing under blast furnace conditions
 University of Wollongong Research Online Faculty of Engineering and Information Sciences - Papers: Part A Faculty of Engineering and Information Sciences 2015 Macrostrength and pore structure of coke subjected
Reduction and Disintegration Behavior of Sinter under N 2 CO CO 2 H 2 H 2 O Gas at 773 K
 ISIJ International, Vol. 55 (2015), ISIJ International, No. 6 Vol. 55 (2015), No. 6, pp. 1181 1187 Reduction and Disintegration Behavior of Sinter under N 2 CO CO 2 H 2 H 2 O Gas at 773 K Taichi MURAKAMI,*
Coke Degradation under Simulated Blast Furnace Conditions
 ISIJ International, Vol. 56 (2016), ISIJ International, No. 5 Vol. 56 (2016), No. 5, pp. 786 793 Coke Degradation under Simulated Blast Furnace Conditions Xing XING, 1) * Harold ROGERS, 2) Guangqing ZHANG,
Direct reduction of low grade nickel laterite ore to produce ferronickel using isothermal temperature gradient
 Direct reduction of low grade nickel laterite ore to produce ferronickel using isothermal temperature gradient Zulfiadi Zulhan, and Ian Gibranata Citation: AIP Conference Proceedings 1805, 040003 (2017);
Incorporation of Charcoal in Coking Coal Blend A Study of the Effects on Carbonization Conditions and Coke Quality
 Incorporation of Charcoal in Coking Coal Blend A Study of the Effects on Carbonization Conditions and Coke Quality Ka Wing Ng CanmetENERGY 1 Haanel Drive, Ottawa, ON, Canada, K1A 1M1 Phone: (613) 996 8712
Study on the permeability index of COREX melter-gisifer and its influencing factors
 Study on the permeability index of COREX melter-gisifer and its influencing factors Wenlong ZHAN,Keng WU, Yong ZHAO and Erhua ZHANG School of Metallurgical and Ecological Engineering, University of Science
Enhancement of connectivity and flux pinning in MgB2 superconducting bulks and wires
 University of Wollongong Research Online University of Wollongong Thesis Collection 1954-2016 University of Wollongong Thesis Collections 2009 Enhancement of connectivity and flux pinning in MgB2 superconducting
Effect of CO Gas Concentration on Reduction Rate of Major Mineral Phase in Sintered Iron Ore
 , pp. 570 575 Effect of CO Gas Concentration on Reduction Rate of Major Mineral Phase in Sintered Iron Ore Daisuke NOGUCHI, 1) * Ko-ichiro OHNO, 2) Takayuki MAEDA, 2) Kouki NISHIOKA 3) and Masakata SHIMIZU
CONVERSION OF SRI LANKAN IRON ORE INTO HIGH QUALITY PELLETS TO BE USED IN IRON MAKING
 CONVERSION OF SRI LANKAN IRON ORE INTO HIGH QUALITY PELLETS TO BE USED IN IRON MAKING Sudath Peiris Guluwita (08/8034) Degree of Master of Philosophy Department of Materials Science and Engineering University
Never Stand Still Faculty of Science Materials Science and Engineering
 ECIC - 2016 A STUDY OF GASEOUS REDUCTION OF MAGNETITE ORE IN A FIXED-BED REACTOR AND USING IN-SITU HIGH-TEMPERATURE XRD ANALYSIS Never Stand Still Faculty of Science Yury Kapelyushin 1, Yasushi Sasaki
Volatilization Behaviors of Low-boiling-point Elements in Municipal Solid Waste Gasification and Melting Processes
 Volatilization Behaviors of Low-boiling-point Elements in Municipal Solid Waste Gasification and Melting Processes Shohichi Osada 1, Morihiro Osada 2 1. Nishinihon Branch Office, Nippon Steel Engineering
Investigators: R. E. Mitchell, Associate Professor, Mechanical Engineering Department; P. A. Campbell and L. Ma, Graduate Researchers
 Coal and Biomass Char Reactivity Investigators: R. E. Mitchell, Associate Professor, Mechanical Engineering Department; P. A. Campbell and L. Ma, Graduate Researchers Project Overview: There is considerable
Recent Progress in Ironmaking Technology for CO2 Mitigation at JFE Steel
 JFE TECHNICAL REPORT No. 19 (Mar. 2014) Recent Progress in Ironmaking Technology for CO2 Mitigation at JFE Steel SATO Michitaka*1 YAMAMOTO Tetsuya*2 SAKURAI Masaaki*3 Abstract: In order to contribute of
Figure 4.1 shows the changes in composition as peat progresses to bituminous coal.
 4 Coal 4.1 What is coal? Coal is formed almost entirely from plants and parts of plants, woody material bark leaves etc. and is the product of the effect of pressure, heat and hundreds and millions of
Heat Balance in Pyrometallurgical Processes
 Heat Balance in Pyrometallurgical Processes The heat balance shows the important sources of heat energy and their relative contribution to the total energy usage in a process The heat balance in general
Effect of Volatile Matter Content of Coal on Carbothermic Reduction of Ore / Coal Composite Pellets Packed in a Tall Bed
 China Steel Technical Report, No. 27, pp.11-19, Lung-Jen (2014) Chiang, Kuo-Cheng Yang and I-Ching Hsiao 11 Effect of Volatile Matter Content of Coal on Carbothermic Reduction of Ore / Coal Composite Pellets
Utilisation of unconventional ferrous materials by sintering
 University of Wollongong Research Online University of Wollongong Thesis Collection 1954-2016 University of Wollongong Thesis Collections 2015 Utilisation of unconventional ferrous materials by sintering
REDUCTION OF IRON ORE PELLETS BY STATISTICAL DESIGN OF EXPERIMENTS
 Int. J. Engg. Res. & Sci. & Tech. 2014 2013 K M K Sinha and T Sharma, 2014 Research Paper ISSN 2319-5991 www.ijerst.com Vol. 3, No. 1, February 2014 2014 IJERST. All Rights Reserved REDUCTION OF IRON ORE
Dr. Joseph J Poveromo, Raw Materials & Ironmaking Global Consulting DR Pellet Quality & MENA Applications
 Dr. Joseph J Poveromo, Raw Materials & Ironmaking Global Consulting joe.poveromo@rawmaterialsiron.com DR Pellet Quality & MENA Applications Chemistry Considerations direct reduction processes: chemical
FINEX - AN OLD VISION OF THE IRON AND STEEL INDUSTRY BECOMES REALITY*
 FINEX - AN OLD VISION OF THE IRON AND STEEL INDUSTRY BECOMES REALITY* Shibu John 1 Christian Boehm 2 Wolfgang Sterrer 3 Norbert Rein 4 Yi Sang-ho 5 Shin Sungkee 6 Abstract Rising energy demand and steadily
OPTIMUM PROCESS CONDITIONS FOR THE PRODUCTION OF PIG IRON BY COREX PROCESS. Abstract
 OPTIMUM PROCESS CONDITIONS FOR THE PRODUCTION OF PIG IRON BY COREX PROCESS Ahmad Wafiq 1, Ahmed Soliman 1, Tarek M. Moustafa 1, and A.F. Nassar 1 1 Chemical Engineering Department, Faculty of Engineering,
STUDIES ON INFLUENCE OF LIQUID LEVEL ON BLAST FURNACE PERFORMANCE AND MONITORING OF HEARTH DRAINAGE
 STUDIES ON INFLUENCE OF LIQUID LEVEL ON BLAST FURNACE PERFORMANCE AND MONITORING OF HEARTH DRAINAGE Dr. Baidya Nath Roy 1 and Uddeshya Kumar 2 International Journal of Latest Trends in Engineering and
Pulverised Coal Pyrolysis and Char Combustion Characteristics in Simulated Air (O 2 /N 2 ) and Oxy-fuel (O 2 /CO 2 ) Conditions
 and Oxy-fuel (O 2 /CO 2 ) Conditions") 1 st Oxy-fuel Combustion Conference, Cottbus, Germany - 9 September 29 Pulverised Coal Pyrolysis and Char Combustion Characteristics in Simulated Air (O 2 /N 2 ) and Oxy-fuel (O 2 /CO 2 ) Conditions Renu
1 st Oxy-fuel Combustion Conference, Cottbus, Germany - 9 September 29 Pulverised Coal Pyrolysis and Char Combustion Characteristics in Simulated Air (O 2 /N 2 ) and Oxy-fuel (O 2 /CO 2 ) Conditions Renu
CaCO 3 CaO + CO 2 MgCO 3 MgO + CO 2 CaCO 3 MgCO 3 CaO MgO + 2 CO 2 FeCO 3 FeO + CO 2 FeO + CO Fe +CO 2
 A. Fundamentals 1. Introduction 1.1 Principle mechanism Shaft kilns and cupola furnaces are used for the mass conversion and melting of granular and coarse materials. The material is transported through
TOWARDS SUSTAINABLE DEVELOPMENT
 THE SEARCH FOR A NEW IRONMAKING PROCESS TOWARDS SUSTAINABLE DEVELOPMENT WiK Wei Kao Lu Professor Emeritus Materials Science and Engineering g McMaster University, Hamilton, Ontario, Canada GCEP Industry
Determination of the thermal histories of coke in a blast furnace through x-ray analysis
 University of Wollongong Research Online Faculty of Engineering - Papers (Archive) Faculty of Engineering and Information Sciences 2008 Determination of the thermal histories of coke in a blast furnace
Brimacombe Lecture. Research on Sustainable Steelmaking
 Brimacombe Lecture Research on Sustainable Steelmaking R. J. Fruehan Center for Iron and Steelmaking Research Materials Science and Engineering Department Carnegie Mellon University Pittsburgh PA Tel:
Haseeb Ullah Khan Jatoi Department of Chemical Engineering UET Lahore
 Haseeb Ullah Khan Jatoi Department of Chemical Engineering UET Lahore Greek word Keramikos which means Burnt Stuff indicating that desired properties of these materials are normally achieved through a
Biofuels GS 2 Measuring Course Part II, DTU, Feb 2 6, 2009 Experiments in the entrained flow reactor
 Biofuels GS 2 Measuring Course Part II, DTU, Feb 2 6, 2009 Experiments in the entrained flow reactor Frida Claesson (ÅA) Johanna Olsson (CTU) Kavitha Pathmanathan (NTNU) Samira Telschow (DTU) Liang Wang
Impact of PCI Coal Quality on Blast Furnace Operations
 Impact of PCI Coal Quality on Blast Furnace Operations P Bennett*, T Fukushima** *CoalTech Pty Ltd, **F-TeCon Pty Ltd Contact: pbennett@coaltech.com.au ABSTRACT Pulverized coal injection has assisted the
Manufacture of Pig Iron Concentration Calcination Smelting Blast furnace Chemistry of reactions in Blast furnace. 15CY101: Chemistry SRM University 2
 Manufacture of Pig Iron Concentration Calcination Smelting Blast furnace Chemistry of reactions in Blast furnace. 15CY101: Chemistry SRM University Iron is very reactive and is found in nature in form
EFFECT OF MAGNETITE, HEMATITE AND PELLET SCREENINGS AS FEED IN SINTER PRODUCTION. Abstract
 EFFECT OF MAGNETITE, HEMATITE AND PELLET SCREENINGS AS FEED IN SINTER PRODUCTION Mikael Pettersson 1, Peter Sikström 1 and Dr. Volker Ritz 2 1 LKAB, 952, 971 28 Luleå, Sweden 2 SGA, Grubenstrasse 5, 38704
THE REDUCTION OF SELF-REDUCING CHROMITE PELLETS AT 1773 K: INTRAPELLET TEMPERATURE GRADIENTS
 www.arpapress.com/volumes/vol13issue1/ijrras_13_1_29.pdf THE REDUCTION OF SELF-REDUCING CHROMITE PELLETS AT 1773 K: INTRAPELLET TEMPERATURE GRADIENTS Adolfo Pillihuaman Zambrano 1, Cyro Takano 2, Alberto
9/12/2018. Course Objectives MSE 353 PYROMETALLURGY. Prerequisite. Course Outcomes. Forms of Assessment. Course Outline
 Kwame Nkrumah University of Science & Technology, Kumasi, Ghana MSE 353 PYROMETALLURGY Course Objectives Understand the fundamental concepts of pyrometallurgy Understand the concepts of materials and energy
CHAR REACTIVITY AND ITS IMPLICATIONS. *J.M. Steer, R. Marsh, M. Greenslade ECCRIA 2016
 CHAR REACTIVITY AND ITS IMPLICATIONS FOR BLAST FURNACE COAL INJECTION *J.M. Steer, R. Marsh, M. Greenslade Cardiff University - School of Engineering ECCRIA 2016 Content Introduction Blast furnace coal
Conditions for Minimizing Direct Reduction in Smelting Reduction Iron Making
 ISIJ International, Vol. 58 (2018), ISIJ International, No. 2 Vol. 58 (2018), No. 2, pp. 274 281 Conditions for Minimizing Direct Reduction in Smelting Reduction Iron Making Yang-Sub SHIM and Sung-Mo JUNG*
IRONMAKING and THEORY AND PRACTICE. Ahindra Ghosh Amit Chatterjee
 IRONMAKING and STEELMAKING THEORY AND PRACTICE Ahindra Ghosh Amit Chatterjee IRONMAKING AND STEELMAKING IRONMAKING AND STEELMAKING Theory and Practice AHINDRA GHOSH Formerly Professor Materials and Metallurgical
Research on the High Strength Glass Ceramics/Mullite Ceramics Composites
 New Journal of Glass and Ceramics, 2011, 1, 53-57 doi:10.4236/njgc.2011.12009 Published Online July 2011 (http://www.scirp.org/journal/njgc) 53 Research on the High Strength Glass Ceramics/Mullite Ceramics
HOW A BLAST FURNACE WORKS
 HOW A BLAST FURNACE WORKS Introduction The purpose of a blast furnace is to chemically reduce and physically convert iron oxides into liquid iron called "hot metal". The blast furnace is a huge, steel
The Kinetics of the reactivity of a coke analogue with carbon dioxide
 University of Wollongong Research Online Faculty of Engineering and Information Sciences - Papers: Part A Faculty of Engineering and Information Sciences 2014 The Kinetics of the reactivity of a coke analogue
Drying, devolatilization & char oxidation of solid fuel
 Drying, devolatilization & char oxidation of solid fuel Oskar Karlström Dr. Sc. Åbo Akademi 2017: Chemistry in Combustion Processes Solid fuel combustion Solid fuel combustion fuel In pulverized fuel combustion,
Hydrogen-rich materials as auxiliary reducing agents in the blast furnace
 Hydrogen-rich materials as auxiliary reducing agents in the blast furnace Dimitrios Sideris Chemical Engineering, master's level (120 credits) 2018 Luleå University of Technology Department of Civil, Environmental
Subjects for Achievement of Blast Furnace Operation with Low Reducing Agent Rate
 , pp. 1379 1385 Subjects for Achievement of Blast Furnace Operation with Low Reducing Agent Rate Yutaka UJISAWA, Kaoru NAKANO, Yoshinori MATSUKURA, Kohei SUNAHARA, Shusaku KOMATSU and Takaiku YAMAMOTO
SINTER BASICITY INCREASE THROUGH INSERTION OF MAGNESIUM SILICATE MINILUMPS BY ALBA FERNÁNDEZ, PAMELA DIAZ, ESTEBAN RUISÁNCHEZ, JAVIER MARTÍNEZ *
 SINTER BASICITY INCREASE THROUGH INSERTION OF MAGNESIUM SILICATE MINILUMPS BY ALBA FERNÁNDEZ, PAMELA DIAZ, ESTEBAN RUISÁNCHEZ, JAVIER MARTÍNEZ * SYPNOPSIS PASEK Dunite is an ultramaphic rock with a basic
Effect of Iron Ore Concentrate on Sintering Properties
 ISIJ International, Vol. 57 (2017), ISIJ International, No. 11 Vol. 57 (2017), No. 11, pp. 1937 1946 Effect of Iron Ore Concentrate on Sintering Properties Li-Heng HSIEH* Iron & Steel R & D Department,
CZ.1.07/2.3.00/
 NEW CREATIVE TEAMS IN PRIORITIES OF SCIENTIFIC RESEARCH CZ.1.07/2.3.00/30.0055 This project is funded by Structural Funds of the European Union (ESF) and state budget of the Czech Republic Theme: Experimental
LOW-SILICON FERROSILICON PRODUCTION FROM IRON ORE MATERIALS IN AN OXYGEN REACTOR
 LOW-SILICON FERROSILICON PRODUCTION FROM IRON ORE MATERIALS IN AN OXYGEN REACTOR A.V. Pavlov, K.L. Kossyrev, A.E. Semin, А. Korostylev and V.A. Grygorian Moscow Steel and Alloys Institute, Leninsky pr.
IRON AND STEEL INDUSTRY DEVELOPMENT AND TECHNOLOGICAL INNOVATION IN CHINA
 IRON AND STEEL INDUSTRY DEVELOPMENT AND TECHNOLOGICAL INNOVATION IN CHINA Kuang-di Xu Chinese Academy of Engineering, China ABSTRACT China s iron and steel industry enjoys accelerated development thanks
Unique functions of slags in steelmaking
 FRUEHAN, R.J. Unique functions of slags in steelmaking. VII International Conference on Molten lags Fluxes and alts, The outh African Institute of Mining and Metallurgy, 4. Unique functions of slags in
USING OF WASTE PET (POLYETHYLENE TEREPHTHALATE) AS AN ALTERNATIVE REDUCTANT IN IRON AND STEEL INDUSTRY
 AS AN ALTERNATIVE REDUCTANT IN IRON AND STEEL INDUSTRY") USING OF WASTE PET (POLYETHYLENE TEREPHTHALATE) AS AN ALTERNATIVE REDUCTANT IN IRON AND STEEL INDUSTRY Gökhan POLATolat, Burak BIROL and Muhlis Nezihi SARIDEDE Department of Metallurgical and Materials
USING OF WASTE PET (POLYETHYLENE TEREPHTHALATE) AS AN ALTERNATIVE REDUCTANT IN IRON AND STEEL INDUSTRY Gökhan POLATolat, Burak BIROL and Muhlis Nezihi SARIDEDE Department of Metallurgical and Materials
Table of Contents. Preface...
 Preface... xi Chapter 1. Metallurgical Thermochemistry... 1 1.1. Introduction... 1 1.2. Quantities characterizing the state of a system and its evolution... 3 1.2.1. The types of operations... 3 1.2.2.
Concrete Technology. 1- Neville, AM and Brooks J.J." Concrete Technology" Second Edition, 2010.
 Syllabus. Introduction 2. Cement 3. Aggregate 4. Fresh Concrete 5. Strength of Concrete 6. Elasticity, Shrinkage and Creep 7. Concrete Durability 8. Concrete Mix Design 9. Special Concretes Text Book -
Variations in the properties of partially burnt coal chars and implications on the blast furnace process
 Variations in the properties of partially burnt coal chars and implications on the blast furnace process Julian Steer*, Richard Marsh*, Dane Sexton*, Mark Greenslade *Cardiff School of Engineering, Queen
Particulate Sintering of Iron Ore and Empirical Analysis of Sintering Time Based on Coke Breeze Input and Ignition Temperature
 IOSR Journal of Mechanical and Civil Engineering (IOSR-JMCE) e-issn: -1684,p-ISSN: 232-334X, Volume 7, Issue 4 (Jul. - Aug. 213), PP 42-51 Particulate Sintering of Iron Ore and Empirical Analysis of Sintering
Mechanical Strength of Reduced Iron Ore Pellets Sampled from the LKAB Experimental Blast Furnace
 Mechanical Strength of Reduced Iron Ore Pellets Sampled from the LKAB Experimental Blast Furnace Anna Brännmark *, Anna Dahlstedt **, Caroline Stillberg ***, Gunilla Hyllander **** * LKAB SE-971 28 Luleå
Summary. Carbon in solid form exhibit diverse structure and physical properties. It is this diversity
 Summary Carbon in solid form exhibit diverse structure and physical properties. It is this diversity coupled with the ability to prepare carbon products in complete random to perfectly aligned torm that
Reduce Furnace Energy Consumption Using Calumite
 Reduce Furnace Energy Consumption Using Calumite Nicola J. Marriott, Calumite Ltd, UK Introduction Calumite is an environmentally beneficial alumina source used in all types of soda-lime-silica glass making.
The influence of increased air flow on the spatial variation of iron sinter quality
 The influence of increased air flow on the spatial variation of iron sinter quality by A.M. Garbers-Craig, J.M.A. Geldenhuis, W.J. Jordaan, and P.C. Pistorius* Background Synopsis The aim of this investigation
UNIVERSITY OF PRETORIA DEPARTMENT OF MATERIALS SCIENCE AND METALLURGICAL ENGINEERING
 UNIVERSITY OF PRETORIA DEPARTMENT OF MATERIALS SCIENCE AND METALLURGICAL ENGINEERING INVESTIGATION INTO THE INFLUENCE OF MAGNESIA CONTENT, ALUMINA CONTENT, BASICITY AND IGNITION TEMPERATURE ON THE MINERALOGY
ABOUT SLRM. SLRMetaliksiscertifiedbyQMSISO9001:2008, EMS ISO14001:2004andOHSAS 18001:2007 in 2015
 1 ABOUT SLRM SLRMetaliksiscertifiedbyQMSISO9001:2008, EMS ISO14001:2004andOHSAS 18001:2007 in 2015 Located near Hospet, World heritage center and steel city of Karnataka, spread out in more than 200 acres
MULTI-DIMENSIONAL MATHEMATICAL MODEL OF BLAST FURNACE BASED ON MULTI-FLUID THEORY AND ITS APPLICATION TO DEVELOP SUPER-HIGH EFFICIENCY OPERATIONS
 Fifth International Conference on CFD in the Process Industries CSIRO, Melbourne, Australia 13-1 December 6 MULTI-DIMENSIONAL MATHEMATICAL MODEL OF BLAST FURNACE BASED ON MULTI-FLUID THEORY AND ITS APPLICATION
RESEARCH OF REDUCING ABILITY OF CARBON REDUCTANTS FOR FERROALLOY PRODUCTION BY DILATOMETRIC METHOD
 RESEARCH OF REDUCING ABILITY OF CARBON REDUCTANTS FOR FERROALLOY PRODUCTION BY DILATOMETRIC METHOD A.V. Pavlov, A.S. Kazakov, O.V Chadaeva, Y.V. Shurigina National Research Technological University (MISiS),
SULPHUR CAPTURING DURING A FIXED-BED GASIFICATION PROCESS OF COAL
 SULPHUR CAPTURING DURING A FIXED-BED GASIFICATION PROCESS OF COAL M. Pat Skhonde, J. Reginald Bunt, A. Christien Strydom, Harold Schobert 4 th International Conference on Clean Coal Technologies 18-29
Center for Advanced Sustainable Iron & Steel Making
 Proposed Project 10: Effects of Carbonate Minerals on Filtration Rates Objective(s): Determine how carbonate minerals that either occur naturally in the ore, or are added as flux, affect the filtration
Oxidation of Graphite and Metallurgical Coke
 DEGREE PROJECT IN MATERIALS DESIGN AND ENGINEERING, SECOND CYCLE, 30 CREDITS STOCKHOLM, SWEDEN 2016 Oxidation of Graphite and Metallurgical Coke A Numerical Study with an Experimental Approach YOUSEF AHMAD
EVALUATION REPORT OF HESS PUMICE
 EVALUATION REPORT OF HESS PUMICE June 11, 212 By Uma Ramasamy and Paul Tikalsky CONCRETE AND MATERIALS RESEARCH AND EVALUATION LABORATORY DEPARTMENT OF CIVIL AND ENVIRONMENTAL ENGINEERING 1 INTRODUCTION
Effect of Using Oxygen-Enriched Gas during Induration Process of Iron Ore Pellets Containing Solid Fuel
 , pp. 27-31 Effect of Using Oxygen-Enriched Gas during Induration Process of Iron Ore Pellets Containing Solid Fuel M. Alizadeh* 1 Materials and Energy Research Center, P.O. Box 31787-316, Karaj, Tehran,
Influence of Pellet Basicity (CaO/SiO 2 ) on Iron Ore Pellet Properties and Microstructure
 on Iron Ore Pellet Properties and Microstructure") , pp. 14 20 Influence of Pellet Basicity (CaO/SiO 2 ) on Iron Ore Pellet Properties and Microstructure T. UMADEVI, Prasanna KUMAR, Naveen F. LOBO, M. PRABHU, P.C. MAHAPATRA and Madhu RANJAN JSW Steel Limited,
, pp. 14 20 Influence of Pellet Basicity (CaO/SiO 2 ) on Iron Ore Pellet Properties and Microstructure T. UMADEVI, Prasanna KUMAR, Naveen F. LOBO, M. PRABHU, P.C. MAHAPATRA and Madhu RANJAN JSW Steel Limited,
Effect of Mineral Composition and Pore Structure on Reducibility of Composite Iron Ore Sinter
 , pp. 722 728 Effect of Mineral Composition and Pore Structure on Reducibility of Composite Iron Ore Sinter Hideki ONO, 1) Yusuke DOHI, 2) Yuki ARIKATA 3) and Tateo USUI 1) 1) Division of Materials and
Briquette Smelting in Electric Arc Furnace to Recycle Wastes from Stainless Steel Production
 Briquette Smelting in Electric Arc Furnace to Recycle Wastes from Stainless Steel Production Qi-xing YANG 1 2 2, Dong-feng HE 2 3 1 Abstract: Wastes from stainless steel production were briquetted together
Performance of High Strength Concrete Prepared by Partially Replacing Fine Aggregate with Bottom Ash
 Performance of High Strength Concrete Prepared by Partially Replacing Fine Aggregate with Bottom Ash Kylasnath M 1, Ranjan Abraham 2 1 P.G. Student, Department of Civil Engineering, Ilahia College of Engineering
raw sinter mix ignition hood direction of strand wind main electrostatic wind boxes wind legs gas flow Fig. 1 Schematic of a typical sinter plant
 Does the handling of iron present a potential health hazard from the release of respirable crystalline silica? IP TWG position paper to support the Iron Sinter REACH dossier 1. INTRODUCTION Sintering is
Sintering studies of Iron Ore Fines of Hospet-Sandur-Bellary sector, Karnataka, India
 744 Sintering studies of Iron Ore Fines of Hospet-Sandur-Bellary sector, Karnataka, India Anand V.Kulkarni*, H.M.Jayasheela** *(Manager-Geology, Hospet Steel Limited, Koppal, Karnataka. Email: dravk1309@gmail.com)
Production of Iron and Steels
 MME 131: Lecture 24 Production of Iron and Steels Prof. A.K.M.B. Rashid Department of MME BUET, Dhaka Topics to discuss 1. Importance of iron and steels 2. The smelting of iron in Blast Furnace 3. The
RAW MATERIALS AND IRONMAKING. Raw materials improvement in the steel industry
 Raw materials improvement in the steel industry The World Steel Association has recently completed a major technical study: Raw Materials Improvement in the Steel Industry. This article gives a summary
The Death of Coal 1957
 2013/06/13 The Death of Coal 1957 R. P. Wolensky et al., THE KNOX MINE DISASTER, PHMC, 1999 Evan McColl and Peggy Seeger, The Ballad of Spring Hill. Dr LJ Erasmus June 2013 Contents Reductants Pyrometallurgy
Manganese Furnace Dust: Drying and Reduction of Zinc Oxide by Tar
 , pp. 906 911 Manganese Furnace Dust: Drying and Reduction of Zinc Oxide by Tar Tasuku HAMANO, 1) Guangqing ZHANG, 1) Peter BROWN 2) and Oleg OSTROVSKI 1) 1) School of Materials Science and Engineering,
Studies on Blast Furnace Slag Flow Characteristics
 Studies on Blast Furnace Slag Flow Characteristics Thesis submitted to National Institute of Technology, Rourkela For the award of the degree of Master of Technology In Metallurgical and Materials Engineering
MSE 352 Engineering Ceramics II
 Kwame Nkrumah University of Science & Technology, Kumasi, Ghana MSE 352 Engineering Ceramics II Ing. Anthony Andrews (PhD) Department of Materials Engineering Faculty of Mechanical and Chemical Engineering
STUDY OF REDUCTION BEHAVIOUR OF IRON ORE LUMPS BY COAL
 STUDY OF REDUCTION BEHAVIOUR OF IRON ORE LUMPS BY COAL A THESIS SUBMITTED IN PARTIAL FULFILLMENT OF THE REQUIREMENT FOR THE DEGREE OF BACHELOR OF TECHNOLOGY In METALLURGICAL AND MATERIALS ENGINEERING By