Commercial Swine Barn Baseline Energy Audit
|
|
|
- Brice Lane
- 5 years ago
- Views:
Transcription

1 Commercial Swine Barn Baseline Energy Audit June 30, 2017 Eric Buchanan, Kirsten Sharpe, Lee Johnston, Ph.D., Michael Reese, and Joel Tallaksen, Ph.D. *University of Minnesota s West Central Research and Outreach Center, Morris, MN, *With special acknowledgment to Anderson Farms, Hillside Hogs, Moore Lean, and Moser Farms Project funding provided by the Minnesota Environmental and Natural Resources Trust Fund through the Legislative-Citizen Commission on Minnesota Resources (LCCMR)
2 CONTENTS 1. Introduction Materials and Methods Facility information Biosecurity Data collection Electrical energy Equipment uses Thermal energy Pig inventories Results and Discussion Breed-to Wean Barn A and Breed-to-Wean Barn B (BWA and BWB) Electric and thermal energy Nursery Barn A and Nursery Barn B (NBA and NBB) Electric and thermal energy Finishing Barn A and Finishing Barn B (FBA and FBB) Electric and thermal energy References Appendix...17
3 1. INTRODUCTION Interest in energy use for all sectors of society is increasing because of rising energy prices, uncertainty about access to fossil fuel reserves, and scientific consensus about the deleterious implications of fossil fuel use for the global climate (Lammers et al., 2012). Within agricultural systems, there is potential to reduce the fossil energy consumption in livestock production systems. Greenhouse gas emissions from the agricultural sector account for approximately 22% of total global emissions, and livestock production (including transport of livestock and feed) accounts for nearly 80% of the agricultural sector s emissions (McMichael et al., 2007). By 2050, global livestock production is expected to double- growing faster than any other agricultural sub-sector (FAO, 2006a). Meat production and demand is increasing throughout the world, and pork is the most widely consumed meat globally, accounting for 40% of meat consumption worldwide (FAO, 2006b). The U.S. is currently the second largest supplier of pork after China (FAO, 2014), and within the U.S., the largest share of pork production resides within the Midwest region (74% as of September 1, 2015; USDA, 2016). Most of the U.S. swine industry now consists of large, energy-intensive and concentrated production systems. Commercial pork production systems typically consist of three separate phases: breed-to-wean, nursery, and finishing. The breed-to-wean phase includes housing of mature sows during gestation, lactation, and of piglets from birth to weaning. Typically, a sow will enter the birthing room one week before farrowing and remain in the room for approximately three weeks with the piglets. The piglets, which are about 12 pounds and 21 days old, are moved at weaning onto trailers and transported to nursery facilities. The sows are moved back to gestation rooms for mating and pregnancy and the cycle repeats. The nursery phase includes housing of the newly weaned, approximately 12 pound pigs until they are generally 9 weeks old and 50 pounds. The finishing phase houses and grows the pigs from 50 pounds to their market weight of approximately 280 pounds when they are about 25 weeks of age. During each of these phases, pigs have very different environmental requirements, which in turn require differing fossil fuel inputs. In the breed-to-wean phase, sows require extensive cooling during the summer, which is typically supplied by exhaust fans and hanging fans. The piglets in this phase require extensive heating especially during the first week of life which is supplied by propane heaters and heat lamps. In the nursery phase, the pigs require both heating and cooling provided by propane heaters and fans, respectively. Pigs in the finishing phase typically require year-round cooling due to internal heat gains from body heat. One of the University of Minnesota West Central and Outreach Center s (WCROC) strategic goals is to research methods of reducing fossil energy consumption within production agriculture systems. The purpose of the study, reported herein, is to provide actual baseline energy consumption data for commercial pork production systems in the Upper Midwest. There have been previous studies which report energy use in these systems, however these studies estimate energy use theoretically by relying on scientific literature and brief audits. Information on how much energy is used, and on the relative amounts of energy used for each purpose, is far from complete and the differences among production units are large (Barber et al., 1998). There are opportunities for reducing fossil energy consumption; however, the opportunities are different for each production phase. Therefore, this study will be one of the first studies to specifically measure the energy consumption of operating commercial pork production systems and the various loads within these operations, providing data which will give insight into lowering fossil fuel inputs. The data from this study will be used in a Life Cycle Assessment (LCA), energy efficiency studies, economic feasibility studies, renewable energy feasibility studies, and energy/agriculture policy development. The data is also invaluable to researchers and producers that seek to improve the energy efficiency of pork production systems or are interested in integrating renewable energy systems into their facilities. The data will be useful in targeting specific areas of pork production that 3
4 have potential for improved energy efficiency. Energy monitoring was performed from November 2014 to April 2017 which was essential in understanding the influences of seasons and patterns on energy usage. 2. MATERIALS AND METHODS 2.1. Facility Information To collect baseline energy data, two commercial facilities from west central Minnesota that are representative of typical Upper Midwest swine production systems were selected from each phase of production (Table 1.): two breed-to-wean barns (BWA & BWB), two nursery barns (NBA & NBB), and two finishing barns (FBA & FBB). At each of these facilities, researchers recorded and analyzed monthly consumption of electricity and heating fuel. In addition, monthly pig inventories and monthly pig production of each facility were recorded. All barns were located in west central Minnesota. Breed-to-Wean Barn A (BWA) was a 2,600 sow facility. The farrowing and north gestation rooms in this barn were powerventilated, while the south sow gestation rooms were curtain-sided with stirring fans for air movement. The floors were fully slatted with shallow manure pits and scrapers for manure management. The north gestation room consisted of 763 stalls and 8 pens. The south east gestation room consisted of 756 stalls, and the south west gestation room consisted of 612 stalls. The north farrowing barn consisted of four rooms with 52 stalls in each room, which were identical in size, structure, and electrical loads. The south farrowing barn was different than the aforementioned barn and was made up of 9 rooms with 24 stalls in each room. The 9 rooms in the south barn were identical in size, structure, and electrical loads. There were several miscellaneous rooms within the unit used for pressure washers, mechanical rooms, wash rooms, and storage rooms. The unit had a central office area with showers, bathrooms, laundry area, and a kitchen. Lastly, an additional gilt developer unit (GDU) was commissioned during January of 2015 and was dedicated to providing replacement gilts to the main sow unit. Breed-to-Wean Barn B (BWB) was a 3,300 sow facility. The farrowing rooms in this facility were power-ventilated, and the gestation room was tunnel-ventilated in the summer and power-ventilated in the winter. The floors were fully slatted over deep manure pits for manure management. There were 10 farrowing rooms which were identical in size, structure, and electrical loads. Each room consisted of 48 farrowing stalls. There was one additional farrowing room that was half the size of the other rooms and consisted of 24 stalls. The unit had several miscellaneous rooms that served as a pressure washer room, storage rooms, work room, and refrigerator and wash rooms. The unit had a central office area with showers, bathrooms, laundry area, and a kitchen. During late June of 2015, a new GDU was added to provide replacement gilts for the main gestation unit. Nursery Barn A (NBA) was a 3,000 head, power-ventilated facility. There were 3 nursery rooms that housed 1,000 pigs each and had fully-slatted floors and were identical in size, structure, and electrical loads. The unit also consisted of a load out and storage area, office and laundry area, and shower room. Nursery Barn B (NBB) was a 10,200 head, power-ventilated facility. There were 8 nursery rooms that housed 1,000 pigs each and had fully-slatted floors and were identical in size, structure, and electrical loads. There were two additional 1,100 head nursery rooms which also had fully-slatted floors and were identical to each other in size, structure, and electrical loads. The unit had several miscellaneous rooms including a pressure washer room, mechanical room, and storage room. There was also a central office area which had showers, a bathroom, laundry area, and kitchen. Finishing Barn A (FBA) was a 2,400 head, tunnel-ventilated facility. There were 2 finishing rooms that housed 1,200 pigs each and had fully-slatted floors and were identical in size, structure, and electrical loads. The unit also consisted of a load out and storage area, office and laundry area, and shower room. 4

 2,600 sows curtain-sided south gestation rooms")
 10,000 feeder pigs Power-ventilated Finishing Barn A (FBA) 2,400 finishing pigs Tunnel-ventilated Finishing Barn B (FBB) 1,060 finishing pigs Curtain-sided Skov.")
5 Finishing Barn B (FBB) was a 1,060 head, curtain-sided facility. There were 2 finishing rooms that housed 530 pigs each and had fully-slatted floors and were identical in size and structure and consisted of the same electrical loads. The unit also had a central storage room and pressure washer room and a load out hallway. Table 1. Commercial swine barn details Barn Barn Capacity Barn Type Power-ventilated farrowing and north gestation rooms, Breed-to-Wean Barn A (BWA) 2,600 sows curtain-sided south gestation rooms Breed-to-Wean Barn B (BWB) 3,300 sows Power-ventilated farrowing rooms and tunnel/powerventilated gestation room Nursery Barn A (NBA) 3,000 feeder pigs Power-ventilated Nursery Barn B (NBB) 10,000 feeder pigs Power-ventilated Finishing Barn A (FBA) 2,400 finishing pigs Tunnel-ventilated Finishing Barn B (FBB) 1,060 finishing pigs Curtain-sided Skov.com WCROC, 2015 Figure 1. An example of a power-ventilated pig barn. Figure 2. An example of a curtain-sided pig barn. WCROC, 2015 Figure 3. An example of a tunnel-ventilated pig barn with ventilation fans on the far end and an inlet curtain on the near end. 5
6 2.2. Biosecurity Preventing the introduction of potentially devastating disease agents has always been a challenge for pork producers. Typically, strict biosecurity programs are put into effect on pig farms to maintain the health and welfare of the swine and to protect the farmer s financial interests. Renewable energy scientists from the University of Minnesota West Central Research and Outreach Center (WCROC) followed the biosecurity protocols for all commercial facilities and complied with any adjustments throughout the monitoring period. Most breed-to-wean, nursery, and finishing facilities are operated on a continuous basis, therefore they always contain pigs of different ages and weights. To combat the spreading of diseases and sicknesses through a production system, producers follow an All-In/All-Out (AIAO) production method which involves grouping pigs of similar age and weight together. Pigs are farrowed in specific rooms. Weaned pigs from each specific room are kept together and moved to a nursery room and eventually to a finishing room without commingling pigs from other rooms. Marketing is done one room at a time, and rooms are pressure washed and disinfected between groups of pigs to minimize the transmission of disease and sickness (Clark et al., 1995) Data collection In each swine facility, data were collected from two general categories of energy used in pork production: electrical energy and thermal energy provided by heating fuel (propane or natural gas) Electrical energy In this study, we measured energy of loads directly related to the pigs. However, to determine if an adequate amount of these loads were being monitored, researchers compared the monthly data recorded by sensors located in the barn (in kilowatt hours) to the electricity provider s billed kilowatt hours used per month. In some facilities where the collected data were not representative of the entire barn, we measured loads that were not directly related to pigs, such as outbuildings not related to the production units, but powered from the same utility meter. Researchers monitored these circuits separately to subtract the usage of these outbuilding loads from the swine barn data. For BWA and BWB, gilt development units (GDUs) were added in 2015 after monitoring of the barns began. A GDU supports breed-to-wean units but is not directly involved in weaned pig production. So, electrical and thermal energy used in these units was subtracted from the total use of the breed-to-wean barns. Stand-alone HOBO (HOBO UX M, Onset Computer Corporation, Bourne, MA) data loggers were installed to monitor key individual electric loads. These loads were chosen based on categories known to consume the most energy (e.g. ventilation fans, heat lamps, feed lines) and other loads that are representative of swine production systems (see Table 2). Electrical energy monitoring required access to the barn s circuit breaker boxes to install the data loggers and apply current sensors to specific loads. No wiring was added or altered, and the current sensors simply snapped around existing electrical wiring (Figure 4). CR Magnetic CR , 20, and 50 ampere (amp) sensors (CR Magnetics, St. Louis, MO) were connected to input adapter cables (CABLE-ADAP10, Onset Computer Corporation, Bourne, MA) using wire nuts and were then plugged into one of the 4 available channels in the data logger. Magnelab DCT 25, 50, 100, 250, and 500 amp sensors (Magnelab Inc., Longmont, CO) were also used. The Magnelab sensors connected directly to input adapter cables which were then plugged into the data logger. The adapter cables were strung through cable gland joints which were installed on the side of the electrical box and the data loggers attached to the side of the boxes using magnets (Figure 5). The self-powered, split core current sensors generate a 0-5 volts direct current (DC) signal proportional to the input alternating current (AC) current. The output signal is average sensing (as instantaneous power varies from one moment to the next) and calibrated to Root Mean Square (RMS) (CR Magnetics). 6
7 Each data logger was programmed to collect a current reading every 30 seconds and an average recording from each 30 second recording was stored on the logger every 10 minutes. Data was collected using a laptop equipped with HOBOware software (HOBOware Pro Version 3, Onset Computer Corporation, Bourne, MA) and a USB cable connecting the data logger to the laptop. The data were collected monthly and exported from the HOBOware Program into Microsoft Excel (2013). Each 10 minute average value of electric current was converted into power using the power equation described below and multiplied by 1/6 of an hour to determine energy usage in kilowatt hours. The resulting 10 minute average energy usage values were then summed for each load each day to obtain a total energy usage per day. The measured current is used to calculate the power (kilowatts) and energy (kilowatt hours) consumed by the measured load using the following equation (U.S. Department of Energy, 2001): Where: P= Power in watts V= Voltage, line to ground, in volts PP = VV II pphaaaaaa PPPP I= Current, on one phase, in Amperes (Amps) Phase= Number of phases in the circuit, unitless PF= Power Factor, unitless An instantaneous power measurement requires instantaneous measurement of the current and voltage on all phases of the supply lines to every load measured. This would require 6 sensors on a three phase load and would make the number of sensors and data loggers needed for a typical barn cost prohibitive. Several reasonable assumptions were made to simplify the measurement set-up without significantly sacrificing measurement accuracy. In calculating power, it is important that the voltage is measured between one phase line and neutral. The voltage was measured once when the sensors were installed and was considered to remain constant. This is a reasonable assumption since supply voltage changes very little in a properly wired electrical system. Multi-phase loads were assumed to be balanced meaning the same amount of current flows in each phase line. All multi-phase loads measured in the swine barns were AC motors which, theoretically, produce balanced loads. Assuming balanced loads means only one current sensor is required for each load and that the measured current is multiplied by the number of phase lines to calculate the total current. The final element in the power equation is the power factor (PF) which varies between zero and one. A purely resistive load like a heating element or incandescent light bulb has a power factor equal to one. An AC motor has a power factor that varies with the load on the motor; higher loading produces a higher power factor. The power factor accounts for the fact that some of the supplied power to a motor is not consumed by the motor, but instead creates the magnetic field that allows the motor to operate. Adding the power factor to the power equation allows the calculation of the power actually consumed by the motor. Operating motors at a low power factor is undesirable, so motors are typically sized so they are at least 70% loaded under normal conditions. A study by the U.S. Department of Energy (U.S. Department of Energy, 1997) shows that a typical motor loaded between 70% and 100% of its rated load will operate with a power factor generally between 80% and 90%. For this study the power factor of all motor loads was set at 85%. These assumptions allow a reasonable estimate of power consumption with a manageable amount of sensor and data logging equipment.. The power factor of loads which had mixed resistive and inductive loads combined into one sensor, for example when measuring a whole electric sub feed panel, were estimated based on the ratio of resistive to inductive loads within the sensor. 7
8 Additionally, as measuring the current on all of the loads in each barn was not feasible, other assumptions were made to compare the utility meter data to data collected by researchers. In each barn in this study, the loads from only one whole room in the facility were measured. There were 2 to 11 identically sized rooms within a facility, each containing identical loads. The data recorded from the loads in the measured room were multiplied by the appropriate number of identical loads in the other rooms in the barn. Pig flow through each barn is a continuous process with each period or turn occurring multiple times per year in each room. Therefore, the energy used by each load in a monitored room is representative of all other similar rooms in the facility on an annual basis even though the actual size and weight of pigs is not the same in each room at any given time. Thirty four total data loggers were installed and 133 total loads were monitored across all 6 commercial swine barns (Table 2). The shaded loads are categories that were monitored across all six barns. Table 2. Loads measured across all commercial barns Electric Loads BWA BWB NBA NBB FBA FBB Feed Motors/Augers X X X X X X Lights X X X X X X Ventilation/Stirring Fans X X X X X X Pit Fans X X X X X X Manure System a X X Pig Heater Fans X X X X X X Well X X X X X Cooling Cell X Pressure Washer X X X X X X Actuators b X X Curtains X Heat Lamps X X Water Heater X X X Generator Heat/Controls c X X X Office/Mechanical X X X X X X Controller X X Gilt Developer X X Miscellaneous Loads d X X a Comprised of under-slat scrapers, lift pumps, and water pump b Feed system actuator for movement of feed down a feedline c Comprised of generator engine block heater and backup system controls d Examples include hallway heaters and unrelated outbuildings 8


9 Figure 4. Current sensors snapped around different circuits within the circuit breaker panel Figure 5. Data loggers attached to side of electric circuit breaker panel Equipment uses Feed system- actuators are a component of a feedline which control the switching on of motors within the feed system to move feed down the line. Feedline motors and feed auger motors are used to move pig feed from feed bins, down the feedline, and into pig feeders. The horsepower (HP) of these motors typically range from 1/4 HP to 2 HP. Lighting- lighting is used in all areas of a barn. The way lights are used varies across each individual facility due to management practices. Lights might be left on all day in some barns or only used for a short amount of time in other barns. The type of lighting can vary across barns as well. For example, in BWA, compact fluorescent lights (CFLs) were used, whereas light-emitting diodes (LEDs) were used in BWB. Ventilation- one of the most important components of all pig barns, mechanical ventilation can include different types of fans which can serve different purposes. Ventilation systems are used to control the moisture and heat produced by the animals in the barn. In addition, ventilation systems remove air contaminants produced from manure, feed, and the pigs themselves (Jacobson, 2004). Basket/stirring fans are typically hung inside a room and are used for supplemental cooling and air distribution. Pit fans are mounted on manure pit access ports of deep-pitted barns to remove gases generated by manure. Pit fans are typically used for minimum ventilation. Wall/exhaust fans are used to exchange the desired amount of air in a pig housing unit (Jacobson, 2004). The primary function of a cool cell is to cool the pigs, and air needs to be drawn through the cool cell by ventilation fans. Therefore, cool cells are part of a ventilation system. Cooling cells work by evaporating water into incoming air which decreases the incoming air temperature. Manure system- there are different ways in which producers manage their manure. Monitoring in this study included underslat manure scrapers, which push the manure into a storage system. Water pumps are used to flush shallow manure pits into a manure storage system. Lift pumps are used to lift slurry from the facility into a manure storage system. 9
10 Heat (for pigs)- heaters for pig rooms consist of propane, or in some instances, natural gas- fired heaters. The electric load being measured is the heater fan. Pressure washer- pressure washers are used to clean rooms after a group of pigs has left the room. This minimizes the spread of disease and sickness through the production system. Curtains- although this is a form of ventilation, curtain ventilation is different than mechanical ventilation, as buoyancy and wind forces are used to naturally ventilate the barn. Curtains can be adjusted to let more outside air through the barn while using minimal electricity. Heat lamps- as piglets require higher temperatures, especially during the first several days after birth, heat lamps are typically used in breed-to-wean barns to provide supplemental heating. Heat lamps can range from 100 watt bulbs to 250 watt bulbs, depending on management style of the barn. Controllers- controllers in pig barns rely on sensors in the pig rooms to provide optimal environmental conditions for pigs. Controllers regulate ventilation, heating, and humidity within a room. Office (human use)- office use includes electrical loads such as space heaters, washing and drying machines for clothes, refrigerators, computers, stoves, lighting, bathroom and shower rooms, water heaters, etc. Gilt developer- gilt developer units (GDUs) are facilities dedicated to raising replacement females for the sow herd. In the case of both breed-to-wean barns in this study, GDUs were located on the same site. However, the GDUs were managed separately from the breed-to-wean units and could therefore be monitored separately from the sow unit. Miscellaneous loads- miscellaneous loads included hallway heaters and lights, workrooms, storage rooms, etc Thermal energy For the purpose of this study, data from both electrical and heating fuel consumption was obtained. Heating fuel consumption was obtained from the producer s records and receipts from gas utility companies. Each of the six commercial buildings used propane to heat their buildings and pressure wash. However, BWA and NBA switched from propane to natural gas during the summer of 2016 and FBB used diesel for pressure washing. At each swine facility, propane tank fill reports and natural gas consumption reports were obtained from the producers and analyzed to observe monthly and yearly use. Due to fluctuations of oil prices throughout the year and variations in costs to each barn, the yearly average price of propane across the six commercial barns was $1.21 per gallon in 2015 and $1.20 per gallon in These costs were used to calculate the cost of propane per pig produced Pig inventories Monthly pig inventories were reported by each producer, because these numbers can drastically affect energy used in the barn and help in identifying daily routines in the barn. Pig production records were also collected to calculate amount of energy (both electric and thermal) used to produce one pig from each phase of production. 3. RESULTS AND DISCUSSION The objective of this commercial swine energy monitoring task was to understand how much energy is used to produce weaned piglets, feeder pigs, and market weight hogs, and to determine where, specifically, that energy is used within each production stage. This energy use data can then point to areas where both cost and energy consumption might be reduced Breed-to-Wean Barn A and Breed-to-Wean Barn B (BWA and BWB) 10
.")
11 Electric and thermal energy was calculated using $.10/kWh for both years (average price per kwh across the Midwest) and $1.21/gal in 2015 and $1.20/gal in 2016 (using the average price per gallon across all units in this study). The kwh used per pig and the associated costs per pig remain fairly constant over the course of both 2015 and 2016 (Table 3). This can be expected, as electricity is used to maintain production and facility management throughout the building and to power fixed and constant loads. Both facilities used comparable amounts of electrical energy to produce one weaned piglet, regardless of barn size and structure. Commented [KTS1]: The data for BWB is found taking the utility meter data and generator produced data, MINUS the house/shop data logger data AND the GDU data measured by data loggers. From January 2015 to April 2015, the house/shop use was estimated simply using the average of all the months data we have so far on the house/shop (May 2015 through May 2016), as there really wasn t any specific seasonal correlation to the data. The daily average electricity distribution across loads in BWA and BWB is shown in Figures 6 and 7. The largest electric load across both units were heat lamps followed by miscellaneous loads. Heat lamps accounted for about 50% of the total electricity used in each facility. Miscellaneous loads are the difference between the facility utility electric meter and the total of all loads monitored during this study. As these breed-to-wean units were extensive in size and complexity, it was simply not feasible to have sensors installed on every single load within the unit. Loads in the miscellaneous category are comprised of loads not directly related to pig care such as hallway heaters and lights, workroom heaters and lights, storage rooms, etc. Table 3. Electric and thermal consumption and total costs per weaned pig produced across both BWA and BWB in 2015 and Year 2015 Barn Total pigs weaned Total electricity used by facility (kwh) kwh/ pig $ electricity/ pig Total propane used by facility (gal.) Gal. propane/ pig $ propane/ pig Total therms natural gas used by facility Therms natural gas/ pig $ natural gas/ pig Total energy cost/pig BWA 57, , $ , $0.41 X X X $1.55 BWB 85,874 1,045, $ , $0.38 X X X $1.60 BWA 58, , $1.13 4, $0.09 4, $0.07 $ BWB 89,469 1,043, $ , $0.36 X X X $1.53 *In August 2016, BWA transitioned heating fuels from propane to natural gas. The natural gas lines and meter which supplied fuel to the unit also supplied natural gas to the onsite GDU. There was no way to separate out natural gas supplied to the GDU, so these values are included in the 2016 natural gas usage and cost for BWA. Figures 6 and 7. The average daily electricity use across electrical loads in BWA and BWB Nursery Barn A and Nursery Barn B (NBA and NBB) Electric and thermal energy 11

12 The kwh used per pig and the associated costs per pig remain fairly constant over the course of both 2015 and 2016 (Table 4). This can be expected, as electricity is used to maintain production and facility management throughout the building and to power fixed and constant loads. Both facilities used comparable amounts of electrical energy to produce one weaned piglet regardless of barn structure and, most notably, regardless of the fact that NBB was 4 times as large as NBA. Table 4. Electric and thermal consumption and total costs per feeder pig produced across both NBA and NBB in 2015 and Year Barn Total feeders produced Total electricity used by facility (kwh) kwh /pig $ electricity / pig Total propane used by facility (gal.) Gal. propane / pig $ propane / pig Total therms natural gas used by facility Therms natural gas/ pig $ natural gas/ pig Total energy cost/pig NBA 19,596 44, $0.23 8, $0.52 X X X $0.75 NBB 71, , $ , $0.53 X X X $0.75 NBA 18,609 46, $0.25 4, $0.27 4, $0.24 $0.76 NBB 71, , $ , $0.45 X X X $0.65 The daily average electricity distribution across loads in NBA and NBB is shown in Figures 8 and 9. The largest electric load across both units was ventilation, which used about 40% of the electricity used by the whole unit. Miscellaneous loads used the second-most amount of electrical energy. Specifically, in NBA, there was an additional shed onsite which contained several smaller electrical loads and a back-up generator equipped with an engine block heater. Monitoring an engine block heater at another site revealed that a block heater can use a significant amount of electricity- up to 36 kwh per day. Figures 8 and 9. The average daily electricity use across electrical loads in NBA and NBB Finishing Barn A and Finishing Barn B (FBA and FBB) Electric and thermal energy In comparing FBA and FBB (Table 5), a relatively large difference is seen in the electrical use of each barn. As FBA was a tunnel-ventilated barn and FBB was a curtain-sided barn, FBA was expected to use (proportionally) more electrical energy 12
13 than FBB due to the increased ventilation requirements. There was also a slight rise in the amount of electricity used at FBB from 2015 to This can be attributed to the fact that during 2016, the pigs entered the barn at a lower weight which required heater fans to be used more to provide adequate heating for the smaller pigs. Another reason FBB saw a rise in electricity use was because from May 2015 to March 2016, one pit fan motor was not working. When the fan was fixed in March 2016, a rise in ventilation occurred. Comparing propane use of FBA and FBB in Table 5, FBB used slightly more propane per market pig than in FBA. This result was expected due to the fact that FBB was a curtain-sided barn, meaning there is typically less insulation on the curtains than there would be on a solid-walled barn such as FBA. Another result to note is that propane use in FBB was higher during 2016 than Again, propane use increased due to the fact that the pigs in this barn were placed in FBB when they were at a lower weight compared to The smaller pigs therefore required more heating to maintain pig performance and comfort. Table 5. Electric and thermal consumption and total costs per finished pig produced across both FBA and FBB in 2015 and Year Barn Total Market Hogs produced Total electricity used by facility (kwh) kwh/pig $ electricity/ pig Total propane used by facility (gal.) Gal. propane/ pig $ propane/ pig Total energy cost/pig FBA 5,837 90, $1.54 1, $0.30 $1.84 FBB 2,970 9, $ $0.41 $0.72 FBA 6,819 92, $1.35 2, $0.53 $1.88 FBB 2,655 13, $0.52 1, $0.77 $1.29 *FBB used diesel to provide fuel to a pressure washer. As the diesel tank is located on the farm site and is used for other machinery, an estimate of 75 gallons of diesel per year was used by the pressure washer as estimated by the producer. The daily average electricity distribution across loads in FBA and FBB is shown in Figures 10 and 11. The largest electric load across both units was ventilation, which used over 50% of the electricity used by the entire barn. In the case of FBA, there was an additional shed onsite which was powered from the same utility meter. The shed had several smaller electrical loads as well as a generator engine block heater. Through monitoring of an engine block heater on another site, researchers concluded that the block heater may have used a significant amount of electricity- up to 36 kwh per day if running all hours of the day (during winter, for example). We are confident that in both units, electrical energy used directly for the care of the pigs was adequately captured. 13

14 Figures 10 and 11. The average daily electricity use across electrical loads in FBA and FBB. The overarching goal of this study was to provide actual baseline electric and thermal energy consumption within pork production systems in the Upper Midwest. Previous studies have reported energy use within these systems, however, this is the first study of its kind to parcel out individual electric use past the utility meter. This unique aspect allows insight into where electrical energy is specifically being used within each phase of pork production and where there is potential to reduce usage. The findings from this study are comparable to other industry reported measures. Anecdotal evidence from a breed-towean production system of 70,000 sows, indicates average electrical use per weaned pig was 9.7 kwh across the whole system. Units within this system ranged from 5 kwh to 12 kwh per weaned pig, the 5 kwh per weaned pig unit having put various efficiency measures into place. Comparing these industry findings to this study where results ranged from to kwh per weaned pig produced, the findings from this study are comparable with those of the previously mentioned measures. As electric energy was further parceled out among various loads within the breed-to-wean units, the findings of this study point to areas within barns where there is a potential to reduce usage such as in heat lamps, which were found to be the top users of electrical energy by far across breed-to-wean units. Nursery findings from this study are also comparable to other industry measures. Brumm (2015) reported industry measures of about 1.8 kwh and 0.31 gallons of propane per feeder pig produced. These measures are comparable to our findings, which ranged from 2.0 kwh to 2.49 kwh per feeder pig produced and from 0.38 to 0.44 gallons of propane per feeder pig produced. Finishing industry measures from Brumm, (2015) also report 11.2 kwh per finished pig produced in a tunnel-ventilated unit. Our findings, which ranged from kwh to kwh per finished pig produced in FBA, are comparable with the aforementioned measure. The differences may arise from several factors such as overventilation (especially during the winter), additional space heating, or geographical location. All barns are unique based on barn size and structure, ventilation systems, manure systems, climate and geographical location and management style. Therefore, it was expected that there may be some differences within this study from unit to unit. However, differences are minimal, and we are fully confident that our results capture an accurate depiction of Midwest pork production units and point to areas with production phases where there is potential to reduce both electric and thermal energy consumption. 14
15 References Barber, E.M., H.L. Classen, and P.A. Thacker Energy use in the production and housing of poultry and swine- an overview. Can. J. Anim. Sci. 69: Brumm, M Production Contracts [PowerPoint slides]. Retrieved from personal source. Clark, K., C. Hurt, K. Foster, J. Hale Positioning your pork operation for the 21 st century- Chapter Nine: All-In/All-Out Production. Purdue University Cooperative Extension Service, West Lafayette, IN. Accessed May 24, FAO, 2006a. Livestock a major threat to the environment. Food and Agriculture Organization of the United Nations, Rome, Italy. Accessed July 19, FAO, 2006b. World Agriculture: Towards 2030/2050, Interim Report. Food and Agriculture Organization of the United Nations, Rome, Italy. FAOstat, United Nations Food and Agriculture Organization Statistical Databases and Datasets. Accessed July 19, Jacobson, L.D. (2004). Mechanical Ventilation for Pig Housing. Retrieved from Lammers, P.J., M.D. Kenealy, J.B. Kliebenstein, J.D. Harmon, M.J. Helmers, and M.S. Honeyman Energy use in pig production: An examination of current Iowa systems. J. Anim. Sci. 90: McMichael, A.J., J.W. Powles, C.D. Butler, and R. Uauy Food, livestock production, energy, climate change, and health. The Lancet. 370: USDA Quarterly Hogs and Pigs. USDA National Agricultural Statistics Service, Washington, DC. Accessed July 19,
16 U.S. Department of Energy Determining Electric Motor Load and Efficiency. 1st ed. Accessed June 27, U.S. Department of Energy Improving Fan Performance- A Sourcebook for Industry. Accessed June 27,

17 Appendix A.1. Breed-to-Wean Barn A (BWA): BWA Biosecurity Researchers were required to remain out of contact with pigs from other sites for 48 hours and 2 showers before arrival. Protective plastic boots were worn into the facility upon arrival, personnel showered upon entry to the unit, and wore clothing that was provided by the producer. All equipment that was needed by researchers was shipped to the unit at least one week before visiting so that it could sit in isolation before use. A.1.2. Electrical Data The electricity provider of Breed-to-Wean Barn A, Stearns Electric Association (Melrose, MN), provided researchers with daily data taken from the meters. This barn had two meters that fed electricity to the barn, so the data from both meters was added together to obtain a total for the month. This metered total was then compared to the data collected from the installed sensors and data loggers to determine the proportion of total load that was monitored. 17
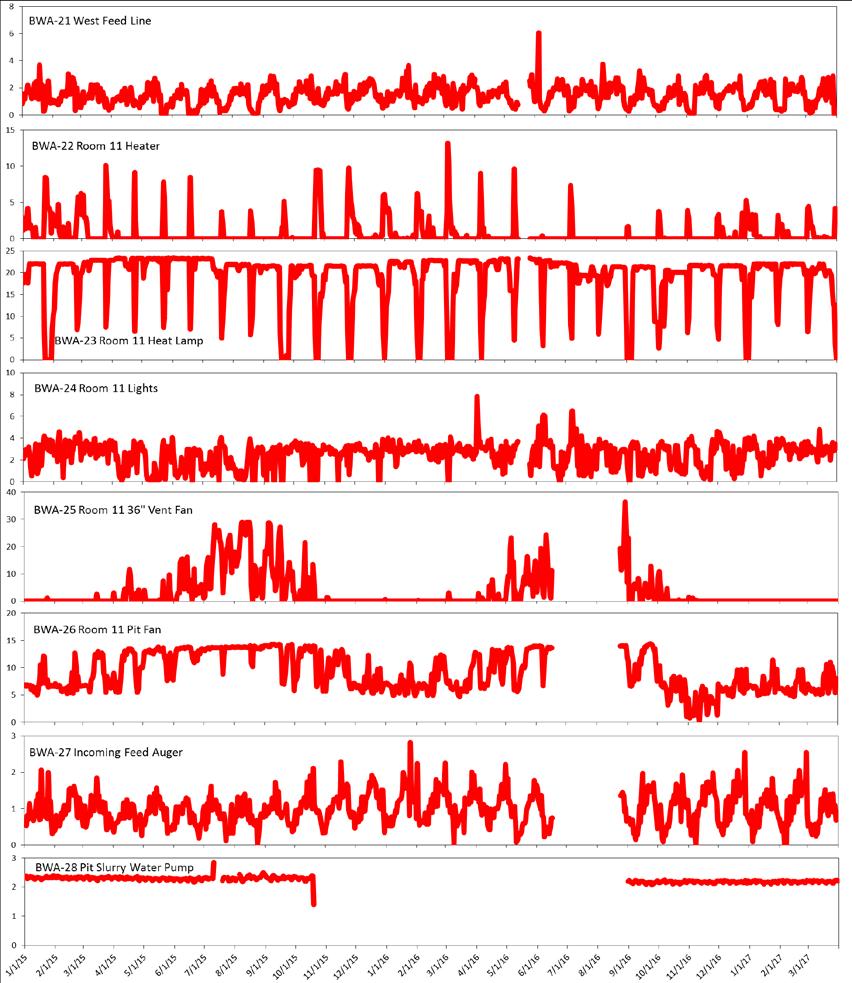
18 Table A1. Breed-to-wean Barn A loads monitored, location of the load, size of the sensor monitoring the load, the sensor name and number, and the data logger ID. Loads that have been starred indicate that the sensor was moved from one load to a different load. Breed-to-Wean Barn A (BWA) Load Description Location of Load Sensor Size (AMPS) Sensor ID Data Logger ID Scraper Motors South Farrowing Rooms 20 BWA-1 Pressure Washer Load Out Room 50 BWA-2 Pressure Washer Load Out Room 50 BWA-3 BWA-D1 *Load Out Unit Heat Load Out Room 20 BWA-4 *Farrowing Room 8 220V Vent Fans South Farrowing Room 8 20 BWA-4 West Heaters South West Gestation 20 BWA-5 Vent Fans South West Gestation 20 BWA-6 Basket Fans South West Gestation 20 BWA-7 BWA-D2 *Scraper Motor South West Gestation 20 BWA-8 *Generator Engine Block Heater Generator 20 BWA-8 Cross Feed Auger South West Gestation 20 BWA-9 Lights South West Gestation 20 BWA-10 Feed Line South West Gestation 20 BWA-11 BWA-D3 Mood Lights South West Gestation 20 BWA-12 Pit Fans Stage 1/2 North Gestation Room 50 BWA-13 Vent Fans Stage 4 & 6-8 North Gestation Room 20 BWA-14 *Feed Actuator North Gestation Room 20 BWA-15 BWA-D4 *Water Heater Office 20 BWA-15 Well Whole Facility (except South Gestation) 20 BWA-16 South Feedline/North Feedline/Cross Auger Farrowing & Gestation 50 BWA-17 Lights North Gestation Room 20 BWA-18 Vent Fans Stage 3-7 & 9-5 North Gestation Room 20 BWA-19 BWA-D5 *Heaters Stage 10 North Gestation Room 20 BWA-20 *Cool Cell North Gestation Room 20 BWA-20 West Feed Line North Farrowing 20 BWA-21 North Farrowing Room 2 Heat North Farrowing Room 2 20 BWA-22 North Farrowing Room 2 Heat Lamps North Farrowing Room 2 20 BWA-23 BWA-D6 North Farrowing Room 2 Lights North Farrowing Room 2 20 BWA-24 North Farrowing Room 2 36" Vent Fan North Farrowing Room 2 20 BWA-25 North Farrowing Room 2 Pit Fan North Farrowing Room 2 20 BWA-26 Incoming Feed Auger North Farrowing 20 BWA-27 BWA-D7 Pit Slurry Water Pump North Farrowing 20 BWA-28 Gilt Developer Unit (GDU) Electric Service GDU 250 BWA-29 GDU Electric Service GDU 250 BWA-30 BWA-D8 GDU Electric Service GDU 250 BWA-31 GDU Electric Service GDU 250 BWA-32 GDU Electric Service GDU 250 BWA-33 BWA-D9 GDU Electric Service GDU 250 BWA-34 18
19 A.1.3. Materials Nine HOBO UX M Data Loggers 24 CR Magnetic CR , 20 amp sensors Four CR Magnetic CR , 50 amp sensors Five Magnelab DCT , 250 amp sensors One Magnelab DCT , 500 amp sensor Nine USB cables 34, 0 to 10V DC input adapter cables 19

20 A.1.4. Data logger and sensor information BWA-4 moved from Load Out Unit Heat to Room 8 220V Vent Fans 20
21 BWA-8 moved from Scraper Motors to Generator Engine Block Heater 21
22 BWA-15 moved from Feed Actuator to Water Heater BWA-20 moved from Stage 10 Heaters to Cool Cell 22
23 23
: BWA-1- Scraper motors (all scraper motors in the S. Farrowing Rooms ) o This sensor had been unplugged from the data logger from 9/10/15 to 11/20/15.")
24 Figure A1. Timeline of sensors from beginning of installation to sensor and data logger removal. Gaps in data represent areas where data was lost due to equipment failure. All data is in kwh. BWA-D1- Entry (installed 11/8/15): BWA-1- Scraper motors (all scraper motors in the S. Farrowing Rooms ) o This sensor had been unplugged from the data logger from 9/10/15 to 11/20/15. However, as this load uses an insignificant amount of energy, the data was estimated to be 0 kwh during this time frame. BWA-2- Pressure washer o This sensor was not reading any usage after the first data collection on 12/15/15, and it was discovered that the circuit was no longer used for the pressure washer. o This sensor was moved to another pressure washer circuit on 12/15/15 at approximately 3:15 PM. 24
25 o On 4/20/15, this sensor came unplugged from the data logger and was not plugged back in until 4/27/15. The missing data was filled in with data from the same sensor earlier in the month, as the pressure washer is used in a cyclical pattern. BWA-3- Pressure washer o This circuit was multiplied by two in the energy calculations, as there were three pressure washers, but only two pressure washers were being monitored. Multiplying this load by two allows for the use of the third pressure washer to be accounted for. o On 2/14/15, at approximately 10:00 AM, the adapter cable on this sensor came unplugged. On 4/27/15, the cable was plugged back in. Therefore, data from 2/14/15 to 4/27/15 is invalid. To estimate the use of the pressure washer, the average daily use was calculated from months with complete data (January, May, and July 2015), and then multiplied by the number of days the pressure washer cable was unplugged (72 days). BWA-4- Load out unit heat until 4/27/15 then sensor was moved to S. Farrowing Room volt fans o On 4/27/15, it was discovered that the data logger had been programmed incorrectly for this sensor- the data logger was programmed to scale BWA-4 as a 50 amp sensor instead of a 20 amp sensor. In the energy calculations, the equation for this sensor was multiplied by 0.4 to correct the scaling issue. o After the sensor was moved to Room volt fans, the data from this load was multiplied by 9, as there were a total of 9 farrowing rooms in the old building, each having the same number of 220 volt fans. BWA-D2- W. South Gestation (installed 12/15/14): BWA-5-West heaters o There were two heaters on this circuit. The data from this circuit was divided by two to obtain the usage of one heater. The remainder was then multiplied by 7 to account for all heaters in the South Gestation rooms (both the west and east sides). BWA-6-Vent fans o 4 of 13 total vent fans in the South West Gestation were being monitored. The data from this load was multiplied by 3.25 to account for all 13 fans in both the west and east sides (3.25 x 4 = 13). BWA-7-Basket fans o 11 basket fans on 2 two phase circuits were being monitored. The data was divided by 11 to obtain the usage of one fan. The remainder was then multiplied by 27 to account for all basket fans in both the west and east sides. BWA-8-Scraper motors until 5/12/15 then the sensor was moved to engine block heater. o When the sensor was monitoring the scraper motors, the data was multiplied by two, as there were two scraper motors in the South Gestation rooms. o When the sensor was moved to the engine block heater, the power factor in the energy calculation was changed to 1, and the calculations were run beginning on 5/12/15. BWA-D3- South West Gestation, (installed 12/15/14): BWA-9-Cross feed auger o The data was multiplied by 2, as the east room had similar augers. BWA-10-Lights o The data was multiplied by 2, as the east room had similar lighting. BWA-11-Feed line o The data was multiplied by 2, as the east room had a similar feed line. BWA-12- Mood lights 25
26 o 20 of 24 bulbs on this circuit were being measured. Therefore, the data was multiplied by 0.2, which was then added back to the original data to account for the 4 unmeasured bulbs. o The total data was then multiplied by 2, as the east room had similar lighting. BWA-D4- N. Gestation, (installed 11/8/14): BWA-13- Pit fans (stage 1 and stage 2) BWA-14- Vent fans (stage 4 and stage 6-8) BWA-15- Feed actuator until 5/12/15, then moved to hot water heater o After the sensor was moved to the hot water heater, the phase and power factor were changed to 1 in the energy calculations. BWA-16- Well o This well fed the whole facility, except for the South Gestation rooms. BWA-D5- N. Gestation, (installed 11/8/14): BWA-17-South feed line/ north feed line/ cross auger BWA-18-Lights o One of seven single circuits was being monitored, so to account for all seven circuits, the energy calculations multiplied the data by 7. BWA-19- Fans (stage 3-7 and stage 9-5) BWA-20- Heaters (stage 10) until 5/12/15, then sensor moved to cool cell o Moving the sensor required changing the power factor to 1 in the energy calculations. BWA-D6- N. Farrowing Room 2 (installed 11/8/15): BWA-21-West feed line o The data from this load was multiplied by two, as there was an east feed line as well that was not monitored. BWA-22- N. Farrowing Room 2 heaters o To scale up data to compare measured data to the utility meter: the data from this load was first divided by two, as there were two heaters on this circuit. The remainder was then multiplied by 17 to account for the total number of heaters in both the old and the new farrowing rooms. BWA-23- N. Farrowing Room 2 heat lamp o This circuit was multiplied by 7 in the energy calculations, as there were 6 additional heat lamp circuits which were used identically. o To scale up data to compare measured data to the utility meter: the monitored circuit had 10 heat lamps on it, so the data from this circuit was divided by 10 to obtain the usage of one heat lamp. The remainder was then multiplied by 424, the total number of heat lamps (farrowing crates) in the whole facility. BWA-24- N. Farrowing Room 2 lights o To scale up data to compare measured data to the utility meter: the data was divided by 28, as there were 28 bulbs on this circuit. The remainder was then multiplied by 252, the total number of lights in both the Old and New Farrowing Rooms. BWA-D7- N. Farrowing Room 2 (installed 11/8/15): BWA-25- N. Farrowing Room 2 36 fan 26
27 o To scale up data to compare measured data to the utility meter: there were 3, 36 fans on the measured circuit. There were 12 total 36 fans in the newer farrowing rooms, so the data from this circuit was multiplied by 4 to account for the fans in the other 3 N. Farrowing rooms. BWA-26- N. Farrowing Room 2 pit fan o To scale up data to compare measured data to the utility meter: there was one pit fan on the monitored circuit. Each new farrowing room had one pit fan, so the data was multiplied by four to account for all four N. Farrowing room pit fans. BWA-27- Incoming auger o This load fed all of the new barn, however, the data was multiplied by two, as there was an incoming feed auger in the S. Farrowing rooms that was not being measured. BWA-28- Pit water pump Gilt Developer Unit- data loggers BWA-D8 and BWA-D9 were installed to capture a large portion of energy that would have otherwise been missing. The whole Gilt Developer Unit electric service was being measured, so that it could be accounted for when comparing utility meter data to measured data. BWA-D8- Gilt Developer (GDU) (installed on 5/12/15): BWA-29- Whole GDU electric service BWA-30- Whole GDU electric service BWA-31- Whole GDU electric service BWA-D9- Gilt Developer (GDU) (installed on 5/12/15): BWA-32- Whole GDU electric service BWA-33- Whole GDU electric service BWA-34- Whole GDU electric service Figure A2. Total monthly electric usage of BWA as obtained from the facility s electric bill, the total monthly amount of electric usage captured by installed data loggers and sensors, and the percent of electricity measured compared to the metered total. 27

28 Figure A3. The monthly averages of daily energy use by various electrical loads measured at BWA from January 2015 to March It should be noted that there were data logger failures that resulted in data lost from Pressure Washers and Ventilation/Cooling during April and from Heat from May to December. The data that was available is reflected in this figure. Figure A4. The average yearly electricity use ( ) by equipment type in BWA. 28

29 Figure A5. The total number of weaned pigs produced per month and the total electricity use per month for January March 2017 at BWA. 29
 Propane Tank Fill History Reports recorded by the gas utility, Belgrade Cooperative (Belgrade, MN), were collected from the producer and analyzed to represent monthly")
30 A.1.5. Thermal data Figure A6 and A7. Total energy use converted into MMBtu across several larger electrical loads and propane/natural gas consumption in BWA in 2015 and (1 kwh= btu, 1 therm= 91,600 btu) Propane Tank Fill History Reports recorded by the gas utility, Belgrade Cooperative (Belgrade, MN), were collected from the producer and analyzed to represent monthly totals and yearly totals of propane used. Propane was used for both heating and pressure washing at Breed-to-Wean Barn A up until August, 2016, when the barn switched to natural gas. Natural gas records were collected from the natural gas utility, Dooley s Petroleum (Clara City, MN). It is noted that the GDU for BWA is included in the natural gas used in 2016 as it was not possible to separate out use from this unit from the breed-to-wean unit. A.1.6. Additional Information Applies to: the total kwh used in 2015 (658,558 kwh), the total kwh used in 2016 (663,751 kwh), and Figure A5. BWA Monthly Electricity Usage and Pig Production. The loads included in the Miscellaneous category include loads not monitored by the data loggers. These data are found by taking the data obtained from the utility meter and generator produced data, minus the Gilt-Developer Unit (GDU). As monitoring of the GDU did not begin until mid-may 2015, and the GDU started up mid-january 2015, January 2015 to mid-may 2015 GDU data was estimated. As the data appears seasonal, January, February, and March 2015 GDU data were estimated using the average of January, February, and March 2016 GDU data. This average was divided in 2 for January, as the GDU started up midway through Jan To estimate April 2015 GDU data, the average of May 2015 and April 2016 GDU data was used. To estimate the GDU usage from May 1, 2015 to May 13, 2015, the daily average of May 2016 was found and multiplied by 12 days (the number of days missing in May). From November 8, 2016 to November 15, 2016 and from December 14, 2016 to December 28, 2016, the data loggers experienced battery issues and data was not recorded. The data during these times was estimated by using the daily average use from November 2015 for the missing days in November 2016 and the daily average use from December 2015 for the missing days in December

31 A.2. Breed-to-Wean Barn B (BWB): BWB Biosecurity BWB: Researchers were required to remain out of contact with pigs from other sites for 48 hours and 2 showers before arrival. Shoes were left in the designated area, showering in was required, and clothing was provided by the producer. Equipment was required to have had adequate downtime (or days of no contact with pigs outside of the facility) of at least one week and was sanitized both before arrival and upon arrival. A.2.1. Electrical data The electricity provider of Breed-to-Wean Barn B, Agralite Electric Cooperative (Benson, MN), provided researchers with 15 minute data taken from the electric utility meters. The metered data was compiled into daily and monthly data and was then compared to the data collected from the installed sensors and data loggers to determine if an adequate amount of loads were being monitored. 31
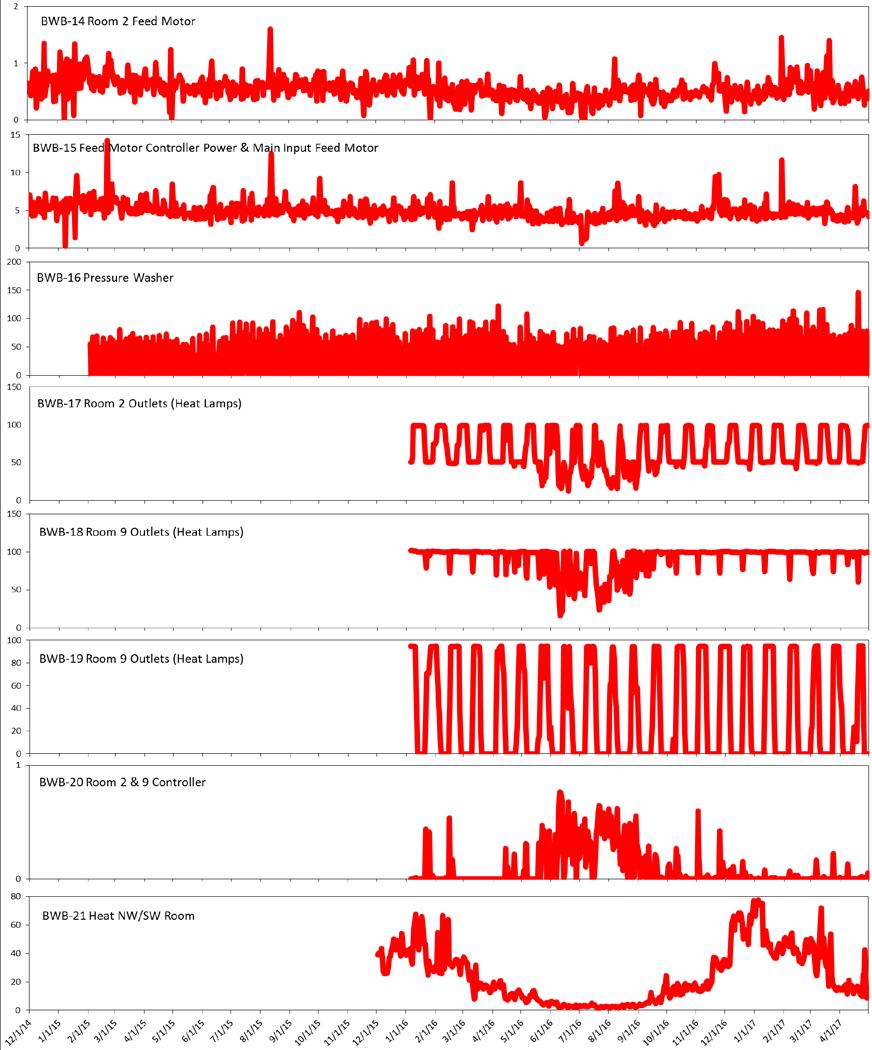
32 Table A2. Loads monitored, location of the load, size of the sensor monitoring the load, the sensor name and number, and the data logger ID. Loads that have been starred indicate that the sensor was moved from one load to a different load. Breed-to-Wean Barn B (BWB) Load Description Location of Load Sensor Size (AMPS) Sensor ID Data Logger ID Lights Gestation Room 20 BWB-1 Feed Motors Gestation Room 50 BWB-2 *Heat Gestation Room 20 BWB-3 *Vent Fans Gestation Room 20 BWB-3 *Heat Gestation Room 20 BWB-3 BWB-D1 *Vent Fans Gestation Room 20 BWB-3 *Heat Gestation Room 20 BWB-3 Vent Fans Gestation Room 50 BWB-4 VS Pit Fans Stage 1/2 Gestation Room 20 BWB-5 Vent Fans Gestation Room 50 BWB-6 VS Pit Fans Stage 1/2 Gestation Room 50 BWB-7 BWB-D2 Vent Fans Gestation Room 50 BWB-8 Farrowing Room 2 Lights Farrowing Room 2 20 BWB-9 Farrowing Room 2 36"/24" Vent Fans/Pit Fans Farrowing Room 2 20 BWB-10 Farrowing Room 2 Outlets (Heat Lamps) Farrowing Room 2 50 BWB-11 *Farrowing Room 2 Heat Farrowing Room 2 20 BWB-12 BWB-D3 *Generator Heater/Off-Peak Controls Generator 20 BWB-12 *Farrowing Room 2 Heat Farrowing Room 2 20 BWB-12 *South Well Whole Facility 50 BWB-13 *South Well & North Well Whole Facility 100 BWB-13 Farrowing Room 2 Feed Motor Farrowing Room 2 20 BWB-14 Main Loop Feed Motor Controller Power & BWB-D4 Main Input Feed Motor Whole Facility 50 BWB-15 Pressure Washer Whole Facility 100 BWB-16 Farrowing Room 2 Outlets (Heat Lamps) Farrowing Room 2 25 BWB-17 Farrowing Room 9 Outlets (Heat Lamps) Farrowing Room 9 25 BWB-18 BWB-D5 Farrowing Room 9 Outlets (Heat Lamps) Farrowing Room 9 25 BWB-19 Farrowing Room 2 & Room 9 Control Panel Farrowing Rooms 2 & 9 25 BWB-20 Heat NW/SW Room Misc. Heating 25 BWB-21 *North Well Whole Facility 25 BWB-22 *Panel 1 Electric Feed Misc. Loads 250 BWB-22 Pressure Washer Room Heater Misc. Heating 25 BWB-23 BWB-D6 *Pressure Washer/Electric Room Lights/Outlets Misc. Lighting 25 BWB-24 *Panel 1 Electric Feed Misc. Loads 250 BWB-24 Gilt Developer Unit (GDU) Electric Service GDU 250 BWB-25 Gilt Developer Unit (GDU) Electric Service GDU 250 BWB-26 BWB-D7 Gilt Developer Unit (GDU) Electric Service GDU 250 BWB-27 Gilt Developer Unit (GDU) Electric Service GDU 250 BWB-28 House & Shop House & Shop 250 BWB-29 House & Shop House & Shop 250 BWB-30 Office Electric Subpanel #1 Office & Farrowing Room BWB-31 BWB-D8 Office Electric Subpanel #1 Office & Farrowing Room BWB-32 32
33 A.2.2. Materials Eight HOBO UX M Data Loggers 7 CR Magnetic CR , 20 amp sensors 8 CR Magnetic CR , 50 amp sensors 5 Magnelab, DCT , 25 amp sensors 2 Magnelab, DCT , 100 amp sensors 10 Magnelab, DCT , 250 amp sensors Seven USB cables 32, 0 to 10V DC input adapter cables A.2.3. Data logger and sensor information All data loggers in this facility, except BWB-D8, were programmed incorrectly, scaling each sensor from 10 volts to the maximum sensor output, instead of from 5 volts to the sensor output. Therefore, in the energy calculations, each equation that was tailored to each sensor was divided by 3000 instead of the typical 6000, in order to correct for the incorrect scaling. It was decided to simply correct for the error in the energy calculations, rather than restart and reprogram each logger, which would cause some data to be lost. Below is the equation used in the energy calculations: VVVVVVVVVV xx AAAAAAAA xx pphaaaaaa xx pppppppppp ffffffffffff kkkkh =
34 BWB-3 moved from Heat to Vent Fans twice during study 34

35 BWB-12 moved from Room 2 Heat to Generator Heater and Controls and back to Room 2 Heat BWB-13 moved from South Well to incorporate the North Well as well 35
36 36
37 BWB-22 moved from North Well to Panel 1 Electric Feed 37
: Data loggers BWB-D1 and BWB-D2 were monitoring loads in the facility s Gestation Room.")
38 Figure A8. Timeline of sensors from beginning of installation to sensor and data logger removal. Gaps in data represent areas where data was lost due to equipment failure. All data is in kwh. BWB-D1- Gestation Room (installed 11/18/14): Data loggers BWB-D1 and BWB-D2 were monitoring loads in the facility s Gestation Room. This room was one large air space, which housed gestating sows in both individual crates and group pens. Data logger BWB-D1 experienced battery issues and data was lost from this logger from 10/28/15-12/1/15. BWB-1- Gestation Room lights o The data from this sensor was multiplied by 2, as only 3 of 6 total two phase circuits were being measured. BWB-2- Gestation Room feed motors o The data from this sensor was multiplied by 2 as only 3 of 6 total two phase circuits were being measured. BWB-3- Gestation Room heaters until 3/30/15, then moved to Gestation Room vent fans on 3/30/15. o While the sensor was on the Gestation Room heaters, the data was multiplied by 4, as only 2 of 8 two phase circuits were measured. BWB-4- Gestation Room vent fans BWB-D2- Gestation Room (installed 11/18/15): BWB-5- Gestation variable speed pit fans, stage 1&2 BWB-6- Gestation vent fans BWB-7- Gestation variable speed pit fans, stage 1&2 BWB-8- Gestation vent fans 38 Figure X. Timeline of sensors from beginning of installation to end. Gaps in data represent areas where data was lost due to battery issues
39 Data loggers BWB-D3 and BWB-D4 were monitoring loads in one of the facility s farrowing rooms, Farrowing Room 2. There were 11 total farrowing rooms in the building with 48 farrowing crates in each room. Farrowing Room 11 was half the size of the other rooms, with 24 farrowing crates. The farrowing rooms housed gestating sows approximately five days before farrowing and lactating sows and piglets for 21 days after farrowing. To scale up data to compare measured data to the utility meter: electricity for Farrowing Room 11 was fed by Office Subpanel #1, which was a subpanel that fed all of the office loads plus Farrowing Room 11. Office Subpanel #1 was monitored by data logger BWB-D8. In order to obtain the usage for Farrowing Room 11, each of the loads specific to Farrowing Room 2 were divided in half, and the remainder was then added to the Farrowing Room 2 loads and also subtracted out from the monthly totals obtained by data logger BWB-D8. For example: the monthly total of Farrowing Room 2 lights was divided by two to obtain Farrowing Room 11 s light usage. This remainder was subtracted from the Office Subpanel #1 loads and then added back on to Farrowing Room 2 lights. Commented [ESB2]: I cannot follow this. BWB-D3- Farrowing Room 2 (installed 11/18/14): BWB-9- Farrowing Room 2 lights o To scale up data to compare measured data to the utility meter: All loads specific to Room 2 were first divided by 2, to obtain the usage of Farrowing Room 11. The remainder was then added back to Room 2 lights and subtracted from BWB-31 and BWB-32. After dividing the data for Room 2 lights by 2, the total of BWB-9 was multiplied by 10, as there were 10 other farrowing rooms that were identical to Room 2. BWB-10- Farrowing Room 2 36 and 24 vent fans and pit fans o All loads specific to Room 2 were first divided by 2, as the 11 th farrowing room was half the size of Room 2. The remainder was then added back to Farrowing Room 2 and subtracted from BWB-31 and BWB-32. o After dividing the data by 2, the monthly total was multiplied by 10 to account for the fans in all 10 identical farrowing rooms. BWB-11- Farrowing Room 2 outlets (heat lamps) o All loads specific to Room 2 were first divided by 2, as the 11 th farrowing room was half the size of Farrowing Room 2. The remainder was then added back to Farrowing Room 2 and subtracted from BWB-31 and BWB-32. o After dividing the monthly total by 2, the data was multiplied by 10 to account for all of the outlets in the other 10 identical farrowing rooms. o After being multiplied by 10, the product was then multiplied by 2, as only 4 of 8 total single phase outlet circuits were being measured. BWB-12- Farrowing Room 2 heat until 4/30/15, then moved to generator heater and off-peak controls until 2/9/16 when it was moved back to Farrowing Room 2 heat. o When the sensor was on Farrowing Room 2 heat, the data was divided by 2 to obtain the usage for Farrowing Room 11. o After the Farrowing Room 2 heat data was divided by two, the original data total was multiplied by 10 to account for all of the other same-sized rooms. o After the sensor was moved to generator heaters and off-peak controls, the phase was changed in the energy calculations to two phase, and the power factor was changed to 1. BWB-D4- Farrowing Room 2 and misc. (installed 11/18/14): BWB-13-South well o There was a north well as well, so the data was multiplied by two in the energy calculations to obtain the usage for both identical wells up until 12/1/15 when sensor BW6-22 was installed on the north well. 39
40 o On 1/4/16, the north well was added to sensor BWB-13, to free up a sensor for placement on an additional load. BWB-14- Farrowing Room 2 feed motor o All loads specific to Farrowing Room 2 were first divided by 2, as the 11 th farrowing room was half the size of Farrowing Room 2. The remainder was then added back to Farrowing Room 2 and subtracted from BWB-31 and BWB-32. o After the data was divided by two to obtain the usage of Farrowing Room 11, the data was multiplied by 10 to account for all 10 rooms. BWB-15- Main loop feed motor controller power and main input feed motor from bins BWB-16- Pressure washer (sensor installed on 2/1/2015) BWB-D5- Farrowing Room 2 and 9 (installed 1/4/16): BWB-17- Farrowing Room 2 Outlets (Heat Lamps) BWB-18- Farrowing Room 9 Outlets (Heat Lamps) BWB-19- Farrowing Room 9 Outlets (Heat Lamps) BWB-20- Farrowing Rooms 2 and 9 Control Panel BWB-D6- Miscellaneous (installed 12/1/15): BWB-21- Heat NW/SW room BWB-22- North well BWB-23- Power washer room heater BWB-24- Power washer and electric room lights and outlets BWB-D7- Gilt Developer Unit (installed 8/7/15): BWB-25- Gilt developer electric service 2A (from automatic transfer switch 2) BWB-26- Gilt developer electric service 2B ( from ATS2) BWB-27- Gilt developer electric service 3A (from ATS3) BWB-28- Gilt developer electric service 3B (from ATS3) BWB-D8- Main Panel (installed 4/30/15): This data logger was programmed correctly, scaling each sensor from 5 volts to the maximum sensor output. Therefore, in the energy equations, each equation that was tailored to each sensor was divided by 6,000, to factor in time into the equation. VVVVVVVVVV xx AAAAAAAA xx pphaaaaaa xx pppppppppp ffffffffffff kkkkh = 6000 BWB-29- House and Shop o This load was monitored so that it could be subtracted out from the metered data, as this load was not related to swine production. BWB-30- House and Shop o This load was monitored so that it could be subtracted out from the metered data, as this load was not related to swine production. BWB-31- Office Subpanel #1 (this includes Farrowing Room 11 ) 40

41 o This subpanel fed the office of BW6 and Farrowing Room 11. Therefore, the loads monitored in Farrowing Room 2 that were identical to all farrowing rooms were divided in half, as Farrowing Room 11 was half the size of Farrowing Room 2. The loads were then subtracted out from the office subpanel and added back to the farrowing loads. BWB-32- Office Subpanel #1(this includes Farrowing Room 11 ) o This subpanel fed the office of BW6 and Farrowing Room 11. Therefore, the loads monitored in Farrowing Room 2 that were identical to all farrowing rooms were divided in half, as Farrowing Room 11 was half the size of Farrowing Room 2. The loads were then subtracted out from the office subpanel and added back to the farrowing loads. Figure A9. Total monthly electric usage of BWB as obtained from the facility s electric bill, the total monthly amount of electric usage captured by installed data loggers and sensors, and the percent of electricity measured compared to the metered total. 41
42 Figure A10. The monthly averages of daily energy use by various electrical loads measured at BWB from January 2015 to April It should be noted that there were data logger battery issues during all years that resulted in some data lost for Heat from May to December and data lost from Ventilation in March. The data that was available is reflected in this figure. Thermal Data Figure A11. The average yearly electricity use ( ) by equipment type in BWB. 42
43 Propane Tank Fill History Reports recorded by the gas utility, Dooley s Petroleum (Murdock, MN), were collected from the producer and analyzed to represent monthly totals and yearly totals of propane used. Propane was used for both heating and pressure washing at Breed-to-Wean Barn B. Figure A12. The total average energy use averaged across 2015 and 2016 and converted into MMBtu across several larger electrical loads and propane consumption in BWB. (1 kwh= btu, 1 therm= 91,600 btu) 43
:")
44 A.3. Nursery Barn A (NBA): 44
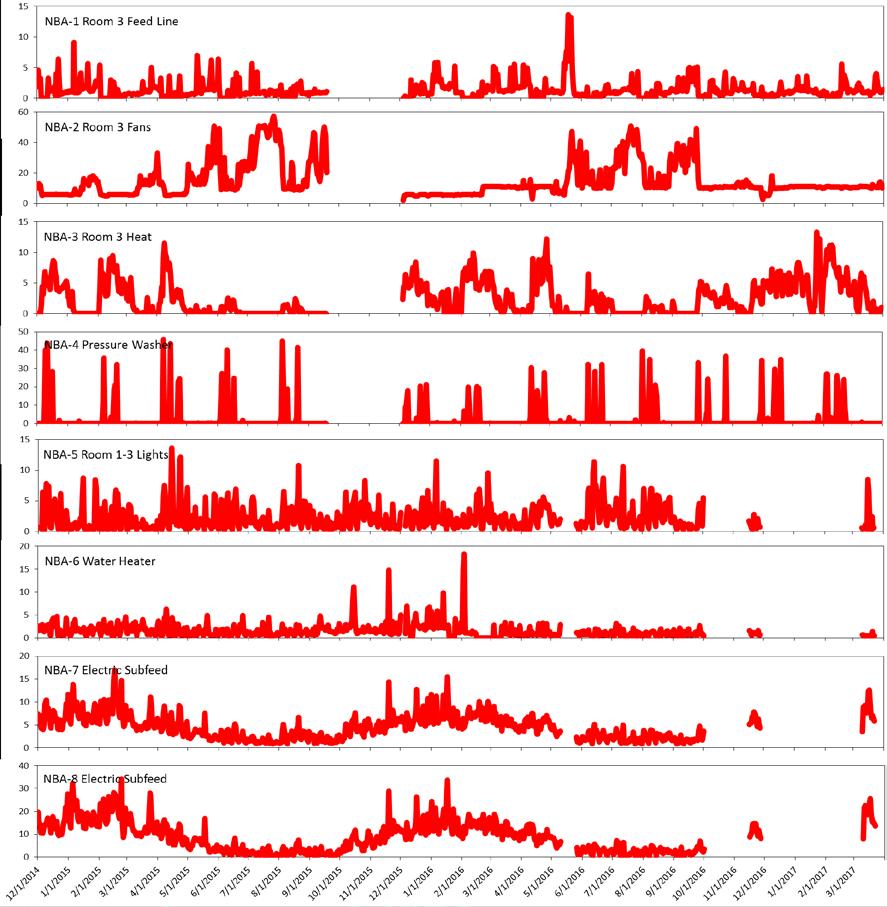
45 NBA Biosecurity Researchers were required to remain out of contact with pigs from other sites for 48 hours and 3 showers before arrival. Personnel put on protective plastic boots provided at the entrance to facility, left shoes with protective boots on in the entrance, and walked through the shower and office areas with socks only. Equipment that was needed in the facility had at least three days of downtime and was sanitized before arrival. A.3.1. Electrical Data The electricity provider of Nursery Barn A, Stearns Electric Association (Melrose, MN), provided researchers with daily data taken from the meters. The monthly metered total was then compared to the data collected from the installed sensors and data loggers to determine if an adequate amount of loads were being monitored. Table A3. Loads monitored, location of the load, size of the sensor monitoring the load, the sensor name and number, and the data logger ID. Nursery Barn A (NBA) Sensor Size Load Description Location of Load (AMPS) Sensor ID Data Logger ID Feed line Room 3 Nursery Room 3 50 NBA-1 Fans Room 3 Nursery Room 3 50 NBA-2 Heat Room 3 Nursery Room 3 50 NBA-3 NBA-D1 Pressure Washer Whole Facility 50 NBA-4 Room 1-3 Lights All Nursery rooms 50 NBA-5 Water Heater Office 50 NBA-6 Electric Subfeed Office 50 NBA-7 NBA-D2 Electric Subfeed Office 50 NBA-8 Cattle Shed Electric Service Outbuilding 250 NBA-9 Cattle Shed Electric Service Outbuilding 250 NBA-10 NBA-D3 Well Whole Site 50 NBA-11 A.3.2. Materials Three HOBO UX M Data Loggers 9 CR Magnetic CR , 50 amp sensors Two Magnelab DCT , 250 amp sensors Three USB cables 11, 0 to 10V DC input adapter cables A.3.4. Data logger and sensor information 45
46 46
47 Figure A13. Timeline of sensors from beginning of installation to sensor and data logger removal. Gaps in data represent areas where data was lost due to battery issues or unplugged cables. All data is in kwh. NBA consisted of three identical rooms, each having the same electrical loads and each having a capacity of 1,000 head. As the rooms were identical, it was determined that the data obtained from the room monitored by the data logger could be multiplied by the total number of rooms in this facility (3) to compare monitored data to metered data. After multiplications, the data was compared to the metered data provided by Stearns Electric Association. NBA-D3 was a data logger that was added in May of 2015 to an additional and unrelated building which was powered from the same meter as the nursery. Monitoring the additional building allows for those data to be subtracted from the metered data to focus solely on the nursery building. NBA-D1- Room 3 (installed 11/8/14): NBA-D1 experienced battery issues from 9/19/15-12/4/15 when a new data logger was made to replace the old. Therefore a significant amount of data was lost during this timeframe. NBA-1- Feed line in Nursery Room 3 o To scale up data to compare measured data to the utility meter- the data from this sensor was multiplied by three to account for feed lines in all three rooms. NBA-2- Fans in Nursery Room 3 o To scale up data to compare measured data to the utility meter- the data from this sensor was multiplied by three to account for fans in all three rooms. NBA-3- Heat in Nursery Room 3 o To scale up data to compare measured data to the utility meter- the data from this sensor was multiplied by three to account for heaters in all three rooms. NBA-4- Pressure washer NBA-D2- Miscellaneous (installed 11/8/14): 47
48 NBA-D2 experienced battery issues from 5/11/16-5/25/16, 10/2/16-11/15/16, and from 11/28/16-12/31/16. Therefore, data from these time periods was lost. NBA-5- All nursery room lights o These light circuits are located in the subfeed which was already being monitored. Therefore, the usage of the light circuits was subtracted from the sub feed total to observe separate usage of the lights. o This adapter cables for this sensor were unplugged from 12/2/15-12/5/16. Therefore, data from these four days is missing. NBA-6- Water heater o This circuit was located in the subfeed which was already being monitored. Therefore, the usage of the water heater circuit was subtracted from the sub feed total in order to observe separate usage of the water heater. o The adapter cables for this sensor were unplugged from 12/2/15-12/5/16. Therefore, data from these four days is missing. NBA-7- Subfeed o The subfeed contained miscellaneous and office circuits. NBA-8- Subfeed o The subfeed contained miscellaneous and office circuits. NBA-D3- Cattle shed (installed 5/23/15): NBA-9- Cattle shed electric service NBA-10- Cattle shed electric service NBA-11- Well o The well fed the whole site and was located in the cattle shed subfeed. Therefore, the usage of the well could not be specifically correlated to swine use, so water for pigs in NBA was not accounted for. 48
49 Figure A14. Total monthly electric usage of NBA as obtained from the facility s electric bill, the total monthly amount of electric usage captured by installed data loggers and sensors, and the percent of electricity measured compared to the metered total. The drastic decrease in percent of electricity recorded during the fall of 2015, May 2016, October-March 2017 can be attributed to data loggers experiencing battery issues. Another reason overall as to why the percent measured was not higher was due to the fact that there was a generator shed on the site that could not feasibly be measured. This shed contained a 1,500 watt block heater (which could have potentially used 1,000 kwh per month). 49
50 Figure A15. The monthly averages of daily energy use by various electrical loads measured at NBA from January 2015 to March No data is estimated. Ventilation and heating use was as expected, with ventilation usage higher in the summer and heater fan use higher during the winter. Other loads such as the pressure washer were not used every month and were only used when rooms needed to be cleaned. The lighting usage reflects when the building was used more- during cleaning and when transitioning pigs. Figure A16. The average yearly electricity use ( ) by equipment type in NBA. 50

51 Thermal Data Propane Tank Fill History Reports obtained from the gas utility, Belgrade Cooperative (Belgrade, MN), were collected and analyzed to represent monthly totals and yearly totals of propane used. Propane was used for both heating and pressure washing at Nursery Barn A. During August 2016, NBA switch over from propane to natural gas. The natural gas bills were obtained from the supplier, Dooley s Natural Gas (Clara City, MN), and were collected and analyzed to represent monthly natural gas total use. Figure A17 and A18. Total energy use converted into MMBtu across several larger electrical loads and propane/natural gas consumption in NBA in 2015 and (1 kwh= btu, 1 therm= 91,600 btu) 51
:")
52 A.4. Nursery Barn B (NBB): 52
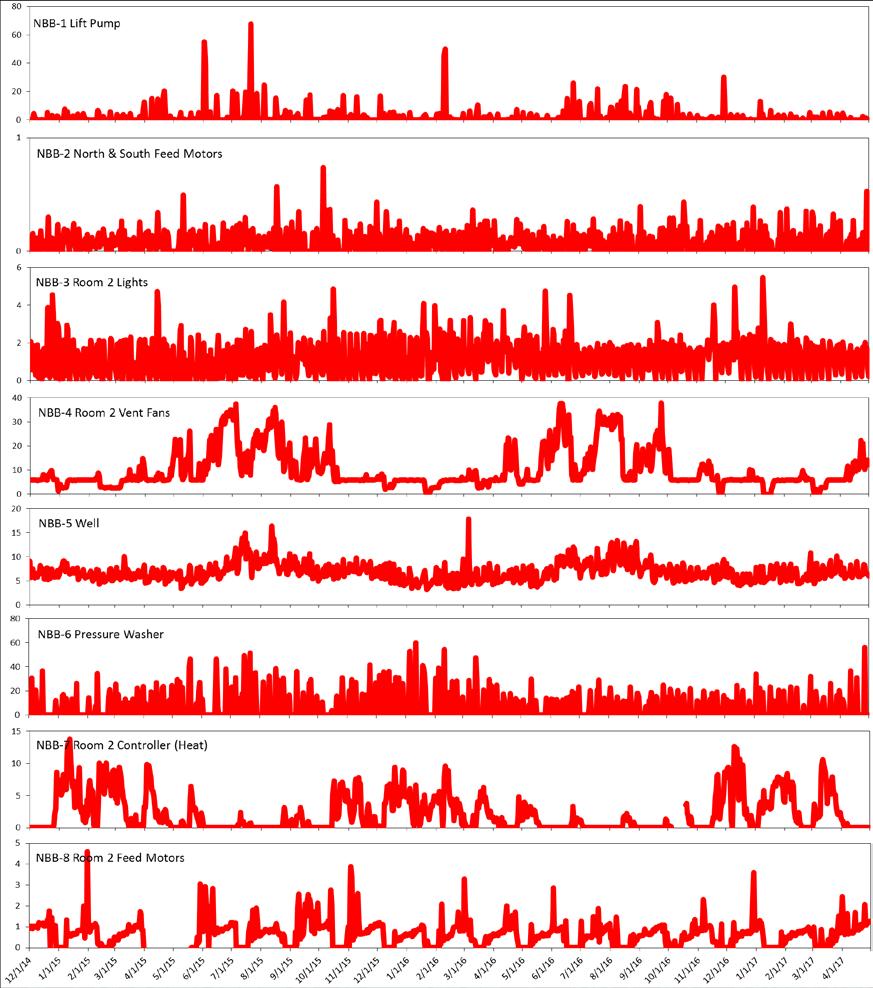
53 NBB Biosecurity Researchers were required to remain out of contact with pigs from other sites for 48 hours and 2 showers before arrival. Shoes were left in the designated spot, researchers showered in to the facility and wore clothing provided by the producer. All equipment needed by researchers had at least 48 hours of downtime and was sanitized before arrival and upon arrival. A.4.1. Electrical data The electricity provider of Nursery Barn B, Agralite Electric Cooperative (Benson, MN), provided researchers with 15 minute data taken from the meters. The metered data was compiled into daily and monthly data and was then compared to the data collected from the installed sensors and data loggers to determine if an adequate amount of loads were being monitored. Table A4. This table represents loads monitored, location of the load, size of the sensor monitoring the load, the sensor name and number, and the data logger ID. Loads that have been starred indicate that the sensor was moved from one load to a different load. Nursery Barn B (NBB) Load Description Location of Load Sensor Size (AMPS) Sensor ID Data Logger ID Lift Pump Whole Facility 50 NBB-1 North & South Feed Motors Whole Facility 50 NBB-2 Room 2 Lights Nursery Room 2 10 NBB-3 NBB-D1 Room 2 Vent Fans Nursery Room 2 50 NBB-4 Well Whole Facility 20 NBB-5 Pressure Washer Whole Facility 50 NBB-6 Room 2 Controller (Heat) Nursery Room 2 50 NBB-7 NBB-D2 Room 2 Feed Motors Nursery Room 2 50 NBB-8 Generator Room Generator 20 NBB-9 *Outside Lights Office 20 NBB-10 *Panel 1 Electric Feed Office 250 NBB-10 *Clothes Dryer Office 50 NBB-11 NBB-D3 *Panel 1 Electric Feed Office 250 NBB-11 Medicine Refrigerator Office 50 NBB-12 Room 9 Fans Nursery Room NBB-13 Room 9 Feed Motors Nursery Room NBB-14 Room 9 & 10 Basket Fans Nursery Rooms 9 & NBB-15 NBB-D4 Room 9 Lights Nursery Room NBB-16 Room 9 Controller/ Acuator/ Heat/ Water Solenoid Nursery Room 9 25 NBB-17 Electric Hallway Heat by Rooms 9 & 10 Hallway 50 NBB-18 Electric Hallway Heat in Entry Office 20 NBB-19 NBB-D5 Unlabeled 60 AMP Circuit Unknown 100 NBB-20 A.4.2. Materials Five HOBO UX M Data Loggers 1 CR Magnetic CR amp sensor 4 CR Magnetic CR amp sensors 6 CR Magnetic CR amp sensors 1 DCT Magnelab 25 amp sensor 3 DCT Magnelab 50 amp sensors 4 DCT Magnelab 100 amp sensor 2 DCT Magnelab 250 amp sensors 53
54 Five USB cables 19, 0 to 10V DC input adapter cables A.4.3. Data logger and sensor information 54
55 55
56 NBB-10 moved from Outside Lights to Panel 1 Electric Feed NBB-11 moved from Clothes Dryer to Panel 1 Electric Feed 56
57 Figure A19. Timeline of sensors from beginning of installation to end. Gaps in data represent areas where data was lost due to battery issues or unplugged cables. All data is in kwh. NBB consisted of ten total nursery rooms. Eight of the ten rooms were identical to each other, each having the same electrical loads and each having a capacity of 1,000 head. As the rooms were identical, it was determined that the data obtained from the room monitored by the data logger could be multiplied by the total number of identical rooms in the facility (eight) to compare monitored data to metered data. NBB also had an additional two nursery rooms that were differently sized than the other eight, but were identical to each other. These two rooms had a capacity of 1,200 head each. As these rooms were only identical to each other, the data obtained from one of the rooms was multiplied by two and the 57
58 data was added to the rest of the data from the facility to compare to the metered data provided by Agralite Electric Cooperative. NBB-D1- Room 2 and misc. (installed 11/18/14): NBB-1- Lift pump NBB-2- North and south feed motors NBB-3- Room 2 lights o The data from this sensor was multiplied by 10 up until 7/10/15, when monitoring began on the lights in Room 9. This was to account for the lights in rooms 9 and 10 that went unmeasured until 7/10/15. After 7/10/15, the data was multiplied by 8 (the number of rooms identical to Room 2 ). NBB-4- Room 2 vent fans o The data from this sensor was multiplied by 10 up until 7/10/15, when monitoring began on the fans in Room 9. This was to account for the fans in Room 9 and 10 that went unmeasured until 7/10/15. After 7/10/15, the data was multiplied by 8 (the number of rooms identical to Room 2 ). NBB-D2- Room 2 and misc. (installed 11/18/14): NBB-5-Well NBB-6-Pressure washer o There were two pressure washers in this nursery, so it was programmed in the energy calculations to multiply this data by 2 to account for both pressure washers. NBB-7- Room 2 controller (heat) o This sensor was originally monitoring Room 2 heat, however, it appeared that this circuit was not being used as current was never measured going to this circuit. Therefore, the sensor was moved on 12/18/15 to the Room 2 controller, which was determined to be the circuit supplying power to the heater fans in this room. o The data from this sensor was multiplied by 10 up until 8/6/15, when monitoring began on the controller in Room 9. This was to account for the controller in rooms 9 and 10 that went unmeasured until 8/6/15. After 8/6/15, the data was multiplied by 8 (the number of rooms identical to Room 2 ). NBB-8- Room 2 feed motors o This sensor came unplugged from the data logger on 4/1/15 and was plugged back in on 5/19/15. o The data from this sensor was multiplied by 10 up until 7/10/15, when monitoring began on the feed motors in Room 9. This was to account for the feed motors in rooms 9 and 10 that went unmeasured until 7/10/15. After 7/10/15, the data was multiplied by 8 (the number of rooms identical to Room 2 ). NBB-D3- Miscellaneous (installed 4/1/15, reprogrammed 7/10/15): NBB-9- Generator Room o The generator room included loads such as lights and the generator block heater NBB-10- Outside lights until 7/9/15, then moved to Panel 1 Feed (office lights/ac/heat, hallway lights, hallway heat, hall feed motors) o This data logger was reprogrammed, as the sensor was switched from a 20 amp sensor to a 250 amp sensor o Sensors NBB-1, NBB-2, NBB-9, and NBB-12 were located within the Panel 1 feed. These loads were subtracted from the Panel 1 Feed to obtain separate usage data. NBB-11- Clothes dryer until 7/9/15, then moved to Panel 1 Feed (office lights/ac/heat, hallway lights, hallway heat, hall feed motors) 58
59 o Data logger was reprogrammed, as the sensor was switched out from a 20 amp sensor to a 250 amp sensor o Sensors NBB-1, NBB-2, NBB-9, and NBB-12 are located within the Panel 1 feed. These loads were subtracted out from the Panel 1 Feed to obtain separate usage data. NBB-12-Medicine refrigerator NBB-D4- Room 9 (installed 7/10/15): NBB-13- Room 9 fans o This data was multiplied by 2 to account for Room 10 fans. NBB-14- Room 9 feed motors o This data was multiplied by 2 to account for Room 10 feed motors. NBB-15-Rooms 9 and 10 stirring fans NBB-16- Room 9 lights o This data was multiplied by 2 to account for Room 10 lights. NBB-D5- Room 9 and misc. (installed 8/6/15): NBB-17- Room 9 controller/actuator/heat/h2o solenoid o This data was multiplied by 2 to account for Room 10 loads. NBB-18- Electric heat in hallway near room 9 and 10 NBB-19- Electric heat in entry hallway Figure A20. Total monthly electric usage of NBB as obtained from the facility s electric bill, the total monthly amount of electric usage captured by installed data loggers and sensors, and the percent of electricity measured compared to the metered total. As additional data loggers were added to this facility, the percentage of electricity captured by loggers can be seen to increase. 59
60 Figure A21. The monthly averages of daily energy use by various electrical loads measured at NBB from January March Figure A22. The average yearly electricity use ( ) by equipment type in NBB. 60

61 Thermal Data Propane Tank Fill History Reports recorded by the gas utility, Jerry s U-Save (Morris, MN), were collected from the producer and analyzed to represent monthly totals and yearly totals of propane used. Propane was used for both heating and pressure washing at Nursery Barn B. Diesel from Jerry s U-Save (Morris, MN) is also used at this nursery in an incinerator used for carcass disposal. Figure A23. The total average energy use averaged across 2015 and 2016 and converted into MMBtu across several larger electrical loads and propane consumption in NBB. (1 kwh= btu, 1 therm= 91,600 btu) A.5. Finishing Barn A (FBA): 61
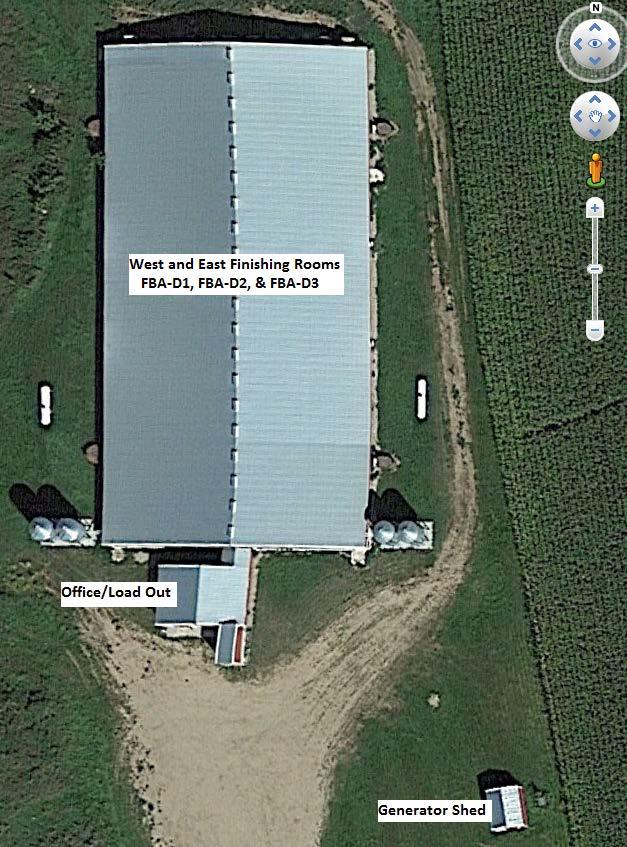
62 FBA Biosecurity 62
63 Researchers were required to remain out of contact with pigs from other sites for 48 hours and 2 showers before arrival. Researchers wore protective plastic boots into barn and made sure all equipment that was needed had at least 48 hours of downtime and was sanitized before arrival. A.5.1. Electrical data The electricity provider of Finishing Barn A, Agralite Electric Cooperative (Benson, MN), provided researchers with daily data taken from the meters. The metered data was compiled into monthly data and was then compared to the data collected from the installed sensors and data loggers to determine if an adequate amount of loads were being monitored. Table A5. Loads monitored, location of the load, size of the sensor monitoring the load, the sensor name and number, and the data logger ID. Loads that have been starred indicate that the sensor was moved from one load to a different load. Finishing Barn A (FBA) Sensor Size Load Description Location of Load (AMPS) Sensor ID Data Logger ID West Feed Augers West Room 20 FBA-1 Well Whole Site 20 FBA-2 West Lights West Room 20 FBA-3 FBA-D1 *West/East Pit Fans West/East Rooms 20 FBA-4 *East 1-36" & 4-54" Wall Fans East Room 20 FBA-4 Pressure Washer Whole Barn 50 FBA-5 *West Heat West Room 50 FBA-6 *Office Outlets Office 50 FBA-6 *Office Heat Office 50 FBA-6 FBA-D2 *West/East 24" Wall Fans West/East Rooms 20 FBA-7 *West/East 24" Wall Fans & West/East Pit Fans West/East Rooms 20 FBA-7 West 1-36" & 4-54" Wall Fans West Room 50 FBA8 West Heat West Room 25 FBA-9 Office Outlets Office 50 FBA-10 West Controller West Room 25 FBA-11 FBA-D3 Water Heater Office 100 FBA-12 A.5.2. Materials Two HOBO UX M Data Loggers Five CR Magnetic CR amp sensors Three CR Magnetic CR amp sensors Two USB cables 8 0 to 10V DC input adapter cables A.5.3. Data logger and sensor information 63

64 FBA-6 Moved from West Room Heat to Office Outlets. West Room Heat then monitored again by FBA-9. FBA-6 Moved from Office Outlets to Office Heat. Office Outlets then monitored again by FBA
65 Figure A24. Timeline of sensors from beginning of installation to end. Gaps in data represent areas where data was lost due to battery issues or unplugged cables. All data is in kwh. FBA consisted of two identical rooms, each having the same electrical loads and each having a capacity of 1,200 head. As the rooms were identical, it was determined that any data obtained from a single room could be multiplied by the total number of identical rooms in the facility (two) to compare monitored data to metered data provided by Agralite Electric Cooperative. However, in some cases, the same loads from each side of this barn were being monitored together, so not all loads are multiplied by two. FBA-D1- West and east rooms (installed on 11/15/14): During the following dates, FBA-D1 experienced battery issues and data was lost: from 11/15/15-12/3/15, 12/20/15-1/22/16, 2/8/16-2/19/16, 3/10/16-4/4/16, 4/22/16-5/4/16, 5/22/16-6/14/16, and from 7/1/16-7/15/16. FBA-1- West feed auger motors o This monthly total consumption was multiplied by 2 after the energy calculations have been run, as the east feed auger was not being monitored. FBA-2- Well o After the first data collection, it was observed that this sensor was not reading any current. The sensor was adjusted and fixed on 12/15/14. Therefore, data is missing from this load from 11/15/14 to 12/15/14. FBA-3- West lights o This load was multiplied by two in the energy calculations, as only two of four single phase circuits were being measured. After the energy calculations were run, the data was again multiplied by two to account for the East Room. FBA-4- West and east pit fans until 9/9/15, then moved to east 1, 36 and 4, 54 vent fans FBA-D2- West and east rooms (installed on 11/15/14): During the following dates, FBA-D2 experienced battery issues and data was lost: from 4/4/16-5/4/16 and from 5/23/16-6/15/16. On 6/15/16, FBA-D2 was replaced with FBA-D3. FBA-5- Pressure washer o The pressure washer adapter cable came unplugged from the data logger between 2/19/15 to 3/13/15. Therefore, data in between these dates is missing. However, this was discussed with the producer, which decided that during these times, the pressure washer was most likely not used, and if it had been used, it would not significantly contribute to the monthly totals. 65
66 FBA-6- West Room heat until 2/19/15, then moved to office outlets (1200W Duraflame heater) until 4/13/15, then moved to office heat (electric wall heat) o The sensor was first installed to monitor the West Room heat (the monthly total was then multiplied by two after the energy calculations had run to account for the use in the East Room ). o On 2/19/15, the sensor was moved to Office Outlets/Outside Office Outlets to capture the use of the office Duraflame heater o On 4/13/15, the sensor was then moved to Office Heat which is electrical heat for the office. The power factor was changed to 1 and the phase became a two phase circuit. FBA-7- West and east 24 wall fans until 9/9/15 then added additional west and east pit fans to the sensor FBA-8- West 1 36 and 4 54 vent fans o The data from this sensor was multiplied by two after the energy calculations to account for the east vent fans up until 9/9/15, when monitoring began on the east vent fans as well. FBA-D3- Miscellaneous (installed on 1/22/16): This data logger was moved to replace FBA-D1 on 7/15/16. So, data from this logger is missing from 7/15/16 until a new data logger was installed on 11/7/16. FBA-9- West heater FBA-10- Office outlets FBA-11- West controller FBA-12- Water heater Figure A25. Total monthly electric usage of FBA as obtained from the facility s electric bill, the total monthly amount of electric usage captured by installed data loggers and sensors, and the percent of electricity measured compared to the metered total. From December 2015 to June 2016, FBA-D1 and FBA-D2 both had issues resulting in a loss of data. 66
67 Figure A26. The monthly averages of daily energy use by various electrical loads measured at FBA from January 2015 to March It should be noted that there were data logger battery issues during both years that resulted in some data lost for Heat/Controller from July to October. The data that was available is reflected in this figure and no missing data was estimated. As was expected, the ventilation loads were high in the summer, with heating loads increasing during the winter. One thing to be noted was that from May 2015 to October 2016, there was a herd of cattle drinking from the same well as the pigs. There was no way to partition off separate use for the pigs versus the cattle. 67
68 Figure A27. The average yearly electricity use ( ) by equipment type in FBA. Thermal Data Propane Tank Fill History Reports obtained from the gas utility, Fauskee Oil Company Incorporated (Brooten, MN), were collected and analyzed to represent monthly totals and yearly totals of propane used. Propane was used for both heating and pressure washing with hot water at Finishing Barn A. Figure A28. The total average energy use averaged across 2015 and 2016 and converted into MMBtu across several larger electrical loads and propane consumption in FBA. (1 kwh= btu, 1 therm= 91,600 btu) 68

69 A.6. Finishing Barn B (FBB): FBB Biosecurity Researchers were required to remain out of contact with pigs from other sites for 48 hours and 2 showers before arrival. Researchers wore protective plastic boots and stepped into a mat containing a disinfectant powder making sure to thoroughly powder the protective boots before entering the facility. All equipment that was needed had at least 48 hours downtime and was sanitized before arrival. A.6.1. Electrical data The electricity provider of Finishing Barn B, Agralite Electric Cooperative (Benson, MN), provided researchers with daily data taken from the meters. The metered data was compiled into monthly data and was then compared to the data collected from the installed sensors and data loggers to determine if an adequate amount of loads were being monitored. Table A6. Loads monitored, location of the load, size of the sensor monitoring the load, the sensor name and number, and the data logger ID. Loads that have been starred indicate that the sensor was moved from one load to a different load. Finishing Barn B (FBB) Load Description Location of Load Sensor Size (AMPS) Sensor ID Data Logger ID Pressure Washer Whole Barn 50 FBB-1 East Lights/Heaters East Room 20 FBB-2 East Receptacles and Curtain East Room 50 FBB-3 FBB-D1 East Fans/Pit Fans East Room 20 FBB-4 East Feed Auger East Room 20 FBB-5 West Fans West Room 50 FBB-6 *Electric Hall Heat Hallway 20 FBB-7 FBB-D2 *West Feed Augers West Room 20 FBB-7 West Pit Fans West Room 20 FBB-8 69
70 A.6.2. Materials Two HOBO UX M Data Loggers Five CR Magnetic CR amp sensors Three CR Magnetic CR amp sensors Two USB cables Eight 0 to 10V DC input adapter cables A.6.3. Data logger and sensor information 70
71 FBB-7 moved from Electric Hallway Heat to West Feed Auger Figure A29. Timeline of sensors from beginning of installation to end. Gaps in data represent areas where data was lost due to battery issues or unplugged cables. All data is in kwh. 71
72 FBB consists of two identical rooms, each having the same electrical loads and each having a capacity of 530 head. As the rooms were identical, it was determined that the data obtained from the room monitored by the data logger could be multiplied by the total number of identical rooms in the facility (two) to compare monitored data to metered data provided by Agralite Electric Cooperative. However, in some cases, the same loads from each side of this barn were being monitored, so not all loads are multiplied by two. From July of 2016 to April 2017, researchers were unable to access this barn. During the time of inaccessibility, both FBB- D1 and FBB-D2 experienced battery issues, and data was lost. FBB-D1- (installed 11/15/14): During the following dates, FBB-D1 experienced battery issues and data was lost: from 7/19/16-12/31/16. FBB-1- Pressure washer FBB-2- East lights and heaters o This circuit fed both the lights and heaters in the East Room o The data was multiplied by two after the energy calculations were run to account for the use of the west lights and heaters. FBB-3- East receptacles and curtain o The data was multiplied by two after the energy calculations were run to account for the use of the west receptacles and curtain. FBB-4- East basket and pit fans FBB-D2- (installed 11/15/14): During the following dates, FBB-D2 experienced battery issues and data was lost: from 12/10/15-1/14/16 and 1/24/16-3/10/16. A new data logger was installed on 3/11/16 to replace the faulty FBB-D2. FBB-5- East feed auger o Although the west feed auger was not monitored until 2/5/16, the east feed auger was not multiplied by two, as this auger had a tendency to become hung up and would run for an excessive amount of time. It was therefore not representative to multiply this load by two. FBB-6- West basket fans o On approximately 5/6/15, FBB was equipped with a new controller. After the controller was installed, the producer had not been able to get the west basket fans to run. FBB-7- Hall electric heat o This load was monitored from 11/15/14-2/5/16. As this load used no electricity between those monitoring dates, the sensor was moved over to the west feed auger on 2/5/16. FBB-7- West feed auger (on 2/5/16) FBB-8- West pit fans o On 5/17/15, the pit fan on the circuit being monitored blew its motor. As this circuit was a two phase circuit, the sensor was simply moved to the other pit fan on the circuit on 9/11/15. After the sensor was moved, the phase in the calculations was changed to 1. o On 3/8/16, the other pit fan on this circuit was fixed, and the phase in the calculations was changed back to 4. 72
73 Figure A30. Total monthly electric usage of FBB as obtained from the facility s electric bill, the total monthly amount of electric usage captured by installed data loggers and sensors, and the percent of electricity measured compared to the metered total. During the winter of , both data loggers began to have issues with their batteries resulting in a significant loss of data which is reflected above. From July 2016 to December 2016, researchers were unable to access the facility. When data was then collected in December 2016, one of the data loggers had experienced battery issues and had died. The data from this logger was unable to be recovered resulting in a loss of data from July 2016 to December
74 Figure A31. The monthly averages of daily energy use by various electrical loads measured at FBB from January March It should be noted that there were data logger battery issues during both years that resulted in some data lost for Feed System in January and from August to November and from Ventilation from August to November. The data that was available is reflected in this figure and no missing data is estimated. As can be seen in this figure, the pressure washer is used only during some months pigs left the building and cleaning was required. Lighting use also reflected the transition of pigs out of the building and pressure washer use. During September 2015, one of the pit fans being monitored blew its motor as can be seen in the sharp reduction of the ventilation load. 74
, were collected and analyzed to represent monthly totals and yearly totals of propane used.")
75 Figure A32. The average yearly electricity use ( ) by equipment type in FBB. A.6.4. Thermal Data At Finishing Barn B, propane was used for heating, and diesel was used for pressure washing. Propane Tank Fill History Reports obtained from the gas utility, Jerry s U-Save (Morris, MN), were collected and analyzed to represent monthly totals and yearly totals of propane used. The producer kept no records of diesel used for pressure washing, as a diesel tank is kept on site and provides fuel for various farm equipment. The producer estimated that 75 gallons of diesel per year are used for pressure washing at Finishing FBB. Figure A33. The total average energy use averaged across 2015 and 2016 and converted into MMBtu across several larger electrical loads and propane consumption in FBB. (1 kwh= btu, 1 therm= 91,600 btu) 75

76 Figure A34. The total daily electricity used and pig inventory in FBB. 76
77 Return on Investment for Energy Conservation Measures in Swine Production Systems Justin Miller West Central Research and Outreach Center August 11, 2016 Contents 1 Literature Review Swine Production Overview Environmental Effects of the Swine Industry Energy Usage Becoming Greener Studies on Alternative Energy Usage/Management in Swine Production Energy Management- Robert Chambers (2011) Ventilation Management- Harry Huffman (2011) Energy and Ventilation Management Issues in U.S. Pig Buildings- Larry Jacobson (2011) Reducing the Environmental Footprint of Pig Finishing Barns- Jacobson et al. (2011) Field Performance Evaluation of a Ventilation System: A Swine Case Study- Harmon et al. (2012) Effects of reduced nocturnal temperature on pig performance and energy consumption in swine nursery rooms- Johnston et al. (2013) Return on Investment Conclusion References Materials and Methods Swine Barn Energy Modeling Narrative- AKF Group LLC (2016) WCROC Data Acquisition Energy Conservation Measures Return on Investment Calculation References Appendix Full Links to Barn Curtain Sales Websites Data Farrowing Barn Nursery Barn Finishing Barn All Barns Combined Analysis LED Lighting Daylighting Solar Chimney Curtain Sided Barns Earth Tube Variable Speed Fans
78 4.7 Heat Lamp Controllers Night Temperature Setback Traditional Air Conditioning Geothermal Heat Exchange Comparisons Conclusion 22 6 Acknowledgments 23 1 Literature Review 1.1 Swine Production Overview Swine production is one of the largest livestock industries in the world. Forty percent of the meat produced worldwide comes from the swine industry (Stone et al. 2011). The United States is one of the highest producing and the second most consuming country of pork in the world (Schaffer et al.). In March of 2016, the U.S. swine industry was reported to contain 67.6 million head of pigs (United States Department of Agriculture et al. 2016). Swine production systems raise these pigs from when they are born until they are ready to be taken to market to be processed for meat. Three of the most common types of swine operations are Farrow to Finish, Farrow to Feeder, and Feeder to Finish (Kephart et al. 2001). A three-site Farrow to Finish production is the most common. Farrow to Finish involves three main steps of production: farrowing, feeder/nursery, and finishing. In farrowing, sows are brought in to give birth to a litter of pigs. The sow is usually put in the farrowing barn one week before giving birth. She and her litter typically stay in the barn another three weeks for a total occupancy of four weeks. At the end of the four weeks, the piglets are around pounds and are moved to the feeder/nursery stage. There is usually a three-day window in between each cycle in the farrowing barn to allow for cleaning of the pens. During the feeder/nursery step in production, the pigs are grown for six weeks until they are around pounds. Then the pigs are moved to the finishing stage where they stay in the finishing barn for around three and a half months. The pigs are then sent off to market after they reach somewhere between pounds. In between each group of finishing pigs, there is typically a one-week gap before the next group comes in. According to Kephart et al. (2001), Farrow to Finish operations tend to have the largest labor and capital costs, but also can have the largest potential in the swine market. A Farrow to Feeder operation involves the same first steps as Farrow to Finish but eliminates the finishing stage. Once the piglets reach pounds, they are sold to swine operations that do finishing. Farrow to Feeder operations have a lot less capital and feed expenses compared to Farrow to Finish, but the market for feeder pigs is not always very stable (Kephart et al. 2001). Feeder to Finish are the operations that buy feeder pigs from other swine operations. The pigs come in at pounds and are raised until they are ready to be sent to market. This operation type tends to have the lowest labor expenses among the three options (Kephart et al. 2001). Most of the U.S. swine industry is concentrated in large production farms, a trend that has taken place over the last twenty years. Schaffer et al. discuss how small swine farms have been stopping production while larger swine farms are taking over the market. In the 1950 s there were approximately three million swine farms, but by 2002 only 79,000 swine farms were in operation, which is a trend that has continued to today. Additionally, the total number of pigs in production on average per year did not significantly fall, leading to more pigs being produced in smaller areas (Schaffer et al.). While larger and more concentrated production can lead to increased production and efficiency, there are problems that can result, as is the case of the swine industry. Many of these problems end up being negative environmental externalities. Most of these externalities are due to some form of pollution in the swine industry. 1.2 Environmental Effects of the Swine Industry Two major forms of negative environmental externalities that occur due to swine production systems are water pollution and air pollution. Both of these primarily result from manure and waste in swine production. Since today s industry has about the same amount of pigs as in past years, but concentrated on fewer farms, all the manure from those pigs tends to be gathered in smaller areas and in larger 2
79 quantities. Much of this is a result of Concentrated Animal Feeding Operations (CAFOs), which are industrialized livestock operations that group large amounts of animals in smaller places in order to produce greater numbers of output. Having greater amounts of manure in smaller places also leaves less room for error in manure handling practices. However, many in the general public, especially those living near these operations, argue that CAFOs in the swine industry pose significant risks to health, quality of life, property value, and local economies (Schaffer et al.). Osterberg and Wallinga (2004) discuss how water and air pollution occur from manure in swine production. One way that water pollution to occurs is when microbes create nitrate from breaking down the nitrogen contained in manure. Normal groundwater nitrate levels then increase when manure is assimilated into wells and streams. These increased nitrate levels can produce diseases when groundwater is ingested by humans, some of which can be fatal. Microbes in manure can enter the groundwater and lead to diseases as well (Osterberg and Wallinga 2004). For air pollution, Osterberg and Wallinga (2004) state that decomposing manure creates dust particles, bacteria, endotoxins, hundreds of volatile organic compounds including hydrogen sulfide and ammonia, and odors that all can create health problems. 1.3 Energy Usage Another major negative environmental externality resulting from swine farms becoming larger is energy usage. One of the biggest uses of energy in the swine industry is in feed production (Thoma et al. 2011). However, this use of energy does not occur in the swine operations themselves but is used to grow and process the feed for the pigs. Within the swine production process itself there is still a lot of energy being used. The West Central Research and Outreach Center (WCROC) swine production system, which is much smaller than the largest commercial swine operations, has a projected annual usage of around 1500 million Btu of energy. In comparison, the U.S. Energy Information Administration (2013) reported that an average U.S. household uses around 90 million Btu of energy annually. While the amount of money spent on electrical and fuel energy in swine production only accounts for around 3-5% of total production costs, the amount of energy used is substantially higher than what residential houses are using (Kephart et al. 2001). Where there is major energy usage, there is always the conversation about making that energy use more efficient or greener. Government organizations and the local populations put pressure on energy-using industries to lower their energy usage or be more environmentally friendly, such as the swine production industry. With swine production, there is the discussion of what does the carbon footprint of the swine industry exactly look like? A report by Thoma et al. on the National Life Cycle Carbon Footprint Study for Production of US Swine (2011) states that the average carbon footprint for a pig in U.S. swine production is 2.87 lb. CO2e per lb. live weight. If an average pig is around 270 lbs., then this equates to 775 lb. CO2e per pig. If a 5000 head farrow to finish operation is used as an example, the carbon footprint of the operation would be around 3,875,000 lb. CO2e per year. While this is a huge number, the initial value of 2.87 lb. CO2e per lb. live weight takes into account all steps of the pork cycle including pig production, processing, retail, consumption, and packaging. The actual pig production process only accounts for 62% of the carbon footprint. Within the portion of the carbon footprint from the pig production process, only about 3% is due to fuel and electricity. This means that electricity and fuel energy use from swine production only puts out about 72,075 lb. CO2e per year. Manure, feed, and piglets account for the other 97% of the pig production process carbon footprint (Thoma et al. 2011). Another factor to consider is that electricity from the grid and fossil fuels are non-renewable resources. This means that at some point in the future, these sources of energy and the way they are produced will run out. 1.4 Becoming Greener Even though energy from electricity and fuel use account for a small percentage of the carbon footprint from swine production, it is still important to look at how to make energy use more efficient and better for the environment. Although the carbon emissions in electricity and fuel usage for pig production are much less than in feed production, Robert Chambers notes in Energy Management (2011) at the London Swine Conference that swine producers are already taking measures to properly allocate feed usage based on needs of the pigs. He proposes the argument that swine producers should do the same for energy usage and find ways to produce energy savings. Chambers lists all the areas where energy is concentrated in swine production as being electrical loads, ventilation fan motors, lighting, heating such as creep heaters, and feed motors, pumps and other miscellaneous loads. According to Chambers, the biggest area out of these energy uses is ventilation. Harry Huffman, in Ventilation Management (2011) at the 3
80 London Swine Conference, discusses how air quality is one of the most important performance factors affecting pig production. Air quality is largely dependent on ventilation and temperature management. If ventilation and temperature control are not managed properly, energy can be wasted and excessively used. An example is that over ventilating during winter months not only uses more electricity for airflow than needed but also will end up using more heating energy to counter the over ventilation (Huffman 2011). This means that properly managing energy use in areas such as heating and ventilation not only will make swine production more efficient and better for the environment, but could also increase pig performance. Many studies and analyses have been done on ways to save energy in swine production to be more environmentally friendly, more efficient, increase pig performance, and lower energy costs. 1.5 Studies on Alternative Energy Usage/Management in Swine Production Energy Management- Robert Chambers (2011) Chambers looks at how swine producers can better manage energy usage in different areas of swine production. First he discusses how energy can be managed in ventilation. Chambers states that producers should pay close attention to design, sizing, and make of fans. He also remarks that they should be properly maintained and set to an efficient set point. An example is given of changing set points from degrees Celsius ( degrees Fahrenheit) to degrees Celsius ( degrees Fahrenheit) which can save 56-60% of heating energy needed. Lighting was also an area that Chambers found possible energy savings in. Using compact fluorescent lighting instead of incandescent bulbs can cut electricity usage by 75%, and using T8 fixtures can cut down the electricity usage again by 40%. Chambers also presents the idea of using heat mats instead of heat lamps for farrowing. According to his data, this could reduce electrical usage by 66%. Other things that Chambers notes are making sure buildings have proper levels of insulation to minimize heat loss, planting tree windbreaks to reduce heating loads, using solar walls to help with heating, and using heat exchangers to precondition the air entering barns. Chambers finishes by stating that all of these energy management measures could lower energy costs for swine producers by 75% or more Ventilation Management- Harry Huffman (2011) Huffman focuses on ventilation in swine production. His main argument is that ventilation systems must not over ventilate or waste feed energy, heat energy, and electrical energy. Huffman s reasons for heat waste in current swine barns are that stage 1 fans tend to be oversized, minimum fan speeds can be set too high, heater shut-off set points are usually too high, and heaters could be oversized. In order to counter these causes of heat waste, Huffman maintains to have two fans at lower speed instead of one at high speed for stage 1 ventilation, don t let stage 2 fans run before stage 1 is at full power, and always use newer, more efficient fans when possible. Along with these suggestions are maintenance and management ideas. Huffman states to keep fans and temperature sensors clean, check heating units yearly or more, insulate and cover fans in winter, and ascertain that buildings are well insulated. Huffman believes energy can be saved and pig performance can be improved by measuring air quality regularly and using set points appropriate for each type and size of pig Energy and Ventilation Management Issues in U.S. Pig Buildings- Larry Jacobson (2011) Jacobson discusses many different ways to reduce energy usage in traditional swine production barns. Some ventilation ideas he presents are keeping up with fan maintenance, using larger fans, using minimum ventilation fans that will not over ventilate, and to use proper temperature set points. An interesting thing to note is that Jacobson argues smaller fans are less efficient than larger fans. The optimal temperatures he uses are degrees Fahrenheit (F) for lb. pigs, degrees F for lb. pigs, and degrees F for lb. pigs. Another thing Jacobson has found is that wind pressure is a factor that reduces efficiency in ventilation and can also cause under ventilation. He suggests using fan baffles and cones, having fans exhaust vertically through the ceiling and roof, and to have an east to west fan layout if in the Midwest. The east to west layout is an important factor because the common summer wind direction in the Midwest is south. In order to save heating energy, Jacobson has found that many farms have over sized heaters which should be replaced by more efficient and appropriately sized heaters. The temperature that a heater 4
81 comes on should be at least 2 degrees F below the set point to help with ventilation efficiency. Jacobson also suggests using radiant heaters that heat surfaces instead of air, which will cut energy usage in half. He goes on to say that proper insulation is an important component of efficient heating. Average poorly insulated barns have an R value of 1, but by increasing the R value to 2, 5, or 10 the swine producers could see fuel savings of 30%, 50%, and 65% respectively. Finally, Jacobson provides many different guidelines for saving energy plus ventilation management for curtain sided and tunnel ventilated barns. Some of these include using bubble wrap to insulate curtains, moving pit fans to side or end walls, pumping manure twice a year, and using the fewest number of exhaust fans possible. For curtain sided barns he suggests increasing the ventilation capacity so that the ventilation season can be extended longer in fall and spring to save gas usage for heating. Jacobson also suggests using sprinklers, evaporative cooling pads, and misting of air for additional cooling Reducing the Environmental Footprint of Pig Finishing Barns- Jacobson et al. (2011) Jacobson et al. propose the idea of creating a new Greener Pig Barn (GPB). They state that this idea is in response to demand for the swine industry to decrease the environmental effects of swine production. The goal of the GPB is to produce greener designs, along with management techniques, to reduce fossil fuel and energy use. Another goal is to reduce air emissions such as greenhouse gases and odors. For this study the group modeled four different GPB designs. All four have shallow gutters, mechanical scrapers, and an in-ground, covered, concrete manure storage tank. The major differences are the type of flooring, cooling systems, and heating systems. Each design was assigned a letter: A, B, C, and D. Design A had partially slatted flooring, a ground source heat pump for heating and cooling, and evaporative cooling pads. Design B also had partially slatted flooring but with a complete geothermal exchange system for heating and cooling. Design B included a boiler using fin tubes to provide additional heating. Design C utilized a fully slatted floor with evaporative cooling pads and direct fire heaters for extra heat. Design D also used fully slatted floors and direct fire heaters but had a geothermal cooling system and some infrared radiant heaters for young pigs. Jacobson et al. then calculated how the electrical energy use, fuel use, and air emissions would be affected for each proposed design. All GPB designs resulted in decreases in air emissions. Designs B and D both had decreases in electrical energy and fuel use. Design A had an increase in electrical energy and decrease in fuel use. Design C saw almost no change in electrical energy and fuel use. Jacobson et al. determined that the costs to design their GPBs would be 1.3 to 2 times higher than normal swine barns, but average daily gain would increase 3-7% and feed consumption per pound of pork produced would decrease 5-10%. Those factors plus the calculation that each design has the potential decrease electricity usage, fuel usage, and/or air emissions should be enough to offset the increased costs. The increase in profit per pig from the GPB designs ranged from $1.22-$4.45 and the payback periods ranged from years. The group also noted that if increased production costs cannot be recovered from increased performance, then consumers would have to be willing to spend more on pork to purchase pork from swine production systems that are more environmentally friendly Field Performance Evaluation of a Ventilation System: A Swine Case Study- Harmon et al. (2012) Harmon et al. set out to develop a procedure for evaluating swine ventilation systems. They also discussed common problems in swine buildings and wanted to provide lessons to help educate swine producers. For their study, a finishing building was evaluated in Iowa that held 2,000 pigs. The ventilation system was fully evaluated with measured parameters of temperature, relative humidity, air speed, static pressure, gas concentrations, and voltage. Some concluding suggestions they made were that minimum ventilation fan speed should be increased as animal size increases, stops should not be used on inlets, and a temperature curve should be used to adjust the set point as the pigs grow. Harmon et al. also stated that fans should be staged with smaller steps during colder weather and larger steps during warmer weather. 5
82 1.5.6 Effects of reduced nocturnal temperature on pig performance and energy consumption in swine nursery rooms- Johnston et al. (2013) Reduced nocturnal temperature (RNT) studies in swine production had previously been done in the 1980s and 1990s, but swine producers had not reacted to those studies by implementing the method in their production systems. Johnston et al. decided to conduct a new reduced nocturnal temperature study on pig performance and energy use in swine nurseries. They wanted to see how the RNT method would perform in today s facilities with the pigs in production now compared to those in the 1980s and 1990s. Two different studies were conducted in facilities from various universities in the Midwest. The first study was conducted at the University of Minnesota, University of Missouri, University of Nebraska, and South Dakota State University. However, there were issues with data from South Dakota State University, so their data was not used in the first study. Pigs at each university were randomly put in two identical rooms at ages days old. One room was a control room that started at around 86 degrees F for the first week and then decreased by 3.6 degrees each week for the rest of the study. The other room was the RNT room which had the same schedule as the control room except that each night after the first week, from 7 p.m. to 7 a.m., the temperature was lowered by about 10.8 degrees F. To achieve this temperature setback at night, the ventilation was not increased. Instead heating was reduced and the room was allowed to cool down to the desired temperature. The pigs were allowed access to feed and water as they pleased. The study was conducted for 35 days in Nebraska and 42 days in the other states. A second similar study was then conducted by the University of Minnesota, University of Missouri, The Ohio State University, and South Dakota State University. This study followed the same methods as the previous study, but the RNT room used the original temperature only for the first 4 days before the nighttime temperature, from 7 p.m. to 7 a.m., was reduced by around 14.9 degrees F. This study lasted from around days depending on the university. Johnston et al. hypothesized that an RNT method of swine production would lower the amount of energy used and would not negatively affect pig performance. Their hypothesis seems to be correct in this study that an RNT regimen would not lower pig performance. The group had looked at energy usage along with average daily gain, average daily feed intake, gain to feed ratio, and final pig body weight. All these pig performance measures were the same in both the control and RNT groups. The heating fuel use was reduced by 30% and the electrical use saw a decrease by 20%. The conclusion of the studies was that using RNT schedules in swine nurseries reduces energy and does not negatively affect pig performance. This leads to reduced costs of production and a reduced carbon footprint. With savings found in the nursery barns using a reduced nocturnal temperature regimen, there is a possibility for RNT to be applied in other barns to produce energy savings. 1.6 Return on Investment All of these previous studies show that there is definite potential for energy savings in swine production and making swine production greener. Saving energy and being greener is better for the environment, but is it better for producers? Financial feasibility is a main factor that needs to be considered when changing the way swine producers manage their production systems. For retrofits or implementations that require initial upfront costs, a projected Return on Investment (ROI) is needed for the producers to implement these ideas. Steve Cotter (2014) states that an ROI analysis is used as a comparison between the expenses or initial costs and the revenue or benefits of a business type decision. Cotter writes there are three general approaches for an ROI to be used. The first approach is to choose among options and determine how to distribute resources that are in high demand. The second is for evaluating and studying different ideas or decisions and the third is as a way of obtaining quantitative evidence to support whatever is being considered for implementation. According to Cotter, the ROI calculation equation is economic gains minus investment costs all divided by investment costs. This calculation results in a percentage value used to measure the ROI. He then goes on to describe two major steps to calculating the ROI. The first step is to design the ROI calculation. This involves finding out what the decision being evaluated will affect, the time line for the decision to be performed or enacted, and figuring out what baseline to compare the decision to. The second step is to actually calculate the ROI by using the calculation equation. The values in the equation will have to be calculated and estimated where needed. An ROI analysis generally can be pretty simple and easy to communicate to others. However, some of the problems with an ROI are that it does not account for the time value of money or risk of decisions, tends to over value investments by overlooking costs down the road, and can be inconsistent because an 6
83 ROI can be evaluated in many different ways (Cotter 2014). To counteract some of these problems, Cotter suggests using the ROI analysis along with net present value, internal rate of return, and payback period for the decision or implementation being evaluated. Net present value is defined as the current value of cash at the necessary interest rate in respect to the initial costs of making a decision or implementation (Gallo 2014). The internal rate of return is the interest rate from the new present value needed to make the net present value equal zero, based on the initial costs and yearly returns of the project (Gallo 2016 A Refresher on Internal Rate of Return ). The amount of time needed to fully cover the initial costs of a decision or project is the payback period and can be calculated by dividing the total initial costs by the returns per year (Gallo 2016 A Refresher on Payback Method ). By using the basic calculation along with these other methods, a Return on Investment analysis should be a strong indicator of the economic feasibility for any project and determine how worthwhile that project is for whoever is implementing it. 1.7 Conclusion With U.S. swine production being concentrated in larger farms than ever before, energy use for large swine production systems has become a significant expense. The high levels of energy use have put pressure on agricultural industries, such as swine production, to become more environmentally friendly and reduce emissions. There are many measures that swine production systems can implement to reduce and optimize energy usage that have been studied and tested by experts. These measures may reduce and optimize energy use, but do they save money and cut energy expenses? Energy conservation measures need to be analyzed from a financial perspective to determine if they should be implemented. Some metrics that can be used for a financial analysis of energy conservation investments are return on investment, net present value, payback period, and internal rate of return. If an energy conservation measure produces a positive result in both optimizing energy use and the financial analysis, then it is something that a swine production system can feasibly consider implementing. 1.8 References AKF Group LLC Swine Barn Energy Modeling Narrative. Unpublished report commissioned by the University of Minnesota West Central Research and Outreach Center. Chambers, Robert Energy Management. London Swine Conference-Exploring the Future Cotter, Steve Return on Investment. EMS World. Expanded Academic ASAP. Gallo, Amy A Refresher on Net Present Value. Harvard Business Review. 14/11/a-refresher-on-net-present-value. Gallo, Amy A Refresher on Internal Rate of Return. Harvard Business Review. rg/2016/03/a-refresher-on-internal-rate-of-return. Gallo, Amy A Refresher on Payback Method. Harvard Business Review. 6/04/a-refresher-on-payback-method. Harmon, Jay D., Michael C. Brumm, Larry D. Jacobson, Stephen H. Pohl, and David R. Stender Field Performance Evaluation of a Ventilation System: A Swine Case Study. Digital Iowa State University. Huffman, Harry Ventilation Management. London Swine Conference-Exploring the Future Jacobson, L. D., D. R. Schmidt, W. F. Lazarus, and R. Koehler Reducing the Environmental Footprint of Pig Finishing Barns ASABE Annual International Meeting. Jacobson, Larry D Energy and Ventilation Management Issues in U.S. Pig buildings. London Swine Conference-Exploring the Future Johnston, L. J., M. C. Brumm, S. J. Moeller, S. Pohl, M. C. Shannon, and R. C. Thaler Effects of reduced nocturnal temperature on pig performance and energy consumption in swine nursery rooms. American Society of Animal Science. g/content/91/7/3429. Kephart, Kenneth B., George L. Greaser, Jayson K. Harper, and H. Louis Moore Agricultural Alternatives: Swine Production. The Pennsylvania State University Agricultural Research and Cooperative Extension. Osterberg, David, and David Wallinga Addressing Externalities from Swine Production to Reduce Public Health and Environmental Impacts. Iowa Research Online. American Journal of Public Health. 94:
84 Schaffer, Harwood D., Pracha Koonnathamdee, and Daryll E. Ray. Economics of Industrial Farm Animal Production. Pew Commission on Industrial Farm Animal Production. Stone, James J., Christopher R. Dollarhide, Jennifer L. Benning, C. Gregg Carlson, and David E. Clay The life cycle impacts of feed for modern grow-finish Northern Great Plains US swine production. Agricultural Systems. 106:1-10. doi: /j.agsy Thoma, Greg, Darin Nutter, Richar Ulrich, Charles Maxwell, Jason Frank, and Cashion East National Life Cycle Carbon Footprint Study for Production of US Swine. Porkcdn.s3.amaz onaws.com. 20Final%20-%20May% pdf U.S. Energy Information Administration Newer U.S. homes are 30% larger but consume about as much energy as older homes. c=%e2%80%b9%20consumption%20%20%20%20%20%20residential%20energy%20cons umption%20survey%20(recs)-b3. United States Department of Agriculture, National Agricultural Statistics Service, and Agricultural Statistics Board Quarterly Hogs and Pigs. urrent/hogspigs/hogspigs pdf. 2 Materials and Methods 2.1 Swine Barn Energy Modeling Narrative- AKF Group LLC (2016) In an unpublished report, AKF Group (AKF) analyzed the swine production system at the WCROC to model its energy use. The current systems at WCROC were modeled and evaluated and baseline energy usage was calculated. All data for the energy systems was provided by WCROC. AKF developed a list of various retrofits that WCROC could implement to lower its energy usage in swine production. These retrofits were analyzed and modeled by AKF to predict their effects on energy usage. The modeling software used by AKF was a program called equest, version 3-64, and used an engine called DOE-2.2 which was developed by the United States Department of Energy. The program uses a calculation system that projects hourly energy usage for 8,760 hours per year. AKF s model projected energy usage based on typical commercial swine production schedule and occupancy. AKF s model used maximum capacity numbers reported from WCROC for each of the three buildings. The farrowing barn used a maximum capacity of 32 sows and 32 litters of piglets. Each litter was estimated to be around 11 piglets. The nursery had 4 rooms that held 288 pigs each at maximum capacity and the finishing barn had 2 rooms holding a max of 216 pigs each. AKF also took into account the schedules of energy usage in areas such as heating, lighting, hot water, and ventilation based on data reported from WCROC. Weather was another factor in the model that was important to predict future heating and ventilation loads. The simulation model used a file called Typical Meteorological Year 3, which was published for Morris, MN by the National Renewable Energy Lab and National Climatic Data Center. This file predicts a typical weather pattern for a year by using an algorithm called The Sandia Method. For the buildings, AKF took into account building performance qualities such as thermal properties, R-value, and assembly U-value. These qualities were necessary for modeling heating and ventilation usage. For baseline energy usage in the model, AKF looked at major sources of energy usage in the current swine production system at WCROC. For lighting, the farrowing and nursery barns used standard T12 fluorescent lighting while the Finishing barn used LED lighting. Miscellaneous equipment in the buildings that used electricity included feed augers, power washers, a clothes washer and dryer, and a medicine fridge. The existing heating, ventilation and air conditioning (HVAC) for each WCROC building was used for the model as well. The farrowing barn has three gas furnaces: one for the office in the building and two for the actual barn itself. There is no mechanical cooling in the building. Instead, fans are controlled based on temperature and pit fans are also used for ventilation. The piglets in the farrowing barn also need heat provided by heat lamps. The nursery and finishing buildings also have no mechanical cooling and use temperature controlled fans along with pit fans for ventilation and air quality control. Each building has gas fired heaters as well. Internal heat output from pigs housed in the barns was also used in the model. 8
85 2.2 WCROC Data Acquisition Data collected for the initial basis of study comes from the West Central Research and Outreach Center, Morris, MN. The WCROC has a swine production system consisting of a farrowing barn, nursery barn, and a finishing barn. Energy usage in these barns is monitored and recorded. Heating fuel usage was recorded through the use of purchase orders. WCROC purchases natural gas from CenterPoint Energy. For electricity usage data in the barns, WCROC uses data loggers and sensors. CR Magnetic 20 and 50 Amp sensors are used to measure the current in the wires. The sensors are clipped on to the main circuit wires to monitor different loads of electricity. Each sensor is able to measure the current flowing through the wire by surrounding a cross section of the wire and measuring the magnetic field. This is possible because a flow of charges through a wire will always produce a magnetic field that is directly dependent on the magnitude of the current in the wire. The sensors then send the current data to data loggers. The data loggers are Campbell Scientific CR800s and have an attached Campbell Sci AM 16/32B Multiplexer. There is one data logger in each barn that records current data from the sensors every 10 minutes. This data is then sent to a computer to be organized so that WCROC can analyze their electricity usage. In total, WCROC collects data from 17 loads in the farrowing barn, 17 in the nursery, and 14 in the finishing barn. WCROC used this data from electricity, along with their natural gas data, to have AKF Group model their swine production energy usage. 2.3 Energy Conservation Measures The baseline energy usage modeled from WCROC data was evaluated by AKF to determine Energy Conservation Measures (ECMs). These ECMs were then put through AKF s model using the same modeling software to produce predicted performance data. ECMs were only modeled in swine barns that made practical sense or were applicable to the WCROC production system.the ECMs are divided into three main areas of energy usage: lighting, ventilation, and heating and cooling. Two ECMs are for lighting in the swine barns. One of these is LED conversion. LED lights produce 50% more light using the same amount of power as fluorescent lighting. For example, in the WCROC nursery barn, this would cut the power used by the lights from 4,560 watts to 1,200 watts. LED lights also have a longer lifespan compared to fluorescent lights. LED lighting could be applied to any barn but was only applied in AKF s model to the WCROC nursery barn. The other lighting ECM is daylight harvesting. This idea proposes either implementing windows or using existing ones as a natural lighting source to lower the electricity load from other lighting sources. Many ventilation ECMs were modeled, the first being a solar chimney. This idea uses solar energy from the sun to heat the chimney that creates a stack effect drawing air out of the barn (AKF 2016). AKF noted that fans would still be needed to provide enough airflow and ventilation during non-sunny times, but that this ECM should be able to offset around one third of the total fan energy. Another ventilation ECM modeled is implementing curtain sided barns. These would decrease the energy needed by fans, but AKF also noted that the heating demand will be greater. Also, curtain sided ventilation is not practical as a retrofit for an already constructed barn. Earth tube preconditioning was also modeled as a ventilation ECM. This ventilation method takes outside air and pulls it through underground ducts to precondition the air coming into the barns. Heat is absorbed underground in the winter by the air and released underground in the summer. According to AKF, using an earth tube would see an increase in fan energy used by about 2.5 times the baseline due to a pressure drop, but the ECM would cut heating energy usage by anywhere from 23 to 33%. AKF also suggested using variable speed fans as an ECM instead of single speed fans. This is because a variable speed fan can save about 7% of energy used at times when less than full fan speed is needed for ventilation. There are also two other ventilation ECMs that were initially modeled, exhaust air energy recovery and high volume, low speed, overhead fans, but AKF explained problems with each and why they are not the best ideas to implement in this situation. The first heating and cooling ECM produced in AKF s model is a controller for the farrowing heat lamps. A controller would allow the heat lamps to turn on and off based on an ideal set point temperature for the piglets. This ECM should be able produce energy savings of around 40%. Night temperature setback is another heating ECM modeled. This ECM involves setting the temperature 15 degrees Fahrenheit lower from 7p.m. to 7 a.m. overnight in nursery and finishing barns. Depending on the type of barn, AKF believes this could produce energy savings from anywhere between 17 and 37%. AKF also proposes that barns use a traditional air conditioning system if they do not have any form of cooling other than fans and outside air. Using an air conditioning system should be able to save energy by limiting the usage of fans. However, in AKF s model, they found that this ECM ends up having relatively low energy savings. A similar ECM option was also modeled but instead of traditional air conditioning it 9
86 was a geothermal heat exchange air conditioning system. This system expends heat to the ground during warm seasons and takes in heat from the ground in cold seasons by pumping a liquid mixture through underground loops of piping. The geothermal heat exchange air conditioning saves heating energy but results in an increase in electrical energy use. AKF Group also mentions a possible ECM of solar air heating, however this method ends up not being very feasible due to expensive installation costs and low efficiency. A water to water heat pump was another proposed ECM but AKF s modeling software could not provide an accurate direct model. 2.4 Return on Investment Calculation This report takes the projected ECM data provided by AKF through their model to analyze the return on investment for each of the ECM s to determine if they are financially viable options. The data provided by AKF for the ECM s included baseline energy load for each barn, installation costs, electricity savings, natural gas savings, and propane savings. This data was used to put each ECM for each type of barn through a 25-year projection table. These projection tables took into account the data provided by AKF along with lifespans and maintenance costs for each. The only investment cost not found in data from AKF was for curtain sided barns. Instead, an average price was found for a barn curtain of $3 per foot and multiplied by the length of the WCROC finishing barn for two sides. This value was found by looking at barn curtain sales websites called FarmTek* ( and Celina Tent** ( Maintenance costs were assumed to only be needed for the solar chimney, earth tube, traditional air conditioning, and geothermal heat exchange. The maintenance requirements for each are generally just inspections and regular cleaning. For each of these ECMs, a reasonable estimate of 500 dollars per year was used. The only ECMs that had a lifespan of less than 25 years that needed to be accounted for were LED lighting and curtain sided barns. LED lights are rated for an expected life of 50,000 hours (Electronics Weekly Staff 2009). If these lights are used, on average, for 8 hours per day then they would have a lifespan of around 17 years and would have to be replaced once during the 25- year period. The curtains on a curtain sided barn are expected to last around 5 to 10 years (Johnson et al. 2002). Consequently, the curtains would have to be replaced twice during the 25-year period. The 25-year projection tables were divided into three groups based on swine barn type. Since a swine production operation would typically use either natural gas or propane, two projections were done for each ECM in each barn using each of the heating fuel options. All annual savings numbers and annual expenses were kept constant over the 25-year period. The electrical, natural gas, and propane savings were provided by AKF in units of kilowatt hours (kwh), therms, and gallons respectively. Natural gas prices are reported by the U.S. Energy Information Administration in units of dollars per thousand cubic feet, so data from AKF for natural gas was converted from therms to thousand cubic feet. Baseline energy loads were provided in million British Thermal Units (MMBTU). To find the new energy load from each ECM, all energy sources were also converted to MMBTU in the projection tables. Energy prices were determined based on data from the U.S. Energy Information Administration (EIA). Electricity prices were reported in cents per kwh. Minnesota commercial monthly average retail electricity prices were analyzed from January 2001 to February A linear fit was observed for the electricity price data and an average annual percent increase was determined to be 3.35%. The average electricity price in 2015 of 9.5 cents per kwh was used in year 0 in the projection table with each consecutive year being 3.35% more than the previous. P Y = P 0 (1 + I) Y (1) Equation 1 shows the formula used to achieve this percentage increase where Y is the year, P Y is the price at year Y, P 0 is the price at year 0, and I is the inflation rate (or average annual percent increase). Natural gas and propane prices were each determined using the same method as electricity prices. Natural gas pricing was reported by the EIA in dollars per thousand cubic feet. Monthly Minnesota commercial natural gas prices were analyzed from January 1989 to February The average annual percent increase in price was found to be 3.76%. The 2015 average natural gas price of $7.48 per thousand cubic feet was used as the initial price at year 0 in the projection table. The price data from the EIA for propane was reported in dollars per gallon on a weekly basis for Minnesota residential pricing from October 1, 1990 to March 28, The linear trend in the data showed an average annual percent increase in price of 4.56%. Average pricing calculated from purchases reported by commercial swine farmers to WCROC was $1.20 per gallon of propane and used as initial pricing for year 0 in the projection. Both natural gas and propane initial prices and inflation rates were used in equation 1 for the projection table. 10
87 Yearly cost savings in dollars were determined for each energy category in each ECM projection table by multiplying each energy savings value by its corresponding price. The dollar energy savings were added together along with maintenance costs subtracted out to calculate a net savings value for each year. The net savings were also discounted to show their value in present day dollars. S D = S N /(1 + R) Y (2) Equation 2 shows the formula used to calculate the discounted value of net savings each year where S D is discounted savings, S N is net savings, R is the discount rate, and Y is the year. In this calculation, a discount rate of 3% was used. Most economic analyses use discount rates of 3-5% and the present rate for a 30-year U.S. Treasury Bond is around 3%. The data from the 25-year projection tables were totaled to create values for the entire 25-year period. These totals were used to calculate the return on investment and other metrics for each ECM in each barn that they could be applied to and for each fuel type. First the total electricity cost savings, and natural gas/propane savings were added together, with total maintenance expenses subtracted, to get the net energy cost savings. Average yearly savings was calculated by dividing the net energy cost savings by 25 years. The return on investment (ROI) was then calculated with the following equation. ROI = (N etenergycostsavings InvestmentCosts)/(InvestmentCosts) (3) Equation 3 results in a percentage that is the return on investment for the ECM. The net present value (NPV) of the investment was then calculated by subtracting the investment costs from the total discounted value of savings from the 25-year period (equation 4). 25 N P V = S N /(1 + R) Y InvestmentCosts (4) Y =1 Next, the internal rate of return was calculated using the Microsoft Excel function IRR. This function takes equation 4 and sets the NPV equal to 0. It then takes a series of cash flows and an initial investment and uses them in equation 4 to solve for the discount rate (R). This discount rate when the NPV is set equal to 0 is the internal rate of return for the investment. Another metric calculated was payback period, found by dividing the initial investment costs by the average yearly savings. The investment cost per each million BTU of energy saved was also calculated by dividing investment costs by the annual energy reduction (MMBTU). After the 25-year projections and ROI calculations were done for each ECM in each appropriate barn, the same projections and calculations were performed for each ECM with all barns combined. 2.5 References Electronics Weekly Staff LED Life Expectancy. Electronics Weekly. Retrieved 30 May 2016, from Johnson, Dexter, G.R. Durland, and Gary Anderson College of Agriculture and Biological Sciences, South Dakota State University and the USDA. Plastic Curtain Wall Use for Barn Venting Appendix Full Links to Barn Curtain Sales Websites * ** gle_agri_barriers&gclid=cpqxqmoowc0cfqiqaqodbhecoq 11
88 3 Data 3.1 Farrowing Barn ECM Farrowing ECM Information Investment Costs Maintenance Expenses Annual Energy Reduction (MMBTU) Investment Costs per Annual MMBTU Saved Earth Tube $10, $12, $77.52 Heat Lamp Controllers $3, $ Geothermal Heat Exchange $175, $12, $ Farrowing ECM Savings Net Net ECM Annual Electricity Savings (kwh) Annual Natural Gas Savings (Therms) Annual Propane Savings (Gallons) Energy Cost Savings Natural (25-year) Gas Energy Cost Savings Propane (25-year) Earth Tube (1,736) 1,349 1,482 $23, $64, Heat Lamp Controllers 7,431 (194) (213) $21, $15, Geothermal Heat Exchange (30,671) 4,607 5,063 $16, $157,
89 Farrowing Return On Investment Metrics (Electricity + Natural Gas) ECM Average Annual Payback Return on Average Annual Net t Internal Energy Period Investment Return on Presen Rate of Investment Cost (Years) (25-year) Value Return Savings Earth Tube $ % 5.3% $4, % Heat Lamp Controllers $ % 25.0% $11, % Geothermal Heat Exchange $ % -3.6% $(164,933.37) -11.4% Farrowing Return On Investment Metrics (Electricity + Propane) ECM Average Annual Payback Return on Average Annual Net t Internal Energy Period Investment Return on Presen Rate of Investment Cost (Years) (25-year) Value Return Savings Earth Tube $2, % 21.8% $31, % Heat Lamp Controllers $ % 17.1% $7, % Geothermal Heat Exchange $6, % -0.4% $(74,099.81) -0.6% 13
90 3.2 Nursery Barn Nursery ECM Information Annual Investment ECM Investment Costs Maintenance Expenses Energy Reduction (MMBTU) Costs per Annual MMBTU Saved LED Lighting $12, $ Daylighting $1, $ Solar Chimney $6, $12, $ Earth Tube $20, $12, $ Variable Speed Fans $1, $ Night Temperature Setback $ $5.37 Traditional Air Conditioning $80, $12, $11, Geothermal Heat Exchange $200, $12, $ Nursery ECM Savings Net Net ECM Annual Electricity Savings (kwh) Annual Natural Gas Savings (Therms) Annual Propane Savings (Gallons) Energy Cost Savings Natural (25-year) Gas Energy Cost Savings Propane (25-year) LED Lighting 6,173 (88) (97) $20, $17, Daylighting 4,999 (70) (77) $16, $14, Solar Chimney 2, $(4,627.54) $(4,627.54) Earth Tube (4,388) 1,899 2,087 $30, $88, Variable Speed Fans 1, $7, $7, Night Temperature Setback ,020 $29, $57, Traditional Air Conditioning 2,593 (17) (19) $(3,311.44) $(3,850.53) Geothermal Heat Exchange (34,711) 4,634 5,092 $2, $144,
91 Nursery Return On Investment Metrics (Electricity + Natural Gas) ECM Average Annual Payback Return on Average Annual Net t Internal Energy Period Investment Return on Presen Rate of Investment Cost (Years) (25-year) Value Return Savings LED Lighting $ % 2.8% $1, % Daylighting $ % 40.1% $9, % Solar Chimney $(185.10) (32.4) -177% -7.1% $(9,492.64) - Earth Tube $1, % 2.1% $(473.69) 2.8% Variable Speed Fans $ % 25.7% $3, % Night Temperature Setback $1, % 231.1% $18, % Traditional Air Conditioning $(132.46) (604.0) -104% -4.2% $(82,618.88) - Geothermal Heat Exchange $2, , % -4.0% $(199,407.67) -16.0% Nursery Return On Investment Metrics (Electricity + Propane) ECM Average Annual Payback Return on Average Annual Net t Internal Energy Period Investment Return on Presen Rate of Investment Cost (Years) (25-year) Value Return Savings LED Lighting $ % 1.9% $(232.38) 2.8% Daylighting $ % 34.4% $8, % Solar Chimney $(185.10) (32.4) -177% -7.1% $(9,492.64) - Earth Tube $88, % 13.8% $36, % Variable Speed Fans $ % 25.7% $3, % Night Temperature Setback $2, % 458.8% $37, % Traditional Air Conditioning $(154.02) (519.4) -105% -4.2% $(82,965.71) - Geothermal Heat Exchange $5, % -1.1% $(108,066.43) -2.0% 15
92 3.3 Finishing Barn Finishing ECM Information Annual Investment ECM Investment Costs Maintenance Expenses Energy Reduction (MMBTU) Costs per Annual MMBTU Saved Curtain Sided $2, $ Earth Tube $10, $12, $ Variable Speed Fans $1, $ Night Temperature Setback $ $10.62 Traditional Air Conditioning $80, $12, $5, Geothermal Heat Exchange $150, $12, $1, Finishing ECM Savings Net Net ECM Annual Electricity Savings (kwh) Annual Natural Gas Savings (Therms) Annual Propane Savings (Gallons) Energy Cost Savings Natural (25-year) Gas Energy Cost Savings Propane (25-year) Curtain Sided 10,607 (224) (246) $32, $25, Earth Tube (1,873) $(4,091.92) $11, Variable Speed Fans $1, $1, Night Temperature Setback $14, $29, Traditional Air Conditioning 3, $ $(260.19) Geothermal Heat Exchange (4,780) 1,229 1,351 $8, $45,
93 Finishing Return On Investment Metrics (Electricity + Natural Gas) ECM Average Annual Payback Return on Average Annual Net t Internal Energy Period Investment Return on Presen Rate of Investment Cost (Years) (25-year) Value Return Savings Curtain Sided $1, % 45.8% $19, % Earth Tube $(163.68) (61.1) -141% -5.6% $(13,199.00) - Variable Speed Fans $ % 1.2% $(138.46) 1.9% Night Temperature Setback $ % 113.9% $9, % Traditional Air Conditioning $ , % -4.0% $(79,920.21) -16.1% Geothermal Heat Exchange $ % -3.8% $(145,251.82) -13.6% Finishing Return On Investment Metrics (Electricity + Propane) ECM Average Annual Payback Return on Average Annual Net t Internal Energy Period Investment Return on Presen Rate of Investment Cost (Years) (25-year) Value Return Savings Curtain Sided $1, % 35.4% $14, % Earth Tube $ % 0.4% $(3,471.35) 0.5% Variable Speed Fans $ % 1.2% $(138.46) 1.9% Night Temperature Setback $1, % 229.6% $18, % Traditional Air Conditioning $(10.41) (7,686.6) -100% -4.0% $(80,600.15) -17.5% Geothermal Heat Exchange $1, % -2.8% $(121,007.35) -6.6% 17
94 3.4 All Barns Combined ECM Information Annual Investment ECM Investment Costs Maintenance Expenses Energy Reduction (MMBTU) Costs per Annual MMBTU Saved LED Lighting $(12,000.00) $(975.61) Daylighting $(1,500.00) $(150.00) Solar Chimney $(6,000.00) $(12,500.00) 7.2 $(833.33) Curtain Sided $(2,628.00) $(190.43) Earth Tube $(40,000.00) $(37,500.00) $(115.34) Variable Speed Fans $(2,000.00) $(251.57) Heat Lamp Controllers $(3,000.00) $(505.38) Night Temperature Setback $(1,000.00) $(7.13) Traditional Air Conditioning $(160,000.00) $(25,000.00) 21.7 $(7,373.27) Geothermal Heat Exchange $(525,000.00) $(37,500.00) $(650.07) ECM Savings ECM Annual Annual Annual Electricity Savings (kwh) Natural Gas Savings (Therms) Propane Savings (Gallons) Net Energy Cost Savings Natural Gas (25-year) Net Energy Cost Savings Propane (25-year) LED Lighting 6,173 (88) (97) $20, $17, Daylighting 4,999 (70) (77) $16, $14, Solar Chimney 2, $(4,627.54) $(4,627.54) Curtain Sided 10,607 (224) (246) $32, $25, Earth Tube (7,997) 3,741 4,111 $49, $164, Variable Speed Fans 2, $8, $8, Heat Lamp Controllers 7,431 (194) (213) $21, $15, Night Temperature Setback 92 1,399 1,538 $44, $87, Traditional Air Conditioning 5, (19) $(2,538.82) $(4,110.73) Geothermal Heat Exchange (70,162) 10,470 11,506 $27, $348,
95 Return On Investment Metrics (Electricity + Natural Gas) ECM Average Annual Payback Return on Average Annual Net t Internal Energy Period Investment Return on Presen Rate of Investment Cost (Years) (25-year) Value Return Savings LED Lighting $ % 2.8% $1, % Daylighting $ % 40.1% $9, % Solar Chimney $(185.10) (32.4) -177% -7.1% $(9,492.64) - Curtain Sided $1, % 45.8% $19, % Earth Tube $1, % 1.0% $(8,894.28) 1.3% Variable Speed Fans $ % 13.4% $3, % Heat Lamp Controllers $ % 25.0% $11, % Night Temperature Setback $1, % 172.5% $28, % Traditional Air Conditioning $(101.55) (1,575.5) -102% -4.1% $(162,539.10) - Geothermal Heat Exchange $1, % -3.8% $(509,592.86) -13.4% Return On Investment Metrics (Electricity + Propane) ECM Average Annual Payback Return on Average Annual Net t Internal Energy Period Investment Return on Presen Rate of Investment Cost (Years) (25-year) Value Return Savings LED Lighting $ % 1.9% $(232.38) 2.8% Daylighting $ % 34.4% $8, % Solar Chimney $(185.10) (32.4) -177% -7.1% $(9,492.64) - Curtain Sided $1, % 35.4% $14, % Earth Tube $6, % 12.4% $64, % Variable Speed Fans $ % 13.4% $3, % Heat Lamp Controllers $ % 17.1% $7, % Night Temperature Setback $3, % 344.2% $55, % Traditional Air Conditioning $(164.43) (973.1) -103% -4.1% $(163,565.86) - Geothermal Heat Exchange $13, % -1.4% $(303,173.60) -2.5% 19
96 4 Analysis 4.1 LED Lighting LED lighting data was from the nursery barn. With a total investment cost of 12,000 dollars, the projected return on investment to implement the LED lights was 70% in a swine production system using natural gas and 47% in a system using propane. This major difference in return on investment percentages is due to an increase in fuel use from this ECM and the fact that propane is more expensive than natural gas. While both ROI percentages indicate a positive return, having propane as a fuel may cause this ECM to not be worth the expense. The internal rates of return also seem to show this. Using LED lighting in a natural gas system produces a projected internal rate of return of 4%, which is better than the ideal interest rate of 3% and produces a positive net present value for the investment. LED lighting with a propane system projects to have an internal rate of return of 2.8%, which is less than the ideal interest rate and produces a negative net present value. A drawback of the LED lighting as an ECM is that is produces one of the highest costs per million Btu saved. The investment still saves about the same amount of energy per year whether the system uses natural gas or propane, but the return only seems to be substantial enough in a system that uses natural gas. If a system uses propane, it will be more worthwhile to invest the money elsewhere if a 3% interest rate will be achieved. However, if lowering energy usage is an important goal for a swine producer, this investment will lower energy usage while still generating a positive return whether propane or natural gas is used. 4.2 Daylighting A low investment cost of 1,500 dollars produced a great projected return on investment for utilizing daylighting. The projected ROI in a natural gas system is 1,003% and 860% in a propane system. The internal rates of return are also both very high at 32.3% and 29.2% respectively, resulting in positive net present values for both. On paper, daylighting is definitely a sound and worthwhile investment. However, it is not very practical to retrofit an existing barn with new windows where they didn t previously exist. For this reason, using daylighting as an energy conservation measure can only really be applied to barns with existing windows or in construction of new barns. If a new barn is being constructed, daylighting is a very positive investment that has a payback period of only 2-3 years. 4.3 Solar Chimney The solar chimney does not have an effect in the model on heating fuel usage, so both the natural gas and propane systems are the same. This ECM had a negative projected return on investment and does not project to have positive savings during any year of operation. This results in a payback period that is negative which means that the investment will never pay for itself. Investment costs per annual million Btu saved is also pretty high. All of this makes for a bad investment projection to implement a solar chimney in a swine production system. Major problems with the outlook of this ECM are that a solar chimney would need to be large enough to properly ventilate a barn and is difficult to implement and operate. 4.4 Curtain Sided Barns Similar to daylighting, this ECM cannot easily be applied to an existing barn. Instead it would be applied to construction of a new barn. The ROI percentages are highly positive for a natural gas system and for a propane system. The investment cost is relatively low at $2,628 along with a low payback period of 2-3 years. The internal rate of return is projected for natural gas to be 36.2% and 30.6% for propane. With such a low payback period and a high internal rate of return, installing curtains seems to be a great investment when constructing a new swine barn. However, this assumes that pig performance is the same in a curtain sided barn when compared to a tunnel ventilated barn. A producer must first evaluate pig performance based on barn type. 4.5 Earth Tube The earth tube ECM has higher installation costs than the other ECMs but presents an opportunity to produce high savings in fuel use. The barn that presents the best return for an earth tube is the farrowing barn, with the finishing barn being the worst. In the farrowing barn, an earth tube in a 20
97 natural gas system has a projected return on investment of 132% with a payback period of 10.8 years and an internal rate of return of 5.9%. In a propane system, the numbers for an earth tube are even better with an ROI of 545%, payback period of 3.9 years, and an internal rate of return of 17.0%. This ECM saves a substantial amount of energy per year with one of the lowest investment costs per annual million Btu saved. An earth tube in the farrowing barn is a great investment both from an energy standpoint and financial outlook. Not only does it project to have high annual energy savings and the same low investment cost per million Btu saved, but it projects to generate a great return. The nursery projected return is very good for an earth tube as well. However, in the finishing barn an earth tube has a negative return in a natural gas system and a very low return on investment with a high payback period in a propane system. This leads to an earth tube not being a great measure to implement in a finishing barn. 4.6 Variable Speed Fans Variable speed fans did not project to affect fuel usage, so both natural gas and propane systems have the same outlook. For a low investment cost of $1,000 in either barn, this ECM has a great ROI at 642% in the nursery barn but only 30% in the finishing barn. The payback periods for each barn are 3.4 and 19.2 years respectively. As far as from a financial standpoint, implementing variable speed fans is a good investment, although it is much better in the nursery than the finishing barn. The biggest drawback with this ECM is that it saves less than 10 million Btu per year. In a finishing barn, the relatively low return on investment may not be large enough to justify implementation of variable speed fans in the barn. If the energy reduction is enough to justify the investment, then there is definitely a substantial return to be made on each dollar invested for variable speed fans in the nursery barn. 4.7 Heat Lamp Controllers The heat lamp controller ECM has the lowest projected annual energy savings of all measures at 5.9 million Btu. However, it projects to be a good financial investment. The installation cost is only $3,000 and has an ROI of 626% for natural gas systems and 428% for propane systems. Both paybacks are under 5 years and the internal rates of return are 22.3% and 17.5% respectively. Using heat lamp controllers is a good investment, but if money is not readily available then there may be better options with similar financial gains that also have better energy savings. 4.8 Night Temperature Setback Implementing a night temperature setback in a swine production system has the lowest estimated investment cost out of all the ECMs at $500 per barn. The projected return on investment is extremely high for both the nursery and finishing barns at 5,778% or 2,848% respectively for a natural gas system and 11,470% or 5,741% respectively for a propane system. The payback periods are all under one year and the internal rates of return are all above 76.9%. The investment cost per million Btu saved is only around $7-10. This ECM projects to be the best investment and value among all options. As long as there are no detrimental effects to the pigs in the barns (see section 1.5.6), then a night temperature setback should definitely be considered for implementation in a swine production system. 4.9 Traditional Air Conditioning This ECM does not save a considerable amount of energy compared to its initial investment cost. The investment costs are very high and the annual energy reduction is only around million Btu depending on the barn. Whether the system is natural gas or propane, implementing traditional air conditioning results in a projected ROI that is negative, which meant that the internal rate of return could not be calculated for this investment. Overall, this ECM is not a good investment due to no positive return over the entire 25-year period. This ECM is not recommended to be pursued at this time Geothermal Heat Exchange A geothermal heat exchange system has the highest investment costs for implementation out of all of the ECM options. All of the projected ROIs for this measure are negative and all the payback periods are over 25 years. This ECM does save anywhere from million Btu per year depending on the barn, 21
98 but payback periods of 450-2,000 years make this investment not feasible in a natural gas system. With propane, a geothermal heat exchange system projects to have a better ROI but the payback periods are all over 25 years. This indicates that the geothermal heat exchange ECM is not an ideal investment even in a swine production system that uses propane instead of natural gas. The installation costs are just too high with this ECM. In the future this could be a good energy conservation measure to implement, due to its high energy savings, if installation costs go down or energy prices drastically rise Comparisons For lighting ECMs, both LED lighting and daylighting are different types of measures. It is conceivable that they could both be used together in a production system. If a new barn is being built and the better ECM needs to be determined, from a financial standpoint it would be daylighting. This ECM is very inexpensive and projects to have a greater return on investment than compared to LED lighting. LED lighting is projected to save a little more than twice the amount of energy as daylighting but the investment cost is at least 15 times greater. The best ventilation ECM from a purely financial standpoint seems to be using a curtain sided barn. The investment costs are one of the lowest and the return on investment is projected to be at least 1,000%. No other ventilation ECM projects to have that large of a return on every dollar invested. The issue with this ECM is that it is not a practical retrofit, so it would mostly apply for construction of a new barn. There also could be effects on the performance of the pigs that would need to be factored into any decision to use this ECM. As far as energy savings are concerned, an earth tube is definitely the best option. However, the ROI for an earth tube is low in a natural gas system, so there may be too much risk. In a propane system, an earth tube is the best option for energy savings and also projects to have a great return on investment in the farrowing and nursery barns. A solar chimney is not a good ECM to pursue based on negative projected returns on investment. Variable speed fans could also be used but may not be ideal for energy reduction. They have a projected ROI that is good but the energy savings are considerably less than other ventilation ECM options. Overall, the best ventilation ECM is an earth tube in a propane system, if implemented in the farrowing or nursery barns, due to the high amount of energy savings and the ROI. The heating and cooling ECM s are difficult to directly compare, as they all have large differences. The night temperature setback ECM is the best option compared to all the rest. The energy savings are relatively high, the investment cost is the lowest, and the ROI is projected to be the highest among all the ECM options. A night temperature setback ECM should seemingly be used in every swine production system if there are no detrimental effects on the pigs. A traditional air conditioning system projects to not generate a return, so it is not a feasible investment. Heat lamp controllers have a good projected ROI, but are not the best energy savings option as they have very low energy savings compared to all other ECMs. A geothermal heat exchange system also may not be a good investment. The investment costs are too high compared to the expected amount of return. However, depending on the importance of energy reduction, a geothermal heat exchange system would have the greatest amount of energy saved each year. 5 Conclusion The results of the data definitely show that there is potential for implementing energy conservation measures and other technologies in the swine production industry. One thing to remember is that the data in this study was all based on projections. The energy usage and savings were also modeled just for the WCROC swine production system assuming that the WCROC barns would have full occupancy and typical usage schedules. Most commercial swine production systems will be larger and will most likely have different energy usage and potential savings from each ECM if they were to be implemented. However, all the energy conservation measures in this study will at least save energy in some way. As far as financial feasibility, some of these are not practical investments. These are the most expensive ECMs being traditional air conditioning and a geothermal heat exchange system. At some point these systems could become cheaper to install, but for now they have too high investment costs. Yet, the rest of the ECMs should generate some sort of return on the investment and some returns are very substantial. This means that investing in energy conservation measures is feasible and a good idea for swine producers from both an energy and economic standpoint. Using ECMs such as LED lights or an earth tube ventilation system instead of current swine production technologies will lower energy usage while also helping to make swine production better for the environment. Many studies have also showed that some of these 22
99 technologies also can result in better production environments for the pigs. Even though there is not heavy pressure on swine production directly to become more environmentally friendly, swine producers can use energy conservation measure to be proactive about how their systems affect the environment while also saving money from a reduction in energy usage. 6 Acknowledgments Funding for this project was provided by the Minnesota Environment and Natural Resources Trust Fund as recommended by the Legislative Citizen Commission on Minnesota Resources (LCCMR). The Trust Fund is a permanent fund constitutionally established by the citizens of Minnesota to assist in the protection, conservation, preservation, and enhancement of the state s air, water, land, fish, wildlife, and other natural resources. Currently 40% of net Minnesota State Lottery proceeds are dedicated to growing the Trust Fund and ensuring future benefits for Minnesota s environment and natural resources. Special thanks to the West Central Research and Outreach Center, Mike Reese, Eric Buchanan, Lee Johnston, and Kirsten Sharpe for direction and support on this project. 23
 Renewable Energy Intern Summer")
100 Return on Investment for Energy Conservation Measures in Swine Production Systems Justin Miller West Central Research and Outreach Center (WCROC) Renewable Energy Intern Summer 2016


101 Swine Production and the Environment Swine Production has been increasing in size and becoming more concentrated Could create environmental problems Public perception that agricultural industries are heavily contributing to environmental problems Leads to pressure on agricultural industries to become greener Image from Jeff Quitney at Image from Smithfield Foods at

102 Swine Barn Energy Modeling Narrative- AKF Group LLC (2016) Report commissioned by WCROC Modeled current energy use for WCROC swine production Determined energy conservation measures (ECMs) Modeled energy usage and savings with ECMs in place Model assumed typical commercial schedule and occupancy Energy data for AKF model collected from WCROC swine facilities Using sensors on electrical loads and fuel billing statements AKF Report Title Page

103 Return on Investment Study AKF found many energy conservation measures that project to reduce energy usage at WCROC Objective of this study: Energy conservation measures can reduce energy usage, but are they feasible economic investments? Image from halalfocus.net


104 Energy Conservation Measures Lighting LED Lighting Conversion Ventilation Solar Chimney Earth Tube Variable Speed Fans Image from Solar Chimney diagram from AKF report Image from Earth Tube picture from


105 Energy Conservation Measures Heating and Cooling Heat Lamp Controllers Night Temperature Setback Effects of reduced nocturnal temperature on pig performance and energy consumption in swine nursery rooms- Johnston et al Traditional Air Conditioning Geothermal Heat Exchange Image from nationalhogfarmer.com Image from Geothermal Heat Exchange system diagram from ericsenergy.com Image from
106 Energy Conservation Measures LED Lighting Solar Chimney Earth Tube Variable Speed Fans Heat Lamp Controllers Night Temperature Setback Traditional Air Conditioning Geothermal Heat Exchange Farrowing Nursery Finishing X X X X X X X X X X X X X X X X
 Inflation Rate Electricity (per kwh) Natural Gas (per therm) Propane (per therm) $ 0.095 3.35% $ 0.75 3.76% $ 1.")
107 Return on Investment Calculation 25-year projections Used AKF energy usage and savings data Initial costs, lifespans, and maintenance costs included as well Energy cost inflation was based on data from U.S. Energy Information Administration Energy Type Initial Energy Price (2015 Avg) Inflation Rate Electricity (per kwh) Natural Gas (per therm) Propane (per therm) $ % $ % $ %
108 Return on Investment Calculation Payback Period Amount of time needed for returns to cover initial investment costs Return on Investment (ROI) RRRRRR = NNNNNN SSSSSSSSSSSSSS IIIIIIIIIIIIIIIIIIII CCCCCCCCCC Other metrics, such as internal rate of return and net present value, were calculated in full analysis but are not in this presentation
109 Data and Results Summary (Electricity+Natural Gas) Energy Conservation Measure Barn Applied to Investment Costs Electricity + Natural Gas Payback Period (years) Annual Return on Investment Night Temperature Setback N $ % Variable Speed Fans N $ 1, % Heat Lamp Controllers Fa $ 3, % Earth Tube Fa $ 10, % LED Lighting N $ 12, % Geothermal Heat Exchange Fa $ 175, % Traditional Air Conditioning Fi $ 80, , % Solar Chimney N $ 6, %
110 Data and Results Summary (Electricity+Propane) Energy Conservation Measure Barn Applied to Investment Costs Electricity + Propane Payback Period (years) Annual Return on Investment Night Temperature Setback N $ % Variable Speed Fans N $ 1, % Earth Tube Fa $ 10, % Heat Lamp Controllers Fa $ 3, % LED Lighting N $ 12, % Geothermal Heat Exchange Fa $ 175, % Traditional Air Conditioning Fi $ 80, % Solar Chimney N $ 6, %
111 Data and Results Summary (Electricity+Natural Gas) Energy Conservation Measure Barn Applied to Investment Costs Electricity + Natural Gas Payback Period (years) Annual Return on Investment Night Temperature Setback N $ % Variable Speed Fans N $ 1, % Heat Lamp Controllers Fa $ 3, % Earth Tube Fa $ 10, % LED Lighting N $ 12, % Geothermal Heat Exchange Fa $ 175, % Traditional Air Conditioning Fi $ 80, , % Solar Chimney N $ 6, %
112 Data and Results Summary (Electricity+Propane) Energy Conservation Measure Barn Applied to Investment Costs Electricity + Propane Payback Period (years) Annual Return on Investment Night Temperature Setback N $ % Variable Speed Fans N $ 1, % Earth Tube Fa $ 10, % Heat Lamp Controllers Fa $ 3, % LED Lighting N $ 12, % Geothermal Heat Exchange Fa $ 175, % Traditional Air Conditioning Fi $ 80, % Solar Chimney N $ 6, %
113 Data and Results Summary (Electricity+Natural Gas) Energy Conservation Measure Barn Applied to Investment Costs Electricity + Natural Gas Payback Period (years) Annual Return on Investment Night Temperature Setback N $ % Variable Speed Fans N $ 1, % Heat Lamp Controllers Fa $ 3, % Earth Tube Fa $ 10, % LED Lighting N $ 12, % Geothermal Heat Exchange Fa $ 175, % Traditional Air Conditioning Fi $ 80, , % Solar Chimney N $ 6, %
114 Data and Results Summary (Electricity+Propane) Energy Conservation Measure Barn Applied to Investment Costs Electricity + Propane Payback Period (years) Annual Return on Investment Night Temperature Setback N $ % Variable Speed Fans N $ 1, % Earth Tube Fa $ 10, % Heat Lamp Controllers Fa $ 3, % LED Lighting N $ 12, % Geothermal Heat Exchange Fa $ 175, % Traditional Air Conditioning Fi $ 80, % Solar Chimney N $ 6, %

115 Implications Energy Conservation Measures can be good financial investments Some are feasible today Others could become feasible in near future Energy modeling is important when considering energy conservation measures Lowering Carbon footprint is a way to improve public perception of swine and agricultural industries Image from
116 Acknowledgements Funding for this project was provided by the Minnesota Environment and Natural Resources Trust Fund as recommended by the Legislative Citizen Commission on Minnesota Resources (LCCMR). Thanks to Mike Reese, Eric Buchanan, Kirsten Sharpe, Joel Tallaksen, Lee Johnston, and Cory Marquart for direction and support on this project.

117 West Central Research and Outreach Center Swine Barn Energy Modeling Narrative Prepared by: AKF Group LLC Revised: December 15, 2016
118 Whole Building Energy Model Summary The WCROC swine program consists of barns for each of the three major swine production stages. These barns are representative of typical commercial operations for gestation/farrowing, nursery, and finishing. The barns are located at the WCROC facility in Morris, MN. AKF Group has prepared energy models to determine the energy cost impacts of the proposed design and renovations. The existing buildings were calibrated using owner provided energy use data as well as data collected from typical commercial barns serving the same functions. The calibrations are intended to represent the actual facilities at the WCROC with commercial production operating schedules. The calibrated models were then used to analyze the results of potential energy conservation measures (ECMs). The ECM s were determined prior to developing the energy models using a decision matrix for each barn type. These are attached in Appendix A. Overview The energy models being used to estimate and compare annual energy use have been created with the software program equest, version 3-64, using the DOE-2.2 simulation engine developed by the US Department of Energy. The program calculates building energy use on an hourly basis for 8,760 hours per year (full year) and utilizes typical meteorological year (TMY) weather data. A. Occupancy i) Farrowing Occupant (animal) density in the model is based on owner provided data using the peak occupancy of the WCROC facility. The existing barn has a maximum capacity of 32 sows plus 32 litters of piglets. Typical litters are 11 piglets. The sows are typically in the farrowing pens for 4 weeks and there is a 3 day window for cleaning before the next sow is brought in. This results in an average sow occupancy of about 91%. The sows are brought in to the barn about 1 week prior to farrowing and then the litter remains with the sow for the remaining 3 weeks before being moved to the nursery. This means there is typical piglet occupancy of approximately 75%. The farrowing sows weigh approximately 400 lbs with the piglets averaging 7 to 8 lbs from birth to leaving the farrowing barn. ii) Nursery Occupant (animal) density in the model is based on owner provided data using the peak occupancy of the WCROC facility. The building has 4 nursery rooms as well as a central support area. Each nursery room can hold 288 pigs. They are brought in from the farrowing barn in the lbs range and leave after 6 weeks reaching an average weight of lbs. iii) Finishing ARLINGTON / BOSTON / MEXICO CITY / MINNEAPOLIS / NEW YORK / PHILADELPHIA / PRINCETON / PUEBLA / ROCHESTER / STAMFORD 2 of 30

119 Occupant (animal) density in the model is based on owner provided data using the peak occupancy of the WCROC facility. Swine in the finishing barn go through a 3.5 month growth phase. The finishing barn has two rooms that can hold a maximum of 216 pigs each. There is typically 1 week of down time after a group of pigs have left a room and the second room will usually be filled 2 weeks after the first is filled. Pigs are brought in from a nursery barn weighing about 50 to 60 pounds and weigh about 260 pounds or more after 3.5 months. B. Schedules of Use i) Farrowing The schedules of use for pit fan operation, lighting, feed augers, and domestic hot water are defined according to owner provided data in order to develop the calibration of annual energy use. The heating and cooling setpoints for heating and fan control are also based on owner provided information. Graphical views of each space type category are shown below to illustrate the lighting and miscellaneous electrical equipment patterns. The sensible heat load graph shows the typical annual farrowing cycles and the heat output from the pigs during each cycle. ii) Nursery The schedules for animal occupancy have been created to represent the typical growth during the 6 weeks the pigs are in the nursery. This can be seen in the sensible heat load graph below. The current temperature schedule maintains the room at 90 F when the pigs are first brought in and decreases the temperature setpoint by 4 F per week until the temperature is at 70 F when the pigs are over 50 lbs. The interior lighting and equipment schedules are also based on owner provided information. This includes the feed augers, refrigerators, power washers, etc. ARLINGTON / BOSTON / MEXICO CITY / MINNEAPOLIS / NEW YORK / PHILADELPHIA / PRINCETON / PUEBLA / ROCHESTER / STAMFORD 3 of 30


120 iii) Finishing The schedules of use for fan operation, occupancy, and domestic hot water are defined according to owner provided data in order to develop the calibration of annual energy use. The heating and cooling setpoints, interior lighting, and general equipment loads are also based on owner provided information. Graphical views of each space type category are shown below to illustrate the occupancy, lighting, and miscellaneous electrical equipment patterns. The rooms are fully occupied with increased heat output from the pigs represented by the sensible heat load graph. A reduced lighting load is maintained during the time between cycles, assuming that some lights will be on while the rooms are being cleaned. ARLINGTON / BOSTON / MEXICO CITY / MINNEAPOLIS / NEW YORK / PHILADELPHIA / PRINCETON / PUEBLA / ROCHESTER / STAMFORD 4 of 30
121 C. General Methodology The existing building areas have been modeled according to owner provided drawings and owner compiled data on motor sizes, lighting, etc. D. Weather The weather file used during simulation is the Typical Meteorological Year 3 (TMY3) file for Morris, MN Municipal Airport as published by the National Renewable Energy Lab and National Climactic Data Center. The TMY3 file for this location uses an algorithm referred to as The Sandia Method to create a typical year using 12 years of site specific meteorological data. The Sandia method is an empirical approach that selects individual months from different years of the period of record. For example, this site contains 12 years of data, all 12 Januarys are examined, and the one judged most typical is selected to be included in the TMY. The other months of the year are treated in a like manner, and then the 12 selected typical months are concatenated to form a complete year. Because adjacent months in the TMY may be selected from different years, discontinuities at the month interfaces are smoothed for 6 hours on each side. The Sandia Method selects a typical month based on nine daily indices consisting of the maximum, minimum, and mean dry bulb and dew point temperatures, the maximum and mean wind velocity, and the total global horizontal solar radiation. Final selection of a month includes consideration of the monthly mean and median and the persistence of weather patterns. E. Utility Rate Structure The utility rates used in the energy models are per the historical utility data from 2014 provided by the owner. The annual average utility costs are $/kwh and 0.73 $/therm. In addition to the utility rate structure for the WCROC, the final summary includes the impact of propane being a common heating fuel using $1.70/gallon. Architecture A. Geometry i) Farrowing The farrowing barn is an existing building that is approximately 3600 square feet. The building is 128 feet long and 28 feet wide. It is oriented with the length running east to west and is split into two main rooms. The model matches the existing geometry per owner provided drawings. ARLINGTON / BOSTON / MEXICO CITY / MINNEAPOLIS / NEW YORK / PHILADELPHIA / PRINCETON / PUEBLA / ROCHESTER / STAMFORD 5 of 30


122 ii) Nursery The nursery barn consists of an existing building that is approximately 7,500 square feet. The model matches the existing geometry per owner provided drawings. The building is approximately 165 feet by 45 feet and consists of 4 swine rooms as well as a central office and support area. iii) Finishing The finishing barn consists of an existing building that is approximately 5,200 square feet. The model matches the existing geometry per owner provided drawings. The barn is about 146 feet long, east to west, by 36 feet wide and has two independent rooms. ARLINGTON / BOSTON / MEXICO CITY / MINNEAPOLIS / NEW YORK / PHILADELPHIA / PRINCETON / PUEBLA / ROCHESTER / STAMFORD 6 of 30
123 B. Material Performance Envelope performance values are based on existing drawings provided by the owner. i) Farrowing Envelope Properties Surface Description Thermal Properties R-Value Assembly U-Value Below Grade Walls 8" concrete with 2 1/2" extruded polystyrene insulation R-5 per inch (est) Structural Insulated Panel (SIP); 4" Above Grade Walls rigid foam bonded to 3/4" Insulation at R-5 per inch plywood both sides, exterior steel (est) siding Roof Wood roof trusses, 48" O.C. with 2" fiberglass insulation draped over purlins and 12" fiberglass attic insulation R-30 per ASHRAE 90.1 Table A ii) Nursery Below Grade Walls Surface Description Thermal Properties R-Value Assembly U-Value 8" concrete with 2 1/2" extruded polystyrene insulation Envelope Properties R-5 per inch (est) Above Grade Walls 2x6 Wood framing with 5 1/2" cavity fiberglass insulation R-19 (Effective R-18 installed) cavity insulation per ASHRAE 90.1 Table A Roof Windows Wood roof trusses, 48" O.C. with 2" fiberglass insulation draped over purlins and 12" fiberglass attic insulation Glass with wood framing R-30 per ASHRAE 90.1 Table A2.4 ASHRAE 90.1 Appendix A Table A8.2: Wood frame, double glazing SHGC, 0.64 VLT iii) Finishing See Farrowing materials. Electrical and Miscellaneous A. Interior Lighting i) Farrowing The lighting in the farrowing barn has been modeled based on the information received from the owner. Farrowing barn lighting has a total power of 1,460 watts using standard T12 fluorescent fixtures. ii) Nursery The lighting in the nursery barn has been modeled based on the information received from the owner. Nursery barn lighting has a total power of 4,560 watts using standard T12 fluorescent fixtures. ARLINGTON / BOSTON / MEXICO CITY / MINNEAPOLIS / NEW YORK / PHILADELPHIA / PRINCETON / PUEBLA / ROCHESTER / STAMFORD 7 of 30
124 iii) Finishing The lighting in the existing building has been modeled based on the information received from the owner. Finishing barn lighting has been mostly converted to LED fixtures and has a total power of 616 watts. B. Miscellaneous Equipment i) Farrowing Miscellaneous electrical equipment for the building includes 2 feed augers, a medicine fridge, and a power washer. These are modeled per owner provided usage and power information. Feed auger o ¾ hp motors o ~10 minute per day total runtime o 2 total augers Medicine fridge o ~175 watts o ~25% duty cycle Power washer o ~8.4 kw o Used to clean pens before new sow is brought in, ~4hrs per month Domestic hot water (DHW) o ii) Nursery 40,000 Btu/h domestic water heater, primary use is for showering which is estimated by the WCROC to be used once per day on average Miscellaneous electrical equipment for the building includes 4 feed augers and a power washer. These are modeled per owner provided usage and power information Feed auger o ¾ hp motors o ~10 minute per day total runtime o 4 total augers Clothes washer/dryer o Used about every two weeks Power washer o ~8.4 kw Used to clean pens before new pigs are brought in, ~10hrs per month Domestic hot water o 75,000 Btu/h domestic water heater serves the showers, restroom fixtures, and clothes washer, approximately 20 gallons per day estimated by WCROC iii) Finishing Miscellaneous electrical equipment for the building includes feed augers and power washers. These are modeled per owner provided usage and power information. Feed auger ARLINGTON / BOSTON / MEXICO CITY / MINNEAPOLIS / NEW YORK / PHILADELPHIA / PRINCETON / PUEBLA / ROCHESTER / STAMFORD 8 of 30
125 o ¾ hp motors o ~10 minute per day total runtime o 2 total augers Power washer o ~8.4 kw o Used to clean pens before new pigs are brought in, ~4hrs per month Mechanical Systems A. General Heating Ventilating and Air Conditioning (HVAC) i) Farrowing The HVAC in the farrowing barn has been modeled based on information provided by the owner. Two 60,000 Btu/h gas fired furnaces provide heat to the farrowing areas with an additional 120,000 Btu/h furnace heating the office. Controller setpoints for heating are 72 F. No mechanical cooling is provided for the building. Tempering of the space temperature is done using thermostatically controlled fans capable of up to 100 air changes per hour. These fans stage on as the temperature increases to maintain the space temperature within 2 to 3 F of the outdoor temperature. Direct evaporative cooling of the sows is employed when temperatures get above 80 F. Pit fans operate continuously for ventilation and humidity control. The pit fans are sized for 2,800 cfm total which equates to 4 air changes per hour at 50% speed. 125W heat lamps provide heat to the newborn pigs during the winter months for the first 15 to 20 days after birth. The heat lamps are used for 7 to 10 days after birth during summer months. ii) Nursery The HVAC in the nursery barn has been modeled based on existing drawings and information provided by the owner. Nursery barn temperatures are kept at 90 F for the first week when the piglets are introduced and then reduced by 4 F per week to 70 F. The office area s gas fired furnace keeps the office at 72 F. The nursery facility has gas fired unit heaters for the heating season. No mechanical cooling is provided for the building. Cooling is accomplished by thermostatically controlled fans. These fans stage on as the temperature increases to maintain the space temperature within 2 to 3 F of the outdoor temperature. Pit fans operate continuously for ventilation and moisture control. Pit exhaust fan operation is defined according to owner provided data and is sized for 1,600 cfm per room. They operate at 50% during winter months to maintain the required 4 air changes per hour for moisture control and 100% during summer months for moisture control and cooling. iii) Finishing The HVAC in the existing building has been modeled based on existing drawings and information provided by the owner. Finishing barn thermostat setpoint is in the high 60 s to low 70 s year round. The current facility has gas fired unit heaters for the heating season. No mechanical cooling is provided for the building. Cooling is accomplished by thermostatically controlled fans as well as direct evaporative cooling of the pigs when temperatures get above 80 F. These fans stage on as the temperature increases to maintain the space temperature within 2 to 3 F of the outdoor temperature. ARLINGTON / BOSTON / MEXICO CITY / MINNEAPOLIS / NEW YORK / PHILADELPHIA / PRINCETON / PUEBLA / ROCHESTER / STAMFORD 9 of 30
126 Pit exhaust fan operation is defined according to owner provided data and is sized for 1,400 cfm per room. They operate at 50% during winter months to maintain the required 4 air changes per hour for moisture control and 100% during summer months for moisture control and cooling. B. Internal heat gains Heat load from the pigs is based on owner provided reports from the American Society of Animal Science and Iowa State University on heat and moisture production of swine. The values used in the simulations are shown in the table and chart below. The reports use different equations for calculating typical heat output for piglets, nursery pigs and finishing pigs. Each phase was treated independently without attempting to normalize the heat output between the different stages. Effects of reduced nocturnal temperature on pig performance and energy consumption in swine nursery rooms November 25, 2014 American Society of Animal Science - L.J. Johnston, M. C. Brumm, S. J. Moeller, S. Pohl, M. C. Shannon, and R. C. Thaler Heat and Moisture Production of Growing-Finishing Gilts as Affected by Environmental Temperature Iowa State University - Tami M. Brown-Brandt, John A. Nienaber, Roger Eigenberg, Hongwei Xin Barn Type (lbs) (Btu/h) Farrowing Nursery Finishing Sow Start Start , Piglet End End ARLINGTON / BOSTON / MEXICO CITY / MINNEAPOLIS / NEW YORK / PHILADELPHIA / PRINCETON / PUEBLA / ROCHESTER / STAMFORD 10 of 30

127 Baseline Building Calibration Results 1 The charts below demonstrate the total annual energy use, in millions of Btu s (MBtu), of each of the three barn types and the breakdown by percentage of their end use energy. The predominant energy use for each barn is natural gas heating. The comparison chart shows the percent energy use by barn out of the total energy used by the swine program facilities. The following calibration graphs show the average daily temperature and total heating energy requirement for each barn as well as the total daily fan power all in relation to the average outdoor ambient temperatures. 1 Building energy modeling is a comparative tool used for understanding the relative impact of alternate strategies and systems on annual energy use and cost. Energy modeling is not an absolute predictor of actual energy use or cost and shall not be relied on to predict actual building performance. Changes in construction, variable weather conditions, operational characteristics, end-user input, miscellaneous electrical and gas loads, controls alterations and other unpredictable metrics prevent energy models from predicting the actual annual energy consumption of any facility. ARLINGTON / BOSTON / MEXICO CITY / MINNEAPOLIS / NEW YORK / PHILADELPHIA / PRINCETON / PUEBLA / ROCHESTER / STAMFORD 11 of 30
128 1) Farrowing barn baseline calibration graphs ARLINGTON / BOSTON / MEXICO CITY / MINNEAPOLIS / NEW YORK / PHILADELPHIA / PRINCETON / PUEBLA / ROCHESTER / STAMFORD 12 of 30

129 2) Nursery barn baseline calibration graphs ARLINGTON / BOSTON / MEXICO CITY / MINNEAPOLIS / NEW YORK / PHILADELPHIA / PRINCETON / PUEBLA / ROCHESTER / STAMFORD 13 of 30
130 3) Finishing barn baseline calibration graphs ARLINGTON / BOSTON / MEXICO CITY / MINNEAPOLIS / NEW YORK / PHILADELPHIA / PRINCETON / PUEBLA / ROCHESTER / STAMFORD 14 of 30
131 Energy Conservation Measures 2 Energy conservation measures (ECMs) will be reviewed based on their return on investment, contribution to a net zero building and on their ability to improve the space conditions for the building occupants (swine and humans). The energy conservation measures that were modeled are as follows: 1. Lighting a. Lighting i. LED conversion ii. Photo sensors (daylight harvesting) 2. Ventilation a. Natural ventilation i. Solar chimney ii. Curtain sided barns b. Mechanical ventilation i. Earth tube outside air pre-conditioning ii. Exhaust air energy recovery iii. Variable speed fans iv. High volume low speed (HVLS) overhead fans 3. Heating and cooling a. Heat lamp controllers (Farrowing) b. Night temperature setback c. Renewable energy d. Mechanical energy i. Water-to-water heat pumps ii. Air conditioning (traditional) iii. Air conditioning (geothermal) Lighting Lighting ECMs LED conversion - Nursery Lighting power for the nursery comprises nearly half of the total electrical use on an annual basis. The lights are simulated as running for 8 hours per day, every day of the year. The current lighting is fluorescent with a total wattage of 4,560 watts with all lights running. The existing barn lighting is from T-12 fluorescent fixtures. A T-12 typically produces about 60 lumens per watt as opposed to LEDs that are about 90 lumens per watt. According to the 2002 Swine Care Handbook, the recommended lighting level for a nursery is 10 foot candles (fc). Based on this value an LED lighting design with an efficiency of 90 lumens/watt would result in a total lighting power for the nursery of about 1,200 watts. There is a larger savings in this barn based on the existing lighting being oversized. In addition to the energy savings, LEDs typically have a lifespan of 2 to 3 times that of fluorescent bulbs which would reduce the labor and replacement costs. The farrowing barn has similar potential for energy savings from an LED conversion. The finishing barn has already been converted to LED under a previous project. 2 Building energy modeling is a comparative tool used for understanding the relative impact of alternate strategies and systems on annual energy use and cost. Energy modeling is not an absolute predictor of actual energy use or cost and shall not be relied on to predict actual building performance. Changes in construction, variable weather conditions, operational characteristics, end-user input, miscellaneous electrical and gas loads, controls alterations and other unpredictable metrics prevent energy models from predicting the actual annual energy consumption of any facility. ARLINGTON / BOSTON / MEXICO CITY / MINNEAPOLIS / NEW YORK / PHILADELPHIA / PRINCETON / PUEBLA / ROCHESTER / STAMFORD 15 of 30

132 Daylight harvesting - Nursery The existing lighting is controlled either manually or by automated scheduling. The building has windows that allow natural light into the spaces and the addition of a photometric controller would reduce the total energy consumed by the lighting over the course of the year. Based on the 2002 Swine Care Handbook, a value of 10 foot candles was used as the minimum lighting level desired for a nursery barn. The lighting energy was reduced by nearly 40% or about 400 dollars per year for this facility. This is using a basic on/off control strategy that utilizes inexpensive individual room controllers. The Daily Lighting Energy Use graph shown below shows the energy use of the lights as they are currently controlled vs with daylight sensor control. This ECM currently applies to only the nursery because it is the only one of the three barns with existing windows. Any facility that has existing windows would be eligible for this ECM. As the heating load is primarily driven by the winter ventilation air, the reduction in envelope thermal value due to windows would not represent a significant change in the heating requirement in order to achieve daylighting savings. The peak heating load for the nursery occurs in the simulation at midnight in December with an outdoor temperature of negative eighteen degrees (-18 F). At this time, the total heating required is 215 kbtu/h. Of this, the building envelope load contributes about 6.5 kbtu/h with the windows representing about one quarter of that amount. Ventilation Natural Ventilation Solar chimney/thermal chimney- Solar/thermal chimneys use the sun s heat to increase the stack effect drawing air out of the barn. A solar chimney could be sized to induce outdoor air into the barns without the use of fans. Ventilation is required 24 hours per day, so fans would still be required to supplement and back up the flow of the chimney when there is not sufficient temperature differential between the interior space and the chimney to maintain flow. ARLINGTON / BOSTON / MEXICO CITY / MINNEAPOLIS / NEW YORK / PHILADELPHIA / PRINCETON / PUEBLA / ROCHESTER / STAMFORD 16 of 30
133 The nursery has a max ventilation rate of 74,000 cfm. In order to achieve this, a thermal chimney would require about 240 square feet of chimney cross sectional area that is about 10 feet tall and maintains a 50 F temperature rise vs the interior barn temperature. At a typical depth of one foot, the length of the chimney would be more than the full length of the barn. These values were derived from formulas in the 1997 ASHRAE Fundamentals handbook. If the temperature difference is less than 50 F there may still be airflow but it would be reduced from the desired rate. The total fan energy use is 6,400 kwh at a cost of $615/year. Because of the size of the chimney required, the cost to retrofit, even with basic materials, would be at least $6,000, and at best would offset about 1/3 of the total fan energy resulting in a payback of around 30 years. There are other issues with the controllability of the air flow rate and the impact on the space temperature. Curtain sided construction- Curtain sided construction can eliminate a large percentage of the fan energy used for a barn but also increases the heating demand due to the reduced insulation value of the curtains. The nursery and farrowing barns require year round heating for the piglets and would not be well suited for curtain sided construction. This ECM was only modeled for the finishing barn. Mechanical Ventilation Earth tube pre-conditioning- This is a method of tempering the outside air that is required for ventilation and moisture control by drawing it through ductwork buried in the ground. The air will absorb or reject heat to the ground, and the reduced winter heat load is the primary benefit along with moderate summer cooling. This is at the expense of increased fan power due to the pressure drop caused by the required buried ductwork. Data used for analysis of this ECM was taken from the article Earth Tempering of Ventilation Air from the Pork Industry Handbook, September The article was authored by Warren Goetsch from the University of Illinois, Larry Jacobson from the University of Minnesota, Randall Reeder from Ohio State University, and Dennis Stombough from Ohio State University. Per this paper, the required piping for each barn was determined using 10 diameter pipe at 300 cfm per 150 foot length and buried at a minimum starting depth of 6 below grade and sloped to a common sump location to handle condensation. The duct sizing indicated in this ECM is only intended to be used as a starting point for investigating the potential benefit of this strategy. ARLINGTON / BOSTON / MEXICO CITY / MINNEAPOLIS / NEW YORK / PHILADELPHIA / PRINCETON / PUEBLA / ROCHESTER / STAMFORD 17 of 30

134 i) Farrowing The total heating energy requirement is reduced by about 28% from 4,600 therms to 3,250 therms. The pit fan energy use increases by a little more than 2.5 times from 1,100 kwh to 2,800 kwh due to the increase in pressure drop from the earth tube ducting. The winter minimum outside air flow rate to achieve 4 air changes per hour is 1,400 cfm. This would require a minimum of five 10 pipe runs with a rough cost of between $10,000 and $15,000 based on 2014 RS Means Mechanical Cost Data. ii) Nursery The total heating energy requirement is reduced by about 36% from 5,200 therms to 3,300 therms. The pit fan energy use increases by a little more than 2.5 times from 2,500 kwh to 6,500 kwh due to the increase in pressure drop from the earth tube ducting. The winter minimum outside air flow rate to achieve 4 air changes per hour is 3,200 cfm. This would require a minimum of eleven 10 pipe runs with a rough cost of between $20,000 and $30,000 based on 2014 RS Means Mechanical Cost Data. iii) Finishing The total heating energy requirement is reduced by about 40% from 1,200 therms to 700 therms. The pit fan energy use increases by a little more than 2.5 times from 1,100 kwh to 2,800 kwh due to the increase in pressure drop from the earth tube ducting. The winter minimum outside air flow rate to achieve 4 air changes per hour is 1,400 cfm. This would require a minimum of five 10 pipe runs with a rough cost of between $10,000 and $15,000 based on 2014 RS Means Mechanical Cost Data. ARLINGTON / BOSTON / MEXICO CITY / MINNEAPOLIS / NEW YORK / PHILADELPHIA / PRINCETON / PUEBLA / ROCHESTER / STAMFORD 18 of 30
135 Construction of the earth tube heat exchanger system requires deep trenches to be excavated representing the majority of the cost of this ECM. As long as the geology around the barn is favorable and the cost to excavate is not too high there is large potential for heating savings that could result in paybacks as low as 10 years. Exhaust air energy recovery- For the majority of the year the indoor temperatures are higher than the outdoor ambient temp and there is constant ventilation requirement that has a net cooling effect on the space as cooler air is drawn in and warm air is exhausted out. Recovering the heat from the warm pit exhaust air stream would help to reduce the heating demand on the space. There is greater potential to recover heat from an exhaust air energy recovery heat exchanger than with the earth tube system previously discussed due to the barn exhaust temperature being higher than the ground temperature as well based on the efficiency of the heat exchange material. The downsides of this method are increased fan power due to the added pressure drop of the heat exchanger as well as reduced heat exchanger life due to the corrosive air that is exhausted from the building. An added constraint is that the typical exhaust air paths would have to be rerouted to facilitate energy recovery as well as implementation of daily or weekly cleaning and maintenance. The article Heat Exchangers in Swine Facilities written by Larry D. Jacobson, University of Minnesota; Martin L. Hellickson, Oregon State University; Jay D. Harmon, Iowa State University was referenced during the investigation of this ECM. Exhaust air energy recover was not modeled or included in the final summary primarily due to the maintenance required to operate. Variable speed fans- This ECM had initially been designed to analyze the use of a single central fan with variable speed control as a replacement for the distributed wall mounted fans currently in use. Due to the extensive conversion that would be required to the exhaust/ventilation system, the ECM was changed to look at control of the existing fans. The use of a variable speed drive or a fan that has an electrically commutated motor can help to save energy when less than 100% of fan flow is required. The fans can be controlled to run at reduced RPM based on the interior temperature. Reducing the fan speed as opposed to cycling the fans on and off can show positive savings. To evaluate this, the finishing barn was tested by switching the calibration fan control from cycling to variable speed and there was a savings of about 7% of the total fan power. There are drawbacks to this strategy including reduced static pressure, which can be an issue in high wind conditions as well as poor mixing of air in the space. High volume low speed overhead fans- This ECM is not being pursued based on physical space constraints and reduced life expectancy of equipment due to being located in corrosive environments. Heating and Cooling Heat Lamp Controllers (Farrowing barn only) Heat lamps are used in the farrowing barn to keep the new born piglets warm. These are currently uncontrolled and run 24 hours per day when switched on. Several options exist for thermostatic control of heat lamps including the HerdStar MicroZone controller which can automatically adjust heat lamp output based on ambient conditions and piglet growth. HerdStar s literature states that when implemented in facilities without any automatic controls they typically see savings of around 40% with payback periods of less than one year in most cases. ARLINGTON / BOSTON / MEXICO CITY / MINNEAPOLIS / NEW YORK / PHILADELPHIA / PRINCETON / PUEBLA / ROCHESTER / STAMFORD 19 of 30

136 Night Temperature Setback i) Farrowing N/A ii) Nursery This ECM uses a 15 degree temperature setback at night from 7pm to 7am. The setback temperature would vary depending on the size of the pigs in the room from no setback for the first week to 55 F during the last week they are in the nursery. The overall savings is about 18% and due to the relative low cost of adjusting temperature setpoint schedules, this is an effective ECM that helps reduce heating energy use. At the WCROC facility, this reduces natural gas usage by about 930 therms per year. iii) Finishing This ECM uses a 15 degree temperature setback at night from 7pm to 7am. The overall savings is about 38% and due to the relative low cost of adjusting temperature setpoint schedules this is an effective ECM that helps reduce heating energy use. The minimum setback temperature is 53 F. At the WCROC facility, this reduces natural gas usage by about 470 therms per year. The higher savings for the finishing barn is due to the higher heat output by the larger pigs as well as the whole barn being setback to 53 F as opposed to the higher temperatures required during setback in the nursery. The simple paybacks of this ECM are less than one year due to the low cost of implementation. The cost associated with this was assumed to be a single visit from a controls contractor. Solar Air Heating The barns require a large amount of outside air that is required for moisture and contaminant control. Solar air heating panels can provide free heating but only during daylight. Outside air is required 24 hours per day, so there is only a partial offset to the heating requirement. It does have the potential to be constructed on site for a lower cost than commercially available panels, but at the cost of efficiency which is already quite low due to the heat capacity of air. ARLINGTON / BOSTON / MEXICO CITY / MINNEAPOLIS / NEW YORK / PHILADELPHIA / PRINCETON / PUEBLA / ROCHESTER / STAMFORD 20 of 30
137 The following graph shows a typical week in February. The window for free heat is about 8 to 9 hours and this correlates with the time of day with the lowest heating demand. This is based on a 400 SF south facing solar collector. Water-to-water Heat Pump (Simultaneous heat/cool) This ECM is being specifically targeted toward the farrowing barn due to the need for simultaneous heating and cooling of the piglets and sows. The system would consist of a water to water heat pump that would supply approximately F water to hydronic heating pads in the piglet crates and 70 F water to cooling pads in the sow crates. The system would be sized to replace the existing infrared electric heat lamps that serve the piglet areas. The system would be controlled to maintain a desired surface temperature for the piglets and any available cooling capacity would be sent to the sow crates. In addition to eliminating the need for the heat lamps, this system would allow lower overall space temperatures in the barns, reducing the natural gas heating load. i) Farrowing The heating lamps total 4 kw of total power which is about 13,500 Btu/h. This would mean that about 1 ton of cooling would be available for the sows. As part of a previous proposal, AKF sized a cooling only sow pad system at 7.5 tons, so it is not anticipated that this approach would significantly benefit the sows. The smallest commercial water-to-water units available are 2 tons and at the required temperatures the heat pump would use a little under 2 kw. The two circulation pumps would each have fractional horse power motors and would use less than 1 kw total. A temperature controller would be used to maintain the surface temperature of the heating pads so that the system would not be required to run continuously as the existing heat lamps are being controlled. Due to the limitations of the modeling software, this ECM is not able to be directly modeled. A conservative estimate for the savings would be to reduce the energy use of the existing heat lamps by one third. Due to ARLINGTON / BOSTON / MEXICO CITY / MINNEAPOLIS / NEW YORK / PHILADELPHIA / PRINCETON / PUEBLA / ROCHESTER / STAMFORD 21 of 30

138 the high cost of implementing this ECM, it may not be feasible based on the long payback timeframe but may be worth further investigation if there is a higher priority on animal comfort and net zero energy use. ii) Nursery N/A iii) Finishing N/A Air Conditioning - Traditional air cooled direct expansion (DX) The barns currently do not have any cooling capability other than drawing large volumes of outside air through the space to remove heat. Based on the existing fans and typical design for enclosed barns a maximum air flow rate of 100 air changes per hour is possible. During a peak design condition the swine rooms will be approximately 2 degrees F warmer than the outdoor temperature during that hour. Adding mechanical cooling with air cooled equipment is not directly an energy conservation measure but done more as a way to improve the environmental conditions for the swine and farmers. The addition of cooling does allow for the peak outside airflow rate to be reduced while still maintaining reduced indoor temperatures. Limiting all fans to 50% of their peak flow rate saves enough fan power to offset the added power of the DX cooling equipment. In order to avoid issues with reduced equipment life and intensive cleaning and maintenance of the equipment, this ECM is modeled as conditioning outdoor air only with no recirculation of air from the space. i) Farrowing Air conditioning was not analyzed for the farrowing barn due to the heating requirement of the piglets. ii) Nursery Eight tons of air conditioning was added to the nursery and used to reduce the temperature of the incoming ventilation air. The following graph shows the effect of the air cooled DX system on the peak space temperature of one of the rooms in the nursery barn in the middle of June. The use of the air conditioning keeps the room up to 3 degrees cooler during peak conditions than by using a high air exchange rate only. ARLINGTON / BOSTON / MEXICO CITY / MINNEAPOLIS / NEW YORK / PHILADELPHIA / PRINCETON / PUEBLA / ROCHESTER / STAMFORD 22 of 30
139 iii) Finishing Ten tons of air conditioning was added to the finishing barn and used to reduce the temperature of the incoming ventilation air. The DX air conditioning system has a similar effect on the finishing barn while showing greater fan power savings. While traditional air conditioning has a positive effect on stabilizing and lowering the peak indoor temperatures of the barns as well as reducing the required fan power, there is very little savings in energy cost or energy use. This equates to long payback periods that do not justify this ECM unless the goal is to provide better thermal comfort for the pigs which may have positive results in health and growth. Air Conditioning - Geothermal heat exchange Similar to the air source DX cooling ECM, this option would add cooling capacity to the swine rooms and help to maintain the room temperatures closer to setpoints during warmer summer conditions. Due to the use of the well field, the system is also capable of heating the barn. The geothermal heat exchange system rejects heat to the ground during the cooling season and extracts heat from the ground during the heating ARLINGTON / BOSTON / MEXICO CITY / MINNEAPOLIS / NEW YORK / PHILADELPHIA / PRINCETON / PUEBLA / ROCHESTER / STAMFORD 23 of 30
140 season. Due to an imbalance in the heating and cooling profile, the well field must be oversized to prevent possible freezing conditions. i) Farrowing The geothermal air conditioning would be sized to both heat and cool the entire barn. This would require about 7.5 tons of capacity per room in order to offset the full heating load. A typical installation would require one 200 foot deep vertical well for each ton of cooling. The HVAC system would consist of air handling units that would heat or cool the ventilation air. The following graph shows the effect of the geothermal system on the peak space temperature of one of the rooms in the farrowing barn in the middle of June. As the geothermal system has been sized for heating capacity, this means there is additional cooling capacity that keeps the peak indoor temperature lower than with the air cooled DX system. These charts show the effect of converting the full heating load over to the geothermal system as well as adding cooling. The result is a large reduction in total energy use as the primary benefit. ARLINGTON / BOSTON / MEXICO CITY / MINNEAPOLIS / NEW YORK / PHILADELPHIA / PRINCETON / PUEBLA / ROCHESTER / STAMFORD 24 of 30


141 ii) Nursery The geothermal air conditioning would be sized to both heat and cool the entire barn. This would require about 10 tons of capacity per room in order to offset the full heating load. A typical installation would require one 200 foot deep vertical well for each ton of cooling. The HVAC system would consist of air handling units that would heat or cool the ventilation. The following graph shows the effect of the geothermal system on the peak space temperature of one of the rooms in the nursery barn in the middle of June. As the geothermal system has been sized for heating capacity, this means there is additional cooling capacity that keeps the peak indoor temperature lower than with the air cooled DX system. These charts show the effect of converting the full heating load over to the geothermal system as well as adding cooling. The result is a large reduction in total energy use as the primary benefit. ARLINGTON / BOSTON / MEXICO CITY / MINNEAPOLIS / NEW YORK / PHILADELPHIA / PRINCETON / PUEBLA / ROCHESTER / STAMFORD 25 of 30
142 iii) Finishing The geothermal air conditioning would be sized to both heat and cool the entire barn. This would require about 8 tons of capacity per room in order to offset the full heating load. A typical installation would require one 200 foot deep vertical well for each ton of cooling. The HVAC system would consist of air handling units that would heat or cool the ventilation air. The following graph shows the effect of the geothermal system on the peak space temperature of one of the rooms in the finishing barn in the middle of June. As the geothermal system has been sized for heating capacity, this means there is additional cooling capacity that keeps the peak indoor temperature lower than with the air cooled DX system. These charts show the effect of converting the full heating load over to the geothermal system as well as adding cooling. The result is a large reduction in total energy use as the primary benefit. ARLINGTON / BOSTON / MEXICO CITY / MINNEAPOLIS / NEW YORK / PHILADELPHIA / PRINCETON / PUEBLA / ROCHESTER / STAMFORD 26 of 30
143 While the geothermal option represents an overall energy use reduction, the cost of electricity is higher so there are not large energy cost savings to go along with it. In addition, the installation cost of the vertical wellfield means that the simple payback for this ECM would be well over 100 years for all three barns. It would be possible to downsize the systems to reduce the installed cost, but this would still require the use of the natural gas heaters and there would be less of an energy savings. Unless the projects are seeking net zero energy use or had more favorable utility costs, such as propane for heating, this ECM may have too long of a payback timeframe to be considered further. Summary Table ECM Barn Electrical Natural Gas Propane Energy Energy Cost Energy Cost Installed Cost Natural Gas Propane Savings Savings Savings Savings Savings Savings Opinion* Payback Payback (kwh/yr) (therms/yr) (gallons/yr) (MBtu) ($) Propane ($/yr) ($) (yrs) (yrs) LED Lighting [Total fixture replacement] Nursery 6,173 (88) (97) , Daylight Harvesting Nursery 4,999 (70) (77) , Solar Chimney Nursery 2, , Curtain Sided Barn [New construction only] Finishing 10,607 (224) (246) Earth Tube Pre-conditioning Farrowing (1,736) 1,349 1, ,353 10, Nursery (4,388) 1,899 2, ,125 20, Finishing (1,873) , Variable Speed Fans Nursery 1, , Finishing , Heat Lamp Controllers Farrowing 7,431 (194) (213) , Night Temperature Setback** Nursery , , Finishing Water to Water Heat Pump Farrowing 7, , Air Conditioning (Traditional) Nursery 2,593 (17) (19) , Finishing 3, , Air Conditioning (Geothermal) Farrowing (30,671) 4,607 5, , , Nursery (34,711) 4,634 5, , ,000 3, Finishing (4,780) 1,229 1, , , *Based on other recent projects or using RS Means data **This ECM would realize electrical energy use savings from reduced heating unit fan run time but is not shown due to modeling software limitations The following charts compare the annual energy use and energy cost for the calibrated baseline model against the ECM s that were simulated for each barn type. There are two sets of charts one set showing natural gas as the heating fuel and one set showing propane as the heating fuel. The charts DO NOT consider the installation costs of the various ECMs, only the annual costs from fuel use. The solid bars in the charts show the annual gas and electric energy usage while the wider translucent bars show the associated costs of that usage. Electricity usage and costs are shown with red bars and fuel (natural gas or propane) usage and costs are shown with blue bars. The charts show at a glance if a reduction in energy usage results in a reduction in energy costs. ARLINGTON / BOSTON / MEXICO CITY / MINNEAPOLIS / NEW YORK / PHILADELPHIA / PRINCETON / PUEBLA / ROCHESTER / STAMFORD 27 of 30


144 ECM Annual Energy Use and Cost Comparison Charts Natural Gas Heating ARLINGTON / BOSTON / MEXICO CITY / MINNEAPOLIS / NEW YORK / PHILADELPHIA / PRINCETON / PUEBLA / ROCHESTER / STAMFORD 28 of 30


145 ECM Annual Energy Use and Cost Comparison Charts Propane Heating ARLINGTON / BOSTON / MEXICO CITY / MINNEAPOLIS / NEW YORK / PHILADELPHIA / PRINCETON / PUEBLA / ROCHESTER / STAMFORD 29 of 30
Electric and Thermal Energy Consumption in Commercial Swine Facilities
 Electric and Thermal Energy Consumption in Commercial Swine Facilities KIRSTEN SHARPE UNIVERSITY OF MINNESOTA WEST CENTRAL RESEARCH AND OUTREACH CENTER University of MN s Research and Outreach Centers
RENEWABLE & EFFICIENT ENERGY SYSTEMS FOR MIDWEST FARMS. Eric Buchanan Renewable Energy Scientist West Central Research and Outreach Center
 RENEWABLE & EFFICIENT ENERGY SYSTEMS FOR MIDWEST FARMS Eric Buchanan Renewable Energy Scientist West Central Research and Outreach Center WCROC Farm Site in Morris 1 of 9 University research and outreach
Author(s) First Name Middle Name Surname Role Joseph M. Zulovich Ph.D., P.E., Extension Assistant Professor, Commercial Agricultural Engineer
 First Name Middle Name Surname Role Joseph M. Zulovich Ph.D., P.E., Extension Assistant Professor, Commercial Agricultural Engineer") Author(s) First Name Middle Name Surname Role Joseph M. Zulovich Ph.D., P.E., Extension Assistant Professor, Commercial Agricultural Engineer Affiliation Organization URL Email Livestock Housing Systems;
Author(s) First Name Middle Name Surname Role Joseph M. Zulovich Ph.D., P.E., Extension Assistant Professor, Commercial Agricultural Engineer Affiliation Organization URL Email Livestock Housing Systems;
Using Wind Energy on Farms
 Using Wind Energy on Farms Presented by: Michael Reese, Renewable Energy Director West Central Research and Outreach Center Presented at: 13 th Annual Small Wind Conference Bloomington, MN April 10, 2017
Reducing Energy Costs in Swine Barns
 Reducing Energy Costs in Swine Barns B. Predicala, E. Navia, L. Whittington, J. Patience Prairie Swine Centre Inc. Saskatoon, Saskatchewan 26 September 2007 Presentation Outline Background Project Objectives
Using Renewable Energy in Dairy Production. Brad Heins West Central Research and Outreach Center Morris, MN
 Using Renewable Energy in Dairy Production Brad Heins West Central Research and Outreach Center Morris, MN WCROC Dairy Herds Organic herd 130 cows 40 lbs milk, 4.4% fat, 3.5% protein, 265 SCC Milk price:
Energy Efficiency on the Farm
 Energy Efficiency on the Farm June 14, 2017 Josh Ludgate (Exact Energy Inc.) and Erin Puryear (ODEC) How do farms use electricity? Water heating, space heating Grain Drying, Aeration Feed augers, manure
Food Defense Assignment Due: Name:
 Food Defense Assignment Due: Name: Student ID: Using the swine facility map and accompanying text: 1. Label the following: a. All entrances and doors b. Electric, water and gas shut offs c. Storage areas
Construction Resource Use of Different Types and Scales of Swine Production Facilities
 Animal Industry Report AS 655 ASL R2471 2009 Construction Resource Use of Different Types and Scales of Swine Production Facilities Peter J. Lammers Iowa State University Mark S. Honeyman Iowa State University,
Two-litter Outdoor Farrowing System Budget
 Two-litter Outdoor Farrowing System Budget Benjamin Larson, senior undergraduate; Mark Honeyman, associate professor of animal science; and James Kliebenstein, professor of economics ASL-R1501 Summary
Born in Canada and Raised in the USA
 Born in Canada and Raised in the USA Greg Howard Vice President, Chief Operating Officer Premium Pork A look at a large cross border farrow to finish operation Premium Pork is a farrow to finish system
Unit 2: Understanding Common Energy Conversion Systems. Lesson Objectives: Introduction. Lesson
 Unit 2: Understanding Common Energy Conversion Systems Lesson 4 - Electric Energy & Power Approximate Lesson Length: 3 hours Subject Line for Email: SCI24U2L4 Lesson Objectives: Upon completion of this
Economics of Breeding, Gestating and Farrowing Hogs in Natural Pork Production; Financial Comparison
 Animal Industry Report AS 652 ASL R2165 2006 Economics of Breeding, Gestating and Farrowing Hogs in Natural Pork Production; Financial Comparison Denis Reich Iowa State University James B. Kliebenstein
Farm Energy IQ. Farms Today Securing Our Energy Future. Farm Energy Efficiency Principles Tom Manning, New Jersey Agricultural Experiment Station
 Farm Energy IQ Farms Today Securing Our Energy Future Farm Energy Efficiency Principles Tom Manning, New Jersey Agricultural Experiment Station Farm Energy IQ Farm Energy Efficiency Principles Tom Manning,
Farm Energy IQ. Farm Energy Efficiency Principles 2/16/2015. Farm Energy Efficiency. Basic Energy Principles
 Farm Energy IQ Farm Energy IQ Farms Today Securing Our Energy Future Farm Energy Efficiency Principles Tom Manning, New Jersey Agricultural Experiment Station Farm Energy Efficiency Principles Tom Manning,
Challenges and Emerging Needs for the Next Generation of Swine Production Facilities
 Challenges and Emerging Needs for the Next Generation of Swine Production Facilities Jay D. Harmon, PhD, PE, Professor Steve J. Hoff, PhD, PE, Professor Brett Ramirez, PhD Candidate Agricultural & Biosystems
Life Cycle Energy and Carbon Footprint in Midwest Dairies
 Life Cycle Energy and Carbon Footprint in Midwest Dairies MIDWEST FARM ENERGY CONFERENCE JUNE 18 TH MORRIS, MINNESOTA Joel Tallaksen, Brad Heins, Michael Reese With lot of help from others! West Central
Economic Impacts from Increasing Pig Farrowing in Iowa
 Animal Industry Report AS 654 ASL R2365 2008 Economic Impacts from Increasing Pig Farrowing in Iowa Erik M. Guffy Daniel M. Otto James B. Kliebenstein Michael D. Duffy Recommended Citation Guffy, Erik
Many issues to consider when planning & designing a new dairy facility- Process Flows Water Flow Land Flow Manure Flow Cow Flow Feed Flow Traffic Flow
 Many issues to consider when planning & designing a new dairy facility- Process Flows Water Flow Land Flow Manure Flow Cow Flow Feed Flow Traffic Flow Systemic Personnel Flow Visitor Flow Growth (future)
Energy Assessment Report Clayville Elementary School DRAFT October George Washington Highway, Clayville, RI DRAFT
 Report Clayville Elementary School October 2016 3 George Washington Highway, Clayville, RI 02815 Clayville Elementary School Summary of Findings On behalf of the School Building Authority at Rhode Island
Using Renewable Energy in Dairy Production. Brad Heins West Central Research and Outreach Center Morris, MN
 Using Renewable Energy in Dairy Production Brad Heins West Central Research and Outreach Center Morris, MN WCROC Dairy Herds Organic herd 130 cows 40 lbs milk, 4.4% fat, 3.5% protein, 265 SCC Milk price:
Chapter Fourteen: SUMMARY AND CONCLUSIONS
 Chapter Fourteen: SUMMARY AND CONCLUSIONS Chris Hurt The pork industry is changing rapidly. These changes not only are numerous but they are also complex, and they are threatening to most producers and
2/17/2017. Energy Accounting & Education. Topics (Electricity) Creating Electricity
 Creating Electricity") Energy Accounting & Education Energy Managers Kermit King School District of La Crosse John Daily School District of Holmen 1 Topics (Electricity) Creating electricity Defining degree days Customer charges
Energy Accounting & Education Energy Managers Kermit King School District of La Crosse John Daily School District of Holmen 1 Topics (Electricity) Creating electricity Defining degree days Customer charges
...and we p r o v i d ed it
 Y o u t o l d u s w h a t y o u n e e d e d... Powerful, versatile environmental control for your whole barn, building, or greenhouse Trust worthy, reliable performance over the whole productive life of
Demonstrating a Swedish Feeder Pig Production System in Iowa
 Demonstrating a Swedish Feeder Pig Production System in Iowa M. S. Honeyman, associate professor of animal science D. Kent, livestock research specialist ASL-R1390 Summary and Implications At the Iowa
SOUTH DAKOTA BOARD OF REGENTS. Committee on Budget and Finance ******************************************************************************
 SOUTH DAKOTA BOARD OF REGENTS Committee on Budget and Finance AGENDA ITEM: III M DATE: December 12-13, 2012 ****************************************************************************** SUBJECT: SDSU
Mapping for manure management Written by Diane Mettler
 1 of 6 02/07/2009 10:15 AM Mapping for manure management Written by Diane Mettler By employing new manure mapping technologies and through their own progressive initiatives, Iowa s Van Gilst brothers are
Revised Estimated Returns Series Beginning in 2007
 Revised Estimated Returns Series Beginning in 2007 The Economics Department at Iowa State University has prepared monthly Estimated Returns to Feeding Livestock in Iowa since the 1960s. Each month the
HOBO Plug Load Logger (UX ) Manual
 Manual") HOBO Plug Load Logger (UX120-018) Manual The HOBO Plug Load logger is designed to monitor energy consumption of AC-powered plug in loads. This compact device can be used as a power meter with its built-in
HOBO Plug Load Logger (UX120-018) Manual The HOBO Plug Load logger is designed to monitor energy consumption of AC-powered plug in loads. This compact device can be used as a power meter with its built-in
Livestock Enterprise. Budgets for Iowa 2017 File B1-21. Ag Decision Maker
 Livestock Enterprise Ag Decision Maker Budgets for Iowa 2017 File B1-21 This publication contains estimates of production costs for common livestock enterprises in Iowa. Estimates are intended to reflect
Cost of Organic Pork Production: A Seasonal Analysis and Needed Price Premium for Continuous Production
 Cost of Organic Pork Production: A Seasonal Analysis and Needed Price Premium for Continuous Production By James Kliebenstein 1, Sean Hurley 2, Ben Larson 1, and Mark Honeyman 1 1 Kliebenstein, Larson
Confinement Sow Gestation and Boar Housing
 Confinement Sow Gestation and Boar Housing Originally published as PIH-28. Authors: Gilbert R. Hollis, Texas A & M University L. Bynum Driggers, North Carolina State University Arthur J. Muehling, University
Livestock Enterprise. Budgets for Iowa 2010 File B1-21. Ag Decision Maker
 Livestock Enterprise Ag Decision Maker Budgets for Iowa 2010 File B1-21 This publication contains estimates of production costs for common livestock enterprises in Iowa. Estimates are intended to reflect
your source for innovative solutions
 your source for innovative solutions automated production systems automated production systems Automated Production Systems Your Source For Innovative Solutions diversity global network For more information,
Livestock Enterprise. Budgets for Iowa 2008 File B1-21. Ag Decision Maker
 Livestock Enterprise Ag Decision Maker Budgets for Iowa 2008 File B1-21 This publication contains estimates of production costs for common livestock enterprises in Iowa. Estimates are intended to reflect
Saving Energy on Electric, Lighting and Water Systems
 Sponsored by Nexus Greenhouse Systems Saving Energy on Electric, Lighting and Water Systems Terms & Conditions of Use Proper installation and maintenance of all electronic systems can lead to significant
Greenhouse Gas Emission Study and Model for Swine Barn Operations. Two Topics for This Talk. Both efforts were funded by the National Pork Board
 Greenhouse Gas Emission Study and Model for Swine Barn Operations Dr. Rick Ulrich University of Arkansas rulrich@uark.edu (479) 575-5645 Webinar 1 Two Topics for This Talk How much GHG is emitted from
Commercial Energy Savings Guide
 Commercial Energy Savings Guide www.touchstoneenergy.coop Commercial Energy Saving Tips This guide provides basic hints on ways to reduce energy costs for business customers. All Touchstone Energy cooperatives
DRAFT REPORT. November Tim Sexton, Division of Soil and Water Conservation, Virginia Department of Conservation and Recreation, Richmond, VA
 Recommendations to Estimate Swine Nutrient Production in the Phase 6 Watershed Model DRAFT REPORT Report to the Agricultural Modeling Subcommittee and Agricultural Workgroup November 2016 Report generation
ECE 4901 Design I Fall Solar Panel & Solar Thermal Heating Project (UConn Spring Valley Farm) Project Proposal
 Project Proposal") ECE 4901 Design I Fall 2014 Solar Panel & Solar Thermal Heating Project (UConn Spring Valley Farm) Project Proposal Faheem Dalal (EE), Jorge Llivichuzhca (EE), Stephanie Mesick (EE) Faculty advisor: Dr.
ECE 4901 Design I Fall 2014 Solar Panel & Solar Thermal Heating Project (UConn Spring Valley Farm) Project Proposal Faheem Dalal (EE), Jorge Llivichuzhca (EE), Stephanie Mesick (EE) Faculty advisor: Dr.
Utilities Used in Production 129
 www.revenue.state.mn.us Utilities Used in Production 129 Sales Tax Fact Sheet 129 Fact Sheet What s New in 2017 We added information on different methods to calculate exempt utility percentages. Utility
CONSTRUCTION RESOURCE USE OF TWO DIFFERENT TYPES
 CONSTRUCTION RESOURCE USE OF TWO DIFFERENT TYPES AND SCALES OF IOWA SWINE PRODUCTION FACILITIES P. J. Lammers, M. S. Honeyman, J. D. Harmon, J. B. Kliebenstein, M. J. Helmers ABSTRACT. As global populations
Energy Efficient Tech and FUNDING for Swine and Poultry Fritz Ebinger Rural Energy Development Program Manager (612)
") Energy Efficient Tech and FUNDING for Swine and Poultry Fritz Ebinger Rural Energy Development Program Manager (612) 626-1028 ebing007@umn.edu 2013 Regents of the University of Minnesota. All rights reserved.
Energy Efficient Tech and FUNDING for Swine and Poultry Fritz Ebinger Rural Energy Development Program Manager (612) 626-1028 ebing007@umn.edu 2013 Regents of the University of Minnesota. All rights reserved.
Recommendations to Estimate Swine Nutrient Production in the Phase 6 Watershed Model
 Recommendations to Estimate Swine Nutrient Production in the Phase 6 Watershed Model November 21, 2016 Robb Meinen, PSU Mark Estienne, VT Tim Sexton, VA DCR Upcoming Conference of Interest 3 rd International
The Iowa Pork Industry 2008: Patterns and Economic Importance by Daniel Otto and John Lawrence 1
 The Iowa Pork Industry 2008: Patterns and Economic Importance by Daniel Otto and John Lawrence 1 Introduction The Iowa pork industry represents a significant value-added activity in the agricultural economy
Utilities Used in Production
 www.taxes.state.mn.us Utilities Used in Production 129 Sales Tax Fact Sheet 129 Fact Sheet Utility exemption Electricity, gas or steam used or consumed in agricultural or industrial production is exempt
Performance response of growing-finishing pigs to an air-cooled environment during a simulated hot weather growth period
 Performance response of growing-finishing pigs to an air-cooled environment during a simulated hot weather growth period Presented at MPB research committee Mtg August 25, 2015 Larry Jacobson, Lee Johnston,
Grant County Blake s Point RE, LLC information sheet for a sow farm
 Grant County Blake s Point RE, LLC information sheet for a sow farm February, Purpose: To produce high quality weaned piglets to supply family pork producers located in the Midwest. Why Grant County: Ag
19 A New Prefabricated 3,200 Sow Pig Unit and its Environmental Impact Assessment
 19 A New Prefabricated 3,200 Sow Pig Unit and its Environmental Impact Assessment Jorge F Meneses, CEER, Instituto Superior de Agronomia, Portugal A new 3,200 sow prefabricated pig unit was built this
16.3 Electric generators and transformers
 ElEctromagnEts and InductIon Chapter 16 16.3 Electric generators and transformers Motors transform electrical energy into mechanical energy. Electric generators do the opposite. They transform mechanical
Energy Assessments: What Are They Worth?
 Energy Assessments: What Are They Worth? A large farrow to wean swine operation located in Southern Alberta had an energy assessment performed on it in 2015. Over the course of the assessment it was found
Energy Savings with Heat Pads and Lighting
 Energy Savings with Heat Pads and Lighting R. E. Boris P.Eng., Manitoba Hydro, PO Box 815, Stn Main, Winnipeg, MB R2C 2P4 Email: rboris@hydro.mb.ca Heat Pads vs. Heat Lamps Summary The results from three
HOG PROFITS NARROW AS CORN PRICE RISKS RISE
 HOG PROFITS NARROW AS CORN PRICE RISKS RISE APRIL 2006 Chris Hurt 2006 NO. 3 After two years of notable profits, hog producers have started to worry about eroding hog prices and rising risk of higher corn
25 Years of Swine Research
 25 Years of Swine Research Original Facilities 250 sow farrow to wean unit was built in 1980 by the University of Saskatchewan. It consists of two 100 sow and one 50 sow units, each with its own gestation,
MEASUREMENT AND VERIFICATION GUIDELINES FOR RETROFIT AND NEW CONSTRUCTION PROJECTS
 EL PASO ELECTRIC COMPANY S LARGE COMMERCIAL AND INDUSTRIAL STANDARD OFFER PROGRAM MEASUREMENT AND VERIFICATION GUIDELINES FOR RETROFIT AND NEW CONSTRUCTION PROJECTS This document includes detailed information
A UCC Building permit is not required for the exceptions listed below for COMMERCIAL application: (403.42): Building construction for the following:
: Building construction for the following:") New buildings or renovations to existing buildings for which an application for a permit was made to the Department or a municipality before April 9, 2004. New buildings or renovations to existing buildings
New buildings or renovations to existing buildings for which an application for a permit was made to the Department or a municipality before April 9, 2004. New buildings or renovations to existing buildings
October 1998 ARPR 98-03
 October 1998 ARPR 98-03 Department of Agricultural and Resource Economics, Fort Collins, CO 80523-1172 http://dare.colostate.edu/pubs SWINE INDUSTRY ECONOMICS Jennifer Grannis and Andrew Seidl 1,2 Changes
ENERGY SAVINGS AND AUDIT SOLUTIONS SAVE ENERGY SAVE MONEY SAVE THE ENVIRONMENT
 ENERGY SAVINGS AND AUDIT SOLUTIONS SAVE ENERGY SAVE MONEY SAVE THE ENVIRONMENT TABLE OF CONTENTS Our Company Progress The Yehans Advantage Benefit to our Clients What is Energy Audit Energy Consumption
Hog Industry Ask Where All the Pigs Came From?
 Hog Industry Ask Where All the Pigs Came From? January 2002 Chris Hurt The year of 2001 resulted in pork supplies being up 1.1% with prices averaging $45.78 per live hundredweight. Increasing supplies
Areas to Discuss. Facility design and transport: the welfare connection. Classifying Non-ambulatory Pigs. Transport Losses: Definitions
 Areas to Discuss Facility design and transport: the welfare connection Dr. Matt Ritter 1 and Dr. Anna Johnson 1 ELANCO Animal Health Iowa State University Livestock Transport Conference Calgary, AB January
The Ex Ante Calculations match the claimed savings in the project tracking system.
 Project Information Project ID#: Measure: Ex Ante : Facility Type: End Use: CE06M003 Compressed Air System 354,654 kwh, 56.4 kw Manufacturing Compressed Air Measure Description This project consisted of
Moving Floor Concept. patented new technology for automatic cleaning in pig barns. No water Improved hygiene Increased profitability
 Moving Floor Concept patented new technology for automatic cleaning in pig barns No water Improved hygiene Increased profitability www.movingfloor.se 1 What is Moving Floor? Moving Floor is an endless
CHANGES IN THE MIDWESTERN U.S. PORK INDUSTRY
 CHANGES IN THE MIDWESTERN U.S. PORK INDUSTRY John D. Lawrence Department of Economics Iowa State University ABSTRACT Midwest pork production has changed dramatically in the past ten years and continues
The Iowa Pork Industry 2003: Patterns and Economic Importance
 The Iowa Pork Industry 2003: Patterns and Economic Importance by Daniel Otto and John Lawrence* Introduction The pork industry of Iowa represents a major value-added activity in the agricultural economy
Ammonia and Greenhouse Gas Emissions of a Swine Breeding-Gestation-Farrowing Facility in the Midwestern USA
 Agricultural and Biosystems Engineering Conference Proceedings and Presentations Agricultural and Biosystems Engineering 7-2012 Ammonia and Greenhouse Gas Emissions of a Swine Breeding-Gestation-Farrowing
Peter J. Lammers 301A Kildee Hall, Iowa State University, Ames, IA Ames, IA
 301A Kildee Hall, 515-294-4637 618 7 th Street Iowa State University, Ames, IA 50011 Ames, IA 50010 515-520-9174 Education Ph.D., May 2009, Animal Science and Sustainable Agriculture Iowa State University,
Establishing ammonia emission factors for shallow pit, fully-slatted finisher buildings
 Establishing ammonia emission factors for shallow pit, fully-slatted finisher buildings Summary Ammonia (NH3) emissions levels determined for a fully slatted, shallow pit (
Energy Simulation And Optimized Retrofit Practices Applied To A Real Dwelling
 Purdue University Purdue e-pubs International High Performance Buildings Conference School of Mechanical Engineering 2014 Energy Simulation And Optimized Retrofit Practices Applied To A Real Dwelling Giulia
ENERGY MANAGEMENT PLAN - HEADQUARTERS. ABC Winery 123 1st Street Franklin, NJ 12345
 ENERGY MANAGEMENT PLAN - HEADQUARTERS ABC Winery 123 1st Street Franklin, NJ 12345 TABLE OF CONTENTS Executive Summary 3 Background and Site Information 3 Summary 3 Energy Conservation Opportunities 4
Incentives. After work is complete:
 SAVE your WAY Create your own Energy Demand Savings with OUC s Commercial & Industrial Custom Incentive Program Overview OUC is committed to helping your business become more energy efficient. We understand
The Renner Residence 2009 Mike and Elida Renner
 The Renner Residence 2009 Mike and Elida Renner Mike and Elida Renner began work on their home long before green was the "in" thing. Today, their home is a model of energy efficiency and solar energy equipment.
Cultivating Energy Efficiency in the Ag Community A Look at How Local Cooperatives Approach Agricultural Energy Efficiency
 Cultivating Energy Efficiency in the Ag Community A Look at How Local Cooperatives Approach Agricultural Energy Efficiency ACEEE s Forum on Energy Efficiency in Agriculture Madison, Wisconsin Paul Gillis,
 i'-u --~.-- ~- f /ft,/ I':
 ¾ º ²½ìñ ¾ º ðìò ñ Sunlabob
 Introduction to the Sunlabob Energy Audit ການນ າສະເໜ ການກວດສອບພະລ ງງານຂອງ ບ ລ ສ ດ ຊ ນລະບ ບ Customer, Vientiane, Lao PDR March 2011 Sunlabob Energy Audit ¾ º ²½ìñ ¾ º ðìò ñ Sunlabob Energy Audit Department,
Evaluating Ventilation Rates Based on New Heat and Moisture Production Data for Swine Production
 Agricultural and Biosystems Engineering Publications Agricultural and Biosystems Engineering 2017 Evaluating Ventilation Rates Based on New Heat and Moisture Production Data for Swine Production Yanxi
An electric motor is designed to transform electrical energy into. Some of the electrical energy supplied to the motor is wasted as
 (a) Complete the following sentences. (i) An electric motor is designed to transform electrical energy into... energy. (ii) Some of the electrical energy supplied to the motor is wasted as... energy and...
MILESTONE REPORT. Phone: (320) Phone: (320) Congressional District: (Corporate office) Congressional District: (Project location)
 Phone: (320) Congressional District: (Corporate office) Congressional District: (Project location)") Project Title: Optimizing Renewable Electric Energy Generation on Minnesota Dairy Farms Contract Number: RDF4-2 Milestone Number: 4 Report Date: 12/7/2017 Principal Investigator: Name: Michael Reese Congressional
Project Title: Optimizing Renewable Electric Energy Generation on Minnesota Dairy Farms Contract Number: RDF4-2 Milestone Number: 4 Report Date: 12/7/2017 Principal Investigator: Name: Michael Reese Congressional
Protection Distances for Sufficient Dispersion and Dilution of Odor from Swine Buildings
 Protection Distances for Sufficient Dispersion and Dilution of Odor from Swine Buildings A. Heber Department of Agricultural and Biological Engineering Odor from a swine operation is caused by decomposing
Swine Production Records
 A L A B A M A A & M A N D A U B U R N U N I V E R S I T I E S ANR-844 Production record systems overwhelm many farmers. However, if pork producers want to increase profit, then complete, detailed records
Hog Producers Near the End of Losses
 Hog Producers Near the End of Losses January 2003 Chris Hurt Last year was another tough one for many hog producers unless they had contracts that kept the prices they received much above the average spot
A student investigated the efficiency of a motor using the equipment in Figure 1. Figure 1
 A student investigated the efficiency of a motor using the equipment in Figure. Figure He used the motor to lift a weight of.5 N a height of.0 m. He measured the speed at which the weight was lifted and
HOGS VS. ETHANOL: ETHANOL WINS!
 HOGS VS. ETHANOL: ETHANOL WINS! OCTOBER 2006 Chris Hurt 2006 NO. 6 The pork industry s concerns about higher corn prices from the extraordinary growth in corn demand for ethanol appears to be moving from
Global Price and Production Forecast
 Global Price and Production Forecast Ron Plain Professor of Ag Economics, University of Missouri-Columbia, 220 Mumford Hall, Columbia, MO 65211 USA; Email: plainr@missouri.edu Introduction Last year, 2008,
POSSIBILITIES OF HEAT PUMP USAGE FOR HEATING PIGLET RESTING PLACES
 POSSIBILITIES OF HEAT PUMP USAGE FOR HEATING PIGLET RESTING PLACES Andrievs Ilsters, Imants Ziemelis, Igors Kristutis Latvia University of Agriculture, Scientific Institute of Agricultural Machinery ilsters_uzc@unimail.lv
NZPork Guide: Outdoor Pigs in OVERSEER
 NZPork Guide: Outdoor Pigs in OVERSEER This guidance has been developed for nutrient budget advisors that provide support outdoor pork producers and their consultants using the online version of OVERSEER.
HVAC and lighting: Reducing energy costs in poultry farming
 HVAC and lighting: Reducing energy costs in poultry farming Factsheet Optimising lights and ventilation in poultry farming saves energy E lectricity is at the core of a poultry farm and one of the most
SUMMARY OF SERVICES & INCENTIVES
 SMALL BUSINESS PROGRAM 2017 SUMMARY OF SERVICES & INCENTIVES Effective through December 31, 2017 Last updated February 1, 2017 EFFICIENCY INCENTIVES SUMMARY The Focus on Energy Small Business Program offers
Project aims. My aims were:
 Pig enterprise Project aims My aims were: to buy in store weaners and raise them for slaughter at 6 months learn enterprise and animal welfare skills sell the meat for a profit raise money for a scout
BUILDING ELECTRICAL AND SIGNAL SYSTEMS. Electricity Background
 BUILDING ELECTRICAL AND SIGNAL SYSTEMS Ball State Architecture ENVIRONMENTAL SYSTEMS 2 Grondzik 1 Electricity Background Electric charge was known to the ancient Greeks Magnetism was known historically
Performance response of growing-finishing pigs to an air-cooled environment during a simulated hot weather growth period
 Performance response of growing-finishing pigs to an air-cooled environment during a simulated hot weather growth period Presented at the 2016 Minnkota Meeting Jackpot Junction Hotel March 11, 2016 Larry
Which power station is the most efficient overall, the normal power station or the combined heat and power station? Give reasons for your answer. ...
 Q1. Power stations are usually not very efficient. A lot of energy is wasted as thermal energy. The diagrams show the percentage of energy transferred by two coal-burning power stations. (a) (b) Write
Gas and PM Emissions Monitoring from Swine Gestation and Farrowing Barns in Central Iowa
 Animal Industry Report AS 65 ASL R2659 2011 Gas and PM Emissions Monitoring from Swine Gestation and Farrowing Barns in Central Iowa Lingshuang Cai Iowa State University Jacek A. Koziel Iowa State University,
Pig housing systems designed to manage or adapt to climate change impacts
 Pig housing systems designed to manage or adapt to climate change impacts Larry D. Jacobson, PhD BBE Dept., University of Minnesota Introduction The national and global concern over climate change is forcing
PacifiCorp s Planned Changes to Home Energy Savings Program in Washington Effective for
 PacifiCorp s Planned Changes to Home Energy Savings Program in Washington Effective for 2016-2017 PacifiCorp (Company) is planning to make modifications to the Washington Home Energy Savings program (Program),
EVALUATE THE EFFICACY OF HEAT STRESS AUDITS OF YOUR COOLING SYSTEM THROUGH CORE BODY TEMPERATURE
 Dairy Research 2006 EVALUATE THE EFFICACY OF HEAT STRESS AUDITS OF YOUR COOLING SYSTEM THROUGH CORE BODY TEMPERATURE J. F. Smith, M. VanBaale 1, C. Jamison 2, R. Rodriguez 2, M. J. Brouk, and J. P. Harner
Exampro GCSE Physics. P1 Foundation - Electrical Energy and Efficiency Self Study Questions. Name: Class: Author: Date: Time: 76. Marks: 76.
 Exampro GCSE Physics P Foundation - Electrical Energy and Efficiency Self Study Questions Name: Class: Author: Date: Time: 76 Marks: 76 Comments: Page of 3 Q. The figure below shows a car with an electric
DESIGN SUPPLY BUILD. Pig Equipment Specialist Supplier. Company and Product Presentation. By Clifford Richardson, M.D. Mobile
 DESIGN SUPPLY BUILD Pig Equipment Specialist Supplier Company and Product Presentation By Clifford Richardson, M.D Mobile 00353 87 256 9428 DESIGN SUPPLY BUILD At the forefront of the pig husbandry and
My Daily Energy Use. Objectives: Target grades: AK GLEs:
 AK Target grades: 9-12 AK GLEs: Science [9/10/11] SA1.1 [9] SA2.1 [11] SA3.1 [9] SE2.1 Reading [9/10] 4.2.2 Math [9] N-3 [9] E&C-3 [9/10] S&P-1 [9/10] PS-5 Set up time: 45 minutes Class time: Two or three
Energy efficiency of low voltage electrical installations
 Energy efficiency of low voltage electrical installations One new area within international standards is the integration of requirements for energy efficiency into IEC 60364 (the international standard
The Handling of Medicated Feed
 The Handling of Medicated Feed (See the Feed Handling and Shipping, Marketing and Transport sections of the Producer Manual.) 10a) On the Rations Used On-Farm Form, or a similar form of your own design,