Training Efficiency Master Series
|
|
|
- Josephine Pierce
- 6 years ago
- Views:
Transcription
1 Training Efficiency Master Series Optimizing Costs Optimizing Learning Technology Optimizing Customer Training Measuring Learning as Budgets Tighten Internal Marketing Learning Portals & Informal Learning Technologies
2 TABLE OF CONTENTS EXECUTIVE SUMMARY... 4 SURVEY RESULTS OPTIMIZING COSTS... 8 SURVEY HIGHLIGHTS... 9 THE RESEARCH... 9 KEY FINDINGS OPTIMIZING LEARNING TECHNOLOGY SURVEY HIGHLIGHTS KEY FINDINGS SURVEY ANALYSIS ABOUT THE SURVEY RESPONDENTS OPTIMIZING CUSTOMER TRAINING SURVEY OVERVIEW KEY FINDINGS SURVEY ANALYSIS ABOUT THE SURVEY RESPONDENTS MEASURING LEARNING AS BUDGETS TIGHTEN SURVEY OVERVIEW KEY FINDINGS DATA CHARTS ABOUT THE SURVEY RESPONDENTS INTERNAL MARKETING SURVEY HIGHLIGHTS KEY FINDINGS SURVEY ANALYSIS LEARNING PORTALS & INFORMAL LEARNING TECHNOLOGIES SURVEY HIGHLIGHTS
3 KEY FINDINGS DETAILED FINDINGS ABOUT EXPERTUS & TRAINING INDUSTRY INC
4 EXECUTIVE SUMMARY The Training Efficiency Masters Series was designed to help learning executives transform their organizations into models of operational efficiency and impact. Through six research studies, Expertus and Training Industry, Inc. have partnered to collect hundreds of learning leaders insights and practices on how they master learning efficiency. Based on this joint research, we created six research reports on the following topics: Training Efficiency: Optimizing Costs Training Efficiency: Optimizing Learning Technology Optimizing Customer Training: Growth, Impact and Tools Measuring Learning as Budgets Tighten Training Efficiency: Internal Marketing Learning Portals & Informal Learning Technologies This comprehensive report compiles the results and insights of all six of the above studies that were completed in For more information on Expertus, please visit and for more information on Training Industry, Inc., please visit Study 1: Training Efficiency: Optimizing Costs This study takes a hard look at training executives budgets and cost reduction plans. The study was conducted against the backdrop of declining budgets and mounting pressure to reduce costs. Over 90% of training executives surveyed felt some pressure to reduce costs, and more than 50% indicated that they felt significant or intense cost reduction pressure. According to those surveyed, the single greatest opportunity for cost reduction and improved efficiency is in administration. 46% of respondents rated administration the number one area to reduce costs, compared with less than 20% who rated either of delivery, content development or technology as their prime targets for cost reduction. In fact, training managers say learning technology is the last place they will reduce costs, as they consistently rate it as an investment through which they can reduce costs in other budget areas. The most popular technology investments include migrating from ILT to e-learning or blended delivery, and otherwise optimizing, customizing or consolidating learning technologies to reduce labor costs and 4
5 increase efficiency. Within each of the four budget areas, the study provides a prioritized list of cost reduction activities that learning leaders planned to take, as well as metrics they use to gauge the efficiency of their training operations. Given the opportunity to reinvest cost savings, training leaders would spend those funds on: improving the quality of their content (65%); improving their measurement and analytics capabilities (61%) and/or upgrading their technology (e.g., LMS, delivery or authoring systems) (61%). Study 2: Training Efficiency: Optimizing Learning Technology Learning technology, particularly learning management systems (LMS) as well as delivery tools and content development/authoring tools, are key drivers of efficiency gains in training organizations. The study found that LMS managers and administrators reported the highest efficiency gains from learners ease in finding and registering for training, being more compliance ready and lower administrative costs. Among several LMS functionalities, respondents felt that their content management function has the strongest impact on efficiency, followed by their roster management, registration and scheduling functions. LMS managers and administrators most frequently cited two obstacles in using LMS functionalities to increase efficiency: lack of integration with other technology systems and inflexible reporting capabilities. Overcoming both obstacles will help training organizations demonstrate their impact to stakeholders. Respondents also indicated key challenge areas in getting the most from their LMS, including lack of user acceptance and responsibility, slow, old-school technology, lack of resources, difficulty adapting processes to LMS and lack of consolidation with other LMS. Study 3: Optimizing Customer Training According to corporate training leaders who lead or are involved with customer training, nearly one half felt their customer training budgets would go up, with 41% believing it would increase by over 10%. By contrast, only one-third thought their employee training budgets would increase. Among the reasons respondents gave for expecting increases in customer training were the need to extend the product reach to more customers and the importance of customer training in achieving company financial goals. In fact, respondents reported that customer training is revenue-producing: 81% reported increased training revenue and 77% reported increased customer revenue as a result of customer training. 5
6 Respondents said that the number one expected and experienced benefit of customer training, however, was improved customer satisfaction. 82% of respondents expected improved customer satisfaction from their customer training. 93% reported results in this area, with 53% realizing strong benefits. The other areas where respondents reported strong benefits from customer training were increases in training revenue (with 46% reporting a strong benefit) and increases in customer retention (with 36% reporting a strong benefit). The study also revealed that customer training is primarily marketed by website and marketing, which respondents also find to be the most effective types of marketing. Study 4: Measuring Learning as Budgets Tighten In a time where training budgets are increasingly slashed, the relationship between metrics and budgets becomes even more important. Training clients want to know the impact of their increasingly limited resources. This study found that more than twice as many respondents (48%) expect budget decreases rather than increases (17%) in Similarly, since 2008 budgets were first approved, far more respondents saw decreases (38%) than increases (11%) by the end of the year. Despite the need for better outcome metrics, less than one in four respondents reported using business outcome or return on investment metrics; instead, the vast majority collected metrics on course completion, registration and course participant s reactions. Respondents further shared that they used the above metrics, along with cost metrics, to support budget decisions. However, respondents were most comfortable in using their metrics to support decisions on what training is needed and which types of topics to offer. In addition to reporting on budget changes and metrics use, this research report also provides fresh data on how cost reduction pressure is increasing and the major challenges of learning measurement. Study 5: Internal Marketing for Corporate Training Programs This survey focused on identifying the tools that are widely used to market internal training programs, the main reasons for marketing these programs and determining what actually works and how they measure success. Respondents indicated that blasts are the most effective marketing activity, followed closely by phone calls and management recommendations. Although utilizing management recommendations isn t a typical marketing technique, management buy-in on training programs is also seen as among the most favorably-received marketing technique among employees, along with webinars and seminars/workshops. 6
7 While slightly more than half of the respondents use different marketing activities for different types of training, 44% market all training programs alike. The remaining respondents do not market individual training programs. Among the more common purposes of marketing included simply making employees aware of the training available (41% of respondents did this) and actively marketing programs to increase fill rates (35% did this). While the majority of respondents don t track their marketing reach (or effectiveness), 43% track participation in workshops, 22% ask participants how they heard about the training and 19% and 15% count visitors or clicks on internal training websites, respectively. Study 6: Learning Portals & Informal Learning Technologies To make learning more efficient, effective, and accessible, many corporate training organizations have adopted both learning portals and informal learning technologies. In fact, over 93% of respondents' learning organizations have learning portals. Organizations that train internal employees are by far the most frequent users of learning portals. However, two-thirds of those who train customers, and over half of those who train channel partners or vendors also use learning portals. Within the next two years, 45% of respondents say they will upgrade their existing learning portal, and 14% plan to launch a new learning portal. In their portals, most respondents use in their portals all of the twelve major learning tools and technologies listed on the survey. These include blogs, online coaching, polls, self-study programs, communities of practice, and more. Improving learner (and customer) satisfaction was cited by 68% of respondents as a top benefit of having a learning portal. The other two top benefits are tracking and enabling informal learning and helping to integrate learning technology. Fifty percent of respondents said that including informal learning technologies in their learning programs is critically important, and 39% reported that it is somewhat important. Less than 5% said that it is not important. Respondents also described why informal learning is important and how they use technology to support it. 7

8 Training Efficiency Master Series Survey Results Training Efficiency: Optimizing Costs 8
9 SURVEY HIGHLIGHTS In early 2008, TrainingIndustry.com and Expertus partnered to produce the first survey in the Training Efficiency Masters Series. We asked training leaders about the efficiency of their organizations, opportunities and plans to reduce costs, and how they plan to reinvest cost savings. The survey was completed by 113 training leaders whose companies vary by industry sector and organization size. THE RESEARCH 41% admit that they have significant levels of pressure to reduce costs. 1. Which of the following best describes the level of external pressure (e.g., outside your training organization) that you have experienced in the past year to reduce training costs? Intense pressure Level of Pressure to Reduce Costs 13% Significant pressure 41% Mild pressure 37% No pressure at all 9% 0% 5% 10% 15% 20% 25% 30% 35% 40% 45% 9
10 2. Please indicate which types of cost reduction pressures apply to your training organization. Check all that apply. Types of Cost Reduction Pressure Our training organization has been asked to expand our training offerings with no Senior management has cut my budget Some of our costs have gone up without a corresponding increase in budget Customers demand/willingness to pay for our training has gone down Other (please specify) 13% 29% 40% 49% 60% 0% 10% 20% 30% 40% 50% 60% 70% Other responses include: Re-organized (2) and centralized L&D for efficiencies Lay offs Pressure to cut as other departments have cut Production cost reductions, but not training yet Our training organization has been asked to expedite our development process beyond the realm of possibility We haven't had to reduce our budget/none (2) 3. Please indicate the percentage increase or decrease in your 2008 training budget compared to your 2007 budget. Budget Changes from 2007 to 2008 Decreased by over 10% 17% Decreased by under 10% 24% Remained the same 28% Increased by under 10% 15% Increased by over 10% 17% 0% 5% 10% 15% 20% 25% 30% Interestingly, one respondent indicated that they had the budget eliminated and have made it pay as you go scrutinizing everything that is requested except training supplies. 10
11 4. What metrics do you use to measure the efficiency of your training processes? Types of Training Metrics Used Levels I-III Kirkpatrick (Satisfaction, Learning & OJT Application) 41% Output & Volume Metrics 36% ROI/Profitability or Business Outcome 20% Advanced Metrics 8% Other 4% 0% 5% 10% 15% 20% 25% 30% 35% 40% 45% NOTE: Below is a sample of typical write-in responses to Q4. Similar responses are grouped under the same bullet and separated by slashes. Nearly identical responses are represented as one response, followed by the number of respondents in parentheses (#). A. Levels I III Kirkpatrick: Satisfaction, Learning and Onthe-Job Applications Level I: Employee or student satisfaction ratings (4) / Informal feedback / Feedback forms and surveys Level II: Pre and post testing assessments (5) / Gained knowledge / Evaluations Performance results in first 90 days Level III: Competency improvement / Process usage / Transfer of learning to workplace / Behavior changes / OJT performance (2) / Supervisor's evaluation / Performance evaluations/indicators (2) Customer feedback (2) B. Output and Volume Metrics Learner-Focused Volume Metrics # participants, attendees, students or employees trained (6) Training days per employee # hours completed or % training projects, courses or development plans completed ILT attendance, LMS & e-learning courses accessed and completed # offerings # classes per headcount Training delivered vs. planned (3) 11
12 Cost, Time or Resource-Related Metrics % cost recovery Training cost per student Duration of training / Time to finish training Frequency and time with attendee Utilization models Employees per training hour Delivery hours per month/resource Training intervention per cost (or vice versa), learners by business audience Average number of person-days of training delivered in a year C. ROI/Profitability or Business Outcome Metrics Kirkpatrick Level IV Profitability / Revenue, margin Financial ROI / Financial (cost and revenue) / Impact on company results and sales / Money and resources saved Business impact metrics (2) Improved operational metrics / Reduction in work safety, less reliance on help desk / Reduction in incidents & production down time Retention (3) / Turnover & attrition (2) D. Advanced Metrics Speed to productivity Time from hire to productivity Balanced Scorecard Six Sigma methodology Accenture Model Earned value management 12
13 5. Please estimate what percent of your budget (including salaries in each area) is allocated to the following training categories. Average Training Budget Allocations Delivery 35% Content Development 26% Administration 24% Technology 15% 0% 5% 10% 15% 20% 25% 30% 35% 40% 6. How does your management team perceive the efficiency of your training organization in each of these four areas? [Note: Percentage saying Just about right/to be expected is not charted.] Managements' Perceptions of Efficient and Inefficient Training Operations Administration 14% 46% Delivery Content Development 7% 18% 31% 43% Efficient Inefficient Technology 26% 27% 0% 10% 20% 30% 40% 50% 7. Which of the following additional actions are you likely to take in 2008 to reduce your administration costs within your training organization? Check all that apply Administration Cost Reduction Actions Invest in technology to decrease labor costs 67% Streamline evaluations or reporting process 53% Optimize scheduling 50% Reduce training administration staff 19% Outsource vendor relationship management 17% Outsource some or all of administration 16% Other (please specify) 14% 0% 10% 20% 30% 40% 50% 60% 70% 80% 13
14 Other responses include: LMS launch this year/ Change to new outsource vendor Reduce trainer and participant s logistics and travel None (5) 8. Which of the following additional actions are you likely to take in 2008 to reduce your content development costs within your training organization? Check all that apply Content Development Cost Reduction Actions Invest in content development software 46% Streamline materials fulfillment Centralize content development organization Reduce curriculum costs Purchase collaboration tools to enhance staff communication Outsource some or all of content development 35% 34% 32% 32% 43% Other (please specify) Reduce content development staff 11% 12% 0% 5% 10% 15% 20% 25% 30% 35% 40% 45% 50% Other responses include: Negotiate with vendors for better pricing "Do it yourself" in developing the contents whenever possible Not design or develop courseware Do not develop content / I don't have budget responsibility for Content Development / do not currently spend significant amounts in development costs (3) We are in good shape for 2008 / none (3) 9. Which of the following additional actions are you likely to take in 2008 to reduce your delivery costs within your training organization? Check all that apply Delivery Cost Reduction Actions Migrate from ILT to e-learning or blended learning Reduce travel & lodging Increase classroom fill rates Maximize use of training facilities Centralize training staff & support Outsource some or all of delivery Reduce instructor costs Consolidate delivery vendors Reduce catering Decrease training delivered Other (please specify) 22% 21% 18% 13% 11% 32% 29% 43% 40% 53% 65% 0% 10% 20% 30% 40% 50% 60% 70% 14
15 Other responses include: Better target actual needs vs. general offerings Reduce number of ILT courses/blend instructor led with e-learning (2)/Increase the use of web-ex to deliver training and use video conferences LMS Launch Make serial sessions to reduce travelling costs None, costs are low /I don't have budget responsibility for delivery 10. Which of the following additional actions are you likely to take in 2008 to reduce your technology costs within your training organization? Check all that apply Technology Cost Reduction Actions Optimize, customize or consolidate learning technologies 67% Invest in Learning Management System (LMS) Invest in authoring systems technologies Invest in delivery platform management technology Other (please specify) Outsource technology support Move from enterprise network to externally-hosted applications 13% 13% 13% 22% 30% 48% 0% 10% 20% 30% 40% 50% 60% 70% 80% Other responses include: Change LMS vendor Okay for 2008 / No reduction in technology costs likely / None / No action is planned (4)/ I don't have budget responsibility for technology / Not in my budget Corporate IT is responsible (2) 15
16 11. If you were able to uncover cost reduction opportunities, in which of the following areas would you reinvest it? Check all that apply. Areas to Reinvest Cost Savings Improve the quality of our content Improve our measurement and analytics capabilities Upgrade our technology (e.g., LMS, delivery or authoring system) Develop more custom courses Invest in better marketing for our training Improve the quality of our instructors Increase training staff Make improvements to the training facilities 25% 24% 30% 30% 42% 61% 61% 65% Deliver more instructor-led training 18% 0% 10% 20% 30% 40% 50% 60% 70% Other response included: KEY FINDINGS Integration with talent management, competency development, and more e-learning development Finding #1: Pressure To Reduce Costs Cost reduction pressure is significant or intense among most training leaders (54%), resulting from expectations to expand training without additional revenue (60%), and/or from budget cuts (49%). Among those feeling intense pressure (13%), 80% feel budget cut pressure. Finding #2: Budget Areas Where Costs Can Be Cut As a group, training leaders struggle to use advanced or business outcome-based metrics to communicate with senior management about the impact and efficiency of their operations. Among respondents, typical training budget allocations are as follows: Delivery: 35% Content Development: 26% Administration: 24% Technology: 15% By far, training managers (46%) believe administration presents the best opportunity to cuts costs and improve efficiency. Technology is the area that can least afford cost reductions, as training managers consistently look to technology as an investment through which they can reduce costs in other areas. 16
17 Finding #3: Use of Metrics As a group, training leaders struggle to use advanced or business outcome-based metrics to communicate with senior management about the impact and efficiency of their operations. Only 23% of the respondents use these types of metrics, while the majority (62%) uses learning metrics such as Kirkpatrick s Levels I-III and volume-based metrics to monitor the amount of training or learners. Finding #4: Top Ways to Cut Costs Despite the lack of metrics to prioritize their own levels of efficiency, training leaders identified the following as the top ways to cut cost in each of the four budget areas. Technology: Optimize, customize/consolidate learning technologies (67%) Administration: Streamline evaluations or reporting process (53%) Delivery: Reduce travel and lodging (53%) Content Development: Increase use of content development software (46%) Finding #5: Ways to Reinvest Cost Savings The most popular actions training managers plan to take to reinvest cost savings are: Improving the quality of content (65%) Improving measurement and analytics capabilities (61%) Upgrading technology (61%), specifically: An LMS, authoring or delivery systems (70%) Systems to reduce long-term administrative labor costs (67%) E-learning or blended learning (65%) 17


18 Training Efficiency Masters Series Survey Results Training Efficiency: Optimizing Learning Technology 18
19 SURVEY HIGHLIGHTS In May 2008, Training Industry, Inc. and Expertus partnered to conduct the second survey in the Training Efficiency Masters Series. We asked corporate training professionals about the efficiency gains they have realized from their LMS and about several other factors that we expected to have an impact on efficiency. Respondents also shared qualitative best practices and challenges in optimizing LMS use. The results can be used by readers to identify areas of improvement and achieve greater efficiency gains themselves. The survey was completed by 53 training leaders whose organizations varied in the time since they implemented their LMS, their initial investments in their LMS, and the number of learners their LMS supports. Most respondents were managers or administrators of an enterprise-wide LMS. KEY FINDINGS Finding #1: Compliance Readiness An LMS has the strongest impact on being compliance ready. Other major LMS efficiency gains result from learners finding and registering for training more easily and reducing administration costs. An LMS has the weakest impact on employee productivity, which is also the least well understood area of expected LMS impact. Finding #2: Content Management The LMS functionality which generates the strongest efficiency gain is content management, followed closely by roster 19
20 management and scheduling. When asked which one area had the biggest impact, content management was the overwhelming choice. Finding #3: Outsourced Administration The longer a company has an LMS, the higher their efficiency gains are in nearly all areas. Companies that outsource administration to an external partner and integrate their LMS with other systems have stronger efficiency gains than those who do not. Finding #4: Duration of Implementation The longer a company has an LMS, the higher their efficiency gains are in nearly all areas. After the third year of implementation, companies experience the most consistent efficiency gains. Finding #5: Reporting Capabilities The biggest challenges in making the most from an LMS are inflexible reporting capabilities and a lack of integration between the LMS and other systems. 20
21 SURVEY ANALYSIS: WHAT IMPACTS EFFICIENCY GAINS The strongest known LMS impact areas were being more compliance ready and learners finding and registering for training more easily. A. Areas of Greatest Impact on Efficiency The primary purpose of this study is to understand the impact of LMS use on efficiency. As such, a great deal of focus is centered on the answer to the following question: How much impact has your LMS had in the following areas? Among those who reported a known LMS impact, the strongest impact areas were being more compliance ready, learners finding and registering for training more easily and reduced administration costs. Ease in Finding/Registering for Training Greater Compliance Readiness Reduced Administration Costs Improved Operational Efficiency More Actionable Learning Metrics Reduced Time to Find Information Optimized the Training Catalog Increased Learning Effectiveness Increased Employee Productivity Areas of LMS Efficiency Gains with Strongest Impact 13% 29% 35% 33% 33% 49% 46% 43% 41% 0% 5% 10% 15% 20% 25% 30% 35% 40% 45% 50% Respondent Number (N) = 38 [Note: This excludes respondents who implemented their LMS less than one year ago.] Note: All horizontal bar charts in this report represent the percentage of respondents. Interestingly, the low percentage of respondents who rated increased employee productivity as having a strong impact may have had to do with many people simply not knowing or being able to measure the impact on employee productivity. In fact, the highest percentages of respondents rated this area as unknown impact (25%). B. LMS Functionalities with the Strongest Impact and How to Optimize Them To find out which part of the LMS had the greatest impact, we asked this question: What impact have the following LMS functionalities had on the efficiency of your training organization? 21
22 Among those who used the LMS functionalities, the functionality with the strongest impact on overall efficiency gains was content management, followed closely by roster management and scheduling. LMS Functionalities with Strongest Impact on Efficiency Gains Content Management Roster Management Scheduling Registration Reporting Assessments Catalog Management Resource Management Accounting Course Material Fulfillment Vendor Management 3% 10% 10% 15% 22% 29% 35% 35% 45% 45% 51% 0% 10% 20% 30% 40% 50% 60% 33% of the respondents indicate that content management has the #1 impact on LMS efficiency gains. This is twice that of any other functionality. N = 40 [Note: This excludes respondents who implemented their LMS less than one year ago.] To find out the strongest LMS functionalities in a different way, we asked respondents this follow-up question: Which of the above functionalities has had the biggest impact on efficiency gains in your training organization? For the most part, the same functionalities appear, in roughly the same order, as having the greatest impact on efficiency gains. LMS Functionalities with the # 1 Impact on Efficiency Gains Content Management 33% Roster Management 17% Registration 17% Scheduling 14% Assessments 11% Catalog Management 6% Reporting 3% 0% 5% 10% 15% 20% 25% 30% 35% However, there are a few noteworthy differences. In the chart above, notice that content management was chosen by twice as many respondents as any other functionality. Also notice that only 3% of the respondents selected reporting as the functionality that generated the biggest (or #1) impact on efficiency gains, even though 35% rated it as having a strong 22
23 impact. This may be due to widespread frustration with the flexibility of LMS reporting capabilities, which is listed as a top challenges under section F (Challenges) of this report. Below are the key themes from respondent answers to this question: For the one LMS functionality that you chose in the question above that had the biggest impact on efficiency gains, please describe what specific processes or practices you used to optimize this functionality. Content Management: Use web technology to expand distribution of all elearning courses. Create content with departments for specific employee groups and/or specific learning objectives. Outsource content management to a third party with hosting capability. Registration: Streamline registration by clearly communicating what training is mandatory, pre-approved, and budgeted, and when learners need to take it. Allow students to self-enroll; this frees up considerable administrative time. Scheduling: Customize the LMS room-booking feature, min/max attendees, etc. to meet administrative and student needs. Contract with an external partner for administrative functions. Catalog Management: Upload catalogs of external vendors, information on courses and price lists. Use the catalog as list and access point for all customer training resources - live & recorded. 23
24 C) General Practices to Optimize LMS Use: Expertus identified eleven general LMS best practices that we asked respondents to select from: Which of the following practices has your organization used to optimize the use of your LMS? Study results show that companies who integrated their LMS with other systems and leveraged external partners for administration had much higher efficiency gains than those who did not. The top three most frequently used practices are: centralize administration, modify processes to work with the LMS, and define reports and metrics. Most Frequently Used Practices to Optimize LMS Use Planning the Implementation: Centralize administration Planning the Implementation: Modify processes to work with the LMS Planning the Implementation: Define reports & metrics Planning the Implementation: Get executive buy-in for enforcement Planning the Implementation: Customize for usability Leveraging External Partners/Vendors: Outsource technology support Using Tools & Integration: Use LCMS to house/distribute content Using Tools & Integration: Tntegrate systems (e.g., LCMS, HR systems) Planning the Implementation: Invest in architecture blueprint Leveraging External Partners/Vendors: Outsource administration Using Tools & Integration: Consolidating LMS' 10% 14% 22% 20% 31% 35% 45% 49% 59% 59% 57% 0% 10% 20% 30% 40% 50% 60% 70% N = 51 Study results show that companies which integrated their LMS with other systems and leveraged external partners for administration had much higher efficiency gains than those who did not. A related survey finding showed that companies with any level of integration with other learning or HR systems (from real-time to less often than weekly frequencies) had greater overall efficiency gains than companies which had no integration at all. As expected, the impact area most affected by whether or not a company integrates its LMS with other systems is more actionable learning metrics. This makes sense, considering that metrics related to learning outcomes are often dependent upon access to other HR and performance data combined with LMS data. Access to multiple data sources helps training leaders make better decisions about which training courses are making a difference. 24
25 D) Time to Impact Do organizations have more efficiency gains with their LMS over time? Generally, yes. The data shows that the more time since the full implementation, the stronger the impact on efficiency gains. However, in the first few years (less than three years) efficiency gains are not as consistently positive as they are after three years. It seems that there is a learning curve or time period in which employees learn how to best use the LMS before their full impact on efficiency is realized. Of all areas of impact, the area which shows the greatest improvement over time is compliance readiness. People who are not seeing an early impact in this area should take heart; improvement should come over time. E) Initial LMS Investment Levels There is little to no relationship between the amount invested per learner and overall efficiency gains. One cannot expect more efficiency gains based on a higher-priced LMS; the combined factors of time and both general and functionality-specific practices may have greater influence over the kinds of results you can expect. To see how much respondents are spending on their LMS for how many learners, see About the Survey Respondents. F) Challenges To understand why some respondents were able to get more efficiency gains than others, we asked this question: Please describe the biggest challenges or obstacles your training organization faces in using LMS functionalities to increase efficiency. The most frequent challenges are lack of integration and inflexible reporting capabilities. Interestingly, these two challenges were also reported among the biggest problems in learning measurement in an April 2007 Expertus and Training Industry, Inc study. Without effective reporting and system integration, it is difficult to provide internal stakeholders with meaningful metrics about the impact of training on the business. Instead, training departments must rely on volume and activity-based metrics (e.g., courses, hours, registrations or test scores). The April 2007 study also found that more survey respondents relied on internally- 25
26 developed software or manually compiled reports for learning metrics than LMS-generated reports. This is a further indication that the reporting functionality was inadequate. Below are key challenge areas that respondents had in getting the most from their LMS: Lack of Integration With HR and accounting systems Lack of standards from system to system Inflexible Reporting Functionality: Inability to create report templates that allow collection of learning metrics to benchmark with ASTD Limited, clunky, and inflexible reporting Lack of User Acceptance & Responsibility: Some want the training group to do all the work rather than accepting responsibility for their learning Need to create and use learning plans Slow, Old-School Technology: LMS technology can be described as the big, lumbering dinosaur in the middle of a world more suited to small, nimble animals. As such, Generation Y or millenials are not jazzed by it LMS is not suitable for blended learning or other innovative learning solutions Need to dig to get to things Lack of Resources: Insufficient development resources for creating content or managing content Organization lacks emphasis on continuous learning, resulting in inadequate staff to do more with the LMS Adapting Processes to LMS: Difficult to adapt current processes to the LMS features and functionality Lack of Consolidation with Other LMSs Having multiple LMS makes some processes like scheduling very complicated The process of consolidating to one LMS requires a lot of time, effort, and support G) Other Learning Technologies 26
27 To understand the relative impact of different learning technologies, we asked respondents this question: For each learning technology which your training organization has used for at least a year, please indicate the impact each has had on efficiency gains. The top three learning technologies with the strongest impact on efficiency are delivery tools, LMS, and content development/authoring tools. Learning Technologies with the Strongest Impact on Efficiency Gains Delivery Tools LMS Content Development/Authoring Tools 47% 46% 46% LCMS for Delivering Content Separate from LMS Assessment & Survey Tools 35% 34% 0% 5% 10% 15% 20% 25% 30% 35% 40% 45% 50% ABOUT THE SURVEY RESPONDENTS N = 39 The following charts describe several characteristics of the survey respondents. A) LMS Role and Infrastructure The vast majority of respondents were managers or administrators of a single enterprise-wide LMS. Respondents' LMS Roles Manager of Enterprise-wide LMS Administrator of Enterprise-wide LMS User of Enterprise-wide LMS Administrator of Departmental LMS Manager of Departmental LMS User of Departmental LMS 12% 8% 6% 4% 25% 46% 0% 10% 20% 30% 40% 50% N = 53 27
28 Respondents' LMS Infrastructure On average, respondents reported an initial investment of $31 per learner for their LMS. Only One Enterprise-Wide LMS 73% Multiple Departmental LMS' 12% One Enterprise-Wide LMS Plus Dept. LMS' 10% One Departmental LMS 4% 0% 10% 20% 30% 40% 50% 60% 70% 80% N = 53 B) Initial LMS Investments and Learners Supported LMS respondents reported an average initial investment of about $867,000. The average number of learners supported is approximately 28,000 with an average investment of about $31/learner. Distribution of Initial LMS Investment vs. Learners Supported $2,200,000 $2,000,000 $1,800,000 $1,600,000 $1,400,000 $1,200,000 $1,000,000 $800,000 $600,000 $400,000 $200,000 $0-10,000 20,000 30,000 40,000 50,000 60,000 70,000 80,000 90,000 N = 30 C) Most Frequently Used LMS Functionalities The top five most frequently used LMS functionalities are also the top five functionalities with the strongest impact on efficiency. 28
29 Most Frequently Used LMS Functionalities Scheduling Roster Management Registration Content Management Reporting Catalog Management Resource Management Assessments Vendor Management Accounting Course Material Fulfillment 100% 98% 98% 90% 90% 88% 85% 85% 78% 76% 76% 0% 20% 40% 60% 80% 100% N = 53 D) Level of Integration with Other Systems The most common state of integration with other systems is no integration at all. However, when there was integration, it was most often done on a daily basis. Frequency of Data Integration Updates No Integration 40% Daily 23% Between Daily and Weekly Real-time Integration Weekly or Less 13% 13% 11% 0% 10% 20% 30% 40% 50% N = 53 E) Time since Full LMS Implementation Respondents were evenly distributed across the time spectrum since implementation, which the survey defined as for both the internal training department and learner use. In many of the impact-related questions in the prior section, Survey Analysis: What Impacts Efficiency Gains? the group of respondents who were within their first year of LMS implementation was excluded. 29
30 Time since Respondents' Full LMS Implementations 25% 23% 23% 20% 15% 15% 17% 19% 10% 5% 4% 0% < 1 Year 1 < X < 2 Years 2 < X < 3 Years 3 < X < 4 Years 4 < X < 5 Years 5 + Years N = 53 F) Use of Other Learning Technologies Besides the respondents who use LMS, they typically used three other learning technologies: content development/authoring tools, assessment and survey tools, and delivery tools. LCMS that delivered content separately from the LMS were used by about half of the respondents, which may be due to the use of the content management functionality within the LMS by 90% of all respondents. Respondents' Use of Other Technologies Content Development & Authoring Tools 88% Assessment and Survey Tools 84% Delivery Tools 83% LCMS (Delivers Content Separately from LMS) 53% 0% 20% 40% 60% 80% 100% N = 51 30


31 Training Efficiency Master Series Survey Results Optimizing Customer Training: Growth, Impact & Tools
32 SURVEY OVERVIEW In July and August 2008, Expertus partnered with Training Industry, Inc. to conduct the third thought leadership study for the Training Efficiency Master Series. We asked corporate training professionals who lead or are involved in customer training to let us know where they think customer training is headed in We also asked about the benefits they realize from customer training and how they market and deliver it. The results of this survey can be used by readers to compare their own customer training programs to that of the respondents. The survey was completed by 34 respondents from companies in industries as diverse as technology, finance/banking, business services/consulting, telecommunications, and utilities. Company sizes were broadly distributed from under 100 to over 5,000 employees. Most of the respondents were in leadership roles in customer and/or employee training. KEY FINDINGS Finding #1: Growth Expectations Despite the vast majority believing that customer training budgets would go down in a difficult economy, 48% of survey respondents believed their own customer training budgets would go up in Only 32% believed their employee training budgets would go up in % believed customer training budgets would go up by more than 20%, compared to only 8% who believed that employee training budgets would increase by over 20%. Finding #2: Main Benefits Customer satisfaction was the most strongly expected and realized benefit from customer training. Reducing support calls and increasing training revenue particularly for those operating 32
33 as profit centers were also highly expected and realized benefits. Finding #3: Payment Structure About half of the companies charged separate fees for their customer training, while less than one-third offered customer training at no cost. The vast majority of companies used website and marketing to market their customer training. Finding #4: Marketing The vast majority of companies used website and marketing to market their customer training, which many also considered to be the most effective way to market customer training. Finding #5: Web Registration Respondents were evenly distributed among those who gave their customers access to their LMS through the web real-time, gave them access to a manually-updated website, or provided no web access. Finding #6: Delivery & Support Technologies By far, webinar technology is used most frequently to deliver customer training. Finding #7: Most Significant Challenges The two top challenges both had to do with a lack of resources in staffing and in marketing expertise or budget. SURVEY ANALYSIS 89% believed that being in a difficult economy would negatively affect their company s level of investment in customer training. 1. Is Customer Training Growing? To understand how customer training will grow in relation to employee training from 2008 to 2009, respondents were asked two questions: In general, how do you think being in a difficult economy affects your company s level of investment (e.g., budget) in customer training? By what percentage increase or decrease do you expect your company s level 33
34 of investment (e.g., budget) for customer training and employee training to change from 2008 to 2009? Among the respondents who were not unsure, 89% believed that being in a difficult economy would negatively affect their company s level of investment in customer training, for three reasons: There s a general need to be budget-conscious and limit spending Non-core activities such as training are vulnerable during difficult economic times Customer training has not clearly proven its business value A minority (11%) of respondents believed customer training budgets would go up in a difficult economy. One explanation was that customers are less willing to travel due to cost, which requires companies to invest in more web-delivered training. Despite respondents beliefs that a difficult economy would decrease customer training budgets, the vast majority predicted that their budget would stay the same or go up in % believe that customer training budgets will increase in 2009, compared to 32% who believe employee training budgets will go up. A higher percentage of respondents believed employee budgets would stay the same (54%) compared with customer training budgets staying the same (32%). Less than one in five respondents thought customer or employee training budgets would decrease. Employee and Customer Training Budget Change Expectations from 2008 to % 54% 50% 40% 41% Customer Training 30% 20% 10% 0% 0% Down 20%+ 0% 4% 4% Down 10-19% 22% 12% 12% 12% 7% 7% Down 1-9% Same Up 1-9% Up 10-19% 19% 8% Up 20%+ Employee Training Percent of Respondents Why did respondents believe their customer training budgets would go up? They provided the following insights: 34
35 Customer Training Budget Up Importance of customer training in achieving company financial goals Need to extend the product-reach to more customers Introduction of new products About half of the respondents had the same predictions for budget changes in both customer and employee training. Of those who differed in their predictions, the vast majority believed that customer training budgets would go up more or down less than employee training budgets. Respondents provided these explanations for why both their training budgets would both go up or down: Both Budgets Up Overall company growth in the number of employees and customers Need to outsource to meet aggressive training development goals Both Budgets Down Cost containment and company budget cut backs Economic pressures 2. What are the Benefits of Customer Training? Survey respondents were asked two questions related to both the expected and realized benefits from customer training: Which of the following benefits did your company expect to realize from customer training? (And which was the one primary expected benefit?) What level of benefit has your company actually realized from its customer training programs? (And which was the greatest actual benefit?) 35
36 Primary and Non-Primary Expected Benefits of Customer Training Reduce support calls 18% 68% Improve customer satisfaction 32% 50% Increase customer retention Increase existing customer revenue 14% 11% 54% 57% Increase training revenue Generate new customers 18% 7% 36% 43% Primary Non-Primary Reduce litigation risks/potential costs0% 14% 0% 10% 20% 30% 40% 50% 60% 70% 80% 90% Percent of Respondents The two most commonly-expected benefits (combined percentage of primary and non-primary benefits) were reducing support calls (86%) and improving customer satisfaction (82%), followed closely by increasing customer retention (71%). Note that a much higher percentage of respondents expected that improving customer satisfaction would be the primary benefit (32%), compared with reducing support calls (18%) making it the top goal for customer training. Note also that increasing training revenue tied for second in the highest primary benefits (also at 18%), although it was fifth in the overall expectations of customer training benefits. Only a very small percentage of respondents reported the benefit of generating new customers and reducing litigation risks/potential costs. Customer satisfaction was the strongest benefit realized from customer training. This is not surprising since it was also by far the primary expected benefit or goal of customer training. 36
37 There is general alignment between the top four primary benefits and the top four strongest realized benefits. The biggest difference between expected and realized benefits is in the area of reducing support calls. Differences in Benefits by Profit or Cost Center Models Customer training groups that are run as cost centers have different benefits from those that are managed as profit centers. Among survey respondents, 42% operated their customer training as a cost center, and 58% ran their customer training as a profit center, including those that managed to a profit of zero (break-even model). Cost Center Model Benefits By far, the top goal of customer training units that are managed as cost centers is customer satisfaction, followed by reducing support calls. 37

38 N=11 Note that increasing training revenue is not a primary goal of any of the cost center respondents. As expected, the strongest benefit realized by customer training units run as cost centers is customer satisfaction. N=13 Although no one reported customer retention as a primary expected benefit from customer training, it was nevertheless a significant benefit that customer training groups run as cost centers realized. By contrast, reducing support calls one of the top primary benefits -- was reported as a moderate benefit much more often than it was reported as a strong benefit. Profit Center Benefits For those in profit centers, the goal of customer satisfaction was on par with increasing training revenue and increasing customer retention. 38
39 N=16 The relative importance of increasing training revenue was much higher for those who operate under a profit center model than for those managed as a cost center. Among those operating as profit centers, 88% charged customers either in credits or dollars for their training. By contrast, only 42% of those managed as cost centers required customers to expend credits or dollars for customer training. This difference in priorities and charging methods undoubtedly impacts outcomes realized from customer training, particularly increasing training revenue. As expected, the benefit of increasing training revenue was one of the strongest benefits realized by those using a profit center model. In fact, more respondents said they had a strong impact on increasing training revenue than on increasing customer satisfaction or from any other benefit. Note that the percentages reporting strong benefits in improving customer satisfaction were virtually the same for respondents from both groups. 39
40 N=17 42% of the respondents who operated their customer training as profit centers reported strong benefits in reducing supports calls - compared with only 8% who were managed as cost centers. 3. How is Customer Training Offered? About half of the respondents required their customers to pay separate fees for training courses, while less than one-third did not require payment. How Customers Pay for Training Courses 50%, 50% 10%, 10% 13%, 13% 27%, 27% Use credits with bundled product purchases Other ways Do not pay for training courses Pay separate fees for training courses Among the other ways that respondents took payment were using a combination of methods requiring customers to pay separately for some courses and not requiring payment for other courses, or a combination of purchased subscription and standalone fees. Those that did not require payment for training said that training was part of a contract, statement of work, company settlement account, or was part of the price of the product itself. 40
41 Regardless of payment structure, customer training was predominantly marketed by website and marketing. Webinars and brochures were also used by the majority of respondents. Most Frequent Ways of Marketing Customer Training Website marketing Webinars Brochures, flyers, etc. Newsletters Seminars Web advertising (e.g., banners, pop-ups) Promotions (20% off, Buy one get one Print advertising Public relations Training catalogs Direct mail Telemarketing Search Engine Optimization Promotional Items Viral marketing Pay-per-clicks (Google, Yahoo, etc.) 3% 3% 41% 34% 34% 34% 28% 24% 24% 17% 17% 17% 14% 55% 55% 90% 83% 0% 10% 20% 30% 40% 50% 60% 70% 80% 90% 100% Percent of Respondents N=29 Participants also stated that website and marketing were the two most effective types of marketing. Use of the Web for Finding and Registering for Courses Profit centers had about 20% more use of the web for finding and registering for courses when compared with those who operate in a cost center environment. Respondents were evenly-distributed among those who: Gave their customers access to their LMS real-time through the web or a portal Gave them access to a manually updated website Offered no way to find or register for courses on the web at all. Use of Web to Find and Register for Customer Training 6% 26% 38% Access LMS thru web real-time Access a manuallyupdated website No way to find courses or register via web Other (e.g., WebEx) 29% N=34 41
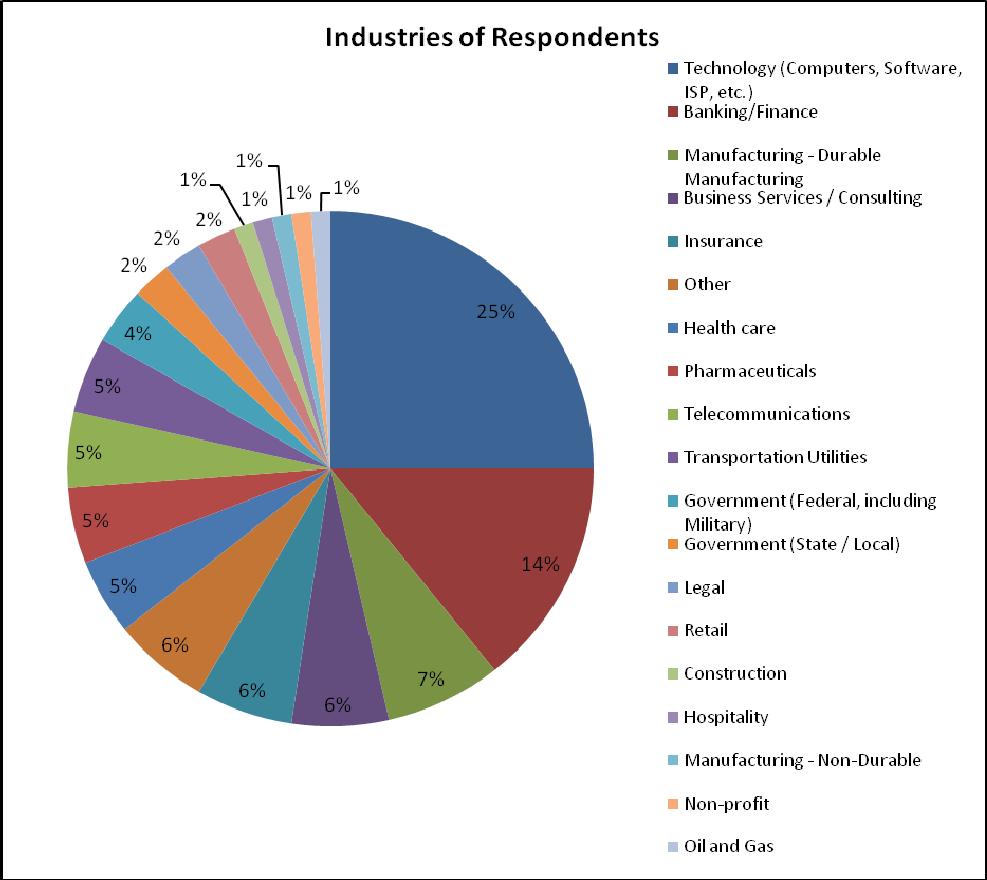
42 Those respondents who managed learning as profit centers had about 20% more use of the web for finding and registering for courses, when compared with those who operated in a cost center environment. Use of Support and Delivery Technologies By far, webinar technology was used most frequently to deliver customer training. Survey tools were used about half of the time. Most Frequently Used Delivery and Support Technologies for Customer Training Webinar Technology Post-Class Surveys Tools Content Delivery or Authoring Tools Testing and Assessment Tools Customer Portal LMS Video on demand Blogs Audio on demand Video coaching LCMS 52% 45% 42% 35% 35% 29% 19% 16% 10% 10% 77% 0% 20% 40% 60% 80% 100% Percent of Respondents N=31 A higher percentage of profit centers used these technologies than cost centers. Respondents were asked what their one biggest challenge was among a list of about 16 challenges. The two top challenges both had to do with a lack of resources in staffing (24%) and in marketing expertise or budget (12%). ABOUT THE SURVEY RESPONDENTS The following charts describe several characteristics of the survey respondents. A. Industries of Respondents About two-thirds of the respondents were in the Technology industry, followed by business service and consulting. The remainder were scattered in several other industries. 42
43 Industries of Survey Respondents 6% 3% 6% 12% 3% 3% 3% Banking/Finance Business Services/Consulting Construction Oil and Gas Mining 64% Technology (Computers, Software, ISP, etc.) Telecommunications Utilities N=34 B. Company Sizes of Respondents Respondents were widely distributed across companies of different sizes. Company Sizes by Number of Employees 12% 26% Below % Above 5,000 36% N=34 C. Departments Doing Customer Training Customer training is conducted by different departments in different companies. About half of the survey respondents indicated that it was run by the training department, while the remainder was in other groups, including human resources, the business/product group, sales, and marketing groups. 43
44 Departments Responsible for Running Customer Training 6% 12% 9% 15% 49% Training Human Resources Business/Product Unit Sales Marketing Other 9% N=34 Respondents Roles in Customer Training Nearly half of all respondents were in leadership roles for both employee and customer training. Most of the other respondents were leaders of either customer training or employee training. Roles of Respondents in Customer Training 28% 9% 6% 13% 44% Leader for Both Employee and Customer Training Leader for Employee Training Only Leader for Customer Training Only On Customer Training Team On Employee Training Team N=32 44
45 Training Efficiency Master Series Survey Results Measuring Learning as Budgets Tighten 45
46 SURVEY OVERVIEW In November 2008, Training Industry, Inc. and Expertus partnered to conduct the fourth survey in the Training Efficiency Masters Series. We asked training professionals about which metrics they collect and use to measure learning. We asked specific questions about the relationships between types of decisions and metrics and pulse questions around budgetary pressure and changes in training budgets from 2008 to Readers can use the results to better understand what metrics learning leaders use to influence budgetary and other important decisions. The pulse data will give you a perspective on the current business environment s impact on training budgets. The survey was completed by 84 corporate and government training professionals in organizations with varying sizes throughout 19 industries. Technology companies represented 25% of all survey-takers, while banking and finance companies were represented by almost one in six respondents. KEY FINDINGS Finding #1: Types of Metrics Collected More difficult-to-collect metrics are used less often. Return on investment and other types of business impact metrics, which are arguably the most difficult to calculate, are used the least often by one in four respondents or less. Conversely, simple metrics such as numbers of course completions and registrations are among the most often used. 46
47 Finding #2: Types of Metrics Used to Influence Budget Volume & cost metrics are most used for budget decisions. The most frequent metrics collected are also most often used to influence budget decisions. However, cost-based metrics are used more frequently in the budgeting process. Finding #3: Types of Decisions Supported by Metrics Current metrics and reporting best support decisions about course offerings. This includes both the strategic decisions about what general types of courses to offer and also tactical decisions about what specific course topics and levels to offer. However, only about half or less of the respondents had the metrics or reporting capabilities to support budgetary, operational, course improvement or compliance decisions. Finding #4: Biggest Measurement Challenges Lack of time and data accuracy are top challenges. Compared with data from a previous survey (April 2007), the current study suggests that lack of time and staffing has become more of a challenge and lack of data is becoming less of a challenge. Finding #5: Cost Reduction Pressure Changes Throughout 2008, cost reduction pressure is rising. Survey data from early February 2008 and early November 2008 indicate that more respondents say their cost reduction pressures in November are significant (45% vs. 41% in Feb.) or intense (15% vs. 13% in Feb.) while fewer describe it as mild (31% vs. 37% in Feb.) The majority of respondents (60%) feel at least significant pressure. Finding #6: Training Budget Changes in 2008 Over twice as many budgets went down than up in During 2008 (through early November), 38% reported training budget decreases compared with only 11% who reported increases. About half of the budgets remained the same. Finding #7: Budgets Changes: 2008 & 2009 Fewer learning leaders expect budgets to increase in Only 17% reported budget increases from 2008 to 2009 compared with 31% who reported budget increases from 2007 to budgets changes are more likely flat or lower. 47

48 DATA CHARTS A) Metric Collection & Decision Support 1. What types of metrics does your training department currently collect? Note: References to Levels I-IV refer to Kirkpatrick Levels I-IV. N=84 Other Types of Metrics collected for question #1 include: Self-Reported Level II and III: Self-report effectiveness, selfreport intent to increase behavior Level III-Related: Competency assessments & Transfer Skills Agreements between trainee and supervisor Level IV-Related: Qualitative feedback on training impact on performance improvement 48

49 2. Which metrics does your training department use to influence budget decisions that are made by leaders outside of the training department? N = Which types of decisions are well-supported by your current metrics and reporting capabilities? N=84 49
50 4. What are your biggest challenges when it comes to training measurements? N=84 Other types of measurement challenges include: Difficulty measuring impact or ROI and isolating the impact of training vs. other factors (e.g., connecting sales training effectiveness to increases in sales/productivity) Non-existent or poor LMS or reporting tools Interpreting data and presenting to upper management Collection difficulty due to lack of buy-in on the importance of collecting data by instructors & coordinators Worldwide privacy requirements regarding reporting data across country borders (especially Europe) 50
51 B) Cost Reduction Pressure & Budget Changes 5. Which of the following best describes the level of external pressure (e.g., outside your training organization) that you have experienced in the past year to reduce training costs? N= Since your 2008 budget was first approved, how has the amount you are allowed to spend changed? N= 84 51
52 7. Please indicate the percentage increase or decrease you expect in your 2009 training budget compared to your 2008 budget. N= 84 ABOUT THE SURVEY RESPONDENTS 8. Please indicate your industry and company size. N=84 52
53 53
54 Training Efficiency Master Series Survey Results Training Efficiency: Internal Marketing 54
55 SURVEY HIGHLIGHTS In 2008, Expertus launched a research study aimed at understanding how companies use marketing to promote participation in internal training programs. We found that while some organizations use marketing to improve training utilization, others do not place any importance on marketing. The survey asked corporate training professionals to discuss their internal marketing activities - including budget, formality, activities, success levels and more. The survey was completed by 75 training leaders whose organizations vary widely in size, scope of resources, marketing budget and other factors. This brief summary highlights just a few of the major findings. You ll find the complete results and charts in the pages that follow. KEY FINDINGS The average marketing budget is only about $.43 per employee, per year. Compare this to a typical training supplier, who may spend as much as $1,000 just to get one person to purchase a seat in a class. Only 15% of respondents have a formal marketing plan. 62% of training departments allocate no budget to marketing. The most frequently used marketing activities include blasts (93%), seminars and workshops (84%) and internal training websites (81%). 41% of respondents only market to make employees aware of their training courses, without actively seeking to increase the size of their classes. 36% of respondents do not use any type of targeting to market to employees; only about half (55%) of respondents target their marketing based on departments or job roles. 55
56 60% of organizations that take the initiative to market programs don t measure the results of their marketing campaigns. 66% of respondents stated that management recommendations are effective in garnering participation in training programs and 69% of respondents stated that these recommendations are received favorably. In addition, they said that management support (either mandates or buy-in) has a tremendous impact. 60% of organizations that take the initiative to market programs don t measure the reach of their marketing campaigns. 73% use no incentives or rewards for participating in internal training programs but for those who do use incentives, popular examples include food, gas cards and ipods. 56

57 SURVEY ANALYSIS: INTERNAL MARKETING 1. Please rate the following activities for their effectiveness in garnering participation in training programs. blasts have been the most effective marketing activity, followed closely by phone calls and management recommendations. The rank for management recommendations is surprising, because this isn t normally considered marketing. However, for effectiveness in marketing of training programs, it clearly has an impact. Not too surprisingly, print newsletters and inter-office mail are at the bottom of the list, which seems to be a direct result of the increased reliance on and websites. In fact, anything that requires paper or printing is at the bottom half of the list. "76% of respondents indicated that blasts are an effective marketing activity." 2. For all of your training department's marketing activities, what kind of reaction do you generally receive from employees? Respondents indicated that webinars, seminars, and workshops get the most favorable reaction from employees. This is probably because these are unobtrusive activities, unlike , phone calls and mail. Closely behind webinars and seminars is management recommendations, which also ranked highly as an effective marketing activity. The added benefit of getting management to recommend training is its low cost of execution. It requires practically no budget and relatively little time, but is highly effective. 57

, the majority of the marketing activities are driven directly by HR or training departments.")
58 3. Please specify who handles the following marketing activities for internal training programs. Respondents indicated that, regardless of the marketing technique (e.g. blasts, posters, internal website updates), the majority of the marketing activities are driven directly by HR or training departments. External vendors are used less than 5% of the time for all activities. 4. Which of the following best describes your training department's overall approach to internal marketing and communications about your training programs? "41% of respondents indicated they make their employees aware of all available training." 58

?")
59 5. Which of the following best describes your corporate training department's marketing communications plan? Only 15% of respondents have a formal written marketing plan. Other responses included, in the following: Proven practices are followed, but not necessarily written down Formal communications, plan but no formal marketing plan Annual 'calendar' of events then ad hoc during rest of year We have a consistent messaging plan relating to all of our learning offerings as it relates to the desired performance outcome. 6. Does your organization change your marketing activities for different types of training programs (e.g. managerial/ supervisory, mandatory/compliance, IT & systems, sales, interpersonal skills, customer service or executive development)? 7. How does your training department generally decide who should receive your internal marketing? 59


60 8. Which of the following incentives or rewards does your training department offer your employees for participating in internal training programs? 77% of respondents use no incentives for employees to participate in training. 9. In what ways do you measure participation in your internal training programs? 80% of respondent s measure participation in internal training programs by the total number of employees trained. 60

61 10. Which of the following metrics does your training department track to measure the reach of your marketing activities? 61
62 Training Efficiency Master Series 2009 Study on Learning Portals & Informal Learning Technologies 62
63 SURVEY OVERVIEW In March 2009, Training Industry, Inc. and Expertus partnered to conduct a study on learning portals and informal learning technologies. We asked training professionals whether they have a learning portal, what benefits they ve experience, how they re using the portal, and how they track and enable informal learning. For this study, learning portals are defined as websites where learners find, buy or simply get access to training. Readers can use these results to better understand how to use a learning portal and how to maximize the value of informal learning technologies. This survey was completed by 194 training professionals from mostly medium to large corporations and government agencies. All major industries were represented, but the largest number of respondents came from Technology (14%), Education (13%), Banking and Finance (12%), and Healthcare (11%). KEY FINDINGS Finding #1: Almost all respondents learning organizations use learning portals. Over 93% of respondents learning organizations have learning portals. Training organizations that train internal employees are by far the most frequent users of learning portals. However, two-thirds of those who train customers and over half of those who train channel partners or vendors also use learning portals. Finding #2: A majority plan to launch a new portal or upgrade their existing portal. Within the next two years, 45% of respondents say they will upgrade their existing learning portal and 14% plan to launch a new learning 63
64 portal. Finding #3: Most portals are home to a large array of learning tools and technologies. Most respondents use all of the twelve major learning tools and technologies listed on the survey in their portals. These include blogs, online coaching, polls, self-study programs, communities of practice, and more. Finding #4: The most important benefit of having a learning portal is improving learner satisfaction. Improving learner (and customer) satisfaction was cited by 68% of respondents as a top benefit of having a learning portal. The other two top benefits are tracking and enabling informal learning and helping to integrate learning technology. Finding #5: The vast majority view informal learning technology as important. 50% of respondents said that including informal learning technologies in their learning programs was critically important and 39% reported that it was somewhat important. Less than 5% said that it was not important. DETAILED FINDINGS Question 1: For which groups does your training organization provide training? Check all that apply. Over 96% of respondents provide training for employees. A surprisingly large amount of these organizations provide training for customers, channel partners or vendors (46%). More training organizations provide training for customers than channel partners. 64
65 Question 2: From which groups does your training organization generate revenue? Check all that apply. The majority of survey participants training organizations (52%) do not generate revenue from training. Among those who provide training to the groups listed in question one: Only 15% of those training organizations that train employees generate revenue 67% of those that provide customer training charge for the training All of those that train channel partners generate revenue 19% of those that train vendors collect money from them Question 3: For which groups does your training organization provide learning portal(s) (i.e., website where learners find, buy or simply get access to training)? Check all that apply. Virtually all of respondents already have some sort of learning portal in place, particularly for employees. Among those providing training to the groups listed in question one: 91% of those who provide training for employees have a learning portal. 66% of those who provide training for customers have a learning portal. 56% of those who provide training for channel partners have a 65
66 learning portal. 57% of those who provide training for vendors have a learning portal. Question 4: Which tools or technologies does your training organization use? Check all that apply. Every learning tool and technology listed on the survey resides inside most respondents learning portals. Among these, the most prominent is self-study programs (which usually means e-learning). The least prominent tool is social profiles, which are more likely to reside outside of the portal. In training situations, social profiles are used for finding subject matter experts who can provide training, mentoring, or answer questions. Online books are also less likely to reside inside portals. Question 5: Please give an example of how your learning organization best uses technology to enable or measure informal learning. Here are a few examples of the more innovative ways that respondents described how they use technology for informal learning: One week after our instructor-led training ends, each student begins a self-directed, twelve-week reinforcement program. We send weekly s that include a content review and an application assignment. Local managers are copied so that they can monitor progress, and every four weeks after that, students do an online self-assessment to measure their progress. 66
67 We allow our customers to access our professional staff through the learning portal rather than face-to-face in our brickand-mortar location. The result has been an increase in overall participation by more diverse groups that include organization leaders. Our LMS has the ability to register informal learning activities. Also, learning plans are completed as a part of the performance development process. When the learning plans are expressed as objectives, we can also track that. We enable informal learning through a number of enabling technologies. SharePoint is leveraged to support blogs, wikis, and communities of practice. Our corporate employee portal is used to support a Facebook-like internal application and we have a beta site that supports YouTube-like user-generated content. Question 6: How important is it that you include informal learning technologies in your training programs? 89% of respondents thought it was either critically important or somewhat important to include informal learning technologies in their training programs. Among the 50% of respondents who said informal learning was critical, their primary reasons are that, compared with formal training, informal learning: Enhances learning by making it more integrated with a job and reinforces formal training Accommodates learner s schedules, geographic locations and learning styles Takes less time Saves money Is how most learning is done anyway Provides immediate access to information Leads to better participation in learning Is expected by younger workers 67
68 Is sometimes easier to get buy-in or support The following represent their comments: Formal training is only the beginning. It has to be reinforced in many different ways for it to stick. There is a limited amount of time and money for formal classroom training and we know that much is learned outside of the classroom. If we can t enable and monitor informal training practices, then we cannot ensure that the training is accurate or going in the right direction. We must use all of our resources to ensure that the information our employees get is accurate, consistent and immediately available. Two trends that we see are: 1) Cutbacks in training budgets, which means less money for training groups to facilitate informal learning without relying on technology. 2) Introduction of Generation Y to the workforce, who expect more online (technology driven) and informal learning via social networking, wikis, blogs, etc. We want to combine learning with work. Informal learning and learning-on-demand is critical in today's fast-paced work environment. Employees need to get information when they need it - and quickly. Question 7: What are the top three benefits of a learning portal? Choose only three. According to the respondents, the top benefit of learning portals is improving learner or customer satisfaction (68%). Other important benefits include: Help in integrating learning technology (54%) Tracking and enabling learning technology (48%) Increasing training adoption (40%) Interestingly, only 9% of respondents thought that increasing training sales was a top benefit. 68
69 Question 8: What was the primary factor supporting funding for the launch of your learning portal(s)? A multitude of factors were used to obtain approval for learning portal funding. The most frequent responses were: Centralized and consistent training repository Our customers or learners demand it Anticipated cost reduction Easy access to self-paced e-learning On-demand and just-in-time training Ability to reach a large global workforce and partners Ability to track learning usage and the status of compliance training Here are some representative comments about reasons to justify funding for portals: We needed one-stop-shopping and a centralized training repository. Minimum cost, maximum exposure! It s necessary to provide remote, just-in-time training access with consistent messaging and reduced travel costs. We needed to create a portal that would simplify learner access, increase learner satisfaction, reduce costs and better integrate learning technologies. Question 9: Do you plan to launch a new learning portal or upgrade your current portal within the next two years? 59% of respondents plan to either upgrade or launch a new learning portal within the next two years. Almost half of the respondents are planning to upgrade their current learning portal within the next two years, which illustrates how fast learning portal technology is evolving and the attractiveness of the new features that have been developed. Question 10: Please indicate your company's industry and company size. 69


70 A wide variety of industries were represented in this study, with the most common industries (in bold) being Technology, Education, Banking/Finance, Healthcare, and Other. 70
Transforming Learning into a Strategic Business Enabler:
 State of the Industry Study Transforming Learning into a Strategic Business Enabler: What does it mean for learning to be a strategic enabler for the business? Submitted by: HCM Advisory Group Sponsored
Driving Cost Out of the Learning Organization:
 Driving Cost Out of the Learning Organization: Keith Hazen David Atack Intrepid Learning Solutions Intrepid Learning Solutions Executive White Paper August 2008 Leading the L&D enterprise is especially
Driving Cost Out of the Learning Organization:
 Learning Services Driving Cost Out of the Learning Organization: Assessing the Enterprise Learning Function Driving Cost Out of the Learning Organization: Assessing the Enterprise Learning Function Leading
The ROI of training: Strategies and evaluation methods
 The ROI of training: Strategies and evaluation methods As global organizations seek to gain a competitive advantage through employee development, more pressure has been placed on HR and learning professionals
Learning Analytics. Metrics that Matter
 Metrics that Matter Learning Analytics Everything is in place with Metrics that Matter. We get great guidance there are many times when we ve called KnowledgeAdvisors and they ve really helped us through
Centralize Service, Not Business Processes
 Ideas & Insights from Expertus Learning 2.0 Centralize Service, Not Business Processes A Best Practice for Training Outsourcing Where Learning Means Business Our research demonstrates that training outsourcing
The Accenture 2011 High Performance Finance Study. Redefining High Performance in the Insurance Finance Function
 The Accenture 2011 High Performance Finance Study Redefining High Performance in the Insurance Finance Function Contents Introduction Introduction 03 Delivering greater value to the enterprise 09 Dealing
Demonstrating Positive Elearning ROI
 Demonstrating Positive Elearning ROI 6 TACTICS FOR SUCCESS By Savanah Barry lynda.com www.lynda.com/industries enterprisesolutions@lynda.com How can you and your organization demonstrate positive elearning
CEdMA Training Market Barometer 3 rd Quarter 2012 actual and forecast for 4 th Quarter 2012
 Introduction CEdMA Training Market Barometer 3 rd Quarter 2012 actual and forecast for 4 th Quarter 2012 This report is compiled by CEdMA for its members about their Education businesses. It is based around
A BIT ABOUT US. Richardson and our clients are highly recognized and have won numerous industry awards, including the following:
 Founded in 1978, we are headquartered in Philadelphia and have international offices in the UK, Singapore, Australia, and additional satellite offices around the globe. A BIT ABOUT US We re Richardson,
RESEARCH SPOTLIGHT EXTENDED ENTERPRISE LEARNING
 RESEARCH SPOTLIGHT EXTENDED ENTERPRISE LEARNING A Profit Driver for Leading Organizations June 2017 Table of CONTENTS About the Study 3 Extended Learning is In 4 Benefits of Extended Enterprise Learning
The State of Employee Engagement
 The State of Employee Engagement A comprehensive look at employee engagement best practices from over 200 organizations around the world 815 W 450 S, Springville, UT 84663 USA // +1.801.515.6500 // decision-wise.com
Redefining Measurement for Continuous Learning
 Redefining Measurement for Continuous Learning How to demonstrate impact when learning goes beyond L&D Todd Tauber Vice President, Learning Research Bersin by Deloitte, Deloitte Consulting LLP April 1,
The Social Marketer vs. the Social Enterprise Social media in financial institutions is in transition.
 DECEMBER 2014 THE STATE OF Social Media in Financial Services The Social Marketer vs. the Social Enterprise Social media in financial institutions is in transition. Although social media is largely perceived
How to Choose the Right LMS Implementation: An Implementation Model Comparison. The LMS you want, the partner you deserve
 How to Choose the Right LMS Implementation: An Implementation Model Comparison The LMS you want, the partner you deserve Copyright Copyright 2018 elogic Learning. All rights reserved. All trademarks are
Choosing an ASP for Your LMS
 Choosing an ASP for Your LMS What Works TM in outsourcing LMS technology & services. Chris Howard October 2004 Bersin & Associates Table of Contents Table of Contents... 2 Table of Figures... 2 Introduction...
executive summary workplace trends guide
 executive summary workplace trends guide Insight from leaders within: Engineering Finance & accounting Healthcare Human resources IT Legal Life sciences Manufacturing & logistics Office & administration
AN EXECUTIVE S GUIDE TO BUDGETING FOR SECURITY INFORMATION & EVENT MANAGEMENT
 WHITE PAPER AN EXECUTIVE S GUIDE TO BUDGETING FOR SECURITY INFORMATION & EVENT MANAGEMENT COST ANALYSIS OF TWO DELIVERY MODELS: SELF-MANAGED SIEM VS. MANAGED SIEM SERVICES AN EXECUTIVE S GUIDE TO BUDGETING
COURSE CATALOG. vadoinc.net
 COURSE CATALOG 2018 vadoinc.net Welcome Welcome to the Vado 2018 Course Catalog. Vado provides any organization or learner numerous opportunities to build the skills needed to lead and manage others, as
Building a Corporate University by TechProse. All rights reserved.
 Building a Corporate University Agenda Risks/Obstacles Why? The Business Case How? Examples, Processes, Effort Questions? Risks/Obstacles Centralized L&D can not meet the needs of the business, does not
Building the Business Case for Learning Technology Systems. Business Builder
 Business Builder Brandon Hall Group Research Team July 2016 TABLE OF CONTENTS Executive Summary 3 The Agenda 3 Business Impact 4 Business Need 4 Solution 6 Questions To Consider 8 Building A Business Case
Issue #1: Understand why you are doing the deal and how people fit into the overall strategy.
 March 2018 HR has a big job to do when two organizations come together, as the success of a deal often depends on how well you address people issues. People issues from culture to total rewards can be
You and Your LMS: 5 Ways to do More with Less
 You and Your LMS: 5 Ways to do More with Less January 2012 Introduction We ve all experienced the ups and downs of recent economic times and have heard the phrase do more with less more than we care to,
Calculating Return On Investment from HR Analytics. Presented by: Scott Mondore, Ph.D.
 Calculating Return On Investment from HR Analytics Presented by: Scott Mondore, Ph.D. Submitting Questions Questions may be submitted at any time during the presentation. To submit a question: Click on
IDENTIFYING SALES TRAINING & DEVELOPMENT INVESTMENTS THAT DRIVE LEARNER OUTCOMES
 IDENTIFYING SALES TRAINING & DEVELOPMENT INVESTMENTS THAT DRIVE LEARNER OUTCOMES IDENTIFYING SALES TRAINING & DEVELOPMENT INVESTMENTS THAT DRIVE LEARNER OUTCOMES 2 IDENTIFYING SALES TRAINING & DEVELOPMENT
Onboarding vs Orientation: Going beyond the Paperwork
 Onboarding vs Orientation: Going beyond the Paperwork Table of Contents Introduction 3 Organizational Roadblocks 4 1. UTILIZE NEW HIRE PORTALS TO SPEED UP THE TIME TO PRODUCTIVITY 7 Centralize All Hiring
trg_11_1207indrepedit 10/25/07 2:34 PM Page 8 Industry Repo
 trg_11_1207indrepedit 10/25/07 2:34 PM Page 8 2007 Industry Repo trg_11_1207indrepedit 10/25/07 2:34 PM Page 9 2007 saw overall training budgets and staffing go up, but growth tailed off somewhat, and
Cloud Contact Centers Gaining Share. 8x8-CCNG Survey, November 2016 SURVEY REPORT
 8x8-CCNG Survey, November 2016 Contents Introduction.... 3 Executive Summary....4 Analysis.... 5 1. Respondents... 5 2. Moving to the Cloud... 6 3. Cloud Inhibitors... 10 4. Analytics The Next Frontier...
JANUARY 2017 $ State of DevOps
 JANUARY 2017 $1500 2017 State of DevOps Although DevOps is maturing, organizations still face barriers to adoption. But eight out of 10 are planning DevOps investments, and those diving in have realized
Special Report: The Secret to Increasing Workforce Performance through Great Objectives Management
 Special Report: The Secret to Increasing Workforce Performance through Great Objectives Management Introduction Why Your Workforce is Biggest Contributor to Business Success The business marketplace has
A small investment that pays big ROI REPORT
 2016 A small investment that pays big ROI REPORT Report highlights In 2015, Pluralsight partnered with CEB, Inc. for an independent survey to evaluate the effectiveness of its training. Nearly 2,000 people
The Case for an LMS. How to Build a Business Case for a Modern Learning Management System. By Tim Armstrong. ExpertusONE Case Study
 ExpertusONE Case Study Expertus White Paper Expertus 2017 The Case for an LMS How to Build a Business Case for a Modern Learning Management System By Tim Armstrong 01 Contents Let the LMS Buyer Be Right
Talent Development Reporting Principles for Customer Education
 Talent Development Reporting Principles for Customer Education By: Jeff Grisenthwaite VP, Operations KnowledgeAdvisors Revision date: 21-August-12 Table of Contents Introduction... 2 Scope... 2 Customer
The Age of Agile Solutions
 >> Whitepaper The Age of Agile Solutions Creating Interconnected Ecosystems October 2017 Sell Side Sponsored by The Age of Agile Solutions Contents Executive Summary... Technology and Services to Unlock
Driving Business Performance
 Workforce Scheduling Driving Business Performance How Workforce Scheduling Optimization Aligns the Workforce with Business Demands for Customer Satisfaction and Success While many factors affect an organization
TOP PERFORMING ORGANIZATIONS
 THE 7 PRACTICES OF TOP PERFORMING ORGANIZATIONS Highlights and Recommendations taken from CedarCrestone 2012 2013 HR Systems Survey White Paper w w w.cedarcrestone.com/annual_surve y The Seven Practices
KEY CONSIDERATIONS FOR EXAMINING CHANNEL PARTNER LOYALTY AN ICLP RESEARCH STUDY IN ASSOCIATION WITH CHANNEL FOCUS BAPTIE & COMPANY
 KEY CONSIDERATIONS FOR EXAMINING CHANNEL PARTNER LOYALTY AN ICLP RESEARCH STUDY IN ASSOCIATION WITH CHANNEL FOCUS BAPTIE & COMPANY NOVEMBER 2014 Executive summary The changing landscape During this time
Strategic Meetings Management: Solutions and Consolidation Opportunities
 About Egencia Meetings & Incentives Egencia Meetings & Incentives combines strategic meetings management expertise with fullservice meeting and incentive planning, all backed by an expert team of meetings
APTA Preliminary Skill Development and Training Needs Report
 APTA Preliminary Skill Development and Training Needs Report July 2010 July 2010 Table of Contents LIST OF FIGURES... i EXECUTIVE SUMMARY... ii SECTION I SURVEY REVIEW... 1 SECTION II OVERVIEW OF SURVEY
BUSINESS INTELLIGENCE: IT S TIME TO TAKE PRIVATE EQUITY TO THE NEXT LEVEL
 BUSINESS INTELLIGENCE: IT S TIME TO TAKE PRIVATE EQUITY TO THE NEXT LEVEL BUSINESS CONSULTANTS DEEP TECHNOLOGISTS In a challenging economic environment, portfolio management has taken on greater importance.
The Emerging Contingent Workforce: Benefits, Challenges, and Opportunities. Research Summary. Brandon Hall Group Research Team April 2017
 The Emerging Contingent Workforce: Benefits, Challenges, and Opportunities Research Summary Brandon Hall Group Research Team April 2017 TABLE OF CONTENTS About the Study 3 The Emerging Contingent Workforce:
2018 Legal Client Satisfaction Report
 2018 Legal Client Satisfaction Report Benchmarks and Key Drivers of Client Satisfaction and Service Excellence in Law Firms Table of Contents Introduction 2 Client Satisfaction in Legal 2018 State of the
SAS ANALYTICS AND OPEN SOURCE
 GUIDEBOOK SAS ANALYTICS AND OPEN SOURCE April 2014 2014 Nucleus Research, Inc. Reproduction in whole or in part without written permission is prohibited. THE BOTTOM LINE Many organizations balance open
IAB GUIDE TO LEARNING & DEVELOPMENT BEST PRACTICES
 IAB GUIDE TO & DEVELOPMENT BEST PRACTICES Expert guidance from the IAB Learning & Development Council to help you improve and benchmark your company s training strategy. IAB GUIDE TO & DEVELOPMENT BEST
3 STEPS TO MAKE YOUR SHARED SERVICE ORGANIZATION A DIGITAL POWERHOUSE
 GUIDE 3 STEPS TO MAKE YOUR SHARED SERVICE ORGANIZATION A DIGITAL POWERHOUSE www.celonis.com IN THIS GUIDE Shared-service organizations (SSOs) are about to get a digital upgrade. For decades, SSOs have
Future of Work is getting bigger in the rearview mirror
 Future of Work is getting bigger in the rearview mirror The Open Talent Economy Deloitte Review 2013 Machines As Talent Global Human Capital Trends 2015 The Gig Economy: Disruption or Distraction? Global
ILRHR555: HR Analytics for Business Decisions
 ILRHR555: HR Analytics for Business Decisions Copyright 2012 ecornell. All rights reserved. All other copyrights, trademarks, trade names, and logos are the sole property of their respective owners. 1
ServiceNow Custom Training and Adoption
 ServiceNow Custom Training and Adoption Overview... 3 Adoption Toolkit Deliverables... 3 Change Enablement Deliverables... 4 Custom Training Deliverables... 5 Custom Training Applications by Business Function...
Time-Starved B2B Buyers
 2017 CONTENT PREFERENCES SURVEY REPORT Time-Starved B2B Buyers Move Toward Shorter, More Targeted Experiences SPONSORED BY SURVEY REPORT INTRODUCTION Content consumption habits among buyers continue to
WHITE PAPER. Annual IIoT Maturity Survey. Adoption of IIoT in Manufacturing, Oil and Gas, and Transportation
 WHITE PAPER 2017 Adoption of IIoT in Manufacturing, Oil and Gas, and Transportation 1 Executive Summary A survey of senior-level, experienced Industrial Internet of Things (IIoT) decision-makers and influencers
A LOOK INTO HOW UNIVERSITIES OPTIMIZE PROCUREMENT PROCESSES WITH INNOVATION
 A LO O K I N TO H OW U N I V E R S I T I E S OPTIMIZE PROCUREMENT P R O C E S S E S W I T H I N N OVAT I O N W R I T T E N BY: J I M K N I G H T, P R E S I D E N T O F S TO N E B R I D G E V E N T U R
The good news is that with some planning and the right partnership, IT leaders and their teams can achieve incredible success.
 Executive Summary In today s tech-driven landscape, software change is a critical part of strategy for every enterprise. Yet change management remains a challenge for most IT leaders and their teams. Why
Why the CFO Cares about Post-Sales Service Realizing opportunities for lower costs and higher revenues
 Realizing opportunities for lower costs and higher revenues CFOs understand that excellence in post-sales service is important both to bolster the bottom line and to support business growth, and they agree
The Accountability Evolution Marketers Turn to Metrics to Boost Their Strategic Value
 in association with: The Accountability Evolution Marketers Turn to Metrics to Boost Their Strategic Value As organizations continue to respond to the uncertain economic environment by tightening their
IT Decision Makers Get Information Workplace Platforms But Strategies And Implementations Are Just Beginning To Break Silos
 December 5, 2006 IT Decision Makers Get Information Workplace Platforms But Strategies And Implementations Are Just Beginning To Break Silos A commissioned study conducted by Forrester Consulting on behalf
The Value of Employee Engagement. A Guide to Discovering the Business Impact of High-Engagement Employees
 A Guide to Discovering the Business Impact of High-Engagement Employees Introduction Today s business leaders are faced with many challenges brought on by recent economic, technological, demographic, and
INTRODUCTION KEY LESSON FOR 2016 IT S ALL ABOUT TIME SURVEY DETAILS
 INTRODUCTION In recent years, Internet marketing has replaced most other marketing efforts for businesses of all sizes. A wealth of research has emerged studying the use of digital marketing by large companies.
Clear Creek County Broadband Survey Results
 Clear Creek County Broadband Survey Results MARCH, 2017 Contents About NEO Connect... 3 Introduction... 4 Summary of Survey Results... 4 Residential Results... 4 Business Results... 5 Role of Government
How Improving Communication Skills Increases Bottom Line Results
 How Improving Communication Skills Increases Bottom Line Results Introduction Communication is the act of transferring information from one person to another. While it s simple enough to say, it s not
2018 Trends in Personalization
 2018 Trends in Personalization Researchscape International Evergage, Inc. 2 SURVEY RESULTS PAGE 2 EXECUTIVE SUMMARY To help organizations better understand the key benefits, current usage and barriers
PMO. The 2012 Global State of the PMO On the Road to the Next Generation. An ESI International study
 PMO The 2012 Global State of the PMO On the Road to the Next Generation An ESI International study The Global State of the PMO: On the road to the Next Generation 1 Introduction 2 Section 1: Personal and
Redeployment. Connecting Talent to Organizational Workforce Needs
 Redeployment Connecting Talent to Organizational Workforce Needs Table Of Contents Trends in Workforce Management 1 Understanding the Business Challenge 3 Talent: A Key Priority 4 Right Redeployment An
Justifying Elearning: Online courses for employees with practical cases of leading US companies. ROI and Key Metrics
 Justifying Elearning: Online courses for employees with practical cases of leading US companies ROI and Key Metrics WHY CALCULATE ROI? Elearning specialists constantly face a lot of why questions: Why
The Corporate Learning Factbook 2010
 The Corporate Learning Factbook 2010 Overview Karen O Leonard, Principal Analyst January 2010 BERSIN & ASSOCIATES RESEARCH REPORT V.1.0 The Bersin & Associates Membership Program This document is part
In the face of changing technologies, hyper-busy
 If You Build It, Will They Come? How internal and external trainers successfully market their programs and services. BY SAUL CARLINER, PH.D., CTDP, AND DAVID W. PRICE In the face of changing technologies,
Introduction. Communication: ion: Why Is Something So Simple, So Hard?
 How Improving Communication Skills Increases Bottom Line Results Introduction Communication is the act of transferring information from one person to another. While it s simple enough to say, it s not
SEMtek. Introduction. SEMtek success story: University of Alabama at Tuscaloosa
 SEMtek Since 1984, entrinsik has invested considerable time researching the seminar and event management industry, learning the business and developing software that would not only automate the process
TEMKIN GROUP OVERVIEW
 TEMKIN GROUP OVERVIEW is a leading customer experience (CX) research, consulting, and training firm. We help many of the world s largest brands lead their transformational journeys towards customer- centricity
Metrics that Matter Training Portfolio Evaluation Model
 Metrics that Matter Training Portfolio Evaluation Model Formal Learning Interventions Contents Introduction... 2 Portfolios... 3 Other Considerations:... 4 Duration... 4 Sampling... 4 Survey Form Types...5
Today s Sponsor: Today s Session: Integrated Learning Analytics: Strategies & Best Practices for Success. Nov. 7, 2012
 Today s Session: Today s Sponsor: Integrated Learning Analytics: Strategies & Best Practices for Success Nov. 7, 2012 Tips for the Webinar: Tweeting? Please use this tag: #IntegratedAnalytics (800) 263-6317
Employee Engagement Leadership Workshop
 Employee Engagement Leadership Workshop Turning employee feedback into results Developed for: Presented by: Copyright 2010, DecisionWise, Inc. All rights reserved. No part of this publication may be reproduced,
Making the Case for an LMS
 A Best Practices Guide Making the Case for an LMS Key Steps for Success Introduction If your organization is considering a Learning Management System (LMS), finding one that best meets your organization
Rethinking voice. Survey of employers about employee voice. Sustainable business success
 Rethinking voice Survey of employers about employee voice Sustainable business success Employee voice Employee voice is increasingly important in the modern workplace. Having a voice is crucial, for the
KEY LESSONS FROM SUCCESSFUL ASC 606 IMPLEMENTATIONS
 KEY LESSONS FROM SUCCESSFUL ASC 606 IMPLEMENTATIONS 1 Revenue management is a complex exercise for most businesses. The incoming guidance change in the form of ASC 606 has made it even more complicated.
Building a Rockstar CUSTOMER TRAINING DEPARTMENT
 Building a Rockstar CUSTOMER TRAINING DEPARTMENT Overview You ve just been given the responsibility of building a customer training department. Now what? This guide outlines the foundational building blocks
Inventory performance today: Why is it declining?
 www.pwc.com Inventory performance today: Why is it declining? November 2015 Inventory performance today: Why is it declining? Inventory is often considered by manufacturers to be the most valuable category
Demonstrating Value Through Learning Analytics KnowledgeAdvisors. All rights reserved.
 Demonstrating Value Through Learning Analytics 1 Overview of KnowledgeAdvisors The Standard in Learning Analytics Benchmarking Visit our website at www.knowledgeadvisors.com We help organizations measure
CEdMA Europe Market Barometer
 CEdMA Europe Market Barometer st Quarter and forecast for nd Quarter Introduction This report is compiled by CEdMA Europe for its members and is based on input for their EMEA businesses. It is based around
MEASURING ROI WITH A TRAINING ADMINISTRATION SYSTEM
 MEASURING ROI WITH A TRAINING ADMINISTRATION SYSTEM Proving ROI is now a standard expectation across most business functions. This paper will look at how best to use a Training Administration System to
Achieve Business Results with Performance - Based Learning Best Business Practices and Call Center Case Study
 Achieve Business Results with Performance - Based Learning Best Business Practices and Call Center Case Study Convergys Relationship Management Customer Relationships Achieve a Superior Customer Experience
Marketing Automation: A View from the C-Suite
 Marketing Automation: A View from the C-Suite Table of Contents 3. Marketing Automation: A View from the C-Suite 4. Important Strategic Objectives 5. Rating Strategic Success 6. Challenges to Success 7.
PROVEN ROI. The Case for the YouEarnedIt Employee Experience Platform
 PROVEN ROI The Case for the YouEarnedIt Employee Experience Platform PROVEN ROI TABLE OF CONTENTS 2 Table of Contents 1 2 3 4 5 6 7 About This Report Proven ROI: Employee Engagement Proven ROI: Organization-wide
COACHING USING THE DISC REPORT
 COACHING USING THE DISC REPORT TAKING THE NEXT STEP Congratulations! You ve taken the first vital step in showing that you are a champion in your organization that wants to make a difference. Your employees
Building the Business Case for Learning Technology Systems. Business Builder
 Business Builder Brandon Hall Group Research Team July 2017 TABLE OF CONTENTS Executive Summary 3 The Agenda 3 Business Impact 4 Business Need 5 Technology Solutions 6 Questions to Consider 8 Building
STATE OF B2B MOBILE MARKETING 2015
 STATE OF B2B MOBILE MARKETING 2015 Research Report - May 2015 WHO WE SPOKE TO Number of mobile phone users globally overtook the number of desktop users sometime last year. More and more business executives
The future for cloud-based supply chain management solutions
 The future for cloud-based supply chain management solutions A global survey of attitudes and future plans for the adoption of supply chain management solutions in the cloud Survey conducted by IDG Connect
SAP BW Consulting, Inc s. Value Creation Proposition
 www.sapbwconsulting.com SAP BW Consulting, Inc s Value Creation Proposition E-Mail: Lonnie.Ayers@SAPBWConsulting.com We Don t Try to Fit a Square Peg in a Round hole 2 TABLE OF CONTENTS Client Value Creation
Case Study: Grange Insurance Creates Prescriptive Learning Portal. Jennifer De Vries. Bersin & Associates May, 2004 V 1.0. Bersin & Associates 1
 Case Study: Grange Insurance Creates Prescriptive Learning Portal Jennifer De Vries Bersin & Associates May, 2004 V 1.0 Bersin & Associates 1 Table of Contents Case Overview... 3 The Business Challenge...
Each of these is an invaluable investment in the growth and health of a staff, and ultimately, the health of the church.
 1 Most leaders would say that their people are their greatest asset. Yet the greatest asset rarely receives the greatest level of investment. A great investment in staff members is far more than financial.
Performance Consultant Certification
 Performance Consultant Certification...Realizing the Value of Consulting Program Overview Leading to the designation of Certified Performance Consultant (CPC) Program Overview The Meaning of Certification
SHIFTING DIGITAL LANDSCAPE
 THE SHIFTING DIGITAL LANDSCAPE An Advertiser s Guide to Targeting, Technology, and Transparency Table of Contents Executive Summary 3 Key Takeaways 4 Shifting to Audience Targeting 6 Shifting Control 8
Using HR Analytics to Build a Business-Focused HR Strategy. Scott Mondore, Ph.D. Strategic Management Decisions
 Using HR Analytics to Build a Business-Focused HR Strategy Scott Mondore, Ph.D. Strategic Management Decisions Learning Objectives A step-by-step process for building an HR strategy How to connect people
SpECIal EdItORIal FEatuRE, In association WItH CIO. Service-based software powers ahead
 SpECIal EdItORIal FEatuRE, In association WItH CIO SaaS adoption SPONSORED FEATURE 1 Service-based software powers ahead the trend towards SaaS in organisations of all sizes is now irreversible, a survey
CMMS REPORT JOURNEYMAN LEADER M P P A
 APPRENTICE STATE OF CMMS REPORT 2017 JOURNEYMAN LEADER MOVER 82 MASTER P.01 ABOUT THE STATE OF CMMS REPORT JOURNEYMAN Using 1000 responses to the CMMS Score Survey, we ve produced the 2017 State of CMMS
2017 Recruiter Sentiment Study
 2017 Recruiter Sentiment Study With Insights from and Candidates Conducted by The Martec Group on behalf of MRINetwork, a subsidiary of CDI Corporation CONTENTS SURVEY HIGHLIGHTS 3 JOB OPENINGS TODAY What
2017 Recruiter Sentiment Study
 2017 Recruiter Sentiment Study with Insights from and Candidates Conducted by The Martec Group MRINetwork.com/Recruiter-Sentiment-Study CONTENTS SURVEY HIGHLIGHTS 3 JOB OPENINGS TODAY What is Causing Job
How to Select, Align, Develop, and Retain Highly-Engaged People in Healthcare
 How to Select, Align, Develop, and Retain Highly-Engaged People in Healthcare INTRODUCTION A PATIENT-CENTERED WORKFORCE A Patient-Centered Workforce is made of highly-engaged people and teams who endeavor
Teaming with PepsiCo to achieve high performance with an innovative learning model for Finance professionals
 Teaming with PepsiCo to achieve high performance with an innovative learning model for Finance professionals Micro-profile PepsiCo Inc. is a FORTUNE 100 company and one of the leading food and beverage
Building the Business Case for Next-Generation HR Systems. Business Builder
 Business Builder Brandon Hall Group Research Team December 2016 TABLE OF CONTENTS Executive Summary 3 The Agenda 3 Business Impact 4 Business Need 4 Solution 5 Questions to Consider 7 Building a Business
The Executive s Guide To HR Outsourcing
 The Executive s Guide To HR Outsourcing HR Benefits Payroll gnapartners.com There comes a time in the journey of every successful business owner or executive when they realize their company can no longer