Job Market Paper. Edgar Cortés. Current Draft, December Please retrieve the latest version of the paper at: ecortesq.weebly.com.
|
|
|
- Edwin Robbins
- 6 years ago
- Views:
Transcription
1 Explaining the Decline in High Skill Employment in the 2000s in the US Job Market Paper Edgar Cortés Current Draft, December Please retrieve the latest version of the paper at: ecortesq.weebly.com Abstract A slowdown in the growth of the level of employment in high-skill occupations in the United States has resulted in a slight decrease in the share of the working population employed in high skill occupations beginning around the year This paper shows that this decrease is mainly driven by demographic changes associated with the exit from the high skill employment of the first baby boom generation, which had a high rate of employment in high skill occupations. It then provides evidence that suggests that the slowdown of high-skill employment is not caused by a negative demand shock. The finding suggests that the US economy has experienced a negative skill supply shock and that the slowdown in the share of individuals employed in high-skill occupations will continue further. KEYWORDS: college premium, earnings inequality, occupations, returns to school- ing, skill biased technical change, skill premium, labor force and employment, retirement. JEL: J20, J21, J23, J24, J26, J30, J31, O33 University of California at Los Angeles, Department of Economics: ecortesq@ucla.edu I would like to thank Maurizio Mazzocco, for continous guidance, support, and encouragement. I would also like to thank Pedro Aratanha, Mary Ann Bronson, Moshe Buchinsky, María Casanova, Yi Chen, Edward Kung, Kenneth Mirkin and Till Von Wachter for very helpful comments that have significantly improved the paper as well as audiences in the Applied Seminar at UCLA. 1
2 1 Introduction A large literature in economics has documented the growth in employment for occupations involving a high degree of cognitive skills, named hereafter high skill occupations and the associated disappearance of occupations intensive in routine tasks, typically referred to as middle-skill occupations (Katz and Murphy (1992), Acemoglu (2002), Autor and Murnane (2003), Autor and Dorn (2013), Autor and Kearney (2006), Goos and Manning (2007)) 1. The share of men between 25 and 55 years employed in high skill occupations had grown at an approximately constant rate since the 1970s. However, beginning around the year 2000, this share started to decline 2. In this paper I provide an explanation for the slowdown in the level and the slight decrease in the share of working individuals employed in high skill occupations between the year 2000 and the year I limit the analysis up to 2007 to abstract from changes in employment associated with the economic recession of 2008 and The main focus of the paper is on men, in order to abstract from life cycle differences in the labor supply of men and women. 3 Figure 1 shows for males 25-55, the trends in levels of employment and both the share of individuals employed in high skill occupations and the share of total hours worked employed in high skill occupations between 1970 and The upper panel of Figure 1 also shows the trend that would have been observed in the absence of a post 2000 slowdown. The difference between the two lines represents about one million workers. This paper provides evidence that an important source of the slowdown shown in these graphs is a change in the composition of the workforce in the United States. Previous work has documented a 1 This same literature has noticed a slight expansion in employment of jobs that require the least amount of skill, which are also associated with low wages. This has led numerous researchers to consider this period as one of polarization, with increases in employment and real wages at both ends of the skill distribution. 2 The Appendix contains a detailed list of occupations 3 When I include both men and women in the analysis I find a less pronounced slowdown in the proportion of individuals working in this type of occupations. 4 Appendix Figure 1 shows the combined male and female share of total hours worked employed in high skill occupations. 2
3 slowdown in the proportion of men and women obtaining a college degree or a graduate degree for cohorts born after the second World War ((Card and Lemieux, 2000)). The present study complements the previous literature in three ways. First, I document that the slowdown in the trend of accumulation of higher education coincided with a slowdown in the share of the population working in high skill occupations. Specifically, for cohorts born between 1920 and 1945, the share of workers going to high skill occupations had been growing at an approximately constant rate. However, starting with the post World War II (WWII) cohorts there was a decline in the proportion going into high skill occupations. This proportion remained about constant for cohorts born in the 1950s and early 1960s. Second, I document that there is an age gradient associated with employment in high skill occupations: as cohorts age, a higher proportion of each cohort ends up working in this type of occupations, followed by a sharp transition out of high skill occupations as cohorts enter their fifties. 5. These two facts suggest the exit from high skill occupations of the highly skilled cohorts born in the late 1940s has contributed to the stagnation in high skill employment previously mentioned. Indeed, a simple decomposition of high skill employment into cohort, age, and time effects suggests that if cohorts born in the 1950s and 1960s had entered high skill occupation at a higher rate than older cohorts, the share of the labor force in high skill occupations would have increased more and would not have stopped increasing after the year Third, using standard assumptions that relate skill supplies and relative wages ((Card and Lemieux, 2001), Autor et al. (2008)), I show that the implied relative demand for high skill workers has continued increasing during the 2000s 6. Using a production function that takes as inputs high skilled workers and workers in other occupations and that allows workers of different age groups to be imperfect 5 This is consistent with evidence on age-related career progression 6 Notice that this differs from the demand for workers in high skilled occupations 3
4 substitutes. This allows me to recover the degree of substitutability across workers of different age groups. I find that, within high skill occupations, there is a high degree of substitutability across workers of different age groups. This suggests that the exit from high skill occupations of old highly skilled cohorts will increase the wage premium younger workers employed in high skill occupations are able to command over workers in other sets of occupations. Since higher education increases the probability of entering this type of occupations, this provides an incentive for younger workers to accumulate more human capital. 7 This paper contributes to the literature on by documenting a slowdown in entry into high skill occupations starting with post WW2 cohorts and exploring its potential consequences for inequality. The next section provides an overview of trends in the data. Section 3 explains the decomposition and presents results from simple counterfactual exercises. Section 4 considers the exit from high skill occupations of relatively older cohorts. Section 5 explains the link between education and high skill employment and, using standard structural assumptions, presents estimates of the implied elasticity of substitution across age groups and estimates of the implied trend for the relative demand for high skill workers. Section 6 discusses implications for policy and its connection to the literature on polarization. Section 7 concludes and presents avenues for future research. 2 Trends in the data In this section I present a descriptive overview of trends in employment in high skill occupations. In the first subsection I discuss high skill occupations relevance. In the second subsection, I describe the data. In the third subsection I present the trends in the data that motivate the empirical analysis. 7 Notice that this hinges upon the assumption that the unobservable characteristics of younger high school graduates has remained relatively unchanged. (Altonji et al., 2012) suggest this is a strong assumption. 4
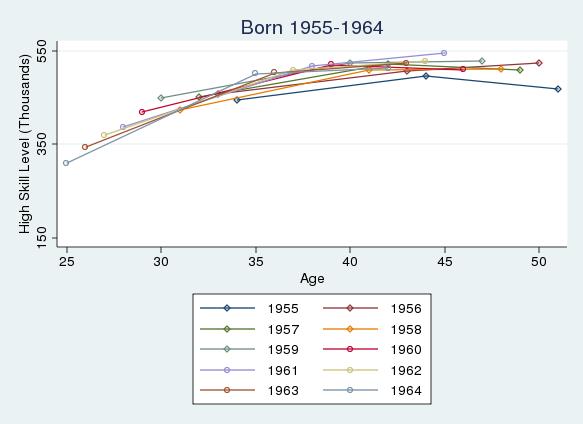
5 2.1 Overview This paper uses 3 main sources of data. In Sections III, IV and V, I use 5 percent samples of the U.S. censuses from the 1970, 1980, 1990, and 2000 Integrated Public Use Microdata Series (IPUMS) (Ruggles et al. (2010)) and annual data from the American Community Survey for the years I also use data from the May/Org rotation groups of the Current Population Survey (CPS).These data provide individual level information on economic and demographic characteristics, employment, and occupation. The analysis in all sections of the paper is restricted to non-institutionalized individuals between 25 and 65 years of age. The data are used to construct estimates of educational attainment, employment, and wages. Further details about the data and the construction of variables of interest are provided in Appendix A. A central feature of the analysis is the definition of occupations. I follow the standard in the literature (Autor and Murnane, 2003) and convert all occupations to the 1990 classification. Appendix A provides a detailed discussion of the definition and construction of occupations. 2.2 Trends in the Data Employment Levels Although the level of employment in high skill occupations increased continually during the 1970s, 1980s and 1990s, the aggregate pattern masks important differences across age groups and cohorts in the labor market. Figure 3A shows the average number of workers employed in high skill occupations for cohorts born five years around each of the labeled Birth Years at different points in their lives. For example, the 1930 Birth Year cohort includes those born between 1928 and The figure reveals three important features of the data. First, there is a very marked increase in the level of employment in high skill occupations for cohorts born around 1950 relative to cohorts born around There is 5
6 a strong slowdown in the number of individuals entering high skill occupations between cohorts born around 1950 and 1960 and this slowdown persists for successive cohorts. Second, as individuals age, a higher number of members of a given cohort are employed in high skill occupations. In the figure, this increase is more pronounced between ages 30 and 40. Third, between ages 50 and 60 a large number of members of each cohort are no longer employed in high skill occupations 8. The figure confirms the presence of a large expansion and subsequent stabilization of employment in high skill occupations for cohorts born between the early and late 1940s and a concave age profile in employment in high skill occupations. Abstracting from the age profile for a moment helps understand the force behind the slowdown in the growth of employment in high skill occupations seen in the 2000s. Consider first the cohort born in Assuming for simplicity that all individuals belonging to such cohort exit high skill employment between 50 and 60 years old, the number of individuals from such cohort leaving the labor market between 1980 and 1990 would be lower than the number of individuals born around 1960, who would be entering high skill employment in In such a scenario, the level of employment in high skill occupations would have undoubtely increased between 1980 and Similarly, the entry into high skill employment of the 1970 cohort would more than compensate for the exit of the 1940 cohort. However, the number of individuals belonging to the 1980 cohort entering the high skill employment in 2007 is lower than the large number of individuals belonging to the 1950 cohort exiting high skill employment between 2000 and There are two ingredients that generate the disproportionate expansion and subsequent stabilization of employment in high skill occupations. First, cohorts born in the late 1940s and 1950s were disproportionately large relative to previous cohorts 9 These are typically called baby-boom cohorts. 8 Appendix Figure 3 plots the age profiles for all cohorts in the data. 9 Appendix Figure 2 shows the number of individuals born in different cohorts in the year There is a clear increase in cohort size starting with cohorts born in 1946 up to cohorts born in
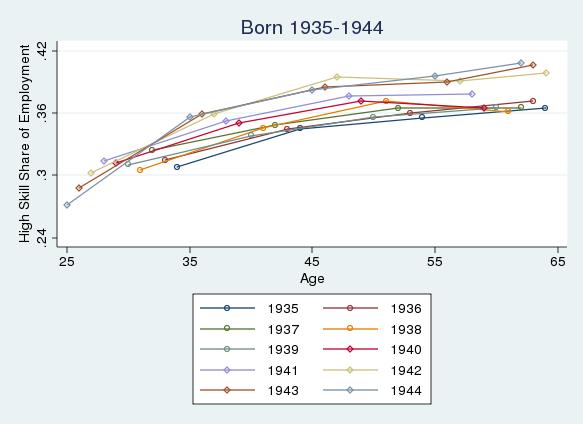
7 Second, starting with the baby-boom cohorts, the share of individuals entering high skill occupations stopped growing. Figure 3B shows that, as a share of total employment, high skill employment increased for cohorts born before 1950 at every point in their lifetime. It also shows that this share experienced a slight decrease for baby boom cohorts and a slight recovery for cohorts born around Whereas Figure 3A showed an increase in the number of individuals employed in high skill occupations between 30 and 50 years, Figure 3B shows that, as cohorts age, high skill occupations represent a higher proportion of employment. Notice that this is generated in part by the increasing number of individuals who gain access to high skill employment and partially by exit from the labor market of individuals employed in other occupations. Thus, the high skill level of employment stops growing between 40 and 50 years old but the share of employment corresponding to high skill occupations continues increasing. This is consistent with individuals in other occupations exiting the labor force earlier 10. Taken as a whole, Figures 3A and 3B suggest that the reversal in high skill employment in the 2000s is connected to the changes in high skill employment brought about with the exit from the labor market of the baby boom cohort. In order to show more formally the effect of changes in the composition of the labor force on high skill employment, in the next section I use a simple decomposition that allows me to perform some counterfactuals that highlight the importance of the slowdown in entry into high skill occupations associated with the baby boom cohort. 10 Individuals in middle and low skill occupations tend to exit the labor force earliers than individuals employed in high skill occupations 7
8 3 Decomposition To understand how demographic changes have impacted the occupational distribution in the data, we would like to compare two otherwise identical economies that differed in their demographic composition. A simple comparison of these two economies occupational composition would suffice to understand how demographics affect the occupational distribution in the data. In the absence of this source of variation in the data, in this section I illustrate the consequences of changes in the demographic composition of the labor force by decomposing the share of employment of individuals of different age groups at different points in time as a function of their age and the cohort they belong to. In the first subsection I briefly discuss the decomposition. In the second subsection I discuss the results. Consistent with the patterns presented in the previous section, suppose that the share of individuals in age group a at time t working in high skill occupations is given by: S it = a i + c t i + e it where i is and index for age, t is an index for time, and t i indexes cohorts. This specification imposes that as individuals age, a larger fraction ends up working in high skill occupations, which is consistent with career progression motives. The second term, c t i, captures the remaining cohort specific variation in the data. Panels A and B of Figure 4 show the estimated age and cohort effects. 11 The figure shows a concave age profile in high skill empoyment. Relative to individuals in their early twenties, the share of individuals 11 A similar specification that exploits only within-industry variation: generates similar coefficients (Appendix) S ijt = a i + c t i + d j + e ijt 8
9 going into high skill occupations increases by 10 percentage points by the time they reach 40 years old. Between 50 and 60 years old there is a very steep decline in the fraction of individuals still working in high skill occupations. Panel B of Figure 4 displays the estimated cohort effects. As can be seen, for individuals born between 1925 and 1945, a higher share of each successive cohort entering the labor market has worked in high skill jobs throughout their lives. There was a strong reversal starting with cohorts born in the second half of the century. There has been a slow increase in high skill employment for cohorts born in the 1970s. The upper panel of Figure 5A shows the predicted values obtained using the estimated coefficients from this decomposition along with the predicted values under a counterfactual scenario in which post WW2 cohorts had entered high skill occupations at an increasing rate 12. The figure reveals several facts. First, consistent with the graphical evidence presented in the previous section, this simple decomposition captures the trends in the data, as revealed by the predicted values displayed in the graph. Second, the figure suggests that, if post World War II cohorts had continued entering high skill employment as previous cohorts did, employment in high skill occupations would have displayed a less significant slowdown between 2000 and This section has shown that the reversal in high skill employment observed in the data appears to be mainly driven by the exit from high skill employment of the first baby boom cohorts. This suggestive evidence is not conclusive. Thus, in the next sections I first provide complementary evidence that suggests that the cohorts exiting high skill employment in the 2000s have not been subject to negative demand shocks and then I make use of structural assumptions relating relative wages and relative quantities to confirm that the slowdown in the high skill employment share cannot be a consequence of negative changes in the demand for skill. 12 I assume the share continues increasing at its pre-1945 cohort trend 9
10 4 Exit from High Skill Occupations In the previous section I provided evidence that suggests that the slowdown in the growth of employment in high skill occupations and the decline in the share of the population working in high skill occupations is strongly related to the exit of relatively older cohorts from high skill occupations. In this section I provide evidence that suggests that a negative demand shock affecting individuals working in high skill occupations around the year 2000 cannot play a big role in these individuals exit from employment in high skill occupations. This exercise does not require me to impose any assumptions on the selection of individuals still employed in high skill occupations. 4.1 Exit Rates from Census Data From Census and ACS data I know the number of individuals belonging to each cohort that work in high skill occupations. Thus, I can also calculate the cohort-specific proportion of individuals leaving high skill occupations between two given dates. Then I can take the difference in this measure for consecutive cohorts. To fix ideas, consider the cohort of individuals born in These were 53 years old in 1990 and 63 years old in I calculate the proportion of those employed in high skill occupations in 1990 who are no longer employed in high skill occupations in I obtain (equation for exit rate 1947). Similarly, for each cohort c I can obtain this measure between time periods t and t + 1 : ExitRate c,t:t+1 = HS c,t HS c,t+1 HS c,t Now consider the cohort of individuals born in These were 53 years old in 1980 and 63 in If labor supply has remained stable across these two dates, exit rates between 53 and 63 years old should be similar for these two cohorts unless these were exposed to differential demand shocks. Figure 5A plots the implied exit rates for different cohorts between different ages. First, notice that the 10
11 figure mirrors the age profile of employment in high skill occupations discussed in Section (Profiles): the share of individuals no longer working in high skill occupations between two Census years (i) starts increasing as individuals approach their mid fifties and (ii) continues rising smoothly with age. Second, the figure shows the implied exit rate from high skill employment: in order to make the exit rates from high skill employment between , and comparable I assume that the exit rate represents 70% of the implied exit rate Third, the differences in exit rates across the three time periods considered are not increasing. This suggests that negative demand differentially affecting high skill workers in the 2000s cannot play a big role in explaining exit from high skill occupations. Table I confirms the visual impression conveyed by Figure 5. It shows the within age-group average difference in exit rates between years from 1980 to Between 1980 and 1990 exit rates from high skill occupations for individuals years old were essentially constant. Following a 1% increase in exit rates from high skill employment between 1990 and 2000, there was a 4% decrease in high skill employment exit rates between 2000 and Hence, there is no evidence of a negative demand shock that would reduce employment for highly skilled individuals in the 2000s. 5 What explains the decline in High Skill Employment starting with the Baby Boom Cohort? In Section 3 I provided evidence that suggests that the decline in high skill employment is a consequence of the exit from high skill occupations starting with the first baby boom cohorts. In Section 4 I provided evidence that suggests that, relative to older generations, these cohorts were not subject to 11
12 stronger negative demand shocks as they approached retirement. Moreover, the evidence provided so far suggests that the decline in high skill employment is strongly related to the fact that the share of individuals employed in high skill occupations stopped growing precisely for generations born in the late 1940s and 1950s. Why did baby boomers stop going into high skill occupations at higher rates than previous cohorts? In this section I provide evidence that suggests that a slowdown in educational attainment characteristic of the baby boom generation represented a negative skill supply shock to the economy that in turn reduced employment growth in high skill occupations. I first show that there is a strong positive relation between a cohort s higher education rate and the share of that cohort that is employed in high skill occupations. I then present evidence that suggests that this negative skill supply shock contributed to increase the wage premium workers in high skill occupations received relative to workers employed in other occupations. 5.1 Educational Attainment, Employment in High Skill Occupations, and Wage Differentials For all the years considered in this study, there is a strong association between a cohort s educational attainment and its share working in high skill occupations. The cross sectional correlation of a cohort s share of individuals with more than four years of education and the share working in high skill occupations is 95%; a 10 percent increase in a cohort s share of individuals with more than 4 years of education is associated with a 9 percent increase in that cohort s share of individuals working in high skill occupations. Figure 6 shows that there was a strong reversal in the share of workers with a college degree or more education for cohorts born in the second half of the century. 12
13 This suggests that the reversal in educational attainment of post WWII cohorts reduced the supply of skill available to work in high skill occupations. In the next subsection I discuss the implications in terms of wages of this negative skill supply shock. Did the slowdown in educational attainment contribute to increase wages in high skill occupations? The extent to which a slowdown in educational attainment increases different cohorts wages depends on the elasticity of substitution across age groups. If different age groups with the same level of education are perfectly substitutable, a slowdown in the educational attainment of cohorts just entering the labor force should increase the relative wage of those with a higher level of education. If different age groups are far from perfect substitutes in production, age groups for which the relative supply of educated individuals decreases the most will experience larger increases in relative wages. If a slowdown in educational attainment constitutes a negative shock to the supply of skill available to work in high skill occupations, the wage of workers in high skill occupations will also increase relative to the wage of workers in other less skill-intensive occupations. How this increase in wages is distributed across different age groups will also depend on the degree of substitutability across different age groups in high skill jobs. Following (Card and Lemieux, 2001) I decompose the log wage difference between groups with different levels of skill into age effects, time effects, and post WWII cohort effects. Age effects capture the increase in the wage differential between skilled and unskilled individuals coming from returns to experience. Time effects capture time-varying increases and decreases in the relative aggregate demand and supply of skill. Cohort effects capture cohort specific premia. Under perfect substitutability across age groups, a cohort-specific increase in the relative supply of skill in a specific year will increase the wage premia of all age groups in the market in that year. Year effects will absorb this demand shock and cohort effects will be equal to zero. Under imperfect substitutability across age groups, a cohort- 13
14 specific increase in relative skill supply will disproportionately increase the wage premium experienced by that cohort, absorbed by a cohort effect. Table II shows the results of such a decomposition for several skill groups. I first show the College-High School log wage difference. The year effects show that after a dip in 1980, the aggregate returns to college have been increasing over time, consistent with both an acceleration of demand for skill and a deceleration in the average level of education since that year. Cohort specific effects of post WWII cohorts are also increasing over time. This is inconsistent with perfect substitutability across age groups with the same level of schooling, and confirms Card and Lemieux s (2001)* observation that the slowdown in educational attainment of the cohorts has also been a key component in the increase in inequality after Column II shows that the returns to post-graduate education have increased at a faster pace than the returns to college, and the increasing cohort effects also suggest the presence of imperfect substitutability across age groups. Columns III shows the log wage difference between workers employed in high skill occupations and those employed in middle or low skill occupations. Columns IV and V show this difference separately for workers with college and those with more than college. Column III shows a pronounced increase in the wage difference between workers in high skill occupations and those in other sets of occupations. The time effects in Columns IV and V suggest that this increase is fundamentally driven by high skill workers with more than four years of education, whose relative supply contracted the most. However, for both college workers and post-graduate workers the wage differential has increased the most in the 2000s. This can be a consequence of a post-2000 increase in the demand for skill or from a post-2000 contraction in the supply of skill. Although the cohort effects in Columns IV and V are somewhat increasing for post WWII cohorts, they are estimated very imprecisely. The lack of strong cohort effects could be a consequence of a higher degree of substitutability across different age groups among the highest educated skilled workers as compared to college workers. In order to make progress in 14
15 disentangling supply from demand, in the next subsection we make some functional form assumptions. Implied Relative Demand for Skill Under certain assumptions regarding the underlying production function of the economy, we can use information about wages and relative supplies of work to obtain estimates of the implied demand for high skilled workers relative to middle and low skilled workers. Building on (Card and Lemieux, 2001), we can assume that production of a single final good is CES and depends on high skilled labor HS t, non-high skill labor NHS 13 t, and the productivity of each of these two groups (θ HSt and θ NHSt, respectively). We can also assume that total high skilled and total non-high skilled labor are themselves CES aggregates of age-specific high skilled and non-high skilled labor. Thus, the production function can be written as follows: y t = (θ HSt HS ρ t + θ NHStNHS ρ t )1/ρ, where HS t = ( a (h ahs η at ))1/η, and NHS t = ( a (n anhs η at ))1/η. If we assume both types of workers are paid their marginal product, the log wage ratio between the two types of workers can be written as a function of the overall relative productivity ((θ HSt /θ NHSt )), the age-specific relative productivity (h a /nh a ), the age specific relative supply (HS at /NHS at ), the aggregate relative supply (HS t /NHS t ) and both the elasticity of substitution across age groups (σ a = 1 1/η) and the elasticity of substitution across skill groups (σ s = 1 1/ρ): ( ) ( ) ( ) ( ) ( ) ( ) [ ( ) ( )] whsat θhst ha 1 HSt 1 HSat HSt log = log + log log log log w NHSat θ NHSt nh a σ s NHS t σ a NHS at NHS t Provided data on relative wages and relative supplies of different skill groups we can obtain estimates for σ a 14, h a, nh a and construct estimates for HS t and NHS t. With these estimates in hand, and information on relative supplies, we can obtain the implied values for log (θ HSt /θ NHSt ) for different 13 In the polarization literature, non-high skill labor is itself composed of two different types of labor inputs: middle skill labor and low skill labor 14 Specifically, in a regression of the log wage ratio on time effects, age effects and age-specific relative supplies, log (θ HSt/θ NHSt) and [ (1/σ s) + (1/σ a)] log (HS t/nhs t) will be absorbed by the time effects, and log (h a/nh a) will be absorbed by the age effects. Thus, the coefficient on log (HS t/nhs t) will provide an estimate of 1/σ a 15
16 values of σ s. OLS and IV estimates In order to obtain consistent estimates of the elasticity of substitution across age groups and skill levels we need exogenous variation in the relative supplies of high skill workers and workers in other sets of occupations. I first report estimates that assume the relative employment in high skill and other occupations to be exogenously given. Since this very strong assumption is not likely to be tenable I supplement these estimates with estimates obtained by instrumenting a cohort-specific supply of workers in high skill occupations and other sets of occupations with cohort-specific educational attainment. This strategy is motivated by two facts. First, there is a strong relationship between a cohort s educational attainment and the share of workers belonging to that cohort employed in high skill occupations. Second, the educational attainment of a given cohort is approximately fixed after individuals in that cohort turn around 30 years old 15. If the average educational attainment of a given cohort does not increase as a consequence of increases in the wages of more highly educated individuals relative to less educated individuals, using educational attainment of a cohort as an instrument for the share of that cohort working in high skill occupations seems valid 16. Table III shows results from regressions of log wage differentials on time effects, age effects, and log relative supplies, for different groups of interest 17. In general, the results indicate relatively high elasticities of substitution across different age groups. When we compare college graduates to high school graduates, the implied elasticity of substitution is close to 10. A comparison of individuals with 15 This can be a consequence of large perceived opportunity costs associated with acquiring further education once an individual has entered the labor force and accumulated some experience 16 Katz and Murphy (1992) and numerous studies thereafter assume relative supplies of education to be fixed to study the evolution of the college to high-school wage gap 17 Age effects are not shown 16
17 more than 4 years of college with individuals with just high school implies an overall high degree of substitutability between young and old highly educated individuals. The higher degree of substitutability between young and old workers obtained when we compare highly educated high skill workers to non-high skill workers than that obtained when we compare college graduates in high skill education relative to non-high skill workers reveals that assuming the same elasticity of substitution across age groups for all types of work is a strong assumption rejected by the data. Maintaining the assumption that factors are paid their marginal product, we can use expressions for each factor s marginal product to obtain separate estimates of the elasticity of substitution for different skill groups 18 Table IV displays separate estimates of the elasticity of substitution across age groups for several skill groups. Columns four and six suggest that the elasticity of substitution across age groups is lower for High Skill Workers with College than it is for Graduate High Skill Workers. The relative supply of High Skill Workers to workers in other occupations can respond to changes in relative wages so the obtained estimates might be biased. Under the assumption that a cohort s relative supply of different groups of education is approximately constant along the life-cycle, we can instrument college high skill employment with the number of college graduates, post-college high skill employment with the number of post-college graduates and employment in other types of occupations with the stock of individuals with some college, high school graduates and high school dropouts. The estimates shown in Columns 5 and 7 follow this strategy. The estimates are similar to those obtained via OLS and confirm that the elasticity of substitution across age groups is about 5 for High Skill Workers with College and about 18 Allowing for skill-specific age-elasticities of substitution, the marginal product of high skill workers is given by: log (w HSat) = log (θ HSt) + log (h a) (1/σ s) log (HS t) (1/σ ah) [log (HS at) log (HS t)] A similar expression holds for non-high skill workers. The difference between the two can be expressed as log (w HSat) log (w NHSat) = d t + d a (1/σ ah) [log (HS at)] + (1/σ anh) [log (NHS at)] where the first two terms absorb time-specific and age-specific variables, respectively. 17
18 10 for Graduate High Skill Workers. The relatively high estimated elasticity of substitution across age groups for high skill workers with a graduate degree has an important implication: if the relative demand for skill does not decrease in the following years, the return to post-graduate education is likely to increase for all workers, as a consequence of the retirement from the labor force of the most educated cohorts. The return to college is likely to increase as well, especially for middle-age and older workers. Under the assumption of a linear Trend in Demand, Table V provides estimates of the Relative Demand for High Skill Workers, the elasticity of substitution across skill groups, and skill-specific estimates of the elasticity of substitution across age groups. 19 The estimates for the elasticities of substitution across age groups are in line with those of Table IV. Non-parametric estimate of the Relative Demand for Skill The previous estimates assume a linear trend for the relative demand for skill. This is a restrictive assumption. In principle, the relative demand for skill could have substantially increased up to 2000 and stagnated afterward. In order to obtain a flexible estimate of the implied trend for the relative demand for skill I can choose specific values for the elasticity of substitution across skill groups (σ s ) and, recover the implied trend for the relative demand for skill (log(θ HSt /θ NHSt ). Figure 7 shows the implied estimates for this trend when we compare college graduates in high skill occupations and postcollege graduates in high skill occupations, respectively. The figure shows that the implied relative demand for skill has continued increasing during the 2000s, although it has increased substantially more for individuals with more than 4 years of higher education. In the next section I discuss some implications of these results. 19 These estimates come from the following specification: log (w HSat/w NHSat) = log (θ HSt/θ NHSt) + log (h a/nh a) (1/σ s) [log (HS t/nhs t)] (1/σ ah) [log (HS at/hs t)] + (1/σ anh) [log (NHS at/nhs t)] 18
19 6 Implications 6.1 Education In previous sections I provided evidence that suggests that the slowdown in employment of individuals in high skill occupations has been a consequence of the slowdown in the rates of entry into this type of jobs characteristic of generations born since the late 1940s. I have also argued that the relative wage of younger individuals working in high skill occupations has increased partially in response to this slowdown. If the late baby boomers start exiting high skill employment in the next few years, the wage premium workers in high skill occupations command over workers in other occupations is likely to increase for both young and older workers. Since there is a strong relationship between This provides additional incentives for young individuals at the margin between continuing studying or not, to continue acquiring education. 6.2 Polarization An important hypothesis put forward in the literature on polarization (Acemoglu and Autor, 2010), (Autor and Dorn, 2013) argues that increases in employment and wages at both the high and the low end (but not the middle) of the wage distribution starting in 1980 is consistent with a special type of technological change that complements highly skilled workers, substitutes middle skilled workers whose jobs can be replaced with capital, and neither complements nor substitutes workers at the bottom of the skill distribution, who typically work in service occupations that require assisting others and are difficult to codify. Figure 8 reproduces a graph from Acemoglu and Autor (2010) for men that shows the , and change in the share of total employment corresponding to each of 326 occupations 19
20 in Occupations are ranked according to the mean wage for individuals in that occupation in Panel B shows these changes for men. As we can see, the contraction of middle skill employment is evident in all decades. However changes at the top and the bottom do not follow a consistent pattern: whereas employment in high skill occupations expands between 1980 and 2000, its share of total employment stops growing in the last decade. Conversely, low skill service occupations seem to only start expanding beginning in the 1990s. Given that high skill employment does not expand in the 2000s and that middle skill employment keeps contracting in the last decade, the share of total employment low skill occupations represent greatly expands in the last decade. The stagnation in both educational attainment and employment in high skill occupations documented in this paper offers a plausible explanation for this pattern. A more thorough analysis is needed to obtain conclusive evidence in this respect. 7 Concluding Comments In this paper I have provided evidence that suggests that an important determinant of the reversal in the growth of employment in high skill occupations since the year 2000 is a change in the composition of the US skill distribution. Using some standard structural assumptions I provide evidence that suggests that the return to higher education is likely to continue increasing as cohorts of highly skilled workers are exiting the labor force. Other industrialized countries have experienced demographic shifts similar to those of the United States. An immediate step for research is to extend the present analysis for these countries to better understand the links between demographic changes, educational attainment, and occupational structure. Since some of these countries have large longitudinal publicly available datasets, an immediate direction for future work is to follow individuals from different cohorts to better understand the entry and exit from high skill occupations of workers at different points in the 20
21 lifecycle. 21
22 References Acemoglu, Daron (2002), technical change, inequality, and the labor market. Journal of Economic Literature. Acemoglu, Daron and David Autor (2010), Skills, tasks and technologies: Implications for employment and earnings. NBER Working Papers 16082, National Bureau of Economic Research, Inc. Altonji, Joseph G., Prashant Bharadwaj, and Fabian Lange (2012), Changes in the characteristics of american youth: Implications for adult outcomes. Journal of Labor Economics, 30, Autor, David H. and David Dorn (2013), the growth of low-skill service jobs and the polarization of the us labor market. American Economic Review. Autor, David H., Lawrence F. Katz, and Melissa S. Kearney (2008), Trends in u.s. wage inequality: Revising the revisionists. The Review of Economics and Statistics, 90, Autor, Frank Levy, David and Richard Murnane (2003), the skill content of recent technological change: An empirical exploration. The Quarterly Journal of Economics,. Autor, Lawrence F. Katz, David H. and Melissa S. Kearney (2006), The polarization of the us labor market. The American Economic Review Papers and Proceedings. Card, David and Thomas Lemieux (2000), Dropout and enrollment trends in the post-war period: What went wrong in the 1970s? NBER Working Papers 7658, National Bureau of Economic Research, Inc. Card, David and Thomas Lemieux (2001), can falling supply explain the rising return to college for younger men? a cohort-based analysis. The Quarterly Journal of Economics. 22
23 Goos, Marten and Alan Manning (2007), lousy and lovely jobs: the rising polarization of work in britain. The Review of Economics and Statistics. Katz, Lawrence F. and Kevin Murphy (1992), changes in relative wages: Supply and demand factors. The Quarterly Journal of Economics. Meyer, Peter B. and Anastasiya M. Osborne (2005), Proposed category system for census occupations. Working Papers 383, U.S. Bureau of Labor Statistics. 23

24 Figure 1: Aggregate Employment in High Skill Occupations Panel A: Levels Panel B: Shares 24
25 Notes: The upper panel of the figure plots the number of individuals working in high skill occupations. The medium and lower panels plot, respectively, the share of individuals whose main job is at a high skill occupation, and the share of hours worked in high skill occupations. 25


26 Figure 2: Employment for different cohorts Panel A: Levels Panel B: Shares Notes: Panel A displays the estimated average number of workers employed in high skill occupations for cohorts born around 1930, 1940, 1950, 1960, 1970 and For example, cohorts born around 1930 include those born between 1928 and Panel B displays the estimated average proportion of workers employed in high skill occupations for these same representative cohorts. 26


27 Figure 3: Estimates from Decomposition: Shares Panel A: Age Profile Panel B: Cohort Effects Note: Decomposing a cohort s share of workers in high skill occupations into age, cohort, and time effects generates the displayed coefficients in panels A, B, and C, respectively. 27

28 Figure 4: Decomposition Counterfactual Shares Note: This figure displays the estimated share of workers in high skill occupations along with the counterfactual share of workers in high skill occupations if post WW2 cohorts had entered high skill occupations at increasing rates. 28

29 Figure 5: Exit from High Skill Employment Implied Exit Rates Note: This figure uses Census and ACS data to display the implied exit rates from high skill employment for older workers. 29
30 Figure 6: Educational Attainment, Men Note: This figure presents estimated cohort effects from a regression of the share of the population with a college degree (left panel) and more than 4 years of college (right panel) on age and birth cohort indicator variables. using CPS MORG data from 1973 to

31 Figure 7: Implied Relative Demand Note: This figure shows the implied nonparametric relative demand trend for workers in high skill occupations relative to workers in other sets occupations. Panel A focuses on workers with a college degree working in high skill occupations. Panel B focuses on post-college workers working in high skill occupations. 31

32 Figure 8: Polarization Polarization by Decade Men Note: This figure reproduces Figure 10 in (Acemoglu and Autor, 2010) for men. Using data from the Census and the ACS, it shows that employment growth in high skill occupations has been stagnant during the 2000s. 32
33 Table I Exit Rates from High Skill Occupations: Men (1) (2) (3) All College or More High School Graduates Implied *** * (0.0115) (0.0129) (0.0156) Implied *** (0.0115) (0.0129) (0.0156) Implied *** *** (0.0115) (0.0129) (0.0156) Observations R-squared Standard errors in parentheses *** p<0.01, ** p<0.05, * p<0.1 Note: Using Census data, this table shows average implied exit rates from high skill occupations for men. 33
34 Table II Wage Decompositions by Age and Year into Age, Time, and Cohort Effects (1) (2) (3) (4) (5) Wage differences Col-HSC Grad-HSC HSK-OthOcc HSKCol-OthOcc HSKGrad-OthOcc Year Effects *** *** 0.148*** 0.280*** 0.133*** (0.0105) (0.0123) (0.0121) (0.0160) (0.0160) *** 0.224*** 0.184*** 0.330*** 0.277*** (0.0105) (0.0123) (0.0121) (0.0160) (0.0160) *** 0.135*** 0.149*** 0.234*** 0.185*** (0.0108) (0.0127) (0.0125) (0.0166) (0.0165) *** 0.316*** 0.258*** 0.309*** 0.321*** (0.0117) (0.0138) (0.0136) (0.0179) (0.0179) *** 0.398*** 0.312*** 0.346*** 0.391*** (0.0134) (0.0158) (0.0155) (0.0205) (0.0205) *** 0.510*** 0.397*** 0.404*** 0.507*** Cohort Effects (0.0145) (0.0171) (0.0168) (0.0223) (0.0222) *** *** (0.0124) (0.0147) (0.0144) (0.0191) (0.0191) *** ** (0.0119) (0.0140) (0.0138) (0.0182) (0.0182) *** (0.0152) (0.0180) (0.0177) (0.0234) (0.0233) *** *** ** ** (0.0144) (0.0170) (0.0167) (0.0221) (0.0220) ** *** ** (0.0192) (0.0226) (0.0222) (0.0294) (0.0293) *** *** ** *** (0.0179) (0.0211) (0.0208) (0.0274) (0.0274) ** * * (0.0260) (0.0307) (0.0302) (0.0399) (0.0398) Observations Standard errors in parentheses *** p<0.01, ** p<0.05, * p<0.1 Notes: All columns display differences in log wages for males. Column 1 reports the difference between those with exactly 4 years of college and those with exactly high school. Column 2 reports the difference between those with more than 4 years of college and those with only high school. Column 3 shows the difference between those working in high 34
35 skill occupations and those in other occupations. Columns 4 shows the same difference for those with College and those with more than college. 35
36 Table III Relative Supplies and Elasticity of Substitution Across Age Groups (1) (2) (3) (4) (5) (6) Col/Hsc ColE/HscE Gr/Hsc Hsk/Oth HskC/Oth HskG/Oth *** ** 0.132*** ** 0.124*** (0.0181) (0.0184) (0.0180) (0.0113) (0.0229) (0.0180) *** *** ** *** (0.0252) (0.0203) (0.0199) (0.0128) (0.0260) (0.0204) *** 0.120*** 0.320*** *** * 0.246*** (0.0308) (0.0245) (0.0240) (0.0151) (0.0307) (0.0241) *** 0.181*** 0.411*** 0.106*** 0.128*** 0.334*** (0.0339) (0.0287) (0.0281) (0.0179) (0.0365) (0.0287) *** 0.238*** 0.540*** 0.195*** 0.204*** 0.466*** (0.0359) (0.0332) (0.0325) (0.0184) (0.0376) (0.0295) log(col/hsc) *** (0.0235) log(coleq/hsceq) * (0.0342) log(grad/hsc) (0.0335) log(hsk/oth) (0.0240) log(hskc/oth) *** (0.0490) log(hscg/oth) * (0.0384) Constant *** *** (0.0416) (0.0407) (0.0398) (0.0369) (0.0751) (0.0589) Observations Standard errors in parentheses *** p<0.01, ** p<0.05, * p<0.1 Notes: The first column of the Table compares college graduates with exactly four years of college to high school graduates. Column 2 compares individuals with more than 4 years of college to high school graduates. Column 3 compares college equivalents to high school equivalents 20. Column 4 compares individuals in high skill occupations to 20 The total number of college equivalents equals all individuals with 4 years of college plus individuals with more than 4 years of college weighted by their wage relative to college graduates plus a share of individuals with some college proportional to their wage relative to college graduates. The total number of high school equivalents is given by all high school graduates plus all high school dropouts weighted by their wage relative to high school graduates, plus a share of 36
37 individuals in other occupations. Column 5 compares individuals with 4 years of college degree in high skill occupations to individuals in other occupations. Finally, Column 6 compares individuals with more than 4 years of education to individuals in other occupations. individuals with some college proportional to their wage relative to high school graduates 37
38 Table IV Relative Supplies and Elasticity of Substitution Across Age Groups (1) (2) (3) (4) (5) (6) (7) Col-Hsc Grd-Hsc Hsk-Nhsk HskCol-Nhsk 2SLSHskCol-Nhsk HskGrd-Nhsk 2SLSHskGrd-Nhsk High School Supply 0.105*** *** (0.0288) (0.0145) College Supply *** (0.0309) Graduate Supply *** (0.0170) Non-High Skill Supply *** 0.209*** *** *** (0.0327) (0.0370) (0.0325) (0.0129) (0.0108) High Skill Supply (0.0358) Col High Skill Supply *** *** (0.0448) (0.0393) Grad High Skill Supply *** *** (0.0166) (0.0140) Observations Standard errors in parentheses *** p<0.01, ** p<0.05, * p<0.1 Notes: Column 1 shows the estimated effects of Log College Supply and Log High School Supply on College and High Scool Log Wages. These provide estimates of one over the elasticity of substitution across age groups for these two. Column 2 compares individuals with more than 4 years of college to high school graduates. Column 3 Compares High Skill Workers to Non-High Skill Workers. Column 4 compares Graduate High Skill Workers to Non-High Skill Workers. Column 5 shows 2SLS estimates for the model in Column 4. Log Supplies of High Skill College Graduates and Non-High Skill Workers are instrumented with Log Supplies of College Workers and Individuals with less than College. Column 6 compares Post-College High Skill Workers to Non-High Skill Workers. Column 7 shows 2SLS estimates for the model in Column 6. Log Supplies of High Skill Post-College Graduates and Non-High Skill Workers are instrumented with Log Supplies of Post-College Workers and Individuals with less than College. 38
39 Table V Implied Demand Trend (1) (2) (3) (4) (5) (6) (7) Col-Hsc Grd-Hsc Hsk-Nhsk HskCol-Nhsk HskCol-Nhsk HskGrd-Nhsk HskGrd-Nhsk Linear Trend *** *** *** *** *** *** *** ( ) ( ) ( ) ( ) ( ) ( ) ( ) Agg Rel Supply *** *** *** *** *** *** *** (0.104) (0.0681) (0.128) (0.0814) (0.0738) (0.0540) (0.0471) Rel Supply High Sch (0.0524) (0.0404) Rel Supply College * (0.0491) Rel Supply Grad ** (0.0252) Rel Supply Non-High Skill ** 0.184*** (0.0569) (0.0640) (0.0584) (0.0613) (0.0534) Rel Supply High Skill (0.0603) Rel Supply High Skill Col *** *** (0.0594) (0.0555) Rel Supply High Skill Grad ** *** (0.0352) (0.0306) Observations Standard errors in parentheses *** p<0.01, ** p<0.05, * p<0.1 Notes: See Notes to Table IV for Column Information. The Linear Trend is a measure of Relative Demand. In Column 1 Agg Rel Supply equals the log total number of College Graduates minus the log total number of high school graduates. Rel Supply College equals the log College Graduates in age group a minus the total number of College Graduates. Other variables are defined analogously. 39
40 Appendices Data Construction Employment I compute data on both the number and proportion of individuals employed and hours worked by these individuals. To achieve the latter I weight each individual observation by the number of hours that individual works each week times the number of weeks worked by the individual. Wages Wages are constructed as wage and salary income divided by usual hours of work times number of weeks worked. Usual hours of work is not available for the years 1960 and Instead hours worked last week is reported in intervals 1-14, 15-29, 30-34, 35-39, 40, 41-48, 49-59, 60+. Since both hours worked last week and usual hors worked are available for 1980 and 1990, I take the median number of usual hours worked for individuals belonging to each interval for both 1980 and I take the average of these two and input it as usual hours worked for individuals in 1960 and 1970 in each corresponding interval. The results for average number of hours worked for 1960 and 1970 are very similar to those for 1980, 1990, 2000 and The number of weeks worked is imputed analogously. Occupations The definition of occupations employed in the paper is based on the 1990 Census Bureau classification of occupations. A detailed discussion of this classification is provided in Meyer and Osborne (2005). High Skill Occupations are composed by Managerial, Professional and Technical Occupations. Examples of these occupations are Managers, Scientists, and Laboratory Technicians, respectively. Medium Skill Occupations include (i) Sales and Administrative Support Occupations such as Clerks and Sales Representatives, (ii) Precision Production, Craft and Repair Occupations, such as Mechanics and Repairers and (iii) Operators, Fabricators and Laborers. Low skill Occupations include Service Occupations. These include Private Household Occupations, Food Preparation, Cleaning, etc. High Skill Occupations typically require a higher degree of instruction and are thought to complement recent technological advances in computing power (Autor and Murnane, 2003). Medium Skill Occupations are assumed to be increasingly replaced by technological advances and/or offshored. Low Skill Occupations are typically assumed not to complement nor substitute technological progress and are less susceptible to be offshored. 40

41 Appendix Figure 1: Employment in High Skill Occupations, Men and Women Appendix Figure 2: Cohort Size 41

42 Appendix Figure 3: Cohort Profiles Levels 42
43 43
44 Shares 44
45 45
46 Appendix Figure 4: Exit from High Skill Occupations Panel A: Actual Rates Panel B: Actual Levels 46

47 Appendix Figure 5: Educational Attainment, Men and Women 47

48 Appendix Figure 6: Within Industry Cohort Effects Notes: This figure displays the cohort effects estimated when I exploit within-industry variation across different cohorts in the share entering high skill occupations. 48
Automation and Job Polarization: On the Decline of Middling Occupations in Europe
 Automation and Job Polarization: On the Decline of Middling Occupations in Europe Vahagn Jerbashian Universitat de Barcelona and CERGE-EI IBS Jobs Conference (December 6-7, 2017) Motivation In labor markets,
Ageing and the Skill Portfolio: Evidence from Job Based Skill Measures
 Ageing and the Skill Portfolio: Evidence from Job Based Skill Measures Audra Bowlus Hiroaki Mori Chris Robinson University of Western Ontario August 2015 An earlier version was presented at the Workshop
31E00700 Labor Economics: Lecture 7
 31E00700 Labor Economics: Lecture 7 20 Nov 2012 First Part of the Course: Outline 1 Supply of labor 2 Demand for labor 3 Labor market equilibrium 1 Perfectly competitive markets; immigration 2 Imperfectly
KIER DISCUSSION PAPER SERIES
 KIER DISCUSSION PAPER SERIES KYOTO INSTITUTE OF ECONOMIC RESEARCH Discussion Paper No.874 Job polarization and jobless recoveries in Japan: Evidence from 1984 to 2010 Yosuke Furukawa and Hiroki Toyoda
Trends in US Wage inequality: Revising the Revisionists
 Trends in US Wage inequality: Revising the Revisionists Authors: Autor, Katz and Kearney Presenter: Diego Daruich Review of Economics and Statistics (2008) Prepared for Sargent s Reading Group (NYU) March
Econ 792. Labor Economics. Lecture 6
 Econ 792 Labor Economics Lecture 6 1 "Although it is obvious that people acquire useful skills and knowledge, it is not obvious that these skills and knowledge are a form of capital, that this capital
Business Cycle Facts
 Sectoral Employment and Aggregate Labor Market Business Cycle Facts Carol Cui Abstract This paper studies the slow job market recovery in the U.S. after each post- 1990 recession from a sectoral perspective.
Layoffs and Lemons over the Business Cycle
 Layoffs and Lemons over the Business Cycle Emi Nakamura Harvard University May 9, 2007 Abstract This paper develops a simple model in which unemployment arises from a combination of selection and bad luck.
College-High School Wage and Human Capital Price Differentials, and the Role of Mobility for Local Wages in the U.S.
 Western University Scholarship@Western Electronic Thesis and Dissertation Repository May 2015 College-High School Wage and Human Capital Price Differentials, and the Role of Mobility for Local Wages in
Business Cycle Facts
 Sectoral Employment and Aggregate Labor Market Business Cycle Facts Carol Cui Abstract This paper studies the slow job market recovery in the U.S. after each post-1990 recession from a sectoral perspective.
The Polarization of the U.S. Labor Market
 MEASURING AND INTERPRETING TRENDS IN ECONOMIC INEQUALITY The Polarization of the U.S. Labor Market By DAVID H. AUTOR, LAWRENCE F. KATZ, AND MELISSA S. KEARNEY* Much research (surveyed in Katz and Autor,
NBER WORKING PAPER SERIES THE POLARIZATION OF THE U.S. LABOR MARKET. David H. Autor Lawrence F. Katz Melissa S. Kearney
 NBER WORKING PAPER SERIES THE POLARIZATION OF THE U.S. LABOR MARKET David H. Autor Lawrence F. Katz Melissa S. Kearney Working Paper 11986 http://www.nber.org/papers/w11986 NATIONAL BUREAU OF ECONOMIC
Centre for Human Capital and Productivity (CHCP) Working Paper Series
 Working Paper Series") Wages and Employment: The Canonical Model Revisited by Audra Bowlus, Eda Bozkurt and Lance Lochner Working Paper # 2017-9 June 2017 Centre for Human Capital and Productivity (CHCP) Working Paper Series
Wages and Employment: The Canonical Model Revisited by Audra Bowlus, Eda Bozkurt and Lance Lochner Working Paper # 2017-9 June 2017 Centre for Human Capital and Productivity (CHCP) Working Paper Series
The Role of STEM Occupations in the German Labor Market
 IAB-OECD Seminar: Rising Wage Inequality in Germany December 16/17, 2018 The Role of STEM Occupations in the German Labor Market Alexandra Spitz-Oener Humboldt-University Berlin and IAB, Nuremberg Based
Changes in the Thai Educational Wage Structure,
 Changes in the Thai Educational Wage Structure, 1987-2006 Dilaka Lathapipat Thailand Development Research Institute Australian National University, and Dhurakij Pundit University January 2010 Dilaka (TDRI,
Labour Supply and the Extensive Margin
 Labour Supply and the Extensive Margin By Richard Blundell, Antoine Bozio and Guy Laroque Forty years ago the Europeans (here French and British) used to work more than the Americans. They now work less.
Understanding the Supply and Demand Forces behind the Fall and Rise in the U.S. Skill Premium
 Understanding the Supply and Demand Forces behind the Fall and Rise in the U.S. Skill Premium Francisco Parro Universidad Adolfo Ibáñez October 2015 Abstract I develop an assignment model to quantify,
This Job is Getting Old: Measuring Changes in Job Opportunities using Occupational Age Structure
 This Job is Getting Old: Measuring Changes in Job Opportunities using Occupational Age Structure David Autor MIT Department of Economics and NBER David Dorn Boston University Department of Economics and
Field Exam January Labor Economics PLEASE WRITE YOUR ANSWERS FOR EACH PART IN A SEPARATE BOOK.
 University of California, Berkeley Department of Economics Field Exam January 2017 Labor Economics There are three parts of the exam. Please answer all three parts. You should plan to spend about one hour
The Micro and Macro of Job Polarization
 Matias Cortes (University of Manchester) Nir Jaimovich (Duke University) Christopher J. Nekarda (Federal Reserve Board) Henry E. Siu (University of British Columbia) IZA Workshop on the Future of Labor
Supply and Demand Factors in Understanding the Educational Earnings Differentials: West Germany and the United States
 The European Journal of Comparative Economics Vol. 8, n. 2, pp. 235-263 ISSN 1824-2979 Supply and Demand Factors in Understanding the Educational Earnings Differentials: Abstract Gulgun Bayaz Ozturk 1
Skills, Tasks and Technologies
 Skills, Tasks and Technologies Beyond the Canonical Model David Autor and Daron Acemoglu MIT and NBER Acemoglu-Autor (MIT and NBER) Skills, Tasks, Techs 1 / 49 Skills, Tasks and Technologies: Beyond the
The Computer Use Premium and Worker Unobserved Skills: An Empirical Analysis
 The Computer Use Premium and Worker Unobserved Skills: An Empirical Analysis Michael D. Steinberger * May, 2005 Abstract: On-the-job computer use is associated with a 10-15% wage premium for US workers.
Human Capital and Income Inequality: Some Facts and Some Puzzles
 Human Capital and Income Inequality: Some Facts and Some Puzzles Amparo Castelló and Rafael Doménech 28th Annual Congress of the European Economic Association Goteborg, August 2013 1/28 . Introduction
THE PENNSYLVANIA STATE UNIVERSITY SCHREYER HONORS COLLEGE DEPARTMENT OF ECONOMICS THE EFFECTS OF HUMAN CAPITAL ACCUMULATION ON INCOME INEQUALITY
 THE PENNSYLVANIA STATE UNIVERSITY SCHREYER HONORS COLLEGE DEPARTMENT OF ECONOMICS THE EFFECTS OF HUMAN CAPITAL ACCUMULATION ON INCOME INEQUALITY DEVON C. CARTER SPRING 2015 A thesis submitted in partial
Autor and Dorn (2013)
") Autor and Dorn (2013) Abstract: We offer a unified analysis of the growth of low-skill service occupations between 1980 and 2005 and the concurrent polarization of US employment and wages. We hypothesize
Autor and Dorn (2013) Abstract: We offer a unified analysis of the growth of low-skill service occupations between 1980 and 2005 and the concurrent polarization of US employment and wages. We hypothesize
Skill-Biased Technical Change and Labor Market Polarization: The Role of Skill Heterogeneity Within Occupations
 Skill-Biased Technical Change and Labor Market Polarization: The Role of Skill Heterogeneity Within Occupations Orhun Sevinc London School of Economics and Central Bank of Turkey o.sevinc@lse.ac.uk This
DEPARTMENT OF ECONOMICS COLLEGE OF BUSINESS AND ECONOMICS UNIVERSITY OF CANTERBURY CHRISTCHURCH, NEW ZEALAND
 DEPARTMENT OF ECONOMICS COLLEGE OF BUSINESS AND ECONOMICS UNIVERSITY OF CANTERBURY CHRISTCHURCH, NEW ZEALAND Is the Growing Skill Premium a Purely Metropolitan Issue? by Chul Chung 1, Jeremy Clark 2, and
A Robustness Analysis of the Estimated Trends in the Relative Supply of College Equivalents
 A Robustness Analysis of the Estimated Trends in the Relative Supply of College Equivalents Zeynep Elitas Middle East Technical University Hakan Ercan Middle East Technical University Semih Tumen Central
The Polarization of Employment: Explanations and Implications
 The Polarization of Employment: Explanations and Implications Georg Graetz Department of Economics at Uppsala University LINK Research Lab, U Texas Arlington, March 23 2016 focus on job polarization Introduction
SKILL BIASED ENTREPRENEURIAL DECLINE
 SKILL BIASED ENTREPRENEURIAL DECLINE Helu Jiang Faisal Sohail First Version: February 2017 This Version: February 2019 Click here for Latest Version Abstract The U.S. is undergoing a long-term decline
LECTURE 11 Inequality. April 8, 2015
 Economics 210A Spring 2015 Christina Romer David Romer LECTURE 11 Inequality April 8, 2015 I. OVERVIEW Top 10% Pre-tax Income Share in the US, 1917-2013 50% Top 10% Income Share 45% 40% 35% 30% 25% 1917
THE QUANTITY AND PRICING OF HUMAN CAPITAL IN CANADA AND THE UNITED STATES
 Preliminary and Incomplete: Please do not quote THE QUANTITY AND PRICING OF HUMAN CAPITAL IN CANADA AND THE UNITED STATES Audra Bowlus*, Haoming Liu** and Chris Robinson* *University of Western Ontario
The evolution of the gender pay gap in Australia: Do young women now have the advantage?
 The evolution of the gender pay gap in Australia: Do young women now have the advantage? Rebecca Cassells, Anne Daly & Alan Duncan Presentation to the Australian Gender Economics Workshop Fremantle, 8-9
Disappearing Routine Jobs: Who, How, and Why?
 Disappearing Routine Jobs: Who, How, and Why? Guido Matias Cortes University of Manchester and RCEA matias.cortes@manchester.ac.uk Nir Jaimovich University of Southern California, Marshall Business School
Determinants of the Gender Gap in the Proportion of Managers among White-Collar Regular Workers in Japan
 Determinants of the Gender Gap in the Proportion of Managers among White-Collar Regular Workers in Japan Kazuo Yamaguchi University of Chicago This article analyzes the determinants of gender differences
Disappearing Routine Jobs: Who, How, and Why?
 Disappearing Routine Jobs: Who, How, and Why? Guido Matias Cortes University of Manchester and RCEA matias.cortes@manchester.ac.uk Nir Jaimovich University of Southern California, Marshall Business School
Internet Appendix to Technological Change, Job Tasks, and CEO Pay
 Internet Appendix to Technological Change, Job Tasks, and CEO Pay I. Theoretical Model In this paper, I define skill-biased technological change as the technological shock that began in the 1970s with
Estimating Earnings Equations and Women Case Evidence
 Estimating Earnings Equations and Women Case Evidence Spring 2010 Rosburg (ISU) Estimating Earnings Equations and Women Case Evidence Spring 2010 1 / 40 Earnings Equations We have discussed (and will discuss
Automation and Job Polarization: On the Decline of Middling Occupations in Europe
 Automation and Job Polarization: On the Decline of Middling Occupations in Europe Vahagn Jerbashian Abstract Using data from 10 Western European countries, I provide evidence that the fall in prices of
CIBC Working Paper Series
 Human Capital, Productivity and Growth by Audra Bowlus, Haoming Liu and Chris Robinson Working Paper # 2005-2 September 2005 CIBC Working Paper Series Department of Economics Social Science Centre The
LOUSY AND LOVELY JOBS: THE RISING POLARIZATION OF WORK IN BRITAIN * Maarten Goos and Alan Manning
 LOUSY AND LOVELY JOBS: THE RISING POLARIZATION OF WORK IN BRITAIN * Maarten Goos and Alan Manning Centre for Economic Performance London School of Economics Houghton Street London WC2A 2AE January 2004
RETAIL TRADE Workforce Demographics
 RETAIL TRADE Workforce Demographics Maryland Department of Labor, Licensing and Regulation Division of Workforce Development Office of Workforce Information and Performance 1100 N. Eutaw Street, Room 316
Unequal Effects of Trade on Workers with Different Abilities
 Unequal Effects of Trade on Workers with Different Abilities Elhanan Helpman Harvard University and CIFAR Oleg Itskhoki Princeton University Stephen Redding London School of Economics August 1, 2009 Abstract
Performance Pay, Competitiveness, and the Gender Wage Gap: Evidence from the United States
 DISCUSSION PAPER SERIES IZA DP No. 8563 Performance Pay, Competitiveness, and the Gender Wage Gap: Evidence from the United States Andrew McGee Peter McGee Jessica Pan October 2014 Forschungsinstitut zur
Skills, Tasks and Technologies
 Skills, Tasks and Technologies Beyond the Canonical Model Daron Acemoglu and David Autor (Handbook of Labor Economics, 2011) James J. Heckman University of Chicago AEA Continuing Education Program ASSA
The long-lasting effect of technological change on the careers of young workers: Evidence from changes of mandatory training regulations
 The long-lasting effect of technological change on the careers of young workers: Evidence from changes of mandatory training regulations Simon Janssen (IAB Nürnberg, IZA) Jens Mohrenweiser (ZEW, Mannheim)
Technological Change and Wage Premium in a Small Open Economy: An Inter-Industry Analysis
 Technological Change and Wage Premium in a Small Open Economy: An Inter-Industry Analysis Kang-Shik Choi Department of Economics, Yonsei University, Seoul 120-749, Korea kschoi1@yonsei.ac.kr Jinook Jeong
The Price of Experience
 The Price of Experience Hyeok Jeong KDI School of Public Policy Yong Kim Yonsei University Iourii Manovskii University of Pennsylvania Abstract We assess the role of of the evolution of of supply, driven
Skill-Biased Innovation Activities: Evidence from Hungarian Firms
 1/53 Skill-Biased Innovation Activities: Evidence from Hungarian Firms Attila Lindner 1 Balázs Muraközy 2 Balázs Reizer 3 1 UCL and MTA-KRTK 2 MTA-KRTK 3 MTA-KRTK 28 November 2018, University College London
Automation and Job Polarization: On the Decline of Middling Occupations in Europe
 Automation and Job Polarization: On the Decline of Middling Occupations in Europe Vahagn Jerbashian Abstract Using data from 10 Western European countries, I provide evidence that the fall in prices of
December Abstract
 PULLED AWAY OR PUSHED OUT? EXPLAINING THE DECLINE OF TEACHER APTITUDE IN THE UNITED STATES CAROLINE M. HOXBY AND ANDREW LEIGH* December 2003 Abstract There are two main hypotheses for the decline in the
Essays on the Economics of Wage Inequality
 Essays on the Economics of Wage Inequality The Harvard community has made this article openly available. Please share how this access benefits you. Your story matters Citation Tomb, Ian Alan. 2014. Essays
David Autor MIT and NBER Federal Reserve Bank of Chicago Strategies for Improving Economic Mobility of Workers November 15 16, 2007
 Past Trends and Projections in Wage, Work and Occupations in the United States David Autor MIT and NBER Federal Reserve Bank of Chicago Strategies for Improving Economic Mobility of Workers November 15
Albert Rees Lecture, April Thomas Lemieux University of British Columbia
 Albert Rees Lecture, April 30 2011 Thomas Lemieux University of British Columbia Thou shalt not include occupation dummies in a wage regression. But occupations are important and it works. Important t
Employer Discrimination and Market Structure
 Employer Discrimination and Market Structure Josh Ederington Jenny Minier Jeremy Sandford Kenneth R. Troske August 29 Abstract We extend Gary Becker s theory, that competitive forces will drive discriminating
What Economics Can Teach Us About Inequality and Social Policy. Lawrence F. Katz, Harvard University October 11, 2013
 What Economics Can Teach Us About Inequality and Social Policy Lawrence F. Katz, Harvard University October 11, 2013 Three Major Recent Contributions of Economics 1. Supply-Demand-Institutions Framework
Occupational Projections Methods
 Occupational Projections Methods Michael Wolf U.S. Bureau of Labor Statistics (BLS) Employment Projections Program 28 March, 2017 1 U.S. BUREAU OF LABOR STATISTICS bls.gov Overview BLS Projections Background
LABOR MARKET POLARIZATION
 LABOR MARKET POLARIZATION ECONOMIC SUMMIT THE CHALLENGE: KEEPING UP JUNE 17, 2014 Melissa LoPalo and Pia Orrenius The opinions expressed are solely those of the presenter and do not reflect the opinions
Discussion Paper Series
 Discussion Paper Series IZA DP No. 10718 Skill Premium, Labor Supply and Changes in the Structure of Wages in Latin America Manuel Fernández Julián Messina april 2017 Discussion Paper Series IZA DP No.
Job Market Signaling and Returns to Education
 Job Market Signaling and Returns to Education Suqin Ge ans aller Revised: July 2017 Abstract We compare two partially separating equilibria in a job market signaling model with unproductive education.
Industrial and Occupational Employment Changes During the Great Recession
 Industrial and Occupational Employment Changes During the Great Recession Sangmin Aum, Sang Yoon (Tim) Lee, and Yongseok Shin The U.S. labor market contracted sharply during the Great Recession. The ensuing
The Instability of Unskilled Earnings
 XII. LABOR ECONOMICS/LABOR MARKETS AND HUMAN RESOURCES REFEREED PAPERS The Instability of Unskilled Earnings Michael Mamo Westminster College Wei-Chiao Huang Western Michigan University Abstract The year-to-year
Job Satisfaction and the Gender Composition of Jobs
 Job Satisfaction and the Gender Composition of Jobs Emiko Usui Abstract Using job satisfaction data from the National Longitudinal Survey of Youth, I examine whether people who move to predominantly male
The Gender Pay Gap In International Perspective
 The Gender Pay Gap In International Perspective Francine D. Blau Introduction espite considerable progress in narrowing the gender pay gap in recent years, substantial differences in pay between men and
The Micro and Macro of Disappearing Routine Jobs: A Flows Approach
 The Micro and Macro of Disappearing Routine Jobs: A Flows Approach Guido Matias Cortes University of Manchester and RCEA matias.cortes@manchester.ac.uk Nir Jaimovich Duke University and NBER nj41@duke.edu
Understanding the Supply and Demand Forces behind the Fall and Rise in the U.S. Skill Premium
 Understanding the Supply and Demand Forces behind the Fall and Rise in the U.S. Skill Premium Francisco Parro Universidad Adolfo Ibáñez December 2016 Abstract I develop an assignment model to quantify,
Beyond Signaling and Human Capital: Education and the Revelation of Ability
 Beyond Signaling and Human Capital: Education and the Revelation of Ability Peter Arcidiacono Patrick Bayer Aurel Hizmo Duke University Duke University Duke University January 12, 2010 Abstract In traditional
In the UK today, the richest tenth
 Over the last 3 years, inequality has risen as new technologies have massively increased the demand for highly skilled workers. But as research by Guy Michaels and colleagues shows, it is not simply a
THE DYNAMICS OF SKILL MISMATCHES IN THE DUTCH LABOR MARKET
 THE DYNAMICS OF SKILL MISMATCHES IN THE DUTCH LABOR MARKET Wim Groot* Department of Health Sciences, Maastricht University and "Scholar" Research Centre for Education and Labor Market Department of Economics,
Skill Requirements, Search Frictions and Wage Inequality
 Skill Requirements, Search Frictions and Wage Inequality Lawrence Uren University of Melbourne Gabor Virag University of Rochester January 15, 2008 Abstract This paper examines wage inequality in the context
Education, Ability and Earnings, 1980s vs. 2000s
 Education, Ability and Earnings, 1980s vs. 2000s Gonzalo Castex and Evgenia Dechter y February 2011 Abstract This study examines changes in returns to formal education and cognitive ability over time using
NBER WORKING PAPERS SERIES HUMAN CAPITAL, TECHNOLOGY, AND THE WAGE STRUCTURE: WHAT DO TIME SERIES SHOW? Jacob Mincer. Working Paper No.
 NBER WORKING PAPERS SERIES HUMAN CAPITAL, TECHNOLOGY, AND THE WAGE STRUCTURE: WHAT DO TIME SERIES SHOW? Jacob Mincer Working Paper No. 3581 NATIONAL BUREAU OF ECONOMIC RESEARCH 1050 Massachusetts Avenue
The Return to Cognitive Skills in the Australian Labour Market
 The Return to Cognitive Skills in the Australian Labour Market Garry Barrett UNSW April 2010 Garry Barrett (UNSW) Return to Cognitive Skills April 2010 1 / 27 Motivation Returns to Education and Cognitive
A Study of the Long-run Substitutability Between Men and Women
 A Study of the Long-run Substitutability Between Men and Women Pallab K. Ghosh Department of Economics University of Oklahoma April, 2018 Abstract Using a variable elasticity of substitution (VES) framework,
Extended Abstract: Inequality and trade in services in the UK
 Extended Abstract: Inequality and trade in services in the UK Martina Magli July, 2017 The present study investigates the role of rise in services offshoring on UK local wages inequality for the period
The Skill-Specific Impact of Past and Projected Occupational Decline
 The Skill-Specific Impact of Past and Projected Occupational Decline Lena Hensvik (IFAU, UCLS) Oskar Nordstrom Skans (UU, UCLS) OECD ELS Seminar October 10, 2018 Motivation How do current and future technological
Measurement of Working Experience and Education Level in Earning Models Among African-American and Whites
 Clemson University TigerPrints All Theses Theses 12-2013 Measurement of Working Experience and Education Level in Earning Models Among African-American and Whites Zhuang Zheqi Clemson University Follow
A number of studies have documented lower levels of schooling or formal education in
 1. Introduction A number of studies have documented lower levels of schooling or formal education in developing countries among females relative to males (see for example, Dollar and Gatti 1999; Duflo
Chapter 12 Gender, Race, and Ethnicity in the Labor Market
 Chapter 12 Gender, Race, and Ethnicity in the Labor Market Summary The discussion in Chapter 11 of the complex relationship between pay and productivity drew on a wide array of material from Chapters 5,
Where Have the Middle-Wage Workers Gone? A Study of Polarization Using Panel Data
 Where Have the Middle-Wage Workers Gone? A Study of Polarization Using Panel Data Guido Matias Cortes University of British Columbia November 12, 2011 JOB MARKET PAPER Abstract Using a general equilibrium
Introduction [to How New Is the "New Employment Contract"?]
![Introduction [to How New Is the New Employment Contract?]](/thumbs/89/99576826.jpg "Introduction [to How New Is the New Employment Contract?]") Upjohn Press Book Chapters Upjohn Research home page 2002 Introduction [to How New Is the "New Employment Contract"?] David I. Levine University of California, Berkeley Dale Belman Michigan State University
Upjohn Press Book Chapters Upjohn Research home page 2002 Introduction [to How New Is the "New Employment Contract"?] David I. Levine University of California, Berkeley Dale Belman Michigan State University
Changes in relative wages in Japan: The role of supply and demand. Ciro Baldi
 Baldi 1 Changes in relative wages in Japan: 1984-2003. The role of supply and demand Ciro Baldi Japan Institute of Labour Policy and Training - Visiting Researcher Draft March 27, 2006 Comments and feedbacks
The Structure of Wages and Internal Mobility
 NEW DATA AND NEW QUESTIONS IN PERSONNEL ECONOMICS The Structure of Wages and Internal Mobility By EDWARD P. LAZEAR AND PAUL OYER* As the fields of personnel economics and organizational economics have
Modeling Automation. February 4, Abstract
 Modeling Automation Daron Acemoglu Pascual Restrepo February 4, 2018 Abstract This paper points out that modeling automation as factor-augmenting technological change has several unappealing implications.
Demographic Change, Human Capital, and Economic Growth. in the Republic of Korea 1
 Demographic Change, Human Capital, and Economic Growth in the Republic of Korea 1 Jong-Suk Han 2 and Jong-Wha Lee 3 February 2019 Abstract In this study, we construct a measure of human capital for the
Career Risk and Market Discipline in Asset Management
 Career Risk and Market Discipline in Asset Management Andrew Ellul, Marco Pagano and Annalisa Scognamiglio University of Naples Federico II and CSEF Global Corporate Governance Colloquia 1 June 2018 1
Endogenous Skill Bias in Technology Adoption: City-Level Evidence from the IT Revolution
 Endogenous Skill Bias in Technology Adoption: City-Level Evidence from the IT Revolution Paul Beaudry Mark Doms Ethan Lewis University of British Federal Reserve Bank Dartmouth College Columbia and NBER
Commentary: Causes of Changing Earnings Inequality
 Commentary: Causes of Changing Earnings Inequality Robert Z. Lawrence In the first half of this stimulating paper, Dennis Snower gives us a review of the existing academic literature on inequality. His
LABLAC LABOR DATABASE FOR LATIN AMERICA AND THE CARIBBEAN
 This version: March, 2018 A GUIDE TO LABLAC LABOR DATABASE FOR LATIN AMERICA AND THE CARIBBEAN CEDLAS * and The World Bank ** * Centro de Estudios Distributivos, Laborales y Sociales at Universidad Nacional
Spring 2012 Lecture 1 The Theory of Skill Premia
 14.662-Spring 2012 Lecture 1 The Theory of Skill Premia David Autor, MIT and NBER February 2012 1 1 Part I: Laying out facts and clearing empirical underbrush It is useful to start with some key facts
Skill Premium, Labor Supply and Changes in the Structure of Wages in Latin America
 IDB WORKING PAPER SERIES Nº IDB-WP-786 Skill Premium, Labor Supply and Changes in the Structure of Wages in Latin America Manuel Fernández Julián Messina Inter-American Development Bank Department of Research
Digital Technology Adoption and Jobs
 Policy Research Working Paper 8326 WPS8326 Digital Technology Adoption and Jobs A Model of Firm Heterogeneity Irene Brambilla Public Disclosure Authorized Public Disclosure Authorized Public Disclosure
Appendix (Additional Materials for Electronic Media of the Journal) I. Variable Definition, Means and Standard Deviations
 I. Variable Definition, Means and Standard Deviations") 1 Appendix (Additional Materials for Electronic Media of the Journal) I. Variable Definition, Means and Standard Deviations Table A1 provides the definition of variables, and the means and standard deviations
1 Appendix (Additional Materials for Electronic Media of the Journal) I. Variable Definition, Means and Standard Deviations Table A1 provides the definition of variables, and the means and standard deviations
Applied Microeconometrics I
 Applied Microeconometrics I Lecture 5: Identification based on observables (continued) Tuomas Pekkarinen Aalto University September 25, 2018 Lecture Slides 1/ 31 Applied Microeconometrics I Reminder: Interpreting
Interindustry Wage Differentials, Technology. Adoption, and Job Polarization
 Interindustry Wage Differentials, Technology Adoption, and Myungkyu Shim Hee-Seung Yang Abstract Using the U.S. Census and EU KLEMS data, we find that the progress of job polarization between 1980 and
Lousy and Lovely Jobs: the Rising Polarization of Work in Britain. Maarten Goos and Alan Manning
 Lousy and Lovely Jobs: the Rising Polarization of Work in Britain Maarten Goos and Alan Manning December 2003 Abstract This paper argues that skill-biased technical change has some deficiencies as a hypothesis
Earning Functions and Rates of Return
 Earning Functions and Rates of Return by James J. Heckman, Lance J. Lochner and Petra Todd Camilla Borgna - Phd student in Political Studies Course in Economics of Education 2010-11 What do we mean by
Labor Market Polarization in Japan Changes in Tasks and the Impact of the Introduction of IT
 Labor Market Polarization in Japan Changes in Tasks and the Impact of the Introduction of IT Toshie Ikenaga Institute of Economic Research Hitotsubashi University tikenaga@ier.hit-u.ac.p April 2009 Abstract
Increased Wage Inequality
 Increased Wage Inequality 1. Introduction: Basic Facts on Quantities and Wages 2. Possible Explanations 3. Quantity decomposition Katz and Murphy 4. Quantity/Wage decomposition Bound and Johnson 1. Motivation: