Draft Never Published. Modal Shares in Transport: Significance for the Development of India
|
|
|
- Domenic French
- 6 years ago
- Views:
Transcription
1 Draft Never Published Modal Shares in Transport: Significance for the Development of India Louis S. Thompson 1 Railways Adviser The World Bank Jitendra Sondhi Management Consultant Authors note -- Writing for an Indian audience is always a challenge. Experts who work in India quickly learn two things: that Indian audiences can be among the world s most knowledgeable and intellectually demanding; and, that Indian audiences can also be among the proudest of (and the most sensitive to apparent criticism about) the manifest accomplishments of India s railways. The dilemma is how to say challenging things in a way that is perceived as constructive. This article should be seen in this context enormous respect for what has been accomplished coupled with a belief that the Indian Railways (IR) of tomorrow will not look like the IR of yesterday or even the IR of today. The path to the future is always paved with earnest argument and, sometimes, honest differences of opinion. Freight Transport Freight transport the ability to move goods from producer to consumer is an increasingly important aspect of modern economic development. The globalized economy has made efficiency in freight transport even more important: countries that pay too much for transport, or have transport of poor quality, are at a costly disadvantage. Passenger transport the freedom of individuals to find and travel to employment, the opportunity to visit family and friends, movement of tourists, and the vital human interactions needed to support trade in goods and services is also one of the critical underpinnings of all open societies. Economies do not function well without good transport. Transport is, however, rarely consumed for its own sake. For the most part, passengers travel to get somewhere and back, and not for the journey alone: instances of freight joy riding are almost too rare to identify. 2 Thus, transport is, in economic terms, a derived demand: that is, demand for transport is defined by the demand for the underlying goods or human movement needs that it serves. As a result, transport plays a significant role in what can and does happen elsewhere in the economy. If an electric power plant wishes to buy coal and has a choice between two 1 Opinions in this article are those of the authors alone, and should not be attributed to the World Bank, its Directors or its member. 2 Certain liquors Genever Gin in the Netherlands, are sent on long sea voyages to promote aging.
2 2 mines of equal quality and mine head cost, it is unlikely to buy from the mine 1000 Km away if there is a mine 150 Km from the plant. Individuals can readily commute 5 Km each way to work (they can even walk this distance if they are energetic), but almost never commute farther than 200 Km each way, unless they have free transport. Issues in transport are made more complex by the number of choices available to shippers or travelers. A shipper of goods can choose human power (head loading, freight cycles or bicycles), animal power, small goods vehicles, large trucks, rail, barges, river ships, intra-coastal ships, deep sea ships, pipeline, or air. In some cases, a shipper will have competitive offers from two, three or even more different modal possibilities. Similarly, passengers can walk, cycle, use an automobile, bus, train, boat, ship, or airplane and, in many cases, the passenger can choose among modes for the same trip. The Basis for Modal Choice So freight and passenger modal choices must be made, on the basis of the relative cost, trip time and quality of the transport offered. In cases where only one mode is available or all choices are too expensive, the choice is to use transport or not ship at all (or stay at home). Where there are several modal choices available, the issue of modal choice, and how it might be influenced arises. Early demand modelers tended to view the cost/time/quality tradeoffs as being fairly simple. Later experience has expanded the definition of these terms so that cost now includes not just the line haul tariff or fare, but also local pick up and delivery, insurance (affected by quality), and inventory impacts of different minimum shipment sizes, among many others. Trip time includes not only line haul travel time once started, but also departure frequency and reliability of departure and arrival. Quality includes not only comfort, but also safety, lack of damage to cargo, information en route as to arrival times, en route services such as reliable refrigeration, and many others. The rapid emergence of just-in-time logistics has emphasized the complexity of the modal choice calculation, and has shown how important it can be to understand all of the factors acting on freight shipment decisions. The importance of the airline practice of yield management makes the same point: passengers on the same airplane may be paying many different prices for legitimate reasons depending on their travel demand characteristics (the tourist who bought a non-refundable ticket 6 months in advance pays a lot less than the day-trip business person). In fact, the economic efficiency of transport is significantly promoted when customer and transporter (freight or passenger) can interact flexibility across the full range of cost and performance options, and when government policies do not distort the choices they make. Market economists argue that transport choices are made relatively effectively. Shippers or passengers tend to know the cost/performance choices available to them and (within the normal limits of information and rationality) choose what best meets their needs. Taken together, these choices define the modal shares that each mode enjoys. There is also a clear recognition of the economic importance of modal choice: when Government policies distort modal choices (through unbalanced regulation or biased promotional
3 3 spending on a particular mode without adequate user charges to compensate), the entire economy can pay a very high price. External Costs There is, however, a clear exception to this principle when there are aspects of cost or performance that the system user does not perceive or pay for or, when the transport mode does not pay for the costs of the transport infrastructure or capacity it consumes. These are in fact important exceptions. External costs (costs that are not perceived by the provider or user) such as pollution, noise, safety, and congestion are often not seen as costs and thus do not affect modal choice the way they would if the user had to pay. In some countries, heavy trucks do not pay their full share of the cost of building and maintaining highways: the resulting public subsidies are distorting modal choice. Much the same can be said of rail passengers traveling for free or at severely reduced fares without adequate and direct public compensation to the carrier. Measuring Market Share Discussions of modal choice often are confused by conflicting definitions of how modal output actually should be measured. Two approaches are often used passengers handled (or tons 3 lifted) versus passenger-km (or ton-km moved). The first measures the quantity of goods or passengers handled, the other measures the quantity of transport produced. Another definition revenue generated from transport (or expenditure on transport in the case of private carriage) -- measures in effect the value of the transport services rendered. Each can have a valid purpose, but they can yield very different pictures of the role of each mode. Moreover, as discussed below, modal choices and shares can vary significantly from country to country depending on income levels, geography, commodities produced, etc. Much more important, modal shares are dynamic they change, sometimes rapidly and significantly, in response to underlying changes in the costs and performance of the modes of transport. [Figure 1] shows the three market share measures as applied in the U.S. (where the full data are available). Rail s share of the market in tons originated is 25.8 percent, in tonkm 37.1 percent; but, in revenue, the rail share is only 9.4 percent. Corresponding shares for intercity trucks are 38.6 percent of tons, 27.7 percent of ton-km, but 75.6 percent of revenues. Put another way, trucks carry about 75 percent as many ton-km as rail, but they generate over eight times as much transport revenue! A very different perspective, indeed! [Figure 2] displays the changes in modal share in freight, and [Figure 3] displays the changes in modal share in passenger transport for a number of countries over time. These Figures are based on ton-km or passenger-km, which are the most familiar measures -- but the reader is cautioned to keep in mind that other measures might yield a different 3 Throughout this note, only metric measures will be used. Thus, tons are 1000Kg (2204 pounds). Numbers published from U.S. sources are usually given in short tons (2000 pounds) and short ton-miles (0.621 miles per Km).
4 4 perspective. Evidently, market share can change greatly in response to underlying changes in capacity, cost and performance of the various modes. There are two important points: 1) market share, especially for freight, is a dynamic, not a static concept; 2) put a different way, if market shares can change, then they can probably be influenced by a number of factors, including public policy. Detailed discussions of the determinants of modal shares rapidly become impossibly complex for a short paper. It is necessary to separate the discussion of freight from passenger, and it is necessary to simplify the discussion considerably. Freight Modal Choices and Competition Freight modes will normally consist of trucks, rail, water (rivers, intra-coastal and international), and pipelines. Generally speaking, where pipelines exist, they are a superior competitor and take all of the liquid traffic for which they are designed. Much the same can be said for water transport: it tends to take most of the low cost, bulk traffic for which it is intended to compete. Air transport carries primarily extremely high value, small sized shipments and is not a significant competitor (in ton-km terms) with either rail or truck. For these reasons, this paper will exclude air, pipelines and water from the competitive discussion and focus primarily on rail and truck Freight Tariff Structures In any particular economy and for a given, desired commodity flow, the competitive interface between freight modes is determined fundamentally by the tariff structure the shipper faces and the performance of the competing modes. Tariff structure means the freight pricing system as related to its general level as well as the size of shipment, the commodity and the length of haul. Performance means the relative speed of the mode in combination with the length of haul, cargo loss and damage experience, and reliability of service, along with a number of much more complex factors. In market competitive conditions, especially when the role of the Government or of Government-owned enterprises as shippers begins to diminish, the railway s competitive position, and its market share will depend critically on its ability to relate effectively to each shipper s needs. Freight tariff systems are highly detailed, sometimes filling long books, but it is possible to make some general comparisons of the flexibility of the system to accommodate the demand elasticities of particular commodities and of the general level of tariffs. [Figure 4] shows the cumulative percentage of ton-km that are carried at various ratios of the specific commodity group tariff to the average tariff for all commodities. For example, approximately 38 percent of U.S. Class I ton-km are carried at tariffs that are only 57 percent of the average tariff. By contrast, only about 15 percent of the Indian Railways ton-km are carried on tariffs that are 57 percent or less than the average. This Figure shows that the rail freight pricing system of the U.S. railroads is far more flexible in adapting to needs of particular shippers and to the competitive forces in
5 5 particular markets. It charges less when it needs to do so, and thus generates significant traffic at lower ratios, but also charges more when it can in order to generate maximum net contribution (revenue minus marginal cost) when competitive conditions permit. This is an illustration of the so called Ramsey pricing : price deviations from marginal cost are in inverse relation to the elasticity of demand for shipment of the commodity in question. The comparison with China is interesting. In general, it is fair to say that the Chinese freight pricing system is a remnant of central planning, when all prices were determined without relationship to demand (or cost) factors and when shippers, being also subject to the Plan, were neither price nor performance sensitive. Two curves are shown for China. The blue curve shows the book tariff structure the tariffs that would be charged if the book tariffs were the only consideration. In addition, though, China adds a flat surcharge per ton-km to all tariffs in order to finance construction of new lines. The construction surcharge per ton-km is about 70 percent of the average freight tariff per ton-km so imposition of the surcharge has the effect of significantly reducing the range of actual variation that the shipper sees, assuming that the shipper simply adds the basic tariff and the surcharge and considers this the total cost (a reasonable presumption). The net effect is that the tariff structure the shipper in China sees is the green curve which is nearly vertical highly insensitive to commodity considerations and thus not very effective at promoting the market share of China s railways and not effective at generating the maximum contribution for the railway from the assets and capacity available. 4 The IR tariff structure (the black curve) falls between the Chinese and the U.S. tariff structures. To some extent, this reflects the history of IR as a major part of the planned economy in India, though with somewhat more pricing flexibility than China. Arguably, the narrower (than the U.S.) range is also a result of the lack of a freight profit and management center in IR. Though there is no doubt a great deal of interaction between shippers and IR (perhaps even when the shipper is itself a Government agency), the absence of a bottom line for freight reduces the impetus to adjust freight tariffs as thoroughly as has been done in the U.S. railways. Another consideration in the difference in freight tariff dispersion between the U.S. and India is the pervasive use in the U.S. railroads of traffic costing models that permit comparison of the revenue generated from a particular piece of traffic with the specific costs that vary with that traffic. This difference is particularly important on the more price sensitive commodities where freight tariffs may need to go below fully allocated average costs and approach variable costs. 5 Indeed, U.S. regulatory practice is based on the use of variable costs in two ways: 1) a tariff that is provably below variable costs is deemed potentially predatory and therefore too low; and, 2) a tariff that is provably 4 It is also significant that the construction surcharge is not applied to passenger tariffs. Since passenger traffic is about 20 percent of traffic units (p-km + ton-km), this has the effect of exaggerating the impact of the surcharge. 5 U.S. railways and regulators tend to use the term variable cost rather than marginal cost. Variable is used to indicate that some accounting allocations of costs are made, but the allocations fall far short of attempting to allocate all costs, or to allocate average long-run costs.
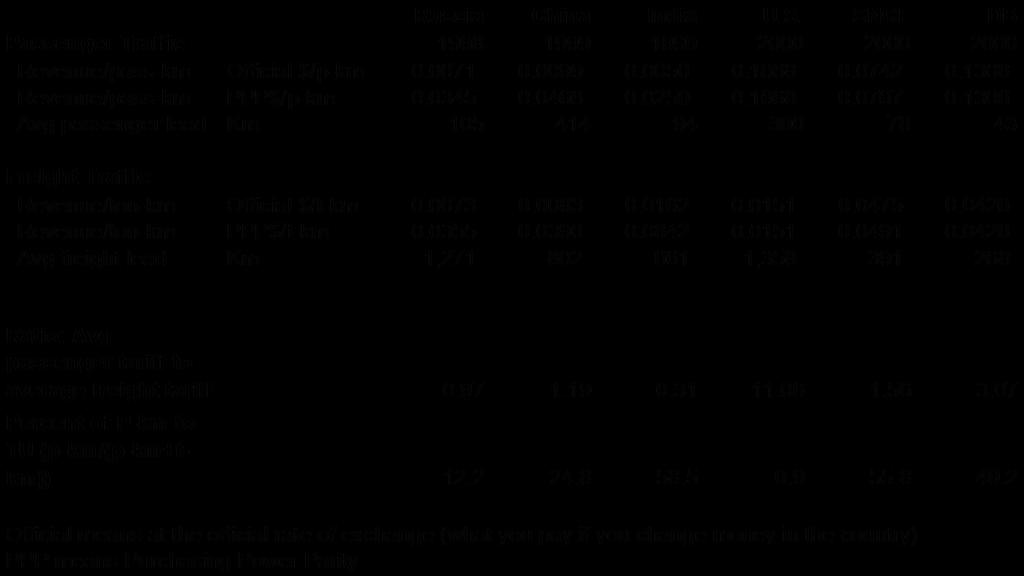
6 6 above 180 percent of the relevant variable cost is considered prima facie evidence of the potential existence of market power, which opens the rail tariff to deeper regulatory examination. Use of these models explains the difference between the U.S. curve (red) and the Indian and Chinese curves in the range where tariffs on particular commodities (particularly coal in the U.S.) are well below the average tariff. [Figure 5] provides more detail on the tariff dispersion in the U.S. freight railroads, and adds an interesting dimension the relationship between the tariff and the estimated variable cost of moving the commodity. This Figure shows, on the left hand vertical axis, the average revenue per ton-km for the 15 most important commodities (% of tons) for the U.S. rail system and shows on the right hand axis the ratio for each commodity of the revenue generated to the variable cost of handling the commodity. For example, the significant commodity (coal) with the lowest tariff ($/ton-km) also has quite a high ratio of its tariff to variable cost: that is, coal is both cheap to ship and profitable to the railways. By comparison, the commodity with the highest average tariff (transportation equipment) is certainly not the most profitable because its costs are higher. These conclusions would be difficult to reach without traffic costing models and, more important, the ton-km market share or U.S. railways would be significantly constrained if the railways did not have the flexibility and information needed to engage in this sort of pricing. Tariff structure is thus an important determinant of modal shares, and tariff structure is determined both by the flexibility of the railway to develop tariffs that respond to customer demands and needs, and by the costing information available to the railway to support tariff decision-making. Without both flexibility and information, the modal share of the railway will be limited (or, of course, the railway s profits will be diminished). Freight Tariff Levels In parallel with the tariff structure issue is the question of tariff levels: that is, even if tariffs are flexibly adjusted to customers and competitive conditions, if the average level of tariffs is too high, then the competitive position and the modal share of railways vis a vis trucks is going to be limited. [Figure 6] gives a broad comparison of the average freight and passenger tariffs and the average passenger and freight leads in Russia, China, India, the U.S. and, to bring some European perspective, SNCF and DB. The average tariffs are shown both in official U.S. dollars (the dollar value converted at the official exchange rate) and in PPP$ (the dollar value converted from local currency using the Purchasing Power Parity rate as calculated by the International Comparison Project). Although there are arguments as to the accuracy of the PPP calculations, they are generally regarded as reasonably reflective of the actual value of the different currencies, especially those that are not freely convertible on world markets. Figure 6 shows that, in PPP terms, the U.S. freight railroads have by far the lowest freight tariffs per ton-km. Interestingly, the average rail freight tariffs in Russia and China are roughly comparable to each other, and are somewhat more than double the tariffs in the U.S. The freight rates of SNCF and DB are also similar, and they are 10 to 30 percent
7 7 above those in Russia and China. The average rail freight rates in India are far higher than the other countries about 5.6 times higher than in the U.S., more than twice the levels in Russia and China, and nearly double those in Europe. Even though the trucking competitors in India are also likely to be somewhat more costly than in the other countries because of the limitations of Indian highways and the generally smaller size of Indian trucks, the market share in freight for Indian Railways will always be limited by this large disparity in freight tariffs. The average intercity truck tariff in the U.S. is around US$ 0.17 per ton-km, and the average tariff for intercity truckload trucking is around US$ 0.10 per ton-km. Rough estimates suggest that the trucking tariffs in India are not far different in PPP terms from the U.S. levels which is not surprising, given similar fuel costs and the fact that lower labor costs in India might roughly be balanced by smaller trucks and slower highway travel. If true, then the costs by rail and truck in India are very close, and not far apart as in the U.S. If Indian highways continue to improve, IR might be faced with trucking competitors that can nearly equal IR s freight tariffs. Thus, IR s market share vis a vis trucking will also be increasingly vulnerable as the highway system is expanded and trucking technology improves. Figure 6 also contains at least part of the explanation for the disparity in freight tariffs: differences in policies toward cross subsidies between freight and passengers and differences in traffic mix among the railways shown. The U.S., SNCF and DB have effectively eliminated cross subsidies by paying for passenger losses directly through PSO systems. The ratio of passenger tariffs to freight tariffs 6 in these countries (1.56 to 11.06) is thus free to reflect roughly the balance of costs of production (research has shown, for example, that rail labor productivity tends to fall rapidly as the percentage of passenger traffic increases): thus, railways with high passenger traffic percentages would normally have higher costs, and the ratio of passenger tariffs to freight tariffs should reflect this. The Russian and Chinese Governments have tried to limit freight to passenger cross subsidies by keeping passenger tariffs roughly in line with freight tariffs and their ratios reflect this (0.97 to 1.19). India, by contrast, has actively fostered cross subsidies from freight to passenger, and Figure 6 emphasizes the difference, with the ratio of 0.31 being among the lowest in the world, and certainly the lowest among the larger railways. With passenger tariffs being held down (and, to be sure, this will promote the passenger market share of IR), freight tariffs have no place to go but up if IR is to operate at break-even or better. In fact, as Figure 6 shows, the unusually high level of India s rail freight tariffs is aggravated by the leverage of having the highest passenger to freight traffic mix. If, as in China, only 24 percent of traffic were passengers, then lower passenger tariffs would not have such an effect in pushing up freight tariffs: but, with extremely low passenger tariffs and a high share of passenger traffic, the IR freight tariffs are pushed even higher. 6 This ratio is useful because it factors out any discussion of currency values, local, official or PPP. It uses the same currency on top and bottom, and conversions would not affect the ratio.
8 8 To be fair, of course, no simple set of measures can capture the full complexity of the various railway settings. IR, for example, has a large percentage of suburban passengers which reduces the average passenger lead ( lead means the average length of haul in p- km/passengers or t-km/tons), and the average revenue per passenger-km. But Russia has a large number of suburban passengers as well, and SNCF and DB have even shorter average passenger leads. Russia, China and the U.S. have longer average freight leads than IR, but SNCF and DB are shorter. Russia, China and the U.S. have much lower percentages of passenger traffic, but SNCF and DB are not far from comparable with IR s percentage. Trying to make exact comparisons is clearly impossible, but this should not obscure the basic point that the market share in freight of IR is being significantly reduced by a policy of cross subsidy from freight to passenger services combined with (and partly caused by) a relatively high percentage of passenger traffic to total traffic. This effect could actually worsen with time as has happened in all other countries when incomes have increased and highways have been expanded and modernized. Impact of Performance and Service Quality Aside from cost, shippers also care about performance, primarily speed and reliability of service. Railways inevitably cede a reliability advantage to truckload shipments because of the need to marshal wagonloads at various points in a movement. Each point of marshalling adds both delay and the possibility that a wagon will miss the outbound train or even miss several trains (or be lost entirely). There are no good, totally comparable measures of freight total trip time and reliability. [Figure 7] gives one indirect measure average speed in freight train service. It is not clear that the statistics shown are tabulated exactly the same way or that they have the same definition, but the comparisons are interesting. They show that Russian freight train speed is higher than the U.S. and that the U.S. is in turn significantly higher than IR (China is about the same as the U.S.). This seems logical, since the Russian network operates at high freight traffic densities and little passenger train interference with scheduled and standardized (+/- 55 wagons) freight trains. The U.S. operates longer freight trains (average length in 2001 was 69 wagons, with an average of load of 68 tons), mostly on demand and not scheduled (and very little passenger traffic interference, at least in the past). IR operates shorter freight trains (around 50 4-axle equivalent wagons) trains but on a network with a lot of interference from short haul and long haul passenger train traffic. This is substantiated by [Figure 8] which compares the ratio of engine hours spent in hauling freight trains with the total engine hours including hours on marshalling trains of various types. This comparison shows that IR uses a significant percentage more marshalling effort in freight trains, and it suggests (but does not prove) that IR probably has a higher degree of unpredictability in the arrival time of its freight loads. Trends in the U.S. have been toward running more block trains (often 100 wagons or more with up to 113 net tons per wagon). In addition to increasing average freight train speed, increasing the block train ratio reduces marshalling effort and significantly reduces the effect of marshalling on arrival time reliability. In fact, a block train can compete
9 9 with the reliability (if not the actual trip time) of trucks. In market share terms, block trains have permitted the U.S. railroads to extend their market share in markets, such as high value autos and auto parts, where service reliability is actually more important than small differences in trip time. IR also has made an effort in recent years to increase the percentage of block trains and this should have had an effect on average freight train speed and in reduction of marshalling effort: why this is not so is an interesting question. Taken together, [Figures 7 and 8] show that IR will not be as competitive as the U.S. railroads and the Russian and Chinese railways over longer distances. Higher average speeds reduce trip times and competitive position, a factor that becomes more important with increasing distance. In addition, higher speed and reduced marshalling will improve reliability of arrival time as well, which again acts to increase market share for rail in freight transport. One way for IR to maintain market share in freight would be to attempt to increase freight operating speeds. Another factor in the modal share equation is the information available to the shipper on expected pick up and delivery times and information available to the railway to control operations and track cargoes to ensure service quality. The U.S. railroads have invested large amounts of money into wagon location and control systems that permit them to locate and track wagons in real time. Shippers are enabled to access the system directly and locate their own cargo hour-by-hour (of course, they cannot locate the cargoes of other shippers). Railways can track wagons originating on their lines or destined to terminate on their lines as well, which permits them to develop good schedules of delivery. In general, with better wagon location information comes a significant improvement in service reliability. China is in the final stages of commissioning a similar system (Traffic Management Information System TMIS). This system, under planning and construction for a decade, will permit wagon management in China on a level comparable to the U.S. Among other things, this will permit development of a privately financed wagon leasing business that will foster the introduction of more specialized wagons and related equipment. As of now, the system is intended for railway use and does not have shipper interfaces, but these can be added with small difficulty as communications in China improve. Russian railways has a similar system with more limited capabilities, both in data available and in real-time operation. IR appears to have the least capability to do wagon tracking and management in real time, and IR s system does not afford shippers direct access for tracking cargo location and expected delivery times.. As shipper needs in India become more complex and sophisticated, IR s ability to develop real-time information will become more important in competition with trucks. Fortunately, technology to do so is evolving rapidly and innovations such as GPS-based location systems may permit IR to leapfrog the more expensive technology used elsewhere. A final, and impossible to quantify, issue is simple user friendliness. Does the railway answer the telephone, and does it respond quickly to shipper needs? Can a wagon be
10 10 made available quickly for loading (or is a consideration required in order to get a wagon at all)? Does the wagon arrive when expected, and is it delivered as and when promised? Is there a high loss and damage ratio, and does the railway promptly settle claims? These are problems for all freight railways, and anecdotal evidence suggests that IR is no exception. Of course, service quality requirements are different for different types of cargo: coal is not time sensitive, but TV sets are. This said, improving market share will require a tight and intense focus on improving the shipper s belief that the railway cares about the freight business. Summarizing Freight Market Shares [Figure 9] helps to bring the freight discussion together, displaying the rail versus truck market share (other freight modes have been removed in order to focus on the rail/truck interface) as a function of the average length of haul of the railway for a number of developing, former socialist and developed economies. The intuitive argument that the rail share should increase with larger distances is confirmed. It is interesting that the formerly socialist countries tended to have a much higher rail freight market share than the more market-oriented economies at any given freight lead. This appears to be an artifact of the command and control economies in which the planners focused on line haul costs and ignored total logistics costs. Moreover, the composition of the planned economy output was weighted toward basic commodities which also favored rail. This is quite likely to change as these economies adapt to market forms and as shippers make bottom line decisions. We can also observe that IR is almost exactly on the regression line despite its high freight tariffs. The most likely explanation is that trucking in India has also been hindered by lack of high quality highways and the smaller trucks that the Indian highway conditions have fostered. Another reason may have been the large impact that Government controlled shipping decisions has had on the traffic of IR. It seems reasonable to speculate that the IR market share will be pushed downward by better trucking competition and a shift toward private production of freight commodities. The question is whether an improvement in average speed and service reliability can act to counteract competition. Another question is whether bottom line management at IR coupled with greater pricing flexibility will be helpful. The question of Government policy of cross-subsidizing passengers from freight is also crucial: if this does not change (and Russia, China, the U.S. and the E.U. have changed their policies in this regard) then the freight market share for IR will continue to be constrained. Potential Impacts of Inclusion of External Costs Thus far, this note has focused on the more or less explicit and direct costs of the transport system. How much does the shipper have to pay, or what are the measurable performance parameters of the competing modes? In economic terms, these can be called the internal costs of transport and they clearly are the current drivers of modal choices made by shippers of travelers.
11 11 There are, however, external costs costs and performance factors that are not part of the decision-making process. Simple examples are pollution or highway congestion. Shippers do not have to pay for the pollution emitted by trucks and travelers are not charged for pollution emitted by their auto or bus (or 3-wheeler). Truck drivers are not charged for the congestion their traffic generates (though they do pay for delays through higher labor and fuel costs as well as lower truck utilization). No transport users pay for the Carbon Dioxide (CO 2 ) which their movements generate. In all cases, the costs and impacts on service are very real, but they do not enter into the shipper/traveler s modal choice decision because they are either not paid at all or are paid in a way that does not generate a transport demand response. To the extent that highways pollute more than railways without paying for it, or to the extent that trucking companies do not pay for the highway congestion or the CO 2 they generate, then IR s share in Indian transport is lower than it should be. Whether this has a significant impact on the efficient modals or not is hard to say convincingly. [Figure 10] shows the range of energy consumption of the various freight modes and [Figure 11] shows the same for the major passenger modes. Since energy consumption is directly related to CO 2 generation, this is a good measure of the relative emissions of greenhouse gases. Energy use is not so directly related to localized air and noise pollution (2-cycle, 3-wheelers are more fuel efficient than autos, but emit much more pollution), these Figures may not be as good at representing environmental external costs. [Figure 12] shows the relative level of fuel taxation in a number of countries in 1998 (latest year data are available). Fuel prices (and taxation) in China and Russia are lower in the U.S. (and among the lower in the world). Diesel prices in India are lower than in the U.S., while petrol prices are somewhat higher. Taken together, these Figures certainly raise a question as to whether trucks and autos are being taxed at levels which might compensate for pollution and CO 2 generation. By comparison with the U.S., China and Russia, India s low diesel prices actually are having a more adverse impact on the freight modal shares than on passenger modal shares again a problem that will get worse as highway capacity is expanded and improved. Marginal costs in transport are higher than average costs if capacity is being stretched and social costs are higher than financial costs if there are social costs that user charges are not fully compensating. There are no good studies available for India exploring this issue. Again, indications can be gained from [Figure 12] and [Figures 13, 14 and 15], which show the results of studies done in the U.S. and the U.K. of highway costs and revenue allocations from taxes. [Figure 13] shows that, in the U.S., autos pay fuel taxes which roughly cover the financial cost of building and maintaining highways for auto use. Light trucks (similar to many trucks in India) and heavy trucks in the U.S. fall short of paying their way financially. This means broadly that Government subsidies to highway construction and maintenance in the U.S. are reducing the rail market share in freight - but not in passengers. By contrast, in the U.K., autos, light trucks and heavy trucks all pay fuel taxes that more than compensate the government for the financial cost of the highways no great surprise when fuel taxes and prices in the U.K. are compared with those in the U.S. Given the similarities of fuel taxation of India, Russia and China
12 12 with those in the U.S., there is a reasonable suspicion that trucks might not be paying their share of the financial costs of highways in India as well. This of course deals only with the financial cost of highways. If the social marginal cost of highway use is taken into account, the difference is more pronounced, as [Figures 14 and 15] show. Even in the U.K., with its high fuel taxation, highway modes do not cover their social marginal costs: in the U.S., the gap is much higher because of low fuel prices (similar to India). Moreover, while some aspects of the social marginal cost calculations are debatable (it is hard to agree on the actual costs of pollution, or CO2 emissions and human life in safety calculations), the costs of highway congestion are clearer. [Figure 15] shows that a significant percentage of the social marginal costs are congestion alone, and only heavy trucks in the U.S. come close to covering the congestion component of social marginal costs. If U.S. conditions are relevant to India, there is some reason to believe that if highway access and user charges were set at full financial cost, and even more so, social marginal costs, this would benefit the market share of IR. Passenger Transport Much of the discussion above has touched on passenger modal shares as well as freight (because many aspects of the issue are inter-related). The focus in this note is on freight, so passenger issues will not be discussed in detail. It is worthwhile, however, to discuss passenger modal shares briefly in order to complete the picture of next steps in actions that could be taken to reach efficient modal shares in India. As discussed above, passenger transport choices extend from walking (and biking) through motorcycles, 3- wheelers, autos, rail, bus and air. In broad terms, these choices are made in a short trip (mostly urban) milieu or in a longer trip environment. Decisions are made differently in the two arenas. Urban and short trips are usually made for personal reasons (shopping, visits to family or friends) and for business or employment reasons (especially commuting from home to work). Walking can be a major share of these trips in the denser or smaller cities. Choices between the common carrier modes, bus and rail, are determined by availability and frequency, and usually by government subsidy policies. Commuting by auto is usually limited when incomes are low, but begins to grow rapidly when incomes rise, especially if road congestion is not intolerable and parking costs are low. Typically, western cities have a higher proportion of urban space dedicated to roads (20 percent or more) than is prevalent in Asian cities (often less than 15 percent). As a result, the trend toward motorization has hit early and hard in many of the larger Asian cities, and congestion will get worse as these cities (Mumbai and Delhi are examples) grow. Combined with the dramatic trend toward urbanization now being felt in developing countries, especially the large mega-cities of Asia, urban congestion is a crucial arena for transport policy. Public policies have a major impact on modal choice in the urban context. When access to urban areas is underpriced (many Asian cities do not even have parking charges for autos), then the tendency for commuters to try to drive to work will increase rapidly with
13 13 incomes. If mass transit access (heavy rail and suburban rail as well as trams, trolleys and buses) is good and fares are low (and subsidies are high) then modal shares can be shifted from auto (or, at least, the growth of auto traffic can be slowed) back to public modes. In this sense, the Indian policy of keeping suburban rail passenger fares low (suburban fares in India are among the lowest in the world) may well be economically justifiable. Mumbai, for example, which is one of the economic engines of the Indian economy, depends heavily on good rail service at low fares. Mumbai, and India, would suffer greatly if the IR suburban services were not maintained. Longer haul passenger services may be somewhat different. As a general rule of thumb, autos should be faster and cheaper at distances up to about 200 km (or more, when there is more than one passenger in the auto) whereas air will be faster and cheaper than rail at distances of more than 500 km. Given the condition of the highways in India, railways can offer relatively faster and cheaper trips at much shorter distances than is true of China and Russia (much less the U.S.). On the other hand, inefficient airports and airlines have in the past meant that air services in India only became competitive at longer distances than are typical of China, Russia and the U.S. Both of these relative advantages for IR will change with time: better highways will make autos more competitive over short and even medium distances and better air service (especially privatized airlines and airports) will erode IR s long haul passenger markets as they have elsewhere. IR s market share will more closely resemble that of Russia and China (and the E.U.) as the Indian highway and air infrastructure develop and as incomes increase. Policies to Develop Efficient Modal Shares in India Despite the complexity of the modal choice issues, it is possible to provide a broad outline of policy and financing actions available to the Indian Government that would support the emergence of efficient modal shares in Indian transport. In this case, efficient means that the total cost of transport to the economy is minimized and that the economy can develop rapidly without being constrained by transport bottlenecks. Reduce or eliminate cross subsidies from freight to passenger transport in railways. As discussed, IR s freight tariffs are too high because they have to carry the burden of low passenger tariffs. If the passenger deficits are funded directly by Government, as is the practice in E.U. and the U.S. (and as is the objective in China and Russia), through PSO contracts, then IR s freight tariffs would be freed to reach a better competitive level. This does not argue that there should not be passenger subsidies for suburban or long haul passenger services: rather, it argues that IR cannot reach an efficient freight modal share so long as it has to finance passenger losses from freight surpluses. In fact, as the U.S. experience with freight regulation and Amtrak shows, cross subsidies cannot be sustained when unregulated competition emerges. Significantly relax the control over the IR freight tariffs, including more ability to develop and implement contract tariffs, in cases where it can be shown that IR is not earning excessive monopoly profits. This will permit IR to price more flexibly in competition with trucks. Of course, this implies that IR should organize its freight
14 14 operations by lines of business so that freight profits can be measured and managed. More broadly, IR will need to ability to change its business policies (management structure and tariff levels and structure) in order to react to the rapidly developing competitive scenarios. Given changes in management structure and tariff flexibility, IR may be able to use innovative tools, such as specialized companies for marketing higher value commodity shipments (e.g. Concor in India and J.B. Hunt in the U.S.) that would give IR a chance to recover its share in freight shipments in the longer-haul but less-thantrainload category. Consider whether fuel taxes, especially low taxes on diesel fuel, are fostering an unnecessarily high market share for trucks in the freight market. This deserves consideration both because of India s need to construct and maintain new highway capacity and because the social marginal costs of autos and trucks should at least be partially compensated from user charges. If not, then IR s market share will be constrained at the expense of the overall economy. Consider the need for further organizational change of IR as the different IR markets come under more vigorous attack. It will do no good to rectify imbalances in other modes if IR itself is not prepared to take advantage of the opportunity. It has been suggested that IR might manage itself by lines of business: that is, have profit centers for freight (and for particular markets by commodity or type of service within freight), for longer haul passenger services and for each of a series of very large suburban passenger services. This type of organizational evolution would help IR to respond to growing competition and would permit IR to do a better job of targeting resources and justifying PSO contract payments. Such organizational change must be accompanied by a Management Information System (MIS) that provides accurate and defensible information in respect of costs, especially marginal costs. Assess the experience in Mumbai of gradual evolution of planning and at least partial funding of suburban services to the local communities. In the longer run, IR may wish to follow the model of railways in most of the countries in the developed world who have found that running suburban railways consumes resources and managerial effort that is better dedicated to running freight and intercity passenger trains. There are no simple formulae for success. Competition from truck, barges and pipelines in the U.S. has forced the U.S. Class I freight railroads to work very hard just to survive. Changes in Government policy in the U.S., specifically the creation of Amtrak (to take passenger losses from the freight side and put them in the Federal budget) and deregulation have at least partly leveled the competitive conditions and saved the economy billions of dollars annually in transport costs. China has thus far avoided the problem of massive rail passenger losses (it has higher intercity passenger fares and few commuters), but the Chinese Government is already looking at various railway reforms in order to stabilize the railway in the face of growing highway competition (and air competition) and of growing competition of privately financed carriers that WTO membership will generate. The Russian Government is also engaged in a long range restructuring effort in the Russian Railway in order to relieve the railway of its passenger losses, transfer suburban responsibilities to urban or oblast levels, and to create rail versus rail competition in area where no trucking competition can be expected to emerge.
15 15 India is different (so goes the refrain), but it is not that different. Adapted to Indian conditions, many of the same measures will be an important part of reform in the Indian transport sector as India finds its own way to economic development. December 2002
16 Figure 1 Market Shares in U.S. Transport (1998) Tons Ton-Km Revenue Rail Intercity Truck* Domestic Water Pipeline Air
 over")
17 Figure 2 Freight Modal Shares (ton-km) over time
")
18 Figure 3 Passenger Modal Shares (p-km) over time
19 Figure 4 Rail Freight Rate Distribution In China, India and in the US: (Cumulative Percent Of Ton-Km vs. Ratio of Tariff to Average Tariff) Cumulative Percent of Ton-Km US China without surcharge China with surcharge India Ratio of Tariff to Average Tariff
20 Figure U.S. rail traffic Revenue/Ton-Km Ratio: Rev/VC Revenue/T-Km Ratio: Rev/VC Average Coal Chemicals Farm Products Nonmetallic Minerals Miscellaneous Mixed Food or Kindred Products Iron and Steel Lumber or Wood Clay, Concrete, Glass or Stone Transportation Equipment Pulp and Paper Petroleum POL Waste or Scrap Materials Metallic Ores Containers All Other Top 15 commodities, 98 % of ton-km
21 Figure 6
22 Figure 7 Average speeds in freight service US Class I IR BG Diesel IR BG Electric Russia China
23 Figure 8 Ratio of road engine hours to total engine hours U.S. IR
24 Rail Share of Rail + Truck Traffic (%) versus Average Rail Length of Haul Socialist Developing Developed Regression G FR Figure 9 India Canada Regression: Developing and Developed Russia U.S. China
25 Figure 10 Energy Consumption -- Ranges in Freight Transport dedicated air cargo operations high end rough central average kj/t-km low end incremental air cargo slurry gas oil Air Pipeline Rail Small Truck Medium Truck Mode of Transport Large Truck Water NMT
26 Figure 11 Energy Consumption -- Ranges in Passenger Transport Cessna Citation Concorde Commercial Upper Limit Air Rail Bus Auto Motorcycle Mode of Transport high end Rough central average low end Bicycle Walking Swim
27 Figure 12 Gasoline and diesel fuel prices (US $/gallon) Gasoline (super) Diesel China India Russia Untaxed Mexico Saudi Arabia Canada Brazil Poland Romania US Average Spain Japan France Germany Sweden Netherlands Finland Italy Denmark Belgium UK Norway Ireland Source: Fuel Prices and Taxation, GTZ, May 1999
28 Figure 13 Ratio of highway user charge revenue to fully allocated infrastructure costs Auto Light trucks Heavy trucks UK US
29 Figure 14 Ratio of highway user charge revenue to marginal transport costs in the U.K. and U.S UK US Auto Light trucks Heavy trucks
30 Figure 15 Percent of marginal costs attributable to congestion Auto Light trucks Heavy trucks UK US
What is the Future of the Chinese Railways?
 What is the Future of the Chinese Railways? By David Burns 2/19/09 Not a definitive presentation! Railways are Railways the World Over Possible to predict future of Chinese railway by observation of those
Northeast Rail Operations Study (NEROps)
") I-95 Corridor Coalition Northeast Rail Operations Study (NEROps) Phase I Final Report Executive Summary June 2007 Northeast Rail Operations Study (NEROps) Phase I Final Report Executive Summary Prepared
I-95 Corridor Coalition Northeast Rail Operations Study (NEROps) Phase I Final Report Executive Summary June 2007 Northeast Rail Operations Study (NEROps) Phase I Final Report Executive Summary Prepared
Performance and Policy Reform of the U.S. Transportation System. Clifford Winston Brookings Institution
 Performance and Policy Reform of the U.S. Transportation System Clifford Winston Brookings Institution Motivation Transportation is a cost in both money and time that must be incurred by individuals and
Opportunities and Risks of the Infrastructure Management Models
 Opportunities and Risks of the Infrastructure Management Models VALEC/IDB Seminar Lou Thompson July 4, 2012 Thompson, Galenson and Associates, LLC 14684 Stoneridge Drive Saratoga, CA 95070-5745 Tel: (408)
Relieving the Trucking Jam By Mark Alexander and Alexander Neuhaus
 Relieving the Trucking Jam By Mark Alexander and Alexander Neuhaus Motor carriers have been successful because of their ability and willingness to take just about any traffic at any price. And in the United
Transform Milwaukee. Section 8 Freight Transportation and Logistics. Summary Findings
 Transform Milwaukee Section 8 Freight Transportation and Logistics Summary Findings Freight Originating in the Milwaukee CSA 2011 Estimates to 2040 Projections Mode 1000 s of Tons in 2011 1000 s of Tons
Toolkit for Improving Rail Sector Performance. Chapter 8: Buying Services from Railways
 8 Railway Reform: Toolkit for Improving Rail Sector Performance Chapter 8: Buying Services from Railways 8. Rail Sector Governance and Policy 8 Buying Services from Railways 8.1 Introduction Most governments
Appendix B. Commodity Flow Profile
 Appendix B 1.0 Introduction The overall goal of the Kansas Department of Transportation (KDOT) Statewide Freight Plan is to develop a set of infrastructure, operational, and institutional recommendations
Transportation Cost Analysis:
 Victoria Transport Policy Institute www.vtpi.org info@vtpi.org 1250 Rudlin Street, Victoria, BC, V8V 3R7, CANADA Phone & Fax (250) 360-1560 Efficiency - Equity - Clarity Transportation Cost Analysis: Techniques,
The increased flow of knowledge, resources, goods and services among nations that has
 Globalisation, Transport and the Environment OECD 2010 Executive Summary The increased flow of knowledge, resources, goods and services among nations that has occurred as a result of globalisation has
The Fertilizer Institute. Current Transportation Dynamics November 6, 2006 By Tom Williamson, Transportation Consultants Co.
 The Fertilizer Institute Current Transportation Dynamics November 6, 2006 By Tom Williamson, Transportation Consultants Co. Questions What will be the cost of fuel, insurance, taxes, and new transportation
Explaining and Understanding Declines in U.S. CO 2 Emissions
 Explaining and Understanding Declines in U.S. CO 2 Emissions Zeke Hausfather Seven key factors, combined with the impacts of a prolonged economic slowdown, have led U.S. CO2 emissions to fall to 1996 levels,
SECTOR ASSESSMENT (SUMMARY): TRANSPORT (RAIL TRANSPORT [NONURBAN])
![SECTOR ASSESSMENT (SUMMARY): TRANSPORT (RAIL TRANSPORT [NONURBAN])](/thumbs/76/73866832.jpg "SECTOR ASSESSMENT (SUMMARY): TRANSPORT (RAIL TRANSPORT [NONURBAN])") Railway Rolling Stock Project (RRP BAN 49094) SECTOR ASSESSMENT (SUMMARY): TRANSPORT (RAIL TRANSPORT [NONURBAN]) Sector Road Map 1. Sector Performance, Problems, and Opportunities 1. Bangladesh s transport
Railway Rolling Stock Project (RRP BAN 49094) SECTOR ASSESSMENT (SUMMARY): TRANSPORT (RAIL TRANSPORT [NONURBAN]) Sector Road Map 1. Sector Performance, Problems, and Opportunities 1. Bangladesh s transport
HHG Shipping. topia.com
 HHG Shipping Household Goods (HHG) Shipping can be confusing, but when you add in the differences between shipping items domestically and internationally it can be even more challenging to understand.
CASE STUDY: INDIAN RAILWAYS
 52 CHAPTER VI CASE STUDY: INDIAN RAILWAYS 6.1 Railway Operation : The principal mode of inland transport in India is Railways and Road Transportation. Other modes of transport play comparatively a minor
Introduction... 1 Florida s Rail System... 1 Rail Freight... 3 Rail Passengers... 5 Conclusions... 9
 January 2011 Table of Contents Introduction... 1 Florida s Rail System... 1 Rail Freight... 3 Rail Passengers... 5 Conclusions... 9 Table of Figures and Tables Figure 1 Florida Rail System Map... 2 Figure
LECTURE 13 (and forward): TRAVELER TRANSPORTATION
: TRAVELER TRANSPORTATION") Introduction to Tranportation Systems 1.201J/11.545J/ESD.210J Fall 2006 LECTURE 13 (and forward): TRAVELER TRANSPORTATION DISPLAYS October 24 (and forward), 2006 SPEAKER: Joseph M. Sussman MIT Traveler
Introduction to Tranportation Systems 1.201J/11.545J/ESD.210J Fall 2006 LECTURE 13 (and forward): TRAVELER TRANSPORTATION DISPLAYS October 24 (and forward), 2006 SPEAKER: Joseph M. Sussman MIT Traveler
Infrastructure endowment
 Infrastructure endowment Most public investment in Member States as well as that supported by the Structural Funds goes on infrastructure. An adequate endowment of infrastructure is a necessary, but not
FDOT FREIGHT PERFORMANCE MEASURES
 FDOT FREIGHT PERFORMANCE MEASURES 1 PEOPLE FREIGHT Transit MODE QUANTITY QUALITY ACCESSIBILITY UTILIZATION Auto/Truck Pedestrian Bicycle Aviation Rail Seaports Truck Aviation Rail Seaports Vehicle Miles
FAQ: The New East Coast Line
 FAQ: The New East Coast Line Why is a railway in northern Sweden essential for Europe? Sweden is a vast country with enormous natural resources. Our industry has extremely high standards for environmental
car pool mass transportation schedule carrier transfer
 How will I get to where I m going? Chapter 30 Transportation Chapter Objectives After studying this chapter, you will be able to identify two forms of self-powered transportation. determine the pros and
FOUNDATIONAL RESEARCH BULLETIN
 FOUNDATIONAL RESEARCH BULLETIN SUSTAINABILITY BY DESIGN An examination of alternatives to an underground extension of the Millenium line to UBC. No. September 2008 A Cost Comparison of Transportation Modes.
Railway-Related Cement Consumption Outlook
 Contact: Ed Sullivan, Senior VP & Chief Economist, (847) 972.9006, esullivan@cement.org Trevor Storck, Economist, (847) 972.9044, tstorck@cement.org May 2018 Railway-Related Cement Consumption Outlook
Infrastructure and Growth Leadership Advisory Group Ideas and Approaches Survey
 Infrastructure and Growth Leadership Advisory Group Ideas and Approaches Survey Maintain transportation system in state of good repair 1. Increase focus on maintenance of existing infrastructure in poor
Northeast Rail Operations Study (NEROps)
") I-95 Corridor Coalition Northeast Rail Operations Study (NEROps) Phase I Final Report Executive Summary July 2007 Northeast Rail Operations Study (NEROps) Phase I Final Report Executive Summary Prepared
I-95 Corridor Coalition Northeast Rail Operations Study (NEROps) Phase I Final Report Executive Summary July 2007 Northeast Rail Operations Study (NEROps) Phase I Final Report Executive Summary Prepared
IDEI Report # 12. Rail Transport. June The European Market for Freight Services : Towards A Simulation Model of Competition
 IDEI Report # 2 Rail Transport June 2007 The European Market for Freight Services : Towards A Simulation Model of Competition IDEI Report #8 on Passenger Rail Transport June 2007 The European Market for
PROJECTS. The KIPDA MPO s Central Location
 PROJECTS Freight The economy of the Louisville KY-IN) Metropolitan Planning Area MPA), similar to that of the United States as a whole, is largely dependent on the efficient, reliable, and safe movement
Overview. Facilitating Trade through Competitive, Low-Carbon Transport
 Overview Inland waterway transport (IWT) and coastal shipping are essential to the everyday functioning of the Vietnamese economy, which is endowed with two large river deltas and more than 3,000 kilometers
2 INTERMODAL COMPETITORS AND THEIR ADVANTAGES TODAY
 2 INTERMODAL COMPETITORS AND THEIR ADVANTAGES TODAY During the last thirty years, the unbalanced construction of infrastructures, legislations that neither set ecology as an objective nor could cope with
TRANSPORTATION 101 Today and Tomorrow. Moving People and Goods
 TRANSPORTATION 101 Today and Tomorrow Moving People and Goods What is the Transportation Commission? An independent, seven-member body of citizens appointed by the Governor for six-year terms and representing
Q&A: The New East Coast Line
 Q&A: The New East Coast Line Why is a railway in northern Sweden essential for Europe? Sweden is a vast country with enormous natural resources. Our industry has extremely high standards for environmental
BACKGROUNDER #6: Moving Goods & Services
 BACKGROUNDER #6: Moving Goods & Services Introduction The Metro Vancouver region plays a critical role as Canada s Pacific Gateway providing the network of roads, waterways, rail facilities, and air and
Overview of America s Freight Railroads
 Overview of America s Freight Railroads Association of American Railroads August 2017 Summary From one end of the country to the other, America is connected by the best freight rail system in the world.
Linking the Logistics Dots. Presentation Date: February 4 th, 2016
 Linking the Logistics Dots Presenter Name: Poroma Munshi Rebello Presentation Date: February 4 th, 2016 Infrastructure & Logistics. well known facts Efficient, cost effective and energy friendly transportation
Changes in Service Levels, Fares, and Funding for Small Urban Transit Agencies: Survey Results
 Changes in Service Levels, Fares, and Funding for Small Urban Transit Agencies: Survey Results Preliminary Report Jeremy Mattson David Ripplinger Small Urban & Rural Transit Center Upper Great Plains Transportation
Concept of Sustainable Transport: Planning and Designing for Sustainable and Inclusive Transportation Systems UNESCAP Transport Division
 National Capacity Building Workshop on Sustainable and Inclusive Transport Development Colombo, Sri Lanka 9-10 July 2015 Concept of Sustainable Transport: Planning and Designing for Sustainable and Inclusive
Test bank Chapter 4. Multiple Choice
 Test bank Chapter 4 Multiple Choice 1. During 1997, railroads carried what percentage of the total intercity freight traffic? a. 47 percent b. 39 percent c. 51 percent d. 25 percent 2. Which is considered
INTERMODAL TRANSPORT AND THE WHITE PAPER IRU POSITION
 GETC/G3311/SPR Geneva, 29 November 2001 INTERMODAL TRANSPORT AND THE WHITE PAPER IRU POSITION INTRODUCTION The White Paper EUROPEAN TRANSPORT POLICY FOR 2010: DECISION TIME published by the European Commission
A Short History of U.S. Freight Railroads
 A Short History of U.S. Freight Railroads Association of American Railroads August 2017 Summary Since their birth more than 185 years ago, railroads have played a crucial role in America s development.
Freight Management for Mid-sized Companies:
 WHITE PAPER Freight Management for Mid-sized Companies: Manage Transportation Like a Fortune 500 Company Without Spending Millions Mid-sized companies frequently lack the internal systems and resources
2017 TRANSPORTATION POLICY STATEMENT
 0 TRANSPORTATION POLICY STATEMENT 1 1 1 1 1 1 0 1 0 1 0 1 Critical investments are needed to maintain and improve Virginia s transportation network. The structural imbalance between critical needs and
Importance of Road Freight Transport to the Organization and Economy. Amal S. Kumarage July 2014
 Importance of Road Freight Transport to the Organization and Economy Amal S. Kumarage July 2014 Freight Transport FT is the process of conveying different types of goods from one point to another using
Group III. Suzana Kahn Ribeiro. Transport Engineering Program Federal University of Rio de Janeiro Brazil CLA Transport Chapter IPCC WG III
 IPCC Outreach Event on AR4 Working Group III Suzana Kahn Ribeiro Transport Engineering Program Federal University of Rio de Janeiro Brazil CLA Transport Chapter IPCC WG III AR4 WG3 Carbon dioxide is the
REGIONAL RAIL REVIVAL
 REGIONAL RAIL REVIVAL Bryan Nye, CEO ARA 10 MAY 2013 ABN 64 217 302 489 The ARA Who we are: a member-based association that represents the interests of the rail sector Our purpose: to create an environment
The Effect of Rising Fuel Costs on Goods Movement Mode Choice and Infrastructure Needs
 2008-1 The Effect of Rising Fuel Costs on Goods Movement Mode Choice and Infrastructure Needs October 2008 This Goods Movement Challenges and Opportunities Report was prepared jointly by the Florida Department
Factors Affecting Transportation Decisions. Transportation in a Supply Chain. Transportation Modes. Road freight transport Europe
 Transportation in a Supply Chain Factors Affecting Transportation Decisions Carrier (party that moves or transports the product) Vehicle-related cost Fixed operating cost Trip-related cost Shipper (party
B. S. Fisher and M. D. Hinchy Australian Bureau of Agricultural and Resource Economics, Canberra, Australia
 IMPACTS OF ENERGY TAXES AND SUBSIDIES B. S. Fisher and M. D. Hinchy Australian Bureau of Agricultural and Resource Economics, Canberra, Australia Keywords: energy taxes, energy subsidies, price gap approach
Urban Transportation Planning Prof Dr. V. Thamizh Arasan Department of Civil Engineering Indian Institute Of Technology, Madras
 Urban Transportation Planning Prof Dr. V. Thamizh Arasan Department of Civil Engineering Indian Institute Of Technology, Madras Lecture No. # 14 Modal Split Analysis Contd. This is lecture 14 on urban
AN ANALYSIS OF VERTICAL SEPARATION OF RAILWAYS
 AN ANALYSIS OF VERTICAL SEPARATION OF RAILWAYS JR East Consultants Company, Japan E-mail address: fumio39@hotmail.co.jp ABSTRACT A number of state railways over the world have experienced railway reform,
The Cost of Production
 C H A P T E R 7 The Cost of Production Prepared by: Fernando & Yvonn Quijano CHAPTER 7 OUTLINE 7.1 Measuring Cost: Which Costs Matter? 7.2 Cost in the Short Run 7.3 Cost in the Long Run 7.4 Long-Run versus
VIA Long Range Plan Glossary
 VIA Long Range Plan Glossary Accessibility. Accessibility is the ability to reach opportunities (economic, social, etc.) within a certain geographical area. Americans with Disabilities Act (ADA). Passed
Improved public transport? An evaluation of two reforms. Summary Report 2014:13
 Improved public transport? An evaluation of two reforms Summary Report 2014:13 Improved public transport? An evaluation of two reforms Summary Report 2014:13 Transport Analysis Address: Torsgatan 30 SE-113
Delivering a Sustainable Railway. Summary
 Delivering a Sustainable Railway Summary July 2007 Present success, future ambition Delivering a Sustainable Railway is the most positive statement about the growth and development of rail for over 50
External costs of traffic in Sweden with a European outlook, Summary Report 2015:4
 External costs of traffic in Sweden with a European outlook, 2015 Summary Report 2015:4 External costs of traffic in Sweden with a European outlook, 2015 Summary Report 2015:4 Transport Analysis Address:
The 'stickiness' of prices
 The 'stickiness' of prices By Sam Wylie When supply and demand drift apart, prices adjust to restore equilibrium. But when prices cannot adjust, or can only adjust slowly, there is an inefficiency in the
Introduction to Transportation Systems
 Introduction to Transportation Systems 1 PART I: CONTEXT, CONCEPTS AND CHARACTERIZATION 2 Chapter 4: The Customer and Level-of-Service 3 The Customer u The customers of the transportation system, be it
Freight Transportation Megatrends
 Freight Transportation Megatrends Copyright 2006 Global Insight, Inc. Freight Demand Modeling: Tools for Public-Sector Decision Making Conference Paul Bingham Global Insight, Inc. Washington, DC September
FACTS ABOUT THE AUSTRALIAN RETAIL FUELS MARKET & PRICES
 FACTS ABOUT THE AUSTRALIAN RETAIL FUELS MARKET & PRICES RETAIL PRICES & INFLUENCES The most important influences on retail fuel prices in Australia are: the international price of refined fuel the exchange
THE ASIA PACIFIC PARTNERSHIP: ITS ROLE IN PROMOTING A POSITIVE CLIMATE FOR INVESTMENT, ECONOMIC GROWTH AND GREENHOUSE GAS REDUCTIONS EXECUTIVE SUMMARY
 THE ASIA PACIFIC PARTNERSHIP: ITS ROLE IN PROMOTING A POSITIVE CLIMATE FOR INVESTMENT, ECONOMIC GROWTH AND GREENHOUSE GAS REDUCTIONS By W. David Montgomery Sugandha D. Tuladhar * EXECUTIVE SUMMARY Background:
Special Advertising Section
 Special Advertising Section Vital and Dynamic Trucking Industry Plots Road to Sustainable Future Written by John D. Schulz Trucking is an overlooked national resource, even in the transportation world.
Input from Engineers Ireland Into the Department of Transport s Statement of Strategy
 Input from Engineers Ireland Into the Department of Transport s Statement of Strategy 2008 2010 Table of Contents Page Executive Summary 3 Department of Transport Mandate and Mission (2005-2007) 4 The
1 In the version of the spreadsheet model that we received, column headings are missing and formulas have evidently
 ROCOG STAFF COMMENTS ON THE DRAFT COMPREHENSIVE MINNESOTA STATEWIDE FREIGHT AND PASSENGER RAIL PLAN I. Vision We support the Plan s conclusion (page 4-36) that high speed passenger rail should focus in
TECHNICAL MEMORANDUM #1. The Vision, Goals and Objectives for Rail Transportation in Missouri
 TECHNICAL MEMORANDUM #1 The Vision, Goals and Objectives for Rail Transportation in Missouri April 2012 1 The Vision, Goals and Objectives for Rail Transportation in Missouri Role of Railroads in Missouri
Transit Works. Improving the quality of life for all Californians.
 Transit Works Improving the quality of life for all Californians. Transit Works For Commuters Students Seniors the Environment the Economy Robust public transit is as vital a component of a thriving community
Network Rail s response to ORR s 2018 Periodic Review (PR18) consultation on charges recovering fixed network costs.
 consultation on charges recovering fixed network costs.") Network Rail s response to ORR s 2018 Periodic Review (PR18) consultation on charges recovering fixed network costs 30 November 2017 1 Executive summary Network Rail welcomes the opportunity to respond
Network Rail s response to ORR s 2018 Periodic Review (PR18) consultation on charges recovering fixed network costs 30 November 2017 1 Executive summary Network Rail welcomes the opportunity to respond
APPENDIX B - GLOSSARY FEBRUARY 2017
 APPENDIX B - GLOSSARY FEBRUARY 2017 DENVERMOVES Transit Denver Moves: Transit - ii - APPENDIX B TRANSIT AND MOBILITY GLOSSARY Amenities, stop or station: Objects or facilities (such as a shelter, bench,
Introduction. 1 McKinstry/Bounajm. 1 In this paper, any reference to short lines also includes regional railways.
 Investigating the Social Benefits of Short Line Freight Railways in Canada Robert McKinstry, Railway Association of Canada Fares Bounajm, Railway Association of Canada Introduction The Canada Transportation
Class I Railroad Statistics
 Class I Railroad Statistics Class I Railroads Class I Railroads are U.S. line haul freight railroads with operating revenue in excess of $266.7 million. Two Canadian railroads, Canadian National Railway
Rail - What Does the Future Bring?
 Rail - What Does the Future Bring? Jeannie Beckett Sr. Dir., Inland Transportation Port of Tacoma Oct 18, 2007 The Rail Networks Railroads Media Blitz Print Ads TV Ads Radio Ads D:\aapa\ RailroadsPSA.wmv
Summary. Freight transportation in New England
 This memo is preliminary in nature and subject to revision and review. Any views expressed are not necessarily those of the Federal Reserve Bank of Boston or the Federal Reserve System. To: Carrie Conaway,
Econ 1101 International Application Case Studies
 Econ 1101 International Application Case Studies InterApp 2: Fuel Consumption in Europe and the United States And Long-Run Elasticity of Demand By Thomas J. Holmes, Dept. of Economics, University of Minnesota
Arkansas Transportation Report
 Arkansas Transportation Report February 2017 Arkansas River traffic up nearly 16% in 2016 Despite continued declines reported in iron and steel shipments, food and farm products and petroleum products,
Lecture - 44 Supply Chain
 Economics, Management and Entrepreneurship Prof. Pratap. K. J. Mohapatra Department of Industrial Engineering and Management Indian Institute of Technology Kharagpur Lecture - 44 Supply Chain Good morning.
Rail Freight and Passenger
 Take Care of the System Critical Investments in the areas of: Rail Freight rehabilitate rail bridges o Rail Bridge Inventory Database... $0.5 - $1.0 million (one time) Rail Freight rail replacement and
Class No. 14 (file 11): Regulation in
: Regulation in") Regulation Policy and Economics of Regulation Class No. 14 (file 11): Regulation in Transportation Industry Objectives of Today s Class (1)T To understand dthe theory behind dthe regulation in the taxi
Regulation Policy and Economics of Regulation Class No. 14 (file 11): Regulation in Transportation Industry Objectives of Today s Class (1)T To understand dthe theory behind dthe regulation in the taxi
The connected future of public transportation
 The connected future of public transportation New technologies and real-time data are merging with established public transport paradigms. Discover the five capabilities needed to prepare for this future
INFLUENCE OF PRICE AND FINANCIAL STABILITY OVER THE PRICE IN TOURISM
 INFLUENCE OF PRICE AND FINANCIAL STABILITY OVER THE PRICE IN TOURISM Lect. Roxana Ispas Ph. D University of Craiova Faculty of Economics and Business Administration Craiova, Romania Lect. Roxana Marinescu
MANAGEMENT CASE STUDY May 2018 EXAM ANSWERS. Variant 2. The May 2018 exam can be viewed at
 MANAGEMENT CASE STUDY May 2018 EXAM ANSWERS Variant 2 The May 2018 exam can be viewed at https://connect.cimaglobal.com/system/files/resource/mcs%20vari ant%202%20qs%20may%202018.pdf Section 1 Direct customer
Operation and supply chain management Prof. G. Srinivasan Department of Management Studies Indian Institute of Technology Madras
 Operation and supply chain management Prof. G. Srinivasan Department of Management Studies Indian Institute of Technology Madras Lecture - 37 Transportation and Distribution Models In this lecture, we
China s Changing Economic Growth Modes in Historical Perspective
 Chapter 1 China s Changing Economic Growth Modes in Historical Perspective Liu Wei and Cai Zhizhou School of Economics, Peking University, Beijing, PRC China has kept a long-term rapid economic growth
Summary of Impacts on Transit Ridership, The Transit Industry, Related Industries, and Energy Consumption
 Chapter IX Summary of Impacts on Transit Ridership, The Transit Industry, Related Industries, and Energy Consumption INTRODUCTION Chapter VIII reviewed the impact of various transit incentive and auto
Failure to Act. Of current Investment Trends in. Airports, Inland Waterways, and Marine Ports. Infrastructure EXECUTIVE SUMMARY
 Failure to Act The economic impact Of current Investment Trends in Airports, Inland Waterways, and Marine Ports Infrastructure EXECUTIVE SUMMARY EXECUTIVE SUMMARY Air and waterborne transportation infrastructure
Transportation Trends
 Transportation Trends Revenue: $544.4 billion in gross freight revenues (primary shipments only) from trucking, representing 81.9% of the nation s freight bill in 2009. Tonnage: 8.8 billion tons of freight
Railroads - The Economy and Trade National Coal Transportation Association Denver, Colorado September 19, 2017
 Railroads - The Economy and Trade 2017 National Coal Transportation Association Denver, Colorado September 19, 2017 Railroads and the Economy 2017 SLIDE 2 Coal: 365,806 (14.1%) Railroads Help Keep Coal-
Arkansas Transportation Report
 Arkansas Transportation Report January 2018 Arkansas River traffic up 3% in 2017 Despite a slow start in the spring, barge activity on the Arkansas River in 2017 reached its second-highest total in the
1. Reasons for Recommendation
 Recommendation: BUY Target Stock Price (12/31/2015): $148 1. Reasons for Recommendation Union Pacific Corporation will continue to lead the railroad industry in the years to come with continuous expansion
BUSINESS-AS-USUAL INDUSTRIAL DEMAND
 APEC Energy Demand and Supply Outlook 5th Edition 6 INDUSTRIAL SECTOR ENERGY DEMAND BUSINESS-AS-USUAL INDUSTRIAL DEMAND The APEC region s total industrial energy demand in a business-as-usual (BAU) scenario
The Impact of Logistics Costs on the Economic Development: The Case of Thailand
 The Impact of Logistics Costs on the Economic Development: The Case of Thailand Liu Xianghui, International School, Associate Dean Huaqiao University, PRC Abstract Thai economy has been suffering from
Microsoft Azure: CSP SCE and Pay As You Go Customer Behavior Analysis
 Microsoft Azure: CSP SCE and Pay As You Go Customer Behavior Analysis Patrick O Leary Microsoft Practice Leader, Softchoice Patrick.Oleary@softchoice.com +1 610-914-5265 Connect with us today. 1.800.268.7638
TERM Transport prices (real change in passenger and freight transport prices by mode)
") Indicator fact sheet TERM 2005 20 Transport prices (real change in passenger and freight transport prices by mode) Indicator code / ID Analysis made on (Assessment date) 18 October 2005 EEA contact /fact
Indicator fact sheet TERM 2005 20 Transport prices (real change in passenger and freight transport prices by mode) Indicator code / ID Analysis made on (Assessment date) 18 October 2005 EEA contact /fact
EXPLORING THE POTENTIAL FOR ENERGY EFFICIENCY IN TURKEY SIMONE TAGLIAPIETRA SENIOR RESEARCHER, FONDAZIONE ENI ENRICO MATTEI
 EXPLORING THE POTENTIAL FOR ENERGY EFFICIENCY IN TURKEY SIMONE TAGLIAPIETRA SENIOR RESEARCHER, FONDAZIONE ENI ENRICO MATTEI Energy efficiency is one of the key crossroads between energy, climate and economic
Bruce Lambert Presentation to LSU Capstone Class, Spring 09
 Bruce Lambert Presentation to LSU Capstone Class, Spring 09 My Background ITTS 07-Present Policy and Planning Studies for Regional Freight Transportation Improvements USACE (04-07) Waterway Planning and
SECTOR ASSESSMENT (SUMMARY): TRANSPORT, AND INFORMATION AND COMMUNICATION TECHNOLOGY. 1. Sector Performance, Problems, and Opportunities
: TRANSPORT, AND INFORMATION AND COMMUNICATION TECHNOLOGY. 1. Sector Performance, Problems, and Opportunities") Anhui Intermodal Sustainable Transport Project (RRP PRC 45021-002) SECTOR ASSESSMENT (SUMMARY): TRANSPORT, AND INFORMATION AND COMMUNICATION TECHNOLOGY 1. Sector Performance, Problems, and Opportunities
Anhui Intermodal Sustainable Transport Project (RRP PRC 45021-002) SECTOR ASSESSMENT (SUMMARY): TRANSPORT, AND INFORMATION AND COMMUNICATION TECHNOLOGY 1. Sector Performance, Problems, and Opportunities
Environmentally Harmful Subsidies in the Transport Sector
 Environmentally Harmful Subsidies in the Transport Sector Presentation at the Green Budget Europe conference 28 February 2011, Brussels By Nils Axel Braathen OECD, Environment Directorate 1 Background
Highway Motor Transportation. Concentrate On Commercial Motor Vehicles (CMV) Trucks Busses
 Trucks Busses") Highway Motor Transportation Concentrate On Commercial Motor Vehicles (CMV) Trucks Busses History 1913 Lincoln Highway 1916 1 st Federal Aid Legislation 1919 Army Convoy took 62 days 1921 2 nd Federal
Highway Motor Transportation Concentrate On Commercial Motor Vehicles (CMV) Trucks Busses History 1913 Lincoln Highway 1916 1 st Federal Aid Legislation 1919 Army Convoy took 62 days 1921 2 nd Federal
Speaking Notes. I am going to give you a quick overview of what we have achieved. Modernization
 Speaking Notes Montreal, May 28, 2013 MARC LALIBERTÉ, PRESIDENT AND CHIEF EXECUTIVE OFFICER VIA RAIL CANADA DELIVERED IN MONTRÉAL 2013 ANNUAL PUBLIC MEETING CHECK AGAINST DELIVERY As Mr. Smith said, 2012
The Indian Digital Traveler Research. November 2017
 The Indian Digital Traveler Research November 2017 Introduction CEO foreword Travelport s Global Traveler survey is rich with insights and stories about the modern traveler. The findings demonstrate the
Rail Intermodal Keeps America Moving
 Rail Intermodal Keeps America Moving Association of American railroads March 2018 Summary Rail intermodal the movement of shipping containers and truck trailers on railroad flat cars has been growing rapidly
Chapter 11 Industry and Manufacturing
 AP Human Geography Chapter 11 Industry and Manufacturing Key Issues Where is industry distributed? Why are situation and site factors important? Why does industry cause pollution? Why are situation and
COPPER FOR BUSBARS CHAPTER 3: LIFE CYCLE COSTING
 European Copper Institute COPPER FOR BUSBARS CHAPTER 3: LIFE CYCLE COSTING David Chapman August 2011 ECI Available from www.leonardo-energy.org Document Issue Control Sheet Document Title: Publication