The Pennsylvania State University. The Graduate School. College of Engineering MODIFICATION OF THE ORDER PICKING AND REPLENISHMENT POLICY IN A
|
|
|
- Hilda Barton
- 6 years ago
- Views:
Transcription
1 The Pennsylvania State University The Graduate School College of Engineering MODIFICATION OF THE ORDER PICKING AND REPLENISHMENT POLICY IN A DISTRIBUTION CENTER A Thesis in Industrial Engineering and Operations Research by Anita Latumena 2011 Anita Latumena Submitted in Partial Fulfillment of the Requirements for the Degree of Master of Science May 2011
2 ii The thesis of Anita Latumena was reviewed and approved* by the following: Deborah J. Medeiros Associate Professor of Industrial Engineering Thesis Adviser Terry P. Harrison Professor of Supply Chain and Information Systems Paul Griffin Professor of Industrial Engineering Peter and Angela Dal Pezzo Department Head Chair * Signatures are on file in the Graduate School
3 iii ABSTRACT As the global standard to fulfill orders is now expected to be within a 24 hour period, distribution centers have become an important part in the supply chain in order for businesses to stay competitive. A distribution center is important because it is a point where products are consolidated to serve ever-changing customer demand faster and efficiently. The goal of this thesis is to improve productivity by studying and suggesting alternatives to the two most timeconsuming activities in a distribution center: order picking and replenishment. The warehouse studied in this paper is a regional distribution center which fulfills orders for laboratory supplies from industries and universities within the United States. In the forward area of the distribution center, customer orders are picked one at a time and replenishments are done concurrently with the order picking. Replenishment sources sometimes are located on a productive or reachable area instead of on the top of the racks. Hence, in the current replenishment procedure, a picker replenishes from a productive area to another productive area, which is inefficient. To improve productivity, the order picking process is modified to batched order picking process and replenishment operation is modified by assigning direct picking from productive replenishment sources. The existing and modified systems are modeled using simulation to estimate the total pick times. The total pick times are compared using two-way ANOVA to identify the effects of the modifications on the two factors, the order picking process and replenishment operation, to the total pick time. The statistical analysis shows significant improvements of the total pick time when these two factors are altered. Based on the analysis, the greatest reduction on the total pick time is achieved when both the order picking process and replenishment operation are modified to batched picking process and direct picking from replenishment.
4 iv TABLE OF CONTENTS LIST OF FIGURES... vii LIST OF TABLES... viii ACKNOWLEDGMENT... ix Chapter 1: INTRODUCTION Introduction Thesis Overview... 2 Chapter 2: LITERATURE REVIEW Introduction Distribution Center Types Storage Strategy Dedicated Vs. Shared Class-Based Storage Forward Vs. Reserve Slotting Order Picking Policies Single Order Batch Order Pick Path Optimization Zone Picking Wave Vs. Waveless Picking Replenishment Operations Replenishment Type Replenishment Strategy Summary... 14
5 v Chapter 3: METHODOLOGY Introduction Problem Description Distribution Center Layout Types of Customer Orders, WMS, and Slotting Software Picking Operations Replenishment Operations Problem Objective and Assumptions Data and Data Analysis Pick Time Put-Away Time Retrieve-Tote Time Push-To-Conveyor Time Delay Time Pick List Simulation Model Layout Pick Logic Pick Data Modeling of Existing and Alternative Systems Replenishment Vs. Picking from Replenishment Directly Single Order Picking Vs. Batched Order Picking Summary Chapter 4: EXPERIMENTATION AND RESULTS Introduction Experimentation Results Total Pick Time Comparison of Alternatives Effects of the Two Policies Summary Chapter 5: CONCLUSION Introduction Conclusion Total Pick Time Reduction Recommendation Future Research Opportunities... 50
6 vi BIBLIOGRAPHY APPENDIX A SIMULATION MODEL CODING APPENDIX B DATA SETS APPENDIX C SIMULATION RESULTS APPENDIX D TIME STUDIES... 70
7 vii LIST OF FIGURES Figure 3.1 Zone, Aisles, and Rack Configuration Figure 3.2 Histogram of Total Scan and Pick Times Figure 3.3 Probability Plot of Total Scan and Pick Times Figure 3.4 Probability Plot of Put-Away Time Figure 3.5 Probability Plot of Retrieving-Tote Time Figure 3.6 Probability Plot of Push-to-Conveyor Time Figure 3.7 Probability Plot of Delay Time Figure 3.8 Simulation Layout Figure 3.9 Pick Logic of the Simulation Process Figure 3.10 Pick Data for No Replenishment Needed Vs. Replenishment Figure 3.11 Pick Data for No Replenishment Needed Vs. Pick Directly from Replenishment Figure 3.12 Pick Data for Single Vs. Batched Order Picking Figure 4.1 Tukey s 95% Confidence Interval Figure 4.2 Residual Plots for Total Pick Time Figure 4.3 Residuals Normal Probability Plot Figure 4.4 Two-Way ANOVA of Total Pick Time vs. Picking and Replenishment Figure 4.5 Interaction Plot between Factors... 45
8 viii LIST OF TABLES Table 3.1 Pick List Table 3.2 Pick Data for Unbatched Order without Replenishment Table 4.1 Test Cases Table 4.2 Estimated Total Pick Time 95 % Confidence Interval in Minutes Table B.1 Pick Data for Base Case Table B.2 Pick Data for Case Table B.3 Pick Data for Case Table B.4 Pick Data for Case Table C.1 Total Pick Time Table D.1 Scan and Pick Times Table D.2 Put Away Times Table D.3 Retrieve-Tote Times Table D.4 Push-To-Conveyor Times Table D.5 Delay Times... 74
9 ix ACKNOWLEDGMENT I would like to thank God for leading me to meet so many wonderful people. I would like to thank Dr. Medeiros for being a super great advisor and for being patient with me. She always answers all my questions and doubts. I dedicated this thesis for my parents, Wiria and Thressia. They created opportunity for me to go to college and inspired me to take Industrial Engineering as my major. I thank Mark and my sisters, Monica and Melanie, for all your love and support. I also thank my brother-in-laws, Awie and Keith, for proof-reading this thesis.
10 1 Chapter 1: INTRODUCTION 1.1 Introduction As industries grow in a competitive world, optimization of distribution centers in the supply chain becomes important. Distribution centers are critical because they process orders and redistribute products to retailers, wholesalers, and consumers. In today's lean era, to stay competitive, distribution centers are not only expected to process orders correctly, but are also expected to accommodate fluctuations in demand faster and more efficiently. This situation forces distribution centers to continuously improve to become leaner, more flexible, and responsive. Approaches to improving a distribution center include technology updates, layout, picking optimization, and other optimization on the warehouse activities. Before deciding on a strategy, observation of a distribution center s activities should be conducted to identify areas that can be improved. In this thesis, research on improving distribution center productivity is conducted by first studying an existing system and then identifying the problems to be addressed. The study of the existing system of the distribution center shows that the productivity in the distribution center can be optimized by minimizing the total travel time of the pickers. The total travel time can be minimized by modifying the two most important activities in the distribution center, order picking and replenishment operations.
11 2 1.2 Thesis Overview This thesis is organized in chapters by literature review, methodology, experimentation and results, and conclusion. In the literature review, previous studies on types of distribution centers, distribution center layouts, storage strategies, picking, and replenishment policies are discussed. Chapter three discusses an existing system, its problems, and suggestions for alternatives. Also in chapter three, simulation modeling for the existing and alternative systems is described. The data required for modeling the simulation are also presented. Chapter four, experimentation and results, presents the analysis of the results from the simulation. The results from existing and alternative systems are also compared. In chapter five, recommendations based on the analysis from chapter four are presented. Future research opportunities are also discussed.
12 3 Chapter 2: LITERATURE REVIEW 2.1 Introduction As the global standard to fulfill orders is now within a 24 hour period, distribution centers have become an important part in the supply chain for businesses to stay competitive (Gagliardi, 2008). A distribution center or warehouse is needed because it becomes a point where product is consolidated in order to serve ever-changing customer demand faster and more accurately (Bartholdi and Hackman, 2010). Unfortunately, managing distribution centers is expensive because they require labor, capital (land and storage and handling equipment) and information systems. (Bartholdi and Hackman, 2010, p. 5). In this chapter, previous studies on different types of distribution centers are reviewed. Studies on different types of storage policies, order picking, and replenishment operations are also assessed. 2.2 Distribution Center Types Bartholdi and Hackman (2010) explained that depending on customers, distribution centers can be categorized to several types. The types of distribution centers are as follows: Retail distribution centers, which supply retail stores such as Wal-Mart, etc.; Service parts distribution centers, which hold spare parts for expensive equipment; Catalog fulfillment distribution centers, which receive orders from phone, fax, or Internet;
13 4 3PL warehouses (a warehouse outsourced by the company), which could serve multiple companies; and Perishable warehouses, which carry products that have short shelf life such as food, vaccines, etc. In addition to the warehouse types listed above, there are also different policies for the activities within the warehouse. Storage planning, picking, and replenishment are the types of activities within the warehouse. These activities are important because they can impact the productivity of the warehouse (Bartholdi and Hackman, 2010). In the next section, various storage policies are explained. 2.3 Storage Strategy Bartholdi and Hackman (2010) explained that storage locations are expensive because they represent the rent, heating/air conditioning, and other costs to keep the space usable. Because space locations are expensive, policies are developed to utilize the space as efficiently as possible. The following are common policies that have been studied; some have been implemented in actual warehouses or distribution centers Dedicated Vs. Shared The two common types of storage strategies that are used in distribution centers are dedicated storage strategy and shared storage strategy. In dedicated storage strategy, Stock Keeping Units (SKUs) are placed in fixed locations. Bartholdi and Hackman (2010) have
14 5 proven that distribution centers with dedicated storage strategy, on average, utilize only 50% of the warehouse. An optimization approach was developed by Lee and Elsayed (2005) to find the optimal storage capacity for warehouses that use dedicated storage strategy. In a shared storage strategy, SKUs are not placed in one fixed location but are stored in more than one location. Bartholdi and Hackman (2010) have proven that in shared storage strategy, space utilization is higher than that of dedicated storage strategy. Detailed pros and cons of dedicated and shared storage policies were discussed more by Bartholdi and Hackman (2010) and also by Roll and Rosenblatt (1983). Bartholdi and Hackman (2010) explained that a combination of both storage strategies in a warehouse is possible. For example, certain SKUs that move faster can be stored in dedicated storages while slower moving SKUs can be assigned to shared storages Class-Based Storage In addition to dedicated and shared storage, class-based storage strategy can also be used in the warehouse. Class-based storage strategy is a strategy in which SKUs are stored in a fixed area or zone. But within that particular area or zone, SKUs are allocated randomly (Chan and Chan, 2011). ABC classification is used in grouping the products together in class-based storage (Chan and Chan, 2011; Rouwenhorst et al., 2000). ABC classification is a product classification where product A has outstanding importance, B has average importance, and C has relatively low importance. In an inventory control application, these products are grouped based on their annual sales volume (Arsham, 2011). Using this technique as a clustering rule in random storage policy, Chan and Chan (2011) mentioned that the fast moving products can be stored close to the depot while the flexibility
15 6 and high storage space utilization of random storage are applicable (p. 2687). Chan and Chan (2011) also suggested that ABC class-based storage will reduce total retrieval time in multi-level rack warehouses and will reduce travel distance in single-level rack warehouses. Further study on class-based storage was also performed by Liu (1999). Liu (1999) used clustering technique to group the items together so that the items within the group have a strong relation with each other rather than with those outside the group. Similar items were clustered by their demand sizes at a period of time and by the type of customers ordering the items. Liu (1999) found that travel distance of a picker in the distribution center is minimized by using the clustering rule and sorting while picking Forward Vs. Reserve Other than the previously mentioned storage policies, another common way to store SKUs is forward and reserve storage. In this storage strategy, the warehouse is divided into two sections, the forward and reserve areas. The forward area, which is also known as the primary or fast-pick area, is an area dedicated to products that are picked in less than pallet quantity. This is also known as bin pick (Bartholdi and Hackman, 2010; Gagliardi, 2008; Taljanovic and Salihbegovic, 2009). In this area, SKUs are stored in smaller sizes (cases or eaches) for easy access and are replenished from the reserve area (Rouwenhorst et al., 2000). The reserve area, also known as secondary, bulk, storage, or replenishment area, is an area for storing products in pallets or large quantity. The reserve area supplies the forward area and also supplies for bulk pick (Bartholdi and Hackman, 2010; Gagliardi, 2008; Taljanovic and Salihbegovic, 2009).
16 7 According to Bartholdi and Hackman (2010), separating the area into reserve and forward could incur benefits, such as "reduced pick costs and increased responsiveness to customer demand (p. 89). Bartholdi and Hackman (2010), Gu et al. (2010), and Van Den Berg et al. (1998) have addressed various methods to determine the optimal number of SKUs and their quantity to be put in the forward area in order to obtain the most benefit from the forwardreserve layout Slotting Slotting is a newer and more dynamic storage strategy. Slotting is a method of allocating products in the best place (Davey, 2009; Specter, 2009). The best place is a location which has high productivity, ergonomics, security, and quality (Chinnabhandar, 2006). From a productivity point of view, the most efficient place in a rack is the Golden Zone area (Bartholdi, 2008). The Golden Zone is the area within shelves at the height between the picker's waist and shoulders and was first introduced by Petersen et al. (2005). By using the Golden Zone area to identify the efficient placement, productivity can be increased significantly (Petersen et al., 2005). Slotting items based only on productivity is not enough. There can be restrictions so that some items cannot be stored next to each other. For example, in warehouse containing volatile substances, products may not be placed close to each other because of possible chemical reactions. (Chinnabhandar, 2006, para. 11). Therefore, with all aspects including productivity, ergonomics, security, and quality in mind, allocating spaces for products in optimal locations is a complex problem, especially with unstable demands. To identify the optimal slots faster, slotting software can be used.
17 8 There are many consulting companies that offer slotting optimization software (e.g., Manhattan Associates and Sedlak) (Davey, 2009; Chinnabhandar, 2006). Slotting software also helps to identify the optimal primary and reserve slots of the SKUs in the bin pick area. Implementing slotting to work along with a Warehouse Management System (WMS) is another example of a method to increase productivity in distribution centers (Davey, 2009). 2.4 Order Picking Policies In one single order, multiple items can be requested. Each different SKU in a single customer order is called an order line (Bartholdi and Hackman, 2010). Each line can have different sizes such as pallets, cases, or eaches. Because there are different sizes of customer orders, Bartholdi and Hackman (2010) explained that many warehouses separate their picking process to broken-case picking or bin picking and carton picking or bulk picking. Broken-case picking is the picking of SKUs which are requested in less-than-carton quantities. Bartholdi and Hackman (2010) explained that this type of picking requires a large expenditure of labor because pickers have to handle the smallest units of measure. The other type of picking is carton-picking. Carton-picking is the picking of SKUs in a full carton. Automation for this type of picking is possible because the cartons sometimes have similar sizes and are securely packed. According to Bartholdi and Hackman (2010), order picking composes about 55% of the operating costs in a warehouse. Because of this costly activity, many researchers have been working to improve picking policies in order to maximize productivity. A number of common methods to maximize productivity are introduced and explained.
18 Single Order The most common picking policy is the strict-order picking policy (Petersen and Aase, 2004). Strict-order picking policy is also known as single order picking policy or discrete picking policy. According to Petersen and Aase (2004), it is a policy where pickers complete a tour through the warehouse to pick all SKUs for a single order (p. 12). Strict-order picking is used mostly because it is simple, easy to implement, and reliable (Eisenstein, 2008). Eisenstein (2008) suggested that the picking cost using discrete picking policy can be reduced by placing depots (where pickers receive lists and deposit orders) at optimal locations and by choosing the correct technology for the depots. The technology types for the depot are no technology at all, conveyor technology, or conveyor and Radio Frequency (RF) technology. Eisenstein (2008) provided the optimal depot locations for each technology type used. Choosing the optimal type of technology, Eisenstein suggested, is dependent on the volume of the orders Batch Order Although the strict-order picking policy is simple and easy to implement, another picking policy called batch picking offers many advantages over strict-order picking policy. In batch picking, groups of different orders are picked at the same time to reduce the number of trips to the same product bin. Bartholdi and Hackman (2010), De Kostner et al. (1999), Gibson and Sharp (1992), and Petersen and Aase (2004) have shown that this policy can greatly reduce traveling time. However, even though batch picking can minimize traveling time, Petersen and Aase (2004) concluded that if a picker is combining too many orders in the same cart, it may lead to a significant increase in sorting time once all the items are picked.
19 Pick Path Optimization Other improvements in batch picking were researched by Gademann et al. (2001). Based on their research, the branch and bound algorithm can compute the optimal combination of orders and batches which leads to minimum traveling and picking time. Using this algorithm, the optimal number of orders per batch from a total of 24 orders can be solved in less than one minute with a personal computer. Another method of batch picking improvement was introduced by Tsai (2008). He incorporated a genetic algorithm into batching strategy and routing methods. Using his method, the batch and route are optimized by looking at traveling costs and the penalties for earliness and lateness. Genetic and traveling salesperson algorithms were used to search for the most effective travel path for batch by minimizing travel distance (Tsai et al., 2008, p. 6540). Tsai et al. (2008) also mentioned that the larger the population size, the more CPU time is needed Zone Picking Another type of picking strategy is zone picking. In zone picking, the warehouse is divided into several different zones and pickers are assigned to a specific zone in the warehouse (Gagliardi, 2008; Petersen, 2002). The warehouse can have different configurations of zones and by changing zone layout, productivity can be improved. Ho et al. (2007) studied a total of eight different geometric layouts of zone-picking warehouses. They used the clustering technique to divide the warehouse into zones, and they found that the total travel distance can be improved if the zone division is applied appropriately. Petersen (2002) further studied zone picking by analyzing the aisle configuration within the zone itself. He analyzed the zone configuration using class- or volume-based strategy. In his
20 11 paper, he specifically studied the forward picking area, which uses both random and dedicated storage policies. He concluded that choosing appropriate zone configuration can reduce the travel time greatly. However, to select the proper zone configuration, one must keep in mind that zone configuration is affected by storage capacity, number of pick list items, and storage policy. Tompkins and Harmelink (1994) further categorized zone picking into sequential zone, batch zone, and wave picking. In sequential zone, the picker only picks a single order and puts items into a bin that travels through the conveyor. In batch zone, several orders are batched together and the picker can pick several items at a time within the zone that she/he is assigned to. If there are items from different zones in the orders, then another picker from a different zone is responsible for it. Overall, zone picking is commonly used and is proven to reduce the response time from the warehouse to the customer (Petersen, 2000) Wave Vs. Waveless Picking In wave picking, orders are received, grouped, and released together in a list to achieve efficient picking route and balanced flow (Taljanovic and Salihbegovic, 2009). To be more advanced, wave picking can be combined with WMS and RF technology (Real-time logistics, 1996). WMS has the ability to sort order list and schedule replenishment (Taljanovic and Salihbegovic, 2009), and RF technology can direct wave picking with a hand held display of the next order for the picker (Real-time logistics, 1996). Another improvement of wave picking was also researched by Owyong and Yih (2006) where waves overlap each other to reduce idle time of the picker at the end of waves.
21 12 An alternative to wave picking is waveless picking. Waveless picking, or continuous flow picking, is when orders are not batched together but rather processed right away. The orders are usually ranked based on the shipping dates. In waveless picking, each picker receives a pick list which is continuously updated as he/she travels with a fixed direction (Gallien and Weber, 2008). Waveless picking also involves a labor balancing tool that calculates the expected completion picking time of each zone. This policy will direct pickers to other zones when a zone has a certain higher or lower completion time than the average. Waveless picking can counter some disadvantages of wave picking, such as inefficiency between waves, by eliminating the picker s idle time between waves and allowing priority orders to be processed right away without delay (Gallien and Weber, 2008). Hinojosa (2006) also mentioned that companies that have implemented waveless picking increased their productivity and throughput capacity. Gallien and Weber (2008) mentioned that Industry commentators have also described waveless picking as an application to warehouses of lean manufacturing principles, because of the lot size reduction it entails (p. 6). 2.5 Replenishment Operations Replenishment operation is one of the more expensive activities in warehousing not only because of the labor needed to pick items from the bulk area but also because of the labor needed to set items up in the fast or bin pick area (Bartholdi and Hackman, 2010; Rouwenhorst et al., 2000).
22 Replenishment Type Different types of replenishment operations have been discussed in Bartholdi and Hackman (2010). In a multi-level rack warehouse, replenishment is performed by moving items from the bulk area to the top rack of the shelves in bin pick areas and then from the top rack to the bottom rack. Another type of replenishment is shelf replenishment, where items are moved from bulk areas and inserted into the shelves from the back side Replenishment Strategy Bartholdi and Hackman (2010) explained that replenishment and picking should be done at different times (e.g., at the end of a wave or during additional shifts on different days). By picking and replenishing at different times, picking activities are not interrupted by replenishing activities. Van Den Berg et al. (1998) explained that in a part-to-picker or picker-to-part warehouse, reducing the number of replenishments during a busy period and increasing the number of replenishments during an idle period can increase the productivity and reduce accidents and congestion. In a forward-reserve warehouse, Van Den Berg et al. (1998) divided the timing of the replenishment into two: advance and concurrent replenishment. Advance replenishment is the replenishment during the idle period (beginning of the day or weekends). Concurrent replenishment is the replenishment during the busy or picking period. Van Den Berg et al. (1998) addressed the problem of deciding the quantities of which products should be allocated in the forward area. Van Den Berg et al. (1998) had the objective of minimizing the expected amount of labor-time during a picking period corresponding to order-picking and performing concurrent replenishments (p. 100). Van Den Berg et al. (1998)
23 14 found the feasible optimal number of unit loads to be stored by constraining concurrent replenishment using the Greedy Knapsack Heuristic. Gagliardi (2008) also optimized the allocation of SKUs in the bin pick area and created several replenishment heuristics. Gagliardi (2008) had the objective of minimizing the number of stockouts in the warehouse instead of minimizing labor time. In his research, Gagliardi (2008) used different replenishment heuristics for both concurrent and advance replenishment. The first replenishment heuristic is to choose SKUs that have highest order frequency. The second is to choose the SKUs that have high weekly demand. The third replenishment heuristic is to choose SKUs that are appearing in the incoming picking list. The last heuristic is to choose the SKUs that will have stockouts. Gagliardi (2008) found that using his own allocation and replenishment heuristics, he reduced the number of stockouts by 70% in a pick-to-belt warehouse with dedicated personnel assigned to replenishment tasks. 2.6 Summary Picking policies are crucial to picking time and they depend on the storage and replenishment policies that warehouses use. Many of the picking policies are too complex and difficult to convey (Gademan et al., 2001; Tsai et al., 2008), while some are simple enough and have been shown to greatly reduce the traveling time (Petersen and Aase, 2004). The objective of this paper is to optimize productivity by minimizing travel time in the forward (bin) picking area in the multi-level rack distribution center, which uses WMS and RF technology. The distribution center that is studied also has a class-based storage strategy and wave picking policy. Further details are disused in the next chapter.
24 15 Chapter 3: METHODOLOGY 3.1 Introduction The objective of this thesis is to increase productivity by reducing the total pick time. To reduce the total pick time, the picking and replenishment operation in the existing system must be studied. After that, modifications for improvements are suggested. Finally, using a simulation model, the modifications are evaluated. To achieve the objective, the current distribution center s layout, WMS, slotting software, and the existing procedures for picking and replenishment are described. After describing the current situation of the distribution center, this chapter continues by explaining the simulation model that is built to evaluate the suggested modifications. 3.2 Problem Description The warehouse studied in this research is a regional distribution center for laboratory supplies. It ships orders to industries and universities within its region and to distribution centers in other regions. The warehouse operates seven days a week, 16 hours per day. Each day has seven waves. Within the distribution center there is a bulk pick area and a forward pick area. The forward pick area consists of 19 zones of shelves. Order pickers are assigned to one or more zones and pick one order at a time into a tote. The totes are placed on a conveyor and sent to an order consolidation area. In this section, the warehouse layout, WMS and slotting software, picking and replenishment operation, and the problem from an existing distribution center are discussed.
25 Distribution Center Layout The existing distribution center has a zone-based warehouse type where the warehouse is divided into several zones. Each zone has several aisles as can be seen in Figure 3.1 below. One picker is assigned to every zone. The picker is responsible for picking all items requested from that zone. The aisles are coded alphabetically from left to right. On every aisle, there are four major sections called bays. All bays on the left side of every aisle are coded using odd numbers and all bays on the right side of every aisle are coded with even numbers. On one side of the zone, the conveyor belt is presented so that the items that are picked may go to the packing department. The side of the aisle that is facing the conveyor is called the front of the aisle. Figure 3.1 shows the complete zone and aisle configuration. Totes are used for storing the picked items. They are available in front of every aisle. Carts are also available for pickers if the items are too big to be stored in the totes.

26 17 Figure 3.1 Zone, Aisles, and Rack Configuration The aisles consist of several racks. The rack configuration can also be seen in Figure 3.1 above (Rack; Side View). The rack typically has five levels: level A, B, C, D, and R. Level C is the Golden Zone area. Like level C, level A, B, and D are also in the reachable area. Level R is the replenishment area, or the top rack area. This area is not reachable without a stool or stair. The reachable area is also known as the primary area, and replenishment area is also known as the secondary area.
27 Types of Customer Orders, WMS, and Slotting Software There are two types of customer orders: single-line orders and multi-line orders. A single-line order is a customer order which consists of only one type of SKU. The multi-line order is a customer order which consists of several different types of SKUs. The WMS is responsible for scheduling order picking and concurrent replenishment. The schedule for picking and replenishment is also known as the pick list. The pick list is released to pickers via radio frequency on the beginning of every wave. Pickers receive the pick and replenishment schedule from the RF terminal that is attached to each picker s hand. Before sending the pick list to pickers, the WMS sorts the pick list to minimize the traveling time. There are two major sorting levels. At the first level, the WMS sorts the pick list by the type of the customer orders. After sorting the pick list, it is divided into two sections; the first section consists of the multi-line orders and the last section consists of the single-line orders. In the pick list of the distribution center that is being studied, roughly 70% are multi-line orders. The multi-line orders are processed before the single-line orders. This is done because the multiline orders take longer time to process than the single-line orders. After sorting by the customer order types, the WMS then sorts the pick list by the locations of SKUs. Because of the second level of sorting, the lines within each multi-line order are sorted so that pickers travel from the first aisle to the last aisle. For the single-line order section, all lines from all the single-line orders are sorted by location from the first to the last aisle. Once the pick list is sorted, then the WMS sends it to pickers. In addition to the WMS, the distribution center utilizes slotting software. The slotting software is responsible for assigning areas or slots on the racks for SKUs so that the productivity can be maximized. Based on the slotting software, a SKU can be stored in several slots and the
28 19 slots can be in any level on the rack; for example, a SKU might have slots in A, C, and R level. The WMS currently can only schedule one primary area to every SKU for picking location but it can schedule multiple secondary areas to SKUs for replenishment sources. Hence, of all the slots that are assigned to a SKU by the slotting software, only one slot can be assigned as the primary location by the WMS for picking. The other slots can only be stored as the secondary location for replenishment by the WMS. Because of this limitation, slots in level A, B, or D sometimes are assigned as the replenishment sources, thus creating inefficiencies. Further explanation of the problem will be discussed in section Picking Operations In the distribution center, pickers pick items based on the sorted pick list from the WMS. The existing picking policy in the distribution center is the single order picking policy, where pickers process one order at a time regardless of the number of lines in the order. The steps to picking process are as follows: 1. The picker starts from a point in front of the conveyor to take one empty tote 2. The picker travels the aisles to pick the customer order and puts the items into the tote as he/she picks. There are carts available for the pickers if the items are too large for the totes 3. Once the picker is finished picking one multi-line or single-line order, the picker goes back to the nearest point of the conveyor to put the product on the conveyor to be transferred to the packing department. 4. Picker repeats step one to three
29 Replenishment Operations The WMS sometimes schedules concurrent replenishments within the zone in the forward area. This replenishment is different from the replenishment from the bulk area to the forward area. To be clear, all different types of replenishment are discussed below. There are four different types of replenishment operations in the distribution center. The first replenishment type is the replenishment from the vendor to the reserve or bulk area. The second replenishment type is the replenishment within the bulk area itself (from the top to the bottom of the rack). The third replenishment type is the replenishment from the bulk to the forward area. The fourth replenishment type is the replenishment within the forward area itself. The replenishment operation that this paper focuses on is the fourth type, which is the replenishment within the zone in the forward area (from the top to the bottom of the rack). The timing of each type of replenishment is different. The third replenishment type is conducted at the beginning and at the end of the wave. The fourth replenishment type is performed concurrently with order picking or within the wave. The steps to complete the fourth replenishment type are as follows: 1. The picker picks items from the secondary area. While picking items to be put away, totes are not involved but a cart may or may not be involved depending on the size of the items 2. The picker puts the item away into the primary area 3. The picker picks from the primary area and puts items in the tote During concurrent replenishment operation, pickers are given the privilege to reject the replenishment tasks scheduled by the WMS. They are given this privilege for many reasons.
30 21 For example, the picker may need help to pick products on the top of a rack that are heavier than expected (rarely happens), the stairs may be missing, or barcodes on the racks may be missing. When pickers reject a replenishment task, the order will not be processed until a supervisor is involved to investigate and fix the problem Problem Pickers follow the replenishment routine given by the WMS even when the secondary areas are reachable areas (not R level). Some argue that it takes more time to pick an order if they have to replenish items first from level A, B, or D to level C because level A, B, and D are reachable and still are productive areas. As the result, pickers use the privilege to reject the replenishment tasks, wait for the supervisors to switch the primary and secondary location of the SKU, and wait for the WMS to automatically schedule a new pick directly from the secondary location of the SKU. This way, the pickers do not have to do the replenishment. Once the pick task is complete, supervisors have to switch the location of the primary and secondary of the SKU back to the original. Replenishment rejection and slots switching in the WMS are the causes of inefficiencies in the distribution center. Replenishment rejection causes longer pick time and utilizes extra supervisors time for unnecessary slot changes. Slots switching can confuse the inventory control if supervisors forget to switch the primary area back to original. Some pickers follow the existing replenishment schedules from the WMS while others reject the replenishments and pass the responsibility to the supervisors. In addition to the inefficiencies due to the replenishment rejection, there is also inefficiency that is caused by the existing order picking procedure. Currently, the pickers are
31 22 scheduled to pick one order at a time because that is how the pick list is set up. The items are sorted per order in the pick list. Therefore, to pick every multi-line order, the picker has to backtrack to the beginning of the zone most of the time. The inefficiency of this policy results in extra travel distance every time the picker starts picking a new multi-line order. 3.3 Objective and Assumptions The objective of this research is to increase the productivity of the distribution center by studying the existing replenishment and order picking system, suggesting improvements to the existing method, and evaluating alternatives using simulation. The replenishment operation is modified by scheduling the picker to directly pick, instead of replenishing, from the reachable secondary areas. The order picking is modified by incorporating the batching technique. The batching technique is suitable to improve the travel time as already shown and proven by Bartholdi and Hackman (2010), De Kostner et al. (1999), Gibson and Sharp (1992), and Petersen and Aase (2004). In this paper, two orders are batched together. Instead of sorting the lines per order, the lines are sorted per two orders. The number of orders to be batched is chosen to be two because it is not too many to confuse the picker when he/she is sorting. The simulation model is discussed in the next section. The simulation model uses only one particular zone in the distribution center. The results of the simulation and the improvements from the modified systems are analyzed in chapter 4. below: There are several assumptions made for the simulation model. The assumptions are listed
32 23 The front of the aisles is the side of the aisles which are facing the conveyor. The back of the aisles is the side of the aisles where there is a walking path shared with another zone. The back of the aisles does not have conveyor. During the wave, replenishment from the bulk to the forward area is not necessary because these replenishments are already performed at the beginning and end of each wave. The slotting software is assumed to slot SKUs and their quantity optimally in the forward area. The pickers are assumed to be experienced and familiar with the aisle configuration. The pickers know where to exit the aisle (front or back) in order to reach the next destination with the shortest distance. The speed for walking straight or turning is constant. The acceleration and deceleration are ignored because the total picking time is the focus instead of the detailed time. The picker starts from the middle of the zone in front of the aisles. Totes are always available in front of each aisle. The picker is assumed to stop in the same place to take items which are located on either odd or even bays that are facing each other within aisles; for example bay 1 and bay 2 in aisle Data and Data Analysis This section explains all the data needed for building a valid simulation model. The required data include the travel, pick, put-away, retrieve-tote, push-to-conveyor, and delay times.

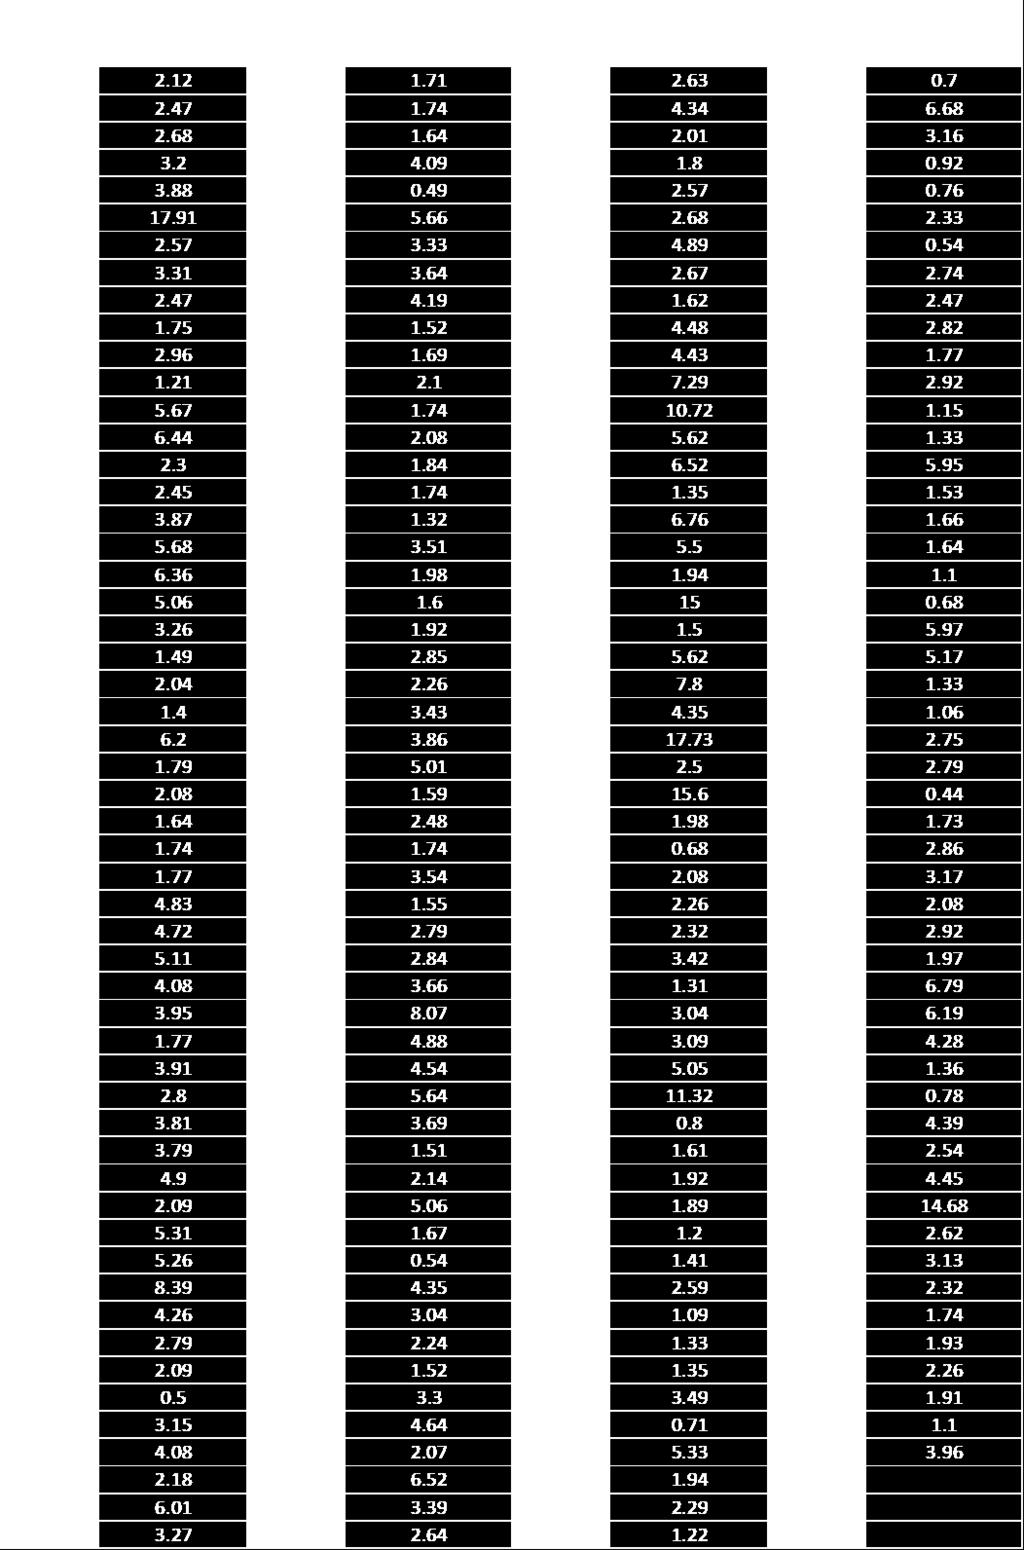
33 24 Data are obtained from time studies previously performed in the distribution center. For the travel time, the picker has a standard time of four feet per second. This standard time is used in the simulation as the picker s speed Pick Time In the pick time, there are other times included, such as scan and confirming-quantity time. There are 243 pick time data that were gathered from bin-picking activities. The data can be seen in Appendix D, Table D.1. The quantities and location (aisles, bays, and rack levels) of items picked are varied. To obtain the distribution of the pick time for the simulation, the pick time data is fitted to a lognormal distribution. The histogram of the data was constructed using Minitab and is seen in Figure 3.2 below. Figure 3.2 Histogram of Total Scan and Pick Times

34 25 Figure 3.3 Probability Plot of Total Scan and Pick Times Figure 3.3, the lognormal probability plot, shows that the p-value is greater than When the p-value is greater than 0.05, we fail to reject the null hypothesis which states that the data is lognormal with 95% confidence level. The mean and the standard deviation obtained from the log total pick times that were used in the simulation are seconds and seconds respectively Put-Away Time In the put-away time, the time to scan the product and the location are also included. There are 27 data points for put-away time that were obtained from observations made on putaway activities in various locations with different quantities in the bin pick area. The data can be seen in Appendix D, Table D.2. The data points then are fitted into lognormal distribution.
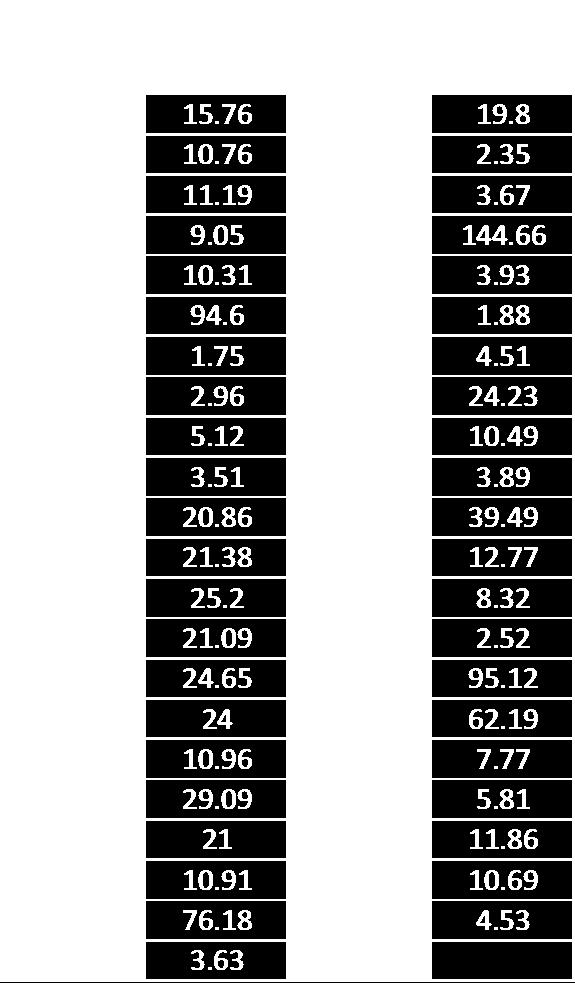
35 26 Figure 3.4 Probability Plot of Put-Away Time The probability plot in Figure 3.4 above shows that the p-value is greater than Hence, it can be concluded that the data is lognormal with 95% confidence level. The lognormal distribution is used in the simulation for the time to put away the item to the rack with mean and standard deviation of the log time of seconds and seconds respectively Retrieve-Tote Time There are 213 data points for pure retrieve-tote time that were obtained from observations made on retrieving tote activities in the bin pick area. Data can be seen in Appendix D, Table D.3. The data points then are fitted into a lognormal distribution. The probability plot in Figure 3.5 below shows that the p-value is greater than Hence, it can be concluded that the data is lognormal with 95% confidence level. The lognormal distribution is used in the simulation for the time to retrieve the tote with mean and standard deviation of the log time of seconds and seconds respectively.

36 27 Figure 3.5 Probability Plot of Retrieving-Tote Time Push-To-Conveyor Time There are 145 data points for push-to-conveyor time from the time study. Data can be seen in Appendix D, Table D.4. The data points are fitted into lognormal distribution. The probability plot in Figure 3.6 below shows that the p-value is greater than Hence, it can be concluded that the data is lognormal with 95% confidence level. The lognormal distribution is used in the simulation for the time to push the tote to the conveyor with mean and standard deviation of the log time of seconds and seconds respectively.

37 28 Figure 3.6 Probability Plot of Push-to-Conveyor Time Delay Time The delay time includes time to retrieve Styrofoam, clean up the station, deal with a supervisor s interruptions, un-jam the conveyor belt, etc. There are 43 data points for delay time that were obtained from observations made in the bin pick area. Data can be seen in Appendix D, Table D.5. The data points are fitted into a lognormal distribution. The probability plot in Figure 3.7 below shows that the p-value is greater than Hence, it can be concluded that the data is lognormal with 95% confidence level. The lognormal distribution is used in the simulation for the delay time with mean and standard deviation of the log time of seconds and seconds respectively.

38 29 Figure 3.7 Probability Plot of Delay Time Pick List The actual history of the pick list from a specific date and wave, which is representing two hours of picking, is used to schedule tasks for the pickers. The actual pick list is used because it makes the simulation reflect the real system accurately. In this particular pick list, there are about 112 orders with a total of 150 lines in the pick list. The pick list consists of 127 unique SKUs. Each SKU has its own primary and secondary slots. Within the pick list, about 13 different SKUs have a secondary area in a reachable area. The simulation schedules replenishment for those 13 SKUs. Table 3.1 below shows an example of an actual pick list from the WMS.
, drop off location (to locn), the date that the order comes")
39 30 Table 3.1 Pick List The pick list includes the type of task: replenishment or pick task. It also has the catalog number, the vendor catalog number, description of the SKU, unit of measurement, quantity, pick location (from locn), drop off location (to locn), the date that the order comes in, and finally the start and end time for documentation purpose. The start and end time are filled after the task is completed. 3.5 Simulation Model The simulation model was successfully created using AutoMod. The layout, logic, and the pick data for the simulation are explained below Layout The simulation s layout is made to be similar to the distribution center s layout. Figure 3.8 is the simulation layout of one particular zone in the warehouse. There is one load which represents the picker. There are 11 aisles in the zone and they are named path1, path1_1, etc. in the simulation. Path1 represents aisle A, path1_1 represents aisle B, etc. The bays that are facing each other within the aisles are represented by one node in the simulation because it is
40 31 assumed that the picker stops at the same point to access items on the facing bays. For example, bays one and two in aisle A are represented with the node A1, bays three and four in aisle A are represented with the node A3, etc. In the simulation, rack levels are not represented. Figure 3.8 Simulation Layout Pick Logic The picker is represented by a load that is mounted on a vehicle. The picker starts from the middle of the zone in front of aisles. The flow chart in Figure 3.9 shows the full logic of the simulation. The pick data is the modification of the pick list to ease the simulation coding. The pick data is detailed in section The simulation starts with a load that reads the pick data. The pick data contains codes to determine if the picker should pick, put away, or push the totes to the conveyor. If the picker reads a new customer s order, meaning that he/she is done picking one order, then the picker goes to the front of the aisles to put the totes on the conveyor. When the picker is done pushing the totes to the conveyor, he/she retrieves new totes for the next order. The picker is given time for any possible delays, such as picking up trash. After

41 32 that, the picker can start processing the next order. For the new order number, the picker starts picking or putting away items according to what the pick data instructs. If the order number is still the same as the previous one, the picker continues to pick items or put away items without going back to the conveyor. Figure 3.9 Pick Logic of the Simulation Process Pick Data The pick data is built to fit the simulation code and to fit different batching and replenishment policies for experimentation. Within the pick data, there are four columns (Table 3.2). The columns, from left to right, indicate the location of an item, order number, aisle


42 33 number, and code for pick or put-away task. The first column represents the aisle and the bay where the picker should go in the simulation. For example, in Table 3.2 below, pm.a3 is instructing the picker to go to the first aisle, bay three. The second column is the order number. The customer orders were coded numerically and sorted increasingly. The third column is the aisle number to show where the picker is currently located. This column is useful to instruct the picker to go to the conveyor after he/she is finished picking all the items in one order. The fourth column indicates if the task is a pick or a put away. Just like the pick list, pick data is sorted by the order number and then by the location of SKUs. For example, in Table 3.2 below, order number three is processed before order number four. Within order number three, items in B5 are picked before the item in H7. Table 3.2 Pick Data for Unbatched Order without Replenishment
43 Modeling of Existing and Alternative Systems This section shows how the pick data changes for alternative systems. There are two factors that are modified in the alternative systems. The two factors are the order picking and replenishment operations Replenishment Vs. Picking from Replenishment Directly The replenishment that is modeled in the simulation is strictly the fourth type, which is the replenishment within a zone in the forward area from a secondary to a primary slot. Because the third replenishment type, replenishment from bulk to the forward area, is done at the beginning and end of each wave, it is valid to assume that shortages within the forward area will not occur. Hence, the replenishment from bulk to forward area is not modeled in the simulation. To model the concurrent replenishment, the simulation code stays the same but the pick data is modified. For each SKU that needs to be replenished, there are two additional lines in the pick data. These two additional lines in the pick data are tasks for the picker in the simulation to transfer product from the secondary to the primary location before picking from the primary location. Figure 3.10 below shows how the pick data changes for the same SKU if the replenishment is scheduled.

44 35 Figure 3.10 Pick Data for No Replenishment Needed Vs. Replenishment The left side of Figure 3.10 shows the pick data if the primary of SKU x does not need replenishment. SKU x is directly picked from its primary location, at A3. The right side of Figure 3.10 shows picks data when replenishment is scheduled. Notice that there are two additional lines for SKU x before picking from the primary location. The two lines are used to schedule the transfer of product from secondary (B5) to primary location (A3) before SKU x is picked. The alternative to the replenishment operations is direct picking from the replenishment source. To model this alternative in the simulation, the pick data is modified so that the pick location is the secondary location. Figure 3.11 below shows how the pick data changes if direct picking from the secondary location or from the replenishment source is conducted. Figure 3.11 Pick Data for No Replenishment Needed Vs. Pick Directly from Replenishment
45 36 The left side shows if SKU x does not need replenishment and is scheduled to pick directly from its primary location at A3. On the right side, SKU x needs replenishment, but instead of performing the replenishment task by transferring product from secondary to primary location, a direct pick from the replenishment source, B5, is scheduled Single Order Picking Vs. Batched Order Picking For order picking, the existing system uses a single order picking policy where the picker goes back to the conveyor to transfer a product to the packing department after picking a single order, regardless the order size. In Figure 3.12 below, the left side is the pick data for system with the single order picking policy. In the single order picking pick data, there are two orders presented, orders three and four. First, the picker starts from his/her last point on the conveyor, and when the picker reads the new order, he/she starts the picking task by taking one empty tote and traveling to pick items. The picker starts picking from aisle B for SKU a and b and then to aisle H for SKU c. After the picker is finished picking order number three, the picker goes back to the conveyor to transfer the tote to the packing department. Then the picker takes one empty tote and goes back to aisle C to pick the next order and goes back to the conveyor again after he/she is done picking order number four. The alternative of the single order picking policy is the batched order picking policy. In this thesis, two consecutive orders are batched together for picking (for example, first and second orders are batched, third and fourth orders are batched, etc). In batched picking, two orders are treated as if they are one order. The grouping of two orders affect the sorting of the multi-line orders but does not affect the sorting of the single-line orders. The effect on the sorting can be seen in Figure 3.12 and is explained below.

46 37 Figure 3.12 Pick Data for Single Vs. Batched Order Picking The right side of Figure 3.12 is the pick data for batched order picking. Orders three and four are combined to a single order in the pick data of batched order picking. Because of this grouping, the pick data is sorted by the location per two orders instead of one. As the result of batching the orders, SKU c is picked last. This is because SKU c has the farthest aisle compared to all the SKUs from order number three and four. To process batched orders, the picker starts on her/his last point in front of the conveyor. The picker utilizes a cart to pick two empty totes. Then the picker travels through the aisles to pick items needed for the two orders batched. The WMS is assumed to have the ability to state the original order number of each line so that the picker can put the items to the corresponding totes. After the picker is finished picking two orders, then he/she goes back to the conveyor to transfer the two orders to the packing department.
47 Summary In this chapter, the existing warehouse layout, order types, WMS, slotting software, picking, and replenishment operations are explained. The problem with the existing procedures and how replenishment rejections and picking one order at a time can cause longer pick time are discussed. The objective of studying the current system, suggesting alternatives, and evaluating alternatives using simulation are also discussed. The data, layout, logic, and pick data for simulation are explained. In the next chapter, design of experiments and results are presented. Comparisons of total pick time from different cases are discussed.
48 39 Chapter 4: EXPERIMENTATION AND RESULTS 4.1 Introduction In this chapter, the design of the experiment is explained. The two factors that are the main leverages are the order batching and replenishment operation. To decide whether or not the two factors are significant to the total pick time, three different test cases are developed. The base and test cases are explained and the total pick times from all of the cases are estimated from the simulation and are analyzed using Tukey s method. After the combinations of the two factors are analyzed, the effect of each factor is analyzed using the Two-Way ANOVA. 4.2 Experimentation The two factors that are leveraged can be seen in Table 4.1 below. They are the order picking policy and replenishment operation. Based on these two factors, four combinations are constructed. The base case is the existing procedure in the distribution center where customer orders are not batched and the concurrent replenishment from the reachable area takes place. In the first case, orders are not batched and the concurrent replenishment from the reachable area is avoided. In this case, the picker directly picks from the reachable replenishment area rather than replenishes the item to the primary area. The second case has the order batching and the concurrent replenishment from the reachable area. The third case has the order batching and direct picking from the replenishment area.


49 40 Table 4.1 Test Cases For the regular picking, there are 112 orders to be processed. For the batched picking, there are 56 orders to be processed. For each case, the simulation is run ten times. The total pick time data for each case can be seen in Appendix C. The reason why the simulation is run ten times is because the pick, put-away, push-to-conveyor, delay, and retrieve-tote times are generated randomly based on the lognormal distribution in the simulation. 4.3 Results Once the total pick time data for all cases are gathered, statistical tests are conducted. First, the 95% confidence interval of the estimated total pick time is constructed. After that, to test that the mean of all cases are different significantly, Tukey s method is performed. Finally, Two-Way ANOVA is conducted to determine the effect of the order batching, replenishment operation and their interaction to the total pick time Total Pick Time Confidence interval is constructed because it gives upper and lower limits of the estimated total pick time, which is more accurate than just a single estimated value. The 95 %


50 41 confidence interval of estimated total pick time in different systems can be seen in Table 4.2 below. Table 4.2 Estimated Total Pick Time 95 % Confidence Interval in Minutes The confidence intervals in Table 4.2 do not overlap. To show that at least one case has an estimated total pick time that is significantly different than any of the cases, Tukey s method is performed Comparison of Alternatives Tukey s method is a tool to compare the mean of total pick time between cases. There are six combinations of the cases comparisons, e.g., Base Case and Case 1, Base Case and Case 2, etc. Figure 4.1 below shows the results of Tukey s method with 95% joint confidence level. This means that all six comparisons have a family error rate of As Figure 4.1 suggests, all six comparisons have significant difference because none of the confidence intervals includes zero. With the result from Tukey s method, it can be concluded that all the cases have significantly different means with 95% confidence level.
51 42 Figure 4.1 Tukey s 95% Confidence Interval This test suggests that the cases impact the estimated total pick time. However, because each case is a combination between the two factors, the order batching and replenishment operation, Tukey s method does not explain the effect of each factor and their interaction on the total pick time. To determine the effect of each factor and their interactions on the total pick time, Two-Way ANOVA is conducted.
52 Effects of the Two Policies In the Two-Way ANOVA the null hypotheses tested are as follows: No main effect due to the order picking policy. No main effect due to the replenishment policy. No effect due to the interaction between the order picking and the replenishment policy. Before conducting the Two-Way ANOVA, the residuals were tested for normality. In Figure 4.2, the normal probability plot of the residuals of total pick times falls fairly straight on the 45 line. For further investigation, a separate residual probability plot is also graphed in Figure 4.3. Figure 4.3 below shows that the p-value of normal probability plot is greater than Hence, it can be concluded that the residuals of the total pick times are normally distributed. This indicates that the underlying assumptions hold; data is normal, variance is constant, and there is no need for higher order terms.
53 Percent Frequency Residual Percent Residual 44 Residual Plots for Total Pick Time 99 Normal Probability Plot 10 Versus Fits Residual Fitted Value Histogram 10 5 Versus Order Residual Observation Order Figure 4.2 Residual Plots for Total Pick Time Probability Plot of Residual Normal - 95% CI Mean E-15 StDev N 40 AD P-Value Residual 5 10 Figure 4.3 Residuals Normal Probability Plot
54 Mean 45 Figure 4.4 Two-Way ANOVA of Total Pick Time vs. Picking and Replenishment The Two-Way ANOVA in Figure 4.4 shows that the p-values for both picking and replenishment are This means that the two main factors, picking and replenishment, are significant to the total pick time. However, because the p-value of the interaction is larger than 0.05, then it can be concluded that the interaction between the two factors is not significant to the total pick time. When the interaction is not significant, this means that the effect of one factor is not dependent on the other factor. Figure 4.5 demonstrates that the interaction is not significant. Interaction Plot for Total Pick Time Data Means 130 Picking Batched Order Single Order With Replenishment Without Replenishment Replenishment Figure 4.5 Interaction Plot between Factors
55 46 Figure 4.5 also shows that no matter which replenishment policy is used, changing the order picking policy from single order picking policy to batched order picking policy reduces the mean of total pick time significantly. It also can be seen that no matter which order picking policy is chosen, changing the replenishment policy to direct pick from the secondary location (without replenishment) reduces the mean of the total pick time significantly. 4.4 Summary In this chapter, the base case and the three different simulation test cases were explained. The total pick times are gathered from all the test cases. The 95% confidence interval and Tukey s method are constructed to determine that the test cases give significantly different total pick times. Two-Way ANOVA is conducted to determine that the two factors, picking and replenishment operations, are significant to the total pick time but their interaction is not important to the total pick time. In the next chapter, recommendation to the system is presented. Opportunities for future research are also discussed.
56 47 Chapter 5: CONCLUSION 5.1 Introduction In the distribution center, the two most expensive activities are picking and replenishment operations. Modifications made to those two activities can greatly impact the productivity in the distribution center. Simulation and statistical analysis can help to identify the modifications that positively impact the productivity. In this chapter, recommendations based on the statistical analyses that are performed in the previous chapter are presented. Then, future research opportunities are discussed. 5.2 Conclusion Based on the Two-Way ANOVA, replenishment operations and order picking policy are significant factors contributing to the total pick time while the interaction between these two factors is not significant. This analysis suggests that changing the order picking policy from single order picking to batched order picking, regardless of the replenishment operations, can reduce the total pick time. This analysis also suggests that altering the replenishment operations from replenishing from productive secondary area to a direct picking from productive secondary area, regardless of the order picking policy, can also reduce the total pick time. The expected total pick time of the existing system, single order picking policy and replenishment from a productive secondary area, is shown to be statistically larger than that of all the altered models. This shows that for distribution centers which have a similar setup as the distribution center that is studied for this thesis, e.g. zone-based forward area with single order
57 48 picking policy, the productivity can be increased if at least one of the two factors, the order picking policy or replenishment operations, is altered Total Pick Time Reduction In a single wave and a single zone, reduction in total pick time can be achieved if the order picking policy is altered from single order picking to batched order picking. The mean of total pick times reduces by 32 minutes from approximately 131 minutes to 99 minutes. This is about a 25% savings in picking time per wave per zone. In a single wave and single zone, reductions in total pick time can also be achieved if the replenishment operation is modified to a direct pick from a productive secondary area. The expected total pick times reduces by 14 minutes from approximately 131 minutes to 117 minutes. This yields about a 10% savings in picking time per wave per zone. The greatest saving can be achieved if both the order picking policy and the replenishment operation of the existing system are both altered. The mean of the total pick times is reduced by 49 minutes from 131 minutes to 82 minutes. This yields a 37% savings in picking time per wave per zone. In the distribution center that is studied for this thesis, there are 19 zones in the bin pick area and seven waves in one day. If all the zones and waves are identical with the zone and wave that are studied, then in one day, a total savings of 4256 minutes can be achieved by changing the order picking policy from single to a batched order picking policy without altering the replenishment operation. This represents approximately eight shifts per day, assuming that order pickers work 8 hour shifts. Changing the replenishment policy would save 1862 minutes,
58 49 or about 3 shifts, per day. If both the replenishment operation and order picking operations are altered, 6517 minutes can be cut from the total pick time, or about 13 shifts per day Recommendation To change the order picking and replenishment operations, the WMS and the pick list need to be updated so that they can handle scheduling batch picking and multiple pick locations for SKUs. For batched picking, it is recommended to first investigate if the WMS in the company is capable of batching the orders because there are many other WMS that have the capability to batch orders. If the capability exists, then the company can turn on the batching option and set the batch size to two. If the capability does not exist, then changes to the pick list have to be done. The pick list can be extracted from the WMS before the WMS sends it to the pickers. In the pick list, a new column should be added for the numbers of batched orders. One batched order number consists of two sequential orders. After adding this column, the sorting logic should be modified so that the pick list is sorted based on the batched number, not based on the original order number. This procedure can be done using powerful tools such as databases which are already available in the distribution center. After sorting, the pick list can be inputted into the WMS again and the WMS can send the sorted pick list to the pickers. For order batching modifications, outside parties do not need to be involved because it is easy to implement. To change the replenishment operations from secondary location to direct pick, the WMS must have the capability to schedule multiple pick locations for SKUs. For the WMS to have this capability, the structure of the code within the WMS needs to be changed. An outside
59 50 source (e.g. programmer) and more time might be needed to implement the changes in the WMS so that it can schedule multiple pick locations for SKUs. If the company is looking for a cheaper and quicker change, then it is recommended to change the order picking policy from single order picking to batched order picking policy. If the company is looking for a long term investment, then both order picking policy and replenishment operation should be altered to batched order picking policy and direct pick from replenishment source. 5.3 Future Research Opportunities This thesis indicates benefits that can be obtained by changing single order picking to batched order picking policy with a batch size of two. Further research on the optimal number of orders that can be batched in a batched order picking policy should be conducted. Other than research on the optimal number of orders to be batched, further research on how to process single-line orders in a more efficient way should also be performed. For singleline orders, the picker should not have a confusion of where he/she should put the items in the tote since only one SKU is assigned to a tote. Instead of a single order picking policy or twoorder batch picking policy, maybe all the single-line orders should be batched. If all single-line orders are batched, then the picker will not have to travel to a conveyor before he/she is done picking all the single-line orders. This could result in great reduction of the total pick time. In this thesis, it is assumed that the picker is familiar with the zone, aisle, and bay configuration. With this assumption, pickers know where to exit the aisle (front or back) in order to reach the next destination with the shortest distance. This assumption is not always true. Consider pickers that are always rotated in the warehouse or new employees. They will need
60 51 time to know the zone configuration thoroughly. In this case, the assumption does not apply for them. Hence, further study on the optimal routing policy for the pickers to travel the aisles should be analyzed so that the optimum travel route does not have to depend on picker s experience. Because of the limitation of the WMS scheduling picking from only one location, slotting of SKUs to more than two slots should be prevented. A further study should be done on SKUs that have more than two slots assigned to them. Instead of having multiple slots, the number of slots for each SKU maybe can be reduced into two by consolidating the other slots into a single but bigger slot. Further research should be done because the effect of having a bigger slot is unknown.
61 52 BIBLIOGRAPHY Arsham, H. (2011). ABC Inventory Classification Tools. University of Baltimore Home Page. Retrieved 20 January 2011 from Bartholdi, J.J. and Hackman, S.T. (2010). Warehouse & Distribution Science. Atlanta, GA: Georgia Institute of Technology. Retrieved 01 November 2010 from Bartholdi, J. J. (2008). A Project for Manhattan Associates. Retrieved 09 November 2010 from Chan, F. T. and Chan, H. K. (2011). Improving the productivity of order picking of a manualpick and multi-level rack distribution warehouse through the implementation of classbased storage. Expert Systems with Applications, 38(3), Chinnabhandar, A. (2006). Let the WMS do the walking. Ferret - Australia's Manufacturing, Industrial and Mining Directory. Retrieved 18 January 2011 from
62 53 Davey, P. (2009). Slotting Optimization - Lost & Found. Software research on warehouse management systems, transportation management systems, and supply chain management using WMS TMS. Retrieved 18 January 2011 from De Koster, M. B. M., Van Der Poort, E. S., and Wolters, M. (1999). Efficient order batching methods in warehouses. International Journal of Production Research, 37(7), Eisenstein, D. D. (2008). Analysis and optimal design of discrete order picking technologies along a line. Naval Research Logistics, 55(4), Gademann, A. J. R. M. (Noud), Van Den Berg, J. P., and Van Der Hoff, H. H. (2001). An order batching algorithm for wave picking in a parallel-aisle warehouse. IIE Transactions, 33, Gagliardi, J. (2008). Space allocation and stock replenishment synchronization in a distribution center. Int. J. Production Economics, 115, Gallien, J. and Weber, T. (2008). To Wave Or Not To Wave? Order Release Policies for Warehouses with an Automated Sorter. MIT Sloan Research Paper, , Gibson, D. R. and Sharp, G. P. (1992). Order batching procedures. European Journal of Operational Research, 58,
63 54 Gu, J., Goetschalckx, M., and McGinnis, L. M. (2010). Solving the forward-reserve allocation problem in warehouse order picking systems. Journal of the Operational Research Society, 61(6), Hinojosa, A. (2006). What is waveless processing and how can it optimize my operation? Retrieved 18 January 2011 from Ho, Y., Wee, H. M., and Chen, H. C. (2007). A geometric design of zone-picking in a distribution warehouse. Lecture Notes in Computer Science, 4707, Lee, M. and Elsayed, E. A. (2005). Optimization of warehouse storage capacity under a dedicated storage policy. International Journal of Production Research, 43(9), Liu, C. M. (1999). Clustering techniques for stock location and order-picking in a distribution center. Computers and Operations Research, 26(10-11), Owyong, M. and Yih, Y. (2006). Picklist generation algorithm with order-consolidation consideration for split-case module-based fulfillment centers. International Journal of Production Research, 44,
64 55 Petersen, C. G. (2000). An evaluation of order picking policies for mail order companies. Production and Operations Management, 9(4), Petersen, C. G. (2002). Considerations in order picking zone configuration. International Journal of Operations & Production Management, 22(7/8), Petersen, C. G. and Aase, G. (2004). A Comparison of Picking, Storage, and Routing Policies in Manual Order Picking. International Journal Of Production Economics, 92, Petersen, C. G., Siu, C., and Heiser, D. R. (2005). Improving order picking performance utilizing slotting and golden zone storage. International Journal of Operations & Production Management, 25(10), Real-time logistics: Advanced technology helps users to better manage, warehouse and distribute products. (1996). Retrieved 18 January 2011 from Roll, Y. and Rosenblatt, M. J. (1983). Random versus grouped storage policies and their effect on warehouse capacity. Material Flow, 1(3), a Rouwenhorst, B., Reuter, B., Stockrahm, V., van Houtum, G.J., Mantel, R.J., and Zijm, W.H.M. (2000). Warehouse design and control: Framework and literature review. European Journal of Operational Research, 122,
65 56 Specter, S. P. (2009). Slotting basics. Modern Materials Handling, 64(2), Taljanovic, K. and Salihbegovic, A. (2009). A new strategies in picking from the forward pick locations XXII International Symposium on Information, Communication and Automation Technologies. ICAT Piscataway: IEEE. Tompkins, J. A. and Harmelink, D. A. (1994). Warehouse Operations. The Distribution Management Handbook (pp ). New York: Mcgraw-hill Companies. Tsai, C. Y., Liou, J. J. H., and Huang, T. M. (2008). Using a multiple-ga method to solve the batch picking problem: considering travel distance and order due time. International Journal of Production Research, 46(22), Van Den Berg, J. P., Sharp, G. P., Gademann, A. J., and Pochet, Y. (1998). Forward-reserve allocation in a warehouse with unit-load replenishments. European Journal of Operational Research, 111(1),
66 57 APPENDIX A SIMULATION MODEL CODING /*A_ctrl is the control point attribute, type: location. A_pick is picking time, type: real. A_order is order number, type: integer.*/ begin P_one arriving /*initialization*/ set V_order = 1 /* this is to initialized the variable to be the same order number as the first order in the list */ set CurrentAisle = "A" move into Queue1 move into pm.f0 while 1 = 1 do begin read A_ctrl, A_order, A_aisle, A_repl from "arc/pickfrom1stprimary.txt" with delimiter "\t" at end begin end print "Ran out of data in data.txt" to message travel to pm.f0 send to die /*tracking purpose*/ print "this is V_order " V_order to message print "this is A_order " A_order to message print "this is A_repl " A_repl to message print "current aisle " CurrentAisle to message /*set picking time*/ set V_pick = stream1 lognormal 2.518, sec if A_repl = 1 then begin end /*set put away time*/ set V_putaway = stream1 lognormal 3.584, sec
67 /*if current item s order number is the same as the previous item s order number*/ if A_order = V_order then begin travel to A_ctrl if A_repl = 0 then begin wait for V_pick print "this is V_pick " V_pick to message end else begin wait for V_putaway print "this is V_putaway " V_putaway to message end /*picker pick the items*/ end else begin /*travel to nearest conveyor*/ if CurrentAisle = "A" then begin travel to pm.a0 end else if CurrentAisle = "B" then begin travel to pm.b0 end else if CurrentAisle = "C" then begin travel to pm.c0 end else if CurrentAisle = "D" then begin travel to pm.d0 end else if CurrentAisle = "E" then begin travel to pm.e0 end else if CurrentAisle = "F" then begin travel to pm.f0 end else if CurrentAisle = "G" then begin 58
68 59 travel to pm.g0 end else if CurrentAisle = "H" then begin travel to pm.h0 end else if CurrentAisle = "J" then begin travel to pm.j0 end else if CurrentAisle = "K" then begin travel to pm.k0 end else begin travel to pm.l0 end set V_pushtoconv = stream1 lognormal 0.906, sec wait for V_pushtoconv print "V_Push to conveyor: " V_pushtoconv to message set V_retrievetote = stream1 lognormal 0.986, sec print "V_Retrieve tote: " V_retrievetote to message wait for V_retrievetote set V_delay = stream1 lognormal 2.451, sec wait for V_delay print "V_delay: " V_delay to message travel to A_ctrl /* this is to process first item of the order */ /*this is to use the pick or putaway item */ if A_repl = 0 then begin wait for V_pick print "this is V_pick " V_pick to message end else begin wait for V_putaway print "this is V_putaway " V_putaway to message end
69 60 set V_order = A_order /*if previous item's order number is not the same as the current, then go to conveyor*/ end set CurrentAisle = A_aisle /*this is to indicate which bay the picker is on the last item of the order*/ end end send to die

70 61 APPENDIX B DATA SETS Table B.1 Pick Data for Base Case
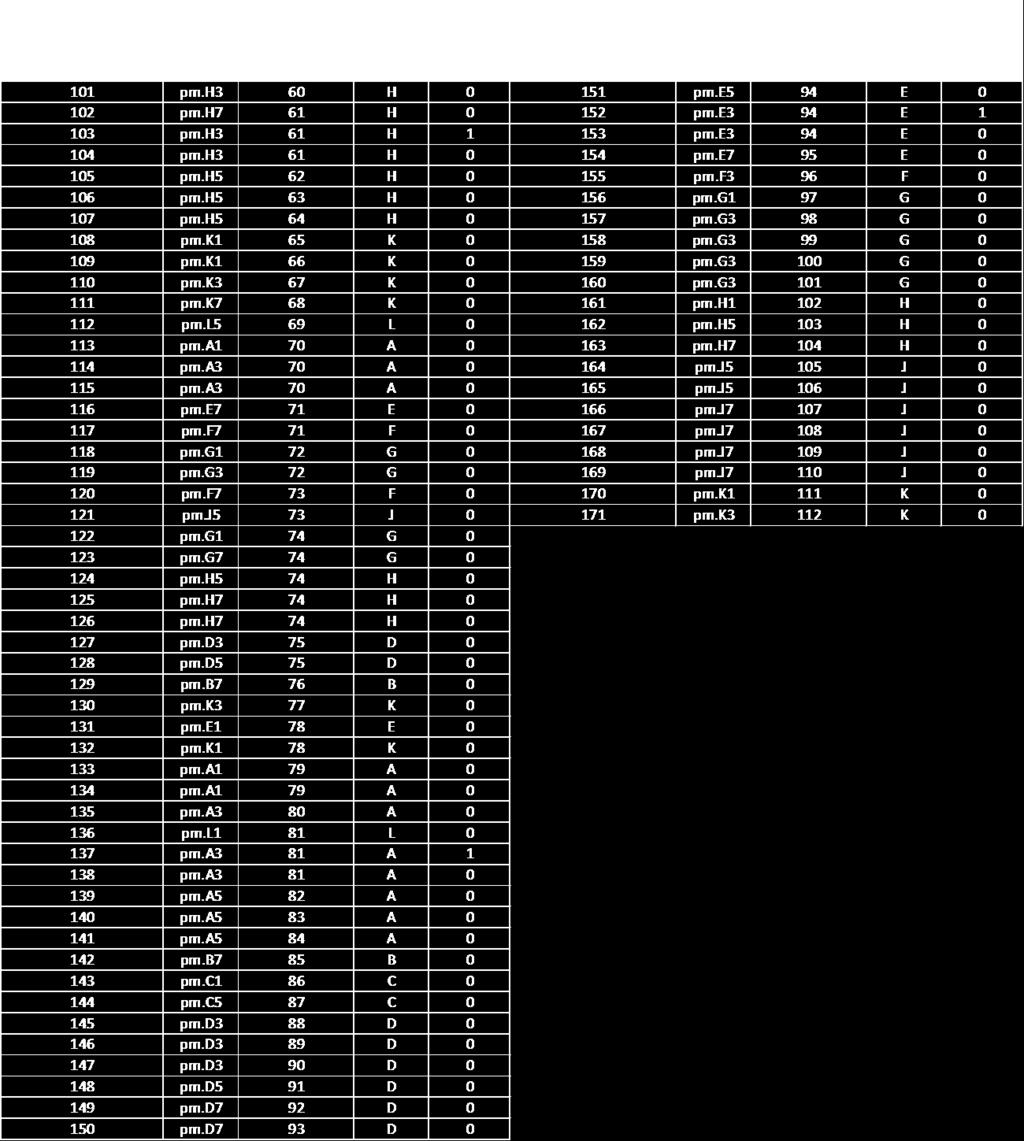
71 62
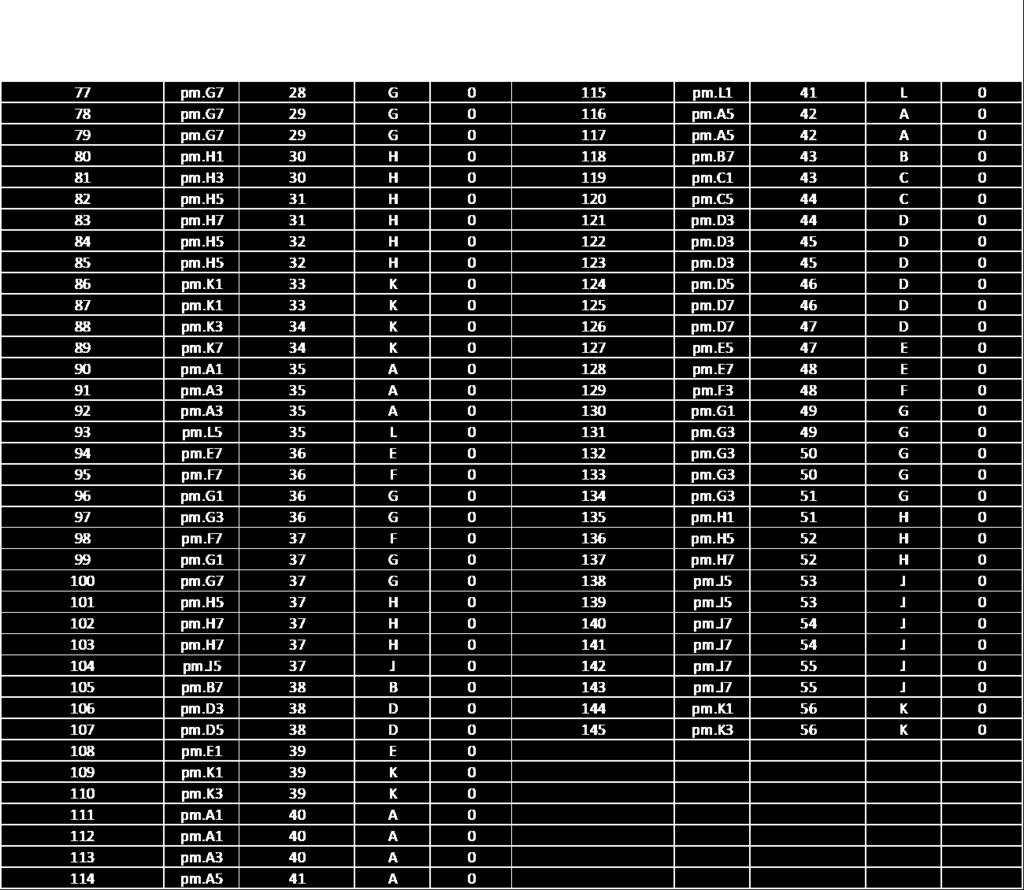
72 Table B.2 Pick Data for Case 1 63
73 64
74 Table B.3 Pick Data for Case 2 65
75 66

76 Table B.4 Pick Data for Case 3 67
77 68

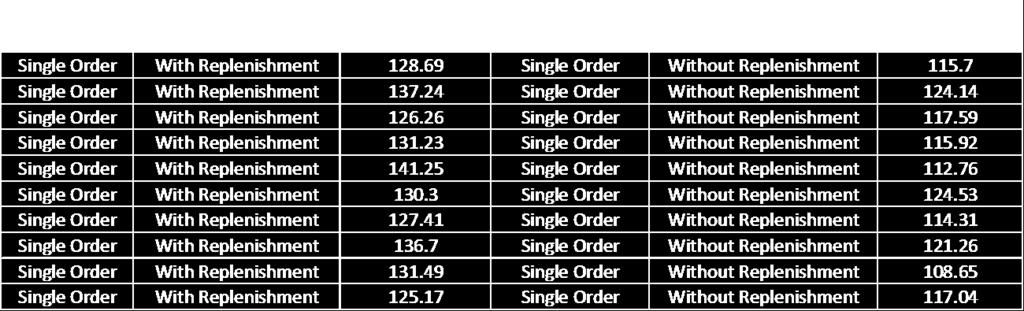
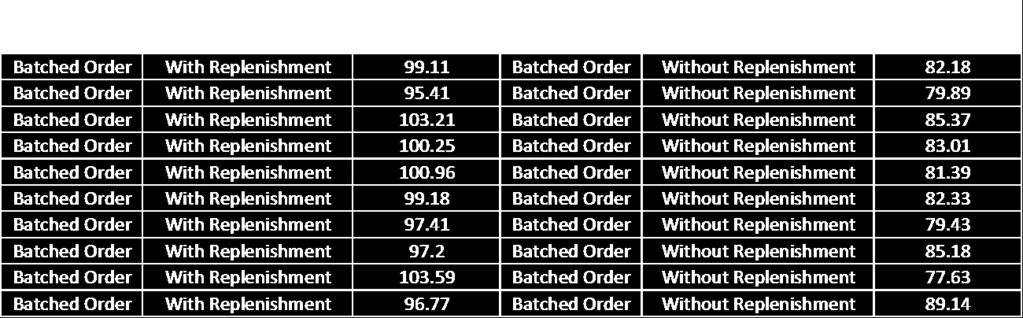
78 69 APPENDIX C SIMULATION RESULTS Table C.1 Total Pick Time

79 70 APPENDIX D TIME STUDIES Table D.1 Scan and Pick Times
80 Table D.2 Put Away Times 71

81 Table D.3 Retrieve-Tote Times 72


82 Table D.4 Push-To-Conveyor Times 73

83 Table D.5 Delay Times 74
MTTN L11 Order-picking MTTN25 Warehousing and Materials Handling. Warehousing and Materials Handling 1. Content. Learning objectives
 L11 Order-picking MTTN25 Warehousing and Materials Handling Warehousing and Materials Handling Tools & Techniques Optimization models Pick-paths Inclusion of SKU in FPA Lane depth & slotting L11 Layout
Order Fulfillment Strategies for Low Velocity Inventory
 Order Fulfillment Strategies for Low Velocity Inventory Presented by: Ken Ruehrdanz 2018 MHI Copyright claimed for audiovisual works and sound recordings of seminar sessions. All rights reserved. Order
WMS Best Practices Top Ten List
 WMS Best Practices Top Ten List David Letterman Top Ten List Top 10 reasons to adopt WMS best practices Reason 10 Your receiving backlog is so bad you haven t seen the dock floor since 1974 Advanced shipping
A thesis presented to. the faculty of. the Russ College of Engineering and Technology of Ohio University. In partial fulfillment
 Methodology for Data Mining Customer Order History for Storage Assignment A thesis presented to the faculty of the Russ College of Engineering and Technology of Ohio University In partial fulfillment of
White Paper. Dynamic Slotting (Capabilities of Exacta Profile)
") White Paper On Dynamic Slotting (Capabilities of Exacta Profile) Software and Automation Technology for Supply Chain Logistics Louisville, Kentucky This paper contains information considered proprietary
White Paper On Dynamic Slotting (Capabilities of Exacta Profile) Software and Automation Technology for Supply Chain Logistics Louisville, Kentucky This paper contains information considered proprietary
white paper Top 10 Trends Driving Order Fulfillment
 white paper Top 10 Trends Driving Order Fulfillment Introduction What is driving the design of order fulfillment systems today? What is driving the design of order fulfillment systems today? While an analysis
A Thesis presented to the Faculty of the Graduate School. University of Missouri. In Partial Fulfillment. Of the Requirements for the Degree
 DETERMINING A HEURISTIC FOR PICK LOCATION DESIGN IN AN END USER WAREHOUSE A Thesis presented to the Faculty of the Graduate School University of Missouri In Partial Fulfillment Of the Requirements for
THE ADVANTAGES OF SUMULTANEOUS PICKING STRATEGIES IN LIGHT-DIRECTED ORDER FULFILLMENT. WHITE PAPER
 WHITE PAPER THE ADVANTAGES OF SUMULTANEOUS PICKING STRATEGIES IN LIGHT-DIRECTED ORDER FULFILLMENT. Lightning Pick A (MATW) International Company N114 W18770 Clinton Drive Germantown, WI 53022 Website:
SIX MONTHS TO A STRONGER OPERATION
 SIX MONTHS TO A STRONGER OPERATION OVERALL OPERATIONAL EFFICIENCY YOUR SYSTEM, ONLY BETTER. www.dlneu.com (616) 538-0638 WELCOME The January edition of D.L. Neu s series, Six Months to a Stronger Operation,
Using Proven Material Handling Automation and Emerging Bot Technologies to Optimize DTC Order Fulfillment.
 Using Proven Material Handling Automation and Emerging Bot Technologies to Optimize DTC Order Fulfillment. Presented by: Matthews Automation Solutions 2 2 Presenters Gary Cash Vice President of Solution
AN EVALUATIVE FRAMEWORK FOR PICK AND PASS ZONE PICKING SYSTEMS
 Rotterdam School of Management Erasmus University AN EVALUATIVE FRAMEWORK FOR PICK AND PASS ZONE PICKING SYSTEMS Master Thesis AUTHOR Alina Stroie 332925 MSc Supply Chain Management Date: 13.03.2014 COACH
RELATION-BASED ITEM SLOTTING
 RELATION-BASED ITEM SLOTTING A Thesis presented to the Faculty of the Graduate School University of Missouri In Partial Fulfillment Of the Requirements for the Degree Master of Science by Phichet Wutthisirisart
Building a Omni- Channel Distribution Center A Case Study
 Building a Omni- Channel Distribution Center A Case Study Sponsored by: Presented by: Chris Castaldi Allen Sisk Marc Teychene 2015 MHI Copyright claimed for audiovisual works and sound recordings of seminar
XXVI. OPTIMIZATION OF SKUS' LOCATIONS IN WAREHOUSE
 XXVI. OPTIMIZATION OF SKUS' LOCATIONS IN WAREHOUSE David Sourek University of Pardubice, Jan Perner Transport Faculty Vaclav Cempirek University of Pardubice, Jan Perner Transport Faculty Abstract Many
OUTSOURCED STORAGE AND FULFILLMENT FACILITY TO ENHANCE THE SERVICE CAPABILITIES OF SHOPPING MALL TENANTS
 OUTSOURCED STORAGE AND FULFILLMENT FACILITY TO ENHANCE THE SERVICE CAPABILITIES OF SHOPPING MALL TENANTS Zachary Montreuil University of North Carolina at Charlotte Mike Ogle, Ph.D. University of North
Supply Chain Best Practices Consortium
 Supply Chain Best Practices Consortium Order Picking Executive Seminar Supply Chain Leadership Forum Track B, Session 3 September, 2007 1 Session Scope This session covers best practices for what is generally
The Picking Playbook Batch Picking, Zone Picking or Cluster Picking Which is Right for Your Distribution Center?
 The Picking Playbook Batch Picking, Zone Picking or Cluster Picking Which is Right for Your Distribution Center? Publication Date: September, 2016 Author: Ian Hobkirk The Picking Playbook Batch Picking,
Dual-tray Vertical Lift Modules for Fast Order Picking
 Georgia Southern University Digital Commons@Georgia Southern 14th IMHRC Proceedings (Karlsruhe, Germany 2016) Progress in Material Handling Research 2016 Dual-tray Vertical Lift Modules for Fast Order
Order Fulfillment Systems
 Order Fulfillment Systems Honeywell Intelligrated Order Fulfillment Systems Software Intelligence That Delivers Honeywell Intelligrated draws on decades of experience and hundreds of installations to provide
MTTN L3 Activity profiling MTTN25 Warehousing and Materials Handling. Warehousing and Materials Handling 1. Content. Learning objectives
 L3 Activity profiling MTTN25 Warehousing and Materials Handling Warehousing and Materials Handling Tools & Techniques Optimization models Pick-paths Inclusion of SKU in FPA Lane depth & slotting Layout
DC And FC Automation Economics
 DC And FC Automation Economics Presented by : Dale Pickett Kelly Reed Contents 2 DC And FC Automation Economics August 31, 2016 Discussion Objectives - 3 Why Companies Automate - 4 When To Automate - 5
GAINING EFFICIENCIES WITHIN THE WAREHOUSE. Setting Up Your Warehouse for Optimal Distribution
 GAINING EFFICIENCIES WITHIN THE WAREHOUSE Setting Up Your Warehouse for Optimal Distribution TABLE OF CONTENTS INTRODUCTION 3 SPACE UTILIZATION BIN CHARACTERISTICS LAYOUT CONSIDERATIONS CROSS DOCK IF POSSIBLE
Lean Distribution. Mark Kushner, COO Lloyed Lobo, Director Business Development
 Lean Distribution Mark Kushner, COO Lloyed Lobo, Director Business Development Agenda Brief Company Overview What is Lean? Lean in the Extended Supply Chain Benefits of Lean Distribution Can Lean Help
The What, How, When and Why of Warehouse Slotting
 The What, How, When and Why of Warehouse Slotting The Impact of Slotting Decisions (and Non-Decisions) on the Bottom Line Measuring The Operational & Financial Impact of Slotting One problem in judging
AGI - WMS Overview. AGI Worldwide Warehouse Solutions
 AGI - WMS Overview In today s rapidly changing business environment, successful supply chain management relies on accurate and instantaneous information. The ability to deliver the right product to the
This appendix includes the title and reference number for every best
 Inventory Best Practices, Second Edition By Steven M. Bragg Copyright 2011 by John Wiley & Sons, Inc. APPENDIX Summary of Inventory Best Practices This appendix includes the title and reference number
Pearson. Flexibility and accuracy.
 Pearson. Flexibility and accuracy. As a result of this vision and the construction of the distribution centre, Pearson is now well positioned in a tough business environment. In the book publishing business,
Increase Warehouse Productivity through Technology
 Increase Warehouse Productivity through Technology There is always room for improvement in warehouse productivity. Achieving it cost-effectively is the challenge. This paper identifies the value of a systematic,
Embedded EWM S/4HANA Basic vs. Advanced 1709FP1
 Embedded EWM S/4HANA Basic vs. Advanced 1709FP1 March 2018 Basic Principles - Pricing of EWM S/4HANA Price EWM in S/4 only when customer uses advanced features List of advanced features Material Flow System
Push vs. Pull: How Pull-driven Order Fulfillment Enables Greater Flexibility in Distribution Operations. Fortna
 Push vs. Pull: How Pull-driven Order Fulfillment Enables Greater Flexibility in Distribution Operations www.fortna.com Fortna The demands of e-commerce and omni-channel fulfillment are increasing the need
Oracle Warehouse Management (WMS) and RFID
 and RFID") Oracle Warehouse Management (WMS) and RFID Integrations, Enhancements and an Overview Aditya Agarkar Director, Product Strategy Safe Harbor Statement The following is intended to
Oracle Warehouse Management (WMS) and RFID Integrations, Enhancements and an Overview Aditya Agarkar Director, Product Strategy Safe Harbor Statement The following is intended to
What is Waveless Processing and How Can It Optimize My Operation?
 White Paper What is Waveless Processing and How Can It Optimize My Operation? www.fortna.com This report is provided to you courtesy of Fortna Inc., a leader in designing, implementing and supporting complete
Stock Management Methods in SAP: Some distinctive differences between IM, WM, and EWM John Gardner
 [ Stock Management Methods in SAP: Some distinctive differences between IM, WM, and EWM John Gardner [ We are an SAP Service Partner and Value Added SAP reseller. We are headquartered in Chicago, and with
Layout design analysis for the storage area in a distribution center.
 University of Louisville ThinkIR: The University of Louisville's Institutional Repository Electronic Theses and Dissertations 5-2009 Layout design analysis for the storage area in a distribution center.
Achieving Better Warehouse Management:
 Achieving Better Warehouse Management: icepts Technology Group, Inc. Warehouse Management Systems are becoming more popular as supply chain logistics become ever more complication along with increasing
Warehouse Management Module (WMS)
") Warehouse Management Module (WMS) 1. Overview Priority's Warehouse Management module provides advanced tools for planning and monitoring all aspects of warehouse management. The outstanding advantage of
Warehouse Management Module (WMS) 1. Overview Priority's Warehouse Management module provides advanced tools for planning and monitoring all aspects of warehouse management. The outstanding advantage of
Travel Time in a Warehouse: Process. Improvement at The Toro Company. John Cinealis
 1 Travel Time in a Warehouse: Process Improvement at The Toro Company by John Cinealis A Research Paper Submitted in Partial Fulfillment of the Requirements for the Master of Science Degree In Technology
Case study: Grégoire-Besson Peak picking productivity at Grégoire-Besson
 Case study: Grégoire-Besson Peak picking productivity at Grégoire-Besson Location: France The new Grégoire-Besson distribution centre, a French farm technology equipment company, consists of an automated
Ch.4 Warehousing. Part 4 : Distribution & Customer support. Edited by Dr. Seung Hyun Lee (Ph.D., CPL)
") Part 4 : Distribution & Customer support. Ch.4 Warehousing. Edited by Dr. Seung Hyun Lee (Ph.D., CPL) IEMS Research Center, E-mail : lkangsan@iems.co.kr Importance of Warehouse. Nature and Importance of
Part 4 : Distribution & Customer support. Ch.4 Warehousing. Edited by Dr. Seung Hyun Lee (Ph.D., CPL) IEMS Research Center, E-mail : lkangsan@iems.co.kr Importance of Warehouse. Nature and Importance of
AN EXPERIMENTAL STUDY OF THE IMPACT OF WAREHOUSE PARAMETERS ON THE DESIGN OF A CASE-PICKING WAREHOUSE
 AN EXPERIMENTAL STUDY OF THE IMPACT OF WAREHOUSE PARAMETERS ON THE DESIGN OF A CASE-PICKING WAREHOUSE Russell D. Meller University of Arkansas and Fortna Inc. Lisa M. Thomas University of Arkansas and
Harrison's Logistics Warehouse Logistics Avenue Any Town QWERTY. Auditor Name Mark Phillips Audit Date 21/01/2016 Reference
 Harrison's Logistics Warehouse Logistics Avenue Any Town QWERTY Auditor Name Mark Phillips Audit Date 21/01/2016 Reference 311738 Site Details Site Footprint 42000 sq ft Usable Height (Meters) 8.0 Sector
Creating Successful Order Picking & Fulfillment
 Creating Successful Order Picking & Fulfillment Phone: 248-668-8250 info@isddd.com www.isddd.com I N T E G R A T E D S Y S T E M S D E S I G N W H I T E P A P E R S Implementing, upgrading or improving
Improving Product Location and Order Picking Activities in a Distribution Center
 Improving roduct Location and Order icking Activities in a Distribution Center Jacques Renaud Angel Ruiz Université Laval Centre Interuniversitaire de Recherche sur les Réseaux d Entreprise, la Logistique
BENCHMARKING WAREHOUSE PERFORMANCE STUDY
 W. M. KECK VIRTUAL FACTORY LAB BENCHMARKING WAREHOUSE PERFORMANCE STUDY Summary of Results for Data Collected through April 2006 for Internet-based Data Envelopment Analysis for Warehousing 2006 contact
Introduction The role of the warehouse Role of the warehouse manager 36. List of figures xi List of tables xv Acknowledgements xvii
 CONTENTS List of figures xi List of tables xv Acknowledgements xvii Introduction 1 01 The role of the warehouse 5 Introduction 5 Types of warehouse operation 7 Why do we hold stock? 12 Warehouse location
Simulation based Performance Analysis of an End-of-Aisle Automated Storage and Retrieval System
 Simulation based Performance Analysis of an End-of-Aisle Automated Storage and Retrieval System Behnam Bahrami, El-Houssaine Aghezzaf and Veronique Limère Department of Industrial Management, Ghent University,
Infor SCM (Supply Chain Management) > Warehouse Management
 > Warehouse Management") Management The right stuff for end-to-end fulfillment and distribution. Experts estimate that 20% of all orders are filled imperfectly. Thus, the ability to meet customer demand by getting the right products
Management The right stuff for end-to-end fulfillment and distribution. Experts estimate that 20% of all orders are filled imperfectly. Thus, the ability to meet customer demand by getting the right products
DECISION SCIENCES INSTITUTE. Cross aisle placement in order picking operations. Charles Petersen Northern Illinois University
 DECISION SCIENCES INSTITUTE Charles Petersen Northern Illinois University Email: cpetersen@niu.edu Gerald Aase Northern Illinois University Email: gaase@niu.edu ABSTRACT Order picking operations need to
Sort it out! Making smart sortation automation decisions. Satyen Pathak, senior product manager
 Sort it out! Making smart sortation automation decisions Satyen Pathak, senior product manager Sort it out! Making smart sortation automation decisions Satyen Pathak, senior product manager 2 Copyright
PLANNING OF ORDER PICKING PROCESSES USING SIMULATION AND A GENETIC ALGORITHM IN MULTI-CRITERIA SCHEDULING OPTIMIZATION
 PLANNING OF ORDER PICKING PROCESSES USING SIMULATION AND A GENETIC ALGORITHM IN MULTI-CRITERIA SCHEDULING OPTIMIZATION Balázs Molnár Budapest University of Technology and Economics Department of Transportation
Storage Media Selection A Roadmap
 Storage Media Selection A Roadmap Introduction Racking and shelving in its various guises is one of the most ubiquitous of equipment types found in businesses today. This is as true for manufacturing facilities
Twice the work, half the time
 Twice the work, half the time Industrial manufacturer Gardner Denver enjoyed a 100% increase in picking productivity and a 50% reduction in labor hours by combining new and aftermarket business in a horizontal
Dynamic Slotting and Cartonization Problem in Zone-based Carton Picking Systems. Byung Soo Kim
 Dynamic Slotting and Cartonization Problem in Zone-based Carton Picking Systems by Byung Soo Kim A dissertation submitted to the Graduate Faculty of Auburn University in partial fulfillment of the requirements
Travel Models for Warehouses with Task Interleaving
 Proceedings of the 2008 Industrial Engineering Research Conference J. Fowler and S. Mason, eds. Travel Models for Warehouses with Task Interleaving Letitia M. Pohl and Russell D. Meller Department of Industrial
MOBILE-RACKS AND ROBOTS: A PARADIGM SHIFT IN ORDER PICKING. Dr. Debjit Roy 24 April 2014 Material Handling Forum Seminar, VU Amsterdam
 MOBILE-RACKS AND ROBOTS: A PARADIGM SHIFT IN ORDER PICKING Dr. Debjit Roy 24 April 2014 Material Handling Forum Seminar, VU Amsterdam Email: debjit@iimahd.ernet.in Material Handling Forum, Erasmus University
Forensic Diagnosis of the Poorly Performing Automated Warehouse
 Forensic Diagnosis of the Poorly Performing Automated Warehouse Mike Wilson Logistics Simulation Ltd IWL Conference 22 nd June 2007 1 Introduction Capital investment in warehouse automation Does not always
Dispen-SI-matic and Mobile-matic Easton, Pennsylvania
 Dispensing Technologies Dispen-SI-matic and Mobile-matic e x t e n s i v e e x p e r i e n c e i n s o lv i n g m at e r i a l f l o w c h a l l e n g e s 800-523-9464 www.sihs.com Easton, Pennsylvania
Dynamic warehouse optimization using predictive analytics.
 University of Louisville ThinkIR: The University of Louisville's Institutional Repository Electronic Theses and Dissertations 12-216 Dynamic warehouse optimization using predictive analytics. Parvaneh
Optimising Inbound, Warehousing and Outbound Strategies
 Warehouse Management EXECUTIVE SUMMARY Optimising Inbound, Warehousing and Outbound Strategies Control the movement of stock within a warehouse or across multiple facilities. Process associated transactions
Omnichannel Challenges
 Omnichannel Challenges One of the biggest challenges for the omnichannel retailer today is the need to keep pace with both the growing demand for low line count orders and the unpredictable and fluctuating
Six Steps To Optimized Order Fulfillment
 Six Steps To Optimized Order Fulfillment White Paper How to properly classify, sort and store inventory in the correct storage systems automated and otherwise to increase throughput and reduce costs associated
Chapter 9 Storage & Warehouse Systems
 FACILITIES PLANNING & DESIGN Alberto Garcia-Diaz J. MacGregor Smith Chapter 9 Storage & Warehouse Systems 1. Warehouse Layout Model 2. Storage Equipment 3. Automated Storage & Retrieval System 1 Dedicated
Designing Distribution Centers: Shifting to an Automated System
 VASAN009 VARGO Technical Notes Page 1 VASAN009 Designing Distribution Centers: Shifting to an Automated System VASAN009 VARGO Technical Notes Page 2 When a distribution center begins the transition from
Association Rule Based Approach for Improving Operation Efficiency in a Randomized Warehouse
 Proceedings of the 2011 International Conference on Industrial Engineering and Operations Management Kuala Lumpur, Malaysia, January 22 24, 2011 Association Rule Based Approach for Improving Operation
USE OF DYNAMIC SIMULATION TO ANALYZE STORAGE AND RETRIEVAL STRATEGIES
 Proceedings of the 1999 Winter Simulation Conference P. A. Farrington, H. B. Nembhard, D. T. Sturrock, and G. W. Evans, eds. USE OF DYNAMIC SIMULATION TO ANALYZE STORAGE AND RETRIEVAL STRATEGIES Mark A.
Warehouse Operations. Putaway
 Warehouse Operations 195 ing Putaway Putaway Warehouse Management System WMS interfaces with a corporation s enterprise resource planning (ERP) and the control software of each MHS Inventory Master File
Improving Order Picking Efficiency with the Use of Cross Aisles and Storage Policies
 Open Journal of Business and Management, 2017, 5, 95-104 http://www.scirp.org/journal/ojbm ISSN Online: 2329-3292 ISSN Print: 2329-3284 Improving Order Picking Efficiency with the Use of Cross Aisles and
How BuySeasons Achieved Record ecommerce Order-Fulfillment Productivity
 CSCMP 2018 Supply Chain Innovation of the Year Award Finalist How BuySeasons Achieved Record ecommerce Order-Fulfillment Productivity Submitted by: Authors: Speakers/Presenters: Jack Peck, FastFetch Corporation
Warehouse Operations. Putaway
 Warehouse Operations 173 ing Putaway Putaway Warehouse Management System WMS interfaces with a corporation s enterprise resource planning (ERP) and the control software of each MHS Inventory Master File
A SIMULATION MODEL TO IMPROVE WAREHOUSE OPERATIONS. Jean Philippe Gagliardi Jacques Renaud Angel Ruiz
 Proceedings of the 2007 Winter Simulation Conference S. G. Henderson, B. Biller, M.-H. Hsieh, J. Shortle, J. D. Tew, and R. R. Barton, eds. A SIMULATION MODEL TO IMPROVE WAREHOUSE OPERATIONS Jean Philippe
IMPROVE CUSTOMER SERVICE! KEEP YOUR COSTS DOWN! MINMIZE YOUR SPACE! NOW!!!
 CDI WMS is a complete Warehouse Management System (WMS), not a stock locator or asset management package. It was designed to control the entire operation of any warehouse from 30,000 sq. ft to 1,000,000
Profitable Distribution System Design Part I
 White Paper Profitable Distribution System Design Part I By John T. Giangrande Senior Account Executive www.fortna.com This report is provided to you courtesy of Fortna Inc., a leader in designing, implementing
modern system report Deon Wagner, director of warehouse operations, Oriental Trading Company.
 Oriental Trading PHOTOGRAPHY BY BLAINE FISHER/GETTY IMAGES Deon Wagner, director of warehouse operations, Oriental Trading Company. 16 S e p t e m b e r 2 0 1 1 / Modern Materials Handling mmh.com Company
Six Ways to Postpone or Eliminate- Distribution Center Expansion
 Supply Chain Advisors LLC 20 Park Plaza, Suite 400 Boston, Massachusetts 02116 Six Ways to Postpone or Eliminate- Distribution Center Expansion A Guide to Maximizing Current Distribution Real-Estate Publication
E-Commerce Fulfillment & Delivery in a Hyper-Local World TRACK 3: SESSION 6
 E-Commerce Fulfillment & Delivery in a Hyper-Local World TRACK 3: SESSION 6 Craig Morris DHL VP Product Management and Strategy Email: Craig.Morris@dhl.com Phone: 954-258-7681 Website: www.dpdhl.com Linkedin:
YOUR BEST WAREHOUSE MANAGEMENT SYSTEM: GETTING MAXIMUM VALUE FROM YOUR WAREHOUSE AND YOUR FUNCTIONAL AREAS
 YOUR BEST WAREHOUSE MANAGEMENT SYSTEM: GETTING MAXIMUM VALUE FROM YOUR WAREHOUSE AND YOUR FUNCTIONAL AREAS Ultra Consultants 847.692.6485 www.ultraconsultants.com 1 CONTENTS Executive Summary The Case
Rtls Delivers For Material Handling & Logistics
 WHITE PAPER Rtls Delivers For Material Handling & Logistics companies implementing real-time locating systems have reliably earned high Rois in a wide range of applications and industries. according to
Minimizing order picking distance through the storage allocation policy. Vadim Smyk
 Minimizing order picking distance through the storage allocation policy Vadim Smyk Master s Thesis International Business Management 2018 DEGREE THESIS Arcada Degree Programme: International Business Management
CHAPTER 1 INTRODUCTION
 1 CHAPTER 1 INTRODUCTION 1.1 MANUFACTURING SYSTEM Manufacturing, a branch of industry, is the application of tools and processes for the transformation of raw materials into finished products. The manufacturing
CLS. Carton live storage. EASY-TO-VIEW PRODUCT PRESENTATION
 CLS Carton live storage EASY-TO-VIEW PRODUCT PRESENTATION www.bito.com STORING PRODUCTS HAS NEVER BEEN MORE EFFICIENT 2 APPLICATION REDUCING TRAVEL TIME ACCELERATES WORKFLOWS IDEALLY SUITED FOR + + achieving
12 Simple Steps to Perfect Accuracy for Order Picking & Packing
 12 Simple Steps to Perfect Accuracy for Order Picking & Packing By Integrated Systems Design Nothing drives profitability out of operations faster than mis-picks, mis-packs and general errors within your
Untangling the Complexities of efulfillment
 Untangling the Complexities of efulfillment AS CONSUMERS GAIN GREATER CONNECTIVITY to retailers by means of e-commerce, their already high demands become increasingly challenging for businesses to meet.
Development of Material Handling System in a Manufacturing Company
 Development of Material Handling System in a Manufacturing Company P. Sunderam 1, E.Viswanathan 2 Assistant Professor, Karpagam College of Engineering, Coimbatore, India 1,2 ABSTRACT: In the last several
Warehouse Management MANHATTAN ACTIVE DISTRIBUTION. VF Corporation
 MANHATTAN ACTIVE DISTRIBUTION Warehouse Management MANHATTAN S WAREHOUSE MANAGEMENT SETS THE STANDARD for leading-edge, highly-mobile warehouse management system (WMS) technology and innovation in both
Determining the Best Split-Case Automated Order Fulfillment System
 Determining the Best Split-Case Automated Order Fulfillment System www.sihs.com info@sihs.com Connect with Us! O: 800-523-9464 F: 610-250-9677 Automated Order Fulfillment Technology Simple, automated order
OPERATIONAL-LEVEL OPTIMIZATION OF INBOUND INTRALOGISTICS. Yeiram Martínez Industrial Engineering, University of Puerto Rico Mayagüez
 OPERATIONAL-LEVEL OPTIMIZATION OF INBOUND INTRALOGISTICS Yeiram Martínez Industrial Engineering, University of Puerto Rico Mayagüez Héctor J. Carlo, Ph.D. Industrial Engineering, University of Puerto Rico
In a league of its own
 BSN Sports: In a league of its own By Bob Trebilcock, Executive Editor Following a retrofit of its DC, BSN Sports has achieved new levels of productivity and space utilization. Bobby Melton, plant director,
INTEGRATION OF STOCK KEEPING AREAS AND INVENTORY PLANNING
 INTEGRATION OF STOCK KEEPING AREAS AND INVENTORY PLANNING Murat Düzgün 1, Mehmet Tanyaş 2 Abstract Inventory are a company's merchandise, raw materials, semi-finished and finished products which have not
Logistics. Get the. right amount of right material to the right place at the right time
 Logistics 1 Logistics The process of planning, implementing, and controlling the efficient, cost effective flow and storage of raw materials, in-process inventory, finished goods and related information
The Viability of Modern Pick-to-Light Systems How Advances in Hardware and Software Address the Challenges of Omnichannel Fulfillment
 The Viability of Modern Pick-to-Light Systems How Advances in Hardware and Software Address the Challenges of Omnichannel Fulfillment The Viability of Modern Pick-to-Light Systems www.intelligrated.com
Proceedings of the 2014 Winter Simulation Conference A. Tolk, S. Y. Diallo, I. O. Ryzhov, L. Yilmaz, S. Buckley, and J. A. Miller, eds.
 Proceedings of the 2014 Winter Simulation Conference A. Tolk, S. Y. Diallo, I. O. Ryzhov, L. Yilmaz, S. Buckley, and J. A. Miller, eds. FROM SIMULATION TO REAL-TIME TRACKING AND OPTIMIZATION Hosni Adra
AN INTEGRATED MODEL OF STORAGE AND ORDER-PICKING AREA LAYOUT DESIGN
 AN INTEGRATED MODEL OF STORAGE AND ORDER-PICKING AREA LAYOUT DESIGN Goran DUKIC 1, Tihomir OPETUK 1, Tone LERHER 2 1 University of Zagreb, Faculty of Mechanical Engineering and Naval Architecture Ivana
A simulation model of a retail distribution centre with RFID technology
 A simulation model of a retail distribution centre with technology Hellström, Daniel 2003 Link to publication Citation for published version (APA): Hellström, D. (2003). A simulation model of a retail
Cornerstone Solutions, Inc.
 Blueprint for Success Cornerstone Solutions, Inc. An implementation guide based on 50+ WMS Implementation Projects White Paper Introduction You know that implementing a WMS can increase your operation
P11 Handling and Storage E212 - Facilities Planning and Design
 P11 Handling and Storage E212 - Facilities Planning and Design Material Handling Is the art and science of moving, storing, protecting and controlling material. Means providing the: Right amount of Material
Warehouse Manager X3
 www.datalinx.co.uk Datalinx have been providing Sage users with warehouse solutions for in excess of 25 years. In line with other Datalinx systems, we analysed the functionality within the core Sage X3
Increasing Distribution Center Title Productivity Using Automated Put Walls
 Increasing Distribution Center Title Productivity Using Automated Put Walls Sure Sort Applications Executive Summary: In April 2017, OPEX Corporation introduced its latest technology, Sure Sort
Case study: AS Healthcare Streamline order preparation to increase warehouse throughput
 Case study: AS Healthcare Streamline order preparation to increase warehouse throughput Location: France Mecalux automated a portion of the warehouse that AS Healthcare owns close to Paris in order to
CASE STUDY. How JTV, an omnichannel retailer, increased productivity and reduced delivery time by utilizing SSI SCHAEFER Automation. ssi-schaefer.
 CASE STUDY How JTV, an omnichannel retailer, increased productivity and reduced delivery time by utilizing SSI SCHAEFER Automation. ssi-schaefer.com ABOUT JTV JTV Jewelry Television (JTV) is one of the
White Paper. your operation.
 10 Signs It s Time To Rethink Your Intralogistics White Paper Uncovering one or more of these symptoms might indicate it s time to consider a new methodology for handling inventory, components, goods and/or