HAN Phase 3 Impact and Process Evaluation Report
|
|
|
- Avice Parrish
- 6 years ago
- Views:
Transcription


1 REPORT HAN Phase 3 Impact and Process Evaluation Report December 2014 Submitted by Nexant Candice Churchwell, Senior Consultant Michael Sullivan, Ph.D., Senior Vice President Dan Thompson, Analyst II Jeeheh Oh, Project Analyst II
2 Table of Contents 1 Executive Summary Project Overview Evaluation Goals and Objectives Report Overview Impact Evaluation Methodology Approach to Matching Matching for SmartRate and TOU Demand Matching for SmartRate and TOU Energy Savings Econometric Analysis Datasets Impact Evaluation Results Load Impacts during Peak Periods SmartRate Peak Period Load Impacts E-6 TOU Peak Period Load Impacts EV-TOU Peak Period Load Impacts Energy Conservation Effects Energy Conservation Savings for SmartRate Customers Energy Conservation Savings for E-6 TOU Participants Energy Conservation Savings for EV TOU Participants Load Impact and Conservation Analyses Summary Process Evaluation - Reported Customer Experience Survey Findings Registering and Joining the HAN Device Experiences with PG&E Customer Service Reasons for Enrolling in the Pilot HAN Device Operability HAN Device Usage Preferences Engagement with the HAN Device Change in Energy Use-related Behavior Satisfaction with HAN and Interest in Other Energy Savings Opportunities Customer Focus Groups i
3 5.2.1 Participant Pilot Expectations and Performance Assessments What Information Attracts Participants Attention? What Did Participants Do with HAN Information? Other Discussion Topics Conclusions Call Center Operator Focus Groups Characterizing Typical and Atypical HAN-related Customer Contact Training and Reference Material Effectiveness CCO Interface with HAN Stakeholders Supporting HAN in the Future First Priority Recommendations for Enhancing HAN-related Customer Service Conclusions and Recommendations Appendix A Customer Survey Instruments A.1 Initial Survey A.2 Final Survey Appendix B Tabulated Survey Responses B.1 First Survey B.2 Second Survey Appendix C Customer Focus Group Discussion Guides C.1 Aztech Guide C.2 Bidgely Guide Appendix D CCO Focus Group Discussion Guide Appendix E Summary of CCO Call Recordings ii
4 Executive Summary 1 Executive Summary The Pacific Gas and Electric Company (PG&E) Home Area Network (HAN) Phase 3 pilot was launched to help participating residential as well as small and medium business (SMB) customers monitor their electricity usage and costs in real-time, better understand the monthly cost of their electric consumption, and reduce their peak demand and/or conserve electricity usage. Two types of HAN technology were tested that present six informational elements concerning electricity usage: Real-time price ($/kwh); Real-time electricity usage (kw); Real-time electricity cost ($/h); Estimated electricity costs to date ($); Estimated electric bill this month ($); and For SmartRate TM customers, and in addition to their standard day-ahead alert, a reminder that a SmartDay TM event will occur. Table 1-1 describes four primary operational and evaluation objectives for the HAN Phase 3 pilot. This report summarizes the findings of the three evaluation objectives listed below. Table 1-1: Pilot Operational and Evaluation Objectives Operational Objective Develop and deploy PG&E HAN infrastructure to provide timely delivery of pricing and demand response messages to HAN devices. Evaluation Objective Determine whether customers perceive the information provided by HAN devices as an effective tool in managing energy consumption, whether the usage, pricing, and event information are useful as provided and provided at the appropriate frequency. Outcome Approximately 1,700 SmartRate and TOU residential customers were recruited to participate in May Two different types of HAN devices were delivered to participants in August HAN infrastructure was deployed and supported by staff representing the HAN Program, Smart Meter Operations Center, Call Center Operations, Marketing Solutions, and Demand Response Measurement and Evaluation organizations at PG&E through December Outcome Two surveys of pilot participants were carried out, one four to six weeks after customers received their HAN device and another three months after they received it. These surveys inquired about HAN device functionality and use, reported behavioral changes in response to the information the device provided and overall satisfaction with the pilot. A focus group conducted with 10 customer service representatives from Call Center Operations (CCO) was held to learn about how well CCO staff felt they could meet pilot participants expectations and what resources could have best enabled them to meet participants needs. Four focus groups of approximately 10 pilot participants were conducted at the conclusion of the pilot. Measure the incremental effect of HAN devices on SmartDay demand response load impacts. Measure the effect of HAN devices on overall energy consumption. SmartMeter TM data for SmartRate pilot participants is used to estimate the incremental impact of the HAN device on SmartDay event load impacts. The load impact analysis also uses meter data from a control group of SmartRate customers who did not participate in the pilot. Meter data for pilot participants segmented by electric rate (E-6, EV-A and SmartRate) is used to estimate the energy savings attributable to the HAN device. The energy savings analysis also uses meter data from a control group of E-6, EV-A and SmartRate customers who did not participate in the pilot. 1
5 Executive Summary Pilot Deployment Both SmartRate and TOU customers were targeted for participation in the pilot. A total of 1,685 customers agreed to participate, where 1,001 were recruited from the SmartRate target base, and 584 were recruited from the TOU target base. With such a recruitment base, caution is indicated in interpreting the results of this study because the customers that were recruited to participate in the pilot are among the most highly engaged customers of the PG&E residential customer base. Devices were shipped to all participants on August 1, The devices tested in this pilot were installed, registered, and joined to the meter by the customer using PG&E s online self-service tools. According to pilot participants reports in a survey administered in November 2014, by the end of the pilot, approximately 88% of the HAN devices that had gone through the device registration and join process were still in operation. Load Impacts and Energy Savings The impacts of the HAN devices on customer electricity consumption were estimated for SmartRate, TOU (Schedule E-6), and electric vehicle (Schedule EV) TOU (Schedule EV-A) customers by comparing the participants actual electricity consumption before and after exposure to the HAN device with the energy consumption of a control group that was selected by matching on monthly energy consumption and load shape of the treatment customers prior to the start of the pilot. Impacts were estimated using three months of pretreatment hourly interval data (May through July 2014) and three months of hourly interval data collected after the devices were installed (August through October 2014). While a randomized controlled trial (RCT) or randomized encouragement design (RED) would provide more robust estimates of the impacts of the technology, it was not possible to employ randomization in this case. Instead, a control group was selected after the treatment group was identified using a propensity score model that was tested using cross-validation. To quantify the estimated difference in electric usage between the pilot participants and the matched control group, Nexant estimated a difference-in-differences fixed effects panel regression model expressing monthly consumption (kwh) and hourly demand (kw) as a function of treatment, time, and customer-specific effects. This approach accounts for pre-existing differences between the treatment and control group s electric usage. Using the panel regression method, the effects of exposure to the HAN devices appear to be directionally as expected toward a reduction in energy demand and consumption but this impact is generally overwhelmed by random noise. The only group that shows statistically significant changes in energy usage is the Schedule E-6 TOU customer group. On average, E-6 TOU HAN pilot participants show a 7.7% reduction in monthly electricity consumption. This impact, combined with an absence of an impact during on-peak hours, indicates that consumers are making behavioral changes during non-peak hours. These impacts combined are consistent with a hypothesis that consumers have already reduced their peak period use as much as they are willing to do in response to the E-6 peak period price signal, but the HAN information devices motivated them to modify usage during other hours in order to reduce their energy costs. The two other customer groups, SmartRate and EV TOU, showed energy savings of 0.8% and 1%, respectively, but neither of these energy savings estimates are significantly different than zero at the 90% level of confidence. With respect to on-peak demand, only EV TOU customers show statistically significant (at the 90% level of confidence) average hourly load impacts during EV TOU on-peak hours: the average hourly load impact during EV TOU on-peak hours is to be 5%. But it must also be noted that EV TOU load impacts are not statistically significant for about half of the hours during the on-peak period. The SmartRate and E-6 TOU participant groups showed average hourly on-peak demand savings of 3% and 1%, respectively, but these on-peak demand savings are not statistically significant with at the 90% confidence level. Table 1-2 presents the load impacts and energy savings estimates for all pilot segments. 2
6 Executive Summary Table 1-2: Average On-peak Hourly Demand and Monthly Consumption Impacts Quantity Group Number of Customers per Group HAN Customer Load Reference Load Impact Impact Impact 90% Confidence Interval Average Onpeak Hourly Demand Average Monthly Consumption (kw) / (kwh) (kw) / (kwh) (kw) / (kwh) (%) Lower Upper SmartRate 1, % E-6 TOU % EV TOU % SmartRate 1, % E-6 TOU % EV TOU 208 1,070 1, % Customer Impacts The customer impact evaluation activities found that the two devices offered to participants differed with respect to their initial attractiveness and how they were ultimately integrated into household use: Bidgely gateway devices are much more attractive to customers in terms of how well they meet current consumer preferences and expectations for new consumer electronics and technologies. Success in this area is evident in higher satisfaction ratings: Bidgely users reported a mean satisfaction rating of 8.1 on a scale with a maximum of 10; Aztech users reported a mean satisfaction rating of 7.3 on the same 10-point scale. However, only the Aztech in-home display became integrated into the household s daily life, by virtue of its design as an always on device that can be viewed by all members of the household during the regular course of the day. Participant surveys revealed startling differences in the frequency with which participants reported viewing information provided by the Bidgely gateway and the Aztech device: almost 50% of Aztech customers report looking at it more than once per day while the majority of Bidgely users report looking at the information provided by the device once a week. The Aztech device is also more successful at communicating to the customer what is currently happening with respect to electricity demands and costs, which provides users with a clear decision to make: Do I like what I see right now or do I need to change anything? Bidgely users did not focus their attention on realtime usage, and the historical information that Bidgely users did focus on began to look the same over time. The problem shifts from making a choice about what is happening now, to puzzling out whether what happened yesterday was good and what they should do differently today to get a different outcome. This approach begins to resemble how a customer might review their monthly PG&E bill. The customer research conducted in this study also reveals that Aztech users were significantly more likely to report taking actions to reduce electricity usage, to use their HAN device to deduce the loads of individual appliances, and to discuss the information they see on their HAN device with others, both within and outside the household. An area of strong agreement among all segments of pilot participants is that PG&E did not meet expectations for many customers with respect to the customer support provided to HAN users. Materials to guide customers through the registration and joining process were not adequate for many participants and not enough information was provided by the device manufacturers to teach customers how to use their devices most effectively. While customer satisfaction with PG&E Call Center Operations (CCO) telephone and support is greatly improved in this pilot relative to HAN Phase 1, PG&E needs to significantly improve the resources 3
7 Executive Summary made available to CSRs and SSRs so that they are better prepared to help customers with device registration and joining issues. Survey responses to questions inquiring about the perceived accuracy of the information provided by HAN devices indicates that there is room for PG&E to improve in delivering more accurate billing-related information to the HAN device, or to better inform participants of the limitations of the information they see on their HAN device, thereby helping to manage their expectations. Improvements in this area would likely require PG&E and HAN device manufacturer efforts on both fronts. For example, the bill forecast provided by the HAN devices gets more accurate over the course of each billing cycle. Customers satisfaction with and perceptions of the bill forecast s accuracy may improve if they had a better understanding of how the bill forecast is calculated. This report presents the evaluation findings of the residential component of the HAN Phase 3 pilot. Due to the fact that only 8 SMB HAN installations were in place as of January 1, 2015, the Program and Evaluation teams concurred in not moving forward with any interviews or surveys of such a small and likely unrepresentative sample. 4
8 Project Overview 2 Project Overview The Pacific Gas and Electric Company (PG&E) Home Area Network (HAN) Phase 3 pilot was launched to help participating residential and small and medium size commercial and industrial customers monitor their electricity usage and costs in real-time, better understand the monthly cost of their electric consumption, and enable them to reduce their peak demand and conserve electricity usage. Two types of HAN technology were tested that present six informational elements concerning electricity usage: Real-time price ($/kwh); Real-time electricity usage (kw); Real-time electricity cost ($h); Estimated electricity costs to date ($); Estimated electric bill this month ($); and For SmartRate customers, and in addition to their standard day-ahead alert, a reminder that a SmartDay event will occur. The overarching goal of this pilot is to build upon the PG&E HAN infrastructure developed for the Phase 1 and Phase 2 pilots by creating and communicating load control signals, such as price signals and demand response (DR) event alerts, to HAN devices. This update to the HAN platform, when used in conjunction with third-party devices, may help customers effectively manage their response to time-varying electric rates by reducing or shifting load. As such, residential SmartRate and time of use (TOU) customers are targeted for participation in the Phase 3 pilot. One of two different types of HAN technology was provided free of charge to pilot participants. The first device is a gateway from Bidgely, Inc. The gateway wirelessly connects to the customer s meter using a ZigBee radio and also has a wired ethernet port connection to the customer s router. The gateway must be placed within 75 feet of the customer s meter to retrieve the meter data and send it to Bidgely s cloud service. Bidgely serves the information to a website portal or app that can be installed on a customer s computer, tablet, or smart phone so that the customer can then see their electricity and cost information in real time using their PC, tablet, or smart phone. Figure 2-1 shows a picture of the Bidgely gateway. 5


9 Project Overview Figure 2-1: Bidgely Gateway The other HAN device offered to pilot participants is an in-home display (IHD) manufactured by Aztech Associates, Inc. The IHD also connects wirelessly to the meter using a ZigBee radio, but the unit does not require an internet connection. The Aztech unit displays electricity usage and cost information directly on its own display, which can be placed wherever it can be plugged in to receive power through an AC adapter. According to the manufacturer, the device must be placed within 75 feet of the customer s meter. The unit has batteries which enables portable use for short periods of time. Figure 2-2 shows a picture of the Aztech IHD. Figure 2-2: Aztech In-home Display 6
10 Project Overview The pilot was designed to accommodate up to 1,700 residential SmartRate participants. Since HAN Phase 3 was not the only pilot or program targeting PG&E s SmartRate customers in the summer of 2014, the SmartRate population was segmented to prevent over-marketing to any subset of customers. The HAN Phase 3 pilot was allocated 8,000 SmartRate customers for recruitment. Since it was uncertain what the uptake would be for the participation offer made to SmartRate customers, TOU customers were also targeted; approximately 5,000 TOU customers were allocated for HAN Phase 3 pilot recruitment as well. Overall, customers who were targeted for recruitments reside in single family homes, 1 have provided PG&E with a valid address, do not receive net energy metered (NEM) electric service, and do not participate in SmartAC. During the recruitment process, screening questions were used to ensure that the customer s likely device installation location was within 75 feet of their electric meter. Customers interested in taking the Bidgely gateway offer were also required to have broadband internet service. Pilot recruitment took place in May and June 2014 using both and outbound calling communication channels. Approximately 3,000 SmartRate customers and 2,500 TOU customers were contacted by or telephone for recruitment in May and June Interest in the devices was high 35% of customers contacted elected to participate in the pilot, compared with a typical 7-10% pilot participation rate. However, customers in the target base for this pilot are highly engaged customers on time-varying rates and are much more likely to be interested in participating than the typical residential customer. The recruitment process was designed to sign up half the participants for the Aztech device and half for the Bidgely device. The uptake rate for Bidgely devices was higher than that of the Aztech devices, so recruitment messaging was adjusted to prioritize Aztech uptake and ensure that both Aztech and Bidgely devices were fully subscribed. In total, 1,685 customers were recruited to participate, where 1,001 were recruited from the SmartRate target base, and 584 were recruited from the TOU target base. Devices were shipped to all participants on August 1, Aztech devices were shipped to 841 participants and Bidgely devices were shipped to 844 participants. The participants were required to register and join their HAN devices on their own; instructions for the registration and joining process were included in the device shipment. The registration and joining process was designed to take customers minutes to complete. 2.1 Evaluation Goals and Objectives The primary objectives of this evaluation are to estimate demand response load impacts for SmartRate customers, on-peak load reductions for TOU customers, and energy savings for all customers that are attributable to the HAN device. Additionally, this evaluation collects and analyses information to gain an understanding of participants experience in this pilot and their assessment of and satisfaction with the information they received via their HAN devices. The load impact and energy savings estimation is accomplished by using hourly load data recorded by participants meters both before and after introducing the HAN device to their household. The load impact evaluation also uses meter data from a control group of customers who did not participate in the pilot. The process evaluation relies on three primary sources of information: Two surveys of pilot participants, one four to six weeks after customers received their HAN device and another three months after they received it. These surveys inquired about HAN device functionality and use, reported behavioral changes in response to the information the device provided and overall satisfaction with the pilot; 1 Customers who live in multi-unit dwellings were permitted to participate if they reported that their home was within 75 of their SmartMeter. 7
11 Project Overview A focus group with 10 customer service senior service representatives from PG&E s Call Center Operations (CCO) was held to learn about how well CCO staff felt they could meet pilot participants expectations and what resources could have best enabled them to meet participants needs; and Four focus groups of approximately 10 pilot participants at the conclusion of the pilot. 2.2 Report Overview The remainder of this report is organized as follows. Section 3 presents the methodology used to estimate load impacts and energy savings. Section 4 presents load impact and energy savings estimates. Section 5 presents an analysis of the surveys and focus groups, and Section 6 concludes this report with recommendations. 8
12 Impact Evaluation Methodology 3 Impact Evaluation Methodology The prior section provided a high level overview of the pilot objectives and design. As indicated, assessing the impact of information feedback devices on demand response and overall energy use were not the primary objectives of the pilot, but they were important objectives. This section summarizes the methods used to estimate load impacts while Section 4 presents the impact evaluation results. The methods used to estimate load impacts from a pilot or experiment are a function of research design. The gold standard of experimental design is a randomized control trial (RCT) or a randomized encouragement design (RED). The primary objective of these designs is to ensure that any difference in usage between customers who do and don t experience the treatment, or the difference in usage for treated customers before and after treatment, is due to the treatment and not some other factor. Comparing usage for treated customers before and after a treatment condition is in effect, referred to as a within-subjects design, is problematic because other factors, such as changes in weather, changes in economic conditions, or changes in household behavior unrelated to the treatment itself, can cause changes in electricity usage over time. Estimating impacts by comparing usage between customers who experience the treatment and those who don t can be subject to selection bias. RCT and RED research designs isolate the treatment effect from other factors that might lead to changes in the outcome variable of interest, or to differences between treatment and control groups. With an RCT, participants (randomly selected or volunteers) are randomly assigned to treatment and control conditions (with the treated customers receiving the information feedback devices), thus ensuring that the only difference between the two groups other than the treatment itself is due to random chance. With large samples, these random differences are quite small. With small samples, these differences can be larger but can be adjusted for using what is referred to as a difference-in-differences calculation in which the impact of the treatment is calculated as the difference in usage between treatment and control customers after the treatment is in effect minus the difference in usage prior to the treatment going into effect. With a RED, a randomly selected subset of customers are encouraged to take the treatment, while encouragement is withheld from the control group. With this design, a two-step process is used to estimate the treatment effect on those who select the treatment. Although pilots that successfully implement RCT or RED methods are unequivocally preferred over all other methods from the perspective of internal validity, both approaches are challenging to implement. For any voluntary offering, an RCT requires that customers be assigned to treatment and control conditions after volunteering to participate in a pilot. Denying customers who have volunteered for the treatment condition, in this case, those who have requested either an Aztech IHD or Bidgely gateway, can lead to customer dissatisfaction. Even more challenging is the fact that, with any technology-related pilot, a true RCT is virtually impossible to implement because many customers who ask for the technology may not be able to successfully deploy it or may not even try to do so after receiving it. For example, in this pilot, about 18% of all volunteers who asked for the technology did not successfully connect (or also referred to as join ) their device with the meter either because of connection difficulties or because they didn t try to connect it. Since customers who do and don t successfully connect the device to the meter may not be a random subset of the volunteer population, impact estimates based on a comparison of customers with and without the device installed will be subject to selection bias. This bias can be eliminated by analyzing the RCT as an RED but this requires larger customer samples, which can be costly with technology pilots. Larger sample size requirements, especially with technology pilots, are the primary problem with implementing an RED. REDs do not deny access to volunteers like RCT designs, but depending on the magnitude of the acceptance rate (for customers who receive offers) and the impacts of the feedback mechanism on energy consumption, the sample sizes required to support analysis of an RED must be inflated by orders of magnitude (over those needed for an RCT) in order to detect impacts. The RED design was rejected in this case because there simply were not sufficient project resources available to support it. 9
13 Impact Evaluation Methodology After considering and deeming the RCT and RED designs as non-implementable, Nexant recommended the use of propensity score matching to form a control group for the study. The advantage of propensity score matching is that it is designed to create a non-equivalent control group that is as similar as possible to the treated group before the onset of the treatment based on observable variables. That is, after customers selfselect into the pilot, a control group is selected from amongst customers who were not offered access to the pilot by finding customers with usage patterns and other characteristics that are as similar as possible (statistically) to those who do volunteer prior to the treatment going into effect. Once this statistically matched control group is selected, the analysis proceeds in the same manner as it would for an RCT design, as discussed further below. While the internal validity of a matched control group design is not as strong as it is for RCT and RED designs, this method is widely used for impact evaluation because it avoids the challenges associated with RCTs and REDs as outlined above and is typically superior to within-subjects designs, which require controlling for the potential influence of other factors that might influence energy use over time, which can be difficult. 3.1 Approach to Matching For this pilot, a technique called propensity score matching was used to select a control group based on similarities in observed variables such as overall electricity use and by time of day. Propensity score matching uses data from before the intervention to estimate a probit model that predicts the probability that an individual would have been selected for and participated in the treatment. The population of participating customers and a sample of non-participating customers are used to estimate the probit model. Once the probit model has been estimated, it can be used to calculate the probability that a customer (treated or not) participates in the treatment. The probability of participation is estimated for treated and untreated customers and is used to find pairs containing one participant and one non-participant that have the most similar probabilities. For this part of the evaluation, the goal is to find the effect of the HAN devices on energy demand during SmartRate and TOU hours as well as energy consumption for SmartRate and TOU customers. Each of these variables is likely associated with different pre-treatment variables. Four models were developed to estimate propensity scores: SmartRate demand during the peak period; TOU demand during the peak period; Energy consumption for SmartRate customers; and Energy consumption for TOU customers Matching for SmartRate and TOU Demand The objective of a propensity score model is to minimize pre-existing differences in demand during peak hours between the treatment and resulting control groups. A number of probit model specifications were investigated using the cross validation process described below. Prior to testing different model specifications, treatment and potential control customer populations were segmented by usage quartile, so, for example, only customers in the top usage quartile could be matched with treatment customers in the top quartile. For customers on TOU rates (not SmartRate customers), roughly half of the participant population had electric vehicles (as evidenced by the fact that they were on PG&E s EV-TOU rate rather than the E-6 tariff). Since EV owners have very different usage profiles than non-ev owners (with much higher electric consumption during overnight hours due to charging the vehicle), matching was done separately for these two sub-segments of the TOU treatment group. That is, only EV-TOU non-participants were matched to EV-TOU pilot participants and only E-6 nonparticipants could be matched to E-6 pilot participants. 10
14 Impact Evaluation Methodology Within the customer segments described above, 12 different model specifications were tested as summarized in Table 3-1. In the table, each X in a cell represents a variable or set of variables that were included in the model. For example, model 6 included variables for average demand during each peak-rate hour, average demand during a selection of off-peak hours, and total consumption for the average pre-treatment day. Table 3-1: Probit Model Specifications Tested for Control Group Selection Hourly Demand Variables Aggregate Variables Model # Peak- Rate Hours Off-Peak- Rate Hours Total Consumption Total Peak-Hour Consumption Standard Deviation of Demand in Average Day 1 x 2 x 3 x x 4 x x 5 x x 6 x x x 7 x X 8 x X 9 x x X 10 x x X 11 x x X 12 x x x X Each of these models can reasonably be proposed to achieve the goal of reducing pre-treatment differences between the treatment and control groups, but it is difficult to know how well one performs against another when evaluating it based on data from the treatment period. A strategy for determining the effectiveness of each model entirely before the treatment period, known as cross-validation, is useful in this setting. A crossvalidation is conducted in five steps: 1. The analyst breaks the pre-treatment data into parts. In the case of SmartRate, the 10 SmartRate days before treatment provided a natural division of the data into 10 parts. Sixty-three days of pre-treatment data were available for TOU participants, so each of the days was randomly put into one of 10 buckets. 2. The analyst runs each propensity score model on all but one of the segments of the data. This is done to simulate a situation in which the propensity score match is conducted on pre-treatment days and is expected to still hold on treated days. In this case, that means 9 out of the 10 SmartRate days are used to conduct a match; as are 90% of the TOU days. 3. A control customer is selected for each treatment customer on the basis of the model that was fit on this restricted dataset. 4. A simple analysis is run to see how similar the treatment and control groups are in the one segment of the data that was left out. This is done to simulate the way the matching model would behave in the real situation of using pre-treatment data to minimize non-treatment related differences in energy demand. Since this data is still actually from before the treatment, there should be no differences between 11
15 Impact Evaluation Methodology treatment and control customers. Variables that characterize the bias created by and the degree of error in each model are then saved. 5. Steps two, three, and four are repeated; holding out each of the data segments one at a time. This means that in this case, there are 10 loops through steps 2, 3, and 4 for each of the 12 models, producing results for 120 models. 6. The results for each run of a single model are combined so that there is one set of performance measures for each model. The models are ranked based on their performance and selected primarily based on their ability to minimize error and bias during peak-rate hours. Once the model that performs best under cross-validation has been selected, it is used on all of the pretreatment data to select a matched control group Matching for SmartRate and TOU Energy Savings The process for finding a matched control group that performs well for assessing energy savings is more straightforward. A probit model that uses total energy consumption for each month before the treatment period during which summer weather and summer electric rate schedules were in effect (May, June, and July) was estimated. Electricity usage during these three months were used as the basis of comparison because the treatment period also covered three months when summer weather and summer electric rates were in effect. The model was used to predict treatment assignment for each control and treatment customer, and each treatment customer was paired with the most similar control customer in terms of predicted probability of treatment assignment. 3.2 Econometric Analysis In using a matched control group, the analysis procedures used to identify treatment effects are the same as those used to estimate treatment effects for an RCT a fixed-effects regression controlling for betweensubjects and temporal effects. A fixed effects regression of this kind is a generalization of the simple difference-in-differences approach. Difference-in-differences models eliminate any meaningful pre-existing differences between the treatment and control groups because all of the variables in the estimation equation are expressed as deviations from their respective means. In this way, a difference-in-differences model allows the analyst to isolate the different ways in which the treatment and control groups change from the pretreatment to the treatment period. Conceptually, a difference-in-differences impact estimate is calculated as shown in Figure
16 Impact Evaluation Methodology Figure 3-1: Difference-in-differences Estimation Estimates of demand impacts for SmartRate and TOU are developed for different hours due to the differences in when the two programs are intended to have the most effect on demand, but the estimates are developed in the same way. The average impact of having a HAN device on average demand for each hour in the period of interest and over the entire period is estimated using the same time and individual fixed-effects regression. Estimates for the impact of having a HAN device on monthly energy consumption are also calculated the same way for SmartRate and TOU customers using a fixed-effects regression. A general version of the fixed-effects model used in this analysis is specified below. It includes a series of indicator variables for each individual and time period, which is mathematically equivalent to expressing each variable for a given customer as the deviation from that customer s mean for that variable on that day. m n demand it = a(treat i post t ) + b d date t + c p cust i + e it d=1 p=1 Where: demand it is demand for a given customer on a given day; treat i is an indicator specifying whether that customer is in the HAN program;, post t indicates whether it is after or before the treatment went into effect; m is the number of days; and n is the number of customers. 3.3 Datasets PG&E provided Nexant with data on each customer s rate schedule, SmartRate participation, HAN participation, and whether or not they were contacted to participate in the pilot and interval data from May 1 through October 31, Hourly temperatures for the same time period were also provided. 13
17 Impact Evaluation Results 4 Impact Evaluation Results This section presents the estimated impacts from the HAN Phase 3 pilot. Section 4.1 presents estimates of the impact of information feedback on peak demand for SmartRate and TOU customers. Section 4.2 shows the impact on overall energy use. It should be kept in mind that the pre- and post-treatment periods for this pilot were only three months long and there were only two SmartDays after installation of the devices. As such, the findings presented here are based on limited time periods. Results could have been different if customers had the devices for the entire summer and impacts on energy conservation might differ between summer and winter periods. 4.1 Load Impacts during Peak Periods The estimated impact of information feedback during the peak period for SmartRate and TOU customers presented here represents the incremental impact of information feedback over and above the load reductions that result from the peak period price signals associated with each rate. Put another way, the objective is to determine if customers on SmartRate and TOU reduce load more as a result of receiving and using the Aztech and Bidgely information devices, and receiving messages from PG&E through these devices, compared with SmartRate and TOU customers who do not have these devices, and receive their event day alerts through standard , text, or voic communications channels. It should be noted that the estimated impacts in each case are for the combined population of Aztech and Bidgely users. Estimates were also estimated for Aztech and Bidgely users separately to see if impacts differed across device types. No statistically significant difference in impacts was found by device type, perhaps due largely to the small sample sizes for the population of participants by device type. The number of devices installed and used for load impact estimation by rate and device type is shown in Table 4-1. Table 4-1: Number of Installed Devices by Rate and Device Type Demand Impacts Monthly SR TOU (E-6) TOU (EV-A) SR TOU (E-6) TOU (EV-A) Both Devices 1, , Aztech Bidgely SmartRate Peak Period Load Impacts The propensity score model selected according to the results of the cross-validation exercise discussed in Section 3 included variables for demand that determine overall load shape characteristics and total consumption. These variables were demand during the hours ending at 7 am, 1 pm, 6 pm, and 9 pm as well as total consumption during SmartRate hours. Figure 4-1 shows the load shapes for treatment customers and the statistically matched control group on the average SmartDay prior to the information devices being installed by treatment customers. As seen, differences in average SmartDay loads are small in all hours and essentially zero during the peak period hours on which the matching was based. Put another way, the propensity model did an excellent job of matching treatment and control customers on the observable variables chosen for the model. 14
18 0 kw Impact Evaluation Results Figure 4-1: Treatment and Control Group Loads on the Average SmartDay Prior to Installation of HAN Devices Hour Non-HAN Customers HAN Customers Following this match, a fixed-effects regression model was used to estimate the impact of the HAN device during SmartRate event days. Figure 4-2 and Table 4-2 summarize the results of this analysis. The reference load in both the figure and the table is the model s prediction of the average demand for treated individuals if they had not been treated. Table 4-2 shows the estimated impacts by hour in both absolute and percentage terms, and the 90% confidence band for the absolute impacts. It also shows the average reduction across the five-hour peak period from 2 to 7 pm. All of the hourly impacts are in the expected direction that is, they show greater peak period load reductions for customers that have the HAN devices relative to SmartRate customers who do not have the devices and the percentage difference ranges from 0 to 7% with an average of 3% across all on-peak hours. However, all confidence bands span or include 0, which means that the estimated impacts are not statistically significant at the 90% confidence level. Put another way, there is more than a 10% chance that the estimated difference would be observed by chance even if the HAN device effect has no effect. The estimating sample included more than 500 treatment and 500 control customers. A larger sample would provide greater estimating precision and might find that the observed differences are statistically significant with a high degree of confidence. 15
19 0 kw Impact Evaluation Results Figure 4-2: SmartRate Treatment and Reference Load by Hour Hour Reference - Diff-in-Diff HAN Customers Table 4-2: SmartRate Load Impacts by Hour Hour Ending 2 HAN Customer Load Reference Load Impact Impact Impact 90% Confidence Interval (kw) (kw) (kw) (%) Lower Upper % % % % % Average % E-6 TOU Peak Period Load Impacts The impact estimation for TOU rates was done separately for E-6 and EV-TOU participants, since the underlying load shapes of these two customer segments are quite different. Unfortunately, this necessary separation of the sample means that the sample sizes for each segment are quite small, equaling just 278 customers for E-6 and 206 customers for EV-TOU. These small sample sizes mean that it is more difficult to obtain a close match and that the standard errors associated with the estimates will be much larger than they would be with larger samples, which decreases the statistical precision associated with the results. Figure 4-3 shows the reference and treatment group loads for E-6 customers for the three-month period prior to device installation. As seen, the match is still good during the peak period hours, which were the primary basis for the match, but there are larger differences in other hours than was seen for the SmartRate sample in Figure 4-2. The peak period hours for E-6 are from 1 pm to 7 pm. 2 Hourly loads are reported on an hour-ending basis, that is, reported hourly loads reflect the average demand during the period ending the given hour. For example, load reported for hour ending 15 represents average load during the period 2:00 pm to 3:00 pm. 16
20 0 kw kw Impact Evaluation Results Figure 4-3: TOU E-6 Control and Treatment Group Loads Prior to Installation of HAN Devices Hour Non-HAN Customers HAN Customers Figure 4-4 and Table 4-3 show the estimated E-6 impacts for each peak period hour and on average across the peak period as a whole. As seen, the estimated impacts are de minimis and are not statistically significant. Although the SmartRate peak period impacts were not statistically significant, they were at least suggestive that the HAN devices influenced peak period reduction. That is not the case here, where there is no suggestion that the HAN devices had any impact on peak period energy use for E-6 customers. As is seen in a later section, however, the devices may have produced a conservation effect for E-6 customers, but did not do so for SmartRate customers. Figure 4-4: E-6 TOU Treatment and Reference Load by Hour Hour Reference - Diff-in-Diff HAN Customers 17
21 0.5 1 kw Impact Evaluation Results Table 4-3: E-6 TOU On-peak Savings by Hour Hour Ending HAN Customer Load Reference Load Impact Impact Impact 90% Confidence Interval (kw) (kw) (kw) (%) Lower Upper % % % % % % Average % EV-TOU Peak Period Load Impacts EV-TOU pilot participants were matched using a propensity model that included variables for demand during the hours ending at 7 am, 1 pm, 6 pm, and 9 pm. The results of the match are displayed in Figure 4-5. This match did not perform as well as the others, but this was expected given the small number of customers for whom this rate applies within the study. The average impact across the entire peak period is 1%. Figure 4-5: EV-TOU Control and Treatment Group Loads on the Average Weekday from May 1 through July Hour Non-HAN Customers HAN Customers Figure 4-6 and Table 4-4 show the estimate impacts for each peak period hour from noon until 9 pm for EV- TOU customers. The estimated hourly impacts range from 1 to 9% and are statistically significant at the 90% confidence level for about half the hours. 18
22 0.5 1 kw Impact Evaluation Results Figure 4-6: Electric Vehicle TOU Treatment and Reference Load by Hour Hour Reference - Diff-in-Diff HAN Customers Table 4-4: Electric Vehicle TOU On-Peak Savings by Hour Hour Ending HAN Customer Load Reference Load Impact Impact Impact 90% Confidence Interval (kw) (kw) (kw) (%) Lower Upper % % % % % % % % % Average % Energy Conservation Effects The prior section summarized the estimated impacts of HAN devices on peak period energy use for three customer segments, those on SmartRate, those on the E-6 TOU rate and those on the EV-TOU rate. This section examines the impact of the devices on overall energy use. Whether or not the devices produce larger impacts during the peak period, they may impact participant interest in managing their energy use and bills and could lead to reductions in energy use overall. This issue is explored in the remainder of this section Energy Conservation Savings for SmartRate Customers As detailed in Section 2, separate control group samples were chosen for the analysis of peak period impacts and conservation savings. The propensity score model for energy savings consisted of one variable 19
23 Impact Evaluation Results representing the total energy consumption for each of the pre-treatment months of May, June, and July. Table 4-5 details the pre-treatment monthly consumption for the average HAN customer and the average of their matched non-han control individual. The differences between the two groups are quite small, indicating that the control group is a good match with the treatment group on this critical variable. Table 4-5: SmartRate Monthly Energy Consumption, Pre-treatment Month HAN Customer Consumption Non-HAN Customer Consumption kwh 511 kwh kwh 513 kwh kwh 557 kwh Similar to the fixed-effects model run for the demand estimates, a dataset of monthly consumption and a generalization of a difference-in-differences strategy was used to estimate conservation savings. This model included dummy variables for every month and every individual. The treatment effect was estimated using an interaction term between the post-treatment indicator variable and a treatment indicator variable. The model was used to predict the impact for the average month and for each of the treated months. As seen in Table 4-6, the impacts are miniscule and are not statistically significant. Table 4-6: SmartRate Energy Savings by Month Month HAN Consumption Reference Consumption Impact Impact Impact 90% Confidence Interval (kwh) (kwh) (kwh) (%) Lower Upper Aug % Sep % -9 7 Oct % 1 22 Avg % Energy Conservation Savings for E-6 TOU Participants As for SmartRate customers, E-6 TOU HAN participants were matched with non-participants based on pretreatment monthly consumption. Table 4-7 shows the pretreatment differences for each month between the treatment group and the statistically matched control group. This match was less effective for E-6 TOU customers as expected given the smaller control pool and smaller number of participating customers. However, given the estimation methodology used, which includes subtracting these pretreatment differences from the observed difference between treatment and control customers after the HAN devices were installed, the estimated impacts should still be reasonably accurate. 20
24 Impact Evaluation Results Table 4-7: TOU E-6 Monthly Energy Consumption, Pre-treatment Month HAN Customer Consumption Non-HAN Customer Consumption kwh 544 kwh kwh 545 kwh kwh 586 kwh Table 4-8 shows the estimate conservation effects for E-6 TOU customers for each month and for the overall treatment period. Unlike for SmartRate participants, the overall conservation effect for E-6 customers equals almost 8% and is statistically significant. This impact, combined with the lack of an impact during peak hours, indicates that consumers are making behavioral changes during non-peak hours. These impacts combined are consistent with a hypothesis that consumers have already reduced their peak period use as much as they are willing to do in response to the E-6 peak period price signal, but the HAN information devices motivated them to modify usage during other hours in order to reduce their energy costs. Table 4-8: E-6 TOU Energy Savings by Month Month HAN Consumption Reference Consumption Impact Impact Impact 90% Confidence Interval (kwh) (kwh) (kwh) (%) Lower Upper Aug % Sep % Oct % Avg % Energy Conservation Savings for EV TOU Participants A final control group was produced to match EV TOU customers on HAN with those not on HAN but otherwise similar during peak pricing periods. The match performed about as well as the energy savings match for E-6 TOU customers with even smaller pools of customers. Differences in monthly electricity use between the treatment and control groups during the pretreatment months are shown in Table 4-9. Again, the difference-indifferences estimation methodology largely controls for these pretreatment differences. Table 4-9: TOU EV Monthly Energy Consumption, Pretreatment Month HAN Customer Consumption Non-HAN Customer Consumption 5 1,061 kwh 1,034 kwh 6 1,061 kwh 1,026 kwh 7 1,176 kwh 1,122 kwh 21
25 Impact Evaluation Results Table 4-10 summarizes the savings estimates for EV-TOU customers. As seen, the estimated savings are quite small and are not statistically significant. Table 4-10: Electric Vehicle TOU Energy Savings by Month Month HAN Consumption Reference Consumption Impact Impact Impact 90% Confidence Interval (kwh) (kwh) (kwh) (%) Lower Upper Aug 1,117 1, % Sep 1,051 1, % Oct 1,041 1, % Avg. 1,070 1, % Load Impact and Conservation Analyses Summary The fixed-effects models estimated here using a matched control group point to a likely impact of a HAN device on SmartRate demand and E-6 TOU energy consumption. However, statistically significant impacts on on-peak electricity demand and monthly electric consumption could only be detected in the case of monthly consumption among E-6 TOU customers. Since these results were only for a small sample over a short time period, and the treatment was not subject to random assignment, there is still a lot to be learned about the true impact of these types of devices on behavior across different rate schedules. Importantly, all of the participants are in some way more engaged in understanding their energy use than the typical PG&E residential customer, and these results are specific to this population. This analysis of this pilot suggests that, even though these caveats are important, there may be a real effect of this treatment on residential energy use to be found upon further investigation. 22
26 Process Evaluation - Reported Customer Experience 5 Process Evaluation - Reported Customer Experience This section summarizes the study of customer reactions to the technologies and information provided to them during the pilot. To assess the impact of the technologies and information on customers, Nexant conducted two surveys at different points in time during the pilot as well as four focus groups carried out at the end of the pilot. In addition, Nexant carried out a focus group with CCO personnel to collect their opinions about the practices employed in handling customers and customers feedback regarding their experiences. The results of these efforts are summarized below. 5.1 Survey Findings Two internet surveys were administered to pilot participants in the course of the study. The first survey was fielded in September about a month after participants had received their HAN devices in the mail. The second survey was sent about two months later in late November, shortly after the analysis period for load impacts and energy savings was cut off on October 31. In both surveys, invitations were sent via to 1,364 participants who had, by September 18, joined or attempted to join their device to their meter. The first survey closed on October 6, after two reminder s and telephone calls were made to non-respondents on September 25 and October 2. About 91% of customers responded to the first survey. The second survey closed on December 1 after two reminder s were sent -- on November 20 and November 25. Reminder telephone calls were not used for the second survey due to the close timing of the survey close date with the Thanksgiving holiday. The second survey achieved an 85% response rate. Respondents received a $50 appreciation check for completing the first survey and a $25 appreciation check for completing the second survey. This section presents key findings from both surveys and compares results from questions that appeared in both surveys. Both survey instruments and complete tabulated survey responses are provided for reference in Appendices A and B Registering and Joining the HAN Device The first survey asked a number of questions about the customer s experience in registering and joining their device to their meter. The first survey was administered a month after participants received their devices in the mail giving them ample time to connect the devices to their respective meters. Table 5-1 describes customer responses to questions about the information they received that was designed to assist them in connecting their devices to the meter. Table 5-1: Customer Opinions about Information Provided by PG&E PG&E provided information that came with the Strongly Disagree Strongly Agree Top 2 Box device to assist device registration and joining: Provided useful information 3% 2% 1% 2% 7% 5% 12% 21% 19% 28% 47% Was easy to understand 3% 2% 3% 4% 7% 6% 12% 22% 17% 24% 41% Provided all the necessary information for registering and joining my device to the Smart 5% 3% 3% 3% 6% 5% 9% 18% 18% 31% 49% Meter The process for registering and joining your device on PG&E's My Energy website: Was easy to understand 4% 3% 4% 4% 7% 6% 13% 22% 18% 21% 39% Can be completed in a reasonable amount of time 7% 3% 4% 3% 7% 7% 10% 18% 17% 24% 41% Was convenient for me 7% 3% 4% 4% 6% 6% 11% 19% 17% 23% 40% Most customers agreed that the information packets they received provided useful information; that it was easy to understand and that it provided all the information necessary to connect their devices and start their service. However there was a sizable minority (i.e., 8%-14%) that felt that the information they received was inadequate. A substantial fraction of customers (i.e., 17%-18%) also indicated that they did not believe the process for installing the devices was easy to understand, could be completed in a reasonable time or was 23
27 Process Evaluation - Reported Customer Experience convenient. So there is room for considerable improvement in supporting the HAN device registration and joining process relative to the information provided and customer expectations around ease of installation Experiences with PG&E Customer Service The first survey also asked whether respondents contacted PG&E Call Center Operations (CCO) for support pertaining to their HAN device. Overall, about 1/3 rd of respondents contacted the CCO for HAN-related support about 52% of Aztech customers and 19% of Bidgely customers. SmartRate customers were no more likely to contact CCO for HAN support than TOU customers. Figure 5-1 presents the customer service ratings as reported by respondents who stated they contacted PG&E during the course of the study. The overall top-two box score is 52% -- a response that indicates that customers were not highly satisfied with their interactions with the call center. The top-two box rating was slightly higher for customers calling about the Aztech device (57%) than it was for customers calling about the Bidgely device (38%). There were no significant differences in customer service satisfaction by rate schedule (i.e., SmartRate and TOU). Figure 5-1: Customer Ratings of Call Center Experience (1=Very Negative, 10=Very Positive) 40% 35% 30% 25% 20% 15% 10% 5% 0% While a third of all respondents contacted PG&E for support, nearly as many (24%) reported that they contacted either Bidgely or Aztech for support with their device. These HAN Phase 3 satisfaction scores demonstrate a remarkable improvement in CCO HAN-related satisfaction as measured in the HAN Phase 1 pilot. In the HAN Phase 1 pilot satisfaction ratings in the top two boxes were only about 18%. The greater reported propensity of Aztech users to contact PG&E CCO may be related to the fact that Aztech users are also more likely to say that they would like to receive more HAN-related educational or informational communications than Bidgely users. Figure 5-2 shows that in the first survey, nearly half (47%) of Aztech users said they would like to have more information about their device to about 30% of Bidgely users. Of those customers that indicated they wanted more information, 80% said they would prefer to receive the additional information by . 24
28 Process Evaluation - Reported Customer Experience Figure 5-2: Percent Answering They Would Like to Receive More Information 100% 90% 80% 70% 60% 50% 40% 30% 20% 10% 0% Gateway IHD Not sure No Yes Reasons for Enrolling in the Pilot Pilot participants were asked about their reasons for enrolling in the pilot in the first survey. Table 5-2 displays the importance ratings respondents gave for various reasons why they might have elected to participate in the pilot. The reason that received the highest average importance rating was: they wanted to better understand how their household uses energy. Lowering their PG&E bill was also a very important reason for participating along with finding ways to use less energy during on-peak hours. The compensation they received for participating in the study, which was tied to completing the surveys, was relatively unimportant in comparison to these other considerations. Table 5-2: Reasons for Enrolling in the Pilot Reason Average Rating To better understand how my household uses 9.1 To lower my PG&E bill 8.8 To help my household use less electricity during onpeak hours every day 8.6 To learn how much electricity each of my appliances use 8.3 To test out a new technology 8.2 To receive compensation for my feedback 5.9 [If rate=sr] To help my household use less electricity during SmartDay events HAN Device Operability The second survey inquired about whether or not the customer s HAN device was operational at the time of the survey at the end of November At that time, about 92% of Bidgely gateways were reported as operational while about 75% of the Aztech devices were reported as operational. In all, about 12% of the 25
29 Process Evaluation - Reported Customer Experience devices that had been commissioned or attempted to be commissioned were not three months after they were delivered to customers. Those customers that said their HAN device was not functioning were asked a series of follow-up questions. The majority of the devices that were reported as not functioning were never operational (60% for Bidgely and 40% for Aztech). That is, these devices never worked. Figure 5-3 shows the distribution of responses to the question of when the customers HAN device stopped working. Almost 20% of the IHD customers whose devices were not working reported that their devices stopped working in the first month after receiving them. This was not true of the Bidgely gateway with less than 5% reported to have stopped working within the first month of receiving them. The inescapable conclusion from this analysis is that the connectivity of the gateways is better than that of the IHDs. Aztech users were more likely to attempt to restart a non-functional HAN device: 91% of Aztech users attempted to restart their device while only 67% Bidgely users did. Nearly all respondents reported attempting to turn the device on and off to regain functionality, but Aztech users were far more likely to contact PG&E for help: 19 Aztech users (31%) reported that they called PG&E for support while only one Bidgely user (13%) reported doing so. Figure 5-3: Approximately when did your HAN device stop working? 3 Gateway IHD 70% 60% 50% 40% 30% 20% 10% 0% It never worked Within a month of receiving it A few days ago A few weeks ago Not Sure/Don't Know A key metric in determining the HAN devices success in providing the participants with the energy usage and cost information is whether or not users report seeing the various information elements provided by PG&E. Almost all of the users of the gateway and IHD devices reported seeing the important information elements presented by the systems. For example, 94% of Bidgely customers reported seeing their current usage while 89% of Aztech users reported the same. However, gateway users are slightly more likely to report seeing the important information elements transmitted by PG&E even after exposure to the devices for more than two months. Figure 5-4 shows a comparison of responses relative to the first and second survey in terms of questions about whether customers are seeing various information elements. The figure illustrates that pilot participants report seeing the current price of electricity, current usage, and the estimated electric costs to date with the same frequency: about 80-90% of respondents report that they have seen each of those elements. The figure also demonstrates that fewer participants have seen their estimated cost this month; about 70-85% of customers report seeing that 3 This survey question was asked of 12% of respondents who reported that their HAN device is not currently operational. 26
30 Process Evaluation - Reported Customer Experience information from their HAN device. Finally, Figure 5-4 also shows small increases in the reported frequency of seeing these HAN informational elements; by the time of the second survey, more respondents reported seeing each of the elements. It is evident that the awareness of customers towards these information elements improves slightly (more so for the IHD) over time; and that customers are slightly more likely to report seeing their current usage than other information elements. Figure 5-4: Customer Reported Viewing of Information Elements 100% Gateway 80% 60% 40% 20% Survey 1 Survey 2 0% Current price of electricity Current usage Cost of electricity used to date this month Projected monthly bill IHD 100% 80% 60% 40% 20% Survey 1 Survey 2 0% Current price of electricity Current usage Cost of electricity used to date this month Projected monthly bill Finally, respondents who stated at the time of the second survey that their device was currently operational were asked about intermittency in the functionality of their device. Specifically, they were asked if there were any occasions during the last 30 days when the device did not appear to be working. Slightly more Aztech users reported such occasions (34%) than Bidgely users did (27%). 27
31 Process Evaluation - Reported Customer Experience HAN Device Usage Preferences Customers were also asked which of the information elements they looked at most often 4. Figure 5-5 displays the distribution of answers to this question. The majority of respondents indicated that they viewed their current usage most often. By the time of the second survey, 58% and 52% of Aztech and Bidgely users reported looking at usage the most. The changes in these statistics from the first survey were not statistically significant. A smaller percentage of respondents indicated that they look at all information elements about the same. Figure 5-5: Information Element Viewed Most Often Gateway IHD 70% 60% 50% 40% 30% 20% 10% 0% Current price of electricity Current usage Cost of electricity used to date this month Projected monthly bill Look at all of them about the same Customers were also asked in both surveys to rate how useful each information element is for tracking and monitoring energy costs. A score of 1 indicates that the customer does not think the element is useful at all and a score of 10 means that they think it is very useful. Not surprisingly current usage is ranked the highest; respondents of the second survey give current usage a usefulness ranking of 9.1 and 9.0, for Bidgely and Aztech devices, respectively. The other HAN information presented on the devices received moderate scores for usefulness ranging from 7.4 and 7.9. Figure 5-6 shows the usefulness rankings for all elements by device type from the second survey. Virtually no changes in the usefulness rankings were seen between the first and second surveys. 4 Skip logic was used in the survey to limit the choices of which element the customer looks at most often to only those elements they report ever seeing on their device. The same skip logic applies to the subsequent follow-up questions described in this section. 28
32 Process Evaluation - Reported Customer Experience Figure 5-6: Rated Usefulness of Information Elements Gateway IHD Current price of electricity Current usage Cost of electricity used to date this month Projected monthly bill Since the Aztech device and Bidgely gateway represent not only a new technology, but also a new communication channel that the customer can tune in to for electricity-related information, the survey also asked the respondents to rate the accuracy of the information shown on the devices. Their ratings of the accuracy of the information channels provided mirrors the ratings of the channels usefulness. The top-two box scores on perceived accuracy for the current price of electricity, current usage, the cost of electricity used to date this month, and the projected monthly bill are 53%, 56%, 49%, and 41%, respectively. All of these scores indicate room for improvement in either delivering more accurate information to the HAN device, or better educating HAN participants on understanding that the information is accurate, or possibly better informing participants of the limitations of the information they see on their HAN device, thereby helping to manage expectations. Likely, improvements in this area would require PG&E and HAN device manufacturer efforts on all of those fronts. The full distribution of responses to this question is shown below in Figure 5-7. Notably, a cluster of respondents gave an accuracy rating of 5, which should be interpreted as a cluster of respondents who either don t have an opinion, or are not willing to assert an opinion, on the accuracy of the information they see on their device. Figure 5-7: Rated Accuracy of Information Elements 40% 35% 30% 25% 20% 15% 10% 5% 0% Current price of electricity Current usage Cost of electricity used to date this month Projected monthly bill Engagement with the HAN Device Engagement is an important metric for understanding the effectiveness of an information feedback device. The surveys contained several questions designed to assess the degree to which customers were paying 29
33 Process Evaluation - Reported Customer Experience attention to their devices over time. Did they return to them often? Did they discuss what they were seeing with others inside and outside their household? Did the information they received cause them to make any changes in the way the household uses electricity? The first survey revealed a startling difference in the frequency with which participants reported viewing the information provided by the Bidgely gateway and Aztech device. As is apparent in Figure 5-8, most of the Aztech customers (over 60%) reported looking at the device one or more times a day with almost 50% of such customers looking at it more than once per day. This is in stark contrast to the frequency of usage reported by Bidgely customers on the first survey. Only about 25% of customers with Bidgely devices reported looking at the device one or more times per day and only about 12% of these customers reported looking at their device more than once per day. Instead, the majority of the Bidgely customers (about 40%) reported that they looked at the device once a week. Figure 5-8: Frequency of Viewing HAN and Gateway Devices Gateway IHD 45% 40% 35% 30% 25% 20% 15% 10% 5% 0% More than once a day About once a day 2-4 times in the week Once in the week Never By the time of the second survey, Aztech viewing frequency had decreased somewhat (from 49% to 40% for more than once per day), with a concomitant increase in viewing only once a day or 2-4 times per week, but the change was not statistically significant. Bidgely users can view information through three channels their personal computer, their smart phone and a tablet. Figure 5-9 displays the reported frequency of usage of Bidgely customers through these channels. First, it is notable that the majority of users reported never viewing the information from the Bidgely system through their tablets or smart phones 5. This did not change between the first and second survey. Most Bidgely customers reported viewing their information on their personal computers; and as explained above, mostly on a weekly basis. Like the Aztech users, Bidgely users report viewing HAN information (through all channels) less frequently in the second survey. However, the decline in viewing for Bidgely customers was more dramatic. The numbers of customers who reported viewing Bidgely more than once a day fell across the board, and the number of customers who reported viewing Bidgely content once in the past week increased. A potentially valuable feature of HAN devices such as the Aztech and Bidgely is that they afford the customer an opportunity to learn about the demands of individual appliances in their home by turning them off and on 5 At the time of the first survey, Bidgely data was only available through the web portal. The mobile app was made available for viewing HAN information on a tablet or smart phone halfway through the pilot. 30
34 Process Evaluation - Reported Customer Experience experimentally and observing the resulting change in energy consumption. This can be done by taking note of the current electricity usage, and then turning on an appliance. Within a few moments, the HAN device will register the increase in electric demand. As long as other appliances are also turned on at the same time, the customer can deduce the demand of the appliance being tested as the difference between the two readings. At the time of the second survey, a significant fraction of users of both systems reported having used their HAN devices to investigate the energy consumption of their appliances in this manner. Aztech users are significantly more likely to report having used their HAN device in this way than Bidgely users; 55% of Aztech users and 43% of Bidgely users state that they (or someone else in the house) did this activity. Reports of using HAN devices to deduce appliance loads did not change between the two surveys. Figure 5-9: Frequency of Viewing Gateway Device by Channel Another indicator of engagement with HAN information is whether customers report discussing the information on the system with other members of their household or neighbors. Significant numbers of respondents using both systems reported having conversations with others about the information they are seeing via their devices 63% of Bidgely customers and 66% of Aztech customers. Interestingly, Aztech users are significantly more likely to have these conversations with children than Bidgely users are Change in Energy Use-related Behavior Respondents were asked whether they believed they had reduced their energy consumption as a result of the information they received from their HAN device; if so, follow-up questions probed to understand what actions they took resulted in the savings. Figure 5-10 shows that about 60% of customers with Aztech devices and a little more than 50% of customers with Bidgely devices reported that they think that they have saved energy as a result of receiving the device. While it can be said that a majority of participants believe they used electricity while participating in this pilot, a large number, about 45%, of participants do not believe that is the case or are not sure they saved energy. These survey responses are not at variance with the estimates of energy savings 31
35 Process Evaluation - Reported Customer Experience presented in Section 4, which were only statistically significant for E-6 TOU customers and de minimis for other participants. Figure 5-10: Percentage of Customers Saying They Saved Energy Gateway IHD 70% 60% 50% 40% 30% 20% 10% 0% Yes No Not sure Customers who stated that they thought their household had saved energy as a result of receiving their devices were then asked to describe any changes they or anyone else in the household may have made as a result of the information they received. Table 5-3 displays the incidence of reported actions taken by households in the study in response to the information they received. As expected, the majority of households reported turning off lights and other appliances not in use. A fairly substantial percentage of households also reported making investments designed to lower their energy consumption including: installing power strips to control vampire loads (18%-25%), installing CFLs (20%-23%), installing LEDs (38%- 40%), and purchasing energy efficient appliances (15%-18%). 32
36 Process Evaluation - Reported Customer Experience Table 5-3: Reported Actions Taken in Response to Information Device Type Stat. Sig. Please describe the changes you or others in your household have made Gateway IHD Diff (90%)? P-value* Turned off lights not in use 75% 82% Y 0.03 Turned off office equipment 44% 40% N 0.26 Turned off entertainment center 32% 31% N 0.87 Installed a power strip to control "vampire" loads 25% 18% Y 0.02 Installed compact flourescent lights (CFLs) 20% 23% N 0.48 Installed light-emitting diode lights (LEDs) 40% 38% N 0.62 Bought an energy efficient appliance 15% 18% N 0.24 Changed the setting on my manual thermostat to use less energy 16% 17% N 0.57 Re-programmed by programmable thermostat to use less energy 22% 21% N 0.63 Did fewer loads of laundry 32% 37% N 0.10 Did fewer loads of dishes 20% 28% Y 0.01 Only used cold water when doing laundry/dishes 15% 20% Y 0.08 Other 21% 28% Y 0.04 *p-values less than 0.1 indicate that gateway and IHD users' responses are significantly different at the 90% level of confidence. There appears to be an interesting difference in the changes reported by parties with Bidgely and Aztech systems. Customers receiving information from the Aztech system were significantly more likely to report making adjustments in their energy consumption-related behavior than parties receiving information through the Bidgely system (i.e., turning off lights, doing fewer loads of dishes and laundry, and using cold water for laundry and dishes). For SmartRate customers, the HAN devices employed in the study are capable of alerting customers to scheduled Smart Days. Two SmartDays had been called as of the time the first survey was conducted, and customers with both types of devices were asked in the survey whether they had received notice of Smart Days from their HAN devices. Figure 5-11 displays the percentage of customers with each type of HAN device that indicated that they had received notice of Smart Days from their HAN devices. Just over 50% of Aztech customers reported seeing alerts on their device, while only about 25% of Bidgely customers reported seeing alerts via the gateway but it is important to note that all SmartRate customers also receive SmartDay event alerts through other channels such as , text message, or phone. This result is not surprising considering the fact that only about 60% of Aztech customers reported viewing their system on a daily basis and considering the fact that relatively few Bidgely customers report viewing their system on a daily basis. 33

37 Process Evaluation - Reported Customer Experience Figure 5-11: Percentage Reported Seeing SmartDay Alerts via HAN Devices Satisfaction with HAN and Interest in Other Energy Savings Opportunities Customers were asked to rate their overall satisfaction with their devices on a 10 point scale ranging from 1 (very dissatisfied) to 10 (very satisfied). Figure 5-12 compares the reported satisfaction of customers with both systems. It has to be said that while the fraction of customers who were highly dissatisfied with these products was relatively small in both cases (2%-6%), the fraction of customers reporting that they were highly satisfied (customers in the top two boxes) is not as large as one would hope. Only about 47% of Bidgely customers reported they were highly satisfied, with a mean satisfaction rating of about 8.1 on a scale with a maximum of 10. Overall satisfaction with the Aztech device was lower, with about 33% of customers reporting they were highly satisfied with a mean of 7.3 on a 10 point scale. Reasons for dissatisfaction were explored in detail in the focus groups that are reported in Section 5.2. Figure 5-12: Customer Satisfaction Ratings for Overall System Gateway IHD 30% 25% 20% 15% 10% 5% 0% Customers were also asked whether they would recommend the device to a friend. Figure 5-13 indicates between 70% and 80% of participants said they would recommend the product to a friend. Given the lower 34
38 Process Evaluation - Reported Customer Experience satisfaction ratings for the IHD, as one might expect, IHD customers are somewhat less likely (70%) to recommend it to a friend than parties who experience the gateway (80%). Figure 5-13: Willingness to Recommend to a Friend Gateway IHD 90% 80% 70% 60% 50% 40% 30% 20% 10% 0% Yes No Not Sure Finally, customers were asked how interested they would be in acquiring a device that would automatically modify the energy use of their home on SmartDays. In particular, they were asked: Future HAN devices may be able to communicate with appliances in your home to provide an automatic response during SmartDays. For example, in the future a HAN device could send a signal to your thermostat to automatically raise the set point a few degrees during SmartDay events, or to delay running the dishwasher until the event period is over. Using a 10-point scale where 10 means you are very interested and 1 means you are not at all interested, please rate your interest in this kind of HAN device. Figure 5-14 displays the distribution of answers given by customers to this question. Figure 5-14: Interest in Appliance Control by HAN Gateway IHD 45% 40% 35% 30% 25% 20% 15% 10% 5% 0%
39 Process Evaluation - Reported Customer Experience Customers who received IHDs are significantly less likely to say they are interested in automatic controls of energy use in their home than customers who received gateways. Over 50% of pilot participants with gateways reported high interest in automatic controls for their appliances to help with programming their responses to SmartDay events. 5.2 Customer Focus Groups The survey data collected at the beginning and end of this pilot offers valuable information on the overall device registration and joining experience, how often customers are using their HAN devices, what their general impressions of the devices and the information they provide are, how they characterize household decisions about energy usage, and whether all these assessments, decisions, and attitudes have changed over the course of the pilot. But there are many follow-up lines of inquiry to these questions that are not possible to anticipate and incorporate into surveys that are short enough to administer by internet, telephone, or mail. In order to more fully understand how pilot participants used and responded to the information provided by the two devices, four focus groups were held in November The first two focus groups were held in Sunnyvale on November 18 and the last two were held in Fremont, on November 19. Two of the focus groups were dedicated to Aztech users and two were dedicated to Bidgely users. All groups were facilitated by Dr. Michael Sullivan, Senior Vice President of Utility Services at Nexant and were open to observation by PG&E staff. Audio and video recordings in addition to complete transcripts of the focus groups were provided to PG&E. The moderator s discussion guides for both sessions are provided for reference in Appendix C. The objectives of the focus groups were to listen to and record: Participants expectations for the pilot and their assessment of the performance of the devices; Their descriptions of the information they were attending to on their HAN device; How their usage of their HAN device changed over time; The actions participants say they are taking in response to the information provided by the HAN device; Their understanding of their electric rate and their interest in time-differentiated rates; and Their interest in advanced home energy management devices or services. By mid-november 2014, pilot participants had been using their IHD or gateway devices for three and a half months. Since focus groups are in-person group discussions, recruitment for focus group participants was limited to areas in the southern half of the Bay Area located within a reasonable distance to two research facilities located in close proximity to high concentrations of HAN pilot participants. To ensure that all participants could participate in discussions about their experience using the HAN device, recruitment was limited to customers that PG&E indicated had successfully registered and joined the device with their meter. 6 Focus group recruitment was conducted by telephone and participation was encouraged by a $200 cash incentive 7, which was paid to participants at the conclusion of each discussion. Each focus group was attended by between 8 and 11 pilot participants. Attendees were predominantly male and represented a broad range of professional occupations including engineers, assembly line workers, venture capitalists, and home makers. Each focus group had at most two women participants. The predominating profession represented in the focus groups was engineering, which is not surprising considering that this pilot is testing an emerging consumer technology. About half of the female participants were retired or 6 Registration and joined device status current as of October 23, The incentive level was set at $200 in order to attract a sufficient number of participants under constrained recruitment conditions. The focus groups were held as the holiday season approached and there were no large clusters of participants near the focus group facility. 36
40 Process Evaluation - Reported Customer Experience stay-at-home caregivers. A third or less of the male participants in each focus group were retired or stay-athome caregivers. More than half of all focus group participants are enrolled in SmartRate and less than a third are on TOU electric rates. Most participants were married and had children living at home. Overall, the customers that participated in these focus groups represented a particular subset of the PG&E residential customer base. They are distinguished by their interest in technology, particularly new technology, and by the fact that prior to the offer to participate in the pilot, they have made an active choice to take an electric rate that encourages reducing their on-peak electric consumption, either every day or only on SmartDays. The participants of these focus groups are highly engaged consumers, both with respect to using new technology and with respect to managing their household s energy usage. The remainder of this section presents the key findings of the focus groups Participant Pilot Expectations and Performance Assessments As part of the introductory segment of each focus group, all participants were asked to explain what motivated them to participate in the pilot. No single rationale was cited by a large majority of participants. The most common response was that participants saw the pilot as a way to lower their electric bill by gaining better understanding of how their household uses electricity, but this was cited as the primary motivator by only a slim majority of participants. There was considerable diversity in the personal circumstances that drew customers attention to their electricity bill. Motivations included: Introduction of an electric vehicle or solar panels to the home; Difficulty in managing electricity consumption of a large household; Recently moving to a new home; Receiving (and questioning) home energy reports; and Enrolling in TOU or SmartRate rate plans. A number of participants said that they chose to participate simply for the enjoyment of trying new technologies and that they were attracted to the HAN device as an example of an emerging class of consumer electronic devices. A small number of participants gave altruistic reasons for participating in the program. However, each focus group had one or two participants who indicated that their participation resulted from an interest in being efficient, to waste less, or to optimize without explicitly connecting those interests to the impacts on either their energy bill or the environment. Participants expectations and the pilot s delivery on those expectations were initially explored through a likes and dislikes exercise. In this exercise, participants were provided with pen and paper and given a few minutes to record the things they liked and disliked about the HAN device. Bidgely Likes Bidgely users overwhelmingly cited the instant or real-time nature of the information provided by the gateway as something they liked. In particular, the large majority of Bidgely users said that they liked the real-time usage presentment (kw). Fewer people indicated that they liked the real-time rate ($/kwh) that is also presented. The next most commonly cited like was that the gateway enabled them to see how much power individual devices use, either by observing current or past usage and taking stock of what devices were on, or by deliberately turning devices on and off to observe the change in energy use on the Bidgely portal. Very few (less than 3 out of 20) customers cited liking other aspects of the product such as learning the household s hourly usage pattern, daily and monthly usage displays, load disaggregation, projected monthly bill, the fact that it can be viewed away from home, and the user interface. 37
41 Process Evaluation - Reported Customer Experience Bidgely Dislikes In contrast to the Bidgely features that were appreciated by participants, opinions on dislikes of the gateway s information display were less focused: The most common complaints centered on the load disaggregation feature. Some customers complained that they didn t trust the load disaggregation algorithm, and there was confusion about whether or not users could assist the software in disaggregating loads by turning devices on and off. Others complained that they felt that the disaggregated load categories were too few or too broad, and some were disappointed that custom disaggregation could not be added (e.g., recognizing usage from a bedroom space heater or small kitchen appliance). Another area of dissatisfaction concerned not being able to find information they wanted. For example, two customers said they could not find information on SmartRate and two others could not find information about the rate tier they were in. Another said that the hourly usage and pricing presentation was confusing overall, and two others commented that it took too long to figure out where to find the information they wanted to see. One customer said he was sorely disappointed that the cost information was discontinued for him because he receives net metered electric service. Another customer reported (and a number of other customers chimed in with agreement) that she did not like the fact that the scale on the hourly usage graph changes from day to day; and another customer wanted to be able to access the Bidgely content directly from the PG&E website. Finally, two customers said that they wished the Bidgely usage alerts were sent sooner, when unusually high loads were still running and when they could still intervene, rather than after the fact. Aztech Likes Aztech users universally reported that they like seeing their real-time usage on their Aztech in-home display. Some users stated that looking at the Aztech unit is much more convenient than walking out to their electric meter to see their usage, and that the Aztech unit allows one to determine device loads that can t be metered with a Kill-a-watt 8 device, indicating that some of the Aztech users were already interested in monitoring their energy usage. A number of customers also reported liking the color coding of the lights that indicated the electric rate tier that is currently in effect or the time of use rate period that is in effect. On the other hand, a number of customers indicated that they had no idea that the color of the lights on the unit was meaningful, other than as entertainment and indicating that the device was on. Additionally, the large majority of Aztech users were annoyed by the dynamic blinking feature of the unit s lights. Fewer customers reported that they liked the monthly projected bill or the current electric rate display, and a number of customers reported that they found the device to be easy to read and see. A couple of participants thought that the device was easy to install, but these two reports are outliers. Aztech Dislikes While Aztech users broadly liked the functionality of the device, they also brought a litany of complaints about the device to the discussion, many of which centered on the difficulty of installing the device, as discussed below. Difficulties with installing the device were encountered through a variety of experiences. Some participants complained that the installation instructions were inaccurate. Others stated that the registration and joining process in general was difficult. One customer complained that the first device sent to him by PG&E failed and had to be replaced and another, which failed in the same manner, so they just didn t bother to try to get 8 Kill-a-Watt devices are consumer products that allow a user to measure the demand (kw) of household devices that are powered with a standard household 120 V plug. 38
42 Process Evaluation - Reported Customer Experience a new one. Some customers also complained about the limited range of the radio in the device. In order to maintain a connection with their meter, these customers could only install their Aztech units in their garages or in a room of the home nearest the meter. Others reported that the device would only work near a window and others said that while their unit works in a central room of the home, they would prefer to be able to put it in a different room if it would work there. One customer also said that reading the MAC address from the bottom of the device during the installation process was difficult due to the small print. Another commonly cited dislike about the Aztech device pertains to the daily delivery of the estimated electric bill this month. A number of customers said they dislike the estimated electric bill this month because they don t think the estimates are useful or accurate. Most customers disliked that the estimated bill message was delivered every day and that, every day, they had to navigate past the message screen to see their real-time usage. Only a couple of Aztech users said that they liked to look at the estimated bill prior to manually navigating to view the main usage screen on the device. Many customers complained that the device beeps when it receives the message every morning, that the light signal that also announces the message arrival was annoying, and that the messages themselves could never be deleted. More than a few Aztech users thought that the device itself is too primitive given the current standard of consumer electronic devices such as high-definition televisions, smart phones, and tablets. The relatively small black and white LCD screen was a target of complaint, as were the many unlabeled buttons on the device. Some participants complained that the complicated navigation prompted them to look for a user s manual, and they were disappointed that PG&E did not provide one that was customized to the Aztech device as configured for PG&E customers. One customer commented that the very act of reaching for the user s manual is a symptom of a failed user interface design. The likes and dislikes exercise revealed that more than half of the Aztech focus group participants reported contacting PG&E by telephone or for support with their device. However, none of the Bidgely users reported contacting PG&E for any support. Those that discussed their experience with PG&E HAN support largely reported having a good (but often lengthy) experience resolving the problem with their device. One customer expressed frustration with being requested to complete a questionnaire prior to receiving HAN support by . The large majority of Aztech users who contacted PG&E for HAN-related support did so for help with joining their device. Since Bidgely focus group participants did not report any problems joining their device, the Aztech-related customer contacts with PG&E appear to be attributable to Aztech-specific joining issues rather than a generally higher tendency to reach out for support on the part of Aztech users What Information Attracts Participants Attention? Bidgely When participants with the Bidgely gateway log in to either the Bidgely web portal or their tablet or smart phone app, they are presented with a variety of information about their home s electricity use: real time usage, real time price, estimated electric costs to date, and estimated electric bill this month. Information on load disaggregation and energy savings tips is also shown. The graphical centerpiece of the portal and app shows a rolling 24-hour history of the customer s hourly energy use. By clicking on a dollars icon or a lightning bolt icon, users can see their historical energy usage in terms of kwh per hour or dollars per hour. Figures 5-15 and 5-16 show examples of these two views of the main Bidgely screen. Figure 5-15 shows the Bidgely dollars view: at the time the screenshot was taken, the customer had used $1.02 in electricity on Wednesday, November 12, The central graphic is a blue bar chart that displays how much the customer spent per hour on electricity for the most recent 24-hour period. A green and grey meter widget shows, at the point in time when the screenshot was taken, that the customer s electric demand was 0.20 kw. Below the bar chart and meter, electric rate and bill information is presented. It shows that the customer is subject to a $0.15/kWh electric rate; the estimated electric cost to date was $8 and the estimated electric bill this month was $41. Figure 5-16 shows the lightning bolt view, which provides the same information, except that the blue bar chart showing how much was spent on electricity on November 12 is replaced with a 39

43 Process Evaluation - Reported Customer Experience continuous blue graph of electricity demand (kw) for the most recent 24-hour period. This view also shows that the customer used kwh of electricity on November 12. Figure 5-15: Bidgely Information Display on Dollars View Figure 5-16: Bidgely Information Display on Usage View The focus group moderator probed participants about the various information elements that attracted their attention. With very few exceptions, Bidgely users stated that they pay the most attention to the hourly 40
44 Process Evaluation - Reported Customer Experience cost/usage graphic, which is a logical outcome of the central positioning and large scale of the graphic. The blue hourly usage/cost chart is also the only element that changes when users toggle between the dollars and lightning bolt views. A couple of participants indicated that the information below the blue usage/cost graphic was not valuable to them; one thought the information in that part of the site was not dynamic and likened the content to news that appears below the fold. Another said that she looked at that information once and her attention never returned to it. Only one person in each Bidgely focus group indicated that they found the instantaneous demand readout of interest while a couple of participants said that they had never noticed it. The Bidgely portal and app also provide SmartDay event alerts to customers on SmartRate, but no focus group participant could recall seeing any SmartDay event alerts on Bidgely. Discussion concerning the blue usage/cost chart revealed a disconnect between the near real-time instantaneous demand meter and the usage/cost chart, which takes one to two hours to update. Participants understood that Bidgely was receiving real-time usage information from their meter, but expressed frustration that the blue chart did not refresh faster it was lost on many participants that the place to look for real-time information was the meter widget. Many customers who wished for a faster refresh of the chart conceded that it was a great improvement over the PG&E website, which has similar graphics that take one to two days to update. For the most part, when asked whether the dollars or lightning bolt view was more useful, participants said they used both views in tandem and largely don t favor one over the other. Many participants could readily explain why both views were useful, or why one view was only meaningful by referencing the other. For example, some customers monitor hourly costs using the dollars view. When they saw a spike in hourly costs, they toggled to the lightning bolt view to learn if the spike in costs was due to a higher electric rate or due to higher usage. Likewise, other customers monitored hourly usage using the lightning bolt view. When they saw a usage spike they toggled to see how the increased usage impacted their hourly cost. A smaller number of participants with a more sophisticated grasp of their TOU electric rate took this analysis one step further, to verify that a high usage device was used when the price of electricity was low. This kind of thought process is exemplified by one participant who said: I look at the usage and I think, Oh gosh, there goes the dryer. And then it goes down. But then I toggle to the price and say, Okay, I did it at the right time. It wasn t a spike, it was just a little blip, you know. Then I realize, Okay, I only spent $0.40 on the dryer. That s okay, I can live with that. Aztech Users of the Aztech in-home display experience a more dynamic delivery and presentment of information to their device than do Bidgely users. The Aztech unit receives new estimated monthly electric costs to date and estimated electric bill this month from PG&E (via the meter) each day, as do Bidgely devices. However, once the information is received, the Aztech device displays it immediately and alerts customers of the update. This update is displayed as a new message and customers are alerted by changing colors and movement patterns on the LED light bar. 9 Figure 5-17 shows an example of the message screen on the Aztech in-home display. 9 The Aztech device also announced the arrival of a new message with a beeping tone for first part of the pilot, but that feature was eventually disabled since most messages were delivered to HAN devices at 3:00 am each day. 41
, current electric rate ($/kw), and current cost of electricity per hour ($/hour).")
45 Process Evaluation - Reported Customer Experience Figure 5-17: Aztech Information Display of New Message To view real-time electricity usage and costs, users must manually navigate past the message screen to the main information screen, which presents real-time electricity demand (kw), current electric rate ($/kw), and current cost of electricity per hour ($/hour). Each day when a message containing a new bill-to-date and bill forecast arrives, the message reasserts itself as the information presented on the screen. As a result, each day customers who wish to view their real-time usage must navigate past the message screen containing the billto-date and projected bill information. Figure 5-18 shows an example of the main real-time electricity usage and costs screen on the Aztech unit. Figure 5-18: Aztech Information Display of Real Time Usage and Cost Since the estimated electric costs to date and estimated bill this month is sent to the display each day, it is the first thing seen by users each day. Interest in the estimated electric costs to date and estimated bill this month varied widely among Aztech focus group participants. One customer said that he used it during the last week of his billing cycle to help decide whether to charge his electric vehicle at home or at work that week: if his usage was near or above what he expects his monthly bill to be, he would charge his car at work until the billing cycle ended. Other customers found the estimated bill this month interesting and looked at it before navigating to the real-time usage screen. However, many participants did not find the estimated bill this month to be useful. Some complained that it was inaccurate, especially during the early part of the billing cycle. Others thought that the estimated bill this month was too backward-looking, representing something they could 42
46 Process Evaluation - Reported Customer Experience not do anything about. But a couple of those critics conceded that they think it might be more valuable to people with tighter budgets who live paycheck-to-paycheck. Nearly all focus group participants stated that they would greatly prefer to navigate through the device to find billing estimates rather than navigate past the estimated bill this month every day in order to get to their real-time usage data. Since the estimated bill this month was so prominently displayed for Aztech users, Aztech users also had strong opinions on the usefulness of the information. Most particularly, a number of Aztech users noted that with each new billing cycle, the estimated bill this month would reset without retaining any learning from the prior months bills. These customers commented that the projected bills for the first week of each new billing cycle is extremely inaccurate and that they expect more accurate information. Once on the real-time usage and cost display, Aztech focus group participants indicated strong interest in both the real-time price ($/hour) and real-time usage (kw), with one focus group evenly split in their interest in the two elements, and the other group with more participants favoring real-time usage. Only one customer voiced a strong preference for monitoring the real-time costs ($/kwh). Other informational features of the device that did not appear on the real-time usage screen got little attention from focus group participants. Two TOU customers mentioned that the color coded light bar on the device is useful for household members who don t have the TOU periods memorized. However, as described earlier, many customers said that they didn t know the light bar colors had meaning. Similarly, customers criticized the unit s many unlabeled buttons, difficulty in navigating to other content on the device, or lack of adequate explanations in terms of configuring the device settings. These comments indicate that participants had a high bar to clear with respect to ever seeing or getting familiar with other information on the Aztech unit. However, one participant who heads a large household said that she predominantly looked at the screen showing hourly usage for the past 24 hours. She stated that she used the device to make sure children or other members of the household were not using too much electricity while she was away at work. Finally, unlike the Bidgely focus group participants, a few Aztech users said that they saw messages that announced SmartDay events What Did Participants Do with HAN Information? Bidgely When the Bidgely focus group participants discussed the information they attend to, they described focusing on presentment of the past 24 hours of hourly usage and cost. Since the graphic is backward-looking, it is not surprising that participants focus is also backward looking: by engaging with the device content, participants indicated a what happened? mindset, distinctly different from a what is happening now mindset. One customer in fact likened using Bidgely to looking in the rearview mirror. Others described their experience with Bidgely as educational or as a learning experience. Customers told of using Bidgely to both learn which appliances use the most electricity and which devices use little electricity; one customer indicated that when she learned how little energy many appliances used, she felt she was able to relax her vigilance on SmartDay somewhat. But very few customers used Bidgely to experiment on a real-time basis with their appliances in order to learn how much they use. A number of customers said that they could look at the 24-hour graph and immediately understand which high-load household devices were used just by remembering the time of day they were turned on. However, other customers said that they just weren t interested in running around to determine how much electricity each device used, while other customers wished that Bidgely itself could algorithmically identify the loads associated with more devices on its own. When asked about whether or not using Bidgely gave them an expectation for how much electricity their home is using at any given point in time, that concept did not resonate with the Bidgely focus group participants. For example, when engaging with Bidgely, they are making a query, Did everything go OK? rather than, Is everything going OK right now? Participants described a pattern-recognition process when looking at the 24- hour historical graph, more like checking up on past performance. In this vein, one woman wished she could annotate the graphs to say, for example, Ran the oven all day. One participant explained that once, when he 43
47 Process Evaluation - Reported Customer Experience viewed Bidgely, he learned that he had left the hot tub on, stating that the discovery was purely by accident, and that he had just happened to look at Bidgely that day. Using the device to check up on whether or not the current energy consumption status of the home is as it should be just wasn t part of the mindset of these participants. This lack of focus on the present moment while looking at Bidgely is at a minimum closely connected to, and potentially a product of, the lack of attention to the meter widget and frustration when trying to use the most recent point in the historical usage/cost chart as the real-time current usage meter. In terms of actions that participants have taken in response to using Bidgely, two people said they stopped using electric space heaters. Others say that with the Bidgely content, they are better able to discuss saving energy for environmental reasons with members of the household. A couple of others stated that using Bidgely had increased their interest in investing in efficient appliances, but that they wished Bidgely gave them more information about whether or not investing in a new dryer or refrigerator would be cost-effective. Some customers described delaying running their dishwasher and pool pump until evening hours as a result of what Bidgely taught them. Aztech Aztech participants, on the other hand, reported that their attention is nearly completely directed to the realtime readout of demand or cost. As mentioned above, only one customer said that she used the device to check up on how her family is using electricity during the course of the day. As a result, many Aztech focus group participants described how they eventually developed an expectation for how much electricity their home should be demanding at different times of day. When looking at the device, customers described how they are checking to see if current demand is what they expect. Even customers who were not able to place the device in a convenient place in their home used the device in the same way when they did look at it (which was much less often than others that had the device in the kitchen, office, or living room) they were checking on the current status of electricity usage. One customer described a slightly different approach to viewing the device: he described using the device to inform him about what to do or not to do going forward; he was primarily using the device to monitor the current price of electricity. When the price was high he would elect not to, or at least think twice about, using appliances with high demand. A handful, but not all, of Aztech users described using their device experimentally to learn about end-use loads. Aztech focus group participants reported taking a few actions as a result of monitoring their energy use with the device. Some described the device as enabling household conversations about energy use, one person said that he delays washing clothes until the light bar display is green, another said that they purchased a number of energy efficient light bulbs, and another said that he opens his window rather than use his air conditioner more often now Other Discussion Topics Device Utilization Bidgely users describe viewing their usage many times a day, or in most cases at least once a day, when the pilot began. But with almost no exceptions, Bidgely users describe having lost interest or that they have learned [their] pattern, and that now they don t need to look at it as often, citing visiting the site or app once every week or two or even once a month. In stark contrast, Aztech users who have the device located in a convenient part of the home reported using the device, i.e., monitoring their electricity usage, with the same frequency as when the pilot began. Most customers who were not able to place the device in a convenient part of the home reported looking at the device less often now. Device Education around Electric Rates The focus groups with Aztech and Bidgely users also afforded an opportunity to explore how well participants understood their electric rates, whether or not the devices they tested helped them respond to the rate more 44
48 Process Evaluation - Reported Customer Experience effectively, and whether or not using their HAN device has increased their interest in TOU rates. For the most part, these focus groups did not prove to be well-suited for discussions on electric rates. Many discussions that went along the lines of What rate are you on? were confusing for many participants, and it was a time consuming process to get most participants on the same page with respect to understanding the difference between SmartRate and TOU and which rate (if not both) they were on. One area that both devices fall short on is explicitly communicating to customers what rate plan they are on. Both devices clearly show what rate ($/kwh) the customer is currently subject to, but there is no explicit communication that informs users that, for example, You are enrolled in the TOU and SmartRate rate plans, or You are enrolled in the tiered pricing plan. A number of customers clearly had a grasp of the kind of rate they are on but many of those customers weren t completely confident or facile in comparing and contrasting different rate options. The majority of focus group participants were SmartRate participants, but a number of them were unsure of their status on the rate, in some cases stemming from the fact that the summer season was over. A majority of the participants were on tiered electric rates and a number of them described how their device made them aware of when they crossed into the next-higher tier each month. Tiered rate customers with Aztech devices elaborated to say that the information about rate tiers that they see on their HAN device would be more useful to them if it were presented on a more forward-looking basis that could alert them when their monthly consumption approaches the next tier threshold. By only seeing what tier they are currently in, these customers felt that they had missed an opportunity to conserve and delay or avoid entering the next usage tier. A minority of focus group participants were enrolled on TOU rates, and most of them described high engagement with the rate. Only a very small number of tiered rate customers stated that their HAN experience led them to become more interested in considering a TOU rate in the future. Future HAN Offerings Lastly, the discussions included some time to talk about the future state of HAN, where devices similar to the ones tested in this pilot would have additional functionality to control when and how appliances are used in the home, subject to customer preferences. Each focus group had one highly engaged participant who envisioned the future state of home automation with interest. However, neither the highly engaged participants nor the discussion leader were able to capture enough imagination or enthusiasm for this concept among other participants to generate much discussion in this area Conclusions Focus group participants were highly engaged and informed electricity consumers. The knowledge about energy use, rates, and devices displayed in the focus groups was unusually good compared to typical residential consumers. These customers were highly engaged as evidenced by their enrollment in the rate program, their enrollment in the pilot and their willingness to participate in the focus groups. It is difficult to know how representative these focus group participants are of the pilot population, but it is clearly the case that they are not representative of the broader population. This fact must be kept in mind when using the focus group findings to inform future strategy. The two products tested in this pilot diverged in their initial appeal to customers. The Bidgely device is the most attractive to customers in terms of form factor and presentment, both in the perception of the initial offering as well as after it was used by participants. While able to describe the value the Aztech device offers in the same breath, Aztech users complain with great color how disappointed they are with the build quality and user interface of the device. However, while the Bidgely device offers more appealing packaging and interface, PG&E sent the exact same information to each device. And for each device, the information that has the greatest attraction to customers is the promise of real-time visibility into usage and the cost of that usage. It is the manner of display of real-time usage and costs that sets the experience with the Bidgely and Aztech devices apart, and which arguably determines the device that is more effective. The Bidgely device presents a 45
49 Process Evaluation - Reported Customer Experience compelling and attention grabbing picture of historical usage, but the presentment of real-time usage and cost is murky. Further, information from the Bidgely device must be proactively pursued by consumers by accessing their laptops or mobile devices. The Aztech device, on the other hand, functions more like a push technology as long as it is connected and in a highly utilized room in the home such as the living room, office, or kitchen, consumers can simply glance at it or easily access the desired display to obtain real-time usage and cost information. Having said that, the device s high potential in this respect was inhibited in this pilot by the limited meter connection range, which caused some consumers to install the device in inconvenient locations. It was also hampered by the daily projected bill messages that must, to the irritation of many participants, be bypassed each day to get to the most desired content. Those issues aside, the focus groups clearly indicated that a key factor to maintaining engagement with the information most sought after, real-time information, is that the device must reside in the customer s environment and must be easily accessible. Once inside the environment, HAN device s effectiveness resides in its ability to assist customers in developing a heuristic 10 that, at the appropriate moment, leads to a clear call to action. With the device in their midst and after a learning period, customers develop an expectation for how much electricity their home should be using at particular times of day or under particular circumstances. When the device shows that usage is not in line with expectations, the call to action is to decide whether or not to pursue re-tuning the house to bring usage back to its expected level. Without the focus on real-time usage, the historical information that Bidgely customers focus on begins to look the same over time. The problem shifts from making a choice about what is happening now, to puzzling out whether what happened yesterday was good and what they should do differently today to get a different outcome. This approach begins to resemble how a customer might review their monthly PG&E bill and lacks the immediacy of empowering customers to control energy consumption right now. Bidgely s suggested energy-saving actions did not suffice as a strong call to action as users perceived that they were not specifically targeted to their household and were not dynamic over time. 5.3 Call Center Operator Focus Groups When the HAN Phase 3 pilot was launched in August 2014, nearly two and a half years had elapsed since the first customer service representatives (CSRs) were trained to provide HAN-specific customer service to HAN Phase 1 participants. Those customer service skills continued to evolve when Phase 1 ended and Phase 2 began. But the HAN Phase 1 evaluation revealed that customer satisfaction with CCO s support for HAN inquiries was low and that investments in improving the level of HAN-specific customer service for HAN customers were necessary. During the course of HAN Phase 3, participants reported through both surveys and focus groups that PG&E s CSRs are doing a remarkably better job meeting the expectations of HAN device users than they did in From the first CSR training session in spring 2012 to the Phase 3 trainings that took place in July and August 2014, PG&E s systems and processes have come a long way towards better meeting the needs of customers who wish to register and join HAN devices to their meter. HAN-related customer support has, since Phase 1 and 2, moved from the Fresno, California call center to a call center in Sacramento, California. While only a limited number of CSRs were trained in Fresno to handle the earlier HAN-related calls, for Phase 3, all CSRs and senior service representatives (SSRs) at the Sacramento call center are trained for HAN customer service. Currently, 60 CSRs and SSRs are capable of providing HAN customer service and they are available to handle HAN calls and s Monday through Friday, from 8 am to 7 pm. CCO training for Phase 3 began in July 2014, with sessions held on July 30, July 31, and August 4, CSRs and SSRs at Sacramento are supported by an internal project manager that ensures HAN training is 10 A heuristic is a term of psychology that refers to a mental shortcut that enables people to solve problems or make decisions quickly and efficiently. 46
50 Process Evaluation - Reported Customer Experience scheduled and completed, provides monthly HAN pilot updates to the Sacramento call center, and acts as the CCO point of contact for the SmartMeter Operations Center (SMOC) and the HAN program team. This manager also contributes to resolving HAN calls and s. A focus group with nine CSRs and SSRs and the CCO HAN project manager was held on November 5, 2014 at the Sacramento call center. A senior consultant from Nexant facilitated the discussions, which lasted 90 minutes, and a digital audio recording of the session was made with the permission of the CCO HAN project manager. The goals of the focus group were to listen to and record CSR and SSR s HAN Phase 3 experiences with, and opinions on, the following areas of inquiry: What are both typical and atypical HAN Phase 3 customer inquiries about; Assessing the effectiveness of training and reference material; Describing the mechanisms for interfacing with other PG&E HAN stakeholders; and Imagining the future-state of HAN customer service. The remainder of this section presents the findings from the CCO focus group discussions on these topics. The CCO focus group moderator s discussion guide is provided for reference in Appendix D Characterizing Typical and Atypical HAN-related Customer Contact Regardless of the particular problem a customer brings to PG&E s CCO for help in resolving, a commonality to all HAN-related calls, as described by CSRs and SSRs, is that they are the most complicated calls that they are asked to handle. Unlike most customer service tasks that CSRs and SSRs complete on the phone with customers, most HAN tasks are not completed using a predictable process or checklist. One CSR likened HAN troubleshooting to spaghetti, where in resolving a customer s HAN-related issue, a CSR typically has to try a number of approaches before a solution to the problem is reached, and where there s typically more than one way to get to the same desired outcome. As described below, this aspect makes adequately training staff a challenge. But it also has implications for how long it takes CSRs to resolve an issue for the customer (call durations can range from 5 minutes to 45 minutes) and how CSRs and SSRs work together as a team to resolve a high percentage of customer issues without escalating to SMOC or the HAN project team. The typical HAN-related customer contact that comes into the CCO is related to joining the HAN device to the meter. Both Bidgely and Aztech users call PG&E for assistance with joining it to their meter, but CSRs report that customers call them about joining Aztech devices more often than Bidgely devices. CSRs suspect that the Aztech radios are not as capable as the radios in the Bidgely gateways. One trick that they have developed for troubleshooting pairing difficulties is to instruct the customer to bring the HAN device outside, close to the meter while the joining process occurs. This has helped them determine with the customer whether or not the device is functionally able to join with the meter at all, or whether or not they are attempting to join while the device is just too far away to join (and operate). Related to the initial joining process is assisting a customer with a time-out, which occurs when the customer has attempted and failed to join the device to their meter a total of four times. Currently, customers must contact CCO for help with resolving a timed-out HAN device. CSRs and SSRs describe troubleshooting timeouts as more difficult to resolve than attempting to join a device for the first time. Here again, in the CSRs experience, Aztech units seem to time-out more often than Bidgely units. While the standard joining procedures are straightforward to implement, CSRs and SSRs describe having difficulty resolving a timed-out device. The call center has developed an internal escalation process to help resolve as many time-outs as possible prior to escalation to the SMOC. With this new process resulting in many more time-outs getting resolved, it also has provided a communications channel for SMOC to report 47
51 Process Evaluation - Reported Customer Experience back to CCO when there is information to share regarding what steps could have been taken to prevent the escalation. The focus group participants discussed that the SMOC feedback can be better communicated through the entire call center and not just remain with the HAN project manager and CSRs. Currently, the HAN manager communicates these learnings through a monthly newsletter, but once the process is in place for a longer period of time, it can be determined whether or not more frequent communication with the broader team is necessary. Other challenges pertaining to joining or resolving a timed-out device include CCO s visibility into the success or failure of the device pairing. Some of the most experienced SSRs reported that the device they are assisting with has joined successfully, but is not always real-time: sometimes the Silver Springs Network (SSN) HAN Communications Manager (HCM) does not report the successful status of a joined device for 5 minutes or even 24 hours. This lack of real-time visibility is a source of frustration for call center staff who then must rely on asking the customer whether or not they see that their device has successfully paired. One SSR commented that this issue undermines their ability to meet a mandate to resolve customer service issues on a first-call basis. CSRs and SSRs also described a problem that, at the time of the focus group, was in the process of being resolved: an error in HCM was not permitting CSRs to enter the complete device MAC address in the required fields. The HAN project manager and SSRs reported that they have had success with elevating this issue to SMOC for resolution. Another situation call center staff can come across is troubleshooting a device with an unjoined-unreachable status. The SSR with the most experience working on HAN issues explained that she currently has no informational resources to effectively troubleshoot this particular joining problem. Other problems that customers bring to the call center are varied and do not come with great regularity: When a customer who does not have an eligible meter (usually due to being on an ineligible electric vehicle (EV) rate or taking net energy metered (NEM) electric service), they are not able to even register their device. Some CSRs know how to manually register devices for NEM customers and put in a request that the meter be changed out for another that has the appropriate program. But many CSRs don t know that process and the discussants agreed that training and documentation for EV and NEM customers is necessary: even though NEM customers can currently only see net electricity used on their HAN devices, and even though some EV rates are not supported on HAN devices yet, these customers are calling in asking to register their devices more and more often. When a customer moves from one home to another and wants to register their device at their new home, associating that device with the new meter was described in the focus group as a complicated process. Well-developed instructions have not been produced to help with this task and should be created so that more CSRs are able to complete this task on their own without escalating to other resources. Customers occasionally call in to register a HAN device that is not on the list of PG&E-authorized devices. Many CSRs and SSRs attempt to join the device for the customer, because sometimes the unauthorized device can successfully join (but only display real-time energy usage). Those that reported doing this in the CCO focus group said that some CSRs do this and others don t; that those that attempt to join the device disclaim that if it doesn t join there is currently nothing to be done to join it. Discussants also described that it seems to them that there is a new, undocumented problem regarding Aztech functionality every month. They described that this tendency of Aztech devices to develop new problems is a particular challenge for them because they do not receive regular enough news from SMOC or HAN to effectively cope with the problems. In fact, they are made aware of the problems when customers start calling in about them. They describe that, for each new issue, there is an internal scramble to figure out how to address the problem, and that a new undocumented problem will typically crop up in short order. By virtue of the fact that CCO is learning about new Aztech problems from customers, it may be that CCO is the first PG&E resource to know of it. A more flexible and robust feedback loop flowing in all directions between HAN, SMOC, and CCO would go a long way towards helping CCO cope with everevolving issues stemming from the more unreliable HAN devices. 48
52 Process Evaluation - Reported Customer Experience CSRs and SSRs are not expected to provide any support for HAN devices beyond the registration and joining process, and for the most part, those are the only types of HAN-related calls and s that they receive. When they receive questions about the general functionality of the device once it is successfully registered and joined, they refer the customer to the device manufacturer. CSRs do not report receiving any calls inquiring about the accuracy or meaning of the information PG&E is providing to the device. When asked, these kinds of questions are typically escalated to an energy cost inquiry (ECI) specialist. The CCO focus group participants said that they cannot think of any HAN calls that they have escalated to ECI specialists, but that in contrast, ECI escalations routinely result from home energy report (HER) calls. A selection of 25 recorded calls that were handled by the Sacramento call center were also summarized to provide additional insight into the CSR and SSRs experiences handling HAN-related calls. The summary results of the review of those call recordings are found in Appendix E Training and Reference Material Effectiveness HAN training for call center staff was enhanced in 2014 to improve upon the training that was held in 2012 and 2013 to support Phases 1 and 2. At that earlier time, HAN team staff conducted the training. The benefit of having members of the HAN team provide CCO training was that they had intimate knowledge of the program to share with the CSRs and SSRs and were highly engaged with the material. But subject-matter expertise does not automatically translate to abilities to effectively train call center staff in call center procedures. While the original Phase 1 and 2 training sessions had the benefit of experts on hand to answer questions, the trainers lacked the abilities that are effective for teaching CCO employees new skills. In 2014, HAN training was conducted by skilled trainers that are experienced in training CCO staff. However, the CSRs and SSRs that attended the focus group felt strongly that the trainers did not understand the subject matter well enough. The trainers were not able to speak with authority on the subject of HAN and supporting HAN users. Unlike most training sessions where CSRs learn new skills, HAN training did not occur in the CCO learning environment. Prior to and at the time of the focus group (provide the date), there were no hands-on opportunities to try out the skills that they were learning. In the opinion of those who participated in the focus group, without activities to practice a new skill and without a well-informed trainer on hand, training is bound to fail in teaching CSRs how to be effective on a HAN call. It is important to note that soon thereafter, a HAN demo board with a live meter was set up at the Sacramento call center for CCRs to plug in a cell phone or other appliance and see the HAN device information change, as well as see the daily billing messages and DR event alerts.) The HAN board also enables CSRs to try joining HAN devices with a SmartMeter so as to understand what the customer is experiencing on their end of the telephone. The HAN board should remain an important part of any future training sessions. Without expertise and hands-on activities, CCO training can too easily be reduced to sharing only basic information, consequently putting the CSRs in the position of training themselves on live calls. CSRs and SSRs in the focus group also stressed the importance of more effective training due to the fact that HAN-related calls come in sporadically. Many CSRs can go weeks without handling a HAN inquiry. Without hands-on training and periodic skills refreshers, retaining knowledge is a challenge for many CSRs. Along these lines, the importance of accurate reference material in GenRef is crucial for keeping the least experienced CSRs reasonably well-prepared for a HAN call. Up-to-date reference materials were not usually available for this pilot, but focus group participants were sympathetic to the fact that they were supporting an always-evolving pilot program. 49
53 Process Evaluation - Reported Customer Experience CCO Interface with HAN Stakeholders CSRs and SSRs at the Sacramento call center interface with other PG&E HAN stakeholders in two ways. First, CSRs and SSRs can hand off or escalate customer issues to either the HAN team or SMOC when they are unable to resolve the issues themselves. Additionally, CSRs and SSRs have initiated a new escalation system within their own organization to minimize sending issues out to SMOC or HAN. This new system was recently implemented and CCO hopes to use it to resolve 95% of all HAN-related customer inquiries without escalation. They estimate that they currently resolve 75% of all calls within CCO. Second, CCO interacts with the SMOC and HAN team in a more indirect way through the HAN documentation found in GenRef. Currently, when call center staff can t resolve a customer s HAN issue, the next step is to use a send an function in the Customer Care and Billing (CC&B) system which escalates the item to SMOC or HAN. But a problem with this process to escalate issues is that there is no feedback on the outcome or status of the issue provided directly to the CSR that escalated it. The only opportunity for a CSR to learn the outcome of an escalation that they initiated is indirectly: SMOC does provide feedback to the CCO HAN project manager, but that project manager must in turn communicate learnings back to the call center at large through the monthly newsletter channel. A similar communication limitation exists for within-cco escalations. If one CSR asks a fellow CSR for help with resolving a HAN-related issue, there is no formal process that allows for the first CSR to track the progress on the issue or to directly learn how the issue was resolved. What s problematic about solving this problem is that if the helper CSR discovers a mistake that the first CSR made, the first CSR may or may not be happy to receive an from his or her peer that points out what he or she did wrong. With a large pool of CSRs available for HAN support that have diverse levels of comfort and interest in HAN support, identifying a way to constructively share lessons learned may be difficult, but should be fruitful. The other communication channel between CCO and other PG&E groups with a stake in HAN is the CCO s GenRef resource. GenRef is intended to be the one place that CSRs turn to for guidance on how to handle any issue a customer may have. The content in GenRef is not exclusively managed by CCO, however. The SSRs and CSRs reported in the focus group that other groups such as the HAN team or SMOC make HAN-related updates to GenRef but that updates are sometimes unannounced. A further difficulty for CSRs is that GenRef content is often produced by SMOC staff who do not have the same access to CC&B as CCO does, which results in content being produced without an accurate perspective into what CSRs and SSRs see in CC&B. There is also additional room for improvement in the HAN GenRef content. Those in the focus group also described that the GenRef content does not point the inexperienced user with clear directions to start here in resolving a particular HAN issue for a customer. Without a firm grasp on where to start, CSRs are finding themselves spending extra time on the phone with the customers while they figure out how to get on the right path, which can produce anxiety for both the CSR and the customer Supporting HAN in the Future Apart from process improvements surrounding training and documentation, the CSRs and SSRs in the focus group shared some insights on other program enhancements that would be valuable for incorporating into HAN customer service in the future. One SSR brought up a clear troublemaker for successfully joining the HAN device: too much distance to the meter can result in a perfectly functional device never getting joined just because the home or living area of the home is too far from the meter. He recommends more customer-facing information be provided online (and internally for CCO staff to use) that emphasizes the reality that the device must be close enough to the meter in order to work. Other SSRs spoke to the fact that the HAN website is not very transparent to the customer with respect to which customers are currently eligible for HAN. They believe that with more complete information, fewer 50
54 Process Evaluation - Reported Customer Experience customers would contact PG&E about registering a HAN device they have purchased and ending up disappointed that it doesn t work. All the call center staff in the focus group felt that PG&E customers appreciate the self-service aspect of HAN registration and joining. They believe that customers expect to be able to complete those tasks on a selfservice basis and are disappointed when this self-service functionality fails. In their opinion, more and more EV and NEM customers are interested in HAN devices. They recommend that the HAN program support those customers with real-time presentment of electric rates and, for NEM customers, complete visibility into electricity usage, generation, and net load as soon as possible First Priority Recommendations for Enhancing HAN-related Customer Service By the end of this pilot, direct feedback from CCO focus group participants reveals that they viewed themselves as much more successful in meeting customers expectations for help with HAN-related problems than they were in 2012 and All HAN stakeholders should celebrate that achievement, but not rest on their laurels. A number of areas of improvement in HAN customer service processes and procedures surfaced in the CCO focus group discussions, as discussed above in this section. HAN may never prove to be simple program to implement and support at PG&E, but developing a hands-on training curriculum that leverages the expertise of both the SMOC and HAN team should be a priority effort that will lead to broader program engagement at the CCO call center. CCO staff should prioritize finding ways to effectively communicate with each other on an ongoing basis to share knowledge and coach each other on what may always be some of the most complicated calls that can come their way. This should include disseminating lessons learned that originate from other HAN stakeholder groups, but also those learnings that are internal to the call center. They should also develop ways to share their learnings in turn with other groups that are invested in HAN. Finally, another priority customer service enhancement should be to assign a crossfunctional team to develop GenRef content for CSRs that can truly serve as a roadmap to be used to assist the agent in quickly resolving customers HAN inquiries and issues in a satisfactory way. 51
55 Conclusions and Recommendations 6 Conclusions and Recommendations Caution is indicated in interpreting the results of this study because the customers that were recruited to participate in the pilot are included among the most highly engaged of the PG&E residential customer base. Every HAN Phase 3 participant has already either responded to PG&E s marketing efforts to enroll in SmartRate or have, upon their own initiative, decided to take either the SmartRate or TOU pricing plans. In either case, both of these kinds of decisions indicate that the customers who participated in this pilot have already contemplated the concept of managing their electricity usage to some degree. Additionally, all customers in this pilot are volunteers. Any estimate of change in energy consumption or energy usage behavior due to a technology such as HAN where those that are provided with the technology were solicited to receive it cannot be assumed to hold true for customers who would receive the same technology without asking for it. This reality is only emphasized by the fact that the pilot participants not only received the device free of charge, but were also incentivized to install the device and complete surveys that inquired their experience using the device, none of which is likely to be offered in any subsequent and more substantial HAN roll-out. A final and also important limitation on the conclusions drawn from this study is that it was conducted for a very short period of time. Changes in energy savings due to HAN devices may occur when the device is in the home for an entire year or more, and these changes could be materially different depending on the technology. While there is strong evidence from this pilot that many Bidgely users have already stopped looking at their HAN information, it is unknown how Aztech users stronger engagement with the device will change over time. While Aztech users reported looking at their devices less often at the end of the study, the decline was not nearly as precipitous as it was for the Bidgely users. The hypothesis that effective HAN devices yield increasing, rather than decreasing, energy savings over time is a research question that future HAN studies should entertain and provide an opportunity to test. This study finds that the HAN devices yield weak, if any, additional demand response load impacts for SmartRate customers or on-peak load reductions for TOU customers. There is, however, evidence here that indicates that there are meaningful impacts on energy consumption for E-6 TOU customers which come from reductions in part-peak and off-peak periods. This finding brings to the fore the possibility that there may be market segments that are more responsive to HAN devices than others. While the first question about HAN devices is usually, Do HAN devices yield energy savings? this study suggests that the answer may really depend on which customers the devices are offered to. Finally, the fact that no statistically significant incremental DR load impacts could be detected among more than 1,000 SmartRate HAN pilot participants should prompt a re-examination of whether DR event alert should continue to be supported by the HAN platform. With respect to impacts the devices had on the customers who used them, it is clear that customers reacted to the two technologies in very different ways. These differences are manifest in three areas: First, on the face of the offer made to the customer, Bidgely devices are much more attractive to customers. Regardless of the effect that a device may have on the customer once it is in the home, the first hurdle of attracting the customer to it in the first place must be cleared. Manufacturers of HAN devices and the utilities that seek to capture energy savings as a result of their adoption must be cognizant of consumer preferences and expectations. Personal electronic devices that capture consumer s attention have high build quality, are viewable with a high-definition display, and are interactive by touch. In this study, the Bidgely gateway came the closest to meeting customer expectations along these lines, as evidenced by the higher uptake rates and satisfaction with the device as reported in the surveys and focus groups. 52
56 Conclusions and Recommendations Only the Aztech device became integrated into the household s daily life. This success is partly by virtue of its design as a tabletop device that can be viewed by all members of the household during the regular course of the day. The device provided the pilot participants an opportunity to learn their normal energy consumption, and then potentially decide to take actions to reduce what normal consumption is. The surveys and focus groups provide evidence that, apart from the convenient always on aspect of the information display, the Aztech device also is more successful at communicating to the customer what is happening right now, which provides users with a clear decision to make: Do I like what I see right now or do I need to change anything? Customer feedback on the Bidgely device leads to the conclusion that Bidgely users had too high a bar to clear to develop these same heuristics. The Bidgely user must think to query it on their computer, tablet, or smart phone, and once there, the presentment of current electricity usage was not prominently displayed. The customer research conducted in this study also reveals that Aztech users were significantly more likely to report taking actions to reduce electricity usage, to use their HAN device to deduce the loads of individual appliances, and to discuss the information they see on their HAN device with others. In short, there is evidence that the Aztech device has been more successful in affecting day-to-day electricity consumption behavior. Finally, an area of strong agreement among all segments of pilot participants is that PG&E did not meet expectations for many customers with respect to the customer support provided to HAN users. Materials distributed with the devices to guide customers through the registration and joining process were not adequate for many participants and the focus groups revealed that there was too little information provided by the manufacturer to teach customers how to use their devices most effectively. While customer satisfaction with PG&E s CCO telephone and support is greatly improved in this pilot relative to HAN Phase 1, PG&E still as a great deal of opportunity to better prepare CSRs and SSRs to help customers with device registration and joining issues. 53
57 Conclusions and Recommendations Appendix A A.1 Initial Survey RATE = SR or TOU SURVEY = 1 or 2 DEVICE = IHD or gateway Customer Survey Instruments Introduction: Thank you for taking the time to participate in this pilot and for completing this important survey, which should take less than 15 minutes to finish. We encourage your candid feedback and there are many optional open-ended questions to enable you to provide more detailed thoughts and suggestions. Your responses will remain completely anonymous and will be used for research purposes only. We will begin by asking for your opinions about your experience with registering and joining your [Insert Aztech Inhome display (referred to as an IHD below) or Bidgely gateway (referred to as a gateway below) depending on the device they received] to your SmartMeter. 1. Please indicate whether you agree with the following statements using a 10-point scale, where 1 means you strongly disagree, 10 means you strongly agree, and you can use any number between 1 and Strongly Disagree Strongly Agree In the package containing the device, PG&E provided you with information to assist you with registering and joining your [insert IHD or gateway] with your SmartMeter. Would you agree or disagree that these materials: [Randomize statements] a. Provide useful information b. Are easy to understand c. Provide all the information necessary for registering and joining your device with your SmartMeter 2. [If Q1 a, b or c is < 8] What changes to the support materials do you recommend regarding the registration and joining process? Please be as specific and detailed as possible. [Open-ended] 3. Please indicate whether you agree with the following statements using a 10-point scale where 1 means you strongly disagree, 10 means you strongly agree, and you can use any number between 1 and Strongly Disagree Strongly Agree Would you agree or disagree that the process for registering and joining your [insert IHD or gateway] on PG&E s My Energy website: [Randomize statements] a. Was easy to understand 54
58 Conclusions and Recommendations b. Can be completed in a reasonable amount of time c. Was convenient for me 4. [If Q3a, b, or c is < 8] What changes to the registration and joining process on My Energy would you suggest? Please be as specific and detailed as possible. [Open-ended] We will now ask for your opinions about your experience with using your [insert IHD or gateway]. [NOTE: Here, customers branch out. If SURVEY = 1, the customer gets questions Q5a through Q13a. If SURVEY = 2, customers get questions Q5b through Q12b. After that, all customers go to Q14.] 5a. Your [insert IHD or gateway] is designed to provide the current price of electricity, your current real time usage, the cost of electricity you have used to date this month, and your forecasted monthly bill. Have you been able to access and view this information? Current price of electricity Current usage Cost of electricity used to date this month Projected monthly bill Yes No Not Sure 6a. [If Q5a = Yes for All] When you look at the [insert IHD or gateway portal], which of the four information elements do you look at most often? a. Current price of electricity b. Current usage c. Cost of electricity used to date this month d. Projected monthly bill e. Look at all of them about the same 55
59 Conclusions and Recommendations 7a. [If Q5a = Yes by each option] On a scale of 1 to 10 where 1 is not at all useful and 10 is very useful and you can use any number between 1 and 10, please rate how useful you think each of these information elements is for tracking and monitoring your electricity costs: Not at all useful Very useful a. Current price of electricity b. Current usage c. Cost of electricity used to date this month d. Projected monthly bill 8a. [If Q5a = Yes by each option] On a scale of 1 to 10, where 1 is very inaccurate and 10 is very accurate and you can use any number between 1 and 10, please rate the accuracy of the information reported by your [insert IHD or gateway]? Very Inaccurate Very accurate a. Current price of electricity b. Current usage c. Cost of electricity used to date this month d. Projected monthly bill 9a. [For any element of Q8a- a to d if answer < 8] Why do you think the element(s) is/are inaccurate? Please be as specific and detailed as possible. [Open-ended] 10a. Did you need to contact PG&E s customer service for support at any point while registering, joining, or using your [insert IHD or gateway]? a. Yes b. No 11a. [If Q10a = a] Specifically with respect to this pilot, how would you rate your experience with PG&E customer service? Using the following 10-point scale, where 1 means very negative and 10 means very positive, please rate your overall experience with PG&E s customer service Very Negative Very Positive 12a. [If Q11a < 8] Why did you give a rating of [insert rating from above] for the customer service you received? Please be as specific and detailed as possible. 13a. Did you contact the device manufacturer or consult their website for support? a. Yes b. No 56
60 Conclusions and Recommendations c. Not sure 5b. Some people have used the [insert IHD or gateway] to determine how much energy individual appliances are using. This is done by turning appliances on or off and watching the usage information change in real time. Did you or anyone else in your household use the [insert IHD or gateway] this way? Check all that apply. a. No one did Mutually exclusive with b, c or d b. I did c. Other adult did d. Children did 6b. Did you discuss your home s energy use with anyone else based on information obtained through the [insert IHD or gateway]? a. No b. Yes, discussed energy use with other adults in the household c. Yes, discussed energy use with guests or other adults outside the household d. Yes, discussed energy use with children 7b. Were there any occasions during which your [insert IHD or gateway] did not appear to be working? a. Yes b. No 8b. [If Q7b = a] Please describe the problems you had. Please be as specific and detailed as possible. [Open-ended] 9b. Besides the support materials provided by PG&E when you received the device, would you like to receive additional educational communications or information regarding your [insert IHD or gateway]? a. Yes b. No c. Not sure 10b. [If Q9b= a] What additional educational communications or information would you like to receive? Please be as specific and detailed as possible. 11b. [If Q9b = a] How would you like to receive the additional educational communications or information? (Choose all that apply) [Randomize options] a. By mail, but in a separate envelope from your PG&E bill b. Via c. Online at pge.com d. Application on your smart phone e. Phone call from PG&E f. Text message on your mobile phone from PG&E g. Other (Please specify) 12b. Please indicate the importance of the following motivations to participate when you decided to participate in this pilot. Use a 10-point scale where 1 means not at all important, 10 means very important, and you can use any number between 1 and 10. [Randomize statements] a. To lower my PG&E bill b. To better understand how my household uses energy c. To help my household use less electricity during on-peak hours every day d. To learn how much electricity each of my appliances use e. To test out a new technology 57
61 Conclusions and Recommendations f. To receive compensation for my feedback g. [Show if rate=sr] To help my household use less electricity during SmartDay events h. Other (Please specify) 14. [If rate = SR] Has your [insert IHD or gateway] notified you of a SmartDay event? d. Yes e. No f. Not sure 15. [If rate = SR] [If Q14 = Yes] On a scale of 1 to 10, where 1 means not at all helpful and 10 means very helpful, please rate the how helpful the SmartDay notification your [insert IHD or gateway] provided was in enabling you to reduce your electricity usage during the event Not at all helpful Very helpful 16. [If rate = SR] [If Q15 < 8] How could the SmartDay notification feature of your [insert IHD or gateway] be changed to better enable you to respond to a SmartDay event? Please be as specific and detailed as possible. 17. [If rate = SR] What actions, if any, did you take as a result of the SmartDay event notification you received through your [insert IHD or gateway]? [Open-ended] 18. [If IHD] In the past week, about how often did you look at your IHD? a. More than once a day b. About once a day c. 2-4 times in the week d. Once in the week e. Never 58
62 Conclusions and Recommendations 19. [If IHD] Where is the device currently located? a. Kitchen b. Family room c. Living room d. Office e. Dining room f. Other (Please specify) 20. [If gateway] It is possible to view information from your gateway on your personal computer, tablet or on your smart phone. Please indicate how often you view information from these different devices. Device Personal computer Tablet Smart phone More than once per day Once a day 2-4 times per week Once a week Seldom or never 21. [If gateway] Which portal do you normally use to view your information? a. Bidgely b. EnergyVue c. Both Bidgely and EnergyVue 22. How would you rate your satisfaction in using your [insert IHD or gateway] overall? Using the following 10-point scale, where 1 means very dissatisfied and 10 means very satisfied and you can use any number between 1 and 10, please rate your overall experience using your device Very Dissatisfied Very Satisfied [If Q22 is < 8] Why do you say that? [Open-ended] 23. Would you recommend the [insert IHD or gateway] to a friend? a. Yes b. No c. Not sure 24. [If Q24 is b or c] Why do you say that? We would finally like to ask a few questions about you and how your household uses electricity: 59
63 Conclusions and Recommendations 25. Do you have any programmable thermostats? a. Yes b. No c. Not sure 26. What is the temperature on your thermostat set to in winter between November and February during the daytime hours? in winter between November and February during the nighttime hours? in summer between June and September during the daytime hours? in summer between June and September during the nighttime hours? 27. Which of the following appliances do you have at this home? [Check all that apply] a. Central air-conditioner b. Clothes washer c. Electric clothes dryer d. Dishwasher 28. What time of day do you use these appliances? Check all that apply [only show appliances that they report having] Central Air-conditioner Clothes Washer Electric Clothes Dryer Dishwasher Morning Mid-day Evening 29. What is your gender? a. Male b. Female c. Refuse to answer 60
64 Conclusions and Recommendations 31. Which of the following groups includes your age? a. 18 to 24 b. 25 to 34 c. 35 to 44 d. 45 to 54 e. 55 to 64 f. 65 to 74 g. 75 or over 32. What is the highest level of education you have achieved? a. High school diploma, GED or less b. Trade / technical school c. Some college d. College degree e. Some post-graduate work or more 33. Which of the following groups includes your total annual household income before taxes in 2011? a. Less than $25,000 b. $25,000 - $49,999 c. $50,000 - $74,999 d. $75,000 - $99,999 e. $100,000 - $149,999 f. $150,000 - $249,999 g. $250, What other feedback, if any, do you have concerning your participation in this pilot? Optional [Open-ended] You have now completed the survey. Thank you for your providing your feedback! We will be sending you a $50 check in appreciation of your time and participation. You should expect your check to arrive in the mail by late-october
65 Conclusions and Recommendations A.2 Final Survey [rate = SR or NONSR] [device = IHD or gateway] Thank you for taking the time to participate in this pilot and for completing this important survey, which should take less than 10 minutes to finish. We encourage your candid feedback and there are some optional open-ended questions to enable you to provide more detailed thoughts and suggestions. Your responses will remain completely anonymous and will be used for research purposes only. 2. Is the [device] you received currently working? a. Yes Skip to Q6 b. No c. Not sure or don t know Skip to Q6 3. Approximately when did it stop working? a. It never worked Skip to Q33 b. Within a month of receiving it c. A few days ago d. A few weeks ago e. Not sure or don t know 4. When you noticed that it wasn t working, did you attempt to restart it? a. Yes b. No Skip to Q5 5. What actions did you take to try to restart the [device]? Check all that apply. a. Turned it off and then on b. Called PG&E customer service c. Contacted the device manufacturer d. Other: 6. Have you discarded the [device] or is it still in your home? a. Discarded b. Still in the home c. Not sure or don t know 62
66 Conclusions and Recommendations 7. Your [device] is designed to provide the current price of electricity, your current real time usage, the cost of electricity you have used to date this month, and your forecasted monthly bill. Have you been able to access and view this information? [If Q6 = No or Not sure for any item, skip to 8] Current price of electricity Current usage Cost of electricity used to date this month Projected monthly bill Yes No Not sure 8. [If Q6 = Yes for All] When you look at the information provided by the [device], which of the four information elements do you look at most often? f. Current price of electricity g. Current usage h. Cost of electricity used to date this month i. Projected monthly bill j. Look at all of them about the same 9. [If Q6 = Yes by each option] On a scale of 1 to 10 where 1 is not at all useful and 10 is very useful and you can use any number between 1 and 10, please rate how useful you think each of these information elements is for tracking and monitoring your electricity costs: Not at all useful Very useful e. Current price of electricity f. Current usage g. Cost of electricity used to date this month h. Projected monthly bill 10. Some people have used the [device] to determine how much energy individual appliances are using. This is done by turning appliances on or off and watching the usage information change in real time. Did you or anyone else in your household use the [device] this way in the last 30 days? a. Yes b. No Skip to Q11 c. I stopped using or discarded the device more than 30 days ago Skip to Q17 63
67 Conclusions and Recommendations 11. Who used the [device] to determine how much energy individual appliances are using? Check all that apply. a. I did b. Other adult did c. Children did 12. Did you discuss your home s energy use with anyone else based on information obtained through the [device] in the last 30 days? a. Yes b. No Skip to Q13 c. I stopped using or discarded the device more than 30 days ago Skip to Q With whom did you discuss your home s energy use? Check all that apply. e. With other adults in the household f. With guests or other adults outside the household g. With children 13. Were there any occasions during which your [device] did not appear to be working in the last 30 days? c. Yes d. No Skip to Q15 or Q16 e. I stopped using or discarded the device more than 30 days ago Skip to Q Please describe the problems you had. Please be as specific and detailed as possible. [Open-ended] 15. [Show if device = IHD] In the past week, about how often did you look at your IHD? f. More than once a day g. About once a day h. 2-4 times in the week i. Once in the week j. Never 16. [Show if device = gateway] It is possible to view information from your gateway on your personal computer, tablet or on your smart phone. Please indicate how often you view information from these different devices in the past week. Device Personal computer Tablet Smart phone More than once a day About once a day 2-4 times in the week Once in the week Never 64
68 Conclusions and Recommendations 17. Please indicate whether you agree or disagree with the following statements using a 10-point scale where 1 means you strongly disagree, 10 means you strongly agree, and you can use any number in between: [randomize statements] Strongly disagree Strongly agree The [device] I received: a. Supplies information that is useful for identifying energy savings opportunities [if a < 8] Why did you give this rating? [open-ended] b. Is easy to navigate, read, and/or understand [if b < 8] Why did you give this rating? [open-ended] c. Makes me worry about the privacy of my usage information d. [show if rate = SR] Will help me reduce my usage during SmartDay events e. Has made my family/household more able to control our energy use f. Has made my family/household more interested in controlling our energy use g. Has made my family/household more interested in participating in PG&E energy savings programs. 18. Would you prefer to see the information the [device] provides on a standalone energy monitor or through a smartphone app or web portal? a. Standalone energy monitor b. Smartphone app c. Web portal d. All of the above e. Other: 19. Do you believe that you have reduced your energy use as a result of receiving the [device]? a. Yes b. No c. Not sure 20. [if rate = SR] Would you be interested in seeing real time SmartDay event performance updates and tips for improvement on your [device]? a. Yes b. No c. Not sure 21. What other information or product do you think would be helpful for you to reduce your energy use? [open-ended] 22. Have you made any changes to the way you use electricity in your home based on the information provided by the [device]? a. Yes b. No Skip to Q24 c. Not sure Skip to Q24 65
69 Conclusions and Recommendations 23. Please describe the changes you or others in your household have made. Check all that apply. a. Turned off lights not in use b. Turned off office equipment c. Turned off entertainment center d. Installed a power strip to control vampire loads e. Installed compact fluorescent lights (CFLs) f. Installed light-emitting diode lights (LEDs) g. Bought an energy efficient appliance h. Changed the settings on my manual thermostat to use less energy i. Re-programmed my programmable thermostat to use less energy j. Did fewer loads of laundry k. Did fewer loads of dishes l. Only used cold water when doing laundry/dishes m. Other: 24. How would you rate your satisfaction in using your [device] overall? Using the following 10-point scale, where 1 means very dissatisfied and 10 means very satisfied and you can use any number between 1 and 10, please rate your overall experience using your device Very dissatisfied Very satisfied 25. [If Q24 is < 8] Why do you say that? 26. Would you recommend the [device] to a friend? d. Yes Skip to Q28 e. No f. Not sure 27. Why do you say that? [Open-ended] 28. Do you have any programmable thermostats? d. Yes e. No f. Not sure 66
70 Conclusions and Recommendations 29. What is the temperature on your thermostat set to in winter between November and February during the daytime hours? in winter between November and February during the nighttime hours? in summer between June and September during the daytime hours? in summer between June and September during the nighttime hours? 30. Which of the following appliances do you have at this home? Check all that apply. e. Central air conditioner f. Clothes washer g. Electric clothes dryer h. Dishwasher 31. What time of day do you use these appliances? Check all that apply. [only show appliances that they report having] Central air conditioner Clothes washer Electric clothes dryer Dishwasher Morning Mid-day Evening 32. What other feedback, if any, do you have concerning your participation in this pilot? Optional. [Open-ended] Exit to thank you message 33. Would you like a member of the PG&E HAN customer service team contact you to assist you with registering and joining your HAN device? a. Yes b. No Skip to Q Please provide your telephone number and the best time of day to reach you. [open-ended] 35. Would you like to share any feedback concerning your participation in this pilot at this time? Optional. [Openended] Exit to thank you message You have now completed the survey. Thank you for your providing your feedback! We will be sending you a $25 check in appreciation of your time and participation. You should expect your check to arrive in the mail by mid-december. 67
71 Conclusions and Recommendations Appendix B Tabulated Survey Responses B.1 First Survey Question 1 Strongly Disagree Strongly Agree Top The PG&E provided information that came with the device to assist device registration and joining: Box Provided useful information Was easy to understand Provided all the necessary information for registering and joining my device to the SmartMeter Question 2 Open Ended Question Question 3 Strongly Disagree Strongly Agree Top The process for registering and joining your device on PG&E's My Energy website: Box Was easy to understand Can be completed in a reasonable amount of time Was convenient for me Question 4 Open Ended Question Question 5a Have you been able to access and view the Gateway IHD following information? Yes No Not Sure Yes No Not Sure Current price of electricity Current usage Cost of electricity used to date this month Projected monthly bill Question 6a Which of the four information elements do you look at most often? Device Type Gateway IHD Current price of electricity 4 32 Current usage Cost of electricity used to date this month Projected monthly bill 4 7 Look at all of them about the same
72 Conclusions and Recommendations Question 7a Gateway Usefulness of Information Elements for Tracking & Not at all useful Very Useful Monitoring Electricity Costs Current price of electricity Current usage Cost of electricity used to date this month Projected monthly bill IHD Usefulness of Information Elements for Tracking & Not at all useful Very Useful Monitoring Electricity Costs Current price of electricity Current usage Cost of electricity used to date this month Projected monthly bill Average Average Usefulness Rating of Information Elements for Tracking & Monitoring Electricity Costs Device Type Gateway IHD Current price of electricity Current usage Cost of electricity used to date this month Projected monthly bill Question 8a Gateway Very inaccurate Very accurate Accuracy of Information Elements Current price of electricity Current usage Cost of electricity used to date this month Projected monthly bill IHD Very inaccurate Very accurate Accuracy of Information Elements Current price of electricity Current usage Cost of electricity used to date this month Projected monthly bill Average Average Accuracy Rating of Information Elements Device Type Gateway IHD 69
73 Conclusions and Recommendations Current price of electricity Current usage Cost of electricity used to date this month Projected monthly bill Question 9a Open Ended Question Question 10a Did you need to contact PG&E s customer service for support at any point while registering, joining, or using your device? Device Type Gateway IHD Yes No Question 11a Specifically with respect to this pilot, how would you rate your experience with PG&E customer service? Very negative Very positive Avg. Rating Gateway IHD Question 12a Open Ended Question Question 13a Did you contact the device manufacturer or consult their website for support? Device Type Gateway IHD Yes No Not sure Question 5b Did you or anyone else in your household use the device Device Type to determine how much energy individual appliances are using? Gateway IHD No one did I did Other adult did Children did 2 14 Question 6b Did you discuss your home s energy use with anyone else based on information obtained through the device? Device Type Gateway IHD No Yes, discussed energy use with other adults in the household Yes, discussed energy use with guests or other adults outside the household Yes, discussed energy use with children
74 Conclusions and Recommendations Question 7b Device Type Were there any occasions during which your device did not appear to be working? Gateway IHD Yes No Question 8b Open Ended Question Question 9b Besides the support materials provided by PG&E when you received the device, would Device Type you like to receive additional educational communications or information regarding your device? Gateway IHD Yes No Not sure Question 10b Open Ended Question Question 11b How would you like to receive the additional educational communications or information? Device Type Gateway IHD By mail, but in a separate envelope from your PG&E bill Via Online at pge.com Application on your smart phone Phone call from PG&E 1 14 Text message on your mobile phone from PG&E 7 8 Question 12b Gateway The importance of the following motivations in deciding to Not at all important Very important participate in this pilot: To lower my PG&E bill To better understand how my household uses energy To help my household use less electricity during on-peak hours every day To learn how much electricity each of my appliances use To test out a new technology To receive compensation for my feedback [If rate=smartrate] To help my household use less electricity during SmartDay events IHD The importance of the following motivations in deciding to participate in this pilot: Not at all important Very important
75 Conclusions and Recommendations To lower my PG&E bill To better understand how my household uses energy To help my household use less electricity during on-peak hours every day To learn how much electricity each of my appliances use To test out a new technology To receive compensation for my feedback [If rate=smartrate] To help my household use less electricity during SmartDay events The average importance rating of the following motivations Device Type in deciding to participate in this pilot: Gateway IHD To lower my PG&E bill To better understand how my household uses energy To help my household use less electricity during on-peak hours every day To learn how much electricity each of my appliances use To test out a new technology To receive compensation for my feedback [If rate=smartrate] To help my household use less electricity during SmartDay events Question 14 [If rate = SmartRate] Has your device notified you of a Device Type SmartDay event? Gateway IHD Yes No Not sure Question 15 [If rate = SmartRate] [If Q14 = Yes] Rate the how helpful the SmartDay notification your device provided was in enabling you to reduce your electricity usage during the event. Not at all helpful Very helpful Gateway IHD Question 16 Open Ended Question Question 17 Open Ended Question Avg. Rating 72
76 Conclusions and Recommendations Question 18 In the past week, about how often did you look at your IHD? Device Type Gateway IHD More than once a day 294 About once a day times in the week 90 Once in the week 47 Never 61 Question 19 Device Type [If IHD] Where is the device currently located? Gateway IHD Kitchen 184 Family room 62 Living room 97 Office 117 Dining room 19 Question 20 How often did you look at your Gateway's information using your Personal Computer, Tablet, or Smart phone? Personal Computer Tablet Smart phone More than once a day About once a day times in the week Once in the week Seldom or Never Question 21 [If Gateway] Which portal do you normally use to view your information? Bidgely 583 EnergyVue 26 Both Bidgely and EnergyVue 41 Device Type Gateway IHD Question 22 Very dissatisfied Very satisfied Avg. Rate your overall experience using your device Rating Gateway IHD
77 Average Thermostat is Off Don't know Average Thermostat is Off Don't know Conclusions and Recommendations Question 23 Device Type Would you recommend the device to a friend? Gateway IHD Yes No Not sure Question 24 Open Ended Question Question 25 Device Type Do you have any programmable thermostats? Gateway IHD Yes No Not sure 7 13 Question 26 What is the temperature on your thermostat set to? Gateway in winter between November and February during the daytime hours? in winter between November and February during the nighttime hours? in summer between June and September during the daytime hours? in summer between June and September during the nighttime hours? IHD in winter between November and February during the daytime hours? in winter between November and February during the nighttime hours? in summer between June and September during the daytime hours? in summer between June and September during the nighttime hours?
78 Conclusions and Recommendations Question 27 Which of all the following appliances do you have at this home? Device Type Gateway IHD Central air-conditioner Clothes Washer Electric clothes dryer Dishwasher Question 28 What time of day do you use these Gateway IHD appliances? Morning Mid-day Evening Morning Mid-day Evening Central air-conditioner Clothes Washer Electric clothes dryer Dishwasher Question 29 Device Type What is your gender? Gateway IHD Male Female Question 31 Device Type Which of the following groups includes your age? Gateway IHD 18 to to to to to to or over Question 32 Device Type What is the highest level of education you have achieved? Gateway IHD High school diploma, GED or less 9 17 Trade / technical school 9 9 Some college College degree Some post-graduate work or more
79 Conclusions and Recommendations Question 33 Which of the following groups includes your total annual household income before taxes in 2011? Device Type Gateway IHD Less than $25, $25,000 - $49, $50,000 - $74, $75,000 - $99, $100,000 - $149, $150,000 - $249, $250, Question 34 Open Ended Question 76
80 Conclusions and Recommendations B.2 Second Survey Question 1 Is the device you received currently working? Device Type Gateway IHD Yes No Not Sure/Don't Know Question 2 Approximately when did it stop working? Device Type Gateway IHD It never worked Within a month of receiving it 1 21 A few days ago 4 8 A few weeks ago 3 34 Not Sure/Don't Know 4 5 Question 3 When you noticed that it wasn't working, did you attempt to restart it? Device Type Gateway Yes 8 62 No 4 6 Question 4 What actions did you take to try to restart the device? IHD Device Type Gateway IHD Turned it off and then on 8 56 Called PG&E customer service 1 19 Contacted the device manufacturer 0 10 Other 1 12 Question 5 Have you discarded the device or is it still in your home? Device Type Gateway IHD Discarded 1 0 Still in the home Not Sure/Don't Know
81 Conclusions and Recommendations Question 6 Have you been able to access and view the Gateway IHD following information? Yes No Not Sure Yes No Not Sure Current price of electricity Current usage Cost of electricity used to date this month Projected monthly bill Question 7 Which of the four information elements do you look at most often? Device Type Gateway IHD Current price of electricity Current usage Cost of electricity used to date this month 22 9 Projected monthly bill Look at all of them about the same Question 8 Gateway Usefulness of Information Elements for Tracking & Not at all useful Very Useful Monitoring Electricity Costs Current price of electricity Current usage Cost of electricity used to date this month Projected monthly bill IHD Usefulness of Information Elements for Tracking & Not at all useful Very Useful Monitoring Electricity Costs Current price of electricity Current usage Cost of electricity used to date this month Projected monthly bill Average Rating Average Usefulness Rating of Information Elements for Tracking & Monitoring Electricity Costs Device Type Gateway IHD Current price of electricity Current usage Cost of electricity used to date this month Projected monthly bill
82 Conclusions and Recommendations Question 9 Have you or anyone else in your household used the device to determine individual appliance energy usage in the last 30 days? Device Type Gateway IHD Yes No I stopped using or discarded the device more than 30 days ago Question 10 Device Type Who used the device to determine individual appliance energy usage? Gateway IHD I did Other adult did Children did 2 18 Question 11 Did you discuss your home's energy use with anyone else based on information from the device in the last 30 days? Device Type Gateway IHD Yes No I stopped using or discarded the device more than 30 days ago 0 3 Question 12 Device Type With whom did you discuss your home's energy use? Gateway IHD With other adults in the household With guests or other adults outside the household With children Question 13 Were there any occasions during which your device did not appear to be working in the last 30 days? Device Type Gateway IHD Yes No I stopped using or discarded the device more than 30 days ago 0 3 Question 14 Open Ended Question 79
83 Conclusions and Recommendations Question 15 In the past week, about how often did you look at your IHD? Device Type Gateway IHD More than once a day 196 About once a day times in the week 78 Once in the week 56 Never 47 Question 16 In the past week, how often did you look at your Gateway's information using your Personal Computer, Tablet, or Smart phone? Personal Computer Tablet Smart phone More than once a day About once a day times in the week Once in the week Never Question 17 Gateway The device I received: Supplies information that is useful for identifying energy saving opportunities Is easy to navigate, read, and/or understand Makes me worry about the privacy of my usage information Will help me reduce my usage during SmartDay events Has made my family/household more able to control our energy use Has made my family/household more interested in controlling our energy use Has made my family/household more interested in participating in PG&E energy savings programs Strongly Disagree Strongly Agree
84 Conclusions and Recommendations IHD Strongly Disagree Strongly Agree The device I received: Supplies information that is useful for identifying energy saving opportunities Is easy to navigate, read, and/or understand Makes me worry about the privacy of my usage information Will help me reduce my usage during SmartDay events Has made my family/household more able to control our energy use Has made my family/household more interested in controlling our energy use Has made my family/household more interested in participating in PG&E energy savings programs Average Rating Device Type Gateway IHD The device I received: Supplies information that is useful for identifying energy saving opportunities Is easy to navigate, read, and/or understand Makes me worry about the privacy of my usage information Will help me reduce my usage during SmartDay events Has made my family/household more able to control our energy use Has made my family/household more interested in controlling our energy use Has made my family/household more interested in participating in PG&E energy savings programs Question 17a Open Ended Question Question 17b Open Ended Question Question 18 Would you prefer to see the information the device provides on any of the following devices? Device Type Gateway IHD Stand-alone energy monitor Smartphone app Web portal All of the Above Other
85 Conclusions and Recommendations Question 19 Do you believe that you have reduced your energy use as a result of receiving the device? Device Type Gateway IHD Yes No Not sure Question 20 Would you be interested in seeing real time SmartDay Device Type event performance updates and tips for improvement on your device? Gateway IHD Yes No Not Sure Question 21 Open Ended Question Question 22 Have you made any changes to the way you use Device Type electricity in your home based on the information provided by the device? Gateway IHD Yes No Not Sure Question 23 Device Type Please describe the changes you or others in your household have made Gateway IHD Turned off lights not in use Turned off office equipment Turned off entertainment center Installed a power strip to control "vampire" loads Installed compact fluorescent lights (CFLs) Installed light-emitting diode lights (LEDs) Bought an energy efficient appliance Changed the setting on my manual thermostat to use less energy Re-programmed by programmable thermostat to use less energy Did fewer loads of laundry Did fewer loads of dishes Only used cold water when doing laundry/dishes Other
86 Average Temperature Thermostat is Off No Central Air Conditioning Don't know Conclusions and Recommendations Question 23a Future HAN devices may be able to communicate Not At All Interested Very Interested with appliances in your home to provide an automatic response during SmartDay events. Please Average rate your interest in this kind of HAN device. Gateway IHD Question 24 How would you rate your satisfaction in using your Very Dissatisfied Very Satisfied device overall? Average Gateway IHD Question 25 Open Ended Question Question 26 Device Type Would you recommend the device to a friend? Gateway IHD Yes No Not Sure Question 27 Open Ended Question Question 28 Do you have any programmable thermostats? Device Type Gateway IHD Yes No Not Sure 5 10 Question 29 What is the temperature on your thermostat set to? Gateway in winter between November and February during the daytime hours? in winter between November and February during the nighttime hours? in summer between June and September during the daytime hours? in summer between June and September during the nighttime hours?
87 Average Temperature Thermostat is Off No Central Air Conditioning Don't know Conclusions and Recommendations IHD in winter between November and February during the daytime hours? in winter between November and February during the nighttime hours? in summer between June and September during the daytime hours? in summer between June and September during the nighttime hours? Question 30 Device Type Which of all the following appliances do you have at this home? Gateway IHD Central air-conditioner Clothes Washer Electric clothes dryer Dishwasher None of the above 8 6 Question 31 What time of day do you use these Gateway IHD appliances? Morning Mid-day Evening Morning Mid-day Evening Central air-conditioner Clothes Washer Electric clothes dryer Dishwasher Question 32 Open Ended Question Question 33 Would you like a member of the PG&E HAN customer service team to contact you to assist you with registering and joining your HAN device? Device Type Gateway IHD Yes No 8 16 Question 34 Open Ended Question Question 35 Open Ended Question 84
88 Conclusions and Recommendations Appendix C Customer Focus Group Discussion Guides C.1 Aztech Guide Introduction of Focus Group Leader and Ground Rules (5 minutes) A brief introduction period will take place at the outset of the focus groups. The introduction will explain who Michael Sullivan is [NEXANT AND NO DOG IN THIS HUNT] and his role, which is to guide the discussion and make sure that everybody has a chance to speak their mind on the issues that are raised. Dr. Sullivan will share a quick personal thank you for agreeing to actively participate. This is an opportunity to provide frank feedback regarding your experience with the Aztech in-home display (IHD). It is an opportunity to tell us what you liked and disliked and ultimately to tell us how to better assist customers in using devices that communicate with their PG&E SmartMeters. The following logistical information and focus group guidelines will be discussed: In the event of an emergency, we will exit this room and ; The restroom facilities are located nearby (point them out); The focus group discussions will last about 90 minutes; The discussion will be recorded for the sole use of the research team to help us review and summarize your input your feedback will remain anonymous The research team is here to hear first-hand about your experience with the Aztech. Like me, they are really only interested in hearing your frank answers to the questions I will be asking, so don t worry about hurting their feelings. More than anything else, everyone here just wants to hear what you really think; That said, while PG&E has been in the news as of late, we would like to be sure to keep our discussion pertinent to your experience participating in this pilot; There are no right answers to the questions posed (this meeting should be a wide-open discussion with all items open to consideration); and Lastly, please turn your mobile phones off. Focus Group Participant Introduction (10 minutes) We will go around the room and have each customer tell us: Their name; A little about them and their household: o o o o o Where they work; Where they live; How long they have lived there; Who they live with; and What interested them in the Aztech and caused them to volunteer for the pilot. Also what their hobbies and interests are. Expectations and Performance (20 minutes) In this section participants discuss their overall impression of the product and service. 85
89 Conclusions and Recommendations I d like to begin by discussing your overall impression of the Aztech display. For starters, I d like you to take about three minutes to think about and write down the things you liked and disliked about the Aztech on the piece of paper in front of you. [Give them three minutes to complete the exercise and then start the discussion] As discussion proceeds, probe the group for: What were their expectations for device functionality at the start of the pilot? What were their expectations for reliability and performance at the start of the pilot? Were their expectations met? From time to time, in-home energy monitoring devices such as the Aztech will stop working unexpectedly. Did anybody have that experience? Were they able to correct the problem? Did they call PG&E at any time during the pilot to request assistance? What was the purpose of the call? Were they satisfied with the outcome from the call? What could have been done better during your call? Discussion of What They Are Looking at on the Aztech (40 minutes) [Hand out page containing the two screen shots ] 86

90 Conclusions and Recommendations 87
91 Conclusions and Recommendations First of all, take a look at the page I just handed you and let s go around the room. As your turn comes, tell me the following: Where is your Aztech located in your home? Was it was operational within the last month? Are you still looking at your Aztech device? If so, how often? Which informational element did you predominately look at? PG&E provides your Aztech with the information elements called out by the numbers 1, 2, 3, and 4. Which of those elements have you looked at, and which do you look at most often? Have you ever navigated to the second screen shown which presents additional information presented in the form of Messages? In terms of your use, how have these three things (viewing mode, operability, screen choice) changed over time? Accumulate the answers based on which screen was displayed. For each element that was mentioned, go back to the individuals that mentioned it and ask in detail: What information are they looking at? Why they are looking at it? What does that information make them think? Whether they have ever taken any action to control their usage based on the information coming from the Aztech? How would you prefer to view your electric usage information on a standalone device such as the Aztech...or on your smart phone, computer, or tablet? Rates and Programs (15 minutes) Before you received your Aztech, did you understand what electric rate you are on? Does your Aztech help you better understand your electric rate and how to respond to it? For those of you on SmartRate, did having an Aztech make responding to the last two SmartDay events this summer easier (they were in September)? For those of you on TOU, does the Aztech help you reduce your on-peak consumption every day? For those of you currently not on TOU, are you more interested in signing up for a TOU rate after using your Aztech? [Hand out page illustrating TOU rate ] 88
92 Conclusions and Recommendations Now that you have been using the Aztech, are you more interested in energy management at home? o o Would you consider a home energy management offering from broadband service or home security providers or big box retailers? What if PG&E offered home energy management services? For those of you on SmartRate, Would you be interested in a HAN device that could communicate with your thermostat or other household appliances to provide (configurable) automatic responses to SmartDay events? Closing Thank the participants for their valuable insights and perspective. 89
93 Conclusions and Recommendations C.2 Bidgely Guide Introduction of Focus Group Leader and Ground Rules (5 minutes) A brief introduction period will take place at the outset of the focus groups. The introduction will explain who Michael Sullivan is [NEXANT AND NO DOG IN THIS HUNT] and his role, which is to guide the discussion and make sure that everybody has a chance to speak their mind on the issues that are raised. Dr. Sullivan will share a quick personal thank you for agreeing to actively participate. This is an opportunity to provide frank feedback regarding your experience with the Bidgely gateway. It is an opportunity to tell us what you liked and disliked and ultimately to tell us how to better assist customers in using devices that communicate with their PG&E SmartMeters. The following logistical information and focus group guidelines will be discussed: In the event of an emergency, we will exit this room and ; The restroom facilities are located nearby (point them out); The focus group discussions will last about 90 minutes; The discussion will be recorded for the sole use of the research team to help us review and summarize your input; They are here to hear first-hand about your experience with the Bidgely gateway. Like me, they are really only interested in hearing your frank answers to the questions I will be asking, so don t worry about hurting their feelings. More than anything else, everyone here just wants to hear what you really think; That said, while PG&E has been in the news as of late, we would like to be sure to keep our discussion pertinent to your experience participating in this pilot; There are no right answers to the questions posed (this meeting should be a wide-open discussion with all items open to consideration); and Lastly, please turn your mobile phones off. Focus Group Participant Introduction (10 minutes) We will go around the room and have each customer tell us: Their name; A little about them and their household: o o o o o Where they work; Where they live; How long they have lived there; Who they live with; and What interested them in the Bidgely gateway and caused them to volunteer for the pilot. Also what their hobbies and interests are. 90
94 Conclusions and Recommendations Expectations and Performance (20 minutes) In this section participants discuss their overall impression of the product and service. I d like to begin by discussing your overall impression of the Bidgely gateway. For starters, I d like you to take about three minutes to think about and write down the things you liked and disliked about the Bidgely gateway on the piece of paper in front of you. [Give them three minutes to complete the exercise and then start the discussion] As discussion proceeds, probe the group for: What were their expectations for device functionality at the start of the pilot? What were their expectations for reliability and performance at the start of the pilot? Were their expectations met? From time to time, in-home energy monitoring devices such as the Bidgely gateway will stop working unexpectedly. Did anybody have that experience? Were they able to correct the problem? Did they call PG&E at any time during the pilot to request assistance? What was the purpose of the call? Were they satisfied with the result? What could have been done better during your call? Discussion of What They Are Looking at on the Bidgely Portal (40 minutes) [Hand out page containing the two screen shots ] 91
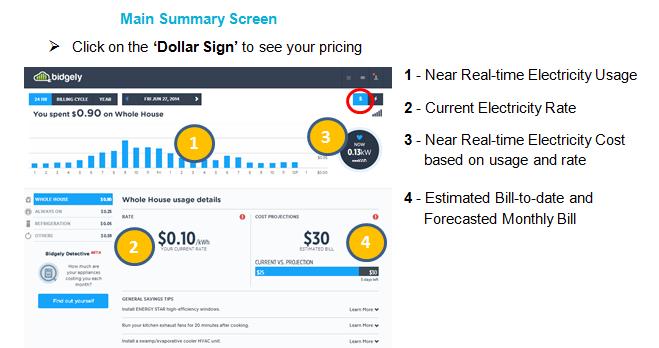
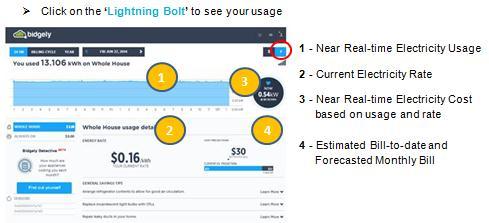
95 Conclusions and Recommendations 92
96 Conclusions and Recommendations First of all, take a look at the page I just handed you and let s go around the room. As your turn comes, tell me the following things: What electronic device are you using to view the information provided by the Bidgely gateway (i.e., PC/laptop, tablet, or smart phone)? Was the Bidgely device operational within the last month? Are you still looking at the Bidgely portal or app? If so, how often? Which screen did you predominately look at, the first Pricing screen or the second Usage screen? PG&E provides Bidgely with the information elements called out by the numbers 1, 2, 3, and 4. Which of those elements have you looked at? How have these three things (viewing mode, operability, screen choice) changed over time? Accumulate the answers based on which screen was displayed, and for each element that was mentioned, go back to the individuals that mentioned it and ask in detail: What information are they looking at? Why they are looking at it? What does that information make them think? Whether they have ever taken any action to control their usage based on the information coming from the Bidgely? How would you prefer to view your electric usage information on a standalone device or on your smart phone, computer, or tablet? Rates and Programs (15 minutes) Before you received your Bidgely, did you understand what electric rate you are on? Does your Bidgely help you better understand your electric rate and how to respond to it? For those of you on SmartRate, did having a Bidgely make responding to the last two SmartDay events this summer easier? For those of you on TOU, does the Bidgely help you reduce your on-peak consumption every day? Many of you are not currently on TOU, are you more interested in taking a TOU rate after using your Bidgely? [Hand out page illustrating TOU rate ] 93

97 Conclusions and Recommendations Now that you have been using the Bidgely device, are you more interested in energy management at home? o o Would you consider a home energy management offering from broadband service or home security providers or big box retailers? What if PG&E offered home energy management services? For those of you on SmartRate, Would you be interested in a HAN device that could communicate with your thermostat or other household appliances to provide (configurable) automatic responses to SmartDay events? Closing Thank the participants for their valuable insights and perspective. 94
Is Behavioral Energy Efficiency and Demand Response Really Better Together?
 Is Behavioral Energy Efficiency and Demand Response Really Better Together? David Thayer, Wendy Brummer, Brian Arthur Smith, Rick Aslin, Pacific Gas and Electric Company and Jonathan Cook, Nexant ABSTRACT
RESULTS OF CL&P PLAN-IT WISE ENERGY PILOT
 Table of Contents..... PAGE INTRODUCTION...2 DECISION ORDERS...2 EXECUTIVE SUMMARY...3 A. RATE PILOT RESULTS... 5 B. ADVANCED METER STUDY RESULTS... 9 C. NEXT STEPS... 10 D. CONCLUSION... 11 Tables TABLE
REPORT. SoCalGas Demand Response: 2017/2018 Winter Load Impact Evaluation. August 14, Prepared for Southern California Gas Company
 REPORT SoCalGas Demand Response: 2017/2018 Winter Load Evaluation August 14, 2018 Prepared for Southern California Gas Company Prepared by Eric Bell, Ph.D. Principal Stephanie Bieler Consultant Nexant,
Final Savings Estimates and Key Learnings from a Behavioral Messaging Thermostat Trial
 Final Savings Estimates and Key Learnings from a Behavioral Messaging Thermostat Trial Lucy Morris Candice Churchwell 2014 BECC Conference Washington, D.C. December 10, 2014 How do we get a thermostat
A Common Evaluation Framework for Comparison of Smart Grid Program Impacts Across Utilities
 A Common Evaluation Framework for Comparison of Smart Grid Program Impacts Across Utilities Stuart Schare, Navigant Consulting, Boulder, CO Mike Sherman, Navigant Consulting, Burlington, MA ABSTRACT A
Colorado PUC E-Filings System
 SmartGridCity TM Pricing Pilot Program Pilot Evaluation and Final Report December 19 th, 2013 This SmartGridCity TM (SGC) Pricing Pilot Program Pilot Evaluation and Final Report ( report ) is submitted
Dynamic Pricing Works in a Hot, Humid Climate
 Dynamic Pricing Works in a Hot, Humid Climate Evidence from Florida BY AHMAD FARUQUI, NEIL LESSEM, SANEM SERGICI 30 PUBLIC UTILITIES FORTNIGHTLY MAY 2017 XT here is some debate about the efficacy of dynamic
Statewide Pricing Pilot (SPP)
") Statewide Pricing Pilot (SPP) Overview and Results 23-24 Should dynamic rates be offered to all customers? 4.5 4. Residential Response to Critical Peak Pricing Control Group CPP Event Total TOU 69% 65%
Statewide Pricing Pilot (SPP) Overview and Results 23-24 Should dynamic rates be offered to all customers? 4.5 4. Residential Response to Critical Peak Pricing Control Group CPP Event Total TOU 69% 65%
PROGRAM YEAR 1 ( ) EM&V REPORT FOR THE RESIDENTIAL ENERGY EFFICIENCY BENCHMARKING PROGRAM
 EM&V REPORT FOR THE RESIDENTIAL ENERGY EFFICIENCY BENCHMARKING PROGRAM") PROGRAM YEAR 1 (2011-2012) EM&V REPORT FOR THE RESIDENTIAL ENERGY EFFICIENCY BENCHMARKING PROGRAM Presented to: Progress Energy Carolinas Prepared by: Navigant Consulting, Inc. 2012 Navigant Consulting,
PROGRAM YEAR 1 (2011-2012) EM&V REPORT FOR THE RESIDENTIAL ENERGY EFFICIENCY BENCHMARKING PROGRAM Presented to: Progress Energy Carolinas Prepared by: Navigant Consulting, Inc. 2012 Navigant Consulting,
NSPM Rate Design Pilot
 NSPM Rate Design Pilot Stakeholder Meeting May 5, 2017 Agenda and Purpose Agenda Introduction of MN Pilot Development A. Liberkowski Concept and Goals Pilot Development Timeline MN Time of Use Rate Option
Public Interest Energy Research (PIER) Energy Savings through Smart Controls in Multifamily Housing Study: Impact Analysis
 Energy Savings through Smart Controls in Multifamily Housing Study: Impact Analysis") San Francisco Bay 510 444 5050 tel 800 966 1254 toll free 1999 Harrison Street Suite 1420 Oakland, CA 94612 Public Interest Energy Research (PIER) Energy Savings through Smart Controls in Multifamily Housing
San Francisco Bay 510 444 5050 tel 800 966 1254 toll free 1999 Harrison Street Suite 1420 Oakland, CA 94612 Public Interest Energy Research (PIER) Energy Savings through Smart Controls in Multifamily Housing
Looking Ahead: Identifying Common Elements of a Customer Engagement Platform
 Looking Ahead: Identifying Common Elements of a Customer Engagement Platform CEE Industry Partners Meeting September 18, 2013 Derek Okada Southern California Edison DSM Strategy & Compliance Copyright
Demanding Baselines: Analysis of Alternative Load Estimation Methods for Two Large C&I Demand Response Programs
 Demanding Baselines: Analysis of Alternative Load Estimation Methods for Two Large C&I Demand Response Programs Assessing Baseline Load Methods for California s Critical Peak Pricing & Demand Bidding Programs
SmartGridCity Pricing Pilot Program
 SmartGridCity Pricing Pilot Program Impact Evaluation Results, 2011-2013 Colorado PUC E-Filings System Prepared for Xcel Energy 1800 Larimer 15 th Floor Denver, CO 80202 Prepared by EnerNOC, Inc. 500 Ygnacio
UK Case Studies. 4 th July 2013 Steinkjer, Norway. Esther Dudek
 UK Case Studies 4 th July 2013 Steinkjer, Norway Esther Dudek Presentation Contents Summary of four case studies: The Energy Demand Reduction Trial E.ON Thinking Energy Trial Customer Led Network Revolution
Matching and VIA: Quasi-Experimental Methods in a World of Imperfect Data
 Matching and VIA: Quasi-Experimental Methods in a World of Imperfect Data Eileen Hannigan, Illume Advising, LLC, Madison, WI Jan Cook, Accelerated Innovations, St. Paul, MN ABSTRACT The State and Local
Customer Targeting for Residential Energy Efficiency Adam Scheer and Sam Borgeson
 Customer Targeting for Residential Energy Efficiency Adam Scheer and Sam Borgeson EEDAL 2017 Customer Targeting A Primer Energy Efficiency Funding California: $1 Billion Residential: $200 Million 14 Million
CALMAC Study ID PGE0354. Daniel G. Hansen Marlies C. Patton. April 1, 2015
 2014 Load Impact Evaluation of Pacific Gas and Electric Company s Mandatory Time-of-Use Rates for Small and Medium Non-residential Customers: Ex-post and Ex-ante Report CALMAC Study ID PGE0354 Daniel G.
The Effects of Time-of-Use Rates on Residential Electricity Consumption. Newmarket Tay Power Distribution
 The Effects of Time-of-Use Rates on Residential Electricity Consumption Presented to Newmarket Tay Power Distribution April 9, 2010 Navigant Consulting Inc. One Adelaide Street East, 30 th Floor Toronto,
Moving forward with tariff reform
 Moving forward with tariff reform P R E S E N T E D T O : EEI Webinar on Rate Design P R E S E N T E D B Y : Ahmad Faruqui, Ph.D. April 6, 2017 Copyright 2017 The Brattle Group, Inc. This presentation
Is More Always Better? A Comparison of Billing Regression Results Using Monthly, Daily and Hourly AMI Data
 Is More Always Better? A Comparison of Billing Regression Results Using Monthly, Daily and Hourly AMI Data John Cornwell, Evergreen Economics, Portland, OR Stephen Grover, Evergreen Economics, Portland,
Time-based Pricing Pilot
 Time-based Pricing Pilot Frequently Asked Questions (FAQ) Overview In November 2012, New Hampshire Electric Cooperative (NHEC) launched a pilot program that studies the impact of time-based rates on members
2012 LOAD IMPACT EVALUATION OF SDG&E SMALL COMMERCIAL PTR PROGRAM SDG0267 FINAL REPORT
 2012 LOAD IMPACT EVALUATION OF SDG&E SMALL COMMERCIAL PTR PROGRAM SDG0267 FINAL REPORT EnerNOC Utility Solutions Consulting 500 Ygnacio Valley Road Suite 450 Walnut Creek, CA 94596 925.482.2000 www.enernoc.com
RTR Appendix. RTR for the Focused Impact Evaluation of the Home Upgrade Program (DNV GL, ED WO #ED_D_Res_5, Calmac ID #CPU0118.
 RTR Appendix Southern California Edison, Pacific Gas and Electric, Southern California Gas, and San Diego Gas and Electric ( Joint Utilities or Joint IOUs ) developed Responses to s (RTR) contained in
Do Customers Respond to Real-Time Usage Feedback? Evidence from Singapore
 Do Customers Respond to Real-Time Usage Feedback? Evidence from Singapore Frank A. Wolak Director, Program on Energy and Sustainable Development Professor, Department of Economics Stanford University Stanford,
Options for Reducing Peak Load
 Options for Reducing Peak Load Michigan Retreat on Peak Shaving to Reduce Wasted Energy Dr. Stephen George Senior Vice President Nexant August 6, 2014 Options for reducing peak load among residential customers
Residential demand response the dynamic Time-of-Use tariff
 Residential demand response the dynamic Time-of-Use tariff Session 2 Adriana Laguna & Kerry Morgan UK Power Networks & EDF Energy In Partnership with: 1 Agenda Before Low Carbon London LCL: dynamic Time
How to Estimate the Value of Service Reliability Improvements
 1 How to Estimate the Value of Service Reliability Improvements Michael J. Sullivan, Chairman, FSC, Matthew G. Mercurio, Senior Consultant, FSC, Josh A. Schellenberg, Senior Analyst, FSC, and Joseph H.
SMUD s Residential Summer Solutions Study
 + SMUD s Residential Summer Solutions Study An Investigation of the Effects of Real- Time Information, Dynamic Pricing, and Thermostat Automation on Residential Energy Conservation, Peak Load Shifting,
Do Touch That Dial! How Satisfied Were You With That Tier II Power Strip? Nicholas O Neil, Energy 350 Kevin Campbell, Energy 350
 Do Touch That Dial! How Satisfied Were You With That Tier II Power Strip? Nicholas O Neil, Energy 350 Kevin Campbell, Energy 350 ABSTRACT The next generation of load controlling power strips is here and
The Energy-Smart Pricing Plan SM (ESPP) Real-Time Pricing for Residential Customers. Lawrence Kotewa Senior Engineer and Project Manager
 Real-Time Pricing for Residential Customers. Lawrence Kotewa Senior Engineer and Project Manager") The Energy-Smart Pricing Plan SM (ESPP) Real-Time Pricing for Residential Customers Lawrence Kotewa Senior Engineer and Project Manager Real-Time Pricing for Residential Customers The Chicago RTP pilot
The Energy-Smart Pricing Plan SM (ESPP) Real-Time Pricing for Residential Customers Lawrence Kotewa Senior Engineer and Project Manager Real-Time Pricing for Residential Customers The Chicago RTP pilot
2011 Load Impact Evaluation of California's Statewide Base Interruptible Program
 CALMAC Study ID: SCE0316.02 2011 Impact Evaluation of California's Statewide Base Interruptible Program June 1, 2012 Freeman, Sullivan & Co. 101 Montgomery St., 15th Floor San Francisco, CA 94104 fscgroup.com
Journal Presentation 陳清宜
 Journal Presentation 陳清宜 http://eliq.se/en/products/eliq-energy-display/ http://eliq.se/en/products/eliq-energy-display/ REAL-TIME USAGE BILL-TO-DATE ELECTRICITY PRICE ESTIMATED MONTHLY USAGE Finding
When You Can t Go for the Gold: What is the best way to evaluate a non-rct demand response program?
 When You Can t Go for the Gold: What is the best way to evaluate a non-rct demand response program? Olivia Patterson, Seth Wayland and Katherine Randazzo, Opinion Dynamics, Oakland, CA ABSTRACT As smart
Review and Validation of 2015 Pacific Gas and Electric Home Energy Reports Program Impacts (Final Report)
") Review and Validation of 2015 Pacific Gas and Electric Home Energy Reports Program Impacts (Final Report) California Public Utilities Commission Date: 05/05/2017 CALMAC Study ID: CPU0155.01 LEGAL NOTICE
Review and Validation of 2015 Pacific Gas and Electric Home Energy Reports Program Impacts (Final Report) California Public Utilities Commission Date: 05/05/2017 CALMAC Study ID: CPU0155.01 LEGAL NOTICE
Using Low Voltage Smart System (LVSS) Data for Intelligent Operations and Customer Support
 Data for Intelligent Operations and Customer Support") Using Low Voltage Smart System (LVSS) Data for Intelligent Operations and Customer Support Author & Presenter: Hartmut Bohmer- Engineering Projects Lead Co-author: Haneefa Motani- Marketing and Sales Administrator
Using Low Voltage Smart System (LVSS) Data for Intelligent Operations and Customer Support Author & Presenter: Hartmut Bohmer- Engineering Projects Lead Co-author: Haneefa Motani- Marketing and Sales Administrator
Modeling Customer Response to Xcel Energy s RD-TOU Rate
 Page 1 of 21 Modeling Customer Response to Xcel Energy s RD-TOU Rate P R E S E N T E D T O Xcel Energy P R E S E N T E D B Y Ahmad Faruqui Ryan Hledik Ap r i l 2 1, 2 0 1 6 Copyright 2016 The Brattle Group,
Summary of 60-Day Notice: Smart Thermostat Demand Response
 Summary of 60-Day Notice: Smart Thermostat Demand Response Public Service Company of Colorado ( Public Service or the Company ) is providing a 60-Day Notice to add a Smart Thermostat measure to the product
Leveraging Smart Meter Data & Expanding Services BY ELLEN FRANCONI, PH.D., BEMP, MEMBER ASHRAE; DAVID JUMP, PH.D., P.E.
 ASHRAE www.ashrae.org. Used with permission from ASHRAE Journal. This article may not be copied nor distributed in either paper or digital form without ASHRAE s permission. For more information about ASHRAE,
Introduction ABSTRACT
 Bring Me the Right Data! An In-Depth Look at What Data Is Useful for the Utility of the Future Isaac Wainstein, Ryan Bossis Energy and Resource Solutions (ERS) ABSTRACT It is often recognized that gathering
AMI Billing Regression Study Final Report. February 23, 2016
 AMI Billing Regression Study Final Report February 23, 2016 Table of Contents Executive Summary... i 1 Introduction... 1 2 Random Coefficients Model... 5 2.1 RANDOM COEFFICIENTS MODEL DEVELOPMENT PROCESS...
Can Dispatchable Pricing Options Be Used to Delay Distribution Investments? Some Empirical Evidence
 Can Dispatchable Pricing Options Be Used to Delay Distribution Investments? Some Empirical Evidence Robert L. Cruz, Pacific Gas and Electric Company Dennis M. Keane and Michael J. Sullivan, Freeman, Sullivan
Dynamic Pricing Programs Focus on Peak-Time Rebate Programs
 Power System Engineering, Inc. Power System Engineering, Inc. Dynamic Pricing Programs Focus on Peak-Time Rebate Programs Steve Fenrick Power System Engineering, Inc. fenricks@powersystem.org 608-268-3549
Estimating Marginal Residential Energy Prices in the Analysis of Proposed Appliance Energy Efficiency Standards
 Estimating Marginal Residential Energy Prices in the Analysis of Proposed Appliance Energy Efficiency Standards Stuart Chaitkin, Lawrence Berkeley National Laboratory James E. McMahon, Lawrence Berkeley
Understanding Residential Customer Response to Demand Charges: Present and Future
 Understanding Residential Customer Response to Demand Charges: Present and Future P R E S E N T E D T O EUCI Residential Demand Charge Conference, Chicago IL P R E S E N T E D B Y Sanem Sergici, Ph.D.
Electric Program Investment Charge (EPIC)
") Pacific Gas and Electric Company EPIC Final Report Program Electric Program Investment Charge (EPIC) Project Name Project Reference Name EPIC 1-23 Demonstrate Additive Billing with Submetering for PVs
Pacific Gas and Electric Company EPIC Final Report Program Electric Program Investment Charge (EPIC) Project Name Project Reference Name EPIC 1-23 Demonstrate Additive Billing with Submetering for PVs
MARKET. In order to provide near real time data, Reliant chose Tendril s In Home Display.
 MARKET Q: Have you seen success of this product with low income groups? A: Yes, It fit the segment very well since there was no prerequisite for broadband Internet for its use. Q: Utility pilots on IHDs
Energy Conservation Pilot Program
 Energy Conservation Pilot Program Pineapple Hill Residence 126 124 122 Average Voltage 12 118 116 114 112 Incoming Voltage After MicroPlanet Regulation Voltage Before and After MicroPlanet Regulation Prepared
Energy Efficiency Impact Study
 Energy Efficiency Impact Study for the Preferred Resources Pilot February, 2016 For further information, contact PreferredResources@sce.com 2 1. Executive Summary Southern California Edison (SCE) is interested
ENERGY INITIATIVE ENERGY EFFICIENCY PROGRAM Impact Evaluation of Prescriptive and Custom Lighting Installations. National Grid. Prepared by DNV GL
 ENERGY INITIATIVE ENERGY EFFICIENCY PROGRAM Impact Evaluation of Prescriptive and Custom Lighting Installations National Grid Prepared by DNV GL Date: September 25, 2015 DNV GL www.dnvgl.com September,
Power Off & Save Pilot
 Electric Ireland Customer Innovations Power Off & Save Pilot Project Progress Report 2 Ref: ENQEIR506/EI April 2018 Progress Report 2 Executive Summary The purpose of this document is to report on the
Santa Clara 2008 PG&E. Associate Project Manager Energy Information Network
 PG&E SmartMeter Program Overview Megan O Brien Associate Project Manager Energy Information Network The PG&E SmartMeter Program Automated meter reading for all customers 10 Million meter upgrades A network
2017 Seasonal Savings Evaluation
 Prepared for National Grid Submitted by: Navigant Consulting, Inc. 77 South Bedford Street Suite 400 Burlington, MA 01803 781.270.8300 navigant.com Reference No.: 194701 March 9, 2018 2018 Navigant Consulting,
Review and Validation of 2014 Pacific Gas and Electric Home Energy Reports Program Impacts (Final Report)
") Review and Validation of 2014 Pacific Gas and Electric Home Energy Reports Program Impacts (Final Report) California Public Utilities Commission Date: 04/01/2016 CALMAC Study ID LEGAL NOTICE This report
Review and Validation of 2014 Pacific Gas and Electric Home Energy Reports Program Impacts (Final Report) California Public Utilities Commission Date: 04/01/2016 CALMAC Study ID LEGAL NOTICE This report
REPORT. Xcel Energy Colorado Smart Thermostat Pilot Evaluation Report. May 12, Prepared for Xcel Energy
 REPORT Xcel Energy Colorado Smart Thermostat Pilot Evaluation Report May 12, 2017 Prepared for Xcel Energy Prepared by Josh Schellenberg Vice President Alana Lemarchand Senior Consultant Alexandra Wein
Residential Real-Time Pricing: Bringing Home the Potential
 Residential Real-Time Pricing: Bringing Home the Potential Kathryn Tholin Assessing the Potential for Demand Response Programs The Institute for Regulatory Policy Studies, Illinois State University May
A Hybrid Model for Forecasting Electricity Sales
 A Hybrid Model for Forecasting Electricity Sales A Case Study of Peninsular Malaysia P R E S E N T E D T O International Energy Policy & Program Evaluation Conference, Bangkok P R E S E N T E D B Y Ahmad
ABSTRACT. Introduction
 Strategies for Improving Customer Response to CPP Price Signals Barb Ryan, EnerNOC Consulting Services, Madison, WI Mark S. Martinez, SCE, Los Angeles, CA Kathryn Smith, SDG&E, San Diego, CA Greg Mandelman,
Smart Grid Demonstration Final Report. MLGW President s Briefing January 17, 2013
 Smart Grid Demonstration Final Report MLGW President s Briefing January 17, 2013 Smart Grid Demo Objective Demonstrate the operational and customer benefits of smart grid technology Labor and transportation
Review of PG&E Home Energy Reports Initiative Evaluation. CPUC Energy Division Prepared by DNV KEMA, Inc
 Review of PG&E Home Energy Reports Initiative Evaluation CPUC Energy Division Prepared by DNV KEMA, Inc. 5-31-2013 Table of Contents DNV KEMA Energy & Sustainability 1. Introduction... 1-1 2. Background...
Opportunities for Demand Response in the National Electricity Market
 Opportunities for Demand Response in the National Electricity Market Dr David Crossley Managing Director Energy Futures Australia Pty Ltd Embedded Generation and Demand Side Responses Seminar Sydney, 27
National Symposium on Market Transformation
 National Symposium on Market Transformation Minding the Gap: Can Residential EE Programs and ENERGY STAR Keep Pace with the Market? Jan Berman, Sr. Director, PG&E April 22, 2015 Mind the Gap 2 Residential
Memorandum. This memorandum requires Board action. EXECUTIVE SUMMARY
 California Independent System Operator Corporation Memorandum To: ISO Board of Governors From: Keith Casey, Vice President, Market & Infrastructure Development Date: August 29, 2018 Re: Decision on the
Energy Trust of Oregon New Homes Billing Analysis: Comparison of Modeled vs. Actual Energy Usage
 ABSTRACT Energy Trust of Oregon 2009-2011 New Homes Billing : Comparison of Modeled vs. Actual Energy Dan Rubado, Energy Trust of Oregon, Portland, OR This paper describes a utility billing analysis of
75/8. About Market Strategies driving confident business decisions. 1.3 million 6,000 #20. Global Reach. Broad Industry Expertise
 Session Overview Utilities are expected to better engage their customers but customer touch points and offerings have exploded, making the best path forward seem overwhelming. Data to the rescue! - The
2016 COLORADO SMART METER PANEL STUDY. Customer Insights April 2016
 Page 1 of 11 2016 COLORADO SMART METER PANEL STUDY Customer Insights April 2016 CONTENTS Page 2 of 11 Objectives & Methodology Key Findings Detailed Results Favorability Understanding of terms Perception
Impact of AMI on Load Research and Forecasting
 Itron White Paper Energy Forecasting and Load Research Impact of AMI on Load Research and Forecasting J. Stuart McMenamin, Ph.D Managing Director, Itron Forecasting 2008, Itron Inc. All rights reserved.
Working Together to Manage Your Company s Energy Use.
 Energy for What s Ahead SM Working Together to Manage Your Company s Energy Use. Take advantage of one or more of our Demand Response (DR) programs to help lower your energy costs when you actively reduce
NSTAR Smart Grid Pilot Final Technical Report
 DE OE0000292 AMR BASED DYNAMIC PRICING NSTAR Smart Grid Pilot Final Technical Report AMR BASED DYNAMIC PRICING Prepared for: U.S. Department of Energy Technical Contact: Anil Rabari Manager, Communication
Smart Meters Provide Multiple Financial Benefits to Consumers. Lisa Wood Executive Director
 Smart Meters Provide Multiple Financial Benefits to Consumers Lisa Wood Executive Director Presented to UTC TELECOM 2010 Indianapolis, IN May 24, 2010 Smart meters provide multiple financial benefits to
SMUD s Low Income Weatherization & Energy Management Pilot Load Impact Evaluation
 Load Impact Evaluation Promoting residential energy and peak savings for low income customers through enhanced information, education, and smart thermostats December 2014 Load Impact Evaluation PREPARED
ENERGY EFFICIENCY CONSIDERATIONS: GRID MODERNIZATION, TIME VARYING RATES, AND ENERGY AS A SERVICE
 ENERGY EFFICIENCY CONSIDERATIONS: GRID MODERNIZATION, TIME VARYING RATES, AND ENERGY AS A SERVICE January 18, 2017 INTRODUCTION Trends in the electric grid suggest new challenges and opportunities for:
Load Impact Evaluation of California s Statewide Base Interruptible Program
 Load Impact Evaluation of California s Statewide Base Interruptible Program Final Report May 1, 2009 Freeman, Sullivan & Co. 101 Montgomery St., 15th Floor San Francisco, CA 94104 Prepared for: Pacific
A Smart Approach to Analyzing Smart Meter Data
 A Smart Approach to Analyzing Smart Meter Data Ted Helvoigt, Evergreen Economics (Lead Author) Steve Grover, Evergreen Economics John Cornwell, Evergreen Economics Sarah Monohon, Evergreen Economics ABSTRACT
The Greatest Generation: The Greatest Energy Shifters. How Seniors Fare with TOU Rates
 The Greatest Generation: The Greatest Energy Shifters. How Seniors Fare with TOU Rates Jordan Folks, Research Into Action, Portland, OR 36 th PLMA Conference, Cambridge, MA, November 15, 2017 Disclaimer
Deriving economic benefits by successfully utilizing the Internet. Richard Huntley
 Deriving economic benefits by successfully utilizing the Internet. Richard Huntley Deriving Economic Benefits from the Successful Utilization of the Web Who is Nexus Energy Software? Global provider of
Better Understanding Customers: Developing SMB DNA to Improve Customer Interactions and Catalyze Positive Behavior Changes
 Better Understanding Customers: Developing SMB DNA to Improve Customer Interactions and Catalyze Positive Behavior Changes Anne-Lise Laurain, Tingwen Bao, Pawel Zawadzki, Kevin Johnson, Pacific Gas & Electric
More is Better? Analyzing the Relation between Metering Duration and Accuracy of Results for Residential Lighting Evaluations
 More is Better? Analyzing the Relation between Metering Duration and Accuracy of Results for Residential Lighting Evaluations Joel D. Pertzsch, Michaels Energy Inc., La Crosse, WI Ryan M. Kroll, Michaels
AESP Brown Bag - Showcase of Largest Residential Dynamic Pricing Programs Ameren Illinois Power Smart Pricing ComEd Residential Real-Time Pricing
 AESP Brown Bag - Showcase of Largest Residential Dynamic Pricing Programs Ameren Illinois Power Smart Pricing ComEd Residential Real-Time Pricing January 9 th, 2014 Who We Are CNT Energy s mission is to
Smart Thermostats P G & E, S C E, S C G, S D G & E M AY,
 P G & E, S C E, S C G, S D G & E M AY, 2 0 1 5 Presentation Overview Objective: Seeking TF feedback on data analysis approach to estimate EE savings opportunity Measure Description IOU Data Overview IOU
Cutting Peak Demand Two Competing Paths and Their Effectiveness
 Cutting Peak Demand Two Competing Paths and Their Effectiveness Tony Larson, National Grid, Waltham, MA Mona Chandra, National Grid, Waltham, MA Kathleen Ward, Navigant, Boulder, CO Debbie Brannan, Navigant,
THE RIGHT PRICE. Dynamic pricing can provide benefits to customers and utilities alike. BY LISA V. WOOD
 THE RIGHT PRICE Dynamic pricing can provide benefits to customers and utilities alike. BY LISA V. WOOD THE PRICE OF ELECTRICITY IS SUBJECT TO the market forces of supply and demand. However, since electricity
Getting the Bead of Hardship
 Getting the Bead of Hardship Benjamin Messer, Jordan Folks, and Jane Peters, Research Into Action, Portland, OR Alex Dunn, Portland, OR Prapti Gautam, Southern California Edison, Rosemead, CA ABSTRACT
EVALUATION OF ENVIROGRID TECHNOLOGY PERFORMANCE. Final Report August Prepared for: Sacramento Municipal Utility District
 EVALUATION OF ENVIROGRID TECHNOLOGY PERFORMANCE Final Report August 2012 Prepared for: Sacramento Municipal Utility District Prepared by ADM Associates, Inc. 3239 Ramos Circle Sacramento, CA 95827 916-363-8383
Demand Response and Energy Efficiency Programs In the Deregulated Texas Electric Market
 Demand Response and Energy Efficiency Programs In the Deregulated Texas Electric Market Daniel F. (Dan) Martinez AEIC Presentation September 21, 2009 CENTERPOINT ENERGY AGENDA Texas Deregulation Summary
APPENDIX. offering supplemental information useful to practitioners (e.g., utility analysts and
 APPENDIX This self-contained appendix presents our paper s technical details, thereby offering supplemental information useful to practitioners (e.g., utility analysts and regulatory staff) of residential
How Much Do We Know About Savings Attributable to a Program?
 ABSTRACT How Much Do We Know About Savings Attributable to a Program? Stefanie Wayland, Opinion Dynamics, Oakland, CA Olivia Patterson, Opinion Dynamics, Oakland, CA Dr. Katherine Randazzo, Opinion Dynamics,
Evaluation of the Residential Inclining Block Rate F2009-F2012. Revision 2. June Prepared by: BC Hydro Power Smart Evaluation
 Evaluation of the Residential Inclining Block Rate F2009-F2012 Revision 2 June 2014 Prepared by: BC Hydro Power Smart Evaluation Table of Contents Executive Summary... ii 1. Introduction... 1 1.1. Evaluation
IMPACT EVALUATION OF OPOWER SMUD PILOT STUDY
 IMPACT EVALUATION OF OPOWER SMUD PILOT STUDY UPDATE September 24, 2009 FINAL REPORT Submitted to: Ogi Kavazovic OPOWER 1515 N. Courthouse Road, 6 th Floor Arlington, VA 22201 703.778.4544 Ogi.kavazovic@opower.com
California s Self-Generation Incentive Program: What Is the Consumer Response and Is the CAISO System Peak Load Being Impacted?
 California s Self-Generation Incentive Program: What Is the Consumer Response and Is the CAISO System Peak Load Being Impacted? Patrick Lilly, Itron, Inc./RER Alan Fields, Itron, Inc./RER Brenda Gettig,
The Potential for Smart Meters in a National Household Energy Survey
 Further Analysis of the Household Electricity Use Survey The Potential for Smart Meters in a National Household Energy Survey 7 October 2013 Steven Firth and Jason Palmer CAMBRIDGE ARCHITECTURAL RESEARCH
Consumer. Engagement. A Playbook for Utilities. January, 2017
 Consumer Engagement A Playbook for Utilities January, 2017 Introduction The utilities industry is beginning to stratify into two categories. The first category comprises progressive utilities that recognize
ESTIMATES OF THE IMPACT OF THE 1981 DEMAND SUBSCRIPTION SERVICE PROGRAM
 ESTIMATES OF THE IMPACT OF THE 1981 DEMAND SUBSCRIPTION SERVICE PROGRAM Mark S0 Kumm Conservation/wad Management Department Southern california Edison Company The views expressed in this paper are the
Summary of 60-Day Notice: Smart Thermostat Optimization
 Summary of 60-Day Notice: Smart Thermostat Optimization Public Service Company of Colorado ( Public Service or the Company ) posts this 60- Day Notice to add a Smart Thermostat Optimization Pilot to the
Value of Customer Reliability Review Update
 Value of Customer Reliability Review Update The Australian Energy Market Operator (AEMO) was established in 2009 by the Ministerial Council for Energy (MCE), now the Standing Council for Energy and Resources
Customer Targeting to Enhance Energy Efficiency Savings at the Meter
 Customer Targeting to Enhance Energy Efficiency Savings at the Meter Adam Scheer and Sam Borgeson Utility Energy Forum, 2018 Customer Targeting A Primer Energy Efficiency Funding California: $1 Billion
Demand as an Active Actor Day 2, Item 1. Presented by: Flora Flygt XM Medellin, Columbia December 12-13, 2012
 Demand as an Active Actor Day 2, Item 1 Presented by: Flora Flygt XM Medellin, Columbia December 12-13, 2012 1 Outline Introduction Demand Response Continuum Passive Demand Response Active Demand Response
The Competitive Market in Texas and Reliant e-sense
 The Competitive Market in Texas and Reliant e-sense Electric Market After Deregulation Generation Power Purchase Power Delivery Electricity Sales, Customer Service and Billing Reliant and Walmart Strategy
Integrated Hourly Electricity Demand Forecast For Ontario
 Integrated Hourly Electricity Demand Forecast For Ontario Andrzej Zerek The Itron User s s Conference September 2009 Ontario Power Generation, Energy Markets Planning & Analysis 1 ENERGY MARKETS Objective
Dynamic Pricing: Transitioning from Experiments to Full Scale Deployments
 Dynamic Pricing: Transitioning from Experiments to Full Scale Deployments Michigan Retreat on Peak Shaving to Reduce Tasted Energy Sanem Sergici, Ph.D. August 06, 2014 Copyright 2014 The Brattle Group,