Understanding Fluctuations in Market Share Using ARIMA Time-Series Analysis
|
|
|
- Susan Webb
- 6 years ago
- Views:
Transcription

1 Understanding Fluctuations in Market Share Using ARIMA Time-Series Analysis Introduction This case study demonstrates how forecasting analysis can improve our understanding of changes in market share over a period of time. Two supermarket chains Norton's and EdMart dominate the retail grocery market in a medium-sized metropolitan area. Norton's was recently bought out by a large national grocery chain that subsequently introduced its own brand of products, most of which sell at far lower prices than the name brand products offered at EdMart. For several years prior to the buyout, EdMart had maintained about a 5% market share advantage over Norton's, primarily because of superior customer service. During their first two months of ownership, the new parent company of Norton's launched an aggressive campaign advertising their own product line. The result was a rapid and dramatic increase in market share. Was the increase in market share solely at the expense of EdMart's share, or is some of the increase due to losses by the small mom-and-pop groceries that comprise the remainder of the local market? The Data Before we begin the ARIMA market share forecast analysis, we will first examine monthly market share data for Norton's and EdMart. The data consist of the six years preceding the buyout and the two years following the buyout. We will conduct an intervention analysis using an ARIMA (Auto-Regressive, Integrated, Moving-Average) market share forecasting model to analyze the effect of the buyout on market share. (In order to do forecasting, one should have at least 50 time periods to examine. Here we have 96.) Before developing an intervention model, we first examine the market share time series to get a preliminary feel for the effect of the buyout. The following graph of the market share data clearly shows EdMart s 5% advantage during approximately the first six years of monthly data. 1

2 The impact of the buyout is apparent in the sharp decline in EdMart s market share and the sudden rise of Norton's market share occurring at approximately six years. Apart from the shift caused by the buyout, both series appear to have a constant level as well as a constant variance, indicating a stationary series. (If the series had not been stationary, then we would have had to perform a special transformation of the data before proceeding with the actual modeling.) ARIMA Time-series Forecasting The impact of the Norton's buyout on the market share series is called an intervention. The key steps in an intervention analysis are: 2
3 1. Develop a market share model for the series prior to the intervention. 2. Add one or more dummy variables representing the timing of the intervention. 3. Re-estimate the market share model, including the new dummy variables, for the entire series. 4. Interpret the coefficients of the dummy variables as measures of the effect of the intervention. Thus we first develop a market share model for each series prior to the intervention. In this case, the intervention period begins in the 73 rd month of data, when the national chain purchased Norton's and launched the aggressive ad campaign. Choosing a good model involves looking at the series to decide whether a transformation, log or square root, is necessary to stabilize the series and then looking at plots of the autocorrelation function (ACF) and partial autocorrelation function (PACF. The previous graph of the market share data showed that except for a one-time change in level, both series are stationary. So no transformations of the data appear necessary. However, because we expect the effect of the intervention to lag the actual intervention by some amount of time, we need to determine the appropriate lag period. We first restrict the cases (months) to the period prior to the intervention that is, the first 72 cases. Because the earlier graph gave us no reason to assume different underlying processes for the two market share series, we need to examine the autocorrelations and partial autocorrelations for only one say, Norton s. As we can see in the following graphs, the autocorrelation function shows a single significant peak at a lag of 1 month (first graph); and the partial autocorrelation function shows a significant peak at a lag of 1 month accompanied by a tail that becomes prominent at a lag of 16 months (second graph). 3
4 4
5 These patterns indicate a moving-average component of order 1, or an ARIMA(0,0,1) model. Next we need to have a way to account for the change in market share due to the intervention. First we must determine the period during which the market share series showed significant level changes. A plot of the market series before and after the buyout will provide the answer. But in order to gain a clearer picture of the intervention period, we will limit the number of cases examined. We will examine the cases beginning with the 60 th month, which is one year prior to the buyout, and ending at month 74, which marks the end of the aggressive two-month advertising campaign that accompanied the buyout. The following graph makes it clear that both series reach their new levels by month 74. The intervention period is thus the two months of the ad campaign, months 73 and 74. 5

6 Both market share series have a statistically constant level before the intervention, followed by a statistically constant level after the intervention period is over. The intervention simply causes the EdMart series to drop by a fixed value and the Norton s series to increase by a possibly different fixed value. A constant shift in the level of a series can be modeled with a variable that is 0 until some point in the series and 1 thereafter. If the coefficient of the variable is positive, the variable acts to increase the level of the series, and if the coefficient is negative. the variable acts to decrease the level of the series. Such variables are referred to as dummy variables; and this particular type of dummy variable is referred to as a step function because it abruptly steps up from a value of 0 to a value of 1 and then remains at 1. So, qualitatively, the drop in the EdMart series can be modeled by a step function with a negative coefficient, and the rise in the Norton s series can be modeled by a step function with a positive coefficient. The only complication in the present case is that the two series change levels over a two-month period. This requires the use of two step functions, one to model the level change in month 73 and one to model the change in month 74. 6
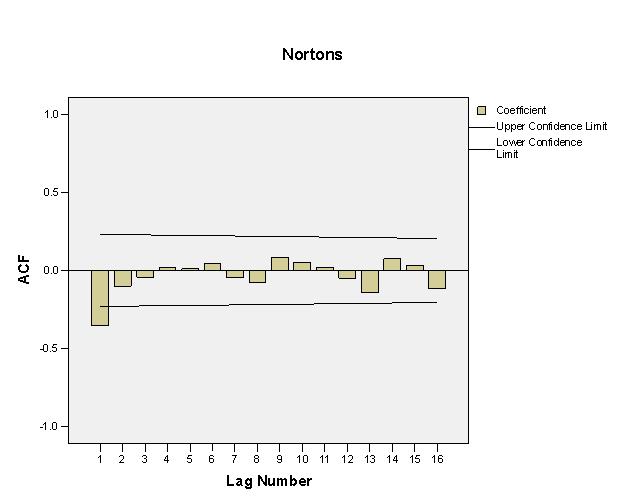
7 So we have determined that the series prior to the intervention follows an ARIMA(0,0,1) model, and we've created two dummy variables to model the intervention. Now we re ready to run the full ARIMA analysis using the two dummy variables as predictors. ARIMA treats these predictors much like predictor variables in regression analysis it estimates the coefficients for them that best fit the data. We'll use the same two dummy predictor variables, step73 and step74, for both the Edmart series and the Norton s series. Market Share Model Diagnostics Before we look at the results of the ARIMA model, we first perform some diagnostics to be sure that our model fits the data well. Among the diagnostics that we examine are the model s residuals, or errors. The four graphs below indicate that for both supermarkets the Autocorrelation Function Errors and Partial Autocorrelation Function Errors are within acceptable limits. This indicates that the model is a good one. (There are other diagnostics that we also perform, but we will not go into them here.) 7
8 8
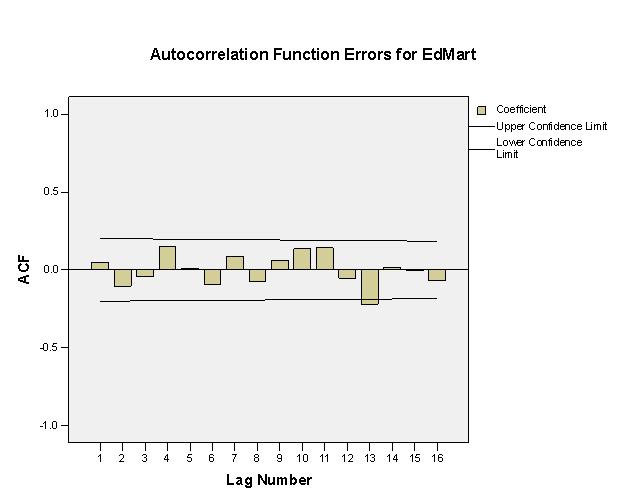
9 9
10 Market Share Model Results Next we examine the results of the actual model. We expect positive coefficients for both predictor variables in the Norton's model and negative coefficients in the EdMart model. The sum of the Norton's coefficients will represent the total increase in Norton's market share over the two-month period, and the sum of the EdMart coefficients will represent the total decrease in the EdMart market share during that period. Here is the table of coefficients for Norton s: 10
11 Estimates Std Error t Approx Sig Non-Seasonal Lags MA Regression Coefficients step step Constant Melard's algorithm was used for estimation. From this table we can see that the coefficient for the dummy variable step73 is This means that the Norton's market share increased by about 1.6% in month 73. Similarly, the coefficient for step74 indicates an additional increase of about 1.8% in month 74, on top of the existing level. So the Norton's market share increased by about 3.4% during the two-month ad campaign and then remained at that new higher level. Next we examine the parameter estimates table for the EdMart model: Estimates Std Error t Approx Sig Non-Seasonal Lags MA Regression Coefficients step step Constant Melard's algorithm was used for estimation. The coefficient for the dummy variable step73 is This means that the EdMart market share fell by about 1.7% in month 73. Likewise, the coefficient for step74 indicates an additional drop of about 0.7% in month 74. In all, then, EdMart market share dropped by about 2.4% during the two month ad campaign. We therefore conclude that about 70% of Norton's gain in market share came at the expense of EdMart; the remaining 30% is due to losses felt by the small mom-and-pop groceries. 11
12 Conclusions Using an ARIMA forecasting model, we have demonstrated that, knowing the timing of a competitive advertising campaign and coordinated pricing actions, we can use time-series analysis to clarify and quantify the causes of changes in a retailer s market share over time. The foregoing case study is an edited version of one originally furnished by SPSS, and is used with their permission. Copyright 2010, SmartDrill. All rights reserved. 12
Pedro J. Saavedra, Paula Weir and Michael Errecart Pedro J. Saavedra, Macro International, 8630 Fenton St., Silver Spring, MD 20910
 IMPUTING PRICE AS OPPOSED TO REVENUE IN THE EIA-782 PETROLEUM SURVEY Pedro J. Saavedra, Paula Weir and Michael Errecart Pedro J. Saavedra, Macro International, 8630 Fenton St., Silver Spring, MD 20910
Univariate Time Series Modeling for Traffic Volume Estimation
 Urban Mobility-Challenges, Solutions and Prospects at IIT Madras BITS Pilani Pilani Campus Univariate Time Series Modeling for Traffic Volume Estimation Presented by: KARTIKEYA JHA & SHRINIWAS S. ARKATKAR
FOLLOW-UP NOTE ON MARKET STATE MODELS
 FOLLOW-UP NOTE ON MARKET STATE MODELS In an earlier note I outlined some of the available techniques used for modeling market states. The following is an illustration of how these techniques can be applied
Revision confidence limits for recent data on trend levels, trend growth rates and seasonally adjusted levels
 W O R K I N G P A P E R S A N D S T U D I E S ISSN 1725-4825 Revision confidence limits for recent data on trend levels, trend growth rates and seasonally adjusted levels Conference on seasonality, seasonal
Predicting the present with Google Trends. -Hyunyoung Choi -Hal Varian
 Predicting the present with Google Trends -Hyunyoung Choi -Hal Varian Outline Problem Statement Goal Methodology Analysis and Forecasting Evaluation Applications and Examples Summary and Future work Problem
Assessing the effects of recent events on Chipotle sales revenue
 Assessing the effects of recent events on Chipotle sales revenue 1Dr. Simon Sheather SAS Day 2016 2 In February 2005, I moved from Head of the Department of Statistics: March 1, 2005 until February 28,
ARIMA LAB ECONOMIC TIME SERIES MODELING FORECAST Swedish Private Consumption version 1.1
 Bo Sjo 2011-11-10 (Updated) ARIMA LAB ECONOMIC TIME SERIES MODELING FORECAST Swedish Private Consumption version 1.1 Send in a written report to bosjo@liu.se before Wednesday November 25, 2012. 1 1. Introduction
Telecommunications Churn Analysis Using Cox Regression
 Telecommunications Churn Analysis Using Cox Regression Introduction As part of its efforts to increase customer loyalty and reduce churn, a telecommunications company is interested in modeling the "time
FORECASTING THE GROWTH OF IMPORTS IN KENYA USING ECONOMETRIC MODELS
 FORECASTING THE GROWTH OF IMPORTS IN KENYA USING ECONOMETRIC MODELS Eric Ondimu Monayo, Administrative Assistant, Kisii University, Kitale Campus Alex K. Matiy, Postgraduate Student, Moi University Edwin
presents: your guide to forecasting
 presents: your guide to forecasting what can forecasting do for me? Having a robust forecast can be an invaluable tool in managing your business finances. If done thoroughly it can show where deficits
Econometric Modeling and Forecasting of Food Exports in Albania
 Econometric Modeling and Forecasting of Food Exports in Albania Prof. Assoc. Dr. Alma Braimllari (Spaho) Oltiana Toshkollari University of Tirana, Albania, alma. spaho@unitir. edu. al, spahoa@yahoo. com
Journal of American Science 2015;11(3)
") Journal of American Science ;() http://www.jofamericanscience.org Econometric Study to Predict the Meat Gap in Egypt Using ARIMA (Box-Jenkins) Method Abo Ragab, S. Al-Said Economic Department, Desert Research
Journal of American Science ;() http://www.jofamericanscience.org Econometric Study to Predict the Meat Gap in Egypt Using ARIMA (Box-Jenkins) Method Abo Ragab, S. Al-Said Economic Department, Desert Research
IBM SPSS Forecasting 19
 IBM SPSS Forecasting 19 Note: Before using this information and the product it supports, read the general information under Notices on p. 108. This document contains proprietary information of SPSS Inc,
Yt i = " 1 + " 2 D 2 + " 3 D 3 + " 4 D 4 + $ 1 t 1. + $ 2 (D 2 t 2 ) + $ 3 (D 3 t 3 ) + $ 4 (D 4 t 4 ) + :t i
 + $ 3 (D 3 t 3 ) + $ 4 (D 4 t 4 ) + :t i") Real Price Trends and Seasonal Behavior of Louisiana Quarterly Pine Sawtimber Stumpage Prices: Implications for Maximizing Return on Forestry Investment by Donald L. Deckard Abstract This study identifies
Real Price Trends and Seasonal Behavior of Louisiana Quarterly Pine Sawtimber Stumpage Prices: Implications for Maximizing Return on Forestry Investment by Donald L. Deckard Abstract This study identifies
George Box and Gwilyni Jenkins
 A GUIDE TO BOX-JENKINS MODELING By George C. S. Wang Describes in simple language how to use Box-Jenkins models for forecasting... the key requirement of Box-Jenkins modeling is that time series is either
Modelling and Forecasting the Balance of Trade in Ethiopia
 American Journal of Theoretical and Applied Statistics 2015; 4(1-1): 19-23 Published online March 18, 2015 (http://www.sciencepublishinggroup.com/j/ajtas) doi: 10.11648/j.ajtas.s.2015040101.14 ISSN: 2326-8999
Volume-5, Issue-1, June-2018 ISSN No:
 FORECASTING EXCHANGE RATE WITH AR(1) AND MA(1) Armi Bakar Lecture at Universitas Indraprasta PGRI, Jakarta, indonesia Abstract In this study has a major problem with the B & J methodology, the problem
TPD2 and standardised tobacco packaging What impacts have they had so far?
 TPD2 and standardised tobacco packaging What impacts have they had so far? December 2018-1 - Europe Economics is registered in England No. 3477100. Registered offices at Chancery House, 53-64 Chancery
TPD2 and standardised tobacco packaging What impacts have they had so far?
 TPD2 and standardised tobacco packaging What impacts have they had so far? November 2017-1 - Europe Economics is registered in England No. 3477100. Registered offices at Chancery House, 53-64 Chancery
Soybean Price Forecasting in Indian Commodity Market: An Econometric Model
 Volume 3, Issue 1 June 2014 58 RESEARCH ARTICLE ISSN: 2278-5213 Soybean Price Forecasting in Indian Commodity Market: An Econometric Model Rajesh Panda Symbiosis Institute of Business Management, Bengaluru
2. What effect would each of the following have on the value of the firm?
 PART A INSTRUCTIONS: ANSWER ALL THREE (3) QUESTIONS. Question 1 1. Discuss the difference between profit maximisation and shareholder wealth maximisation. Which of these is a more comprehensive statement
Forecasting Major Food Crops Production in Khyber Pakhtunkhwa, Pakistan
 Journal of Applied and Advanced Research 2017, 2(1): 21 30 doi.: 10.21839/jaar.2017.v2i1.40 http://www.phoenixpub.org/journals/index.php/jaar ISSN 2519-9412 / 2017 Phoenix Research Publishers Research
Problem 5: Forecasting the demand for bread. V UCM Modelling Week Master in Mathematical Engineering UCM
 V UCM Modelling Week Master in Mathematical Engineering UCM 0. Summary 1. Introduction 2. Descriptive analysis 3. Classification 4. Data imputation for missing and censured values 5. Preliminary model
SPSS 14: quick guide
 SPSS 14: quick guide Edition 2, November 2007 If you would like this document in an alternative format please ask staff for help. On request we can provide documents with a different size and style of
Modelling buyer behaviour - 2 Rate-frequency models
 Publishing Date: May 1993. 1993. All rights reserved. Copyright rests with the author. No part of this article may be reproduced without written permission from the author. Modelling buyer behaviour -
DEMAND FORECASTING FOR FERTILIZERS A TACTICAL PLANNING FRAMEWORK FOR INDUSTRIAL USE
 Demand Forecasting for Fertilizers A Tactical Planning Framework for Industrial Use Proceedings of AIPA 2012, INDIA 123 DEMAND FORECASTING FOR FERTILIZERS A TACTICAL PLANNING FRAMEWORK FOR INDUSTRIAL USE
PROVIDING OPTIMAL PRICING STRATEGY FOR BUYERS ENERGY PACKAGES IN IRAN POWER EXCHANGE
 PROVIDING OPTIMAL PRICING STRATEGY FOR BUYERS ENERGY PACKAGES IN IRAN POWER EXCHANGE Mohammad Mohammadinia (1) Maryam Borzouie (2) Hassan Shakeri (1) Seyed Ali Barband (1) (1)Tehran Regional Electricity
Choosing the Right Type of Forecasting Model: Introduction Statistics, Econometrics, and Forecasting Concept of Forecast Accuracy: Compared to What?
 Choosing the Right Type of Forecasting Model: Statistics, Econometrics, and Forecasting Concept of Forecast Accuracy: Compared to What? Structural Shifts in Parameters Model Misspecification Missing, Smoothed,
In Chapter 3, we discussed the two broad classes of quantitative. Quantitative Forecasting Methods Using Time Series Data CHAPTER 5
 CHAPTER 5 Quantitative Forecasting Methods Using Time Series Data In Chapter 3, we discussed the two broad classes of quantitative methods, time series methods and causal methods. Time series methods are
MODELING OF EXPORTS IN ALBANIA
 MODELING OF EXPORTS IN ALBANIA Prof. Assoc. Dr. Alma Braimllari (Spaho) Applied Mathematics Department, Faculty of Natural Sciences, University of Tirana, (Albania) ABSTRACT Exports of goods represent
Time Series Modeling with Genetic Programming Relative to ARIMA Models
 Time Series Modeling with Genetic Programming Relative to ARIMA Models Miroslav Kľúčik 1, Jana Juriová 2, Marian Kľúčik 3 1 INFOSTAT, Slovakia, klucik@infostat.sk 2 INFOSTAT, Slovakia, juriova@infostat.sk
The SPSS Sample Problem To demonstrate these concepts, we will work the sample problem for logistic regression in SPSS Professional Statistics 7.5, pa
 The SPSS Sample Problem To demonstrate these concepts, we will work the sample problem for logistic regression in SPSS Professional Statistics 7.5, pages 37-64. The description of the problem can be found
Case Studies. M.Com. Semester I
 Case Studies M.Com. Semester I Economics For Business Decisions Revised Syllabus University of Mumbai w.e.f. ac. Year 2016-17 1 Cases for class room discussion Module I Demand Analysis Dr. Parvathi Venkatesh
Short-Term Load Forecasting Under Dynamic Pricing
 Short-Term Load Forecasting Under Dynamic Pricing Yu Xian Lim, Jonah Tang, De Wei Koh Abstract Short-term load forecasting of electrical load demand has become essential for power planning and operation,
COMPUTER SECTION. AUTOBOX: A Review
 COMPUTER SECTION AUTOBOX: A Review Ronald Bewley* AUTO BOX can be run either in batch mode or as a menu-driven program and has, as its central feature, a fully automatic procedure for identifying and estimating
DETECTING AND MEASURING SHIFTS IN THE DEMAND FOR DIRECT MAIL
 Chapter 3 DETECTING AND MEASURING SHIFTS IN THE DEMAND FOR DIRECT MAIL 3.1. Introduction This chapter evaluates the forecast accuracy of a structural econometric demand model for direct mail in Canada.
Selection of a Forecasting Technique for Beverage Production: A Case Study
 World Journal of Social Sciences Vol. 6. No. 3. September 2016. Pp. 148 159 Selection of a Forecasting Technique for Beverage Production: A Case Study Sonia Akhter**, Md. Asifur Rahman*, Md. Rayhan Parvez
PLANNING AND CONTROL FOR A WARRANTY SERVICE FACILITY
 Proceedings of the 2 Winter Simulation Conference M. E. Kuhl, N. M. Steiger, F. B. Armstrong, and J. A. Joines, eds. PLANNING AND CONTROL FOR A WARRANTY SERVICE FACILITY Amir Messih Eaton Corporation Power
The retailer is the final frontier of
 Demand planning and Forecasting with Pos Data: A Case Study By Fred Andres The retailer is the final frontier of supply chain planning. So, it is important for manufacturers to have a serious look at what
Forecasting fruit demand: Intelligent Procurement
 2012 Forecasting fruit demand: Intelligent Procurement FCAS Final Project Report Predict fruit sales for a 2 day horizon to efficiently manage procurement logistics. Dinesh Ganti(61310071) Rachna Lalwani(61310845),
Time Series Analysis in the Social Sciences
 one Time Series Analysis in the Social Sciences in the social sciences, data are usually collected across space, that is, across countries, cities, and so on. Sometimes, however, data are collected across
Silky Silk & Cottony Cotton Corp
 Silky Silk & Cottony Cotton Corp Business Optimization Exercise 2/9/2012 Data_Miners_Anonymous Naveen Kumar 61210144 Akshay Sethi 61210413 Karthik Vemparala 61210505 Sruthi Yalaka 61210416 Contents Executive
ARIMA INTERVENTION ANALYSIS OF NIGERIAN MONTHLY CRUDE OIL PRICES
 ARIMA INTERVENTION ANALYSIS OF NIGERIAN MONTHLY CRUDE OIL PRICES EBERECHI HUMPHREY AMADI AND ETTE HARRISON ETUK ABSTRACT It has been observed that between January 2011 to June 2014 the price of crude oil
Short-Term Forecasting with ARIMA Models
 9 Short-Term Forecasting with ARIMA Models All models are wrong, some are useful GEORGE E. P. BOX (1919 2013) In this chapter, we introduce a class of techniques, called ARIMA (for Auto-Regressive Integrated
PREDICTING THE EVOLUTION OF BET INDEX, USING AN ARIMA MODEL. KEYWORDS: ARIMA, BET, prediction, moving average, autoregressive
 PREDICTING THE EVOLUTION OF BET INDEX, USING AN ARIMA MODEL Florin Dan Pieleanu 1* ABSTRACT Trying to predict the future price of certain stocks, securities or indexes is quite a common goal, being motivated
intelligent world. GIV
 Huawei provides industries aiming to development, as well that will enable the ecosystem to truly intelligent world. GIV 2025 the direction for ramp up the pace of as the foundations diverse ICT industry
Price transmission along the food supply chain
 Price transmission along the food supply chain Table of Contents 1. Introduction... 2 2. General formulation of models... 3 2.1 Model 1: Price transmission along the food supply chain... 4 2.2 Model 2:
Conference Proceedings Paper Prediction of Annual Inflow to Karkheh Dam Reservoir using Time Series Models
 Conference Proceedings Paper Prediction of Annual Inflow to Karkheh Dam Reservoir using Time Series Models Karim Hamidi Machekposhti 1, Hossein Sedghi 2, *, Abdolrasoul Telvari 3,Hossein Babazadeh Published:
Technical note on seasonal adjustment for Gross domestic product (Agriculture)
") Technical note on seasonal adjustment for Gross domestic product (Agriculture) July 1, 2013 Contents 1 GDP (Agriculture) 2 1.1 Seasonal Dummy Model............................... 2 1.2 Slidingspans Diagnostic...............................
Technical note on seasonal adjustment for Gross domestic product (Agriculture) July 1, 2013 Contents 1 GDP (Agriculture) 2 1.1 Seasonal Dummy Model............................... 2 1.2 Slidingspans Diagnostic...............................
SAMPLE. MCQ Test DECISION-MAKING TO IMPROVE MARKETING PERFORMANCE. AQA A Level Business Year 1 (AS) Multiple Choice Question Test Bank
 Multiple Choice Question Test Bank") AQA A Level Business Year 1 (AS) Multiple Choice Question Test Bank SAMPLE 3.3 DECISION-MAKING TO IMPROVE MARKETING PERFORMANCE MCQ Test 1 This MCQ test contains 15 questions covering the specification
AQA A Level Business Year 1 (AS) Multiple Choice Question Test Bank SAMPLE 3.3 DECISION-MAKING TO IMPROVE MARKETING PERFORMANCE MCQ Test 1 This MCQ test contains 15 questions covering the specification
An Examination and Interpretation of Tie Market Data. By Fred Norrell - Economist. Presented at the. RTA convention in Asheville, NC.
 An Examination and Interpretation of Tie Market Data By Fred Norrell - Economist Presented at the RTA convention in Asheville, NC November, 2000 I. Production, inventory and estimated purchases II. III.
Who Are My Best Customers?
 Technical report Who Are My Best Customers? Using SPSS to get greater value from your customer database Table of contents Introduction..............................................................2 Exploring
Electricity consumption, Peak load and GDP in Saudi Arabia: A time series analysis
 22nd International Congress on Modelling and Simulation, Hobart, Tasmania, Australia, 3 to 8 December 2017 mssanz.org.au/modsim2017 Electricity consumption, Peak load and GDP in Saudi Arabia: A time series
Regression Analysis I & II
 Data for this session is available in Data Regression I & II Regression Analysis I & II Quantitative Methods for Business Skander Esseghaier 1 In this session, you will learn: How to read and interpret
Quantification of Harm -advanced techniques- Mihail Busu, PhD Romanian Competition Council
 Quantification of Harm -advanced techniques- Mihail Busu, PhD Romanian Competition Council mihail.busu@competition.ro Summary: I. Comparison Methods 1. Interpolation Method 2. Seasonal Interpolation Method
Performance-based Wage System and Motivation to Work
 Performance-based Wage System and Motivation to Work Fumio Ohtake, Institute of Social and Economic Research, Osaka University Koji Karato, Faculty of Economics, Toyama University Abstract This paper presents
INSIGHTS. Demand Planner for Microsoft Dynamics. Product Overview. Date: November,
 INSIGHTS Demand Planner for Microsoft Dynamics Product Overview Date: November, 2007 www.microsoft.com/dynamics Contents Demand Planning for Business... 1 Product Overview... 3 Multi-dimensional Data Visibility...
Bitcoin Price Forecasting using Web Search and Social Media Data
 Paper 3601-2018 Bitcoin Price Forecasting using Web Search and Social Media Data Rishanki Jain, Rosie Nguyen, Linyi Tang, Travis Miller, Advisor: Dr. Venu Gopal Lolla ABSTRACT Oklahoma State University
Application of ARIMA Model in the Prediction of the Gross Domestic Product Bing Yang1, a*, Chenggang Li1, 2, b, Min Li1, c, Kang Pan1, d, Di Wang1, e
 6th International Conference on Mechatronics, Computer and Education Informationization (MCEI 2016) Application of ARIMA Model in the Prediction of the Gross Domestic Product Bing Yang1, a*, Chenggang
Alternative Seasonality Detectors Using SAS /ETS Procedures Joseph Earley, Loyola Marymount University, Los Angeles
 Alternative Seasonality Detectors Using SAS /ETS Procedures Joseph Earley, Loyola Marymount University, Los Angeles ABSTRACT Estimating seasonal indices is an important aspect of time series analysis.
General notice: Other product names mentioned herein are used for identification purposes only and may be trademarks of their respective companies.
 i SPSS Trends 16.0 For more information about SPSS software products, please visit our Web site at http://www.spss.com or contact SPSS Inc. 233 South Wacker Drive, 11th Floor Chicago, IL 60606-6412 Tel:
STAT 5603 Data mining I. Group Research Project. Canadian Industrial Production
 STAT 5603 Data mining I Group Research Project Canadian Industrial Production Term: Winter 2018 Professor: Shirley Mills Feng Tai (Regression) Wei Zheng (Holt-Winters & SARIMA) Yinzhou Wang (Holt-Winters
Week 1 Business Forecasting
 Week 1 Business Forecasting Forecasting is an attempt to foresee the future by examining the past, present and trends Forecasting involves the prediction of future events or future outcomes of key variables.
Statistics and Data Analysis
 Paper 264-25 SAS Programs to Get the Most from X-12-ARIMA's Modeling and Seasonal Adjustment Diagnostics Catherine C. Hood, U.S. Census Bureau, Washington, DC ABSTRACT SAS 's PROC X11 is based on the Census
Wholes de Regular U nlea=ted Gcs dine Prices ~ ~ I I "1 t ~ ~ "" ~.N'N, i-., s ~ ~ s IS ~ ~ "
 FORECASTING PETROLEUM PRODUCT PRICES Theresa Hallquist, Nancy Hassett, Paula Weir, Energy Information Administration Theresa Hallquist, EIA, 1000 Independence Avenue SW, Mailstop: EI-431, Washington, DC,
OVERVIEW. 5. The marginal cost is hook shaped. The shape is due to the law of diminishing returns.
 10 COST OVERVIEW 1. Total fixed cost is the cost which does not vary with output. Total variable cost changes as output changes. Total cost is the sum of total fixed cost and total variable cost. 2. Explicit
Operational Logistics Management (OLM612S)
") Ester Kalipi (M.LSCM.; B. Hons Logistics; B-tech. BA.; Dip. BA.; Cert. BA.) Operational Logistics Management (OLM612S) Unit 2: Logistics Planning 21 February 2018 Table of contents Unit Objectives The
Ester Kalipi (M.LSCM.; B. Hons Logistics; B-tech. BA.; Dip. BA.; Cert. BA.) Operational Logistics Management (OLM612S) Unit 2: Logistics Planning 21 February 2018 Table of contents Unit Objectives The
Applied Business (JAN10BS0301) General Certificate of Education Advanced Subsidiary Examination January Financial Planning and Monitoring
 General Certificate of Education Advanced Subsidiary Examination January Financial Planning and Monitoring") Centre Number Candidate Number For Examiner s Use Surname Other Names Candidate Signature Examiner s Initials Applied Business Unit 3 General Certificate of Education Advanced Subsidiary Examination January
Centre Number Candidate Number For Examiner s Use Surname Other Names Candidate Signature Examiner s Initials Applied Business Unit 3 General Certificate of Education Advanced Subsidiary Examination January
Code Compulsory Module Credits Continuous Assignment
 CURRICULUM AND SCHEME OF EVALUATION Compulsory Modules Evaluation (%) Code Compulsory Module Credits Continuous Assignment Final Exam MA 5210 Probability and Statistics 3 40±10 60 10 MA 5202 Statistical
Pine Beetle Infestation in the Black Hills. Grant Foster
 Pine Beetle Infestation in the Black Hills Grant Foster March 1, 2012 Pine Beetle Infestation in the Black Hills Grant Foster 1. Introduction At the request of Friends of the Norbeck, I have investigated
Getting Started with OptQuest
 Getting Started with OptQuest What OptQuest does Futura Apartments model example Portfolio Allocation model example Defining decision variables in Crystal Ball Running OptQuest Specifying decision variable
After completion of this unit you will be able to: Define data analytic and explain why it is important Outline the data analytic tools and
 After completion of this unit you will be able to: Define data analytic and explain why it is important Outline the data analytic tools and techniques and explain them Now the difference between descriptive
Review of Risk Free Rate Calculation
 Review of Risk Free Rate Calculation August 2013 Project: ECREGA/10 Review of Risk Free Calculation August 2013 Client: Economic Regulation Authority Project: ECREGA/10 Consultants: Dr Alethea Rea Dr Kathy
GENETIC DRIFT INTRODUCTION. Objectives
 2 GENETIC DRIFT Objectives Set up a spreadsheet model of genetic drift. Determine the likelihood of allele fixation in a population of 0 individuals. Evaluate how initial allele frequencies in a population
Application of Artificial Neural Networks for the Prediction of Water Quality Variables in the Nile Delta
 Journal of Water Resource and Protection, 212, 4, 388-394 http://dx.doi.org/1.4236/jwarp.212.4644 Published Online June 212 (http://www.scirp.org/journal/jwarp) Application of Artificial Neural Networks
ESTIMATES OF THE INCREASE IN MILK PRODUCTION DUE TO THE INTRODUCTION OF MAIZE SILAGE TO A DAIRY FARM IN KWAZULU-NATAL: A TIME SERIES APPROACH
 ESTIMATES OF THE INCREASE IN MILK PRODUCTION DUE TO THE INTRODUCTION OF MAIZE SILAGE TO A DAIRY FARM IN KWAZULU-NATAL: A TIME SERIES APPROACH TS Abstract A method involving time series modelling is provided
A Comparative Study on Rickshaw Fare and Rickshaw Pullers Income between. Trishal and Mymensingh Municipality
 A Comparative Study on Rickshaw Fare and Rickshaw Pullers Income between Trishal and Mymensingh Municipality Md. Altap Hossen Assistant Secretary (Planning Research), The Federation of Bangladesh Chambers
Consumer Insight Panel
 Consumer Insight Panel Welcome to the Motors.co.uk Consumer Insight Panel, December 2018 Understanding customer wants and needs in today s fast-changing and competitive landscape is vital for automotive
FOR MORE PAPERS LOGON TO
 MKT501 - Marketing Management Question No: 1 ( Marks: 1 ) - Please choose one The marketing plan is one of the most important outputs of: Business plan Marketing process Production process Selling plan
Comm Advertising Research Perceptual Mapping
 Comm 560 - Advertising Research Perceptual Mapping Perceptual mapping has been used to satisfy marketing and advertising information needs related to product positioning, 1 competitive market structure,
Nord Pool data overview
 Nord Pool data overview Contents Prices, consumption, production, flow, price spikes. Prices and price log-returns.............................. Consumption, production and flow.........................
Measuring long-term effects in marketing P.M Cain
 Measuring long-term effects in marketing P.M Cain Conventional marketing mix models are typically used to measure short-term marketing ROI and guide optimal budget allocation. However, this is only part
Sample Report Market Sensitivity 30 Year, Fixed, Conforming Mortgages
 Sample Report Market Sensitivity 30 Year, Fixed, Conforming Mortgages DATA is for informational purposes and is not specific to any bank 2010 Heitman Analytics 1 Executive Summary Determine the relationship
Business Analytics Using Forecasting (Fall 2016) Final Report
 Final Report") Business Analytics Using Forecasting (Fall 2016) Final Report Cultivating talents for actual needs : Forecasting numbers of patients as reference for medical profession enrollment Team 3 Yu-Chu Shih Tzu-Han
Business Analytics Using Forecasting (Fall 2016) Final Report Cultivating talents for actual needs : Forecasting numbers of patients as reference for medical profession enrollment Team 3 Yu-Chu Shih Tzu-Han
Spreadsheets in Education (ejsie)
") Spreadsheets in Education (ejsie) Volume 2, Issue 2 2005 Article 5 Forecasting with Excel: Suggestions for Managers Scott Nadler John F. Kros East Carolina University, nadlers@mail.ecu.edu East Carolina
Spreadsheets in Education (ejsie) Volume 2, Issue 2 2005 Article 5 Forecasting with Excel: Suggestions for Managers Scott Nadler John F. Kros East Carolina University, nadlers@mail.ecu.edu East Carolina
Financial Management: Sales and Marketing
 Contact Us Financial Management: Sales and Marketing There is a fee associated with participation in APQC's Open Standards Research. If you have any questions about the fee, please contact the APQC helpdesk
A Bid for Every Auction. Implementing and Improving AdWords Automated Bidding
 A Bid for Every Auction Implementing and Improving AdWords Automated Bidding Ten Automated Bidding Takeaways The Advantages of Auction-time Bidding 1 Bid to the user s context, as close to auction-time
Consumer responses: how quick are they?
 Agenda Advancing economics in business Consumer responses: how quick are they? Ignoring the potential delayed reactions of consumers when thinking about investment, pricing, or competition cases, or when
Sugarcane and cotton are the two major cash crops. Research Article
 Research Article Forecasting Production and Yield of Sugarcane and Cotton Crops of Pakistan for 2013-2030 Sajid Ali 1, Nouman Badar 1, Hina Fatima 2 1 Social Sciences Division, Pakistan Agricultural Research
P2 Performance Management
 DO NOT OPEN THIS QUESTION PAPER UNTIL YOU ARE TOLD TO DO SO. Performance Pillar P2 Performance Management 21 May 2014 Wednesday Afternoon Session Instructions to candidates You are allowed three hours
Technical note on seasonal adjustment for Non oil exports
 Technical note on seasonal adjustment for Non oil exports July 1, 2013 Contents 1 Non oil exports 2 1.1 Additive verus multiplicative seasonality...................... 2 2 Steps in the seasonal adjustment
CP Solutions Overview Strategic Trade & Marketing Planning Overview
 Demand Better Agenda CP Solutions Overview Strategic Trade & Marketing Planning Overview STP Annual Plan creation and Reporting Results List Price/Base Price and Distribution change initiatives, importing
Using AI to Make Predictions on Stock Market
 Using AI to Make Predictions on Stock Market Alice Zheng Stanford University Stanford, CA 94305 alicezhy@stanford.edu Jack Jin Stanford University Stanford, CA 94305 jackjin@stanford.edu 1 Introduction
An Assessment of the ISM Manufacturing Price Index for Inflation Forecasting
 ECONOMIC COMMENTARY Number 2018-05 May 24, 2018 An Assessment of the ISM Manufacturing Price Index for Inflation Forecasting Mark Bognanni and Tristan Young* The Institute for Supply Management produces
Market and Information Economics
 Market and Information Economics Preliminary Examination Department of Agricultural Economics Texas A&M University January 2017 Instructions: This examination consists of six questions. You must answer
Masters in Business Statistics (MBS) /2015. Department of Mathematics Faculty of Engineering University of Moratuwa Moratuwa. Web:
 /2015. Department of Mathematics Faculty of Engineering University of Moratuwa Moratuwa. Web:") Masters in Business Statistics (MBS) - 2014/2015 Department of Mathematics Faculty of Engineering University of Moratuwa Moratuwa Web: www.mrt.ac.lk Course Coordinator: Prof. T S G Peiris Prof. in Applied
Masters in Business Statistics (MBS) - 2014/2015 Department of Mathematics Faculty of Engineering University of Moratuwa Moratuwa Web: www.mrt.ac.lk Course Coordinator: Prof. T S G Peiris Prof. in Applied
Forecasting Campaign Sales Using Artificial Neural Networks. Joel Engström June 22, 2016
 Forecasting Campaign Sales Using Artificial Neural Networks Joel Engström June 22, 2016 1 Abstract This thesis will investigate the characteristics and possibilities of implementing a forecasting model
Evaluating Advertising Return on Investment. Quantifying the return on investment in advertising is important for several reasons:
 pty ltd acn 094 521 614 Evaluating Advertising Return on Investment Charlie Nelson October 2003 Introduction Quantifying the return on investment in advertising is important for several reasons: Determining
i. How do you measure the value of a firm? What is the likely impact of further increases in global oil prices on a firm's value? Explain.
 PART A INSTRUCTIONS: 1. THERE ARE FOUR (4) QUESTIONS IN THIS PART. 2. ANSWER ALL QUESTIONS. Question 1 a. Given the following news caption: KUALA LUMPUR, June 30, Wednesday - Prime Minister Abdullah Ahmad