EVALUATION OF THE USE OF RECLAIMED ASPHALT PAVEMENT IN STONE MATRIX ASPHALT MIXTURES
|
|
|
- Jerome Charles
- 5 years ago
- Views:
Transcription
1 EVALUATION OF THE USE OF RECLAIMED ASPHALT PAVEMENT IN STONE MATRIX ASPHALT MIXTURES Except where referenced is made to the work of others, the work described in this thesis is my own or was done in collaboration with my advisory committee. This thesis does not include proprietary or classified information. Adriana Vargas-Nordcbeck Certificate of Approval: David Timm Assistant Professor Civil Engineering Elton Ray Brown, Chair Director National Center for Asphalt Technology Randy West Assistant Director National Center for Asphalt Technology George T. Flowers Interim Dean Graduate School
2 EVALUATION OF THE USE OF RECLAIMED ASPHALT PAVEMENT IN STONE MATRIX ASPHALT MIXTURES Adriana Vargas-Nordcbeck A Thesis Submitted to the Graduate Faculty of Auburn University in Partial Fulfillment of the Requirements for the Degree of Master of Science Auburn University December 17, 2007
3 EVALUATION OF THE USE OF RECLAIMED ASPHALT PAVEMENT IN STONE MATRIX ASPHALT MIXTURES Adriana Vargas-Nordcbeck Permission is granted to Auburn University to make copies of this thesis at its discretion, upon request of individuals or institutions and at their expense. The author reserves all publication rights. Signature of Author Date of Graduation iii
4 VITA Adriana Vargas-Nordcbeck, daughter of Mario Vargas and Shirley Nordcbeck, was born November 26, 1977 in San Jose, Costa Rica. She graduated from the University of Costa Rica with a Bachelor of Science degree in Civil Engineering in August, She also attended the State University at Distance in San Jose, Costa Rica, and graduated with a Masters Degree in Business Administration in July, She began her studies as a graduate student at Auburn University in September, She married Fabricio Leiva- Villacorta on May 19, iv
5 THESIS ABSTRACT EVALUATION OF THE USE OF RECLAIMED ASPHALT PAVEMENT IN STONE MATRIX ASPHALT MIXTURES Adriana Vargas-Nordcbeck Master of Science, December 17, 2007 (MBA, UNED-Costa Rica, 2005) (B.S., University of Costa Rica, 2003) 171 Typed Pages Directed by E. Ray Brown Mixtures that contain reclaimed asphalt pavement (RAP) can typically perform as well or better than conventional HMA mixes. However, use of RAP has generally not been extended to stone matrix asphalt (SMA) production. This study evaluated the effect of RAP on combined aggregate properties, asphalt binder properties, and overall performance of SMA mixtures. The effect of type and size of RAP, as well as aggregate source on overall mix performance was also evaluated. Four types of RAP were combined at four levels (0%, 10%, 20% and 30%) with four aggregate sources. One source of virgin asphalt cement (PG76-22) was used in this study. v
6 Testing was performed to evaluate LA abrasion and flat and elongated particle content of the virgin and recycled aggregate blends. The effect of RAP addition on the rheological properties and performance grades of the combined binder blends was also evaluated. Finally, testing was performed to determine potential binder effect on resistance to moisture susceptibility, resistance to rutting, thermal cracking potential and fatigue life of the recycled mixtures. Results showed that only fatigue life of the mixes decreased significantly with the addition of RAP, but damage can be minimized by limiting the use of recycled SMA mixes to the top layers of the pavement and ensuring a good bond with the underlying layer. Overall, up to 20% RAP could be used without significantly affecting the performance of the mixes. vi
7 ACKNOWLEDGMENTS The author would like to thank Dr. E. Ray Brown and Donald Watson for all their guidance and support in this endeavor. The author also acknowledges the advisory committee including Dr. David Timm and Dr. Randy West for all of their time and assistance during this project. Thanks are also due to the staff at the National Center for Asphalt Technology for all their assistance. Special thanks are due to her parents Mario and Shirley and to her sister Marcela, for all of their love and support throughout all academic endeavors. Finally to her husband Fabricio, for all of his encouragement and support in every step of the way. vii
8 Style manual used: Proceedings, Association of Asphalt Paving Technologists Computer software used: Microsoft Word, Microsoft Excel, Minitab viii
9 TABLE OF CONTENTS LIST OF TABLES...xi LIST OF FIGURES...xv CHAPTER 1. INTRODUCTION BACKGROUND AND PROBLEM STATEMENT OBJECTIVES SCOPE OF STUDY... 2 CHAPTER 2. LITERATURE REVIEW INTRODUCTION REVIEWS SUMMARY CHAPTER 3. RESEARCH TEST PLAN PART 1 EVALUATION OF MATERIALS Evaluation of Aggregate Properties Evaluation of Asphalt Binder Properties PART 2 MIX DESIGNS PART 3 PERFORMANCE TESTS Moisture Susceptibility Rutting Susceptibility ix
10 3.3.3 Creep Compliance Flexural Beam Fatigue CHAPTER 4. TEST RESULTS AND ANALYSIS MATERIAL PROPERTIES Aggregates Asphalt Binder MIX DESIGNS PERFORMANCE TESTS Moisture Susceptibility Rutting Susceptibility Indirect Tensile Creep Compliance Flexural Beam Fatigue Summary CHAPTER 5. CONCLUSIONS AND RECOMMENDATIONS CHAPTER 6. REFERENCES APPENDIX A APPENDIX B x
11 LIST OF TABLES Table 2.1. Rutting of Fine SMA vs. Standard Hot Mix: I-85 Test Section (2) 5 Table 2.2. Friction Values for Fine SMA Mix: I-85 Test Section (2) Table 2.3. Procedures for the Design of Mixtures Containing RAP (9) Table 2.4. Mix Design Parameters (14) Table 2.5. Strength, Stiffness and Critical Pavement Temperature of the Mixes (16) Table 2.6. Change of IDT Properties for Long-Term Aged Mixture (17) Table 2.7. Summary Results of Fatigue Constants and Allowable Number of Loads (18) Table 2.8. Analysis of Moisture Damage Potential (18) Table 3.1. Test Matrix for Mix Variables Table 3.2. Properties of Virgin Aggregates Table 3.3. Gradations for Mt. View Aggregates Table 3.4. Gradations for Lithia Springs Aggregates Table 3.5. Gradations for Camak Aggregates Table 3.6. Gradations for Ruby Aggregates Table 3.7. RAP Gradations Table 3.8. Asphalt Contents in RAP Table 3.9. Gradations for Control Mixes Table Gradations of Recycled SMA Mix Using DG1 RAP xi
12 Table Gradations of Recycled SMA Mix Using DG2 RAP Table Gradations of Recycled SMA Mix Using -4 RAP Table Gradations of Recycled SMA Mix Using +4 RAP Table 4.1. Aggregate Properties for Combined Blends Table 4.2. Analysis of Variance for Aggregate Properties Table 4.3. Aggregate Properties for RAP Material Table 4.4. Average Results for Aggregate Sources Table 4.5. Average Results for RAP Contents Table 4.6. Critical Temperatures and Performance Grades of Virgin and Recovered RAP Binders Table 4.7. Measured Binder Properties of +4 RAP Blends Table 4.8. Measured Binder Properties of -4 RAP Blends Table 4.9. Measured Binder Properties of DG1 RAP Blends Table Measured Binder Properties of DG2 RAP Blends Table Performance Grades of RAP Blends Table Rate of Increase in G*/sinδ for Unaged Blends Table Rate of Increase in G*/sinδ for RTFO-Aged Blends Table Rate of Increase in G*sinδ for RTFO and PAV-Aged Blends Table Rate of Increase in Creep Stiffness Table Rate of Decrease in Creep Rate Table Volumetric Properties of RAP Mixtures Table Virgin and RAP Binder Contents for SMA Mixes Table Savings in Virgin Binder (%) for RAP Mixtures xii
13 Table Tensile Strengths for SMA Mixtures Table Analysis of Variance for Tensile Strengths Table Tensile Strength Comparisons for SMA Mixes with Various RAP Contents Table Tensile Strength Comparisons for SMA Mixes with Various RAP Types Table Unconditioned Tensile Strengths Comparisons for Aggregate Source RAP Type Interaction Table Conditioned Tensile Strengths Comparisons for Aggregate Source RAP Type Interaction Table Moisture Susceptibility Results for Control Mixes Table Moisture Susceptibility Results for SMA Mixes Using +4 RAP Table Moisture Susceptibility Results for SMA Mises Using -4 RAP Table Moisture Susceptibility Results for SMA Mixes Using DG1 RAP Table Moisture Susceptibility Results for SMA Mixes Using DG2 RAP Table Analysis of Variance for TSR Table Average TSR Values for Various RAP Contents Table Tensile Strength Ratios Comparisons for RAP Contents Table Rutting Susceptibility Results for RAP Mixtures Table Analysis of Variance for Rut Depths Table Average Rut Depths for Various RAP Contents Table Differences in Rut Depth for Aggregate Sources Table Rut Depth Comparisons for RAP Types Table Rut Depths for RAP Content RAP Type Interaction xiii
14 Table m-values for SMA Mixes Table Analysis of Variance for m-value Table m-value Comparisons for Aggregate Sources Table m-value Comparisons for RAP Types Table Test Results for High Strain Beams (800 µε) Table N f Comparisons for RAP Contents (800µε) Table Effect of RAP Binder on Fatigue Life (800 µε) Table N f Comparisons for Aggregate Sources (800µε) Table N f Comparisons for RAP Content Aggregate Source Interaction Table Initial Stiffness Comparisons for Recycled SMA with Various RAP Contents (800µε) Table Initial Dissipated Energy Comparisons for RAP Contents (800µε) Table Average Test Results for Low Strain Beams Table N f and Percent Drop Comparisons for RAP Contents (400 µε) Table Initial Stiffness Comparisons for Aggregate Sources (400 µε) Table Initial Stiffness Comparisons for RAP Content Aggregate Source Interaction (400 µε) Table Fatigue Life Comparisons for Strain Levels xiv
15 LIST OF FIGURES Figure 2.1. Distribution of Rut Measurements on SMA Pavements (3)..7 Figure 2.2. Los Angeles abrasion loss versus change in percent passing 4.75 mm sieve (5) Figure 2.3. F/E particle content versus change in percent passing 4.75 mm sieve (5) Figure 2.4. Percent passing 4.75 mm sieve versus VMA (5) Figure 2.5. Percent passing 4.75 mm sieve versus VCA (5) Figure 2.6. Example of Superpave high temperature sweep blending charts (8) Figure 2.7. Load Vs. Number of Cycles to Failure in SCB Fatigue Test for PG64-22 Mixtures (17) Figure 2.8. Number of Cycles to Failure in Strain Controlled Beam Fatigue Test (17)..31 Figure 2.9. Effect of Test Temperature on Indirect Tensile Strength (18) Figure 3.1. Gradations for Mt. View Aggregates Figure 3.2. Gradations for Lithia Springs Aggregates Figure 3.3. Gradations for Camak Aggregates Figure 3.4. Gradations for Ruby Aggregates Figure 3.5. RAP Gradations Figure 3.6. Rolling Thin Film Oven (20) Figure 3.7. Pressure Aging Vessel (20) Figure 3.8. Basics of Dynamic Shear Rheometer (20) xv
16 Figure 3.9. Schematic of Bending Beam Rheometer (20) Figure Superpave Binder Specification Example (20) Figure Gradations for Control Mixes Figure Gradations of Recycled SMA Mix Using DG1 RAP Figure Gradations of Recycled SMA Mix Using DG2 RAP Figure Gradations of Recycled SMA Mix Using -4 RAP Figure Gradations of Recycled SMA Mix Using +4 RAP Figure Indirect Tension Test Creep Compliance Curves (23) Figure Prony Series Fit to Master Creep Compliance Curve (23) Figure Determination of m, the Slope of the Log Creep Compliance Curve (23) Figure 4.1. Critical High Temperatures for Binder Blends Figure 4.2. Critical Intermediate Temperatures for Binder Blends Figure 4.3. Critical Low Temperatures for Binder Blends Figure 4.4. G*/sinδ Trends for Unaged RAP Blends Figure 4.5. G*/sinδ Trends for RTFO-Aged RAP Blends Figure 4.6. G*sinδ Trends for RTFO+PAV-Aged RAP Blends Figure 4.7. Creep Stiffness Trends for RAP Blends Figure 4.8. Creep Rate Trends for RAP Blends Figure 4.9. Old to New Asphalt Ratio vs RAP Content Figure Asphalt Contents for SMA Mixtures Figure Strength Values from Moisture Susceptibility Test Figure Effect of RAP Percentage on Tensile Strength Figure Strength Values for RAP Types xvi
17 Figure Effect of Aggregate Source on Rut Depth Figure Average Rut Depths for Various RAP Types Figure Effect of RAP Content on Creep Compliance for Recycled Mixes Using +4 RAP Figure Effect of RAP Content on Creep Compliance for Recycled Mixes Using -4 RAP Figure Effect of RAP Content on Creep Compliance for Recycled Mixes Using DG1 RAP Figure Effect of RAP Content on Creep Compliance for Recycled Mixes Using DG2 RAP Figure Creep Compliance Master Curves for RAP Mixtures Figure Average m-values for RAP Mixtures Figure Effect of Aggregate Source on m-value Figure Average m-values for RAP Types Figure Number of Cycles to Failure for RAP Mixtures (800µε) Figure Effect of Aggregate Source on N f (800µε) Figure Relationship between Initial Stiffness and Number of Cycles to Failure (800 µε) Figure Relationship between Drop in Initial Stiffness at 1,000,000 Cycles and Estimated N f (400 µε) Figure Relationship between Initial Stiffness and N f (400 µε) Figure Effect of Aggregate Source on Initial Stiffness (400 µε) Figure Number of Cycles to Failure for High and Low Strain Levels xvii
18 CHAPTER 1. INTRODUCTION 1.1 BACKGROUND AND PROBLEM STATEMENT Economic and environmental considerations have prompted the use of reclaimed asphalt pavement (RAP) in new asphalt mixes. Asphalt pavement is the most recycled product in the United States, both in terms of tonnage (73 million tons, more than any other material) and in terms of percentage (80 percent of reclaimed asphalt pavement is recycled, a higher percentage than any other substance) (1). RAP is used HMA pavement that has been milled up or crushed. It can be used as a constituent in new mixtures, with characteristics similar to those of virgin HMA mixtures. Benefits of using recycled HMA include lower costs, reduced waste and conservation of natural resources. Although RAP has been successfully incorporated in HMA applications, its use by many agencies has not been extended to the production of open-graded friction courses and stone matrix asphalt (SMA) mixtures. When SMA technology was first implemented in the United States in 1991, there was no experience with the use of RAP in this specialty mixture. Its effect on special requirements for SMA mixes, such as more cubical aggregate and use of polymer-modified asphalt and fiber stabilizers was uncertain, and therefore, its use in SMA mixtures has generally not been allowed. Based on the success obtained with the incorporation of RAP in conventional mixtures, the use of RAP in SMA mixtures needed to be evaluated. This research 1
19 evaluated the effect of RAP on aggregate, asphalt binder and combined mixture properties. 1.2 OBJECTIVES The objectives of this study were to: 1) Evaluate the effect of various RAP contents and sources on combined aggregate properties such as toughness/abrasion, and flat and elongated particles. 2) Evaluate the effect of RAP on asphalt binder properties such as dynamic shear and fatigue. 3) Determine the feasibility of using SMA mixtures as future RAP sources. 4) Evaluate the performance of SMA mixtures containing fractionated RAP and the potential economical benefits of using this type of material. 5) Evaluate the effect of various RAP sources of different gradation, asphalt content and aggregate properties on the overall performance of SMA mixtures. 1.3 SCOPE OF STUDY To accomplish the aforementioned objectives, this study started with a literature search and review of the information pertaining to the design of SMA mixtures and mixtures containing RAP and their performance. Based on the results of the literature study, a research plan was developed involving extensive laboratory testing, which included performing mix designs for different aggregate sources, RAP types and RAP proportions. For each blend, aggregate properties were determined, as well as optimum asphalt 2
20 content and volumetric properties. Performance tests were conducted to evaluate the mixtures at different RAP levels. A blend with no RAP was used as a baseline for the study for comparisons of mix performance. 3
21 CHAPTER 2. LITERATURE REVIEW 2.1 INTRODUCTION Several projects have studied the use of SMA mixes in the United States. Results have shown that the same benefits found in European mixes can be obtained with local materials and procedures. However, many specifications for material properties, gradation and volumetrics needed to be modified, and in some cases new requirements were developed. Use of RAP in HMA applications has also been widely investigated. Inclusion of RAP in HMA mixes has been shown to have not only economic and environmental benefits, but also in some cases it has improved performance. Combining RAP with virgin materials may affect mixture properties, and therefore it has been necessary to develop guidelines for the design of mixtures containing RAP. Performance tests conducted on recycled mixtures indicate that for the most part, they have been found to perform as well as virgin mixtures if properly accounted for in the mix design. 4
22 2.2 REVIEWS 1. Summary of Georgia s Experience with Stone Matrix Asphalt Mixes by GDOT (2) This report summarizes the results of various research projects conducted by GDOT to assess the viability of using SMA mixes on the Georgia road system. Research Project No evaluated the performance of SMA asphalt under stresses of heavy truck loadings and compared it to the performance of conventional GDOT mixes. Research Project No evaluated the use of SMA as an overlay for Portland cement concrete (PCC) pavements. Both projects used the 50-blow Marshall Mix Design procedure, which is used in the design of European SMA. In Project No. 9102, coarse and fine SMA mixes were designed for use as intermediate layers and wearing courses, respectively. The mixes were placed in a 2.5- mile, high traffic volume test section on Interstate 85 northeast of Atlanta. Following the construction of the I-85 test section in 1991, rutting measurements were conducted between 1993 and 1995 to monitor rutting in the fine SMA and conventional mixes. The results indicated that SMA mixes exhibited significantly less rutting than conventional mixes (Table 2.1). Table 2.1. Rutting of Fine SMA vs. Standard Hot Mix: I-85 Test Section (2). Year SMA (mm) Standard (mm)
23 The test section on I-85 was also used to monitor the friction provided by SMA mixes. Results indicated that the thick asphalt film in SMA mixes did not affect frictional properties, since the thicker film wears quickly at the surface (Table 2.2). Table 2.2. Friction Values for Fine SMA Mix: I-85 Test Section (2). Friction Number Date Number 11/ / /96 50 A mix optimization research study was conducted in a joint study with Georgia Tech to learn more about methods of enhancing SMA performance. Findings from this study showed that GDOT fine SMA mixes undergo at least 30% to 40% less rutting than a typical GDOT dense-graded surface mix, and these fine SMA mixes typically have a fatigue life of 3 to 5 times that of a conventional surface mix. The study also indicated that by relaxing the aggregate quality requirements for SMA mixes important production cost savings could be realized without significantly reducing the performance of the mixes. In Europe, aggregate quality requirements for SMA mixes are typically very rigorous. Based on this research, GDOT implemented use of aggregates which have no more than 45% abrasion loss and which have no more than 20% flat and elongated particles when measured at the 3:1 ratio. Based on the combination of GDOT and European experience, SMA has proven to have the following intrinsic benefits: 30-40% less rutting than standard mixes 3 to 5 times greater fatigue life in laboratory experiments 6
24 30-40% longer service life Lower annualized cost 2. Performance of Stone Matrix Asphalt (SMA) Mixtures in the United States by Brown et al. (3) This report provides a summary of mix design and performance data obtained between 1994 and 1996 from 86 SMA projects involving a total of 140 test sections in 19 different states. All mixtures were designed using the 50-blow Marshall procedure and used a stabilizer (or special asphalt binder) to prevent draindown of the asphalt cement. In most cases, a fiber (cellulose or mineral) or a polymer was used as the stabilizer. The various SMA mixtures were inspected to determine performance. The study indicated that over 90% of the projects had rutting measurements less than 4 mm. Approximately 25% of the projects had no measurable rutting (Figure 2.1). Figure 2.1. Distribution of Rut Measurements on SMA Pavements (3). Cracking (thermal and reflective) did not represent a significant problem. SMA mixtures appeared to be more resistant to cracking than dense mixtures, most likely due 7
25 to the relatively high asphalt content and its resulting high film thickness. There was no evidence of raveling, and the biggest performance problem was the occurrence of fat spots, which is caused by segregation, draindown, high asphalt content or improper type or amount of stabilizer. The study concluded that SMA mixtures provided good performance in high traffic volume areas and that the increased benefits should compensate for the extra cost of construction. 3. Updated Review of Stone Matrix Asphalt and Superpave Projects by Watson (4). A second study (4) was conducted in September 2001 to evaluate long-term performance on some of the same SMA projects studied by Brown et al. The survey found that SMA mixtures had given exceptional rut-resistant performance, even when placed on hightraffic volume routes. Only one out of the 11 projects visited exhibited rutting in excess of 6 mm. Only one project had significant block-type cracking, believed to be caused by the stiff binder. The biggest long-term performance problem was transverse, reflective cracking. However, this problem appeared to be related to the use of SMA as a thin-lift overlay of PCC pavements. Comparisons between SMA mixes and conventional sections indicated that SMA mixtures may significantly reduce the rate of crack propagation when used as an overlay for concrete pavements. The fat spots, noted as the major performance problem in the original study (2) had been worn off by traffic over time and were not noticeable during the 2001 review. In 8
26 general, several projects were still in excellent condition after 9 years of service and based on an overall project condition rating, SMA mixes can be expected to last up to 25% longer than conventional mixes. 4. Development of a Mixture Design Procedure for Stone Matrix Asphalt (SMA) by Brown et al. (5). This study developed a mixture design procedure for SMA and evaluated material and mixture criteria for these mixes. Data were collected from a laboratory study conducted with various types of aggregates, fillers, asphalt binders and stabilizing additives. Parameters evaluated included aggregate toughness, flat and elongated particles, aggregate gradation, volumetric mix properties, asphalt binder content, compactive effort and asphalt binder draindown. Results indicated that there was a good correlation between aggregate breakdown and aggregate toughness as measured by the Los Angeles abrasion test for both Marshall (R 2 = 0.62) and SGC (R 2 = 0.84) compaction, as seen in Figure 2.2. To evaluate the effect of flat and elongated particles, mixtures were prepared with 0%, 25%, 50%, 75% and 100% flat and elongated aggregate. Samples were compacted with 50 blows of the Marshall hammer and aggregate breakdown was measured. Figure 2.3 shows that increased F/E particle content increases aggregate breakdown (R 2 =0.89). 9
27 50 blow Marshall Compaction Compaction with 100 revolutions of SGC Figure 2.2. Los Angeles abrasion loss versus change in percent passing 4.75 mm sieve (5). 10
28 Figure 2.3. F/E particle content versus change in percent passing 4.75 mm sieve (5). Increased aggregate breakdown resulted in lower VMA. High Los Angeles abrasion values (40% or higher) make meeting the VMA requirements and ensuring a reasonable high asphalt content more difficult. Figure 2.4 shows the change in VMA with change in percent passing the 4.75 mm sieve. As the percent passing the 4.75 mm sieve decreases, the VMA remains nearly constant, and then begins to increase once the percent passing the 4.75 mm sieve reaches percent. The point at which the VMA begins to increase defines the condition at which stone-on-stone contact begins to develop. To ensure the formation of stone-on-stone contact, the percent passing the 4.75 mm sieve should be kept below 30 percent. The presence of an adequate aggregate skeleton can also be verified by measuring the voids in the coarse aggregate (VCA) of the mix. Figure 2.5 shows that as the percent passing the 4.75 mm sieve decreases, the VCA of the mix also decreases. At 11
29 approximately 30 percent passing the 4.75 mm sieve, the slope of the curve begins to decrease slightly, setting the point at which stone-on-stone contact begins to develop. The design air void range should be kept between 3 and 4 percent. To minimize fat spots and rutting, the air voids in warmer climates should be designed closer to 4 percent. Also, use of polymer modified asphalt produced better rut resistant mixes, while fiber stabilizers were superior in preventing draindown. A combination of stabilizers may provide the best properties in SMA mixes. Figure 2.4. Percent passing 4.75 mm sieve versus VMA (5). 12
30 Figure 2.5. Percent passing 4.75 mm sieve versus VCA (5). 5. NCHRP Project 9-12 (6). Research for Project 9-12, Incorporation of Reclaimed Asphalt Pavement in the Superpave System, was conducted in three separate, but related, studies: Black Rock Study The objective of this study was to determine whether RAP acts like a black rock or whether some blending occurs between the old and new binders. Three cases simulating possible interactions between the old and new binders were studied to investigate the behavior of RAP blends. Black Rock (BR) samples were made using virgin and recovered RAP aggregate with virgin binder (no RAP binder). Actual Practice (AP) samples were made using virgin binder and aggregate, mixed with RAP with its binder film intact. Total Blending (TB) samples were made using virgin and recovered RAP 13
31 aggregate. RAP binder was recovered, then blended with virgin binder in the specified percentages before mixing. All the samples were prepared on the basis of an equal volume of total binder. Three different RAPs, two different virgin binders, and two RAP contents (10 and 40 percent) were investigated in this primary phase of the project. The different cases of blending were evaluated through the use of various Superpave shear tests at high temperatures and of the indirect tensile creep and strength tests at low temperatures. Results indicate that even though there is no significant difference at low RAP contents, RAP does not act like a black rock, and blending of the old and new binders occurs to a significant extent. This means that at high RAP contents the hardened RAP binder must be accounted for in the virgin binder selection. Binder Effects Study This study investigated the effects of RAP content and stiffness on the blended binder properties. The same three RAPs and two virgin binders were evaluated in this phase of the project at RAP binder contents of 0, 10, 20, 40, and 100 percent. The blended binders were tested according to the AASHTO MP1 binder tests. The response variables for the experiment were the individual test results and critical temperatures determined at high and intermediate temperatures from the Dynamic Shear Rheometer (DSR) tests and at low temperatures from the BBR tests. The specific parameters studied were complex shear modulus (G*) and phase angle (δ) from the DSR and stiffness and m-value from the BBR. It was found that at low RAP contents, the effects of the RAP binder are negligible. At intermediate RAP contents, these effects can be compensated for by using 14
32 a virgin binder that is one grade softer on both the high- and low- temperature grades. Higher RAP contents require the use of blending charts to determine the appropriate virgin binder grade. Mixture Effects Study This study investigated the effects of RAP on total mixture properties. Shear tests and indirect tensile tests were conducted to assess the effects of RAP on mixture stiffness at high, intermediate, and low temperatures. Beam fatigue testing was also conducted at intermediate temperatures. RAP contents of 0, 10, 20, and 40 percent were evaluated. The tests indicated that high RAP contents increase the mixture stiffness, and therefore, a softer virgin binder must be used to improve the fatigue and low-temperature cracking resistance of the mixture. 6. Laboratory Investigation of Mixing Hot-Mix Asphalt with Reclaimed Asphalt Pavement by Huang et al. (7). This study analyzed the blending process of RAP with virgin mixture. One type of screened RAP consisting only of No. 4 particles was blended with virgin coarse aggregate at different percentages, and binder rheological tests were performed to characterize properties of binders at different layers of aggregate particle coating. An extreme case was evaluated by mixing RAP and virgin aggregates without any new asphalt binder. The objective was to find out to what extent the aged asphalt will get away from the RAP particles under pure mechanical mixing. Results indicated that only a small proportion of the aged binder would be available to blend with the virgin binder. 15
33 A blended mixture containing 20% RAP and PG binder was used to simulate actual plant mixing. The mixture was subjected to staged extraction and recovery by soaking it in trichloroethylene solution for 3 minutes and then decanting the solution, repeating the process several times. This process allowed the formation of different layers of asphalt around the RAP particles. Results showed that the influence of RAP on the virgin binder was very limited. Only a small portion of RAP asphalt participated in the remixing process; other portions formed a stiff coating around RAP aggregates, and RAP acted as a black rock. 7. Designing Recycled Hot-Mix Asphalt Mixtures Using Superpave Technology by Kandhal and Foo (8). This project developed a procedure for selecting the performance grade (PG) of virgin asphalt binder in a recycled HMA mixture based on the Superpave PG grading system. Blending charts were constructed and evaluated based on test parameters obtained from the dynamic shear rheometer (DSR) and therefore, only high and intermediate test temperatures were considered. Two blending charts were used to determine the high temperature value of recycled asphalt binder. The first high temperature sweep blending chart determined the temperature at which G*/sinδ of the unconditioned recycled asphalt binder is 1.0 kpa. The second high temperature sweep blending chart determined the temperature at which G*/sinδ of RTFO residue of the recycled asphalt binder is 2.2 kpa. The high temperature value of the recycled asphalt binder is defined as the lower temperature value given by these two high temperature sweep blending charts. The 16
34 intermediate temperature sweep blending chart determined the temperature at which G*sinδ of RTFO+PAV residue of the recycled asphalt binder is 5 MPa. These charts indicated a linear relationship between the logarithm of binder shear stiffness (expressed as G*/sinδ) and percent of virgin asphalt in a virgin and RAP binder blend, as shown in Figure 2.6. Figure 2.6. Example of Superpave high temperature sweep blending charts (8). 17
35 The following recommendations were made for proper selection of PG asphalt binder: High temperature value of the recycled asphalt binder performance grade can be determined by using only one high temperature sweep blending chart. High temperature sweep blending chart G*/sin δ= 1.0 kpa is recommended over high temperature sweep blending chart G*/sin δ=2.2 kpa because it does not require running the RTFO test. Although the intermediate temperature sweep blending chart G*sinδ=5 MPa was expected to determine the maximum amount of RAP, it allowed unusually high percentages of RAP, which are inconsistent with the field experience with recycled HMA. Use of the intermediate temperature sweep blending chart is not recommended at the present time. A three-tier system of selecting the PG grade of the virgin asphalt binder was recommended for recycled mixes: Tier 1: If the amount of RAP in the HMA mix is equal to or less than 15%, the selected PG grade of the virgin asphalt binder should be the same as the Superpave specified PG grade. Tier 2: If the amount of RAP in the HMA mix is more than 15% but equal to or less than 25%, the selected PG grade of the virgin asphalt binder should be one grade below (both high and low temperature grade) the Superpave specified PG grade. The use of a specific grade blending chart to select the high temperature grade of the virgin asphalt binder is optional. 18
36 Tier 3: If the amount of RAP in the HMA mix is more than 25%, use the specific grade blending chart to select the high temperature grade of the virgin asphalt binder. The low temperature grade should be at least one grade lower than the binder grade specified by Superpave. 8. Guidelines for the Design of Superpave Mixtures Containing Reclaimed Asphalt Pavement (RAP) by Bukowski (9). This guideline was developed by the FHWA Superpave Mixtures Expert Task Group and outlines the proper means for incorporating RAP in Superpave mixtures. It suggests that aggregate and asphalt binder in the RAP should be considered as part of the aggregate and asphalt binder contents of the total mix, respectively. Also, all aggregate requirements for the aggregate blend must be satisfied. Asphalt binder grade must be adjusted depending upon the amount of RAP included in the mixture, according to the following three categories: Tier 1: Up to 15% RAP by weight of total mixture Tier 2: 16% to 25% RAP by weight of total mixture Tier 3: Above 25% RAP by weight of total mixture Tier 1 does not require any modification of the mix design process, and the selection of the grade of virgin asphalt binder is based on typical requirements for climatic conditions and predicted traffic. Determination of asphalt binder content in RAP is left to the discretion of the agency. Tier 2 requires determination of the asphalt binder content in the RAP. For Tier 3, the grade of virgin asphalt binder is either set to one grade lower than that usually selected for given climatic conditions, or selected from a blending 19
37 chart. Table 2.3 summarizes the tests required on the RAP and selection of asphalt binder grade. Tier 1 Table 2.3. Procedures for the Design of Mixtures Containing RAP (9). Determine Measure Measure Measure Agg PG Grade RAP AC RAP RAP AC Blend Change Content Gradation Stiffness Properties (a) x no x none 2 x x no (b) x 3 x x yes x (a) At the discretion of the agency (b) Unless blending chart is used (c) Or use blending chart one grade lower (c) use blending chart 9. Effect of Reclaimed Asphalt Pavement on Binder Properties Using the Superpave System by Kennedy et al. (10). In this study, rheological properties were measured for different combinations and percentages of aged asphalts and virgin asphalts. It includes test results from Superpave binder tests conducted on unaged binders at the high-temperature range, as well as test results on blends aged using the rolling thin film oven test (RTFOT) and pressure aging vessel (PAV) conducted at high-, low-, and intermediate-temperature ranges. Six asphalts were chosen from the Material Reference Library (MRL) for this experiment. Two of the binders were chosen arbitrarily to be aged to simulate RAP binder and then combined with the four virgin binders at different percentages (0, 15, 25, 55 and 100%). Engineering characteristics of the virgin-rap blends were determined with the aid of a dynamic shear rheometer (DSR) and a bending beam rheometer (BBR). 20
38 The result of this study is a methodology for determining the effect of RAP on rheological properties of PG binders in the Superpave system. Specific conclusions drawn from this study include: The stiffness of the binder is higher at higher percentages of RAP binder. The rate of change of stiffness (G*/sin δ, G*sin δ, or creep stiffness) is either constant from 0 100% RAP binder or increases with lower temperatures. The rate of change of stiffness is either constant from 0 100% RAP or increases at higher percentages of RAP in the blend. 10. Determination of Recycled Asphalt Pavement (RAP) Content in Asphalt Mixes Based on Expected Mixture Durability by Abdulshafi et al. (11). This study developed a method to evaluate the effects of RAP content on long-term durability of a bituminous concrete mixture, which may be used to select an optimum RAP content. The procedure includes preparation of test specimens at different levels of RAP addition. Each set of specimens is divided into two subsets to be tested for indirect tensile strength; one is tested in dry condition and the other is subjected to vacuum saturation, followed by a freeze cycle and warm water soaking prior to testing. During the testing, load and deformation data are continuously collected, and the resultant energy needed to fail a specimen is calculated. Numerical indices of absorbed energy are computed from the test data obtained for the dry and conditioned subsets of specimens. The mix that has the greatest index of absorbed energy is selected as having the optimum RAP content. 21
39 11. Recycled Asphalt Pavement (RAP) Effects on Binder and Mixture Quality by Li et al. (12). This study investigated the effect of various types and percentages of RAP on asphalt binder and asphalt mixture properties. Ten mixtures were prepared using two asphalt binders (PG58-28 and PG58-34) and two RAP sources, identified as follows: Millings RAP from a single source, milled up from I-494 in Maple Grove RAP RAP combined from a number of sources and crushed at the HMA plant. In addition to the control mixtures, asphalt mixtures were prepared with 20% and 40% of each of the RAP sources. The dynamic modulus proposed by the recent AASHTO design guide was used to determine the effect of various percentages of RAP on mixture properties. Stiffness and moisture susceptibility results were also used to determine the effect of RAP on the asphalt mixture properties. From the complex modulus test results, it was observed that addition of RAP to a mixture generally increased the complex modulus and mixture stiffness. However, this does not always occur at low temperatures. Asphalt binder grade and RAP source had a significant effect on mixture stiffness. The complex modulus for the mixtures made with PG asphalt binder was always higher than that from the mixtures made with a softer PG asphalt binder. Also, addition of the millings led to a larger increase in stiffness than the similar addition of RAP. Mixtures containing RAP showed significant variability and the variability increased with the increase in RAP content. The IDT creep test was performed at temperatures of -18 C and -24 C. Results indicated that generally stiffness increases as the percentage of RAP or millings increases. The mixtures with PG binder were softer than the mixtures with PG 58-22
40 28 binder. For the mixtures with PG binder, as the percentage of RAP or millings increased, the IDT strength increased, while the mixtures with PG binder did not show the same trend. Moisture susceptibility test data indicated that as the percentage of RAP increased the strength also increased, while the tensile strength ratio decreased. Binder tests showed that the addition of RAP improved the binder grade in terms of high temperature performance, while the low temperature performance did not change significantly except for the case when 40% RAP was added, meaning that the resulting binder blends would be more resistant to rutting and equally resistant to thermal cracking compared to virgin binders. The tests on the binders indicated that using 20% RAP in asphalt mixtures does not significantly affect the performance. RAP amounts of 40% have a significant effect on the performance of the mixtures. 12. Use of Reclaimed Asphalt Pavement in Superpave Hot-Mix Asphalt Applications by Stroup-Gardiner and Wagner (13). This research evaluated the effectiveness of screening RAP stockpiles into coarse and fine fractions. This practice was found to maximize the use of RAP and produce a range of HMA mixtures that meet Superpave requirements. The coarser fraction was used in a typical 12.5 mm below-the-restricted-zone Superpave gradation, while the finer fraction was used in a 12.5 mm above-the-restrictedzone gradation. Screening the RAP increased uniformity in coarser aggregate fractions and allowed up to 40 percent of this material to be used and still meet below-therestricted-zone Superpave gradation requirements by reducing the amount of finer 23
41 aggregate fractions, especially the minus mm material. The use of RAP in these mixtures reduced neat asphalt requirements by 18 to 33 percent. The use of the finer RAP fraction in above-the-restricted-zone Superpave gradations resulted in a reduction in neat asphalt of about 25 percent. Addition of this material decreased rutting potential and temperature susceptibility. However, the amount of material to be used was limited to a maximum of 15 percent in order to meet abovethe-restricted-zone gradation requirements. 13. Mechanistic and Volumetric Properties of Asphalt Mixtures with Recycled Asphalt Pavement by Daniel and Lachance (14). This research examined how the addition of RAP changes the volumetric and mechanistic properties of asphalt mixtures. Two RAP sources, a processed RAP and an unprocessed RAP (grindings), were used to study the change in volumetric properties and one RAP source was used for dynamic modulus and creep testing. A control mixture containing only virgin materials (0% RAP) was tested along with mixtures containing 15, 25 and 40% RAP. The volumetric properties of the different mixes are shown in Table 2.4. For the processed RAP mixtures, the VMA and VFA values for the 25% and 40% RAP contents were higher than those for the control and 15% mixtures. For the grindings RAP mixtures, the VMA values increase with RAP content and the VFA values for all mixtures are higher than for the control mix. It is hypothesized that this difference is due to the extent of blending of the RAP material with the virgin materials. 24
42 Table 2.4. Mix Design Parameters (14). Processed Grindings Control 15% RAP 25% RAP 40% RAP 15% RAP 25% RAP 40% RAP % AC Gmm VMA VFA DP % AC = asphalt content; Gmm = maximum theoretical specific gravity; DP = dust proportion. The study also indicated that there is an optimal preheating time for RAP to allow the particles to soften, break down, and blend with the virgin materials. At 15% RAP, the stiffness of the mixture increased and the compliance decreased, which indicates that the mixture will be more resistant to permanent deformation and less resistant to fatigue and thermal cracking, due to the addition of aged binder contained in the RAP. However, mixtures containing 25 and 40% RAP did not follow the expected trends and behaved similar to the control mixture. A combination of gradation, asphalt content and volumetric properties is likely the cause of these trends. 14. Five Year Experience of Low-Temperature Performance of Recycled Hot Mix by Tam et al. (15). This project investigated the relative resistance of recycled hot mixes to thermal cracking, as compared to conventional mixes. Two criteria were used: limiting stiffness and fracture temperature (FT). Materials were selected from five recycling contracts covering different regions, virgin asphalt cements, and recycling ratios. Direct tension tests were performed at different temperatures to determine the tensile strengths, strains, and stiffnesses of the different mixtures. Results indicated that when using the limiting stiffness approach, the recycled mixes had higher stiffness values 25
43 than the conventional mix, which would translate into higher thermal cracking susceptibility. Thermal contraction was used to estimate the induced strain due to thermal shrinkage under a restrained condition. In this case, only one mixture had a fracture temperature below the FT of the virgin mix, confirming the findings from the direct tension tests. Results from field data and laboratory tests revealed that mixes with low RAP content or high penetration virgin asphalt cement had better performance than those with high RAP content or using low penetration virgin asphalt cement. It was also found that fracture temperature, stiffness and viscosity increased with aging of the pavement, reducing its resistance to low temperature cracking. 15. Investigation of Properties of Plant-Produced RAP Mixtures by McDaniel et al. (16). This experiment examined the influence of RAP content in the mixture and recovered binder properties of plant-produced hot mix asphalt. For low temperature properties the plant-produced mixtures were tested for creep compliance and tensile strength. For high temperature properties the mixtures were tested for dynamic modulus ( E* ). The virgin and recovered RAP binders were also tested for complex shear modulus (G*). Three percentages of RAP were added (15%, 25% and 40%) using two binder grades (PG64-22 and PG58-28). Indirect tensile strength results showed that, in general, mixtures with higher strength also showed higher stiffness values. Mixtures with lower stiffness values have a better ability to relax the thermal stresses that develop as the pavement cools. In addition, 26
44 high strength is also required to resist cracking by traffic loads. Table 2.5 shows that the mixture with the highest RAP content (Mixture D) had the highest strength and stiffness; hence, the warmest critical temperature (T c ). Mixture E with the lowest strength also had the lowest stiffness and a low Tc value. Mixtures with the softer binder (PG58-28) showed lower strengths at a given RAP content than the corresponding mixtures with PG64-22, as expected. Table 2.5. Strength, Stiffness and Critical Pavement Temperature of the Mixes (16). Mixture RAP Strength (kpa) Stiffness T Binder c % Rep1 Rep2 Rep3 Avg. (GPa) ( C) A 0 PG B 15 PG C 25 PG D 40 PG E 25 PG F 40 PG Laboratory Study of Fatigue Characteristics of HMA Mixtures Containing RAP by Huang et al. (17). This project evaluated the laboratory fatigue characteristics of asphalt mixtures containing RAP. A typical surface mixture commonly used in the state of Tennessee was evaluated at 0, 10, 20 and 30 percent of No. 4 sieve screened RAP materials. One type of aggregate (limestone) and two types of asphalt binders (PG64-22 and PG76-22) were considered in this study. Fatigue characteristics of mixtures were evaluated through indirect tensile strength (IDT), beam fatigue, and semi-circular fatigue tests (SCB). These three tests represented three different test modes: indirect tensile at monotonic loading, SCB at cyclic constant stress, and third-point beam at cyclic constant strain. Half of the specimens were subjected to laboratory long-term aging prior to performance tests. 27
45 The indirect tensile stress (ITS) and strain test was used to determine the tensile strength and strain of the mixtures. This test was conducted at 25 o C and a 2 inch/min deformation rate. The toughness index (TI), a parameter describing the toughening characteristics in the post-peak region, was also calculated from the indirect tensile test results. The TI compares the performance of a specimen with that of an elastic perfectly plastic reference material, for which the TI remains a constant of 1. For an ideal brittle material with no post-peak load carrying capacity, the value of TI equals zero. In this study, the values of indirect tensile toughness index were calculated up to tensile strain of one percent. Results from the IDT test revealed that increasing the percentage of screened RAP materials generally increased the tensile strengths, and decreased toughness indices for both un-aged and aged mixes. Increasing RAP percentages had significantly different effects in IDT properties for mixtures with PG64-22 than those with PG76-22, especially for the mixtures subjected to laboratory long-term aging. As shown in Table 2.6, the increase of RAP had more tensile strength gains (about 5 to 10% greater for PG64-22 mixtures), no (or less) tensile strain loss at failure (1% smaller for the PG64-22 mixture at 30% RAP content), and less decrease in post-failure toughness index (9.8 to 24.3% less for PG64-22 mixtures), suggesting that the recycled mixes would have an increased fatigue life. 28
46 Table 2.6. Change of IDT Properties for Long-Term Aged Mixture (17). IDT Properties Tensile Strength Change, % Strain at Failure Change, % Toughness Index Change, % AC %RAP PG76-22 PG64-22 PG76-22 PG64-22 PG76-22 PG Note: The values in the table indicated the increase or decrease or properties relative to the control mix (with 0% RAP). In the SCB fatigue test, the inclusion of RAP generally increased the fatigue life of the mixtures in this study, as well as the total dissipated energy. Long-term aging also increased fatigue life. For mixes subjected to long-term aging, the slope of fatigue curves in load versus log(n f ) increased significantly when the RAP increased to 30 percent, which indicated potential lower fatigue life for these mixes at lower stress levels (Figure 2.7). 29
47 Failure Cycles Vs. Applied Loads, Unaged Mixes: PG Load, lbs % RAP, unaged 10% RAP, unaged 20% RAP, unaged 30% RAP, unaged Cycles, N f Failure Cycles Vs. Applied Loads, Aged Mixes: PG Load, lbs % RAP, aged 10% RAP, aged 20% RAP, aged 30% RAP, aged Cycles, N f Figure 2.7. Load Vs. Number of Cycles to Failure in SCB Fatigue Test for PG64-22 Mixtures (17). Results from beam fatigue tests indicated that the inclusion of RAP generally increased the flexural stiffness of the mixtures. Fatigue life as defined by AASHTO TP8-94 generally increased with the increase of RAP percentages. The percentage of increase in fatigue life is more significant for long-term aged mixtures with PG64-22 asphalt (up to 1.8 higher than the virgin mix) than those with PG76-22 (up to 0.6 times higher than 30
48 the virgin mix). For mixtures with PG76-22 asphalt, without long-term aging, the fatigue life decreased with the inclusion of RAP (Figure 2.8). Number of Cycles to Failure: PG ,000 80,000 70,000 Cycles, Nf 60,000 50,000 40,000 30,000 0% RAP 10% RAP 20% RAP 30% RAP 20,000 10,000 0 unaged long-term aged Number of Cycles to Failure: PG , ,000 Cycles, Nf 200, , ,000 0% RAP 10% RAP 20% RAP 30% RAP 50,000 0 unaged long-term aged Figure 2.8. Number of Cycles to Failure in Strain Controlled Beam Fatigue Test (17). In summary, the results from this study indicated that the inclusion of RAP generally increased the stiffness, indirect tensile strength and laboratory fatigue resistance 31
49 for the mixtures studied. Mixture properties changed significantly at 30% RAP content as compared to those with 10 and 20 percent. 17. A Comparison of the Predicted Performance of Virgin and Recycled Mixes by Puttagunta et al. (18). This study compared the fatigue and moisture damage potential of virgin and recycled mixes through the use of indirect tensile strength and resilient modulus tests, as stipulated by the Asphalt Aggregate Mixture Analysis System (AAMAS) guidelines, which recommend the use of indirect tensile strength and resilient modulus to assess both fatigue and moisture damage potential. One source of RAP was used to prepare mixes with recycling ratios of 25% and 50%. Results for the indirect tensile strength test indicated that the virgin mix had a tensile strength about 1,000 kpa higher at low temperatures as compared to the recycled mixes (Figure 2.9). The tensile strength of all mixes decreased as temperature increased, but the rate of decrease was higher for the virgin mix (about 5 kpa/ C higher). The difference in the tensile strengths of the 25% and 50% recycled materials was small at all temperatures (less than 100 kpa). 32
50 Figure 2.9. Effect of Test Temperature on Indirect Tensile Strength (18). From the results of the resilient modulus test it was concluded that the virgin mix had a higher resilient modulus than the recycled mixes at all temperatures (from 238 MPa at 40 C to 1,667MPa at 5 C for mixtures with 25% RAP and from 255 MPa at 40 C to 1,548MPa at 5 C for mixtures with 50% RAP). The rate of decrease of resilient modulus with test temperature for the virgin mix was 68 to 73 MPa/ C higher than for the recycled mixes between 5 and 22 C but was almost equal between 22 and 40 C (only 8 to 10 MPa/ C higher). Again, at all temperatures the difference between the results of the 25% and 50% recycled mixes was small (not more than 120 MPa). The fatigue analysis showed that in general, the virgin mix had higher resistance to fatigue cracking than the recycled mixes (up to 7.86x10 8 repetitions higher at 5 C). The AAMAS procedure utilizes the resilient moduli and failure strain from the indirect tensile strength test to calculate the fatigue coefficients K 1 and K 2. The fatigue performances of the 25% and 50% recycled mixes were relatively similar at all temperatures, with a maximum difference of 2.8x10 7 repetitions at 5 C (Table 2.7). 33
51 Table 2.7. Summary Results of Fatigue Constants and Allowable Number of Loads (18). Temperature Mixture ( C) Virgin Mix 25% RAP 50% RAP Resilient modulus (MPa) ,928 2,020 1,259 5,261 1,594 1,021 5,380 1,621 1,004 Fatigue constant, K Fatigue constant, K Allowable number of loads, N f x x x x x x x x x x x x x x x x x x10 5 Moisture damage analysis based on retained stability as defined by the Marshall design method indicated that the virgin and recycled mixes offered good resistance to moisture damage (over 90% retained stability). However, the AAMAS procedure, which involves the use of the indirect tensile strength and resilient modulus, predicted a resistance to moisture damage that falls below the minimum criteria. The AAMAS procedure also predicted resistance to moisture damage that increased with increasing recycling ratios (up to 0.32 higher, as shown in Table 2.8). This may be attributed to the fact that recycled aggregates allow a better coating with new asphalt as compared to virgin aggregates. Table 2.8. Analysis of Moisture Damage Potential (18). Reclaimed Asphalt Pavement Virgin mix 25% 50% AAMAS criterion Tensile strength ratio >0.80 Modulus of resilient ratio >
52 18. Behavior of Recycled Asphalt Pavements at Low Temperatures by Sargious and Mushule (19). This study was conducted to evaluate the behavior of recycled asphalt pavements with respect to low-temperature cracking. A recycled mix consisting of 45% RAP and 55% virgin materials as well as a virgin control mix were used. Using mix properties that were determined experimentally in the laboratory, thermal stresses resulted from drop in temperature and the expected cracking temperatures were determined for both mixes. An experimental analysis based on laboratory tests that consider the pavement properties only, as well as a more complete theoretical analysis based on a finite element computer program were included. The mix properties that were determined experimentally included density, resilient modulus, tensile strength, coefficient of thermal contraction, thermal conductivity, and specific heat. The data required by the program are the ambient air temperature, the cross-section geometry, the thermal and elastic properties of pavement and subgrade, and the surface thermal characteristics. The results for both experimental and laboratory-based experimental analyses indicated that the performance of recycled asphalt pavements with respect to lowtemperature cracking is superior to that of virgin asphalt pavements of comparable initial properties. Recycled mixtures had lower crack temperatures (-27 C for the virgin and C for the recycled materials), which may be due to factors such as the use of a soft asphalt in the recycled mix as a modifier. Recycled mixtures also had higher coefficient of thermal conductivity (0.37 to 0.50 W/(m C) higher), higher tensile strength (360 to 1260 kpa higher) and lower coefficient of thermal contraction (0.12x10 5 / C to 35
53 0.19x10 5 / C lower) than those of virgin mixtures. The theoretical work showed that pavement thickness and subgrade type play an important role in low-temperature cracking for both virgin and recycled asphalt pavements. 2.3 SUMMARY The literature review revealed that studies conducted on SMA mixture design and performance (2, 3, 4, 5) concluded that SMA mixes had benefits such as reduced rutting, greater fatigue life and longer service life. Certain modifications in the requirements have been made to adapt the mixtures to the material characteristics and conditions found in the United States. Research on the use of recycled asphalt pavement has found that RAP does not act like a black rock and partial blending occurs (6, 7, 8, 9). Guidelines have been developed to incorporate RAP in conventional HMA mixtures, establishing that at low RAP contents (up to 15%) the binder effects are negligible and no modification is required in the design process. At intermediate RAP contents (16% to 25%), these effects can be compensated for by using a virgin binder that is one grade softer on both the highand low- temperature grades. Higher RAP contents (over 25%) require the use of blending charts to determine the appropriate virgin binder grade. It has also been found that addition of RAP increases the binder stiffness (6, 10), and hence, the mixture stiffness. This may affect low temperature performance (14, 15) and fatigue life (17, 18). On the other hand, increase in mix stiffness resulted in higher indirect tensile strength (17, 18), which improved rutting and moisture resistance (12, 14, 18). 36
54 Fractionated RAP has been successfully used in Superpave mixtures (13). RAP material passing the 1.18 mm sieve represents the fine aggregates bound in small conglomerates by the RAP asphalt, which cannot be separated during milling or sieving operations. RAP sources studied had similar gradations at and above the 1.18 mm size, but showed significant differences in the amount of material passing the 1.18 mm sieve. By removing this material, the uniformity between the RAP sources in the coarser fractions could be increased. The fine RAP fractions generally have a higher asphalt content than the coarse fractions due to the higher surface area per unit weight associated with fine aggregate gradations. This higher binder content may reduce the required virgin binder content noticeably while using a lower percentage of RAP material. It has also been observed that using the fine RAP fraction increases the mixture stiffness which reduces rutting potential. The information collected suggests that use of RAP in SMA mixtures could produce important benefits in terms of performance. The effect of increased stiffness must be carefully studied, since SMA mixes could be especially vulnerable to distresses associated with this property, such as thermal and fatigue cracking. 37
55 CHAPTER 3. RESEARCH TEST PLAN The research approach was divided into three parts as they relate to the objectives of the study: evaluation of materials, mix designs and performance tests. The experiment was planned as a 4x4x4 factorial design, with three factors (aggregate source, RAP content and RAP type) at four levels each. This allowed studying the contributions that each of the factors make individually to the response, as well as the effect of the interaction of treatment factors. The full factorial design would require 64 treatment combinations, but due to time constraints and a need to keep research costs in a reasonable range, a one-fourth fraction was selected so that the number of mix designs to be evaluated could be limited without sacrificing the integrity of the experiment. Table 3.1 shows the test matrix for the fractional factorial design. 38
56 Aggregate source Mountain View Lithia Springs Camak Ruby Table 3.1. Test Matrix for Mix Variables. RAP RAP content, % source Regular X SMA X Fine-graded X Coarse-graded X Regular X SMA X Fine-graded X Coarse-graded X Regular X SMA X Fine-graded X Coarse-graded X Regular X SMA X Fine-graded X Coarse-graded X 3.1. PART 1 EVALUATION OF MATERIALS This study involved evaluating material properties of aggregates, asphalt binder and the combined blend of virgin materials and RAP Evaluation of Aggregate Properties Four aggregate sources were used in this study: Florida Rock at Mt. View, Martin- Marietta at Ruby, Martin-Marietta at Camak, and Vulcan at Lithia Springs. These sources were chosen because they have been widely used in SMA production in Georgia with positive results. Their properties are shown in Table 3.2. Tables 3.3 through 3.6 and Figures 3.1 through 3.4 show the aggregate gradations for each source. The M 39
57 denomination on some of the aggregates means that they are manufactured screenings, while the W denominations correspond to washed screenings, which have a lower dust content. Aggregate Source Mt. View Table 3.2. Properties of Virgin Aggregates. General Specific Gravities Absorption, Character of Bulk SSD App. % Material Granite Gneiss/ Amphibolite Lithia Springs Granite Gneiss Camak Granite Gneiss Ruby Gneiss/ Amphibolite Table 3.3. Gradations for Mt. View Aggregates. Sieve Size Percent Passing W10 1" /4" /2" /8" # # # # # # #
58 Table 3.4. Gradations for Lithia Springs Aggregates. Sieve Size Percent Passing " /4" /2" /8" # # # # # # # Table 3.5. Gradations for Camak Aggregates. Sieve Size Percent Passing 007 M10 1" /4" /2" /8" # # # # # # # Table 3.6. Gradations for Ruby Aggregates. Sieve Size Percent Passing 007 M10 1" /4" /2" /8" # # # # # # #
59 0.45 Power Gradation Chart Percent Passing W10 0 #200 #100 #50 #30 #16 #8 #4 3/8" 1/2" 3/4" 1" Sieve Size Figure 3.1. Gradations for Mt. View Aggregates Power Gradation Chart Percent Passing #200 #100 #50 #30 #16 #8 #4 3/8" 1/2" 3/4" 1" Sieve Size Figure 3.2. Gradations for Lithia Springs Aggregates. 42
60 0.45 Power Gradation Chart Percent Passing M10 0 #200 #100 #50 #30 #16 #8 #4 3/8" 1/2" 3/4" 1" Sieve Size Figure 3.3. Gradations for Camak Aggregates Power Gradation Chart Percent Passing M10 0 #200 #100 #50 #30 #16 #8 #4 3/8" 1/2" 3/4" 1" Sieve Size Figure 3.4. Gradations for Ruby Aggregates. 43
61 Four RAP sources were used in this study: conventional RAP, RAP from reclaimed SMA, fine-graded RAP (-4 RAP), and coarse-graded RAP (+4 RAP). Table 3.7 and Figure 3.5 show the RAP gradations used in this study and Table 3.8 shows the asphalt cement content of each RAP source. SMA RAP was included in this study to evaluate the possibility of recycling SMA material back into an SMA mixture. As the first SMA projects reach the end of their service life, it is important to determine if the stiff mastic in an SMA mix might prevent it from being recycled or if the proportion of RAP may have to be reduced. However, when the SMA RAP received from GDOT was tested it was found that its gradation and asphalt content did not match those of an SMA mix. SMA mixes generally have about 25 percent of the material passing the No. 4 sieve, and in this case, that amount was 77 percent. It is known that this RAP material was crushed to achieve the 12.5 mm NMAS and this may have affected its gradation. The asphalt content of the SMA RAP was unusually low with an average of only 4.4 percent based on weight of total mix (the usual asphalt content being about 6 percent). Based on this result, it is likely that the RAP from the SMA project also included a portion of the underlying 19 mm Superpave mixture as a result of the milling process. Overall, there was no significant difference between the gradations of conventional and SMA RAP, and from this point on they will be treated and referred to as dense-graded RAP 1 (DG1 RAP) and dense-graded RAP 2 (DG2 RAP), respectively. The use of fractionated RAP material into coarse and fine-graded stockpiles was also considered in this study. +4 RAP was used as a substitute of a portion of the No. 7 stone, typically used in high quantities in SMA production. This option would be 44
62 beneficial in the event that quarries were faced with a supply shortage of No. 7 stone due to its high demand in other HMA and concrete mix applications. -4 RAP was used as a substitute for a portion of the asphalt content, since its higher surface area makes it richer in asphalt cement. This would represent an advantage because asphalt cement is typically the most expensive component of a mixture. Table 3.7. RAP Gradations. Sieve Size Percent Passing DG1 RAP DG2 RAP -4 RAP +4 RAP 1" /4" /2" /8" # # # # # # #
63 0.45 Power Gradation Chart Percent Passing DG1 DG #200 #100 #50 #30 #16 #8 #4 3/8" 1/2" 3/4" 1" Sieve Size Figure 3.5. RAP Gradations. Table 3.8. Asphalt Contents in RAP RAP Source Asphalt Content, % DG1 5.6 DG2 4.4 Aggregate toughness was determined by the Los Angeles abrasion test (ASTM C131), which measures the resistance of coarse aggregates to degradation by abrasion and impact. The aggregate is placed in a metal drum along with a charge of steel balls, and the drum is rotated 500 times at a speed of revolutions per minute (RPM). The inside of the drum is equipped with an angle iron which runs longitudinally. This causes the charge of aggregate and balls to fall with a heavy impact once during each revolution, breaking the aggregate particles into smaller particles. At the completion of 46
64 the test, the aggregate is shaken over a No. 12 sieve and the amount which passes through the sieve, expressed as a percentage of the total charge, is the Los Angeles abrasion value designated "percent loss". Aggregates must be tough in order to prevent crushing and abrasive wear during manufacturing, placing and compaction of HMA. This aggregate property is especially critical in gap-graded mixtures such as SMA because excessive aggregate breakdown will fill void spaces within the mixture and thereby reduce the amount of asphalt cement that would otherwise be needed. As the asphalt content is reduced, the durability of the mixture suffers and results in premature aging and deterioration. The flat and elongated property was determined by GDT-129. This characteristic is defined as the percentage by weight of coarse aggregates that have a length in excess of three times its average thickness, in accordance with the test procedure. This test was performed to ensure that the aggregate contained cubical particles capable of distributing traffic loads through the stone-on-stone coarse aggregate skeleton of an SMA mix. This also contributes to the improved rutting resistance of SMA mixes as compared to conventional mixtures Evaluation of Asphalt Binder Properties The binder from RAP materials was recovered through Abson recovery tests (ASTM D1856) and its properties were evaluated by means of the Dynamic Shear Rheometer (DSR) and Bending Beam Rheometer (BBR). Asphalt cement from samples of the 47
 procedure according to AASHTO T240, which simulates aging during construction.")
65 proposed blends was also extracted and analyzed for rheological properties and performance grade. Short-term aging of the blended binders was achieved using the Rolling Thin Film Oven (RTFO) procedure according to AASHTO T240, which simulates aging during construction. In this test, a moving film of asphalt binder is heated in an oven for 85 minutes at 163 C. The moving film is created by placing the asphalt binder sample in a small jar then placing the jar in a circular metal carriage that rotates within the oven (Figure 3.6). This rotation is used to continually expose fresh films of the binder to hot air. Figure 3.6. Rolling Thin Film Oven (20). Long-term aging, which simulates several years of exposure to the environment, was achieved using the Pressure Aging Vessel (PAV) in accordance to AASHTO PP1. The PAV is an oven-pressure vessel combination that takes RTFO aged samples and 48
 and Bending Beam Rheometer (BBR) testing.")
66 exposes them to high air pressure (2070 kpa) and temperature (90 C, 100 C or 110 C, depending upon expected climatic conditions) for 20 hours. Figure 3.7. Pressure Aging Vessel (20). Engineering properties of the blended binders were obtained through Dynamic Shear Rheometer (DSR) and Bending Beam Rheometer (BBR) testing. The DSR test was used in accordance with AASHTO TP 5 to measure the complex shear modulus (G*) and phase angle (δ) of the blended binders at high and intermediate temperatures. The test uses a thin asphalt binder sample placed between two plates. The lower plate is fixed while the upper plate oscillates back and forth across the sample at 1.59 Hz to create a shearing action. These oscillations at 1.59 Hz (10 radians/sec) are meant to simulate the shearing action corresponding to a traffic speed of about 90 km/hr (55 mph). 49

67 Figure 3.8. Basics of Dynamic Shear Rheometer (20). The physical properties measured with the DSR allow obtaining the rutting and fatigue parameters, which are used to quantify the asphalt binder s contribution in resisting those types of distresses. Rutting is considered a stress controlled, cyclic loading phenomenon. Each traffic loading cycle does work that contributes to deform the HMA pavement surface. A part of this work is recovered by elastic rebound of the surface while some is dissipated in the form of permanent deformation and heat. The work dissipated per loading cycle at a constant stress can be expressed as: 2 1 Wc = π σ o G / sin δ Equation 3.1 (21) Where: W c = work dissipated per load cycle σ o = stress applied during the load cycle G * = complex modulus δ = phase angle 50
68 The amount of work dissipated per loading cycle is inversely proportional to G * /sinδ, called the rutting parameter. In order to minimize permanent deformation, W c must be minimized as well. This indicates that higher values of G * /sinδ correspond to binders with better rutting resistance In the case of fatigue cracking, this distress is considered a strain controlled phenomenon. The work dissipated per loading cycle at a constant strain can be expressed as: [ ] 2 Wc = π o G sin δ Equation 3.2 (21) where is the strain and the other variables are as previously described. Fatigue cracking is minimized by decreasing the term G * sinδ (fatigue parameter). The BBR test was performed according to AASHTO TP 1 to determine the binder s propensity to thermal cracking. The BBR basically subjects a simple asphalt beam to a small (1,000 mn) load over 240 seconds. Then, using basic beam theory, the BBR calculates the flexural creep stiffness (S) and logarithmic creep rate (m) of the asphalt binder. The creep stiffness of the asphalt binder beam at 60 seconds loading time is given by: S () t 3 PL = Equation 3.3 (21) 3 4bh δ () t Where: S(t) = creep stiffness at time, t = 60 seconds P = applied constant load, 100 g L = distance between beam supports, 102 mm b = beam width, 12.5 mm 51
 = deflection at time, t = 60 seconds The m-value is the rate of change of the stiffness, S(t), with loading time and is used to describe how the asphalt binder relaxes under load. Figure 3.")
69 h = beam thickness, 6.25 mm δ(t) = deflection at time, t = 60 seconds The m-value is the rate of change of the stiffness, S(t), with loading time and is used to describe how the asphalt binder relaxes under load. Figure 3.9. Schematic of Bending Beam Rheometer (20). Creep stiffness is related to thermal stresses in an HMA pavement due to shrinking while the m-value is related to the ability of an HMA pavement to relieve these stresses. Therefore, asphalt binders with minimum creep stiffness and maximum creep rate are desired in order to resist thermal cracking. The Superpave asphalt binder specification (AASHTO MP1) is intended to control permanent deformation, low temperature cracking and fatigue cracking in asphalt pavements. The specification accomplishes this by controlling the various physical 52
, but the temperatures at which these properties must be achieved vary depending on the climate in which the binder is expected")
70 properties described previously (G*/sinδ, G*sinδ, S(t) and m-value). The physical properties remain constant for all performance grades (PG), but the temperatures at which these properties must be achieved vary depending on the climate in which the binder is expected to serve (Figure 3.10). Figure Superpave Binder Specification Example (20). 3.2 PART 2 MIX DESIGNS RAP material, virgin asphalt and virgin aggregate were proportioned to produce 12.5 mm SMA mix designs. The 50-blow Marshall procedure, which is used by GDOT, was used for asphalt mixture compaction and PG was used as the standard performance grade asphalt. RAP was blended at four proportions (0%, 10%, 20%, and 30%) to determine the effect of RAP over the ranges of anticipated use. A blend with no RAP was 53
71 used as a baseline for the study for comparisons of mix performance. A RAP content of 10% represented the least amount that can feasibly be utilized, and a maximum RAP content of 30% was used because it is improbable that blends with greater contents of RAP would be able to meet gradation and volumetric requirements of the mix design. The gradations for the control and recycled mixes are shown in Tables 3.9 through 3.13 and Figures 3.11 through Table 3.9. Gradations for Control Mixes. Sieve Size Percent Passing Mt. View Lithia Springs Camak Ruby 1" /4" /2" /8" # # # # # # # Table Gradations of Recycled SMA Mix Using DG1 RAP. Sieve Size Percent Passing 10% RAP 20% RAP 30% RAP 1" /4" /2" /8" # # # # # # #
72 Table Gradations of Recycled SMA Mix Using DG2 RAP. Sieve Size Percent Passing 10% RAP 20% RAP 30% RAP 1" /4" /2" /8" # # # # # # # Table Gradations of Recycled SMA Mix Using -4 RAP. Sieve Size Percent Passing 10% RAP 20% RAP 30% RAP 1" /4" /2" /8" # # # # # # # Table Gradations of Recycled SMA Mix Using +4 RAP. Sieve Size Percent Passing 10% RAP 20% RAP 30% RAP 1" /4" /2" /8" # # # # # # #
73 0.45 Power Gradation Chart Percent Passing Mt. View Lithia Springs Ruby Camak 0 #200 #100 #50 #30 #16 #8 #4 3/8" 1/2" 3/4" 1" Sieve Size Figure Gradations for Control Mixes Power Gradation Chart Percent Passing % 20% 30% 0 #200 #100 #50 #30 #16 #8 #4 3/8" 1/2" 3/4" 1" Sieve Size Figure Gradations of Recycled SMA Mix Using DG1 RAP. 56
74 0.45 Power Gradation Chart Percent Passing % 20% 30% 0 #200 #100 #50 #30 #16 #8 #4 3/8" 1/2" 3/4" 1" Sieve Size Figure Gradations of Recycled SMA Mix Using DG2 RAP Power Gradation Chart Percent Passing % 20% 30% 0 #200 #100 #50 #30 #16 #8 #4 3/8" 1/2" 3/4" 1" Sieve Size Figure Gradations of Recycled SMA Mix Using -4 RAP. 57
75 0.45 Power Gradation Chart Percent Passing % 20% 30% 0 #200 #100 #50 #30 #16 #8 #4 3/8" 1/2" 3/4" 1" Sieve Size Figure Gradations of Recycled SMA Mix Using +4 RAP. In the mix design, the gradations of the SMA mixtures were kept as close as possible to each other to provide a proper comparison among the different aggregate sources and RAP types. The gradation charts in Figures 3.11 through 3.15 show that there is little variation in the percent passing each sieve size among the different mixtures (in most cases under 5%). Fiber stabilizing additive (cellulose fiber) and mineral filler (marble dust) were included in the mixture as specified by GDOT. Once the blends for each type of aggregate were determined, an initial asphalt content was estimated for each mixture. Replicate samples prepared for each blend were mixed at three different asphalt contents and conditioned in accordance with AASHTO R30. Specimens were compacted using a Marshall hammer, following procedures in AASHTO T-245. The bulk specific gravity of each specimen was determined by 58
76 AASHTO T 166. The theoretical maximum specific gravity of the loose HMA mix samples was measured in accordance with AASHTO T 209. Percent of air voids in the mix, voids in mineral aggregate (VMA) and voids filled with asphalt (VFA) were calculated for each mixture. 3.3 PART 3 PERFORMANCE TESTS The performance of the bituminous concrete test mixes was evaluated by subjecting specimens to diametral tensile strength, moisture susceptibility, flexural beam fatigue, APA rutting, and indirect tensile creep compliance tests Moisture Susceptibility The effect of RAP addition on the moisture susceptibility of the mixtures was evaluated by determining the diametral tensile strength on dry and wet specimens according to GDT-66, Evaluating the Moisture Susceptibility of Bituminous Mixtures by Diametral Tensile Splitting. In this test, internal water pressures in the mixtures are produced by vacuum saturation followed by a freeze and a warm-water soaking cycle. Six Marshall specimens were prepared using optimum asphalt content and compacted to 7.0 ± 1.0 percent air voids. A subset of three specimens remained unconditioned and was used as the control group. The other subset was partially vacuum saturated with water for 30 minutes and then subjected to a freeze (-18 C for 15 hours) and thaw (60 C for 24 hours) cycle. Both subsets were then tested for indirect tensile 59
77 strength at a load rate of in/minute. The diametral tensile strength of each specimen was determined by Equation 3.4. S 2P = Equation 3.4 π td Where: S = tensile strength, psi (kpa) P = maximum load, pounds (N) t = specimen height immediately before tensile test, inches (millimeters) D = specimen diameter, inches (millimeters) The percentage of retained strength (TSR) was calculated by comparing the properties of dry specimens with water-conditioned specimens. Where: TSR = percent retained strength S a = average tensile strength of conditioned subset, psi (kpa) S c = average tensile strength of control subset, psi (kpa) S a TSR = 100 Equation 3.5 S c Rutting Susceptibility Rutting susceptibility of the mixtures was tested with the Asphalt Pavement Analyzer (APA), according to GDT-115, Determining Rutting Susceptibility Using the Loaded Wheel Tester. The APA is a modification of the Georgia Loaded Wheel Tester (GLWT), 60
78 and it follows a similar rut-testing procedure. A wheel is loaded onto a pressurized linear hose and tracked back and forth over a testing sample to induce rutting. Six samples for each mix type were compacted with a gyratory compactor to 5.0 ± 1 percent air voids and tested at 64 C using a vertical load of 100 lbs. and hose pressure of 100 psi for 8,000 cycles Creep Compliance The creep compliance of the mixtures was evaluated according to AASHTO T 322, Determining the Creep Compliance and Strength of Hot-Mix Asphalt Using the Indirect Tensile Test Device, in order to determine if the addition of RAP affected the resistance of the mixtures to thermal cracking. Three replicate specimens for each mixture were compacted with a gyratory compactor to approximately 7% air voids and cut to dimensions of 150 mm diameter by 50 mm height. The tensile creep compliance was determined by applying a static compressive load of fixed magnitude along the diametral axis of each specimen for 100 s. Each specimen was tested at temperatures of -20, -10 and 0 C. The horizontal and vertical deformations measured near the center of the specimen were used to calculate the tensile creep compliance as a function of time, given by the following relationship: () t where ε(t) is the strain and σ 0 is the stress. ( ) ε t D = Equation 3.5 σ 0 61
79 Compliance is a way of characterizing the stiffness of a material. Another term frequently used is creep stiffness, S(t), which is the inverse of creep compliance as determined from a creep test: S () t σ 0 1 = = Equation 3.6 D t () ε () t An example of creep compliance curves measured at multiple temperatures using the indirect tensile test at low temperature is presented in Figure A nonlinear regression routine is used to determine the master creep compliance curve from the creep compliance curves measured at multiple temperatures. The regression is performed in two steps. First, a regression is performed to simultaneously determine the temperature shift factors (a t ) and the parameters for the following Prony series (Maxwell model) representation of the master creep compliance curve: Where: D (ξ) = creep compliance at reduced time ξ ξ = reduced time (= t/a t ) a t = temperature shift factor D(0), D i, τ I, η v = Prony series parameters D ξ = 0 i + Equation 3.7 η N ξ / τ i ( ξ ) D( ) + D ( 1 e ) i=1 v 62
80 Figure Indirect Tension Test Creep Compliance Curves (23). In essence, the regression finds the best shift factors and Prony series parameters to fit the measured data based upon a least-squares criterion. One of the temperatures is selected as the reference temperature for the master curve (typically -20 C), and thus the creep compliance curve at this temperature is fixed in time (a t = 1). The regression determines the amount of time (horizontal) shift required for the curves at the remaining temperatures to result in a smooth master curve. Each of these remaining creep compliance curves will thus have a shift factor (a t ) associated with it. Figure 3.17 shows the shifted creep compliance data. 63
81 Figure Prony Series Fit to Master Creep Compliance Curve (23). The second step in the regression routine is to fit a second functional form to the master creep compliance information. This second functional form is the following power law: D m ( ) D( 0 ) + D ξ ξ 1 = Equation 3.8 where D(ξ) and ξ are as defined previously, and D(0), D 1, and m are the coefficients of the functional form. The primary purpose for fitting this functional form is to determine the parameter m. This parameter is essentially the slope of the linear portion of the master creep compliance curve on a log-log plot (Figure 3.18). It has been found to be an important parameter in distinguishing between the thermal cracking performance of different materials. 64
82 Figure Determination of m, the Slope of the Log Creep Compliance Curve (23) Flexural Beam Fatigue Fatigue tests were conducted according to AASHTO TP 8, Determining the Fatigue Life of Compacted Hot-Mix Asphalt Subjected to Repeated Flexural Bending, to evaluate the stiffening effect of RAP on the mixture and its impact on the long-term fatigue life of the pavement. Three replicate beams were compacted with a kneading compactor to 6.0 ± 1.0 percent air voids and cut to dimensions of 380 mm long by 50 mm thick by 63 mm wide. The beams were placed in four-point loading and subjected to repeated haversine loads. The deflection caused by the load was measured at the center of the beam. The tests were performed under a constant-strain condition, at strain levels of 400 and 800 micro-strain and at a temperature of 20 C. The variables measured include the number of cycles to failure, initial and final stiffnesses, and dissipated energy. The flexural stiffness is defined as: 65
83 S t = 1000 Equation 3.9 ε σ t Where: S = flexural stiffness, MPa σ t = maximum tensile stress, kpa ε t = maximum tensile microstrain The initial stiffness is defined as the measured flexural stiffness after 50 cycles. The number of cycles to failure (N f ) is the load cycle at which the specimen exhibits a 50 percent reduction in stiffness relative to the initial stiffness. The dissipated energy is calculated by determining the area within the stress-strain hysteresis loop for each captured data pulse. The cumulative dissipated energy is the summation of the dissipated energy per cycle. 66
84 CHAPTER 4. TEST RESULTS AND ANALYSIS 4.1 MATERIAL PROPERTIES Aggregates Properties of the virgin and recycled SMA mixes used in Part 1 of the study are shown in Table 4.1. These data were used to perform an analysis of variance (shown in Table 4.2), which indicated that combined blend properties such as LA abrasion and flat and elongated particle content are mainly influenced by the aggregate source (p-values < 0.001). At 95% confidence level, RAP content and RAP type did not have a significant effect on percent loss or F/E particle content. As Table 4.3 shows, there is little variation in the aggregate properties of the RAP materials (3.0% difference for % loss and 0.8% difference for F/E particle content), which is the reason why RAP type is not significant in this data. 67
85 Table 4.1. Aggregate Properties for Combined Blends. Aggregate % RAP RAP Type LA Abrasion, F/E particles, % loss % (3:1 ratio) Mt. View 0 DG * DG Lithia Springs DG DG Camak DG * DG Ruby 0 DG DG * 6.4 *Same as virgin blend because coarse recycled material was not added. Table 4.2. Analysis of Variance for Aggregate Properties. Factor LA Abrasion F/E Particles F-statistic p-value F-statistic p-value Agg. Source RAP Content RAP Type Table 4.3. Aggregate Properties for RAP Material. RAP Type LA Abrasion, F/E particles, % % loss (3:1 ratio) DG DG N/A N/A The effect of RAP addition on aggregate properties depended on the quality of the virgin and recycled materials contained in the blend. As mentioned above, the differences among aggregate sources were significant (Table 4.4), and they determined the results for 68
86 the combined blend. If a virgin aggregate is combined with RAP aggregates that have higher percent loss values, increasing the RAP content will increase the percent loss of the blend. Likewise, if a virgin aggregate is combined with RAP aggregates that have lower percent loss values, increasing the RAP content will decrease the percent loss of the blend. However, the differences produced by the increase in RAP content were very small (less than 1.5%, as Table 4.5 shows) and were not significant for these data. The results for the F/E particles had a maximum difference of 3.1% among RAP contents, which was not significant. Table 4.4. Average Results for Aggregate Sources. Aggregate Source LA Abrasion, F/E Particles, % % Loss (3:1 ratio) Mt. View Lithia Springs Camak Ruby Table 4.5. Average Results for RAP Contents. RAP Content, % LA Abrasion, % Loss F/E Particles, % (3:1 ratio) Asphalt Binder The single type of virgin asphalt cement was PG 76-22, which is a polymer-modified asphalt. The results for the virgin and recovered RAP asphalts are presented in Table
87 The critical high temperatures for the extracted RAP binders were obtained by testing the recovered RAP binder as if it had been RTFO aged. Table 4.6. Critical Temperatures and Performance Grades of Virgin and Recovered RAP Binders. Aging Property Virgin Recovered RAP Binders Binder +4-4 DG1 DG2 Original G*/sin δ, kpa RTFO G*/sin δ, kpa RTFO+PAV G* sin δ, kpa BBR S, MPa BBR m-value PG Actual MP The actual binder properties of the blends are shown in Tables 4.7 through It can be observed that among RAP types, blends that contain DG2 RAP had higher values of G*/sinδ at a given RAP content for both original (1.96 kpa and higher at passing temperatures) and RFTO aged samples (3.5 kpa and higher at passing temperatures), which indicates better resistance of the resulting binder blends to rutting. Blends containing DG2 RAP also had lower values of G*sinδ than the corresponding blends containing other RAP binder types (maximum 3,847 kpa at passing temperature). This is indicative of a higher fatigue cracking resistance for these binder blends. Finally, the properties obtained with the BBR test (creep stiffness and creep rate) also had more favorable results for blends using DG2 RAP binder. These blends had lower stiffness (maximum 151 MPa at passing temperature) and higher creep rate (0.322 and higher at passing temperatures) than the corresponding blends containing other RAP binder types. Low creep stiffness values are desired in order to minimize thermal stresses, while the m-value must be high to maximize the ability of the HMA pavement to relieve 70
88 those stresses; therefore, mixtures that contain DG2 RAP have a binder blend that is more resistant to thermal cracking. Table 4.7. Measured Binder Properties of +4 RAP Blends. Aging Property Critical Temp. +4 RAP Property C 10% 20% 30% Original G*/sin δ, kpa 1.00 kpa RTFO G*/sin δ, kpa 2.20 kpa RTFO+PAV G* sin δ, kpa BBR S, MPa BBR m-value 5,000 kpa 300 MPa ,427 4, ,614 5, ,413 6, Table 4.8. Measured Binder Properties of -4 RAP Blends. Aging Property Critical Temp. -4 RAP Property C 10% 20% 30% Original G*/sin δ, kpa 1.00 kpa RTFO G*/sin δ, kpa 2.20 kpa RTFO+PAV G* sin δ, kpa BBR S, MPa BBR m-value 5,000 kpa 300 MPa ,370 6, ,153 5, ,690 6,
89 Aging Table 4.9. Measured Binder Properties of DG1 RAP Blends. Property Critical Temp. DG1 RAP Property C 10% 20% 30% Original G*/sin δ, kpa 1.00 kpa RTFO G*/sin δ, kpa 2.20 kpa RTFO+PAV G* sin δ, kpa BBR S, MPa BBR m-value 5,000 kpa 300 MPa ,688 5, ,997 5, ,149 5, Table Measured Binder Properties of DG2 RAP Blends. Aging Property Critical Temp. DG2 RAP Property C 10% 20% 30% Original G*/sin δ, kpa 1.00 kpa RTFO G*/sin δ, kpa 2.20 kpa RTFO+PAV G* sin δ, kpa BBR S, MPa BBR m-value 5,000 kpa 300 MPa ,030 4, ,416 4, ,847 5, Table 4.6 showed that the critical high temperatures of the RAP binders are higher than that of the virgin binder, which suggests that the combined blends of the recycled mixture should be more resistant to rutting. The intermediate temperatures were also higher for the RAP binders, meaning that the fatigue resistance of the asphalt blends may be affected by the addition of RAP binder. The ability of the combined blends to resist thermal cracking could also be affected, since three of the RAP binders had critical low 72
90 temperatures higher than that of the virgin binder and this could cause the combined blends to have higher critical low temperatures as well. DG2 RAP binder has a higher critical high temperature (Table 4.6), which caused the DG2 RAP binder blends to have critical high temperatures at least 1.7 C higher than the other blends (Figure 4.1). It can also be observed that blends containing -4 RAP always had a higher critical high temperature than blends containing +4 RAP. This could be due to the higher asphalt content in -4 RAP, which results in a lower demand of virgin asphalt in the mix. The resulting asphalt blends are therefore stiffer and have higher values of critical high temperatures. Even though the recovered DG2 RAP binder had the highest temperatures in both cases, in general, the combined DG2 RAP blends had critical intermediate temperatures between 0.5ºC and 3.0ºC lower than the other blends, as shown in Figure 4.2. The DG2 RAP blends also had most critical low temperatures between 0.1ºC and 4.3ºC lower than the other blends, and only in one case was the critical temperature exceeded by that of the blend containing +4 RAP (Figure 4.3). 73
91 Critical High Temperature ( C) DG1 DG % RAP Blend Figure 4.1. Critical High Temperatures for Binder Blends DG1 DG2 Critical Intermediate Temperature ( C) % RAP Blend Figure 4.2. Critical Intermediate Temperatures for Binder Blends. 74
92 DG1 DG Critical Low Temperature ( C) % RAP Blend Figure 4.3. Critical Low Temperatures for Binder Blends. Table 4.11 shows the results for the performance grades of the binder blends. The addition of 10% RAP binder did not change the performance grade of the binder blends. Increasing the RAP binder content to 20% only affected the DG2 blend by raising the high-temperature grade by one grade. The low temperature performance grade remained the same as the virgin asphalt binder. Finally, the use of 30% RAP binder reduced the low-temperature grade of the -4 blend by one grade, raised the high-temperature grade of the DG1 blend by one grade, and had no further effect on the DG2 and +4 blends. These results support the ETG design guidelines (8), where no PG grade change in the virgin binder is necessary for mixtures containing less than 15% RAP; mixtures containing 16 to 25% RAP require the new asphalt binder to be one grade lower than the 75
93 grade required for a virgin asphalt binder, and mixtures with over 25% RAP need to select the new asphalt binder using a blending chart. Table Performance Grades of RAP Blends. Performance Grade RAP Source % RAP blend Actual MP 1 0 PG PG PG PG PG PG PG PG DG1 DG PG PG PG PG PG PG PG PG PG PG PG PG PG PG PG PG PG PG PG PG PG PG PG PG The trends of binder properties obtained with the DSR and BBR tests in the range of 0% to 30% RAP binder in the blend were analyzed for the different mixtures in this study. The rates of change of the properties in that range were calculated to assess the impact of the RAP asphalt content in the blends. These rates were computed as the change in the binder property divided by the change in RAP content, for the entire range studied. The results are discussed below. 76
94 DSR Results Results for the rutting and fatigue parameters were analyzed for original (unaged) blends, RTFO-aged and RTFO+PAV aged blends at failing and passing temperatures. Estimated and actual critical temperatures were compared for original and aged blends. Figure 4.4 shows that, as expected, the rutting parameter G*/sinδ in the original blends was higher at the low temperature and increased with the addition of RAP binder because the old binder makes the resulting blends stiffer. The rates of increase were also higher at the low temperature (Table 4.12), with the biggest rates being that of +4 and DG2 RAP mixtures, but they were not significant for the range of RAP binder percentages used in this study (0-30%) RAP RAP C 1.6 G*/sinδ (kpa) C G*/sinδ (kpa) C 82 C % RAP Blend % RAP Blend G*/sinδ (kpa) DG1 RAP 76 C 82 C % RAP Blend G*/sinδ (kpa) DG2 RAP % RAP Blend Figure 4.4. G*/sinδ Trends for Unaged RAP Blends. 76 C 82 C 30 77
95 Table Rate of Increase in G*/sinδ for Unaged Blends. RAP Type Increase Rate (kpa/%rap) 76 C 82 C DG DG The results for RFTO-aged blends, shown in Figure 4.5 were similar to those of unaged blends. Lower temperature and higher RAP binder percentages increased G*/sinδ, but not at a high rate, as shown in Table 4.13 (increase rates smaller than 0.05kPa/%RAP). This suggests that even though the rutting parameter increases with the addition of RAP for both original and RTFO-aged blends, the rates of change are so small that the rutting resistance of the mixes is not likely to be significantly improved. 78
96 +4 RAP -4 RAP G*/sinδ (kpa) 2.0 G*/sinδ (kpa) C C 82 C 82 C % RAP Blend % RAP Blend DG1 RAP DG2 RAP G*/sinδ (kpa) 2.0 G*/sinδ (kpa) C 82 C C 82 C % RAP Blend % RAP Blend Figure 4.5. G*/sinδ Trends for RTFO-Aged RAP Blends. Table Rate of Increase in G*/sinδ for RTFO-Aged Blends. RAP Type Increase Rate (kpa/%rap) 76 C 82 C DG DG For the RFTO and PAV residues, the fatigue parameter G*sinδ increased with the addition of RAP binder (Figure 4.6). The results were considerably higher the lower temperature. Unlike the trends for the unaged and RTFO-aged blends, the rate of increase was much more significant in this case (over 25 kpa/%rap), especially for the +4 and -4 RAP blends, where the rate of increase is as high as 68.4 kpa/%rap (Table 4.14). 79
97 These results indicate that the fatigue resistance of the binder blends is highly influenced by temperature and RAP content. Addition of RAP binder may result in mixes more susceptible to fatigue cracking, especially at high temperatures. +4 RAP -4 RAP 6,500 7,000 5, C 22 C 6,000 G*sinδ (kpa) 4,500 G*sinδ (kpa) 5,000 4,000 3,500 3, C 22 C 2, % RAP Blend 2, % RAP Blend DG1 RAP DG2 RAP 6,500 6,000 5,500 5,000 G*sinδ (kpa) 4,500 G*sinδ (kpa) 4,000 3, C 3, C 22 C 22 C 2, % RAP Blend 2, % RAP Blend Figure 4.6. G*sinδ Trends for RTFO+PAV-Aged RAP Blends. Table Rate of Increase in G*sinδ for RTFO and PAV-Aged Blends. RAP Type Increase Rate (kpa/%rap) 22 C 25 C DG DG
98 BBR Results Results for creep stiffness and creep rate obtained with the bending beam rheometer were analyzed for the asphalt blends at failing and passing temperatures. Figure 4.7 shows that the creep stiffness of the blends increased with lower temperature and addition of RAP binder, although it did it at a slow rate, as seen in Table 4.15 (maximum 2.85 MPa/%RAP). In most cases, the increase rate was higher at the lower temperature (Table 4.15). The results suggest that addition of RAP is not highly influential for the creep stiffness of the binder blend at the temperatures studied (low rates of increase), but could become more significant at lower temperatures. +4 RAP -4 RAP Creep Stiffness (MPa) C -18 C Creep Stiffness (MPa) C -18 C % RAP Blend % RAP Blend DG1 RAP DG2 RAP Creep Stiffness (MPa) C -18 C Creep Stiffness (MPa) C -18 C % RAP Blend % RAP Blend 30 Figure 4.7. Creep Stiffness Trends for RAP Blends. 81
99 Table Rate of Increase in Creep Stiffness. RAP Type Increase Rate (MPa/%RAP) -18 C -12 C DG DG Figure 4.8 shows that, as expected, higher RAP binder percentages and low temperature resulted in lower creep rates. The decrease rate for these values was very small (less than MPa/%RAP) and had a maximum variation of MPa/%RAP between temperatures (Table 4.16). As with creep stiffness, the small rates of change suggest that increasing RAP content does not decrease the creep rate significantly, and that the thermal cracking resistance of the recycled binder blends will not be affected. 82
100 +4 RAP -4 RAP C -12 C C C Creep rate 0.30 Creep rate % RAP Blend % RAP Blend 30 DG1 RAP DG2 RAP C -12 C C C Creep rate 0.30 Creep rate % RAP Blend % RAP Blend 30 Figure 4.8. Creep Rate Trends for RAP Blends. Table Rate of Decrease in Creep Rate. RAP Type Decrease Rate (MPa/%RAP) -18 C -12 C DG DG MIX DESIGNS Table 4.17 shows the virgin asphalt content, total asphalt content (virgin binder plus RAP binder), voids in the mineral aggregate (VMA), and voids filled with asphalt (VFA). The mix design information for all mixtures is presented in Appendix A. The VMA values 83
101 were calculated using the effective specific gravity (G se ) of the aggregate blends, as specified by GDOT. It can be observed that the results for VMA and VFA do not change significantly with the addition of RAP or with the types of RAP used. Table Volumetric Properties of RAP Mixtures. Aggregate Source % RAP RAP Type Total AC, % VMA, % VFA, % Mt. View DG Lithia Springs Camak Ruby 30 DG DG DG DG DG DG DG One parameter that can be useful to evaluate the impact of RAP addition on mixture performance is the ratio of old binder to virgin binder, shown in Table Figure 4.9 shows that as RAP content increases, the ratio of old binder to virgin binder increases as well. When grouped by RAP type, mixes that contained -4 RAP had the highest ratio (0.19) due to the higher asphalt content present in -4 RAP (6.2%). For aggregate sources, mixes that contained Ruby aggregates had the highest ratio (0.18). Figure 4.10 shows the virgin and RAP asphalt binder contents for each mixture. 84
102 RAP Type +4-4 DG1 DG2 Table Virgin and RAP Binder Contents for SMA Mixes. % RAP Agg. Source Virgin AC, Old AC, Old AC/ % % Virgin AC 0 Camak Ruby Lithia Springs Mt. View Lithia Springs Mt. View Camak Ruby Mt. View Lithia Springs Ruby Camak Ruby Camak Mt. View Lithia Springs y = x R 2 = RAP Binder/Virgin Binder % RAP Figure 4.9. Old to New Asphalt Ratio vs RAP Content. 85
103 Table 4.19 illustrates the savings in virgin binder content for all RAP types. These savings were calculated as a percent of reduction on virgin binder compared to the control mix. Since there are four different mixes with 0% RAP (one for each aggregate source), these percentages were computed by matching the recycled SMA mix with the control mix that contained the same aggregate source. For example, the mix that contains 10% -4 RAP and Camak aggregates was compared to the control mix that contains Camak aggregates; while the mix that contains 20% -4 RAP and Mt. View aggregates was compared to the control mix that contains Mt. View aggregates, and so on. At 10% and 20% RAP, the reduction in the required virgin binder is very similar (averages of 11.7% and 10.8%, respectively). Normally, the required amount of virgin binder will decrease with RAP content, and these results can be attributed to variability in mix design. At 30% RAP the savings increase dramatically to an average of 24.1%, which would represent an important economical benefit, since asphalt cement is the most expensive component of an HMA mix. This benefit is particularly important for mixtures containing -4 RAP, where the virgin binder required is reduced in up to 35.5%. 86
104 % Binder Virgin AC RAP AC DG1 DG2 RAP Content, % Figure Asphalt Contents for SMA Mixtures. % RAP Table Savings in Virgin Binder (%) for RAP Mixtures. RAP Type DG1 DG Average PERFORMANCE TESTS Moisture Susceptibility Table 4.20 and Figure 4.11 show the wet (conditioned) and dry (unconditioned) strength values for the SMA mixes with recycled material. An analysis of variance (shown in Table 4.21) indicated that at 95% confidence level, the amount of RAP significantly influences the tensile strength (p-values < 0.001), while type of RAP has a significant effect (p-value = for dry strength and for wet strength). This was expected 87
105 because increasing the RAP content increases the amount of old binder (binder from RAP) and makes the mixture stiffer, which has an effect on the tensile strength and bond to the aggregates. The analysis of variance also indicated that the interaction between aggregate source and RAP type is significant for both conditioned and unconditioned tensile strengths (p-values < 0.001). Table Tensile Strengths for SMA Mixtures. Unconditioned RAP Type % RAP Agg. Source Tensile Strength (psi) +4-4 DG1 DG2 Conditioned Tensile Strength (psi) 0 Camak Ruby Lithia Springs Mt. View Lithia Springs Mt. View Camak Ruby Mt. View Lithia Springs Ruby Camak Ruby Camak Mt. View Lithia Springs
106 160 Wet Strength Dry Strength Strength, psi DG1 DG2 % RAP Figure Strength Values from Moisture Susceptibility Test. Table Analysis of Variance for Tensile Strengths. Factor Unconditioned Conditioned F-statistic p-value F-statistic p-value Agg. Source RAP Content RAP Type Agg. Source x RAP Type Figure 4.12 shows that strength increased as the percentage of RAP increased. This is not surprising since recycled SMA mixtures contain RAP binder that would be expected to have an effect on the mixture properties of the samples, such as increased stiffness. Table 4.22 shows the differences in tensile strengths for various RAP contents and confirms that the higher the RAP content, the more significant those differences become. This can be attributed to the higher old to new binder ratio for mixtures with higher RAP contents. 89
107 y = x R 2 = Tensile Strength, psi y = x R 2 = Unconditioned Conditioned Unconditioned 20 Conditioned % RAP Figure Effect of RAP Percentage on Tensile Strength. Table Tensile Strength Comparisons for SMA Mixes with Various RAP Contents. Unconditioned Conditioned Are differences Are differences Difference Difference % RAP significant at significant at of Means of Means 95% confidence 95% confidence (psi) (psi) level? level? No No Yes No Yes Yes No Yes No Yes Yes Yes The pairwise comparisons for tensile strengths among RAP types are shown in Table 4.23, where it can be observed that the differences among RAP types are not significant, except between mixes containing -4 RAP and mixes containing DG2 RAP. Figure 4.13 shows that recycled mixtures using -4 RAP had the highest tensile strengths (96.6 psi for conditioned and psi for unconditioned specimens), which was 90
108 expected because as mentioned earlier, these mixtures have the highest old to new binder ratio (an average of 0.19), and this increases stiffness. Recycled mixtures using DG2 RAP, have the lowest old to new binder ratio (an average of 0.12) which produces a softer binder blend, and this caused them to have the lowest tensile strengths (82.6 psi for conditioned and 87.9 psi for unconditioned specimens). Table Tensile Strength Comparisons for SMA Mixes with Various RAP Types. Unconditioned Conditioned Are differences Are differences Difference Difference RAP Type significant at significant at of Means of Means 95% confidence 95% confidence (psi) (psi) level? level? DG1 DG1 DG1 DG2 DG2-4 DG No No No No No No Yes No Yes No No No 140 Conditioned Unconditioned Strength, psi DG1 DG RAP Type Figure Strength Values for RAP Types. 91
109 Tables 4.24 and 4.25 show the difference of mean tensile strengths for the interaction term for conditioned and unconditioned specimens. The results are consistent with the trend observed for the individual factors: mixtures with higher old to new binder ratio had higher tensile strengths, such as mixtures containing Ruby aggregates and -4 RAP, which had an average ratio of 0.45 and tensile strengths up to 75.0 psi higher for unconditioned and 71.5 psi higher for conditioned specimens. Table Unconditioned Tensile Strengths Comparisons for Aggregate Source RAP Type Interaction. Difference of Means (psi) RAP Type Mt. View Lithia Spr. Camak Ruby DG1 DG1 DG1 DG2 DG2-4 DG Significant differences at 95% confidence level are in bold. Table Conditioned Tensile Strengths Comparisons for Aggregate Source RAP Type Interaction. Difference of Means (psi) RAP Type Mt. View Lithia Spr. Camak Ruby DG1 DG1 DG1 DG2 DG2-4 DG Significant differences at 95% confidence level are in bold. Tables 4.26 through 4.30 summarize the moisture susceptibility results. All mixtures contained between 0.8 and 1.0 percent of lime by total weight of mix. A minimum TSR of 0.80 is generally required by GDOT for SMA mixtures. However, a 92
110 TSR of 0.7 may be acceptable so long as all individual test values exceed 100 psi. All mixtures met or exceeded the 0.8 minimum retained strength. Table Moisture Susceptibility Results for Control Mixes. Measurement Mt. View Lithia Springs Camak Ruby Unconditioned Samples % Air voids Load, lbs 1,124 1,397 1,377 1,094 Dry S, psi Conditioned Samples % Air voids Load, lbs 1,124 1,114 1,236 1,103 Wet S, psi % Saturation TSR Table Moisture Susceptibility Results for SMA Mixes Using +4 RAP. +4 RAP Measurement 10% Ruby 20% Lithia Springs 30% Mt. View Unconditioned Samples % Air voids Load, lbs 1,628 1,367 1,661 Dry S, psi Conditioned Samples % Air voids Load, lbs 1,450 1,426 1,568 Wet S, psi % Saturation TSR
111 Table Moisture Susceptibility Results for SMA Mises Using -4 RAP. -4 RAP Measurement 10% Mt. View 20% Camak 30% Ruby Unconditioned Samples % Air voids Load, lbs 1,370 1,547 2,273 Dry S, psi Conditioned Samples % Air voids Load, lbs 1,385 1,346 2,226 Wet S, psi % Saturation TSR Table Moisture Susceptibility Results for SMA Mixes Using DG1 RAP. DG1 RAP Measurement 10% Lithia Springs 20% Ruby 30% Camak Unconditioned Samples % Air voids Load, lbs 1,313 1,305 1,960 Dry S, psi Conditioned Samples % Air voids Load, lbs 1,252 1,314 1,855 Wet S, psi % Saturation TSR Table Moisture Susceptibility Results for SMA Mixes Using DG2 RAP. DG2 RAP Measurement 10% 20% 30% Camak Mt.View Lithia Springs Unconditioned Samples % Air voids Load, lbs 1,337 1,601 1,488 Dry S, psi Conditioned Samples % Air voids Load, lbs 1,136 1,443 1,504 Wet S, psi % Saturation TSR
112 The results for the analysis of variance shown in Table 4.31 indicated that the TSR values do not change significantly with the variations in RAP content (p-value = 0.682). The analysis of variance indicated that none of the main factors had a significant effect on TSR. Table 4.32 shows that the average TSR values range from 0.93 for control mixes to 0.97 for mixes with 30% RAP content, all well above the minimum specified by GDOT. The differences in TSR are shown in Table 4.33, where it can be seen that the increase is not significant (less than 0.05). Table Analysis of Variance for TSR. Factor F-statistic p-value Agg. Source RAP Content RAP Type R 2 = 16.49% Table Average TSR Values for Various RAP Contents. RAP Content, % TSR Table Tensile Strength Ratios Comparisons for RAP Contents. Difference of Are differences significant RAP Content, % Means at 95% confidence level? No No No No No No 95
113 4.3.2 Rutting Susceptibility Table 4.34 shows the APA results. An analysis of variance (Table 4.35) indicated that aggregate source, RAP type and the interaction between RAP content and RAP type were significant factors, while RAP content did not have an effect on rutting susceptibility (pvalue = 0.720). Table 4.36 shows that the average rut depths for different RAP contents range from 3.1 mm to 3.4 mm, all below the maximum 5 mm criteria specified by GDOT. It is probable that because the rut depths were already low, RAP content did not have a significant impact on rutting performance. Table Rutting Susceptibility Results for RAP Mixtures. Aggregate RAP Rut depth, % RAP Source Type mm DG Mt. View DG Lithia DG Springs DG Camak DG DG DG Ruby DG
114 Table Analysis of Variance for Rut Depths. Factor F-statistic p-value Agg. Source RAP Content RAP Type RAP Content x RAP Type Table Average Rut Depths for Various RAP Contents. RAP Content, % Rut Depth, mm The analysis of variance (Table 4.35) suggests that rutting is highly affected by the aggregate source and the interaction between RAP content and RAP type (p-values < 0.001). RAP type also has a significant impact on rutting performance (p-value = 0.038). Figure 4.14 and Table 4.37 show that mixtures that contained Ruby aggregates had higher rut depths than the rest of the mixtures (up to 1.9 mm higher), but these results still met the design criteria and therefore there is not a practical difference in terms of rutting performance. Table Differences in Rut Depth for Aggregate Sources. Difference of Aggregate Source Means (mm) Mt. View Mt. View Mt. View Lithia Springs Lithia Springs Camak Are differences significant at 95% confidence level? Lithia Springs Camak Ruby No No Yes Camak Ruby No Yes Ruby Yes 97
115 Rut Depth, mm Mt. View Lithia Springs Camak Ruby Aggregate Source Figure Effect of Aggregate Source on Rut Depth. Figure 4.15 shows the average rut depths for various RAP types. There is no significant difference in the results among RAP types, except between mixtures with -4 RAP and mixtures with DG2 RAP (Table 4.38), which would be expected because of the difference in old to new binder ratio (0.07 higher for mixes containing -4 RAP). However, all mixtures had average rut depths below 5 mm, which means that rutting performance was not really affected by changing the RAP type. Table Rut Depth Comparisons for RAP Types. Difference of Are differences significant RAP Type Means (mm) at 95% confidence level? No No No DG1 DG1 DG1 DG2 DG2-4 DG Yes No No 98
116 Rut Depth, mm DG1 DG RAP Type Figure Average Rut Depths for Various RAP Types. Table 4.39 shows the differences in rut depth for the interaction between RAP content and RAP type. In general, specimens that contained RAP had no significant differences in rut depth when compared to the control mixtures (0% RAP). Two mixtures, one containing 20% DG1 RAP and one containing 10% +4 RAP, exhibited rut depths significantly higher (up to 3.5 mm higher than other mixtures) that also exceeded the 5 mm maximum criteria (Table 4.34). The fact that mixes with these RAP types only affected rutting performance at a particular RAP content can be attributed to test variability. 99
117 Table Rut Depths for RAP Content RAP Type Interaction. % RAP Difference of Means (mm) DG1 DG Significant differences at 95% confidence level are in bold Indirect Tensile Creep Compliance As mentioned in Section 3.3.4, the creep compliance test is used to evaluate thermal cracking resistance of the mixtures. Figures 4.16 through 4.19 show the creep compliance results at 50 seconds. It is clear that, as expected, creep compliance increases with temperature. However, there is not a clear relationship between creep compliance and RAP content in these data. Addition of RAP does not clearly change the stiffness of the mix, as characterized by the IDT creep test, suggesting that the low temperature performance would not be affected by the higher RAP content. 100
118 +4 RAP 9.0E-06 Creep t = 50 sec, 1/psi 8.0E E E E E E E C -10 C 0 C 1.0E E % RAP Figure Effect of RAP Content on Creep Compliance for Recycled Mixes Using +4 RAP. -4 RAP Creep t = 50 sec, 1/psi 4.5E E E E E E E E C -10 C 0 C 5.0E E % RAP Figure Effect of RAP Content on Creep Compliance for Recycled Mixes Using -4 RAP. 101
119 DG1 RAP Creep t = 50 sec, 1/psi 8.0E E E E E E E C -10 C 0 C 1.0E E % RAP Figure Effect of RAP Content on Creep Compliance for Recycled Mixes Using DG1 RAP. DG2 RAP Creep t = 50 sec, 1/psi 1.2E E E E E E C -10 C 0 C 0.0E % RAP Figure Effect of RAP Content on Creep Compliance for Recycled Mixes Using DG2 RAP. 102
120 +4 RAP -4 RAP 1.0E E+00 Creep Compliance, 1/psi 1.0E E E E E E-06 Control 10% RAP 20% RAP 30% RAP Creep Compliance, 1/psi 1.0E E E E E E-06 Control 10% RAP 20% RAP 30% RAP 1.0E E E E E E E+10 Reduced Time, s 1.0E E E E E E E+10 Reduced Time, s Regular RAP SMA RAP Creep Compliance, 1/psi 1.0E E E E E E E-06 Control 10% RAP 20% RAP 30% RAP Creep Compliance, 1/psi 1.0E E E E E E E-06 Control 10% RAP 20% RAP 30% RAP 1.0E E E E E E E+10 Reduced Time, s 1.0E E E E E E E+10 Reduced Time, s Figure Creep Compliance Master Curves for RAP Mixtures. The other parameter that measures thermal cracking resistance is the m-value. Figure 4.20 shows the creep compliance master curves used to calculate the m-value for each mix (Table 4.40). The m-value is obtained by fitting a power law through the master compliance curve obtained from the indirect tensile creep tests, following the procedure described in Section Mixtures with higher m-values tend to have greater resistance to thermal cracking. 103
121 Table m-values for SMA Mixes. RAP Type % RAP Agg. Source m-value 0 Camak Ruby Lithia Springs Mt. View Lithia Springs Mt. View Camak Ruby Mt. View DG1 10 Lithia Springs Ruby Camak Ruby DG2 10 Camak Mt. View Lithia Springs Table 4.41 shows that the m-value is not influenced by RAP content (p-value = 0.552) but is significantly affected by the aggregate source and RAP type. The influence of aggregate source is somewhat unexpected because thermal cracking resistance is not really defined by the aggregate properties, and is instead dictated by the binder properties. This may be attributed to the difference in mean old to new binder ratios among mixtures with different aggregate sources. Figure 4.21 shows the m-values as a function of RAP content and confirms that there is not a strong relationship between the two (R 2 = 0.29). Even though the m-value appears to decrease with RAP content (higher old to new binder ratios), the poor correlation between the two variables is not sufficient to conclude that addition of RAP would affect thermal cracking potential significantly. 104
122 Table Analysis of Variance for m-value. Factor F-statistic p-value Agg. Source RAP Content RAP Type m-value y = x R 2 = % RAP Figure Average m-values for RAP Mixtures. Tables 4.42 and 4.43 show all pairwise comparisons among levels for aggregate source and RAP type, and the effect of these variables on the m-value is shown in Figures 4.22 and It can be observed that in general, Camak and Ruby mixtures had m- values up to 0.17 higher than Mt. View and Lithia Springs mixtures. Mixtures containing DG1 RAP performed better than only -4 RAP mixtures (Table 4.43). This may be attributed to the higher amount of RAP binder present in -4 RAP mixtures and its rheological properties, which as noted earlier, indicated these binder blends were more sensitive to thermal cracking. 105
123 m-value Mt. View Lithia Springs Camak Ruby Aggregate Source Figure Effect of Aggregate Source on m-value. Table m-value Comparisons for Aggregate Sources. Aggregate Source Difference of Are differences significant Means at 95% confidence level? Lithia Springs No Camak Yes Ruby No Mt. View Mt. View Mt. View Lithia Springs Lithia Springs Camak Ruby Yes Yes Camak Ruby No 106
124 m-value DG1 DG RAP Type Figure Average m-values for RAP Types. Table m-value Comparisons for RAP Types. Difference of Are differences significant RAP Type Means at 95% confidence level? No Yes No DG1 DG1 DG1 DG2 DG2-4 DG No No No Flexural Beam Fatigue As described in the previous chapter, beams were tested at two strain levels to simulate different pavement structures. The high strain level (800 µε) simulates a thin pavement with weak structure or poor subgrade, while the low strain level (400 µε) simulates a thick pavement with adequate subgrade (6). Because low strain beams typically do not reach the termination stiffness in a reasonable amount of time, it was necessary to 107
125 establish a cut off point of 1,000,000 cycles, which allowed the test to be completed in a maximum time of nearly 28 hours. High Strain Results Table 4.44 shows the results for the high strain beams. An analysis of variance indicated that the number of cycles to failure is affected by the aggregate source and RAP content (p-values < 0.001) and the interaction of the two (p-value = 0.023). Figure 4.24 shows that as the amount of RAP increases, the number of cycles to failure decreases. As shown in Table 4.45, the fatigue life of the mixes is reduced as soon as RAP is added. This was expected because as the old to new binder ratio increases mixes become stiffer and tend to fail sooner in a constant strain test (Table 4.46). Aggregate Source Mt. View Lithia Springs Camak Ruby Table Test Results for High Strain Beams (800 µε). % RAP RAP Type Cycles to Failure Initial Stiffness (MPa) Final Stiffness (MPa) Initial Dissipated Energy (kpa) 0 DG1 45,800 2,952 1, ,143 3,169 1, DG2 31,013 4,325 2, ,880 4,315 2, ,703 3,090 1, DG1 44,877 3,411 1, ,940 3,179 1, DG2 16,753 4,949 2, ,070 3,220 1, DG2 40,947 3,221 1, ,070 3,380 1, DG1 74,760 3,433 1, DG2 72,680 3,028 1, ,933 3,141 1, DG1 21,123 3,348 1, ,273 4,798 2,
126 80,000 70,000 60,000 Cycles to Failure 50,000 40,000 30,000 20,000 10,000 y = x R 2 = % RAP Figure Number of Cycles to Failure for RAP Mixtures (800µε). Table N f Comparisons for RAP Contents (800µε). RAP Content (%) Difference of Means (Cycles) Are differences significant at 5% confidence level? Yes Yes Yes No No ,088-22,027-38, , , ,370 Yes Table Effect of RAP Binder on Fatigue Life (800 µε). % RAP Old binder/ Initial Stiffness Cycles to Failure New binder (MPa) ,313 3, ,225 3, ,287 3, ,917 4,374 Figure 4.25 shows the effect of aggregate source on fatigue life. Table 4.47 indicates that Camak mixtures reached a higher number of cycles to failure than the rest. 109
127 Camak blends did not have aggregate properties that would seem to significantly improve the fatigue resistance of the mixture; however, they had a low old to new binder ratio (an average of 0.12) and the specimens tested had lower air voids than the other beams (0.6 percent lower on average). Both properties are desirable to obtain greater fatigue life in HMA mixtures. 100,000 80,000 Cycles to Failure 60,000 40,000 20,000 0 Camak Lithia Springs Mt. View Ruby Aggregate Source Figure Effect of Aggregate Source on N f (800µε). Table N f Comparisons for Aggregate Sources (800µε). Difference of Aggregate Source Means (Cycles) Mt. View Mt. View Mt. View Lithia Springs Lithia Springs Camak Are differences significant at 5% confidence level? Lithia Springs Camak Ruby 7,859 33,002-1,957 No Yes No Camak Ruby 25,143-9,816 Yes No Ruby -34,959 Yes 110
128 Table 4.48 shows the difference of mean N f for the interaction between aggregate source and RAP content. It is important to note that the number of cycles to failure only changes significantly with RAP content for Ruby mixtures, and only at the 30% RAP level, which is expected because these mixtures have the highest old to new binder ratio (0.45). Table N f Comparisons for RAP Content Aggregate Source Interaction (800 µε). Difference of Means (Cycles) % RAP Mt. View Lithia Spr. Camak Ruby 4,343-14,787-25,920-13, ,950-51,123-21,000-17,310-31,747-51,557-68, ,130-30,263-11,133 13,063-28,123-41,187 30,123 33,813 3,690-19,810-36,660-16,850 Significant differences at 95% confidence level are in bold. As mentioned earlier, in a controlled-strain test, stiffer mixes are expected to fail earlier (lower number of cycles to failure). It can be observed that the results in Figure 4.26 followed the expected trend, and that the higher initial stiffnesses are related to higher RAP contents and higher old to new asphalt ratios (up to 0.32 on average, as previously shown in Table 4.46). An analysis of variance confirmed that the initial stiffness of the mixtures is influenced by RAP content (p-value < 0.001). Table 4.49 shows that the increase in initial stiffness becomes more significant at higher RAP contents due to the higher amount of old binder present (up to 1.5 percent by total weight of mix higher). 111
129 5,500 Initial Stiffness (MPa) 5,000 4,500 4,000 3,500 3,000 2,500 0% 10% 20% 30% y = Ln(x) R 2 = , ,000 40,000 60,000 80, , ,000 Cycles to Failure Figure Relationship between Initial Stiffness and Number of Cycles to Failure (800 µε). Table Initial Stiffness Comparisons for Recycled SMA with Various RAP Contents (800µε). Difference of Are differences significant RAP Content (%) Means (MPa) at 95% confidence level? No Yes Yes ,138.5 Yes Yes Yes The initial dissipated energy is the energy required at the beginning of the test to deflect the beam, and is an indication of the susceptibility of the mixture to fatigue damage. Mixtures that are more resistant to fatigue cracking would require a higher amount of energy to produce this damage. An analysis of variance showed that RAP content significantly affects the initial dissipated energy (p-value < 0.001). However, the 112
130 only significant difference was found for 30% RAP mixes, in which the dissipated energy was up to 0.37 MPa lower (Table 4.50). This is also related to the high old to new binder ratio (an average of 0.32) that stiffens the mix and makes it more easily damaged. Table Initial Dissipated Energy Comparisons for RAP Contents (800µε). Difference of Are differences significant RAP Content (%) Means (kpa) at 95% confidence level? No No Yes No Yes Yes Fatigue cracking is a distress that initiates at the bottom of the HMA layer where the tensile stress is the highest then propagates to the surface as one or more longitudinal cracks. Since SMA mixes are typically placed at or near the surface of the pavement, fatigue cracking may not be a major concern. Low Strain Results The results for the low strain beams are shown in Table Most tests were stopped at the cutoff point of 1,000,000 cycles, and only a few specimens reached 50% of the initial stiffness before that. The number of cycles to failure shown in Table 4.51 corresponds to the extrapolated value from the best fit curve of the N f vs stiffness plot at 50% of the initial stiffness. Because data extrapolation can be a source of error, the percent drop in initial stiffness at the end of the test (1,000,000 cycles maximum) was also included in the results. Low percentages indicate that the specimen had experienced 113
131 less damage at the end of the test and it was likely to withstand a higher number of cycles before reaching the failure point. As shown in Figure 4.27, there is a good correlation between the percent drop in stiffness and estimated N f (R 2 = 0.66). Aggregate Source Mt. View Lithia Springs Camak Ruby Table Average Test Results for Low Strain Beams. % RAP RAP Type Cycles to Failure * Initial Stiffness (MPa) % Drop in Stiffness ** Initial Dissipated Energy (kpa) 0 DG1 3,601,543 3, ,153,700 3, DG2 2,338,070 3, ,332,883 4, ,526,153 3, DG1 3,686,010 3, ,791,923 3, DG2 1,532,050 4, ,353,263 3, DG2 4,686,913 3, ,689,257 3, DG1 3,857,159 3, DG2 5,405,080 3, ,552,187 3, DG1 4,460,207 3, ,820 4, *Extrapolated values for specimens that did not reach 50% of the initial stiffness after 1,000,000 cycles. **Measured at 1,000,000 cycles. 114
132 % 10% 20% 30% % Drop in Stiffness y = Ln(x) R 2 = E E E E E E+07 Cycles to Failure Figure Relationship between Drop in Initial Stiffness at 1,000,000 Cycles and Estimated N f (400 µε). An analysis of variance indicated the main factor that influenced the number of cycles to failure was RAP content (p-value = 0.002). Again, this is related to the old to new binder ratio that increases with RAP content. Fatigue life is more affected at high ratios (over 0.3), where the number of cycles to failure was reduced by up to 2.8 million cycles (Table 4.52). Similar trends were obtained when using the percent drop in initial stiffness instead of N f. Table N f and Percent Drop Comparisons for RAP Contents (400 µε). RAP Content (%) Difference of Means (Cycles) Difference of Means (%) Are differences significant at 95% confidence level? -201,808-1,151,646-2,851, No No Yes ,838-2,649, No Yes 30-1,699, No 115
133 As with the high strain results, N f decreases with an increase in initial stiffness. Figure 4.28 shows that in general, mixtures with 30% RAP have higher initial stiffness and lower fatigue life. An analysis of variance confirmed that initial stiffness is highly influenced by RAP content (p-value < 0.001) and aggregate source (p-value = 0.001). 6,000 5,500 5,000 0% 10% 20% 30% Initial Stiffness (MPa) 4,500 4,000 3,500 3,000 2,500 y = Ln(x) R 2 = ,000 0.E+00 2.E+06 4.E+06 6.E+06 8.E+06 1.E+07 Cycles to Failure Figure Relationship between Initial Stiffness and N f (400 µε). Figure 4.29 and Table 4.53 show that mixtures that contained Camak aggregates had the lower stiffness among aggregate sources. As mentioned earlier, these mixtures have more virgin binder content (old to new asphalt ratio = 0.13), which is likely the cause of this result. Table 4.54 shows the difference of means for the initial stiffness for the interaction between RAP content and aggregate source. It was found that specimens that contained Lithia Springs and Camak aggregates (both with old to new asphalt ratios 116
134 = 0.13, lowest among aggregate sources) did not change their initial stiffness significantly with an increase in RAP content. 4,800 4,200 3,600 Initial Stiffness (MPa) 3,000 2,400 1,800 1, Camak Lithia Springs Mt. View Ruby Aggregate Source Figure Effect of Aggregate Source on Initial Stiffness (400 µε). Table Initial Stiffness Comparisons for Aggregate Sources (400 µε). Difference of Are differences significant Aggregate Source Means (MPa) at 5% confidence level? 47.6 No Yes 16.9 No Mt. View Mt. View Mt. View Lithia Springs Lithia Springs Camak Lithia Springs Camak Ruby Camak Ruby Yes No Ruby Yes 117
135 Table Initial Stiffness Comparisons for RAP Content Aggregate Source Interaction (400 µε). Difference of Means (MPa) % RAP Mt. View Lithia Spr. Camak Ruby , , ,265 1, ,050 1,226 Significant differences at 5% confidence level are in bold. For low strain specimens, the analysis of variance indicated that the dissipated energy was not influenced by any of the main factors or interaction terms at the 95% significance level. High Strain and Low Strain Comparison As expected, the average number of cycles to failure was higher for low strain samples than for high strain samples (in the order of millions of cycles higher, as shown in Figure 4.30). Mixtures with no RAP showed the best performance (N f up to 2.5 times higher than recycled mixtures, as seen in Table 4.55) because they only contain virgin binder that is less stiff. As the RAP content is increased and more old binder goes into the mix, the fatigue life of the specimens is significantly reduced for both strain levels. This is associated with an increase in initial stiffness that causes earlier failure in controlledstrain specimens. However, this increase in stiffness may not affect performance when the mixes are placed near the top of the pavement, since fatigue cracking originates at the bottom of the HMA layer. 118
136 % 10% 20% 30% Strain Level, µε , ,000 1,000,000 10,000,000 Cycles to Failure Figure Number of Cycles to Failure for High and Low Strain Levels. Table Fatigue Life Comparisons for Strain Levels. % RAP Old binder/ New binder N f (400 µε) N f (800 µε) ,313 4,721, ,225 4,519, ,287 3,569, ,917 1,870, Summary The results of this study have shown that adding RAP to an SMA mix has an impact in the sense that a portion of the total binder content corresponds to old (aged) binder. As the RAP content increases, this portion of binder increases as well. The main implication is that the stiffness of the resulting asphalt blend is higher than that of the virgin binder, and therefore mixture stiffness increases with RAP content. For RAPs with high asphalt content, such as the fine-graded portion of screened RAP, the old to new binder ratio is 119
137 higher and the effect is greater. The magnitude of the effect also depends on the properties of the RAP binder compared to the virgin binder. For the performance tests conducted in this study, the increase in stiffness caused by higher old to new asphalt ratios did not have a significant effect in most cases. Figure 4.31 shows that there is a poor correlation between old to new binder ratio and TSR (R2 = 0.08). However, all mixtures were above the minimum requirement and the TSR values increased slightly as RAP content increased; therefore moisture susceptibility was not an issue for recycled SMA mixes TSR y = x R 2 = GDOT Minumum Required RAP Binder/Virgin Binder Figure Effect of RAP Binder on TSR. Figure 4.32 shows that the rut depths were not correlated to the old to new binder ratio either (R 2 = 0.01). Still, most mixtures had average rut depths below the maximum specified by GDOT. Two recycled mixtures had results that exceeded the design criteria by no more than 0.4 mm, which could be attributed to test variability. In general, 120
138 mixtures had good rutting performance that was not significantly changed by the presence of old binder GDOT Maximum Limit Rut Depth, mm y = 0.878x R 2 = RAP Binder/Virgin Binder Figure Effect of RAP binder on Rutting Performance. Susceptibility of the mixes to thermal cracking was poorly correlated to the old to new binder ratio (R 2 = 0.02), as shown in Figure This could be due to the fact that even though the old binder content increases, there was not a significant change in the combined binder blend properties that control thermal cracking (creep stiffness and creep rate, shown in Figure 4.34). 121
139 0.70 m-value (creep compliance test) y = x R 2 = RAP Binder/Virgin Binder Figure Effect of RAP Binder on Thermal Cracking. Creep Stiffness (MPa) C -18 C y = 1.45x R 2 = y = x R 2 = % RAP Blend Creep Rate C -18 C y = x R 2 = y = x R 2 = % RAP Blend Figure Effect of RAP on Low Temperature Binder Properties. One result that was affected by the increase in the old to new binder ratio was the fatigue life of the mixes. Figure 4.34 shows that adding more RAP binder to the mixtures produces lower number of cycles to failure for specimens tested in controlled-strain mode. This occurs because the stiffness of the mix increases with higher old to new asphalt ratios. 122
140 It was observed that the fatigue life of the mixes was significantly reduced at high strain levels. However, recycled mixes are stiffer and will have less strain. Fatigue life may not be as affected unless the mixes are used in thin pavements. Also, SMA mixes are likely to be used as a surface layer, and because fatigue cracking originates at the bottom of the HMA pavement layers, it may not be a concern for this type of mixture. 100,000 10,000,000 Cycles to Failure (800 µε) 10,000 y = 72064e x R 2 = Cycles to Failure (400 µε) 1,000,000 y = 5E+06e x R 2 = , RAP Binder/Virgin Binder 100, RAP Binder/Virgin Binder Figure Effect of RAP Binder on Fatigue Life. It is important to mention that the type of RAP used in recycled mixes can also have an important influence in performance. When the fine-graded portion of the RAP was used, the amount of old binder was increased because this portion of the RAP typically has a higher asphalt content than dense-graded or coarse graded RAP. As already discussed, this results in higher stiffness of the mix. It is expected that mixes that contain fine-graded RAP will have good resistance to moisture susceptibility and permanent deformation, but low fatigue life. Thermal cracking may not be a major concern for the reasons discussed above. One benefit of using fine-graded RAP is that the virgin binder requirement can be considerably reduced, lowering the cost of the mix. 123
141 Replacing a percentage of the No. 7 stone with coarse-graded aggregate did not affect the performance of the recycled mixes significantly. The low asphalt content characteristic of coarse-graded RAP produces asphalt blends with a low old to new asphalt ratio that did not increase the stiffness of the mixes in a way that would influence performance. Moisture susceptibility, permanent deformation and thermal cracking were not a concern for mixtures containing coarse-graded RAP. Fatigue life may be reduced depending on the RAP content used. The advantage of substituting virgin material with RAP aggregate is that recycled aggregates could be used if quarries were faced with a critical supply shortage of No. 7 stone due to its high demand, and still obtain a mix with characteristics similar to those of a virgin SMA mix. The feasibility of using RAP from reclaimed SMA could not be evaluated conclusively. The SMA RAP received for this project did not match some of the characteristics of an SMA mix (asphalt content, percent passing the No. 4 sieve). This has been partially attributed to circumstances that occurred during the milling process and the fact that the material was crushed to have 100 percent passing the 12.5 mm sieve. The resulting RAP was more similar to a dense-graded mix with low asphalt content. No general conclusions can be made unless it is assured that the same conditions would be repeated as part of a standard procedure for this type of RAP. 124
142 CHAPTER 5. CONCLUSIONS AND RECOMMENDATIONS The following general conclusions and recommendations were obtained from this research: Tests on the aggregate properties of the combined blends indicated that addition of RAP changes the LA abrasion and F/E particle content depending on the properties of the RAP aggregates in relation to the virgin aggregates. However, for the aggregates and RAPs tested the change was not significant up to 30% RAP. Use of RAP changed the engineering properties of the resulting binder blends due to the increased old to new binder ratio. The stiffness of the binder blend (G*/sinδ, G*sinδ and creep stiffness) increases with RAP content, particularly increasing the fatigue cracking potential. The volumetric properties of the mix (air voids, VMA and VFA) were met with all of the RAP stockpiles and various RAP contents. RAP content influenced only the tensile strength and fatigue life (N f ) of the mixtures. Increasing RAP content resulted in higher tensile strengths (conditioned and unconditioned) and lower number of cycles to failure. It can be concluded that RAP content significantly affects only the fatigue performance of the mixtures, especially at high strain levels. 125
143 Separating the RAP into fine and coarse-graded fractions produced two stockpiles with different properties. The fine-graded portion had a high asphalt content and therefore, produced mixes with high old to new binder ratios. Additionally, finegraded RAP contains more material passing the No. 200 sieve, which must be accounted for during mix design. The coarse-graded portion had lower asphalt content, which indicates that mixtures containing this material will have a lower amount of old binder and less increase in stiffness. Use of fine-graded RAP reduced the virgin binder requirements due its high asphalt content, which translates into increased economic benefits. However, mixes that contain fine-graded graded RAP are stiffer because they have higher old to new binder ratios and are more susceptible to fatigue cracking. Use of coarse-graded RAP allowed reducing the No. 7 stone requirement without affecting the performance of the mixes. This may be beneficial in the case that quarries were faced with a shortage due to the high demand of this material. It is uncertain whether SMA pavement material can be successfully recycled back into an SMA mixture. The reclaimed asphalt used in this study had a mix gradation resembled a dense-graded mix and it had low asphalt content. Unless the same conditions are always repeated as part of a standard procedure for this material, it can not be assured that mixes containing recycled SMA will perform similar to other recycled mixes. Because fatigue cracking is the main concern for recycled mixtures and this distress originates at the bottom of the HMA layer, it is recommended that SMA 126
144 mixes containing RAP be used primarily in the top layers of the pavement. Also, a good bond between the SMA layer and the underlying material must be provided. Adding RAP up to 30% had little effect on the low temperature PG properties. The low temperature grade of the combined binder blends was raised by one grade on only one of the cases. This may indicate that the grade of virgin binder does not have to be adjusted to provide the desired properties. 127
145 REFERENCES 1. Beyond Roads, Questions and Answers. Asphalt Education Partnership. da.html. Accessed March 15 th, Summary of Georgia s Experience with Stone Matrix Asphalt Mixes. Georgia Department of Transportation. Accessed February 21 st, Brown, E.R., R.B. Mallick, J. E. Haddock and J. Bukowski. Performance of Stone Matrix Asphalt (SMA) Mixtures in the United States. National Center for Asphalt Technology, Report No , Jan Watson, D. E. Updated Review of Stone Matrix Asphalt and Superpave Projects. In Transportation Research Record 1832, TRB, National Research Council, Washington, D.C., 2003, pp Brown, E.R., R.B. Mallick, J. E. Haddock and T.A. Lynn. Development of a Mixture Design Procedure for Stone Matrix Asphalt (SMA). National Center for Asphalt Technology, Report No , March McDaniel, R.S., H. Soleymani, R.M. Anderson, P. Turner, and R. Peterson. Recommended Use of Reclaimed Asphalt Pavement in the Superpave Mix Design 128
146 Method. Contractor s Final Report. NCHRP Web Document 30 (Project D9-12) Huang, B., G. Li, D. Vukosavljevic, X. Shu, and B.K. Egan. Laboratory Investigation of Mixing Hot-Mix Asphalt with Reclaimed Asphalt Pavement. In Transportation Research Record 1929, TRB, National Research Council, Washington, D.C., 2005, pp Kandhal, P.S. and K.Y. Foo. Designing Recycled Hot Mix Asphalt Mixtures Using Superpave Technology. National Center for Asphalt Technology, Report No , Jan Bukowski, J. R., Guidelines for the Design of Superpave Mixtures Containing Reclaimed Asphalt Pavement (RAP), Memorandum, ETG Meeting, FHWA Superpave Mixtures Expert Task Group, San Antonio, Texas, March, Kennedy T.W., W.O. Tam, and M. Solaimanian. Effect of Reclaimed Asphalt Pavement on Binder Properties Using the Superpave System. Center for Transportation Research, Bureau of Engineering Research, The University of Texas at Austin. Research Report , September Abdulshafi, O., B. Kedzierki, and M.G. Fitch. Determination of Recycled Asphalt Pavement (RAP) Content in Asphalt Mixes Based on Expected Mixture Durability. Ohio State University. December, Li X., T.R. Clyne, and M.O. Marasteanu. Recycyled Asphalt Pavement (RAP) Effects on Binder and Mixture Quality. Minnesota Department of Transportation. July,
147 13. Stroup-Gardiner M. and C. Wagner. Use of RAP in Superpave HMA Applications. In Transportation Research Record 1681, TRB, National Research Council, Washington, D.C., 1999, pp Daniel, J.S., and A. Lachance. Mechanistic and Volumetric Properties of Asphalt Mixtures with Recycled Asphalt Pavement. In Transportation Research Record 1929, TRB, National Research Council, Washington, D.C., 2005, pp Tam, K.K., P. Joseph, and D.F. Lynch. Five Year Experience of Low- Temperature Performance of Recycled Hot Mix. In Transportation Research Record 1362, TRB, National Research Council, Washington, D.C., 1992, pp McDaniel, R.S., A. Sha, G.A. Huber, and V.L. Gallivan. Investigation of Properties of Plant-Produced RAP Mixtures. Transportation Research Board Annual Meeting 2007 Paper # Huang, B., W.R. Kingery, and Z. Zhang. Laboratory Study of Fatigue Characteristics of HMA Mixtures Containing RAP. Presented at the International Symposium on Design and Construction of Long Lasting Asphalt Pavements, Auburn, AL. June, Puttagunta, R., S.Y. Oloo, and A.T. Bergan. A Comparison of the Predicted Performance of Virgin and Recycled Mixes. Canadian Journal of Civil Engineering. Vol. 24, National Research Council of Canada, Ottawa pp
148 19. Sargious, M. and N. Mushule. Behaviour of Recycled Asphalt Pavements at Low Temperatures. Canadian Journal of Civil Engineering. Vol. 18, National Research Council of Canada, Ottawa pp McGennis, R.B., S. Shuler, and H.U. Bahia. Background of Superpave Asphalt Binder Test Methods. FHWA, Report No. FHWA-SA , July Roberts, F.L., P.S. Kandhal, E.R. Brown, D.Y. Lee, T.W. Kennedy. Hot Mix Asphalt Materials, Mixture Design and Construction. National Asphalt Pavement Association Research and Education Foundation, Kandhal, P.S. and F. Parker. Aggregate Tests Related to Asphalt Concrete Performance in Pavements. National Cooperative Highway Research Program NCHRP Report No. 405, Strategic Highway Research Program Report SHRP-A-357. Development and Validation of Performance Prediction Models and Specifications for Asphalt Binders and Paving Mixes. Strategic Highway Research Program, National Research Council, Washington D.C., Kandhal, P.S. Accelerated Laboratory Rutting Tests: Evaluation of the Asphalt Pavement Analyzer. National Cooperative Highway Research Program NCHRP Report No. 508, Strategic Highway Research Program Report SHRP-A-404. Fatigue Response of Asphalt-Aggregate Mixes. Strategic Highway Research Program, National Research Council, Washington D.C.,
149 26. Christensen, D. Analysis of Creep Data from Indirect Tension Test on Asphalt Concrete. Asphalt Paving Technology. Volume 67, Journal of the Association of Asphalt Paving Technologists, St. Paul, MN, pp
150 APPENDIX A Laboratory Mix Designs 133
151 A.1 Mix Designs for Mt. View Mixtures Mt. View 0% RAP Aggregate Components Sieve size M10 Marble dust Lime Blend Proportions 68.0% 12.0% 13.0% 6.0% 1.0% 100% 1" /4" /2" /8" # # # # # # # Series % AC VMA VFA Mt. View 10% -4 RAP Aggregate Components Sieve size M10 Marble dust Lime RAP Blend Proportions 77.0% 0.0% 7.0% 5.0% 1.0% 10.0% 100% 1" /4" /2" /8" # # # # # # # Series % AC VMA VFA
152 Air Voids VMA %AC %AC VFA %AC Mt. View 20% DG2 RAP Aggregate Components Sieve size M10 Marble dust Lime RAP Blend Proportions 67.0% 7.0% 0.0% 4.8% 0.9% 20.3% 100% 1" /4" /2" /8" # # # # # # # Series % AC VMA VFA
153 Air Voids VMA %AC %AC VFA %AC Mt. View 30% +4 RAP Aggregate Components Sieve size M10 Marble dust Lime RAP Blend Proportions 58.7% 0.0% 5% 5% 0.8% 30.5% 100% 1" /4" /2" /8" # # # # # # # Series % AC VMA VFA
154 Air Voids VMA %AC %AC VFA %AC A.2 Mix Designs for Lithia Springs Mixtures Lithia Springs 0% RAP Aggregate Components Sieve size Marble dust Lime Blend Proportions 67.0% 13.0% 13.0% 6.0% 1.0% 100% 1" /4" /2" /8" # # # # # # # Series % AC VMA VFA
155 Lithia Springs 10% DG1 RAP Aggregate Components Sieve size Marble dust Lime RAP Blend Proportions 71.9% 0.0% 12.6% 4.5% 1.0% 10.0% 100% 1" /4" /2" /8" # # # # # # # Series % AC VMA VFA Air Voids VMA %AC %AC VFA %AC 138
156 Lithia Springs 20% +4 RAP Aggregate Components Sieve size Marble dust Lime RAP Blend Proportions 61.8% 0.0% 12.0% 5.0% 0.9% 20.3% 100% 1" /4" /2" /8" # # # # # # # Series % AC VMA VFA Air Voids VMA %AC %AC VFA %AC 139
157 Lithia Springs 30% DG2 RAP Aggregate Components Sieve size Marble dust Lime RAP Blend Proportions 65.7% 0.0% 0.0% 3.0% 0.8% 30.5% 100% 1" /4" /2" /8" # # # # # # # Series % AC VMA VFA Air Voids 3.5 VMA %AC %AC VFA %AC 140
158 A.3 Mix Designs for Camak Mixtures Camak 0% RAP Aggregate Components Sieve size 007 M10 Marble dust Lime Blend Proportions 83.0% 10.0% 6.0% 1.0% 100% 1" /4" /2" /8" # # # # # # # Series % AC VMA VFA Camak 10% DG2 RAP Aggregate Components Sieve size Marble 007 M10 dust Lime RAP Blend Proportions 73.0% 11.0% 4.9% 0.9% 10.2% 100% 1" /4" /2" /8" # # # # # # # Series % AC VMA VFA
159 Air Voids VMA %AC %AC VFA %AC Camak 20% -4 RAP Aggregate Components Sieve size Marble 007 M10 dust Lime RAP Blend Proportions 75.1% 0.0% 4.0% 0.9% 20.0% 100% 1" /4" /2" /8" # # # # # # # Series % AC VMA VFA
160 Air Voids VMA %AC %AC VFA %AC Camak 30% DG1 RAP Aggregate Components Sieve size Marble 007 M10 dust Lime RAP Blend Proportions 65.6% 0.0% 3.5% 0.8% 30.1% 100% 1" /4" /2" /8" # # # # # # # Series % AC VMA VFA
161 Air Voids VMA %AC %AC VFA %AC A.4 Mix Designs for Ruby Mixtures Ruby 0% RAP Aggregate Components Sieve size 007 M10 Marble dust Lime Blend Proportions 77.0% 18.0% 4.0% 1.0% 100% 1" /4" /2" /8" # # # # # # # Series % AC VMA VFA
162 Ruby 10% +4 RAP Aggregate Components Sieve size Marble 007 M10 dust Lime RAP Blend Proportions 69.9% 15.0% 4.0% 0.9% 10.2% 100% 1" /4" /2" /8" # # # # # # # Series % AC VMA VFA Air Voids VMA %AC %AC VFA %AC 145
163 Ruby 20% DG1 RAP Aggregate Components Sieve size Marble 007 M10 dust Lime RAP Blend Proportions 70.0% 5.0% 4.0% 0.9% 20.1% 100% 1" /4" /2" /8" # # # # # # # Series % AC VMA VFA Air Voids VMA %AC %AC VFA %AC 146
164 Ruby 30% -4 RAP Aggregate Components Sieve size Marble 007 M10 dust Lime RAP Blend Proportions 66.7% 0.0% 2.5% 0.9% 29.9% 100% 1" /4" /2" /8" # # # # # # # Series % AC VMA VFA Air Voids VMA %AC %AC VFA %AC 147
165 APPENDIX B Individual Test Results 148
166 Table B.1. Results from Moisture Susceptibility Test. Agg. Source % RAP RAP Type % Air Voids 149 Wet Strength, psi Dry Strength, psi Mt. View 0 DG Mt. View 0 DG Mt. View 0 DG Mt. View Mt. View Mt. View Mt. View 20 DG Mt. View 20 DG Mt. View 20 DG Mt. View Mt. View Mt. View Lithia Spr Lithia Spr Lithia Spr Lithia Spr. 10 DG Lithia Spr. 10 DG Lithia Spr. 10 DG Lithia Spr Lithia Spr Lithia Spr Lithia Spr. 30 DG Lithia Spr. 30 DG Lithia Spr. 30 DG Camak Camak Camak Camak 10 DG Camak 10 DG Camak 10 DG Camak Camak Camak Camak 30 DG Camak 30 DG Camak 30 DG Ruby 0 DG Ruby 0 DG Ruby 0 DG Ruby Ruby Ruby Ruby 20 DG Ruby 20 DG Ruby 20 DG Ruby Ruby Ruby TSR
167 Table B.2. Results from Rutting Susceptibility Test. Agg. Source % RAP RAP Type % Air Voids Rut Depth, mm Mt. View 0 DG Mt. View 0 DG Mt. View 0 DG Mt. View 0 DG Mt. View 0 DG Mt. View 0 DG Mt. View Mt. View Mt. View Mt. View Mt. View Mt. View Mt. View 20 DG Mt. View 20 DG Mt. View 20 DG Mt. View 20 DG Mt. View 20 DG Mt. View 20 DG Mt. View Mt. View Mt. View Mt. View Mt. View Mt. View Lithia Spr Lithia Spr Lithia Spr Lithia Spr Lithia Spr Lithia Spr Lithia Spr. 10 DG Lithia Spr. 10 DG Lithia Spr. 10 DG Lithia Spr. 10 DG Lithia Spr. 10 DG Lithia Spr. 10 DG Lithia Spr Lithia Spr Lithia Spr Lithia Spr Lithia Spr Lithia Spr Lithia Spr. 30 DG Lithia Spr. 30 DG Lithia Spr. 30 DG Lithia Spr. 30 DG Lithia Spr. 30 DG Lithia Spr. 30 DG
168 Table B.2 (cont.). Results from Rutting Susceptibility Test. Agg. Source % RAP RAP Type % Air Voids Rut Depth, mm Camak Camak Camak Camak Camak Camak Camak 10 DG Camak 10 DG Camak 10 DG Camak 10 DG Camak 10 DG Camak 10 DG Camak Camak Camak Camak Camak Camak Camak 30 DG Camak 30 DG Camak 30 DG Camak 30 DG Camak 30 DG Camak 30 DG Ruby 0 DG Ruby 0 DG Ruby 0 DG Ruby 0 DG Ruby 0 DG Ruby 0 DG Ruby Ruby Ruby Ruby Ruby Ruby Ruby 20 DG Ruby 20 DG Ruby 20 DG Ruby 20 DG Ruby 20 DG Ruby 20 DG Ruby Ruby Ruby Ruby Ruby Ruby
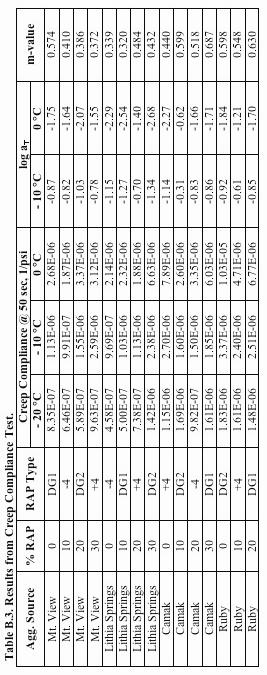
169 152
DEVELOPMENT OF A MIXTURE DESIGN PROCEDURE FOR STONE MATRIX ASPHALT (SMA)
") NCAT Report 97-03 DEVELOPMENT OF A MIXTURE DESIGN PROCEDURE FOR STONE MATRIX ASPHALT (SMA) By E.R. Brown John E. Haddock Rajib B. Mallick Todd A. Lynn March 1997 277 Technology Parkway Auburn, AL 36830
NCAT Report 97-03 DEVELOPMENT OF A MIXTURE DESIGN PROCEDURE FOR STONE MATRIX ASPHALT (SMA) By E.R. Brown John E. Haddock Rajib B. Mallick Todd A. Lynn March 1997 277 Technology Parkway Auburn, AL 36830
DESIGNING RECYCLED HOT MIX ASPHALT MIXTURES USING SUPERPAVE TECHNOLOGY
 NCAT Report 96-05 DESIGNING RECYCLED HOT MIX ASPHALT MIXTURES USING SUPERPAVE TECHNOLOGY By Prithvi S. Kandhal Kee Y. Foo January 1997 277 Technology Parkway Auburn, AL 36830 DESIGNING RECYCLED HOT MIX
Foreword... iii Table of Contents...v List of Figures...vii List of Tables...viii. Chapter 1 : Background...1
 Foreword... iii Table of Contents...v List of Figures...vii List of Tables...viii Chapter 1 : Background...1 Introduction...1 Asphalt Mixtures... 2 Asphalt Binder Behavior... 2 Mineral Aggregate Behavior...
Dynamic Shear Rheometer: DSR
 1 Dynamic Shear Rheometer: DSR Load Dynamic loading vs. static loading. Load Load Time Time Time Static Loading Dynamic Loading Types of loading. Compression, area is normal to load direction Tension,
PRI Asphalt Technologies, Inc.
 in Tampa, Florida, USA has demonstrated proficiency for the testing of construction materials and has conformed to the requirements established in AASHTO R 18 and the AASHTO Accreditation policies established
PERFROMANCE EVALUATION OF ASPHALT PAVEMENT MIXES IN IDAHO CONTAINING HIGH PERCENTAGES FOR RECYCLED ASPHALT PAVEMENT (RAP)
") PERFROMANCE EVALUATION OF ASPHALT PAVEMENT MIXES IN IDAHO CONTAINING HIGH PERCENTAGES FOR RECYCLED ASPHALT PAVEMENT (RAP) Haifang Wen, PhD, PE Kun Zhang, Graduate Student Washington State University Fouad
PERFROMANCE EVALUATION OF ASPHALT PAVEMENT MIXES IN IDAHO CONTAINING HIGH PERCENTAGES FOR RECYCLED ASPHALT PAVEMENT (RAP) Haifang Wen, PhD, PE Kun Zhang, Graduate Student Washington State University Fouad
APPENDIX A DRAFT PERFORMANCE-BASED MIX DESIGN PROCEDURE FOR POROUS FRICTION COURSE
 APPENDIX A DRAFT PERFORMANCE-BASED MIX DESIGN PROCEDURE FOR POROUS FRICTION COURSE Standard Practice for Permeable Friction Course (PFC) Mix Design AASHTO Designation: 1. SCOPE 1.1 This standard covers
Good Performing RAP/RAS mixes. Brian Prowell, PhD, PE
 Good Performing RAP/RAS mixes Brian Prowell, PhD, PE 1997 Virginia Asphalt Association Survey: What determines % of RAP used? 10% of producers said specification limits set by VDOT (20% surface, 25% base).
DESIGN, CONSTRUCTION, AND PERFORMANCE OF NEW- GENERATION OPEN-GRADED FRICTION COURSES
 NCAT Report 00-01 DESIGN, CONSTRUCTION, AND PERFORMANCE OF NEW- GENERATION OPEN-GRADED FRICTION COURSES By Rajib B. Mallick Prithvi S. Kandhal L. Allen Cooley, Jr. Donald E. Watson April 2000 Paper prepared
Using RAP in the Superpave Mix Design System
 Using RAP in the Superpave Mix Design System Mike Anderson, Asphalt Institute CUPGA 2005 Victoria, BC November 6, 2005 Acknowledgments Becky McDaniel, Purdue University Principal Investigator, NCHRP 9-12
Effect of Crumb Rubber Particle Size and Content On The Low Temperature Rheological Properties of Binders
 Effect of Crumb Rubber Particle Size and Content On The Low Temperature Rheological Properties of Binders Authors: Venu T. Gopal 1 Peter E. Sebaaly 2 Jon Epps 3 A Paper Submitted for Publication Transportation
the extraction/recovery process. The various combinations of extraction procedure, recovery
 CHAPTER THREE INTERPRETATION, APPRAISAL, APPLICATIONS SUMMARY OF BINDER EXTRACTION REVIEW Existing extraction and recovery procedures were evaluated to determine their accuracy, precision, speed and ease
ROARING FORK & EAGLE VALLEY (RFEV) SECTION 4 ASPHALT MIXTURE REQUIRMENTS
 SECTION 4 ASPHALT MIXTURE REQUIRMENTS") ROARING FORK & EAGLE VALLEY (RFEV) SECTION 4 ASPHALT MIXTURE REQUIRMENTS DEFINITION OF TERMS Wherever the following abbreviations are used in the specifications or other Contract documents, the intent
ROARING FORK & EAGLE VALLEY (RFEV) SECTION 4 ASPHALT MIXTURE REQUIRMENTS DEFINITION OF TERMS Wherever the following abbreviations are used in the specifications or other Contract documents, the intent
MIX DESIGN FOR HMA RECYCLING. Rebecca McDaniel North Central Superpave Center
 MIX DESIGN FOR HMA RECYCLING Rebecca McDaniel North Central Superpave Center Pavement Performance Prediction Symposium 2008 Laramie, Wyoming July 16, 2008 PRESENTATION OUTLINE Outline current practice
Improving Hot Mix Asphalt Performance with SUPERPAVE
 Improving Hot Mix Asphalt Performance with SUPERPAVE A Driving Force In Asphalt SUPERPAVE Update for Intevep April 8, 2002 Asphalt Mixture Behavior SP Permanent Deformation Fatigue Cracking Low Temperature
Topics. Let s talk about. Hot Mix Asphalt Materials and Mix Design. Traffic Loading (ESALs) Definitions 7/6/2010
 Definitions 7/6/2010") Topics WisDOT/WAPA Asphalt Pavement Project Manager Training June 2010 HMA Materials and Mix Design HMA Plant Overview Hauling, Laydown and Compaction Quality Management Program Overlay Applications and
Topics WisDOT/WAPA Asphalt Pavement Project Manager Training June 2010 HMA Materials and Mix Design HMA Plant Overview Hauling, Laydown and Compaction Quality Management Program Overlay Applications and
FHWA-Central Federal Lands Highway Division
 in Denver, Colorado, USA has demonstrated proficiency for the testing of construction materials and has conformed to the requirements established in AASHTO R 18 and the AASHTO Accreditation policies established
AF2903 Road Construction and Maintenance. Asphalt Binder Characterization
 AF2903 Road Construction and Maintenance Asphalt Binder Characterization Royal Institute of Technology, Stockholm, 25April th March, 11 th 2013 2014 Ali Azhar Butt PhD Candidate Highway and Railway Engineering
Comparing the Performance of Granular and Extracted Binder from Buton Rock Asphalt
 Technical Paper ISSN 1997-14 Int. J. Pavement Res. Technol. 7(1):25-3 Copyright @ Chinese Society of Pavement Engineering Comparing the Performance of and Extracted Binder from Buton Rock Asphalt Kemas
Appendix E NCHRP Project Experimental Plans, Results, and Analyses
 Appendix E NCHRP Project 09-43 Experimental Plans, Results, and Analyses E-1 Table of Contents Table of Contents... 3 List of Figures... 3 List of Tables... 6 E1. Introduction... 9 E2. Sample Reheating
ODOT Research Executive Summary Report State Job Number:
 Ohio Department of Transportation Office of Statewide Planning & Research Research Section 1980 West Broad Street, Mail Stop 3280 Columbus, OH 43223 614-644-8135 Research@dot.state.oh.us www.dot.state.oh.us/research
Asphalt 101 Materials: HMA Part 1. Rocky Mountain Asphalt Conference and Equipment Show. February 18, 2009
 Asphalt 101 Materials: HMA Part 1 Rocky Mountain Asphalt Conference and Equipment Show February 18, 2009 1 SUPERPAVE Achieving Performance 2 Weak Behavior Hot Behavior Cold Behavior 3 SPECIFYING PERFORMANCE
USE OF RECLAIMED ASPHALT PAVEMENTS (RAP) IN AIRFIELDS HMA PAVEMENTS
 IN AIRFIELDS HMA PAVEMENTS") USE OF RECLAIMED ASPHALT PAVEMENTS (RAP) IN AIRFIELDS HMA PAVEMENTS AIRFIELD ASPHALT PAVEMENT TECHNOLOGY PROGRAM Auburn University, 277 Technology Parkway Auburn, AL, 36830 AAPTP Project No. 05-06 July,
USE OF RECLAIMED ASPHALT PAVEMENTS (RAP) IN AIRFIELDS HMA PAVEMENTS AIRFIELD ASPHALT PAVEMENT TECHNOLOGY PROGRAM Auburn University, 277 Technology Parkway Auburn, AL, 36830 AAPTP Project No. 05-06 July,
FHWA-Western Federal Lands Highway Division
 in Vancouver, Washington, USA has demonstrated proficiency for the testing of construction materials and has conformed to the requirements established in AASHTO R 18 and the AASHTO Accreditation policies
Materials for Civil and Construction Engineers
 Materials for Civil and Construction Engineers CHAPTER 9 Asphalt Binders and Asphalt Mixtures Bituminous Materials Asphalt Natural or Refined from petroleum oil Tar Asphalt Cement Cutback Emulsion 2 Source
NCAT Report 17-03R EFFECT OF FLAT AND ELONGATED AGGREGATE ON STONE MATRIX ASPHALT PERFORMANCE. By Donald E. Watson Grant Julian
 NCAT Report 17-03R EFFECT OF FLAT AND ELONGATED AGGREGATE ON STONE MATRIX ASPHALT PERFORMANCE By Donald E. Watson Grant Julian April 2017 (Revised July 2017) i EFFECT OF FLAT AND ELONGATED AGGREGATE ON
LABORATORY TEST METHODS TO UNIQUELY CHARACTERIZE THE PRESENCE AND CONTRIBUTION OF SBS MODIFIERS ON THE CRACKING PERFORMANCE OF ASPHALT MIXTURES
 LABORATORY TEST METHODS TO UNIQUELY CHARACTERIZE THE PRESENCE AND CONTRIBUTION OF SBS MODIFIERS ON THE CRACKING PERFORMANCE OF ASPHALT MIXTURES Booil Kim, Reynaldo Roque, Bjorn Birgisson, and Jaeseung
Moving Towards Balanced Mix Design for Asphalt Mixtures
 Moving Towards Balanced Mix Design for Asphalt Mixtures What is Balanced Mix Design? In September 2015, the FHWA Expert Task Group on Mixtures and Construction formed a Balanced Mix Design Task Force.
Use of Reclaimed Asphalt Pavement (RAP) Under Superpave Specifications
 Under Superpave Specifications") Use of Reclaimed Asphalt Pavement (RAP) Under Superpave Specifications Final Report A Regional Pooled Fund Project Sponsored by: Illinois Department of Transportation Indiana Department of Transportation
Use of Reclaimed Asphalt Pavement (RAP) Under Superpave Specifications Final Report A Regional Pooled Fund Project Sponsored by: Illinois Department of Transportation Indiana Department of Transportation
NCAT LABORATORY EVALUATION OF SYLVAROADTM RP 1000 REJUVENATOR
 NCAT Report 15-03 LABORATORY EVALUATION OF SYLVAROAD TM RP 1000 REJUVENATOR Phase I By Pamela Turner Adam Taylor, P.E. Nam Tran, Ph.D., P.E., LEED GA June 2015 LABORATORY EVALUATION OF SYLVAROAD TM RP
Overview of Current RAP Research. RAP ETG May 4, 2007
 Overview of Current RAP Research RAP ETG May 4, 2007 RAP RAP can be cost effective and environmentally friendly BUT.. Variability of material Compactibility and workability Designing mix Variability RAP
LABORATORY REFINEMENT OF 4.75 mm SUPERPAVE DESIGNED ASPAHLT MIXTURES
 LABORATORY REFINEMENT OF 4.75 mm SUPERPAVE DESIGNED ASPAHLT MIXTURES Except where referenced is made to the work of others, the work described in this thesis is my own or was done in collaboration with
Asphalt 101 Materials: HMA Part 1. Rocky Mountain Asphalt Conference and Equipment Show. February 24, 2011
 Asphalt 101 Materials: HMA Part 1 Rocky Mountain Asphalt Conference and Equipment Show February 24, 2011 1 SUPERPAVE 2 SUPERPAVE 2 SPECIFYING PERFORMANCE Based on Climate PG 58-28 Performance Grade Min
Reclaimed Asphalt Pavement in Asphalt Mixtures: State of The Practice
 Chapter 3 - Reclaimed Asphalt Pavement in Asphalt Mixtures: State of The Practice, Apri... Page 1 of 15 Research Home Pavements Home This report is an archived publication and may contain dated technical,
Fractionation of recycled asphalt pavement materials: improvement of volumetric mix design driteria for High-RAP content surface mixtures
 University of Iowa Iowa Research Online Theses and Dissertations Summer 2012 Fractionation of recycled asphalt pavement materials: improvement of volumetric mix design driteria for High-RAP content surface
2014 Local Roads Workshop
 2014 Local Roads Workshop February & March, 2014 MICHIGAN RIDES ON US 2937 Atrium Drive, Suite 202 Okemos, MI 48864 517-323-7800 www.apa-mi.org History Performance Graded Binders MDOT Local Agency Guide
Performance Characteristics of Liquid and Lime-Treated Asphalt Mixtures
 Performance Characteristics of Liquid and Lime-Treated Asphalt Mixtures P. Sebaaly & E. Hajj Department of Civil& Env. Engineering,University of Nevada, Reno, Nevada, USA ABSTRACT: An extensive laboratory
DESIGN OF BITUMINOUS MIXTURES
 Test Procedure for DESIGN OF BITUMINOUS MIXTURES TxDOT Designation: Tex-204-F Effective Date: August 2016 1. SCOPE 1.1 Use the methods in this procedure to determine the proper proportions of approved
Lecture 6 Characterization of Asphaltic Materials. Part 1-General Concepts
 Lecture 6 Characterization of Asphaltic Materials Part 1-General Concepts Introduction Asphalt concrete is basically a mixture of asphalt binder and aggregates, hot-mixed in an asphalt plant and then hot-laid
Stone Matrix Asphalt Best Management Practices
 Stone Matrix Asphalt Best Management Practices 60 th Annual Asphalt Contractors Workshop MN Quality Initiative Workshop March 2, 2016 Brooklyn Center, MN 1 Copyright 2012 Daniel J Edelman Inc. Intelligent
Chapter 6 Tex-204-F, Design of Bituminous Mixtures
 Chapter 6 Tex-204-F, Design of Bituminous Contents: Section 1 Overview... 6-3 Section 2 Automated Mix Design Report Format... 6-4 Section 3 Procedure... 6-5 Section 4 Part I, Typical Example of Design
THE EFFECT OF SBS ASPHALT MODIFIER ON HOT MIX ASPHALT (HMA) MIXTURE CRACKING RESISTANCE
 MIXTURE CRACKING RESISTANCE") THE EFFECT OF SBS ASPHALT MODIFIER ON HOT MIX ASPHALT (HMA) MIXTURE CRACKING RESISTANCE Birgisson Bjorn Associate Professor University of Florida. bbirg@ce.ufl.edu Montepara Antonio Full Professor University
THE EFFECT OF SBS ASPHALT MODIFIER ON HOT MIX ASPHALT (HMA) MIXTURE CRACKING RESISTANCE Birgisson Bjorn Associate Professor University of Florida. bbirg@ce.ufl.edu Montepara Antonio Full Professor University
Material Test Framework for Warm Mix Asphalt Trials
 Material Test Framework for Warm Mix Asphalt Trials A number of new processes have been developed to allow asphalt mixtures to be mixed and compacted at lower temperatures. These processes tend to reduce
SEAUPG 2004 Conference - Baton Rouge Polymer Modified Asphalts
 SEAUPG 24 Conference - Baton Rouge Investigation of the Use of Recycled Polymer Modified Asphalt in Asphaltic Concrete Pavements Chris Abadie for Dr. Mohammad Louisiana Transportation Research Center Presentation
High Reclaimed Asphalt Pavement in hot mix asphalt
 Rowan University Rowan Digital Works Theses and Dissertations 6-1-2012 High Reclaimed Asphalt Pavement in hot mix asphalt Alan Norton Jr Follow this and additional works at: http://rdw.rowan.edu/etd Part
Warm Mix Asphalt Evaluation Protocol. Brian D. Prowell, P.E. Graham C. Hurley
 Warm Mix Asphalt Evaluation Protocol Brian D. Prowell, P.E. Graham C. Hurley Why Warm Asphalt? Reduce production and laydown temperatures Reduce emissions Reduce energy costs Reduce aging of binder Other
Recycled Asphalt Shingles in Hot Mix Asphalt. Mihai Marasteanu,Adam Zofka,Jim McGraw, Dan Krivit,Roger Olson,
 Recycled Asphalt Shingles in Hot Mix Asphalt Mihai Marasteanu,Adam Zofka,Jim McGraw, Dan Krivit,Roger Olson, Background Using recycled asphalt shingles in HMA a developing technology for more than two
MULTIVARIATE ANALYSIS ON RUTTING OF COSTA RICAN ASPHALT CONCRETE MIXES
 MULTIVARIATE ANALYSIS ON RUTTING OF COSTA RICAN ASPHALT CONCRETE MIXES Pedro Castro-Fernandez, Ph.D. Candidate, Professor, Civil Engineering Department, University of Costa Rica Dr. Peter E. Sebaaly, Ph.D.,
Overview. Mix Design with High RAP Contents SEAUPG 2010 ANNUAL CONFERENCE OKLAHOMA CITY, OK. December 7, 2010
 Overview High RAP Content Mix Design Southeast Asphalt User Producer Group OKC, Status of NCHRP 9 46 Preliminary Recommendations High RAP Mixes on the NCAT Test Track Mix Design with High RAP Contents
Abstract. With the increasing cost of asphalt binder and the growing concern over the availability of
 Abstract VISINTINE, BETH. An Investigation of Various Percentages of Reclaimed Asphalt Pavement on the Performance of Asphalt Pavements. (Under the direction of Dr. N. Paul Khosla.) With the increasing
INVESTIGATION OF THE DESIGN OF ASPHALT PAVING MIXTURES USING MINNESOTA TACONITE ROCK
 INVESTIGATION OF THE DESIGN OF ASPHALT PAVING MIXTURES USING MINNESOTA TACONITE ROCK Sponsored by the Minnesota Department of Natural Resources FINAL REPORT 28 APRIL 26 Roger Olson (Mn/DOT) John Garrity
UNIVERSITY OF NEVADA RENO EVALUATION OF THE CECABASE TM RT WARM-MIX ADDITIVE. CECA Arkema Group. Final Report September 2011
 EVALUATION OF THE CECABASE TM RT WARM-MIX ADDITIVE CECA Arkema Group Final Report September 211 UNIVERSITY OF NEVADA RENO Pavements/Materials Program Department of Civil and Environmental Engineering College
Chapter Eight. Minnesota Mix Specifications, Methods & Quality Control
 Minnesota Mix Specifications, Methods & Quality Control Minnesota Mix Specifications, Methods & Quality Control This chapter of the Design Guide has been prepared to assist persons associated with designing
Definition of HMA. In simple terms :
 Hot Mix Asphalt 101 Definition of HMA In simple terms : A mixture of asphalt binder and graded mineral aggregate, mixed at an elevated temperature and compacted to form a relatively dense pavement layer
Warm Mix Asphalt Mixture Performance Using Recycled Asphalt
 Warm Mix Asphalt Mixture Performance Using Recycled Asphalt Mohamed Elbheiri 1, Hasan Mahdy 2, Khaled Kandil 2, Akram Sultan 1 1 Department of Construction and Building, Faculty of Engineering, AASTMT
Volumetric Analysis-Based Comparison between Superpave and Marshall Mix Design Procedures
 Volumetric Analysis-Based Comparison between Superpave and Marshall Mix Design Procedures By Dr. Ghazi G. Al-Khateeb 1 Prof. Taisir S. Khedaywi 2 Prof. Turki I. Obaidat 3 Abstract This research intended
SPECIAL SPECIFICATION 3032 Reflective Crack Relief Interlayer (RCRI)
") 2004 Specifications CSJ 0197-02-097 SPECIAL SPECIFICATION 3032 Reflective Crack Relief Interlayer (RCRI) 1. Description. Produce and place a Reflective Crack Relief Bituminous Interlayer (RCRI) in one
2004 Specifications CSJ 0197-02-097 SPECIAL SPECIFICATION 3032 Reflective Crack Relief Interlayer (RCRI) 1. Description. Produce and place a Reflective Crack Relief Bituminous Interlayer (RCRI) in one
SPECIAL SPECIFICATION 3017 Reflective Crack Relief Interlayer (RCRI)
") 2004 Specifications CSJ 0027-12-130 SPECIAL SPECIFICATION 3017 Reflective Crack Relief Interlayer (RCRI) 1. Description. Produce and place a Reflective Crack Relief Bituminous Interlayer (RCRI) in one
2004 Specifications CSJ 0027-12-130 SPECIAL SPECIFICATION 3017 Reflective Crack Relief Interlayer (RCRI) 1. Description. Produce and place a Reflective Crack Relief Bituminous Interlayer (RCRI) in one
Evaluation of Stone-Matrix Asphalt Mixtures Containing Recycled Asphalt Shingles (RAS)
") Evaluation of Stone-Matrix Asphalt Mixtures Containing Recycled Asphalt Shingles (RAS) http://www.virginiadot.org/vtrc/main/online_reports/pdf/17-r22.pdf STACEY D. DIEFENDERFER, Ph.D., P.E. Senior Research
Evaluation of Stone-Matrix Asphalt Mixtures Containing Recycled Asphalt Shingles (RAS) http://www.virginiadot.org/vtrc/main/online_reports/pdf/17-r22.pdf STACEY D. DIEFENDERFER, Ph.D., P.E. Senior Research
SEAUPG 2009 CONFERENCE-HILTON HEAD ISLAND, SOUTH CAROLINA
 Overview Use of High Percentages of RAP Andrea Kvasnak Where are we at in RAP Usage? What is the current practice? What is the future of RAP to allow greater percentages? 1 2 Survey of DOT s on RAP Usage
Evaluation of Bitumen Film Thickness for Mixes Subjected to Short Term Ageing
 Proceedings of International Conference on Advances in Architecture and Civil Engineering (AARCV 2012), 21 st 23 rd June 2012 49 Evaluation of Bitumen Film Thickness for Mixes Subjected to Short Term Ageing
Development and Implementation of the Superpave System in the USA And its Relationship to Pavement Design
 Development and Implementation of the Superpave System in the USA And its Relationship to Pavement Design John A. D Angelo D Angelo Consulting, LLC johndangelo@dangeloconsultingllc.com 1 Superpave The
STUDIES ON MARSHALL AND MODIFIED MARSHALL SPECIMENS BY USING CRMB
 Int. J. Struct. & Civil Engg. Res. 2014 Sk. Wasim Anwar, 2014 Research Paper ISSN 2319 6009 www.ijscer.com Vol. 3, No. 4, November 2014 2014 IJSCER. All Rights Reserved STUDIES ON MARSHALL AND MODIFIED
UPDATE ON RAP EXPERT TASK GROUP. Northeast Asphalt User Producer Group Meeting Atlantic City, New Jersey October 8, 2008
 UPDATE ON RAP EXPERT TASK GROUP Northeast Asphalt User Producer Group Meeting Atlantic City, New Jersey October 8, 2008 The Public is BUT I like my SUV! WHY RAP? $25.00 Materials Savings $/ton $20.00
5- Superpave. Asphalt Concrete Mix Design
 5- Superpave Asphalt Concrete Mix Design 1 Superpave Volumetric Mix Design Goals Compaction method which simulates field Accommodates large size aggregates Measure of compactibility Able to use in field
Origin. Characterization of Stone Matrix Asphalt Mixtures and Comparisons to Hot Mix Asphalt Mixtures. Acknowledgements. SMA in the United States
 Characterization of Stone Matrix Asphalt Mixtures and Comparisons to Hot Mix Asphalt Mixtures Brian Pearson Washington State Department of Transportation Origin Europe introduced Stone Mastic Asphalt in
ZIA ALAVI DAVID JONES SHAWN HUNG POST-DOCTORAL SCHOLAR UCPRC UC DAVIS ASSOCIATE DIRECTOR UCPRC UC DAVIS PHD STUDENT UCPRC UC DAVIS
 EVALUATING CHANGES IN RHEOLOGICAL PROPERTIES OF BLENDED BINDERS Conventional Binder with Aged-Hardened Rubberized Binder Rubberized Binder with Aged-Hardened Conventional Binder SHAWN HUNG PHD STUDENT
Richard Steger, P.E. Ingevity NAPA Conference on SMA Atlanta, GA
 Richard Steger, P.E. Ingevity 2018 NAPA Conference on SMA Atlanta, GA Acknowledgments Design of SMA Issues with Fibers Fiberless SMA Concept Design Techniques Lab & Field Mix Performance Data Rutgers University
OKLAHOMA DEPARTMENT OF TRANSPORTATION SPECIAL PROVISIONS FOR PLANT MIX BITUMINOUS BASES AND SURFACES
 708-3(a-g) 99 OKLAHOMA DEPARTMENT OF TRANSPORTATION SPECIAL PROVISIONS FOR PLANT MIX BITUMINOUS BASES AND SURFACES These Special Provisions revise, amend and where in conflict, supersede applicable sections
Hot Mix Asphalt Materials and Mix Design for Airfield Pavements. By V. Aurilio ASPHALT INSTITUTE
 Hot Mix Asphalt Materials and Mix Design for Airfield Pavements By V. Aurilio Asphalt Institute ASPHALT INSTITUTE US-based association of international asphalt producers, manufacturers, and affiliated
Thin Lift Overlay research
 Thin Lift Overlay research Presented By: Professor Walaa S. Mogawer, PE Professor of Civil & Environmental Engineering Director of the Pavement Research Institute of Southeastern Massachusetts achusetts
Mix Design Issues for. In-Place Recycling Products
 CIR Definition Mix Design Issues for Cold in-place recycling (CIR) is the on-site recycling process to a typical treatment depth of 3 to 5 inches, using a train of equipment (tanker trucks, milling machines,
H.A.W. How Asphalt Behaves. Behavior Depends on. Temperature Time of Loading Age of asphalt H.A.W
 How Asphalt Behaves Behavior Depends on Temperature Time of Loading Age of asphalt 1.1. 3 1 60 C 1 hour 1 hour 10 hours 25 C 1.1. 4 High Temperature Behavior High Temperature -- desert climate -- summer
2002 SEAUPG Meeting. Southeastern Asphalt User/Producer Group (SEAUPG) SEAUPG 2002 CONFERENCE FLORIDA FLORIDA. Central Sub-Group
 SEAUPG 2002 CONFERENCE FLORIDA FLORIDA. Central Sub-Group") Central Sub-Group Update Allen H. Myers, P.E. Asphalt Branch Manager Kentucky Transportation Cabinet 502-564-3160 Allen.myers@mail.state.ky.us 2002 SEAUPG Meeting Central Sub-Group Update Allen H. Myers,
Central Sub-Group Update Allen H. Myers, P.E. Asphalt Branch Manager Kentucky Transportation Cabinet 502-564-3160 Allen.myers@mail.state.ky.us 2002 SEAUPG Meeting Central Sub-Group Update Allen H. Myers,
Binder and Mixture ETG Update
 Binder and Mixture ETG Update 1 2 High Temperature Binder Criteria Study Refine the Multi-Stress Creep and Recovery Test Evaluate multiple binders Evaluate binder and mix properties to develop specification
RECYCLED ASPHALT PAVEMENT (RAP) USED IN SUPERPAVE MIXES MADE WITH RUBBERIZED ASPHALT
 USED IN SUPERPAVE MIXES MADE WITH RUBBERIZED ASPHALT") RECYCLED ASPHALT PAVEMENT (RAP) USED IN SUPERPAVE MIXES MADE WITH RUBBERIZED ASPHALT Bradley J. Putman * Lab Manager, Asphalt Rubber Technology Service, Clemson University, Clemson, South Carolina, USA
RECYCLED ASPHALT PAVEMENT (RAP) USED IN SUPERPAVE MIXES MADE WITH RUBBERIZED ASPHALT Bradley J. Putman * Lab Manager, Asphalt Rubber Technology Service, Clemson University, Clemson, South Carolina, USA
Project Description US 30, Montpelier SCL to Dingle Rd. MP (3.22 Miles)
") Evaluation of Fiber Reinforced Asphalt Pavements Idaho Case Study US 3 at Montpelier, Idaho ITD Project Phase 1 (RP 237) Lab Evaluation of Materials Project Team: UI Fouad Bayomy (PI), Ahmed Muftah (Grad
Evaluation of Fiber Reinforced Asphalt Pavements Idaho Case Study US 3 at Montpelier, Idaho ITD Project Phase 1 (RP 237) Lab Evaluation of Materials Project Team: UI Fouad Bayomy (PI), Ahmed Muftah (Grad
Superpave Design Guidelines for Using Hot-Mix Recycled Asphalt Pavement and Recycled Asphalt Shingles
 APPENDIX H Superpave Design Guidelines for Using Hot-Mix Recycled Asphalt Pavement and Recycled Asphalt Shingles Recycling Hot-Mix Asphalt and Recycling Manufacturer Waste Asphalt Roofing Shingles General
Designing Open-Graded Mixes
 Designing Open-Graded Mixes Open Graded Mixes Designed to allow water to flow through the mix (rapidly) Porous Friction Course (PFC) or open-graded friction course Porous European Mix - coarser PFC used
A PRELIMINARY EVALUATION OF SUPERPAVE LEVEL ONE MIX DESIGN PROCEDURE
 A PRELIMINARY EVALUATION OF SUPERPAVE LEVEL ONE MIX DESIGN PROCEDURE by Khaled Ksaibati and Jason Stephen Department of Civil and Architectural Engineering University of Wyoming P.O. Box 3295 Laramie,
MECHANICAL PROPERTIES OF MIXTURES CONTAINING RAP
 MECHANICAL PROPERTIES OF MIXTURES CONTAINING RAP ISAP Working Group WG2: Meeting on Cold Recycling of RAP Elie Y. Hajj, Ph.D. Assistant Professor University of Nevada, Reno United States Fortaleza, Brazil
Balanced Asphalt Mixture Design A Formula for Success
 Balanced Asphalt Mixture Design A Formula for Success October 18, 2017 Hartford, Connecticut Shane Buchanan Discussion Items 1. What is Balanced Mix Design (BMD)? 2. Why the need for BMD? 3. What are the
Update on WMA Lab Foaming Research. Ala R. Abbas, Ph.D. Ayman W. Ali, M.Sc. Department of Civil Engineering The University of Akron
 Update on WMA Lab Foaming Research Ala R. Abbas, Ph.D. Ayman W. Ali, M.Sc. Department of Civil Engineering The University of Akron 1 Outline Acknowledgment Background Objectives of the Study Material Description
Volumetric Analysis and Performance of Hot Mix Asphalt with Variable Rap Content
 Volumetric Analysis and Performance of Hot Mix Asphalt with Variable Rap Content Ahmad Kamil Arshad 1,2,*, Masyita Mohammad 2, Ekarizan Shaffie 2, Wardati Hashim 2, and A. G. Abdul Halim 3 1 Institute
Cracking Propensity of Recycled Superpave Mixtures with Highly Absorptive Aggregates and RAP and RAS
 Cracking Propensity of Recycled Superpave Mixtures with Highly Absorptive Aggregates and RAP and RAS Presented By Masoumeh Tavakol Master s Student Department of Civil Engineering Kansas State University
MICHIGAN DEPARTMENT OF TRANSPORTATION SPECIAL PROVISION FOR SUPERPAVE HMA MIXTURES. C&T:CJB 1 of 5 C&T:APPR:SJP:DBP: FHWA:APPR:
 MICHIGAN DEPARTMENT OF TRANSPORTATION SPECIAL PROVISION FOR SUPERPAVE HMA MIXTURES C&T:CJB 1 of 5 C&T:APPR:SJP:DBP:10-03-07 FHWA:APPR:10-05-07 a. Description. This work shall consist of furnishing a HMA
Determination of Mechanical Properties of Materials Used in WAY-30 Test Pavements
 The Ohio Department of Transportation Office of Research & Development Executive Summary Report Determination of Mechanical Properties of Materials Used in WAY-30 Test Pavements Start date: January 1,
FINAL REPORT ADDITIONAL ASPHALT TO INCREASE THE DURABILITY OF VIRGINIA S SUPERPAVE SURFACE MIXES. G. William Maupin, Jr. Principal Research Scientist
 FINAL REPORT ADDITIONAL ASPHALT TO INCREASE THE DURABILITY OF VIRGINIA S SUPERPAVE SURFACE MIXES G. William Maupin, Jr. Principal Research Scientist Virginia Transportation Research Council (A Cooperative
Committee Research Problem Statements
 Transportation Research Board Technical Activities Division Committee Research Problem Statements Group 2, Design and Construction of Transportation Facilities Section D - Bituminous A2D02 Committee on
Super pave Mix Design (Permanent Deformation of Flexible Pavement)
") Mix Design (Permanent Deformation of Flexible Pavement) Suresh Department of Civil Engineering, Satpriya College of Engineering, Rohtak ABSTRACT This paper contains an extensive study on the Super Pave
Mix Design (Permanent Deformation of Flexible Pavement) Suresh Department of Civil Engineering, Satpriya College of Engineering, Rohtak ABSTRACT This paper contains an extensive study on the Super Pave
EXPERIENCE WITH SUPERPAVE MIXTURES Construction Conference Robert Lee and Paul Hoelscher
 EXPERIENCE WITH SUPERPAVE MIXTURES 2014 Construction Conference Robert Lee and Paul Hoelscher Table of Contents 1 Introduction 3-6 2 Statewide Average Binder Contents 7 3 Statewide Overlay Test Results
SUPERPAVE. SUperior PERforming Asphalt PAVEments. History of Hveem Mix Design
 SUPERPAVE SUperior PERforming Asphalt PAVEments History of Hveem Mix Design Hveem mix design was created by Francis Hveem in the 1920 s Basic premise of the design methodology is to coat each aggregate
Asphalt 104: An Introduction to Hot Mix Asphalt Materials. -Part II- Mix Design. Scott Shuler CSU
 Asphalt 104: An Introduction to Hot Mix Asphalt Materials -Part II- Mix Design Scott Shuler CSU 1 The MIX 2 2 The MIX n Rocks 2 The MIX n Rocks n Asphalt 2 The MIX n Rocks n Asphalt 2 The MIX n Rocks n
The Effect of Rutting in Flexible Pavement as a Result of Aggregate Gradation On Asphalt Mixes
 Available online www.ejaet.com European Journal of Advances in Engineering and Technology, 2017, 4(10): 717-722 Research Article ISSN: 2394-658X The Effect of Rutting in Flexible Pavement as a Result of
Presentation Outline
 Design Consideration of Asphalt Mixtures Containing RAP and/or RAS: Impact of Recycling Agents Louay N. Mohammad Sam Cooper, Jr. Department of Civil and Environmental Engineering LA Transportation Research
Impact of Recycling Agents on the Design of Asphalt Mixtures Containing Roofing Shingles
 Impact of Recycling Agents on the Design of Asphalt Mixtures Containing Roofing Shingles Kimberly Koehl Louisiana Transportation Research Center Department of Civil and Environmental Engineering Louisiana
INTRODUCTION TO ASPHALT MATERIALS FOR MANAGERS AND OWNERS ASPHALT PAVEMENT ASSOCIATION OF OREGON
 INTRODUCTION TO ASPHALT MATERIALS FOR MANAGERS AND OWNERS ASPHALT PAVEMENT ASSOCIATION OF OREGON Kevin Berklund 1 BACKGROUND Flexible Pavements Part of a Layered/Composite System Elastic Behavior 2 BACKGROUND
Research RECYCYLED ASPHALT PAVEMENT (RAP) EFFECTS ON BINDER AND MIXTURE QUALITY. Final Report
 EFFECTS ON BINDER AND MIXTURE QUALITY. Final Report") 2005-02 Final Report RECYCYLED ASPHALT PAVEMENT (RAP) EFFECTS ON BINDER AND MIXTURE QUALITY Research Technical Report Documentation Page 1. Report No. 2. 3. Recipients Accession No. MN/RC 2005-02 4. Title
2005-02 Final Report RECYCYLED ASPHALT PAVEMENT (RAP) EFFECTS ON BINDER AND MIXTURE QUALITY Research Technical Report Documentation Page 1. Report No. 2. 3. Recipients Accession No. MN/RC 2005-02 4. Title
INFLUENCE OF VIRGIN AGGREGATE CONTENT AND CURING TIME TO PERFORMANCE OF EMULSION COLD RECYCLED ASPHALT MIXTURE
 INFLUENCE OF VIRGIN AGGREGATE CONTENT AND CURING TIME TO PERFORMANCE OF EMULSION COLD RECYCLED ASPHALT MIXTURE Zhi SUO, Shifa XU*, Jie JI and Ping SONG Beijing University of Civil Engineering and Architecture,
Application of Mechanistic Tests for Performance of HMA Mixtures
 Application of Mechanistic Tests for Performance of HMA Mixtures Louay Mohammad, Ph.D. Louisiana Transportation Research Center Louisiana State University 2009 Louisiana Transportation Conference February