EVALUATION OF TWIST COMPRESSIONS TEST (TCT) AND CUP DRAW TEST (CDT) FOR DETERMINING THE PERFORMANCE OF LUBRICANTS FOR SHEET METAL FORMING OPERATIONS
|
|
|
- Anissa Williams
- 5 years ago
- Views:
Transcription
1 EVALUATION OF TWIST COMPRESSIONS TEST (TCT) AND CUP DRAW TEST (CDT) FOR DETERMINING THE PERFORMANCE OF LUBRICANTS FOR SHEET METAL FORMING OPERATIONS THESIS Presented in Partial Fulfillment of the Requirements for the Degree of Master of Science in Graduate School of The Ohio State University By Sahika Ruzgar Peker, B.S. Graduate Program in Industrial and Systems Engineering The Ohio State University 2016 Thesis Committee: Dr. Taylan Altan, Advisor Dr. Jerald Brevick
2 Copyright by Sahika Ruzgar Peker 2016
3 ABSTRACT Lubrication is one of the process variables that affects the quality of the stamping part. With an appropriate lubrication, quality of the formed part can be improved, and scrap rate can be reduced. The objective of this study is to provide detailed information about Cup Drawing Test (CDT) and Twist Compression Test (TCT) as two common methods to evaluate lubricants performance. In this study, different types of lubricants were evaluated for different sheet materials using CDT and TCT. In CDT, the perimeters of the drawn cups were used to evaluate lubricants performance. TCT factors were used in TCT to compare the performance of the lubricants. Finite element (FE) simulations were used to predict the temperature distribution in the sheet during both CDT and TCT. According to simulation results, temperature generated at the tool-sheet interface in TCT do not reflect the conditions exists in practical stamping operations. Additionally, TCT results show larger scatter. However, easiness in the application and short process time, make TCT useful to compare the performance of various lubricant additives. ii
4 DEDICATION To my parents, Akın and Sevtap Peker, And my sister Irmak Peker iii
5 ACKNOWLEDGEMENTS I would like to express my deepest gratitude to my advisor, Dr. Taylan Altan for providing me an opportunity to be a part of Center for Precision Forming (CPF) and his exceptional guidance during my studies. I extend my sincere thanks to Dr. Jerald Brevick for serving on the committee and for his continuous support through my Master s program. I am grateful to Quaker Chemical, Roy Miller, Vincenzo Disantis and Lilly Kull for their support for this research. I also extend my thanks to Dr. Hyunok Kim for his valuable inputs to this study. Sincere thanks are extended to all the students and visiting scholars at CPF for their support during my graduate studies. In particular, I would like to mention Suraj Appachu, David Diaz Infante, Zeming Yin and Berk Aykas. My special thanks to Ali Fallahiarezoodar whose advice guided me through my graduate school work. Above all, I would like to thank my family, and friends, especially Güçhan Özbilgin, without their support, I could not have done it. iv
6 VITA B.S. Manufacturing Engineering, Istanbul Technical University, Turkey 2014 to present.....graduate Research Associate, Center for Precision Forming (CPF), The Ohio State University Columbus, Ohio, USA FIELD OF STUDY Major Field: Industrial and Systems Engineering v
7 TABLE OF CONTENTS ABSTRACT... ii DEDICATION... iii ACKNOWLEDGEMENTS... iv VITA... v TABLE OF CONTENTS... vi LIST OF TABLES... ix LIST OF FIGURES... x CHAPTER 1: INTRODUCTION Lubrication in Sheet Metal Forming Parameters Affecting the Sheet Metal Forming Process [Altan, and Tekkaya 2012] Blank Properties Tool Properties Lubrication / Friction Forming Machines and Cushions... 3 CHAPTER 2: OBJECTIVES AND METHODOLOGY Objectives Methodology... 4 CHAPTER 3: LITERATURE REVIEW Friction Models and Lubrication Mechanisms in Metal Forming Processes Friction Models in Metal Forming Primary Lubrication Mechanisms in Metal Forming... 8 vi
8 3.1.3 Secondary Lubrication Mechanisms in Metal Forming Surface Roughness of the Materials and Tool Wear Mechanisms Surface Roughness of the Materials Wear Mechanisms in Sheet Metal Forming Types of Lubricants Used in Sheet Metal Forming [Altan, and Tekkaya 2012] Test Methods to Evaluate Lubricants Draw Bead Test Strip Drawing Test Twist Compression Test Cup Drawing Test CHAPTER 4: CUP DRAWING TEST Principles of Cup Drawing Test Evaluation of the Lubrication Performance for Different Lubricants Experiments: Day One Experiments: Day Two Conclusions Process Simulation Using Finite Element Methods Simulation Results Prediction of Average Speed and Pressures during CDT, to be used to Emulate the Same Conditions at TCT Conclusions CHAPTER 5: TWIST COMPRESSION TEST Principle of Twist Compression Test Preliminary Experimental TCT Results Experimental TCT Results Evaluation of Experimental TCT Results Conclusions Process Simulation Using Finite Element Methods Conclusions vii
9 5.5 Surface Roughness Measurements CHAPTER 6: COMPARISON OF CDT AND TCT AND OVERALL CONCLUSIONS CHAPTER 7: SUMMARY REFERENCES APPENDIX A Experimental Results of Preliminary TCTs APPENDIX B Experimental Results of TCTs APPENDIX C Validation of TCT Model by using Literature [Kim 2008] viii
10 LIST OF TABLES Table 4.1: Lubricant name and symbols Table 4.2 Experimental matrix and results obtained for seven lubricants tested in day one Table 4.3 Experimental matrix and results obtained for seven lubricants tested in day two Table 4.4 Experimental matrix and results obtained for three lubricants at high blank holder force (BHF) tested in day two Table 4.5 Lubricant Rating Table 5.1 Experimental Matrix for Preliminary TCT Experiments Table 5.2 Experimental Matrix for TCT Experiments (conducted by Quaker Chemical) Table 5.3 Detailed Experimental Matrix for TCT Experiments (conducted by Quaker Chemical) Table 5.4 Inputs for TCT Simulations (COF was obtained from TCTs) ix
11 LIST OF FIGURES Figure 1.1 Factors that affect friction and lubrication in sheet metal forming [Altan, and Tekkaya 2012]... 2 Figure 3.1 Relationship between contact pressure and frictional shear stress. [Altan, and Tekkaya, 2012]... 6 Figure 3.2 Stribeck curve showing onset of various lubrication mechanisms, η, lubricant viscosity; v, sliding velocity; p, normal pressure; μ, coefficient of friction. [Kim, 2008]... 9 Figure 3.3: Schematic of Draw Bead Test [Keeler 2008] Figure 3.4: Schematic of Strip Draw Test [Hol 2016] Figure 4.1: Schematic of cup drawing Figure 4.2: Deep Drawing Tooling (used by CPF) Figure 4.3: Schematic of tooling geometry of cup drawing simulation [Kim, 2008]18 Figure 4.4: Average flange perimeter in cup drawing test when using DP590 for different lubricants. One of the specimens were fractured when using lubricant E. Lubricants C, F, and G all failed to form any samples Figure 4.5: Average flange perimeter in cup drawing test when using DP980 for different lubricants. Two specimens were fractured when using lubricant E. Lubricants C, D, F, and G all failed to form any samples Figure 4.6: Average flange perimeter in cup drawing test when using DP980 for different lubricants tasted at day two. Lubricant I failed to form any samples. Lubricant A was used on day during set-up and had approximately mm flange perimeter, but it was not recorded Figure 4.7: Average flange perimeter in cup drawing test when using DP980 to evaluate the performance of lubricant H and J at higher blank holder force. x
12 Only one test for lubricant A and 3 tests for lubricants H and J were performed Figure 4.8 Resulting geometry of the model built by DEFORM 2D Figure 4.9: DP590 Flow Stress Curve Obtained From Tensile and Bulge Tests Figure 4.10: Speed vs Stroke curve used in Simulation to represent mechanical press characteristic (15spm) Figure 4.11: Location of the Calculated Maximum and Minimum Temperatures that Occurs in the Blank (DP590 (1.4mm), 30mm/s punch speed (hydraulic press), COF=0.1) Figure 4.12: Increase in maximum temperature on the blank due to deformation and friction (DP590 (1.4mm), 30mm/s punch speed (hydraulic press)) Figure 4.13: Increase in maximum temperature in the blank due to deformation and friction for different punch speeds (DP590 (1.4mm), at 80mm stroke, 30mm/s and 60mm/s hydraulic press, 15spm mechanical press) Figure 4.14: Effect of the punch speed on increase in temperature due to deformation (DP590 (1.4mm), 30mm/s and 60mm/s hydraulic press, 15spm mechanical press) Figure 4.15: Effect of the punch speed on increase in max. temperature due to friction only (COF=0.1, DP590 (1.4mm), 30mm/s and 60mm/s hydraulic press, 15spm mechanical press) Figure 4.16: Effect of the material on temperature increase in CDT Figure 4.17: Average speed and pressure at the die corner area (DP590, t=1.4mm, 30mm/sec punch speed) Figure 5.1: Schematic of TCT [Kim, 2008] Figure 5.2: TCT Tool Insert (Dimensions are in mm) [Kim, 2008] Figure 5.3: Example COF - Time curves obtained from TCT for DP590 (t=1.4mm) with lubricant B xi
13 Figure 5.4: Example COF - Time curves obtained from TCT for DP590 (t=1.4mm), lubricant B, 10ksi, 10rpm and 1g/m 2 coating weight Figure 5.5: Example COF vs Time curve Figure 5.6: Experimental TCT Results for 10ksi Tool Pressure Figure 5.7: Experimental TCT Results for 20ksi Tool Pressure Figure 5.8: Experimental TCT Results for 30ksi Tool Pressure Figure 5.9: Experimental TCT Results for 30rpm Tool Speed Figure 5.10: Experimental TCT Results for Different Specimen Materials (10ksi Tool Pressure and 10rpm Speed) Figure 5.11: TCT Simulation Model [Kim 2008] Figure 5.12: TCT Simulation Input: DP590 Flow Stress Curve Obtained From Tensile and Bulge Tests Figure 5.13: Temperature Distribution in the Specimen (See figure 5.11) (10rpm, 10ksi, 1g/m 2, the longest run (Case A), room temperature 20⁰C) Figure 5.14: Increase in Maximum Temperature in TCT Specimens (DP590 (t=1.4mm), lubricant B, 10rpm, 10ksi) Figure 5.15: Increase in Maximum Temperature in TCT Specimens (DP590 (t=1.4mm), lubricant B, 30rpm, 30ksi) Figure 5.16: Increase in Maximum Temperature in TCT Specimens (Fully flooded, longest run) Figure 5.16: Surface Roughness Measurement Device (SURFTEST SV-3100) Figure 5.17 Comparison of Surface Roughness of materials Figure 6.1 Example of TCT Results (DP590, 20ksi, 20rpm, lubricant B, 2g/m²) xii
14 CHAPTER 1: INTRODUCTION 1.1 Lubrication in Sheet Metal Forming Lubrication plays an important role in sheet metal forming processes as it reduces the friction at the tool-workpiece interface, thus enhancing the ability to produce a good part integrity. With good lubrication, in addition to the reduction in die wear, failures associated with wrinkling, fracture, and strain concentration can be reduced or avoided. There are different lubricant evaluation methods to compare lubricant performance such as Draw Bead Test, Strip Drawing Test, Twist Compression Test (TCT), Cup Drawing Test (CDT). However, not all of them can emulate the actual stamping conditions. The cup drawing test (CDT) was successfully used for evaluation lubricant by various European manufacturers. [Pfestorf, 2002, Tolazzi et al. 2004, and Wagner et al. 2002]. Cup draw test (CDT) emulates the conditions that exist in practical deep drawing and stamping operations. It is widely used to evaluate and compare the performance of lubricants under stamping conditions. On the other hand, twist compression test (TCT) is being increasingly used by lubricant suppliers/developers because of the short processing time and convenience to evaluate and compare the performance of lubricants and additives. 1
![1.2 Parameters Affecting the Sheet Metal Forming Process [Altan, and Tekkaya 2012] A sheet metal forming operation can be considered as a system is composed of all the input variables.](/docs-images/81/83870663/images/15-0.jpg "Blank and tooling properties, tool-workpiece interface conditions, plastic deformation mechanics, final product characteristics, and forming environment affect this system. Figure 1.")
15 1.2 Parameters Affecting the Sheet Metal Forming Process [Altan, and Tekkaya 2012] A sheet metal forming operation can be considered as a system is composed of all the input variables. Blank and tooling properties, tool-workpiece interface conditions, plastic deformation mechanics, final product characteristics, and forming environment affect this system. Figure 1.1 Factors that affect friction and lubrication in sheet metal forming [Altan, and Tekkaya 2012] 2
16 1.2.1 Blank Properties Mechanical properties of the blank such as flow stress curve of the material, anisotropy, and surface finish and coating (if any) affect the quality of the final part. Additionally, the dimensions of the initial blank will affects the final geometry Tool Properties Different types of deformation modes and forces can be observed during the forming and drawing operations. Other than the tool material, and coating, punch and die corner radii, clearance affect the sheet forming operation and part quality Lubrication / Friction Since lubricant affects the frictional forces at the tool-workpiece interface, material flow during the forming and drawing operations depends on the lubrication. Good lubrication conditions would lead to lower scrap rate and better quality Forming Machines and Cushions Forming speed might affect the quality of the formed part because it affects the temperature conditions during the forming operation. Individually programmable cushions will provide a locally controlled material flow during the sheet metal forming operation. This flexibility in the blank holder force can be adjusted according to the incoming sheet material properties and thicknesses. 3
17 CHAPTER 2: OBJECTIVES AND METHODOLOGY 2.1 Objectives The overall research objective of the proposed study is to provide general information about Cup Drawing Test (CDT) and Twist Compression Test (TCT) as methods to evaluate lubricants. The specific objectives are to: Estimate and compare temperature increase at the sheet/tool interface in both CDT and TCT. Estimate the temperatures and pressures that occur in both CDT and TCT. Determine the limitations of CDT and TCT and investigate how TCT can be used to evaluate lubricants and additives. 2.2 Methodology The following approach was used to evaluate lubrication test methods. 1. Cup Drawing Test (CDT) was conducted for the selected material and lubricant 2. Twist Compression Tests (TCT) were conducted with different lubricants and for selected test conditions 3. FE simulations were used to predict the temperatures during CDT and TCT 4
18 CHAPTER 3: LITERATURE REVIEW 3.1 Friction Models and Lubrication Mechanisms in Metal Forming Processes Friction Models in Metal Forming Coulomb s friction model and Shear friction model are two commonly used models to describe the frictional condition in the metal forming process. According to Coulomb s friction model coefficient of friction (COF) is calculated by using formula below (Equation 3.1) with following parameters: τ f = frictional shear stress μ = coefficient of friction ρ = normal pressure τ f = μ ρ (3.1) Interface pressure can reach a multiple of the yield stress of the yield stress of the material. Since, the shear stress, τ f, cannot exceed the shear strength, k, of the deformed material that is normally the workpiece Coulomb s model is not valid at high contact pressure levels. When μρ exceeds the shear strength, τ f, the coefficient of friction becomes meaningless. 5
19 The shear friction model was proposed by Orowan to avoid the limitation of Coulomb s model [Orawan, 1943]. The frictional shear stress, τ f, is proportional to the normal pressure at low pressure like Coulomb s model, but it equals to the shear strength, k, at high pressure and it is calculated by using formula below (Equation 3.2) with following parameters: f = friction factor m = shear factor k = shear strength σ = flow stress τ f = f σ =m σ = mk (0 m 1) (3.2) 3 Figure 3.1 Relationship between contact pressure and frictional shear stress. [Altan, and Tekkaya, 2012] 6
20 Wanheim and Bay [Wanheim et al. 1974, and Bay et al. 1975] proposed a modified shear friction model, to consider the effect of real contact area ratio on friction. As shown in Equation 3.3, the friction shear stress, τ f, is a function of the real contact area ratio in this model, with following parameters: f = modified frictional factor m = modified shear factor σ = flow stress a = real contact ratio = real contact area/apparent contact area (Ar/Aa) τ f = f ak = m σ 3 (3.3) Another complex model to take lubricant effect into account was proposed for boundary and mixed lubrication regimes by Bowden, and Tabor (1967), as shown in Equation 3.4, where, a = real contact ratio, τ a = average shear stress at contacting asperity peaks τ b = average shear stress (lower stress) at the lubricant pockets τ f = a τ a + (1- a) τ b (3.4) 7
21 Although this approach is the most detailed expression of the lubricant behavior, it is hard to be used in forming simulations. More models to represent lubrication conditions in sheet metal forming are proposed by different studies. [Lee et al. 2002, Wang et al. 2014, and Hol et al. 2015] Primary Lubrication Mechanisms in Metal Forming Different lubrication mechanisms may be seen in sheet metal forming, dry condition, boundary condition, mixed-film lubrication, and hydrodynamic lubrication. Dry condition means no lubrication at the mating surfaces, this lead high friction. The dry condition is often used when the frictional conditions do not have a significant effect on the part quality or when the material is formable enough to form without lubricants. The most commonly encountered lubrication condition is the boundary condition which is defined as a condition where the solid surfaces are so close that surface interaction between single or multimolecular films of lubricants and the solid asperities dominated the contact. [Bhushan, 2002] Another lubricant condition is the mixed-layer lubrication. The micro peaks of the metal surface become filled with lubricant in this case. 8
22 Hydrodynamic lubrication is observed during high-speed sheet rolling operations where hydrodynamic conditions occur at the material-tool interface. The Stribeck curve illustrates lubrication mechanisms as shown in the figure below (Figure 3.2) as a function of lubricant viscosity, η, sliding velocity, ν, and normal pressure, ρ. [Schey, 1983] Figure 3.2 Stribeck curve showing onset of various lubrication mechanisms, η, lubricant viscosity; v, sliding velocity; p, normal pressure; μ, coefficient of friction. [Kim, 2008] 9
23 3.1.3 Secondary Lubrication Mechanisms in Metal Forming Two different types of secondary lubrication mechanisms may be observed when the trapped lubricant permeates to the real contact surface; Micro-Plasto-Hydro-Static Lubrication (MPHSL) and Micro-Plasto-Hydro-Dynamic Lubrication (MPHDL). A thin film occurs between the surface asperities and the die where boundary lubrication previously dominated when lubricant escapes from the valleys of the surface. This leads reduced frictional stress. Many researchers provide experimental evidence of MPHSL and MPHDL. [Azushima et al. 1991, Bech et al. 1998, Le, and Sutcliffe, 2003]. To enhance the MPHSL and MPHDL mechanisms by optimizing textured sheet may help to reduce surface friction. [Pfestorf et al. 1998] 3.2 Surface Roughness of the Materials and Tool Wear Mechanisms Surface Roughness of the Materials Surface roughness describes the deviations in the normal vector direction of a real surface from its ideal form. If these deviations are large, that surface named rough, and if they are small surface named smooth. [Bhushan 2001] Lee et al. (2002), proposed a friction model which considers lubricant velocity and surface roughness. According to this study, the coefficient of friction becomes high for the extremely high and low surface roughness conditions. 10
24 Surface roughness is generally expressed as an average value Ra which is an arithmetic average value of the deviation of the trace above and below the center line [Bhushan 2001]. However, Ra does not differentiate between valleys and peaks. Rz which defines as the maximum height profile and Rq which measures the root mean square deviation of the profile are alternative ways of measuring of roughness Wear Mechanisms in Sheet Metal Forming Gradual material removal from contacting surfaces named wear. Wear occurs in sheet metal forming in two basic forms, adhesive and abrasive. Adhesive Wear Adhesive wear is the most critical wear type in sheet metal forming. Particles are removed from one surface attached to the other surface temporarily or permanently during adhesive wear. Adhesive wear shows itself in different forms during different forming operations such as scoring, powdering and galling. According to Kim et al. (2008), higher contact pressure and temperatures during forming of galvanized Advance High Strength Steels (AHSS) may lead to lubricant breakdown and powdering or galling. To reduce the adhesive wear, more lubricant may be applied or chemical composition of one material might be changed to lower the adhesion between sheet and tool surfaces. 11
25 Abrasive Wear When one hard surface removes/cuts material from the other surface it is called abrasive wear. In sheet metal forming abrasive wear does not occur often. Often, abrasive wear caused by adhesive wear which may generate abrasive particles. 3.3 Types of Lubricants Used in Sheet Metal Forming [Altan, and Tekkaya 2012] Stamping lubricants are either water or petroleum based, and by varying the additive content can have widely different properties and performance qualities depending upon the process. There are several parameters should be considered while selecting lubricants for sheet metal forming operations such as forming operation type, lubricant application methods, types of additives, corrosion control, cleanliness and removal methods, compatibility with pre-lubricants, the effect on additional forming operations, environmental safety, and recycling. Lubricants can be divided into following categories; oils, soluble oils, semisynthetic, synthetics, and dry-film lubricants. Petroleum-based oils are commonly used for light-duty stamping operations. Various types of additives are used to enhance the lubricant performance. Extreme pressure additives are widely used in heavy-duty metal stamping operations to prevent metal to metal contact during stamping. Lubricants with extreme temperature additives stick to the hot workpiece and create a friction reducing barrier while lubricant without extreme temperature additives may become thinner and burn. 12
26 3.4 Test Methods to Evaluate Lubricants Draw Bead Test In this test, a lubricated sheet specimen pulls through the draw bead dies and pulling forces are measuring during the test [Figure 3.3]. Velocity and blank holder force can be adjusted to emulate the actual forming conditions. Since frictional forces and pulling forces change with the changes in lubricant type or amount, a number competitive analysis can be used to evaluate the lubricant performance. Figure 3.3: Schematic of Draw Bead Test [Keeler 2008] 13

27 3.4.2 Strip Drawing Test A strip drawn between two dies during this test. Several types of dies are used. The replacement of flat dies by cylindrical ones leads to higher contact pressures. The amount of stretching with the differences in the coefficient of friction [Figure 3.4]. This test can be performed at different speeds, speed profiles, die radii or material. This test was developed to test the materials with limited formability due to the difficulty to conduct deep drawing test. Figure 3.4: Schematic of Strip Draw Test [Hol 2016] Twist Compression Test Twist Compression Test (TCT) is widely used by lubricant suppliers/developers to evaluate and compare the performance of lubricants and additives. The tool is rotated under axial force and torque is calculated during the test. [Kim 2008] 14
28 3.4.4 Cup Drawing Test Cup Drawing Test (CDT) emulates the conditions that exist in practical deep drawing and stamping operations. It is widely used to evaluate and compare the performance of lubricants under stamping conditions. In CDT, the cup is drawn to a predetermined depth at a given blankholder force. The perimeter of the drawn cup is measured as an indication of lubricant performance. The CDT allows determining the average coefficient of friction (COF) [Diaz et al. 2015]. 15
29 CHAPTER 4: CUP DRAWING TEST In this part of the study, the deep drawing test, and FE Simulations are used to evaluate the performance of various stamping lubricants and predict temperature conditions during forming. 4.1 Principles of Cup Drawing Test The cup drawing process is used extensively to evaluate stamping lubricant performance. Since the most severe friction takes place at the flange area, lubrication conditions at this region influence the thinning and failure in the side wall of the drawn cup and draw-in length. Lubricants can be compared according to their maximum applicable blank holder force without failure in the cup wall. The effectiveness of lubricants are being analyzed based on the following criteria: The maximum necessary punch force, where lower force implies better lubrication, The maximum blank holder force without fracture, where higher blank holder force shows better lubrication, Thinning distribution on the circumferential length (the better lubrication, the lesser thinning), Measurement of the draw-in length and perimeter of the flange, where the shorter perimeter and the larger draw-in length means better lubrication, Visual inspection of galling (the lower galling, the better the lubricant) 16

30 Figure 4.1: Schematic of cup drawing 4.2 Evaluation of the Lubrication Performance for Different Lubricants In evaluating the lubrication performance using cup drawing test, the sheet is not drawn completely and some flange remains. The perimeter of the flange is measured for each specimen. Lower flange perimeter shows the sheet is more drawn and less stretched which represents better lubrication performance. Cup drawing tools are used in this study and the tool geometries are shown in Figure 4.2 and 4.3. The draw depth (punch stroke) is about 80mm and the punch speed is about 30mm/sec. 17


31 Figure 4.2: Deep Drawing Tooling (used by CPF) Figure 4.3: Schematic of tooling geometry of cup drawing simulation [Kim, 2008] 18
32 Cup drawing tests for two different materials (DP590 and DP980) and ten different lubricants including dry and wet lubricants are conducted to evaluate the performance of each lubricant in terms of lubrication quality and reduction of friction in forming of advanced high strength steels (AHSS). Due to a large number of specimens and lubricants, it was not possible to complete all experiments in one day. Also, all lubricants were not available at the same time. Therefore, experiments are conducted on two separate days (one week apart). Lubricant A which was tested in day one and showed the best lubrication performance, among the rest of the other lubricants except B, was initially selected as the base for the experiments (on all days). Thus, lubricant A, was tested again on day two to be sure about the same tooling set up and results were used for comparison of the other lubricants tested in this day. Table 1 shows the lubricants name and symbol which were tested on day 1 and 2. Lubricant code Table 4.1: Lubricant name and symbols Testing Type of Lubricant day A 1 and 2 Polymer Synthetic B 1 Polymer Synthetic C 1 Mineral oil w/rust inhibitors D 1 E 1 F 1 Polymer Water based G 1 Mineral oil w/ extreme pressure additives H 2 Mineral oil w/ extreme pressure additives I 2 Dry film, higher hardness hot melt J 2 Mineral oil w/ extreme paraffinic pressure additives 19
33 In order to reduce the effect of applying different amounts of lubricant and different amounts of spread on test results, all lubricants except lubricant I (dry lubricant) were applied by one person in the same way. Lubricant I was applied to the sheet metal by the provider company. All wet lubricants were applied using a #0 draw down bar and 3 drops of lubricant per sheet side. This method has been shown in past work to give ~+/- 0.3 g/m 2 tolerance, however, the coating weights were not measured or recorded for the current study. The following is the method used for applying the wet lubricant described step by step: 1) Fiber Glass Plate was placed on top of the work bench and cleaned using acetone 2) The draw down bar (#0) was cleaned using acetone after putting on clean gloves 3) Sheet samples of the required material were then cleaned (wiped off) of debris using a paper towel 4) The sheet sample was placed on the fiberglass plate and three drops of the required lubricant were applied on one side 5) The lubricant was then spread over the entire surface of the sample using a #0 draw down bar 6) The sample was then turned over and the same was repeated for the other side 7) The sample was then placed in a cleaned cup draw tooling (Between different lubricants the die, blankholder, and punch are cleaned with acetone. Between samples of the same lubricant the tool surfaces are just wiped with paper towels.) 20
34 8) For each lubricant the gloves were changed and work bench/glass plate and draw down bar were cleaned using acetone. 9) Aforementioned steps (3 through 8) were then repeated Experiments: Day One For DP590 and DP980 sheet materials, 5 or 6 specimens are tested for each lubricant, unless three failures (fracture) in a row occur. A 650 KN blank holder force was applied for DP590 and 600 KN for DP980. After the test, if the cup was formed successfully, the perimeter of the flange is measured. For lubricants C, F, and G, none of the specimens could be formed successfully. Therefore, these three lubricants are eliminated from the study. For lubricant D, only two samples (out of 6) were formed using DP590 and none of the DP980 specimens could be formed successfully. This shows that lubricant D also cannot provide a good lubrication performance during the forming of AHSS using these testing conditions. Failure occurs in one of the six DP590 specimens when using lubricant E while two of the DP980 specimen cracked using this lubricant. As is shown in Figure 4.4 (for DP590) and Figure 4.5 (for DP980) for both materials, lubricant B provides less flange perimeter compared to other lubricants followed by lubricant A. Since cracking occurs in some specimen except when using lubricants A and B, it can be concluded that they have the best lubrication performance in forming of AHSS compare to the other five lubricants tested in the day one conditions. Table 4.2 shows the experiment matrix and test results obtained in day one 21
35 Table 4.2 Experimental matrix and results obtained for seven lubricants tested in day one. Lubricant symbol A (day one) B C D E F G Material Blank holder force (KN) Number Number of of successfully specimen tested formed cup Average of flange perimeter (mm) Notes / Comments DP Thick lube, easily spread DP Part gets hot Part Temperature DP is noticeably high with each test DP DP DP DP DP Part gets very Hot 2.Lube forms beads and doesn t spread out very well 1. Lube hard to spread out 2.Part gets very hot DP Lube hard to spread out 2.Part gets very hot DP Part gets very hot DP Lube spreads but beads up DP DP Lube spreads well DP
36 Figure 4.4: Average flange perimeter in cup drawing test when using DP590 for different lubricants. One of the specimens were fractured when using lubricant E. Lubricants C, F, and G all failed to form any samples. Figure 4.5: Average flange perimeter in cup drawing test when using DP980 for different lubricants. Two specimens were fractured when using lubricant E. Lubricants C, D, F, and G all failed to form any samples. 23
37 4.2.2 Experiments: Day Two In the second day of the experiment, lubricant A selected as the base, was tested again to compare the tool set up and testing conditions with the first day. Cup drawing test with several different blankholder forces were conducted using both materials (DP590 and DP980) to find the force that provides similar flange perimeter as day one. Due to the lack of the specimens and time, for DP980, only one sample was tested for each blank holder force. The selected force was used for the rest of the experiments. 700KN blank holder force was selected for DP590 and 600KN for DP980.For lubricant I which is the dry lubricant, contrary to what was expected, none of the specimens could form successfully. Therefore, several lower blank holder forces were tested to check the possibility of forming specimens with this lubricant. However, only for DP980 with 500KN blank holder force one of the two tested specimens can be formed successfully when using lubricant I. This shows, at least for these experimental conditions, lubricant I is not appropriate for forming AHSS. 24
38 Table 4.3 Experimental matrix and results obtained for seven lubricants tested in Lubricant symbol J H I Material Blank holder force (KN) day two Number of Number of specimens successfully tested formed cup Average of flange perimeter (mm) DP DP DP DP DP590 DP Notes/ Comments Thick and Spreads well and is ok to wipe Very Viscous and Does not spread Parts get well extremely Figure 4.6 shows the results for DP980. As mentioned before, lubricant I did not provide appropriate lubrication performance and was eliminated from the study. As shown in this figure, for DP980, lubricant H provided lower flange perimeters following with lubricant J. Based on the results, both lubricants H and J provided better lubrication conditions compared to lubricant A (which had a perimeter ~ mm during set-up, but was not recorded). The measured average perimeters for lubricant H is lower than lubricant B (results from day one), which showed the lowest average flange perimeter in day one. The average flange perimeters are almost similar when using lubricant J or B. 25
39 Figure 4.6: Average flange perimeter in cup drawing test when using DP980 for different lubricants tasted at day two. Lubricant I failed to form any samples. Lubricant A was used on day during set-up and had approximately mm flange perimeter, but it was not recorded. However, results when increasing the blank holder force to 700KN for DP590 showed that lubricant H (failed 2 of 3 tests) provides similar flange perimeter (but worse performance) to lubricant A (failed 1 of 3 tests), and lubrication performance of lubricant J (failed 2 of 3 tests) worse than these two lubricants. Extra tests were conducted using DP980 to evaluate the performance of lubricants J and H at higher blank holder force (i.e. 750KN). Table 4.4 shows the experiment matrix and Figure 4.7 shows the results of these tests. Due to the lack of specimen and time, only one test was conducted with lubricant A and three specimens were tested for each lubricant H and J. 26
40 The measured flange perimeter when using lubricant A (one test) was 719mm while the average flanges perimeter for lubricant H and J were mm and 727mm, respectively. This shows that the performance of lubricant H reduced and provides almost similar lubrication performance as lubricant A when using higher blank holder force while lubrication performance of lubricant J drops below the performance of lubricant A by increasing the blank holder force. Table 4.4 Experimental matrix and results obtained for three lubricants at high blank holder force (BHF) tested in day two. Lubricant symbol Material Blank holder force (KN) Number of specimens tested Number of successfully formed cup Average of flange perimeter (mm) A (day wo) J H DP DP DP DP DP DP
41 Figure 4.7: Average flange perimeter in cup drawing test when using DP980 to evaluate the performance of lubricant H and J at higher blank holder force. Only one test for lubricant A and 3 tests for lubricants H and J were performed Conclusions Lubricant B was seen to perform better than A, and H was slightly better than A but hard to spread out on the sheet samples. Additionally, it was observed that A produced similar flange perimeters to H (~ mm), but were not recorded on the day that H, J, and I were tested. It was noticed that part temperatures were high, especially for DP980. In large flange parts and fractured parts the temperatures were very high (hard to handle). Simulations are run to predict temperatures during the cup drawing operations (Chapter 4.1). 28
42 There was only one dry film tested (lubricant I ). Temperatures were especially high in those samples, and the temperature was concentrated in the top portion of the part (as opposed to the wall in most other lubricants). The cracks also occurred in the punch radius, as opposed to the part wall in other lubricants. I also performed very poorly, where it could only form DP590 with BHF less than 45 tons and DP980 with 50 tons. There are two hypothesis for the poor performance, 1) the lubricant lacks heat dissipation capability because it is not a wet (oil or water) lubricant, and 2) the lubricant has too high of COF in the punch radius which causes the sample to fail prematurely in the radius instead of the wall (concentrating the thinning over the punch radius). Lubricant Perimeter Rank Table 4.5 Lubricant Rating COF (calculated) Observations/Notes A 3/ (DP980) Was used as base, spread and formed well B 1/ (DP980) Spread very well, seemed to be best lubricant C - - Did not spread well, beads up, cups fractured D 5/ (DP590) Hard to spread, barely formed DP590 E 4/10 >0.1 (DP980) Hard to spread out, formed DP590, barely formed DP980 F - - Spreads, but then beads up, cups fractured G - - Spreads well, cups fractured H 2/ (DP980) Very tacky, hard to spread, cups form very well I - - Dry film, cups fractured in punch radius J 6/ (DP980) Thick, but spreads well, cups form well 29
43 4.3 Process Simulation Using Finite Element Methods For this study the model showed on Figure 4.3 was used and the resulting axisymmetric geometry built on DEFORM 2D version 11.0 can be seen in Figure 4.8. For this simulation, it was chosen that the Blank Holder, Die, and Punch would behave as rigid objects while the sheet would behave as a plastic object. Figure 4.8 Resulting geometry of the model built by DEFORM 2D D590 (t=1.4mm) is used for this simulation. Its flow curve (σ=k.ε n ) obtained from Tensile and viscous pressure bulge tests (VPB) (Strength coefficient (K) =1311MPa, Strain hardening exponent (n) = 0.27) can be seen in the Figure 4.9. Constant simulation parameters for the all simulations are as follows: Blank Holder Force = 600KN Final stroke = 83mm Blank diameter = 152.4mm E-modulus (DP590) = 180GPa 30
44 Stress (MPa) Strain Figure 4.9: DP590 Flow Stress Curve Obtained From Tensile and Bulge Tests Simulations are run for three different punch speeds (30mm/s, 60mm/s, and 15spm) and two coefficient of friction values (0.0 and 0.1) for each speed to calculate temperature increase due to friction and deformation. Mechanical press characteristics are chosen arbitrarily with 15spm angular speed and 640mm stroke (TDC to BDC) with forming from α= 40⁰; 560mm to 640mm. Ram velocity (V) shown in Figure 4.10 is calculated by using formula below (Equation 4.1) with following parameters: S= Stroke (2r) n= rotational speed α= crank angle r= crank radius = s/2 V = Sπn 60 sinα Equation (4.1) 31
45 Figure 4.10: Speed vs Stroke curve used in Simulation to represent mechanical press characteristic (15spm) Simulation Results Simulation results for COF = 0.0 are used to determine the temperature increase due to the plastic deformation only. To be able to calculate temperature increase due to friction, simulation results with COF = 0.0 and COF = 0.1 are compared (results for COF = 0.0 are subtracted from the results for COF = 0.1). To compare the simulation results, the maximum temperature that occurs on the blank during the cup drawing operation is considered as shown in Figure
46 Increase in temperature (max.) (⁰C) Punch Corner Min. Temp. 35⁰C Max. Temp. 105⁰C Die Corner Figure 4.11: Location of the Calculated Maximum and Minimum Temperatures that Occurs in the Blank (DP590 (1.4mm), 30mm/s punch speed (hydraulic press), COF=0.1) Increase in maximum temperature on the blank (near to die corner) due to deformation and friction for the punch speeds 30mm/s, 60mm/s and 15spm are shown in Figure 4.12, and Stroke (mm) 30mm/s, COF=0.1 30mm/s, COF=0.0; Temperature increase due to deformation 30mm/s; Temperature increase due to friction (Δ between two curves (COF=0.0 and 0.1) Figure 4.12: Increase in maximum temperature on the blank due to deformation and friction (DP590 (1.4mm), 30mm/s punch speed (hydraulic press)) 33
47 Increase in temperature (max.) (⁰C) COF = COF = 0.0, temperature increase due to deformation mm/s (Hydraulic press) 60mm/s (Hydraulic press) Punch Speed 15spm (Mechanical press) Temperature increase due to friction only (COF=0.1) Figure 4.13: Increase in maximum temperature in the blank due to deformation and friction for different punch speeds (DP590 (1.4mm), at 80mm stroke, 30mm/s and 60mm/s hydraulic press, 15spm mechanical press) The maximum temperature is higher at higher press speed (60mm/s vs 30mm/s) due to the shorter forming time which reduces the heat transfer. The same observation is valid for maximum temperature calculated with friction. Effect of the punch speed on the increase in temperature due to deformation can be seen in Figure 4.14 and effect of the punch speed on the increase in temperature due to friction can be seen in Figure
48 Increase in temperature (max.) (⁰C) Increase in temperature (max.) (⁰C) Stroke (mm) 60mm/s, COF=0.0; Temperature increase due to deformation (Hydraulic press) 15spm, COF=0.0; Temperature increase due to deformation (Mechanical press) 30mm/s, COF=0.0; Temperature increase due to deformation (Hydraulic press) Figure 4.14: Effect of the punch speed on increase in temperature due to deformation (DP590 (1.4mm), 30mm/s and 60mm/s hydraulic press, 15spm mechanical press) Stroke (mm) 30mm/s; Temperature increase due to friction (Hydraulic press) 60mm/s; Temperature increase due to friction (Hydraulic press) 15spm; Temperature increase due to friction (Mechanical press) Figure 4.15: Effect of the punch speed on increase in max. temperature due to friction only (COF=0.1, DP590 (1.4mm), 30mm/s and 60mm/s hydraulic press, 15spm mechanical press) 35
49 Increase in temperature (max.) (⁰C) Figure 4.16 shows the effect of material on temperature increase in forming in hydraulic press DP980 (1.5mm) DP590 (1.4mm) DP980 (1.5mm) DP590 (1.4mm) Stroke (mm) Figure 4.16: Effect of the material on temperature increase in CDT 36
50 4.3.2 Prediction of Average Speed and Pressures during CDT, to be used to Emulate the Same Conditions at TCT In general tool speed and pressures for TCT are determined according to personal experience and previous trials for a given material and lubricant. Since, speeds and pressure are changing during cup drawing, average pressure and strains at the die corner area are predicted to emulate the same conditions in TCT. In this study, average speeds and pressures are predicted for the 30mm/sec constant punch speed (hydraulic press) during forming of DP590 (t=1.4mm) which was used in CDT lubrication study previously. Average speed and pressure at the die corner area (where the temperature are maximum) are shown in Figure Figure 4.17: Average speed and pressure at the die corner area (DP590, t=1.4mm, 30mm/sec punch speed) 37
51 4.3.3 Conclusions Plastic deformation has much larger effect than friction on the increase in temperature in CDT. Most of the heat is due to plastic deformation, about 70 to 100 %. Increase in temperature due to plastic deformation for different punch speeds has a similar trend (Increase in temperature due to deformation is increasing with higher punch speed, Figure 4.14). Increase in temperature due to friction only for different punch speeds (hydraulic and mechanical presses) varies during the stroke (Figure 4.15). They may be due to numerical errors (temperatures calculated are in the range of 4-8⁰C). Since plastic deformation has a significant effect on the increase in temperature, material properties (especially the flow stress curve) affect temperature results significantly. According to simulation results, to emulate the forming conditions (speed and pressure) in CDT run for 30mm/sec punch speed, 10rpm tool speed, and 10ksi tool pressure should be used in TCT. 38
52 CHAPTER 5: TWIST COMPRESSION TEST In this study, the Twist Compression Test (TCT) and Finite Element Analysis are used to evaluate lubricant performance, investigating the effect of tool speed, tool pressure, specimen material (surface roughness) and lubricant amount on TCT results, and predicting temperatures that occur in TCT. 5.1 Principle of Twist Compression Test In TCT, a rotating annular tool is pressed against a fixed sheet specimen while the pressure and torque are being measured. Schematic of TCT is shown in Figure 5.1 and dimensions of the tooling are shown in Figure 5.2. During the test, COF is calculated by using formula below (Equation 5.1) with following parameters: T = torque (Nm) r = mean radius of the tool (mm) P = applied pressure (MPa) A = cross-sectional area of the tool (mm²) T COF = rpa (5.1) 39
![Figure 5.1: Schematic of TCT [Kim, 2008] Figure 5.2: TCT Tool Insert (Dimensions are in mm) [Kim, 2008] 5.](/docs-images/81/83870663/images/53-0.jpg "2 Preliminary Experimental TCT Results Preliminary TCTs have been conducted for three different specimen materials and two different lubricants, shown in Table 5.1.")
53 Figure 5.1: Schematic of TCT [Kim, 2008] Figure 5.2: TCT Tool Insert (Dimensions are in mm) [Kim, 2008] 5.2 Preliminary Experimental TCT Results Preliminary TCTs have been conducted for three different specimen materials and two different lubricants, shown in Table 5.1. Each condition was repeated four times. Tool speed and pressures are selected according to the previous TCT results for Advance High Strength Steels (AHSSs) and Aluminum alloys. 40
54 According to Cup Draw Test (CDT) results, lubricant B is one of the best lubricants to form Advance High Strength Steels (AHSS), and lubricant J is the worst one among the six tested lubricants. Table 5.1 Experimental Matrix for Preliminary TCT Experiments Material Lubricant Rotational Speed Pressure DP590 Lubricant B 10rpm 45ksi (t=1.4mm) Lubricant J DP980 Lubricant B 10rpm 45ksi (t=1.5mm) Lubricant J Al5182-O Lubricant B 10rpm 5ksi (t=1.2mm) Lubricant J COF curves as function of time are calculated (Appendix A). Figure 5.3 shows an example of test results for DP590 (t=1.4mm), and lubricant B. Figure 5.3: Example COF - Time curves obtained from TCT for DP590 (t=1.4mm) with lubricant B 41
55 According to TCT results: As seen in Appendix A, the average COF for lubricant B (better lubricant, based on CDT) (0.08) is higher than average COF for lubricant J (worse lubricant, based on CDT) (0.05) for DP980 and DP590. Also, lubricant B is breaking down sooner (around 15 seconds) than lubricant J (around 25 seconds). Thus, the CDT and TCT results do not agree. Test results for Al5182-O do not show a significant difference for different lubricants (B and J). As shown in Figure 5.3, TCT results of different runs for the same conditions can be significantly different. Therefore, evaluation of lubricant by using TCT may not be accurate. 5.3 Experimental TCT Results After running preliminary TCTs, understanding the basics and the methodology to analyze the data, to be able to investigate the effect of tool speed and pressure, lubricant amount, and specimen materials, TCTs had run for 33 different test conditions according to experimental matrix below (Table 5.2) by Quaker Chemical. Each condition was repeated for at least 3 times (samples) resulting 146 total number of runs. (Table 5.3) 42
 Rotational Speed (rpm) Chemical) Pressure (ksi) 10, 20, 30 10, 20, 30 10 10 10 10 Application of lubricant 1 g/m 2 ( +/- 0.3g/m 2 ) 2 g/m 2 ( +/- 0.3g/m 2 ) fully flood 1 g/m 2, 2 g/m 2 ( +/- 0.")
56 Table 5.2 Experimental Matrix for TCT Experiments (conducted by Quaker Materials DP590 (t=1.4mm) TWIP900 (1.2mm) CP800 (t=1.4mm) Rotational Speed (rpm) Chemical) Pressure (ksi) 10, 20, 30 10, 20, Application of lubricant 1 g/m 2 ( +/- 0.3g/m 2 ) 2 g/m 2 ( +/- 0.3g/m 2 ) fully flood 1 g/m 2, 2 g/m 2 ( +/- 0.3g/m 2 ) and fully flood 1 g/m 2, 2 g/m 2 ( +/- 0.3g/m 2 ) and fully flood COF vs time curves for all runs are calculated and can be found in Appendix B. An example curve for DP590 (t=1.4mm), and lubricant B,10ksi, 10rpm and 1g/m 2 coating weight can be seen in Figure 5.4. Figure 5.4: Example COF - Time curves obtained from TCT for DP590 (t=1.4mm), lubricant B, 10ksi, 10rpm and 1g/m 2 coating weight 43
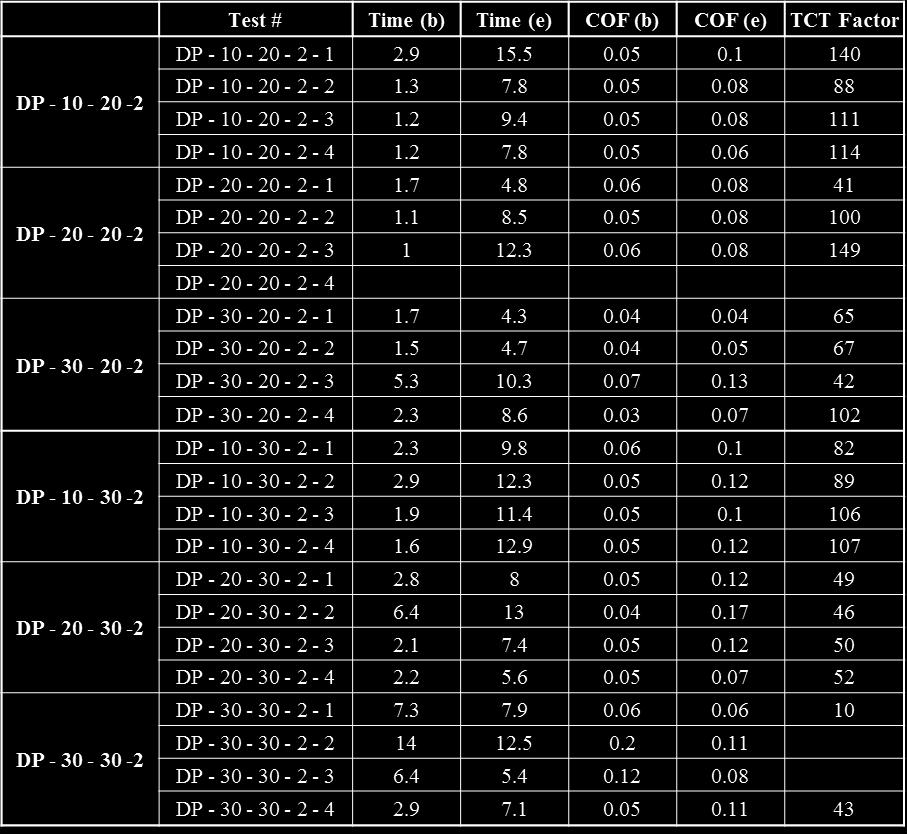
57 Table 5.3 Detailed Experimental Matrix for TCT Experiments (conducted by Metal Substrate DP 590 TWIP 900 CP 800 Test Pressure (ksi) Tool rpm Quaker Chemical) # of Test Target Coating Weight Actual Coating Weight fully flooded fully flooded g/m g/m g/m g/m g/m2 (+/-0.3g/m2) 1.26 g/m g/m g/m g/m g/m g/m g/m g/m g/m g/m2 (+/-0.3g/m2) 2.13 g/m g/m g/m g/m g/m2 4 fully flooded fully flooded 4 1 g/m2 (+/-0.3g/m2) 0.96 g/m g/m2 (+/-0.3g/m2) 2.11 g/m2 4 fully flooded fully flooded 4 1 g/m2 (+/-0.3g/m2) 1.14 g/m2 4 2 g/m2 (+/-0.3g/m2) 2.20 g/m2 44
58 5.3.1 Evaluation of Experimental TCT Results As shown in Figure 5.5, COFb is the COF where the tool pressure reaches to desired value and stays stable. On the other hand, COFe is the COF where the lubricant has broken down. Breaking down points for each run have been determined by three researchers and then average of three were used. Figure 5.5: Example COF vs Time curve Due to the inconsistency of the TCT results, averaging the results of 4 runs provides an error. Thus, two out of four samples (the shortest and longest runs, as discussed below) are considered for each condition (pressures 10, 20, 30 ksi; speeds 10, 20, 30 rpm, lubrication 1g/m², 2g/m², fully flooded). 45
59 The duration of the tests are calculated by using the formula below (Equation 5.2) with following parameters: Time(b) = When the tool pressure reaches to desired value (sec) Time(e) = When the lubricant has broken down (sec) Run time = Time(e) Time(b) (5.2) The longest (Case A) and shortest (Case B) runs are considered for a given condition and TCT factors are calculated for Case A and B according to formula below (Equation 5.3) with following parameters (this is the common procedure to evaluate TCT results): COFb = COF where the tool pressure reaches to desired value and stays stable COFe = COF where the lubricant has broken down TCT Factor= (Time(e) Time (b)) / ((0.2 x COFb) + (0.8 x COFe)) (5.3) An average TCT factor is calculated by using formula below (Equation 5.4) for each condition where the higher TCT factor implies better lubrication Average TCT Factor = TCT Factor (Case A) + TCT Factor (Case B) 2 (5.4) TCT Factor vs lubricant amount for different speeds are plotted for each pressure values (Figure ). TCT Factor vs lubricant amount and different materials are plotted (Figure 5.10) 46
60 Average TCT Factor Average TCT Factor Figure 5.6: Experimental TCT Results for 10ksi Tool Pressure Figure 5.7: Experimental TCT Results for 20ksi Tool Pressure 47
61 Average TCT Factor Average TCT Factor Figure 5.8: Experimental TCT Results for 30ksi Tool Pressure Figure 5.9: Experimental TCT Results for 30rpm Tool Speed 48
62 Average TCT Factor Figure 5.10: Experimental TCT Results for Different Specimen Materials (10ksi Tool Pressure and 10rpm Speed) Conclusions TCT factor decreases (decreased lubricant performance) with increasing tool speed and increasing tool pressure. Increase in lubricant amount increases the TCT Factor which means better lubricant performance, TCT Factors for TWIP900 are higher than TCT Factors for DP590 and CP800 for investigated cases (10rpm and 10ksi). The difference is most probably due to the difference in surface finish or coating of the steels. 49
63 5.4 Process Simulation Using Finite Element Methods Since it is difficult to measure the temperature at the tool-specimen interface during the experiment, FE simulation of TCT was conducted to estimate the interface temperature using the commercial FEM software DEFORM 2-D version The FE model of TCT is shown in Figure To validate the accuracy of the simulation model, a simulation was run by using same conditions that used by Kim (2008). Simulation results of the new model were compared with provided experimental measurements and simulation results (Appendix C) The flow stress of the sheet material DP590 was obtained using the tensile and viscous pressure bulge test (Figure 5.12) [Gutscher et al. 2004]. COF vs time curves obtained from experiments were used as an input for TCT simulations to predict the temperature and compare with temperature results of CDT simulations. Curves obtained from the longest and shortest runs (Case A and Case B) were used to predict temperatures, by using speed and pressure values that are as close as possible to values obtained by CDT simulations (TCT values; 10ksi pressure and 10RPM speed appears to be closest to conditions estimated in CDT (the pressure and speed around the die corner area)). 50
64 Figure 5.11: TCT Simulation Model [Kim 2008] Table 5.4 Inputs for TCT Simulations (COF was obtained from TCTs) Workpiece Tool Workpiece Holder Material DP590 D2 D2 Speed Contact pressure Coefficient of friction 10rpm and 30rpm 10ksi and 30ksi f(time) Thermal Conductivity 50 (W/m⁰K) [Kim et al. 2008] Heat transfer coefficient Between workpiece and tool and workpiece holder 11 (W/m⁰K) [Kim et al. 2008] Initial temperature 20⁰C 20⁰C 20⁰C 51
65 Stress (MPa) Strain Figure 5.12: TCT Simulation Input: DP590 Flow Stress Curve Obtained From Tensile and Bulge Tests Temperatures that occur at the tool/sheet interface were estimated. An example of the heat distribution on the specimen is shown in Figure The increase in maximum temperatures that occur in the specimens are plotted as shown in Figure Figure 5.13: Temperature Distribution in the Specimen (See figure 5.11) (10rpm, 10ksi, 1g/m 2, the longest run (Case A), room temperature 20⁰C) 52
66 Increase in temperature (max.) (⁰C) g/m2, the longest run 1g/m2, the shorthest run 2g/m2, the longest run 2g/m2, the shorthest run Fully flood, the longest run Time (s) Fully flood, the shorthest run Figure 5.14: Increase in Maximum Temperature in TCT Specimens (DP590 (t=1.4mm), lubricant B, 10rpm, 10ksi) TCT curves obtained from the cases with the most severe conditions (30ksi pressure and 30RPM speed) were also used to predict the temperature. TCT results of 3 lubricant amounts were used for the simulations (1g/m², 2g/m² and fully flooded). The increase in maximum temperatures occur in the specimens plotted as shown in Figure
67 Increase in temperature (max.) (⁰C) Time (s) 1g/m2, the longest run 1g/m2, the shorthest run 2g/m2, the longest runt 2g/m2, the shorthest run Fully flood, the longest run Fully flood, the shorthest run Figure 5.15: Increase in Maximum Temperature in TCT Specimens (DP590 (t=1.4mm), lubricant B, 30rpm, 30ksi) Simulation results for investigated tool pressure and speed values (10ksi and 10rpm, and 30ksi and 30rpm) are compared to show the effect of the tool pressure and speed on temperature increase in the specimen (Figure 5.16). It seems that increasing tool speed and pressure results in an increase in temperature. 54
68 Increase in temperature (max.) (⁰C) rpm, 30psi 10rpm, 10psi Time (s) Figure 5.16: Increase in Maximum Temperature in TCT Specimens (Fully flooded, longest run) Conclusions Maximum temperature rise at the tool-sheet interface is reduced when the coating weight of the lubricant is increased from 1 and 2g/m 2 to fully flooded condition (Figure 5.14 and 5.15) For the TCT conditions that represent the similar pressure and speed as CDT experiments (run by CPF), maximum temperature rise at the tool-sheet interface is relatively small, around 5⁰C (TCT simulation results) (Figure 5.14), because TCT does not involve metal deformation. 55
. 5.5 Surface Roughness Measurements Surface roughness and lubricant viscosity have a strong interacting effect on the coefficient of friction [Ghalme et al. 2013].")
69 When tool pressure and speed increase from 10ksi and 10rpm to 30ksi and 30rpm, the maximum increase in temperature at the tool-sheet interface increases from 5⁰C to 19⁰C or more (Figure 5.16). 5.5 Surface Roughness Measurements Surface roughness and lubricant viscosity have a strong interacting effect on the coefficient of friction [Ghalme et al. 2013]. Since the same lubricant (Lubricant B) was used in TCT for different materials (DP590, CP800, and TWIP900), the difference between materials due to the interactive effect of surface roughness and lubricant viscosity depends on surface roughness only. Figure 5.16: Surface Roughness Measurement Device (SURFTEST SV-3100) 56
70 Average Surface Roughness, Ra (μm) Surface roughness measurements have been done for all materials by using a stylus profiler with 2-micron diameter tip. Since rolling directions of the materials were unknown, direction names are given randomly. Measurements have been repeated for 6 times for each direction and measurement length was 30mm (Figure 5.17) Rolling Direction (assumed) Transverse Direction (assumed) 0 DP590 (1.4mm) CP800 (1.4mm) TWIP900 (1.2mm) Materials Figure 5.17 Comparison of Surface Roughness of materials The difference in average surface roughness (Ra) between two directions is not significant for all tested materials. The error range of the average surface roughness of CP800 is higher than other materials. This might be due to the scratches on the sheet surface. Average surface roughness of TWIP900 is significantly lower than other two materials which are around 0.35μm (Ra of DP590=1.35μm; Ra of CP800=1.00μm). 57
 Determining the breaking down point is not straightforward since in most of the cases the breaking down point is not clear (Figure 6.")
71 CHAPTER 6: COMPARISON OF CDT AND TCT AND OVERALL CONCLUSIONS 1. Adjusting the test parameters and evaluating the machine output for TCT is difficult. Figure 6.1 Example of TCT Results (DP590, 20ksi, 20rpm, lubricant B, 2g/m²) Determining the breaking down point is not straightforward since in most of the cases the breaking down point is not clear (Figure 6.1) There are significant differences between TCT runs for the same setup conditions (specimen material, tool speed, tool pressure, and lubricant), as observed from test results (Figure 6.1). 58
72 Commonly used tool pressure (45ksi) for TCT experiments is much higher than the pressures at CDT (used by CPF, around 10ksi). This can affect the lubrication performance. In cup drawing, lubricant B shows better results than J but the TCT results show lower COF for lubricant J. Lubricant J has pressure additives, this might be the one of the reasons why lubricant J performs better at TCT where the pressures are higher. 2. The effect of plastic deformation on the temperature where in the formed part in CDT, is significantly more than the effect of friction work. In TCT, there is no plastic deformation so the temperature increase is only due to the friction. Therefore, increase in temperature in TCT (for the speed and pressure values that emulate CDT conditions) is significantly lower than in CDT (around 5⁰C in TCT and around 90⁰C in CDT) (Figure 4.12 and 5.14). 3. Using CDT is a better choice than TCT to evaluate the performance of lubricants for sheet metal forming applications. 59
73 CHAPTER 7: SUMMARY According to this study, 1. Temperatures during TCT are significantly lower than temperatures during CDT even for most severe TCT conditions (around 32⁰C in TCT and around 90⁰C in CDT ), 2. Tool pressures that used in TCT are higher than pressures occurs in CDT, 3. There is an inconsistency in TCT results (COF vs time curves for the same specimen material, tool speed, tool pressure, and lubricant vary), In summary pressure and temperature conditions found in TCT do not reflect the sheet-tool interface conditions that exist in practical stamping conditions. Therefore, to evaluate the performance of various lubricants for stamping applications, TCT has limited value. However, TCT is fast and easy to conduct. Thus, it is useful in comparing the performance of various additives in lubricants. 60
74 REFERENCES [Altan, and Tekkaya 2012] Altan, T., and Tekkaya, E. (2012). Sheet Metal Forming Fundamentals and Applications, Vol. 1 Ch. 7 Friction and Lubrication, ASM International. [Azushima et al. 1991] Azushima, A., Uda, M., and Kudo, H. (1991). An Interpretation of the Speed Dependence of the Coefficient of Friction under the Micro-PHL Condition in Sheet Drawing. Annals of CIRP, 40, [Bay et al. 1975] Bay, N., Wanheim, T. and Petersen, A.S., (1975). Ra and the average effective strain of surface asperities deformed in metal forming processes. Wear, 34, [Bech et al. 1998] Bech, J., Bay, N., and Eriksen, M. (1998). A Study of Mechanism of Liquid Lubrication in Metal Forming, Annals of the CIRP, 47, [Bhushan 2001] Bhushan, B. (2001). Surface roughness analysis and measurement techniques. Modern tribology handbook, 1, [Bhushan 2002] Bhushan, B. (2002). Introduction to Tribology. John Wiley and Sons. [Bowden, and Tabor, 1967] Bowden, F.P., and Tabor, D. (1967). Friction and Lubrication, Methuen & Co. LTD, London, U.K. [Diaz et al. 2015] Diaz, D., Fallahiarezoodar, A., Appachu, S., Altan T. (2015). CPF-2.3_14_01: Evaluation of the lubrication performance and effect of press speed upon lubrication in forming AHSS, The Ohio State University. 61
75 [Ghalme et al. 2013] Ghalme, S. G., Mankar, A., & Bhalerao, Y. J. (2013). Effect of Lubricant Viscosity and Surface Roughness on Coefficient of Friction in Rolling Contact. Tribology in Industry, 35(4), [Gutscher et al. 2004] Gutscher, G., Wu, H., Ngaile, G., and Altan, T. (2004) Determination of flow stress for sheet metal forming using the viscous pressure bulge (VPB) test, Journal of Materials Processing Technology, 146,.1-7. [Hol et al. 2015] Hol, J., Meinders, V.T., Rooij, M.B., Boogaard A.H. (2015). Multi-Scale Friction Modeling for Sheet Metal Forming: The Boundary Lubrication Regime. Tribology International, 81, [Hol 2016] Hol, Ir. "Tata Steel: Replacing Friction Experiments TriboForm." TriboForm. Web. 12 Apr < [Keeler 2008] Keeler, S. (2008). Interesting Details About Coefficient Of Friction, Metal Forming Magazine, [Kim 2008] Kim, H. (2008). Prediction and elimination of galling in forming galvanized advanced high strength steels (AHSS), Ph.D Dissertation. [Kim et al. 2008] Kim, H., Sung, J., Goodwin, F.E., and Altan, T., Investigation of Galling in Forming Galvanized Adance High Strength Steels (AHSSs) Using the Twist Compression Test (TCT). Journal of Materials Processing Technology, 205,
76 [Le, and Sutcliffe 2003] Le, H.R., and Sutcliffe, M.P.F. (2003). Evolution of Surface Pits on Stainless Steel Strip in Cold Rolling and Strip Drawing, Transactions of the ASME, 125, [Lee et al. 2002] Lee, B.H., Keum, Y.T., and Wagoner, R.H. (2002). Modeling of the Friction Caused by Lubrication and Surface Roughness in Sheet Metal Forming. Journal of Materials Processing Technology, , [Orowan, 1943] Orowan, E. (1943). The calculation of toll pressure in hot and cold flat rolling. Proceeding of Institutional Engineers Symposium, 67, [Peker et al. 2016] Peker, R., Yin, Z., Stemler, P. and Altan, T. (2016). CPF- 6.0/16/01: Cup Drawing A State of the Art. The Ohio State University. [Pfestorf et al. 1998] Pfestorf, M., Engel, U. and Geiger, M. (1998). 3D- Surface Parameters and Their Application on Deterministic Textured Metal Sheets. International Journal of Machine Tools & Manufacture, 38, [Pfestorf 2002] Pfestorf, M. (2002). Influence of Dry Dilm Lubricants and Surface Structure on the Forming Behavior of Aluminum Sheet Metal Forming. BMW Group, Munchen, Germany. [Schey 1983] Schey, J., Tribology in Metalworking: Lubrication, Friction and Wear (1983). American Society for Metal, Metal Park, Ohio 63
77 [Tolazzi et al. 2004] Tolazzi, M., Meiler, M., and Merklain, M. (2005). Tribological Investigations on Coated Steel Sheets Using the Dry Film Lubricant Dry Lube E1. Advance Materials Research, 6-8, [Wagner et al. 2002] Wagner, S., Kleinert, H., Zimmermann, R. (2002). Dry Film Lubricants for Sheet Metal Forming. Proceedings of International Conference of New Developments in Sheet Forming, [Wang et al. 2014] Wang, D., Yang, H., Li, H. (2014). Advance and Trend of Friction Study in Plastic Forming. Trans. Nonferrous Met. Soc., [Wanheim et al. 1974] Wanheim, T., Bay, N., and Peterson, A.S. (1974) A theoretically determined model for friction in metal working processes, Wear, 28, [Yin et al. 2015] Yin, Z., Fallahiarezoodar, A., and Altan, T. (2015) CPF- 2.1/15/02: Evaluation of Simulation Results Using Flow Stress Data Obtained from Tensile and Bulge Tests. The Ohio State University. 64

, lubricant J, 45ksi tool")
78 APPENDIX A Experimental Results of Preliminary TCTs DP 590 (1.4mm), lubricant B, 45ksi tool pressure, 10rpm tool speed, fully flooded DP 590 (1.4mm), lubricant J, 45ksi tool pressure, 10rpm tool speed, fully flooded 65
, lubricant B, 45ksi")
,")

79 DP 980 (1.5mm), lubricant B, 45ksi tool pressure, 10rpm tool speed, fully flooded DP 980 (1.5mm), lubricant J, 45ksi tool pressure, 10rpm tool speed, fully flooded 66
, lubricant B and J, 5ksi tool pressure,")
80 Al 5182-O (1.2mm), lubricant B and J, 5ksi tool pressure, 10rpm tool speed, fully flooded 67
, lubricant B, 10ksi tool pressure, 10rpm tool")
, lubricant B, 20ksi tool pressure, 10rpm tool")
81 APPENDIX B Experimental Results of TCTs DP 590 (1.4mm), lubricant B, 10ksi tool pressure, 10rpm tool speed, 1g/m2 coating weight: DP 590 (1.4mm), lubricant B, 20ksi tool pressure, 10rpm tool speed, 1g/m2 coating weight: 68
, lubricant B, 30ksi tool pressure, 10rpm")

82 DP 590 (1.4mm), lubricant B, 30ksi tool pressure, 10rpm tool speed, 1g/m2 coating weight: DP 590 (1.4mm), lubricant B, 10ksi tool pressure, 20rpm tool speed, 1g/m2 coating weight: 69
, lubricant B, 20ksi tool pressure, 20rpm")

83 DP 590 (1.4mm), lubricant B, 20ksi tool pressure, 20rpm tool speed, 1g/m2 coating weight: DP 590 (1.4mm), lubricant B, 30ksi tool pressure, 20rpm tool speed, 1g/m2 coating weight: 70
, lubricant B, 10ksi tool pressure, 30rpm")

84 DP 590 (1.4mm), lubricant B, 10ksi tool pressure, 30rpm tool speed, 1g/m2 coating weight: DP 590 (1.4mm), lubricant B, 20ksi tool pressure, 30rpm tool speed, 1g/m2 coating weight: 71
, lubricant B, 30ksi tool pressure, 30rpm")

85 DP 590 (1.4mm), lubricant B, 30ksi tool pressure, 30rpm tool speed, 1g/m2 coating weight: DP 590 (1.4mm), lubricant B, 10ksi tool pressure, 10rpm tool speed, 2g/m2 coating weight: 72
, lubricant B, 20ksi tool pressure, 10rpm")

86 DP 590 (1.4mm), lubricant B, 20ksi tool pressure, 10rpm tool speed, 2g/m2 coating weight: DP 590 (1.4mm), lubricant B, 30ksi tool pressure, 10rpm tool speed, 2g/m2 coating weight: 73
, lubricant B, 10ksi tool pressure, 20rpm")

87 DP 590 (1.4mm), lubricant B, 10ksi tool pressure, 20rpm tool speed, 2g/m2 coating weight: DP 590 (1.4mm), lubricant B, 20ksi tool pressure, 20rpm tool speed, 2g/m2 coating weight: 74
, lubricant B, 30ksi tool pressure, 20rpm")

88 DP 590 (1.4mm), lubricant B, 30ksi tool pressure, 20rpm tool speed, 2g/m2 coating weight: DP 590 (1.4mm), lubricant B, 10ksi tool pressure, 30rpm tool speed, 2g/m2 coating weight: 75
, lubricant B, 20ksi tool pressure, 30rpm")

89 DP 590 (1.4mm), lubricant B, 20ksi tool pressure, 30rpm tool speed, 2g/m2 coating weight: DP 590 (1.4mm), lubricant B, 30ksi tool pressure, 30rpm tool speed, 2g/m2 coating weight: 76
, lubricant B, 10ksi tool pressure,")

90 DP 590 (1.4mm), lubricant B, 10ksi tool pressure, 10rpm tool speed, fully flooded: DP 590 (1.4mm), lubricant B, 20ksi tool pressure, 10rpm tool speed, fully flooded: 77
, lubricant B, 30ksi tool pressure,")

91 DP 590 (1.4mm), lubricant B, 30ksi tool pressure, 10rpm tool speed, fully flooded: DP 590 (1.4mm), lubricant B, 10ksi tool pressure, 20rpm tool speed, fully flooded: 78
, lubricant B, 20ksi tool pressure, 20rpm tool speed, fully flooded: 4mm),")
92 DP 590 (1.4mm), lubricant B, 20ksi tool pressure, 20rpm tool speed, fully flooded: DP 590 (1.4mm), lubricant B, 30ksi tool pressure, 20rpm tool speed, fully flooded: 79
, lubricant B, 10ksi tool pressure,")

93 DP 590 (1.4mm), lubricant B, 10ksi tool pressure, 30rpm tool speed, fully flooded: DP 590 (1.4mm), lubricant B, 20ksi tool pressure, 30rpm tool speed, fully flooded: 80
, lubricant B, 30ksi tool pressure, 30rpm tool speed, fully flooded: CP 800 (1.")
94 DP 590 (1.4mm), lubricant B, 30ksi tool pressure, 30rpm tool speed, fully flooded: CP 800 (1.4mm), lubricant B, 10ksi tool pressure, 10rpm tool speed, 1g/m2 coating weight: 81
, lubricant B, 10ksi tool pressure,")

95 CP 800 (1.4mm), lubricant B, 10ksi tool pressure, 10rpm tool speed, 2g/m2 coating weight: CP 800 (1.4mm), lubricant B, 10ksi tool pressure, 10rpm tool speed, fully flooded: 82
, lubricant B, 10ksi tool pressure, 10rpm")

96 TWIP 900 (1.2mm), lubricant B, 10ksi tool pressure, 10rpm tool speed, 1g/m2 coating weight: TWIP 900 (1.2mm), lubricant B, 10ksi tool pressure, 10rpm tool speed, 2g/m2 coating weight: 83
, lubricant B, 10ksi tool pressure, 10rpm tool speed, fully flooded: Specimen names; we are using the")
97 TWIP 900 (1.2mm), lubricant B, 10ksi tool pressure, 10rpm tool speed, fully flooded: Specimen names; we are using the following designation: Material Pressure (ksi) Speed (RPM) - Coating weight (G/m2 or F- flooded) Run # 84

98 85

99 86
100 87

101 88

102 89

103 90
![APPENDIX C Validation of TCT Model by using Literature [Kim 2008] The](/docs-images/81/83870663/images/104-0.jpg "simulation was run by using same conditions with earlier work done by Kim")

104 APPENDIX C Validation of TCT Model by using Literature [Kim 2008] The simulation was run by using same conditions with earlier work done by Kim at CPF. Simulation results are compared with experimental results to validate new simulation model. Simulation inputs are shown in following 3 figures; 91

105 Geometry of the model that used in simulations shown in following figure; 92
Evaluation of Lubricant Performance Using the Cup Drawing Test (CDT)
") Evaluation of Lubricant Performance Using the Cup Drawing Test (CDT) By Cliff Hoschouer 1, Jeff Jeffery 2, Frank Kenny 2, David Diaz Infante 3 and Taylan Altan 3 1 Shiloh Industries, 2 IRMCO, 3 Center
Evaluation of Lubricant Performance Using the Cup Drawing Test (CDT) By Cliff Hoschouer 1, Jeff Jeffery 2, Frank Kenny 2, David Diaz Infante 3 and Taylan Altan 3 1 Shiloh Industries, 2 IRMCO, 3 Center
Determination of Flow Stress Data Using a Combination of Uniaxial Tensile and Biaxial Bulge Tests
 Determination of Flow Stress Data Using a Combination of Uniaxial Tensile and Biaxial Bulge Tests By Ali Fallahiarezoodar, and Taylan Altan Editor s Note: This article describes a new methodology for accurate
Taylan Altan, PhD, Professor Emeritus Center for Precision Forming the Ohio State University.
 ADVANCED METHODS for FORMING AHSS and UHS Al ALLOYS Taylan Altan, PhD, Professor Emeritus Center for Precision Forming the Ohio State University www.cpforming.org www.ercnsm.org January 2015 Center for
NEW DEVELOPMENTS IN SHEET METAL FORMING
 NEW DEVELOPMENTS IN SHEET METAL FORMING Taylan Altan Center for Precision Forming - CPF The Ohio State University Columbus, OH https://ercnsm.osu.edu / https://cpf.osu.edu Overview of CPF activities November
NEW DEVELOPMENTS IN SHEET METAL FORMING
 NEW DEVELOPMENTS IN SHEET METAL FORMING Ongoing Activities of the Center for Precision Forming - CPF The Ohio State University https://ercnsm.osu.edu / https://cpf.osu.edu May 1, 2018 Columbus, Ohio CPF
NEW DEVELOPMENTS IN SHEET METAL FORMING
 NEW DEVELOPMENTS IN SHEET METAL FORMING Ongoing Activities of the Center for Precision Forming - CPF The Ohio State University https://ercnsm.osu.edu / https://cpf.osu.edu January 5, 2018 Columbus, Ohio
Practical Methods for Estimating Formability of Sheet Materials
 Practical Methods for Estimating Formability of Sheet Materials By David Diaz Infante, Berk Aykas, Ali Fallahiarezoodar and Taylan Altan Formability is the ability of a sheet material of a given composition
Lubrication in tube hydroforming (THF) Part II. Performance evaluation of lubricants using LDH test and pear-shaped tube expansion test
 Part II. Performance evaluation of lubricants using LDH test and pear-shaped tube expansion test") Journal of Materials Processing Technology 146 (2004) 116 123 Lubrication in tube hydroforming (THF) Part II. Performance evaluation of lubricants using LDH test and pear-shaped tube expansion test Gracious
Journal of Materials Processing Technology 146 (2004) 116 123 Lubrication in tube hydroforming (THF) Part II. Performance evaluation of lubricants using LDH test and pear-shaped tube expansion test Gracious
Reduction of springback in hat-bending using variable blank holder force using servo hydraulic cushion
 #688-3 April 2018 Stamping Journal Reduction of springback in hat-bending using variable blank holder force using servo hydraulic cushion By Tanmay Gupta, Ali Fallahiarezoodar, Ethan McLaughlin and Taylan
Die Design Software and Simulation Technology Experience
 Die Design Software and Simulation Technology Experience The Influence of Material Properties on Die Design Peter Ulintz Technical Director Precision Metalforming Association The Influence of Sheet Metal
CENTER FOR PRECISION FORMING (CPF) Membership Benefits (June 2015) (www.cpforming.org and
 Membership Benefits (June 2015) (www.cpforming.org and") College of Engineering CENTER FOR PRECISION FORMING (CPF) Membership Benefits (June 2015) (www.cpforming.org and www.ercnsm.org) Engineering Research Center for Net Shape Manufacturing 339 Baker Systems
College of Engineering CENTER FOR PRECISION FORMING (CPF) Membership Benefits (June 2015) (www.cpforming.org and www.ercnsm.org) Engineering Research Center for Net Shape Manufacturing 339 Baker Systems
A CRITICAL EVALUATION OF THE DOUBLE CUP EXTRUSION TEST FOR SELECTION OF COLD FORGING LUBRICANTS
 A CRITICAL EVALUATION OF THE DOUBLE CUP EXTRUSION TEST FOR SELECTION OF COLD FORGING LUBRICANTS Timothy Schrader, Manas Shirgaokar, Taylan Altan ERC for Net Shape Manufacturing, the Ohio State University,
Advances and Challenges in Sheet Metal Forming Technology
 Advances and Challenges in Sheet Metal Forming Technology T. Altan, A. Groseclose, E. Billur, S. Subramonian, T. Mao, Engineering Research Center for Net Shape Manufacturing (ERC/NSM), The Ohio State University,
Fracture and springback on Double Bulge Tube Hydro-Forming
 American Journal of Applied Sciences 5 (8): -6, 28 ISSN 56-929 28 Science Publications Fracture and springback on Double Bulge Tube Hydro-Forming F. Djavanroodi, M. Gheisary Department of Mechanical Engineering,
Editor s Note: This is Part I of a two-part series that discusses factors affecting the
 PROOFED R&D Update Nov/Dec 17 STAMPING Journal Blanking and edge fracture in flanging of AHSS, Part I Test methods for evaluation By David Diaz and Dr. Taylan Altan Editor s Note: This is Part I of a two-part
Fundamental Course in Mechanical Processing of Materials. Exercises
 Fundamental Course in Mechanical Processing of Materials Exercises 2017 3.2 Consider a material point subject to a plane stress state represented by the following stress tensor, Determine the principal
Numerical Simulation of Hydro-mechanical Deep Drawing - A Study on the Effect of Process Parameters on Drawability and Thickness Variation
 Numerical Simulation of Hydro-mechanical Deep Drawing - A Study on the Effect of Process Parameters on Drawability and Thickness Variation Swadesh Kumar Singh and D. Ravi Kumar* Department of Mechanical
RESIDUAL STRESSES DUE TO DEEP-DRAWING OF PRE-COATED ALUMINUM-ALLOY SHEETS
 Materials Science Forum Online: 005-07-15 ISSN: 166-975, Vols. 490-491, pp 35-363 doi:10.40/www.scientific.net/msf.490-491.35 005 Trans Tech Publications, Switzerland RESIDUAL STRESSES DUE TO DEEP-DRAWING
Fundamentals of Metal Forming
 Fundamentals of Metal Forming Chapter 15 15.1 Introduction Deformation processes have been designed to exploit the plasticity of engineering materials Plasticity is the ability of a material to flow as
Evaluation of Formability and Drawability of Al 5182-O Using a Servo Drive Press DISSERTATION
 Evaluation of Formability and Drawability of Al 5182-O Using a Servo Drive Press DISSERTATION Presented in Partial Fulfillment of the Requirements for the Degree Doctor of Philosophy in the Graduate School
Finite element simulation of magnesium alloy sheet forming at elevated temperatures
 Journal of Materials Processing Technology 146 (2004) 52 60 Finite element simulation of magnesium alloy sheet forming at elevated temperatures Hariharasudhan Palaniswamy, Gracious Ngaile, Taylan Altan
Determination of biaxial flow stress using frictionless dome test
 Available online at www.sciencedirect.com Procedia Engineering 00 (2014) 000 000 www.elsevier.com/locate/procedia 11th International Conference on Technology of Plasticity, ICTP 2014, 19-24 October 2014,
Analysis and prediction of springback 3 point bending and U-bending
 Analysis and prediction of springback 3 point bending and U-bending THESIS Presented in Partial Fulfillment of the Requirements for the Degree of Master of Science in the Graduate School of The Ohio State
METAL FORMING AND THE FINITE-ELEMENT METHOD SHIRO KOBAYASHI SOO-IK OH TAYLAN ALTAN
 METAL FORMING AND THE FINITE-ELEMENT METHOD SHIRO KOBAYASHI SOO-IK OH TAYLAN ALTAN New York Oxford OXFORD UNIVERSITY PRESS 1989 CONTENTS Symbols, xiii 1. Introduction, 1 1.1 Process Modeling, 1 1.2 The
LIGHTWEIGHTING IN AUTOMOTIVE INDUSTRY
 LIGHTWEIGHTING IN AUTOMOTIVE INDUSTRY How New Stamping Technologies Can Help? Taylan Altan, Professor (Emeritus) and Director Center for Precision Forming - CPF The Ohio State University https://ercnsm.osu.edu
Formability R. Chandramouli Associate Dean-Research SASTRA University, Thanjavur
 Formability R. Chandramouli Associate Dean-Research SASTRA University, Thanjavur-613 401 Joint Initiative of IITs and IISc Funded by MHRD Page 1 of 8 Table of Contents 1.Formability... 3 1.1 Introduction:...
Friction of Aluminium in Deep Drawing
 Friction of Aluminium in Deep Drawing Wilko C. Emmens, Jan Bottema Hoogovens R&D, P.O.Box 10.000, 1970 CA IJmuiden, the Netherlands IDDRG CONGRESS 1998 Abstract Aluminium shows a large amount of asperity
Introduction to EWI Forming Center
 Introduction to EWI Forming Center Oct. 21, 2013 Hyunok Kim, Ph.D. Technical Director EWI Forming Center 1 National Priority for Forming Technology Advanced Forming and Joining Technologies are recognized
FINITE ELEMENT SIMULATION OF SPRINGBACK IN TRIP 780 ADVANCED HIGH STRENGTH STEEL
 FINITE ELEMENT SIMULATION OF SPRINGBACK IN TRIP 780 ADVANCED HIGH STRENGTH STEEL M. Safaei, W. De Waele, M. Abdel Wahab, P. De Baets Ghent University, Laboratory Soete, Belgium Abstract This paper discusses
CHAPTER 5 FINITE ELEMENT ANALYSIS AND AN ANALYTICAL APPROACH OF WARM DEEP DRAWING OF AISI 304 STAINLESS STEEL SHEET
 97 CHAPTER 5 FINITE ELEMENT ANALYSIS AND AN ANALYTICAL APPROACH OF WARM DEEP DRAWING OF AISI 304 STAINLESS STEEL SHEET 5.1 INTRODUCTION Nowadays, the finite element based simulation is very widely used
where n is known as strain hardening exponent.
 5.1 Flow stress: Flow stress is the stress required to sustain a certain plastic strain on the material. Flow stress can be determined form simple uniaxial tensile test, homogeneous compression test, plane
International Journal of Engineering Research ISSN: & Management Technology March-2016 Volume 3, Issue-2
 International Journal of Engineering Research ISSN: 2348-4039 & Management Technology March-2016 Volume 3, Issue-2 Email: editor@ijermt.org www.ijermt.org Die Defects Analysis Using Taguchi Method Harvinder
VTU NOTES QUESTION PAPERS NEWS RESULTS FORUMS
 Sheet Metal Forming Introduction Sheet metal is simply metal formed into thin and flat pieces. It is one of the fundamental forms used in metalworking, and can be cut and bent into a variety of different
#698 Estimation of Cutting Parameters in Two-Stage Piercing to Reduce Edge Strain Hardening
 #698 Estimation of Cutting Parameters in Two-Stage Piercing to Reduce Edge Strain Hardening Abstract Diaz-Infante D., Narayanan, A. and Altan T. The Ohio State University Edge fracture is a common problem
Water Droplet Impingement Erosion (WDIE) Water Droplet Impingement Erosion (WDIE) Solid Particle Erosion. Outline
 Water Droplet Impingement Erosion (WDIE) Solid Particle Erosion. Outline") Water Droplet Impingement Erosion (WDIE) Incoming air temperature Outline Mass flow rate Introduction Example Output power Energy Demand Temperature Turbine efficiency 1 F 0.3-0.5% Turbine inlet cooling
Water Droplet Impingement Erosion (WDIE) Incoming air temperature Outline Mass flow rate Introduction Example Output power Energy Demand Temperature Turbine efficiency 1 F 0.3-0.5% Turbine inlet cooling
BMM3643 Manufacturing Processes Bulk Metal Forming Processes (Forging Operations)
") BMM3643 Manufacturing Processes Bulk Metal Forming Processes (Forging Operations) by Dr Mas Ayu Bt Hassan Faculty of Mechanical Engineering masszee@ump.edu.my Chapter Synopsis This chapter will introduced
BMM3643 Manufacturing Processes Bulk Metal Forming Processes (Forging Operations) by Dr Mas Ayu Bt Hassan Faculty of Mechanical Engineering masszee@ump.edu.my Chapter Synopsis This chapter will introduced
ME 333 Manufacturing Processes II
 ME 333 Manufacturing Processes II Chapter 5 Metal Working Processes Mechanical Engineering University of Gaziantep Dr. A. Tolga Bozdana www.gantep.edu.tr/~bozdana Introduction Metal forming involves large
Springback Prediction in Bending of AHSS-DP 780
 Springback Prediction in Bending of AHSS-DP 780 N. Kardes Sever, O. H. Mete, Y. Demiralp, C. Choi, T. Altan Center for Precision Forming (CPF, formerly ERC/NSM) The Ohio State University Columbus, OH ABSTRACT
MANUFACTURING SCIENCE-I Time: 1 hour (EME-402) Max. marks:30
 Max. marks:30") B.Tech. [SEM-IV (ME-41,42,43 & 44] QUIZ TEST-1 (Session: 2010-11) MANUFACTURING SCIENCE-I Time: 1 hour (EME-402) Max. marks:30 Note: All questions are compulsory. Q-1). Why there is no material wastage
B.Tech. [SEM-IV (ME-41,42,43 & 44] QUIZ TEST-1 (Session: 2010-11) MANUFACTURING SCIENCE-I Time: 1 hour (EME-402) Max. marks:30 Note: All questions are compulsory. Q-1). Why there is no material wastage
Casting. Forming. Sheet metal processing. Powder- and Ceramics Processing. Plastics processing. Cutting. Joining.
 Traditional Manufacturing Processes Casting Forming Sheet metal processing Powder- and Ceramics Processing Plastics processing Cutting Joining Surface treatment FUNDAMENTALS OF METAL FORMING Overview of
Introduction of EWI Forming Center
 Introduction of EWI Forming Center November 14, 2012 Ron Brown Director EWI Forming Center Office 614-688-5085 E-mail: rbrown@ewi.org Hyunok Kim Technical Director EWI Forming Center Office: 614-688-5239
ERC/NSM Activities. Research for Industry and Government
 / Activities Research for Industry and Government Stamping Hydroforming Machining Forging / Activities in Tube Hydroforming 1. Materials Determination of material flow stress data for tubular materials
Forming of locally made sheet steels
 Forming of locally made sheet steels Issues and Opportunities HH1 Dipl.-Ing. Holger Heinzel (HERA) Prof. Thomas Neitzert (AUT) Slide 1 HH1 Local or locally? Holger Heinzel, 29/10/2006 Content Local material
Types of Strain. Engineering Strain: e = l l o. Shear Strain: γ = a b
 Types of Strain l a g Engineering Strain: l o l o l b e = l l o l o (a) (b) (c) Shear Strain: FIGURE 2.1 Types of strain. (a) Tensile. (b) Compressive. (c) Shear. All deformation processes in manufacturing
Formability of Warm Deep Drawing Process for AA1050-H18 Pyramidal Cups
 Formability of Warm Deep Drawing Process for AA1050-H18 Pyramidal Cups A. Chennakesava Reddy Professor, Department of Mechanical Engineering, JNT University, Hyderabad-500 085, India Abstract: In this
Hydraulic crimping: application to the assembly of tubular components
 Journal of Materials Processing Technology 146 (2004) 44 51 Hydraulic crimping: application to the assembly of tubular components Manas Shirgaokar a, Gracious Ngaile a, Taylan Altan a,, Jang-Horng Yu b,
Numerical Simulation of Sliding Contact during Sheet Metal Stamping
 Numerical Simulation of Sliding Contact during Sheet Metal Stamping Biglari F. R. * Nikbin K. ** O Dowd N. P. ** Busso E.P. ** * Mechanical Engineering Department, Amirkabir University of Technology, Hafez
Frictional Condition Evaluation in Hot Magnesium Forming Using T- Shape and Ring Compression Tests
 College of Engineering Society of Manufacturing University of Tehran Engineering of Iran 3 rd International Conference on Manufacturing Engineering ICME211, Tehran, Iran 27-29 December 211 Frictional Condition
1. Consider the following stress-strain responses of metallic materials:
 TECNOLOGIA MECÂNICA Mestrado em Engenharia de Materiais January 3, 2015 Number: Name: 1. Consider the following stress-strain responses of metallic materials: Y Load Unload Y E Load E Unload Y (1) (2)
ANALYSIS OF SWIFT CUP DRAWING TEST
 ANALYSIS OF SWIFT CUP DRAWING TEST Dr.R.Uday Kumar 1, Dr.G.Chandramohan Reddy 2 1 Associate professor, Dept.of Mechanical Engineering, Mahatma Gandhi Institute of Technology, Gandipet, Hyderabad 500075.Telangana,
Chapter 4 Surfaces, Tribology, Dimensional Characteristics, Inspection and Product Quality Assurance
 Chapter 4 Surfaces, Tribology, Dimensional Characteristics, Inspection and Product Quality Assurance Cross-Section of Metal Surface FIGURE 4.1 Schematic illustration of the cross-section of the surface
EFFECT ON FINITE ELEMENT SIMULATION OF TUBE HYDROFORMING PROCESS
 EFFECT ON FINITE ELEMENT SIMULATION OF TUBE HYDROFORMING PROCESS Vishnu P. Sharma 1, Kamlesh Kushwaha 2 1 M.E. Scholar, MPCT, Gwalior, 2 Assistant Professor, MPCT, Gwalior Abstract: - Hydroforming process
HANDBOOK OF DIE DESIGN
 HANDBOOK OF DIE DESIGN Ivana Suchy Consultant, Design Engineer Fair Lawn, New Jersey Second Edition McGRAW-HILL New York Chicago San Francisco Lisbon London Madrid Mexico City Milan New Delhi San Juan
Effect of E-modulus variation on springback and a practical solution
 Effect of E-modulus variation on springback and a practical solution Ali Fallahiarezoodar, Cliff Goertemiller, Aanandita Katre, Taylan Altan Center for Precision Forming, The Ohio State University, Columbus,
Thermal effects and friction in forming
 Thermal effects and friction in forming R. Chandramouli Associate Dean-Research SASTRA University, Thanjavur-613 401 Joint Initiative of IITs and IISc Funded by MHRD Page 1 of 10 Table of Contents 1.Thermal
NUMERICAL AND EXPERIMENTAL INVESTIGATION OF FORGING PROCESS OF A CV JOINT OUTER RACE
 NUMERICAL AND EXPERIMENTAL INVESTIGATION OF FORGING PROCESS OF A CV JOINT OUTER RACE 1 M.M. MOHAMMADI and 2 M.H.SADEGHI. 1 CAD/CAM Laboratory, Manufacturing Engineering Division, School of Engineering,
International Journal of Modern Trends in Engineering and Research e-issn No.: , Date: 2-4 July, 2015
 International Journal of Modern Trends in Engineering and Research www.ijmter.com e-issn :2349-9745, Date: 2-4 July, 2015 Experimental and Computer Aided Analysis for the Reduction of Damage in Sheet Metal
Study on optimization of process parameters for hydromechanical deep drawing of trapezoid cup
 Journal of Engineering Technology and Education, Vol. 8, No.1 March 2011, pp. 53-71 Study on optimization of process parameters for hydromechanical deep drawing of trapezoid cup Thanh-Phong Dao, Shyh-Chour
SIMULATION ANALYSIS OF MINIMUM BENDING RADIUS FOR LEAD FRAME COPPER ALLOYS
 Engineering Review, Vol. 33, Issue 2, 101-106, 2013. 101 SIMULATIO AALYSIS OF MIIMUM BEDIG RADIUS FOR LEAD FRAME COPPER ALLOYS J. Su * S. Jia F. Ren School of Materials Science and Engineering, Henan University
Warm Deep Drawing of Aluminium Sheet. Abstract. P.J. Bolt 1, R.J. Werkhoven 1, A.H. van den Boogaard 2. 1 Introduction
 Warm Deep Drawing of Aluminium Sheet P.J. Bolt 1, R.J. Werkhoven 1, A.H. van den Boogaard 2 1 TNO Industrial Technology, The Netherlands, 2 University of Twente, The Netherlands Abstract Aluminium sheet
Chapter 14: Metal-Forging Processes and Equipments
 Manufacturing Engineering Technology in SI Units, 6 th Edition Chapter 14: Metal-Forging Processes and Equipments Chapter Outline Introduction Open-die Forging Impression-die and Closed-die Forging Various
2
 1 2 3 4 5 6 7 Direct -Straightforward steady forward force by hydraulic ram Indirect -Has the advantage that there is no friction between billet and chamber (no movement) -Note dummy block at face of ram
Modelling and Experimental Research in Hot Precision Forging of Duplicate Gear Blank Zhi Li1, a, Baoyu Wang1, b
 4th International Conference on Mechatronics, Materials, Chemistry and Computer Engineering (ICMMCCE 2015) Modelling and Experimental Research in Hot Precision Forging of Duplicate Gear Blank Zhi Li1,
THE EFFECT OF SHEET THICKNESS TO FORMABILITY USING HYPERFORM FATIN ZULAIKHA BINTI MOHD HATANAN
 THE EFFECT OF SHEET THICKNESS TO FORMABILITY USING HYPERFORM FATIN ZULAIKHA BINTI MOHD HATANAN B.ENG (HONS.) MANUFACTURING ENGINEERING UNIVERSITI MALAYSIA PAHANG i THESIS STATUS VALIDATION FORM UNIVERSITI
Chapter 2: Mechanical Behavior of Materials
 Chapter : Mechanical Behavior of Materials Definition Mechanical behavior of a material relationship - its response (deformation) to an applied load or force Examples: strength, hardness, ductility, stiffness
A method for evaluating friction using a backward extrusion-type forging
 Journal of Materials Processing Technology, 33 (1992) 19-123 Elsevier 13-9';)- J/ 19 A method for evaluating friction using a backward extrusion-type forging G. Shen Department of ndustrial and Systems
INDEX. forging Axisymmetric isothermal forging, cabbaging, compression of cylinders,
 INDEX Accuracy of simulation, 333 Air bending, 21, 141-147 Air rounding, 21 ALPID program, 136 Analysis in metal forming, 26-52 closed-die forging, 34, 35-36, 37 cold extrusion, 39-41 cold forging, 39-41
Sheet Metal Forming FUNDAMENTALS. Edited by Taylan Altan and A. Erman Tekkaya
 Sheet Metal Forming FUNDAMENTALS Edited by Taylan Altan and A. Erman Tekkaya Materials Park, Ohio 44073-0002 Copyright 2012 by All rights reserved No part of this book may be reproduced, stored in a retrieval
Application of Mechanical Trimming to Hot Stamped 22MnB5 Parts for Energy Saving
 INTERNATIONAL JOURNAL OF PRECISION ENGINEERING AND MANUFACTURING Vol. 15, No. 6, pp. 1087-1093 JUNE 2014 / 1087 DOI: 10.1007/s12541-014-0441-7 Application of Mechanical Trimming to Hot Stamped 22MnB5 Parts
Deformation Behavior of Ultra-Thin Metal Foils in Strip Drawing Friction Test
 Key Engineering Materials Vol. 443 (2010) pp 110-115 (2010) Trans Tech Publications, Switzerland doi:10.4028/www.scientific.net/kem.443.110 Deformation Behavior of Ultra-Thin Metal Foils in Strip Drawing
Research on the mechanism of weld-line movement of. U-shape TWB parts
 5th International Conference on Advanced Engineering Materials and Technology (AEMT 2015) Research on the mechanism of weld-line movement of U-shape TWB parts Yong Gan 1, a, Xi Qin 1, b*, Hanchao Wang
Arch. Metall. Mater. 62 (2017), 2B,
, 2B,") Arch. Metall. Mater. 62 (2017), 2B, 1319-1323 DOI: 10.1515/amm-2017-0201 C.K. LEE*, Y.C. KIM** # A STUDY ON CHANGES IN THICKNESS OF STS304 MATERIAL IN THE PROGRESSIVE DRAWING PROCESS In the drawing process,
Arch. Metall. Mater. 62 (2017), 2B, 1319-1323 DOI: 10.1515/amm-2017-0201 C.K. LEE*, Y.C. KIM** # A STUDY ON CHANGES IN THICKNESS OF STS304 MATERIAL IN THE PROGRESSIVE DRAWING PROCESS In the drawing process,
MANUFACTURING TECHNOLOGY
 MANUFACTURING TECHNOLOGY UNIT II Hot & Cold Working - Drawing & Extrusion Drawing Drawing is an operation in which the cross-section of solid rod, wire or tubing is reduced or changed in shape by pulling
Chapter 4 MECHANICAL PROPERTIES OF MATERIAL. By: Ardiyansyah Syahrom
 Chapter 4 MECHANICAL PROPERTIES OF MATERIAL By: Ardiyansyah Syahrom Chapter 2 STRAIN Department of Applied Mechanics and Design Faculty of Mechanical Engineering Universiti Teknologi Malaysia 1 Expanding
3. TEST METHOD FOR BOND PROPERTIES OF CONTINUOUS FIBER SHEETS TO CONCRETE (JSCE-E )
") 3. TEST METHOD FOR BOND PROPERTIES OF CONTINUOUS FIBER SHEETS TO CONCRETE (JSCE-E 543-2000) 1. Scope This specification describes the method used to test the bond properties to concrete of the continuous
3. TEST METHOD FOR BOND PROPERTIES OF CONTINUOUS FIBER SHEETS TO CONCRETE (JSCE-E 543-2000) 1. Scope This specification describes the method used to test the bond properties to concrete of the continuous
ABSTRACT. The tube hydroforming (THF) process requires the internal pressurization of a tube
 process requires the internal pressurization of a tube") ABSTRACT GIBSON, M. CHRISTOPHER. Investigation of Tube Hydroforming Process Envelope for Macro/Meso Scalability. (Under the direction of Dr. Gracious Ngaile.) The tube hydroforming (THF) process requires
ABSTRACT GIBSON, M. CHRISTOPHER. Investigation of Tube Hydroforming Process Envelope for Macro/Meso Scalability. (Under the direction of Dr. Gracious Ngaile.) The tube hydroforming (THF) process requires
CHAPTER 1 INTRODUCTION
 1 CHAPTER 1 INTRODUCTION Metal forming processes are classified into bulk forming processes and sheet metal forming processes. In both types of process, the surface of the deforming metal and tools in
Application of The Finite Volume Method to Upset Forging of Cylinders. Introduction. Nomenclature. Arjaan J. Buijk
 Arjaan J. Buijk Manufacturing Division MSC.Software Corporation arjaan.buijk@mscsoftware.com Presented at: Forging Fair 2000 April 13, 2000 Columbus, Ohio Application of The Finite Volume Method to Upset
END FORMING OF THIN-WALLED TUBES USING A DIE
 END FORMING OF THIN-WALLED TUBES USING A DIE Gouveia B. P. P. IST, DEM, Av. Rovisco Pais, 1049-001 Lisboa, Portugal, e-mail: bgouveia@ist.utl.pt. Alves M. L. Instituto Politécnico de Leiria, Departamento
Chapter 15 Extrusion and Drawing of Metals
 Introduction Chapter 15 Extrusion and Drawing of Metals Alexandra Schönning, Ph.D. Mechanical Engineering University of North Florida Figures by Manufacturing Engineering and Technology Kalpakijan and
Optimisation of the blank holder stiffness in deep drawing processes by using FEA
 Optimisation of the blank holder stiffness in deep drawing processes by using FEA Ranko Radonjic 1a, Mathias Liewald 1b, Fei Han 1c 1 University of Stuttgart, Institute for Metal Forming Technology Abstract
Simulation studies on Deep Drawing Process for the Evaluation of Stresses and Strains
 International Journal of Computational Engineering Research Vol, 03 Issue, 4 Simulation studies on Deep Drawing Process for the Evaluation of Stresses and Strains A.Purushotham Department of Mechanical
Single Point Incremental Forming of Polymers
 Single Point Incremental Forming of Polymers Tânia A. F. Marques Instituto Superior Técnico, T. U. Lisbon, Portugal E-mail: taniaafm47@gmail.com Abstract The actual need of the constant introduction of
FINITE VOLUME ANALYSIS OF TWO-STAGE FORGING PROCESS FOR ALUMINIUM 7075 ALLOY
 FINITE VOLUME ANALYSIS OF TWO-STAGE FORGING PROCESS FOR ALUMINIUM 7075 ALLOY M. Vidya Sagar a and A. Chennakesava Reddy b a Associate Professor, Department of Mechanical Engineering, JNTUH College of Engineering,
Rolling processes. Fig. (5-1)
") Page1 Rolling processes 5-1 introduction: Rolling is the process of reducing the thickness or changing the cross section of a long workpiece by compressive forces applied through a set of rolls, as shown
Page1 Rolling processes 5-1 introduction: Rolling is the process of reducing the thickness or changing the cross section of a long workpiece by compressive forces applied through a set of rolls, as shown
Challenges in Forming Advanced High Strength Steels
 285 Challenges in Forming Advanced High Strength Steels E. Billur, M.S. and Prof. Dr-Ing T. Altan Engineering Research Center for Net Shape Manufacturing (ERC/NSM) www.ercnsm.org Abstract Advanced High
18 FUNDAMENTALS OF METAL FORMING. Metal Forming and Sheet Metalworking 18.1 OVERVIEW OF METAL FORMING. Chapter Contents
 Part V Metal Forming and Sheet Metalworking 18 FUNDAMENTALS OF METAL FORMING Chapter Contents 18.1 Overview of Metal Forming 18.2 Material Behavior in Metal Forming 18.3 Temperature in Metal Forming 18.4
Forming Simulation and Die Design in Sheet Metal Forming
 Forming Simulation and Die Design in Sheet Metal Forming Pratik Shah 1, D N Korade 2, K R Jagtap 3, P D Darade 4 1 PG Student, Sinhgad Institute of Technology and Science, Pune, India 2,3,4Asst. Professor,
Upset forging of a circular disc in open die forging. Analysis involves cylindrical coordinates
 12 Upset forging of a circular disc in open die forging Analysis involves cylindrical coordinates The stresses acting on an elemental volume in a disc are: σ r = radial stress responsible for increase
Forming of ultra-high-strength sheet metals with alternating blank draw-in
 Forming of ultra-high-strength sheet metals with alternating blank draw-in Ranko Radonjic 1a, Mathias Liewald 1b 1a,b University of Stuttgart, Institute for Metal Forming Technology (IFU) Holzgartenstrasse
Investigation of Surface Topography Effects on Metal Flow Under Lubricated Hot Compression of Aluminum
 Marquette University e-publications@marquette Master's Theses (2009 -) Dissertations, Theses, and Professional Projects Investigation of Surface Topography Effects on Metal Flow Under Lubricated Hot Compression
Prediction of Crack Location in Deep Drawing Processes Using Finite Element Simulation
 Copyright 2012 Tech Science Press CMC, vol.32, no.1, pp.15-27, 2012 Prediction of Crack Location in Deep Drawing Processes Using Finite Element Simulation S. K. Panthi 1 and Sanjeev Saxena 2 Abstract:
A given material (shapeless or a simple geometry) Rolling, extrusion, forging, bending, drawing (plastic deformation)
 Rolling, extrusion, forging, bending, drawing (plastic deformation)") A given material (shapeless or a simple geometry) Primary shaping processes Metal forming processes Metal cutting processes Metal treatment processes A complex geometry (shape, size, accuracy, tolerances,
A given material (shapeless or a simple geometry) Primary shaping processes Metal forming processes Metal cutting processes Metal treatment processes A complex geometry (shape, size, accuracy, tolerances,
PUNCH FORCE BEHAVIOR DURING MICRO V-BENDING PROCESS OF THE COPPER FOIL
 International Journal of Technology (017) 7: 1314-130 ISSN 086-9614 IJTech 017 PUNCH FORCE BEHAVIOR DURING MICRO V-BENDING PROCESS OF THE COPPER FOIL Gandjar Kiswanto 1*, Aida Mahmudah 1,, Dedi Priadi
Simulation based Control of Weld Line Movement in Tailor Welded Blanks
 Simulation based Control of Weld Line Movement in Tailor Welded lanks Manish Thakkar and P. P. Date Department of Mechanical Engineering,IIT ombay, Powai, Mumbai 400 076, India Email :- ppdate@iitb.ac.in,manishthakkar@iiitb.ac.in
Determination of Optimal Preform Part for Hot Forging Process of the Manufacture Axle Shaft by Finite Element Method
 AIJSTPME (2013) 6(1): 35-42 Determination of Optimal Preform Part for Hot Forging Process of the Manufacture Axle Shaft by Finite Element Method Sukjantha V. Department of Production Engineering, the Sirindhorn
Abstract. 1 Introduction
 The analysis of forming process for bimetal materials Stefan Kapinski Institute ofmachine Design Fundamentals Narbutta 84, 02-524 Warszawa, Poland EMail kapinska@sggw.waw.pl Abstract The paper presents
Objectives. This chapter provides fundamental background on processes of drawing of rods, wires and tubes.
 WIRE DRAWING Objectives This chapter provides fundamental background on processes of drawing of rods, wires and tubes. Mathematical approaches for the calculation of drawing load will be introduced. Finally
International Journal of Scientific Engineering and Applied Science (IJSEAS) Volume-2, Issue-2, February 2016 ISSN:
 Volume-2, Issue-2, February 2016 ISSN:") High Temperature and High Strain Rate Superplastic Deep Drawing Process for AA2618 Alloy Cylindrical Cups Chennakesava R Alavala Department of mechanical Engineering, JNT University, Hyderabad, India Abstract
High Temperature and High Strain Rate Superplastic Deep Drawing Process for AA2618 Alloy Cylindrical Cups Chennakesava R Alavala Department of mechanical Engineering, JNT University, Hyderabad, India Abstract
The Relationship between Constant Friction Factor and Coefficient of Friction in Metal Forming Using Finite Element Analysis
 IJMF, Iranian Journal of Materials Forming, Vol. 1, No. 2, pp 14-22 Printed in The Islamic Republic of Iran, 2014 Shiraz University The Relationship between Constant Friction Factor and Coefficient of