Superposition and Synthetic Genetic Devices: Framework and Model System to Investigate Linearity in Escherichia coli
|
|
|
- Merry Shelton
- 6 years ago
- Views:
Transcription

1 Superposition and Synthetic Genetic Devices: Framework and Model System to Investigate Linearity in Escherichia coli Meghdad Hajimorad Electrical Engineering and Computer Sciences University of California at Berkeley Technical Report No. UCB/EECS May 4, 2011
2 Copyright 2011, by the author(s). All rights reserved. Permission to make digital or hard copies of all or part of this work for personal or classroom use is granted without fee provided that copies are not made or distributed for profit or commercial advantage and that copies bear this notice and the full citation on the first page. To copy otherwise, to republish, to post on servers or to redistribute to lists, requires prior specific permission.
3 Superposition and Synthetic Genetic Devices: Framework and Model System to Investigate Linearity in Escherichia coli by Meghdad Hajimorad A dissertation submitted in partial satisfaction of the requirements for the degree of Doctor of Philosophy in Engineering Electrical Engineering and Computer Sciences in the GRADUATE DIVISION of the UNIVERSITY of CALIFORNIA, BERKELEY Committee in charge: Professor Jay D. Keasling, Co-Chair Professor Paul R. Gray, Co-Chair Professor Bernhard E. Boser Professor J. Christopher Anderson Spring 2011
4 Superposition and Synthetic Genetic Devices: Framework and Model System to Investigate Linearity in Escherichia coli Copyright 2011 by Meghdad Hajimorad
5 Abstract Superposition and Synthetic Genetic Devices: Framework and Model System to Investigate Linearity in Escherichia coli by Meghdad Hajimorad Doctor of Philosophy in Electrical Engineering and Computer Sciences University of California, Berkeley Professors Jay D. Keasling and Paul R. Gray, Co-chairs The ability to compose biological systems from smaller elements that act independently of the other upon assembly may help make the forward engineering of biological systems practical. Engineering biology in this manner is made difficult by the inherent nonlinear response of organisms to genetic devices. Devices are inevitably coupled to one another in the cell because they share the same gene expression machinery for expression. Thus, new properties can emerge when devices that had been characterized in isolation are expressed concurrently. We show in this report that, similar to physical systems, the Escherichia coli (E. coli) transcriptional system can exhibit linear behavior under small perturbation conditions. This, in turn, allows devices to be treated as independent modules. A framework and model system consisting of three devices was developed to investigate linear system behavior in E. coli. The framework employed the transfer curve concept to determine the amount of nonlinearity elicited by the E. coli transcriptional system in response to the devices. To this effect, the model system was quantitatively characterized using real-time quantitative PCR to produce device transfer curves (DTCs). Two of the devices encoded the bacterial neomycin phosphotransferase II (nptii) and chloramphenicol acetyl transferase (cat), while the third encoded the jellyfish-originating green fluorescent protein (gfp). The gfp device was the most nonlinear in our system, with nptii and cat devices eliciting linear responses. Superposition experiments verified these findings, with independence among the three devices having been lost when gfp was present at copy numbers above the lowest one used. Elucidation of the mechanism underlying the nonlinearity observed in gfp may lead to design rules that ensure linear system behavior, enabling the accurate prediction of the quantitative behavior of a system assembled from individually characterized devices. This research suggests that biological systems follow principles similar to physical ones, and that concepts borrowed from the latter (such as DTCs) may be of use in the characterization and design of biological systems. 1
6 Table of Contents ACKNOWLEDGEMENTS...III CHAPTER 1: INTRODUCTION...1 Background... 1 Motivation... 4 Thesis Organization... 8 CHAPTER 2: PRELIMINARY INVESTIGATION OF SUPERPOSITION...10 Background Results Superposition improved as copy number was reduced Discussion Methods CHAPTER 3: INVESTIGATION OF LINEARITY VIA DEVICE TRANSFER CURVES...20 Background Results Copy number of genetic device varied with plasmid origin of replication Linear device transfer curves obtained in E. coli Introduction of gfp genetic device led to nonlinear device transfer curves Superposition lost at higher expression levels with the addition of gfp Discussion Methods CHAPTER 4: PLASMID COPY NUMBER CHARACTERIZATION OF A SET OF BGLBRICK-COMPATIBLE VECTORS...43 Background i
7 Results and Discussion Copy number of plasmid in single plasmid strain Copy number of plasmid in multi-plasmid strain Methods CHAPTER 5: CONCLUSION...49 Thesis Summary Future Directions BIBLIOGRAPHY...51 ii
8 Acknowledgements As is the case with any endeavor, the completion of this project would not have been possible without the support and guidance of others. I would like to thank my research advisors Professors Jay D. Keasling and Paul R. Gray for the opportunity to work on this project. Both created an environment conducive for growth as an engineer and scientist, allowing me with the ability to explore ideas and research directions within the broader project goals. Indeed, this research project would not have been possible if it was not for my advisors insights for future directions in science and technology. I thank both of my advisors for always being supportive and enthusiastic mentors, and for finding the time to provide assistance and advice whenever it was needed. I would also like to thank Professor Bernhard E. Boser for his mentorship during my years at Cal. His lectures and talks were indeed inspiring, framing technical discussions in such a way that the bigger picture was not lost and the important aspects of circuit design not forgotten. His courses keep alive the sense of discovery and enjoyment in circuit design, and his EE 240 course was one of my favorites taken at Cal. It has indeed been a privilege to serve as a teaching assistant for him on a couple of occasions. I also thank Professor Boser for serving as chair of my qualifying exam. I also thank Professor J. Christopher Anderson for his support and guidance ever since learning of synthetic biology. I learned a great deal by serving as a teaching assistant for his 2007 igem team. My contributions to subsequent education efforts in synthetic biology are indeed a result of the skills and tools learned during that experience. I also thank Professor Anderson for serving on my qualifying exam and dissertation committees. I am also indebted to Dr. Leonard Katz for all of the stimulating and engaging discussions in science and synthetic biology. Advancing this project forward would not have been possible without the generosity shown by Dr. Katz with his time to discuss scientific concepts and issues. I would also like to take this opportunity to express my gratitude to past and present members of the Keasling lab for all of their time and assistance throughout the challenges encountered in the past few years. Last but not least, I would like to thank my parents for their commitment to my education and their continual support and encouragement. Their wisdom and guidance has always been a source of strength. This research was supported by a National Science Foundation Graduate Research Fellowship and the Synthetic Biology Engineering Research Center (SynBERC). iii
9 Chapter 1: Introduction Background The genetic engineering of microbial organisms offers benefits to society through biotechnology applications. For instance, engineering microbes to produce industrial products (metabolic engineering) has become increasingly attractive due to the advantages over traditional synthetic methods. Modifications that lead to new biosynthetic capabilities in microbes allow for the production of previously limited products at high levels (such as therapeutic proteins and drugs), while at the same time reducing the use of environmentally destructive chemical processes [1-3]. A brief description regarding the genetic modification of microbes for engineering purposes is appropriate at this time. RNA and proteins are the molecular players that perform tasks inside of biological cells. They are synthesized by the gene expression machinery of the cell, with the nucleotide sequence of DNA molecules serving as template. The fundamental building block in biological engineering is the single-gene genetic device (Figure 1-1A), which is a sequence of DNA consisting of a promoter, ribosome binding site (RBS), gene of interest, and transcription terminator. A gene is an ordered sequence of nucleotides that encode a product of interest (protein and/or RNA), and it is typically portrayed by a block arrow (Figure 1-1A). Once the DNA sequence of a device has been inserted into an appropriate microbial host, the gene expression machinery of the cell processes its DNA sequence and the encoded gene product is synthesized. The first step in gene expression is called transcription, and it leads to the synthesis of RNA molecules from the DNA sequence encoded by the device (Figure 1-1B). For a device to undergo proper transcription, the sequences of a promoter and transcription terminator are placed before and after the gene, respectively. The promoter acts as a signal to the host transcriptional machinery to begin transcription prior to the gene nucleotide sequence. The transcription terminator, on the other hand, causes the process of transcription to terminate at a point downstream of the gene nucleotide sequence. In short, the transcriptional machinery of the host cell binds to the promoter, moves along the DNA sequence of the genetic device, and eventually falls off at the terminator. The end result is the synthesis of a RNA transcript that contains the gene sequence plus flanking, so called non-coding sequences (Figure 1-1B). An important non-coding sequence on the RNA is the RBS. It is located upstream of the gene, and it controls the process of translation. During translation (the second step in gene expression), the translational machinery of the host cell binds to the RBS, moves along the RNA sequence, and eventually dislodges at the end of the gene sequence. The end result is the synthesis of a protein molecule (Figure 1-1C). The core steps of gene expression have been described at a basic level here. There are a number of books that address this process in greater detail [4-6]. Genetic modifications that lead to the production of desired molecules are made difficult by the fact that many genes (i.e. enzymes) need to be introduced into the microbial host. The situation is further exacerbated by the necessity of having to control 1
10 A DNA promoter RBS gene terminator B C Transcriptional Machinery Translational Machinery DNA RNA RNA Protein Figure 1-1 A. Schematic representation of the basic components in a genetic device B and C. Schematic representations of the gene expression processes of transcription (B) and translation (C) 2
11 and coordinate the activity of each gene to achieve optimal production of the target molecule. This process is generally complex. One of the most cited recent success stories in metabolic engineering has been a system developed to produce a precursor of the antimalarial compound artemisinin in microbes [7]. The final system developed has been estimated to have taken roughly 150 person-years of work, which included the uncovering of genes involved in the pathway, the refinement of components (e.g. promoters and RBSs) to control the expression of the eventual genetic devices, and the testing of many variants to sufficiently increase production of an enzyme necessary to consume a toxic intermediate molecule [8]. Indeed, the engineering of microbes to arrive at organisms with predictable, quantitative behavior is not engineering in a strict sense. The process of arriving at functional systems, rather, require months (more often years) of trial-and-error type of experiments, with the undertaking being more akin to art than engineering [9]. The burgeoning area of synthetic biology aims to develop foundational principles and technologies to enable the systematic forward engineering of biological systems [10-11]. In essence, synthetic biology aims to put the engineering back into genetic engineering. Recent technological advances in DNA synthesis and sequencing are important developments that have fueled appeal towards realizing the synthetic biology discipline. In order to engineer microbial organisms, it is necessary to construct assemblies of DNA components and genetic devices (Figure 1-1). Analogous to Moore s Law in microelectronics, the prices of determining DNA nucleotide sequence (sequencing) and DNA construction (synthesis) have plummeted over the past two decades (Figure 1-2). This not only means that bioinformatics databases are accumulating the sequences of genes from many organisms in nature, but that it is also easier to assemble arbitrary combinations of said genes together in order to engineer a microbial host with new capabilities. One of the earliest contributions of synthetic biology was the application of basic abstraction and physical composition frameworks through BioBricks and the Registry of Standard Biological Parts [14-15], with variations to the original scheme having been subsequently proposed [16]. The Registry lists DNA sequences designed by synthetic biologists that perform specific functions inside of cells, and the BioBricks standard proposes rules that support the physical assembly of these different sequences together. Other early advances in synthetic biology involved the silicon mimetic approach, where biological circuits were realized to emulate the functionality of such microelectronic circuits as latches and oscillators [17]. The initial circuits of synthetic biology showed that writeable memory (the toggle switch) and oscillator (the repressilator) elements can be realized in the bacterium Escherichia coli (E. coli) by using the standard components of biological engineering (Figure 1-1). The genetic toggle switch [18], having been inspired by the reset-set latch of digital electronics, implements a one-bit memory element using two repressible promoters arranged in a mutually inhibitory network (Figure 1-3). More specifically, it consists of two genetic devices, with the promoter of each being repressed by a regulatory protein encoded by the gene of the other. The transcriptional machinery of the cell (Figure 1-1B) can indeed be repressed (or induced) by certain regulatory proteins and molecules. The fluorescent reporter protein gfp (GFP) provided an external readout of the state of the toggle switch, and two inducer species allowed toggling of the switch from one state to the other. In addition to memory elements, clocks are also important 3
![A B Figure 1-2 Recent advances in DNA sequencing (A) [12] and synthesis (B) [13] elements in electronic systems.](/docs-images/76/73665873/images/12-0.jpg "With the ring oscillator of digital electronics having served as inspiration, the repressilator [19] implements a clock circuit in E.")
 provided a readable output of the system.")
12 A B Figure 1-2 Recent advances in DNA sequencing (A) [12] and synthesis (B) [13] elements in electronic systems. With the ring oscillator of digital electronics having served as inspiration, the repressilator [19] implements a clock circuit in E. coli by using a three transcriptional repressor system (Figure 1-4). This circuit consists of three devices, with the protein of each repressing the promoter of the next device in the system. The addition of the third device leads to the negative feedback loop necessary for oscillation, and the synthesis of GFP (controlled by one of the promoters) provided a readable output of the system. Such initial advances led to opinions that portrayed synthetic biology as simple design and construction [20]. That is, it inspired the idea that biologists can extend traditional genetic engineering to be more akin to the engineering of a computer system. The methodology would consist of characterizing the genetic sequences that perform useful functions (the parts ), combine said parts to arrive at genetic devices with more complex functions, and then insert the devices into host cells. As such, synthetic biology could provide a toolbox of reusable genetic components (biological versions of electronic components) to be plugged into biological circuits. This analogy does not accurately capture the current knowledge gap that exists as to how biology works. Motivation A characteristic feature of established engineering disciplines (such as electronics) is the ability to design and construct systems by way of modularity. The concept of modularity allows engineers to design and build physical systems by bringing together modules that contribute independently to the whole, thereby giving rise to a system whose quantitative behavior can be predicted from its constituent modules [21-23]. A pressing research question is whether the complexity of living organisms allows 4
13 A promoter1 B gene1 promoter2 gene2 gfp fluorescence Figure 1-3 Schematic representation of the genetic toggle switch (A) and an electronic circuit analog (B) engineers with a similar capability to design and construct biological systems from smaller elements characterized in isolation [24-25]. The success of synthetic biology as an engineering discipline will depend, in part, on establishing the conditions necessary for this independence property to hold true in living systems [26]. The research contribution of this study is the application of engineering principles towards realizing modularity and functional composition in biological systems. More specifically, it will be shown that genetic devices can behave in a standardized, quantitatively predictable manner. The ability to view devices as modules may be of benefit in such applications as metabolic pathway construction for the production of natural products and other chemicals (microbial chemical factories). Once introduced into the host cell as DNA, a synthetic device must first be expressed by the native transcriptional and translational machinery in order to give rise to the desired function (e.g. production of transcript, desired protein, or metabolites, transduction of a signal, etc.). Synthetic devices introduced into E. coli for engineering purposes are, in essence, additional devices imposed on top of those present in the wildtype (baseline) case. Synthetic devices can, thus, only begin to behave independently if their respective RNA and protein levels are not affected by the addition of other synthetic devices. In order to motivate the experimental approach taken, the gene expression machinery of the E. coli host cell was viewed as a system in this study. Devices in the form of DNA are its input, with the resultant RNA (and protein) produced its output (Figure 1-5A). Synthetic devices introduced into E. coli for engineering purposes, however, are not the only inputs to the system. Thousands of devices are encoded on the 5
14 A B promoter1 gene1 promoter2 gene2 promoter3 gene3 promoter1 gfp fluorescence Figure 1-4 Schematic representation of the repressilator (A) and an electronic circuit analog (B) E. coli genome [27], whose regulated expression allow the organism to survive and grow in a given environment. The same molecular players and building blocks involved in synthesizing RNA (and protein) encoded by the host s native (chromosomally-encoded) devices are involved in the transcription (and translation) of synthetic (heterologous) devices. The system (Figure 1-5A), thus, not only has synthetic devices as inputs, but also the native devices. For independence among devices (synthetic and native) to be possible, the system must be linear, thereby exhibiting the superposition principle by definition [28]. The superposition property of linear systems states that the net response 6
15 Figure 1-5 Black box representation of the E. coli gene expression system. A. Genetic devices (synthetic and native) in the form of DNA act as inputs to the system, with the resultant RNA (and protein) produced the output. B. Pictorial depiction of the superposition principle in effect in linear systems. Superposition states that the output from a set of inputs represents the linear sum of the outputs from each individual input. caused by two or more inputs is the sum of the responses which would have been caused by each stimulus individually. That is, if x and y amounts of DNA for a couple of devices alone produce X and Y amounts of transcript (protein), respectively, then the concurrent addition of both devices to the system should lead to the formation of X and Y amounts of transcript (protein) (Figure 1-5B). Systems in practice, however, are nonlinear and do not abide by the superposition principle. As such, the different synthetic and native inputs to the system cannot be studied in isolation. Design for predictable, quantitative behavior would, thus, not only require an understanding of how synthetic devices couple to one another by way of the nonlinearity present in the E. coli system, but also how they couple to the host s native devices. Our current level of understanding of these interactions is limited at best qualitatively, much less so in a quantitative manner. This, in part, may explain the difficulty associated with engineering biological systems with predictable, quantitative behavior. As they are embedded inside complex host cells, many 7
16 interactions are possible between the host cell and introduced constructs. And while the implementation of the toggle switch circuit (Figure 1-3) may appear simple on paper, it took years of tweaking the system to make it actually work [8]. This research began with the hypothesis that the introduced synthetic devices can be viewed as perturbations to the E. coli system. That is, the amount of DNA acting as input to the gene expression machinery of the host increases with their addition. So long as this increase (i.e. perturbation) is kept small, the E. coli system may perhaps be approximated as a linear one with respect to the introduced synthetic devices, thereby enabling superposition and the decoupling of synthetic devices from one another. This is the small-signal approximation used in the field of electronic circuit design [29]. There, it is used in the design of analog amplifiers, where voltage and current signals act as inputs to nonlinear, transistor-based systems. The significance and specific contributions of this research are as follows: 1. The current thinking in biology is that organisms are too complex and nonlinear to be predictably engineered. As such, it is thought that the superposition property of linear systems does not apply to the genetic engineering of microbial organisms under conditions relevant in the standard microbiological laboratory. This research demonstrates the contrary. That is, it shows that the nonlinearity in the E. coli system is not complex to the point of preventing functional composability (i.e. superposition) with standard elements used to genetically modify the organism. 2. An approach taken in this research to investigate system nonlinearity involved varying the copy number of synthetic genetic devices to generate transfer curves. This research demonstrates that a transfer curve-based framework has application in the engineering of biological systems, with device nonlinearity as gauged by transfer curve response correlating with superposition experimental data. Furthermore, device transfer curves may find application in the general characterization of devices. 3. This research demonstrates the significance of quantitative techniques (such as device transfer curves) to synthetic biology characterization efforts. It will be shown that growth rate alone (a traditional metric used in characterization efforts) is unable to accurately capture changes that take place due to synthetic device addition. 4. This research also presents characterization data for the absolute copy number of a plasmid resulting from a particular replicon, the impact that a change in bacterial cell type has on plasmid copy number, and the effect on a plasmid s copy number of introducing plasmids with different replicon into the same strain. Thesis Organization In order to demonstrate that biological systems follow principles similar to that of physical ones, Chapter 2 shows that the E. coli system response to genetic device additions becomes more linear as the perturbation level is decreased, under conditions relevant in typical molecular biology experiments. This chapter also describes the construction of a plasmid system used to perform the necessary experiments. Chapter 3 proposes and explores the use of device transfer curves to investigate linear system 8
17 behavior and superposition in E. coli. A plasmid system consisting of three devices was constructed, and it too is described in this chapter. Chapter 4 presents work done to characterize a set of BglBrick-compatible plasmids, with the purpose of having the results documented in a datasheet. Chapter 5 concludes this thesis by presenting a research support in addition to proposing directions for future research. 9
18 Chapter 2: Preliminary Investigation of Superposition Background Plasmids were used in this research to construct systems that allow for the introduction of synthetic genetic devices at different copy numbers (i.e. perturbation levels). It should be noted that the copy number of synthetic devices may not be the only factor that perturbs microbial organisms. Promoter strength, ribosome binding site (RBS) strength, gene length, codon usage, and product function are perhaps important factors too. As the intent of this research was to investigate whether E. coli can accommodate linear system behavior with standard elements used to genetically modify the organism, copy number was the focus here. Plasmids are circular pieces of DNA that are often used to introduce devices into microbes such as E. coli [30-31]. This process entails the use of cloning techniques to first insert the desired device(s) into the plasmid. The plasmid is then transferred into E. coli and the construct ends up in the cell s cytoplasm, separate from the host s genomic DNA, expressing its harbored devices. Figure 2-1 depicts this process. An attractive feature of a plasmid is that the degree to which it replicates within the host can be varied. The degree to which a plasmid replicates within the host is governed by a region on the plasmid called the origin of replication (or replicon). By having a different DNA sequence in this region, one can vary the number of copies of plasmid present in the host cell. The number of copies of the synthetic devices introduced into E. coli would subsequently be varied as they are harbored on the plasmid. In addition to the replicon, the other basic component of a plasmid is its selection marker. The maintenance of plasmids is a burden on the cell, and one needs to overcome the cell s desire to lose plasmid. To this effect, E. coli is typically grown in growth medium that has been supplemented with an antibiotic. The selection marker is a genetic device harbored on the plasmid and that confers resistance to this added antibiotic, thereby providing an advantage to E. coli for maintaining the plasmid in its cytoplasm. That is, the bacterial cell would otherwise be unable to grow and survive in the antibiotic supplemented medium. This research began by first investigating the applicability of the small-signal approximation in E. coli under conditions relevant in the standard microbiological laboratory. In this spirit, plasmids with standard features (i.e. typical replicons, selection marker, etc.) were used to express two devices with different reporter genes. The difference in culture-averaged fluorescence of a device introduced alone and concurrent with the other device was investigated to determine whether superposition improved with a lower copy replicon (i.e. reduced perturbation level). The goal here was to show that microbial organisms follow principles similar to that of physical systems, and that the nonlinearity in E. coli is not complex to the point of preventing linearization studies under conditions relevant in the standard microbiological laboratory. 10
19 + Digestion + Ligation Transformation E. coli Figure 2-1 Schematic representation of the cloning process flow Results Superposition improved as copy number was reduced A plasmid system was constructed to enable the introduction of genetic devices into E. coli at different copy numbers. To this effect, a modular plasmid backbone was constructed as described in the Methods (Figure 2-2). The bacterial rrnb terminator was used for the two multi-cloning sites. This strong transcriptional terminator has been widely used, and shown to exhibit bi-directional termination properties [32]. As such, its inclusion in the plasmid minimized possible transcriptional readthrough from the origin of replication, which relies on transcription for functionality [33-34], into the neighboring cloning sites. The same applies with regards to possible transcriptional readthrough originating from the selection marker device β-lactamase. This device confers resistance to the antibiotic ampicillin. In order to investigate the applicability of the small-signal approximation in the model bacterial system E. coli, two synthetic devices were cloned into the plasmid 11
20 MCS1 TT β-lactamase pmh5 origin MCS2 TT Figure 2-2 Plasmid backbone with the β-lactamase selection marker. The origins of the plasmids p15a and puc were cloned into the backbone using the unique restriction site EcoRI (not shown). TT denotes rrnb transcriptional terminator. backbone (Figure 2-2). One device had the reporter gene red fluorescent protein (rfp) [35], while green fluorescent protein (gfp) [36] was the reporter gene of the other device. Both rfp and gfp are widely used reporter genes in molecular biology and synthetic biology applications. Each device was composed of the IPTG-inducible promoter P trc and cognate gene encoding the lac repressor (laci Q ) [37], the strong ribosome binding site AGGAGG [36], and the rrnb transcription terminator. The devices were placed on one of two plasmids (Figure 2-2) containing either the high or medium copy number puc [38] or p15a [39] replicon, respectively. This was to modulate the copy number of the devices and, thus, the degree of perturbation to the E. coli system. All other sequences on the plasmids (selection marker, multicloning site, and other sequences) were identical. Time course assays were performed to test for superposition in the cultureaveraged fluorescence arising from the encoding devices. E. coli DH10B cells harboring the puc- and p15a-borne constructs were grown in LB medium as described in the Methods. Once in mid-exponential growth, cells were induced by adding IPTG to the medium. Samples were taken over the course of time starting two hours post induction in order to measure OD 600nm and fluorescence, with final fluorescence measurements having been normalized for cell density (fluorescence per OD 600nm unit) to arrive at cultureaveraged fluorescence. The difference between the culture-averaged fluorescence resulting from the puc- and p15a-borned constructs was determined statistically (P < 0.01, t-test) for each time point. Superposition was not observed at the perturbation levels exhibited by the puc-borne devices. That is, the green and red fluorescence levels resulting from both devices present on the same puc-based plasmid did not correspond to those levels when either of the devices was present alone on the plasmid (Figure 2-3). The output of the gfp device when harbored alone on the high copy number puc-based plasmid differed significantly at three of nine time points from that when the device was borne on the same high copy number plasmid with the rfp device present. The red 12
21 A (plasmid w/ puc replicon) E. coli RFP fluorescence / OD Hours post induction B E. coli (plasmid w/ puc replicon) GFP fluorescence / OD600 Hours post induction 13
22 C E. coli (plasmid w/ puc replicon) RFP fluorescence / OD * * * * * * * * * * * * GFP fluorescence / OD600 Hours post induction Figure 2-3 Comparison of superposition in the culture-averaged fluorescence from RFP and GFP encoding devices using plasmids with puc origins of replication. Data presented are the mean from three replicates +/- standard error. The difference between a device introduced alone (A, B) and concurrent with the other (C) was determined statistically (P < 0.01, t-test). Asterisks indicate significant difference. fluorescence resulting from the dual device harboring plasmid differed from that produced by the single rfp device harboring plasmid at all nine time points. In contrast, the green and red fluorescence output from the gfp and rfp devices borne together on the medium copy number p15a-based plasmids differed at only one time point as compared to when the devices were borne singly on the same plasmid backbone (Figure 2-4). 14
23 A (plasmid w/ p15a replicon) E. coli RFP fluorescence / OD Hours post induction B E. coli (plasmid w/ p15a replicon) GFP fluorescence / OD600 Hours post induction 15
24 C E. coli (plasmid w/ p15a replicon) RFP fluorescence / OD * GFP fluorescence / OD Hours post induction Figure 2-4 Comparison of superposition in the culture-averaged fluorescence from RFP and GFP encoding devices using plasmids with p15a origins of replication. Data presented are the mean from three replicates +/- standard error. The difference between a device introduced alone (A, B) and concurrent with the other (C) was determined statistically (P < 0.01, t-test). Asterisks indicate significant difference. Discussion The experimental results here indicate that the response of E. coli becomes more linear as the perturbation incurred by synthetic devices is lowered. This suggests that biological systems follow principles similar to physical ones as it relates to the smallsignal approximation. The results also suggest that the nonlinearity in the E. coli biological system is not complex to the point of preventing linearization studies under conditions relevant in the standard microbiological laboratory. In the plasmid system presented here, the gfp and rfp devices each contained the strong P trc promoter and AGGAGG ribosome binding site. Superposition (linearity) was practically observed for the devices when a plasmid backbone harboring the p15a replicon was used (Figure 2-4). That is, the culture-averaged fluorescence was statistically different at only one time 16
25 point. Superposition (linearity) was lost with a puc origin (Figure 2-3), indicating that the model system presented here enters into the nonlinear regime of operation at this copy number. The results also appear to suggest that the gfp device was the more nonlinear device in the model system. At the higher copy number of puc, rfp device addition did not impact gfp fluorescence levels to the same extent that gfp addition impacted rfp fluorescence (three versus nine time points where the difference in culture-averaged fluorescence was statistically significant). This was in spite of the fact that both gfp and rfp devices were identical except for the sequence of the encoded gene. The larger observed nonlinearity in gfp is further investigated in the next chapter. In a way similar to circuit designers, biological engineers need to be aware of the perturbation levels that synthetic devices incur to observe independence among said devices. Using synthetic devices under small-signal conditions may enable synthetic biologists to engineer microbial organisms with predictable, quantitative behavior. That is, it may enable the realization of functional composition through the assembly of synthetic devices whose quantifiable behavior has been characterized in isolation. The term small has yet to be determined. In this spirit, synthetic biologists may be able to use frameworks similar to those developed by electronics engineers to quantify the nonlinearity of synthetic devices. This, in turn, may enable synthetic biologists to determine whether useful biological systems can be engineered by way of superposition (linearity) or if it is necessary to enter into the nonlinear regime of operation where the independence of devices is lost. A possible framework based on the engineering concept of the transfer curve is presented in the next chapter. Methods Bacterial strains, media, and enzymes E. coli DH10B was used for cloning and time course assays. Luria-Bertani (LB) medium was made as described previously [31]. Restriction enzymes and T4 DNA ligase were purchased from New England Biolabs, with digestion and ligation reactions performed as recommended by the enzyme manufacturer. PCR reactions were performed with Phusion polymerase from Finnzymes, and the primers used were synthesized by Integrated DNA Technologies, Inc. The composition of the PCR reactions, cycle times, and temperatures followed those suggested by the enzyme manufacturer. PCR products were sequenced once cloned into the respective plasmids to ensure that no mutations had been introduced during the amplification process. In cases where single digest cloning was performed, sequencing was also used to select for constructs with inserts in the desired orientation. Plasmid construction The modular plasmid backbone (Figure 2-2) was constructed in several cloning steps. DNA encoding the two rrnb transcription terminators was amplified from pbad24-gfp [37] using PCR. The primer pairs TT-BamHI-F,TT-BamHI-R and TT-ApaI-F,TT-ApaI- R (Table 2-1) were used for this purpose. PCR products were digested with BamHI (former primer pair) and ApaI (latter primer pair), and ligated into the multi-cloning site of pbluescript II SK (Stratagene) to yield pmh1 and pmh2, respectively. Subsequently, β-lactamase DNA and the puc replicon were PCR amplified from puc19 (New England Biolabs) using the primer pairs Amp-KpnI-F,Amp-KpnI-R and pucori-ecori-f,pucori- 17
26 EcoRI-R (Table 2-1), digested with KpnI and EcoRI, and ligated into the multi-cloning site of pbluescriptii SK to yield pmh3 and pmh4, respectively. Finally, the modular plasmid backbone (Figure 2-2) was obtained from pmh4 by PCR amplification. Primers circ-agei-f,circ-agei-r (Table 2-1) were used for this purpose. The obtained PCR product was digested with AgeI, and subsequently ligated to itself to form the circular plasmid backbone pmh5. The plasmid system used for the fluorescence assays (Figures 2-3 and 2-4) was also constructed in several cloning steps. DNA encoding red fluorescent protein (RFP) was amplified from pzbrg [37] using PCR and the primers RFP-XhoI-F / RFP-XhoI-R, digested with XhoI, and ligated into MCS1 of pmh5 to yield pmh6. Subsequently, DNA encoding the IPTG-inducible promoter P trc and cognate gene encoding the lac repressor (laci Q ) were amplified from Ptrc99-gfp [37] using PCR and the primers Ptrc- ClaI-F / Ptrc-ClaI-R, digested with ClaI, and ligated into pmh6 to yield pmh7hc. The cloning of the green fluorescent protein into MCS2 proceeded similarly using pbad24- gfp as template and the primers GFP-XbaI-F / GFP-XbaI-R to yield pmh8. DNA encoding the P trc promoter and laci Q were amplified from Ptrc99-gfp using PCR and the primers Ptrc-SacII-F / Ptrc-SacII-R, digested with SacII, and ligated into pmh8 to yield pmh9hc. To construct the plasmid with both reporter proteins, RFP EC and P trc promoter (with laci Q ) were subcloned step-wise from pmh7hc into pmh9hc to eventually yield pmh11hc. pmh7hc, pmh9hc, and pmh11hc were the puc-based vectors used in the fluorescence assays. In order to arrive at their p15a-based counterparts, DNA encoding the p15a origin of replication was amplified from pacyc177 using PCR and the primers p15ori- EcoRI-F / p15ori-ecori-r, digested with EcoRI, and ligated into pmh7hc, pmh9hc, and pmh11hc to yield pmh7lc, pmh9lc, and pmh11lc, respectively. Fluorescence Assays Cells were grown overnight at 30 C, 200rpm shaking after inoculating 5mL cultures of LB medium (supplemented with 100μg/mL ampicillin) with single colonies from freshly streaked plates. After subculturing (1:25) into shake flasks containing 50mL of LB medium (supplemented with 100μg/mL ampicillin), cells were grown at 30 C, 200rpm shaking until an OD 600nm of approximately 0.6 was reached. At this time, cells were induced by adding IPTG to a final concentration of 100μM to the medium. Samples were taken every 30 minutes (starting two hours after induction) to make OD 600nm and fluorescence measurements using a Tecan SpectraFluor Plus plate reader (Tecan-US, Durham, NC). Excitation/emission wavelengths of 558nm/583nm and 400nm/510nm were used for RFP and GFP, respectively. The fluorescence measurements were normalized for cell density (fluorescence per OD 600nm unit). 18
27 Table 2-1. List of PCR primers used in the cloning of the plasmids constructed in this chapter Primer Sequence TT-BamHI-F TATTATGGATCCTTGGCTGTTTTGG TT-BamHI-R TATTATGGATCCCCTAGGAGAGTTTGTAGAAAC TT-ApaI-F TATTATGGGCCCGCTAGCTTGGCTGTTTTGG TT-ApaI-R TATTATGGGCCCAGAGTTTGTAGAAACGC Amp-KpnI-F TATTATGGTACCGACAGTTACCAATGC Amp-KpnI-R TATTATGGTACCGATACGCCTATTTTTATAGG pucori-ecori-f TATTATGAATTCTCACTGACTCGCTGC pucori-ecori-r TATTATGAATTCAGACCAAGTTTACTCATATATAC circ-agei-f TATTAGACCGGTTGGGTACCGATAC circ-agei-r TATTAGACCGGTAACAAAAGCTGGAG RFP-XhoI-F TAATAACTCGAGCAGGAGGAATCTAATGGC RFP-XhoI-R TAATAACTCGAGAGCATGCCTACAGGAAC Ptrc-ClaI-F TAATAAATCGATAGGTTTTCACCGTCATCAC Ptrc-ClaI-R TAATAAATCGATTGTGTGAAATTGTTATCCG GFP-XbaI-F TAATAATCTAGACAGGAGGAATCTAATGAGTAAAGG GFP-XbaI-R TAATAATCTAGAATCATCTTATTTGTAGAGC Ptrc-SacII-F TAATAACCGCGGAGGTTTTCACCGTCATC Ptrc-SacII-R TAATAACCGCGGTGTGTGAAATTGTTATCCG p15ori-ecori-f ATAATAGAATTCTTAATAAGATGATCTTCTTG p15ori-ecori-r ATAATTGAATTCAGTGTATACTGGCTTACTATG 19
28 Chapter 3: Investigation of Linearity via Device Transfer Curves Background With the previous chapter suggesting that linearity studies can be done at relevant biological conditions, a more systematic approach was undertaken here. That is, the use of transfer curves was explored in order to investigate linear system behavior (superposition) in the context of synthetic biological systems. A model system was constructed to enable the introduction of synthetic genetic devices into E. coli at different copy numbers (Figure 3-1A). The resultant RNA produced was quantified at each copy number to produce RNA versus DNA device transfer curves (DTCs) (Figure 3-1B). DTCs were subsequently analyzed to gauge the nonlinearity of the E. coli system response to individual devices, with linear system behavior being verified by showing the presence of superposition (Figure 3-1C). RNA level was the focus here because synthetic devices can only begin to behave independently if their respective transcript levels are not affected by the addition of other synthetic devices. This is because of transcription being the initial process in gene expression. Results Copy number of genetic device varied with plasmid origin of replication The degree to which a plasmid replicates in E. coli is governed by its origin of replication. Using different origins, one can vary the number of copies of plasmid present in the host cell. The number of copies of the synthetic devices introduced into E. coli would subsequently be varied as they are harbored on the plasmid. In developing the model system for this work, the plasmid origin of replication was flanked by terminators (Figure 3-2A) to minimize possible transcriptional readthrough from replicons, which rely on transcription for functionality [33-34], into neighboring devices. The two terminators used in the plasmid backbone (and all of the other constructs) were the bacterial rrnb T1 and bacteriophage lambda t0. These strong transcriptional terminators have been widely used [32, 40]. It was first verified that the number of copies of a device can be varied in the system by using different replicons. To this effect, the origins of plasmids pmpp6 [41], psc101 [42], p15a [38], pmb1 [39], and puc [39] were cloned into the backbone to determine whether the copy number of the neomycin phosphotransferase II (nptii) device varied (Figure 3-2A). This device confers resistance to the antibiotic kanamycin. The replicons from psc101, p15a, and pmb1 are in different incompatibility groups [33-34]. As the origin of pmpp6 (and puc) is that of psc101 (and pmb1) with point-mutations [39, 41], these two replicons are not compatible with one another. E. coli DH1 cells harboring plasmid backbone constructs (Figure 3-2A) were grown in M9 minimal medium as described in the Methods. The growth rate of cells was comparable among the constructs, with OD 600nm in the log phase 20
29 Figure 3-1 Experimental approach taken in this chapter. A. Copy numbers of the synthetic genetic devices in the model system were varied and the RNA from a particular device was measured as an output. B. DTC for a device (device x as an example) was generated by first plotting the RNA produced at each copy number. A regression that minimized the sum of squared residual error was subsequently fitted to the cumulative data. C. Linear system behavior was gauged by testing for superposition. Superposition was determined to exist if a correspondence was observed between the left and right hand sides of the depicted figure. doubling every ~80 minutes (Table 3-1). With the growth rate of cells not varying with replicon (Table 3-1), it appears unlikely that kanamycin (which was used for selection) elicits an effect on nptii expression. That is, it appears that the level of nptii expressed at the different copy numbers surpasses the minimum threshold necessary for cell survival. Once in mid-exponential growth, cells were harvested and total DNA extracted. Realtime quantitative PCR (qpcr) was subsequently used to determine the copy number of nptii for each construct [42-45]. In general, the results were similar to values reported 21
30 Figure 3-2 Diagrams of the plasmids constructed to enable variation of genetic device copy number and to determine DTCs. A. Plasmid backbone with the nptii selection marker. The origins of the plasmids pmpp6, psc101, p15a, pmb1, and puc were cloned into the backbone using the two unique restriction sites SmaI and AvrII (not shown). TT denotes transcriptional terminator. Two different terminators (λ t0 and rrnb T1) had to be used because cloning attempts aimed at having the same terminator present simultaneously in opposing directions met with failure. The cassettes depicted in panels B and C were cloned in the multi-cloning site indicated by an asterisk. B. The cat device containing cassette cloned into the backbone. C. The cat and gfp device containing cassettes cloned into the backbone to arrive at the model system. Spacers were used to create spatial separation between neighboring devices (see Methods) to minimize the potential of special coupling. The promoter driving cat in B is different from that in C. While the native promoter was used in the former, P L was used in the latter. 22
31 Table 3-1 Growth rate of cells harboring empty (Figure 3-2A) or cat-device containing (Figure 3-2B) backbone E. coli cells were grown in the medium specified in parentheses, with numbers indicating the necessary time in minutes for the optical density at a wavelength of 600nm to double in the log phase. The mean value ± 95% confidence interval as determined in duplicate has been reported (n.d. = not determined) pmpp6 psc101 p15a pmb1 puc backbone (M9) 80 ± 3 80 ± 3 83 ± 3 83 ± 5 84 ± 5 backbone (LB) n.d. 50 ± 4 48 ± 5 48 ± cat wt (LB) n.d. 46 ± 1 n.d. n.d. 48 ± 1 for plasmid copy number (Figure 3-3A) [38-39, 41-42]. While the replicon of pmpp6 has been reported to have a copy number ~1/4 that of wild-type psc101 [41], the work here indicates that the two origins have comparable copy numbers. Perhaps this difference is due to the experimental measures used for quantification. Real-time qpcr was used here while Southern blot analysis was employed in the work cited. Discrepancies between these two techniques have been observed [46]. It should be mentioned that the puc origin of replication is temperature sensitive. While higher plasmid copy number values have been reported for this replicon at 37 C and 42 C, the reduced values observed here are consistent with the 30 C growth temperature used in this study [39]. Similar results were obtained when cells were grown in LB medium (Figure 3-3B), with the growth rate of cells again being comparable among the constructs (Table 3-1). This suggests that the copy number resulting from a particular origin (relative to that of psc101) does not appear to be impacted by the growth medium used. The results here indicate that the copy number of a device can be varied successfully by changing the origin of replication (Figure 3-3), with the range being ~6X for the constructs tested (Figure 3-2A). Linear device transfer curves obtained in E. coli After verifying that the copy number of nptii can be varied in the system, experiments were performed to obtain its DTC. Cells that had been harvested prior (Figure 3-3B) were used to quantify the transcript level of the nptii device. Total RNA was extracted from cells and transcript level quantified using real-time qpcr [47-49]. The results were plotted against the copy number values determined prior (Figure 3-3B), yielding the DTC (Figure 3-4). RNA transcript level and copy number values have been normalized to that of the psc101 construct, which were assigned a mean value of one in each case. The y-axis value for each data point indicates how that particular construct s steady-state transcript level compares relative to that of the psc101 construct. Similarly, the x-axis value for each data point in the plot indicates how that particular construct s 23

32 A B Figure 3-3 Copy number characterization of backbone (Figure 3-2A). A. nptii copy numbers obtained from the plasmid backbone harboring the different replicons used. M9 minimal medium was used here. B. nptii copy numbers obtained from the plasmid backbone harboring the different replicons used. Cells were grown in the indicated growth medium. Each construct was tested at least in duplicate. The mean value has been reported, with the error bars denoting standard error. Values were normalized to that of the pmpp6 (A) or psc101 (B) construct for each medium, which was assigned a mean value of one. steady-state copy number compares relative to that of the psc101 construct. Also shown in the plot are linear regressions fitted to the data. With R 2 > 0.9, the data suggest that the E. coli system response to the nptii device perturbation can be considered linear. The 95% confidence interval for the y-intercepts were also and for LB and M9 media, respectively. These included the origin, further suggesting that a linear 24
33 Figure 3-4 DTC characterization of backbone. nptii DTC obtained from the series of constructs (Figure 3-2A) for LB (orange, circle) and M9 (square, blue) media. Each construct was tested at least in duplicate for each medium. RNA and copy number values were normalized to that of the psc101 construct, with each having been assigned a mean value of one. The regression lines that minimized the sum of squared residual error are also shown, with their corresponding coefficient of determination R 2. regression was an appropriate fit for the data. That is, one cannot have nptii RNA transcript produced when there is no corresponding DNA present in the cell. The results also suggest that the DTC of nptii can be linear under different contexts. That is, the choice of growth medium does not appear to impact system linearity (Figure 3-4). Next, another device was introduced into the plasmid backbone to increase the perturbation level. The goal was to see whether the presence of an additional device would lead to nonlinear DTCs. This device encoded chloramphenicol acetyl transferase (cat), which confers resistance to the antibiotic chloramphenicol. The cat device was expressed from its native promoter (Figure 3-2B). E. coli DH1 cells harboring the constructs were grown in LB medium as described in the Methods. No chloramphenicol was added to the medium during growth, with only kanamycin having been used for selection purposes. The growth rate of cells was comparable among the constructs, with OD 600nm doubling every ~50 minutes in the log phase (Table 3-1). At mid-exponential growth, cells were harvested and total RNA and DNA extracted. Relative nptii and cat transcript levels and copy number were subsequently quantified using real-time qpcr (Figures 3-5A and 3-5B). As was done for the backbone (Figure 3-4), linear regressions were fitted to the data. With a R 2 > 0.96 for each device, the data suggest that the combined nptii and cat device perturbation level appears to be small enough to elicit a 25
34 A B Figure 3-5 DTC characterization of two-device containing constructs. A,B. nptii and cat DTCs obtained from the series of two-device plasmids (Figure 3-2B). The cumulative data presented were the result of two independent experiments. Constructs were tested in duplicate during each independent experiment. Three data points (and not four) are shown for the pmb1 construct because a replicate was lost during sample preparation. RNA and copy number values were normalized to that of the psc101 construct with each having been assigned a mean value of one. The regression lines that minimized the sum of squared residual error are also shown, with their corresponding coefficient of determination R 2. 26
35 linear response from the E. coli system. The 95% confidence intervals were also and for nptii and cat y-intercepts, respectively, including the origin for each device once again. The fact that no chloramphenicol was present in the growth medium suggests linear transfer curve response is not due to antibiotic resistance mechanisms. Introduction of gfp genetic device led to nonlinear device transfer curves Considering the results described above, a model system consisting of three genetic devices was constructed to determine if nonlinear DTCs would be obtained (Figure 3-2C). The model system is the plasmid backbone analyzed previously (Figure 3-2A) with two additional devices added. One genetic device encodes cat, while the other encodes green fluorescent protein (gfp). In order to investigate whether other factors besides the identity of a device s promoter impacts linear system behavior, a derivative of the constitutive bacteriophage P L λ promoter was used for both cat and gfp [50]. E. coli DH1 cells harboring the model system constructs (Figure 3-2C) were grown in LB medium as described in the Methods. At mid-exponential growth, cells were harvested and total RNA and DNA extracted. Relative nptii, cat, and gfp transcript levels and copy number were subsequently quantified using real-time qpcr to obtain DTCs (Figure 3-6). Note that the copy number of the puc construct relative to its psc101 counterpart was ~6X greater compared to the similar constructs in the previously studied series of plasmids (Figures 3-3, 3-4, and 3-5). Unlike the latter series of plasmids, the growth rate of cells was not comparable among constructs harboring the three devices of the model system. While cells harboring the psc101, p15a, and pmb1 constructs had doubling times comparable to one another (and similar to the ~50 minute doubling time found for the constructs used in the experiments of Figures 3-3, 3-4, and 3-5, see Table 3-1), the doubling time of cells harboring the puc construct was ~2X greater (Table 3-2). It has been observed that that the plasmid copy number of constructs with ColE1-derived origins (e.g. puc) increases under slow-growth conditions [51]. The results here are consistent with these findings. Table 3-2 Growth rate of cells grown in LB medium harboring the different constructs in model system Numbers indicate the time in minutes necessary for the OD 600nm to double in the log phase. The mean value ± 95% confidence interval as determined in duplicate has been reported. origin psc101 p15a pmb1 puc backbone 45 ± 1 50 ± 2 54 ± 3 49 backbone with cat device backbone with gfp device backbone with cat and gfp devices ± 2 58 ± ± 1 53 ± 2 56 ± 1 80 ± 2 46 ± ± ± 2 27
36 A B 28
37 C Figure 3-6 DTC characterization of the model system. gfp (A), nptii (B), and cat (C) DTCs obtained from the series of model system plasmids (Figure 3-2C). The cumulative data presented were the result of two independent experiments. Constructs were tested in duplicate during each independent experiment. Three data points (and not four) are shown for the psc101 construct in all panels because a replicate was lost during sample preparation. RNA and copy number values were normalized to that of the psc101 construct, with each having been assigned a mean value of one. The piecewise-linear fits that minimized the sum of squared residual error are also shown. As done for the other systems, a linear regression was fitted to the gfp data (Figure 3-6A). The results suggested that the E. coli system response to the gfp device was not linear (not shown). This was due to the 95% confidence interval for the y- intercept not including the origin (i.e ). The 95% confidence interval for the y- intercept still did not include the origin if only the first three constructs (i.e. the ones with the psc101, p15a, and pmb1 replicons) were considered. This suggested a piecewiselinear model for the data, with the first segment consisting of data points for the psc101, p15a constructs (where the 95% interval for the y-intercept included the origin) and the second segment data points for the pmb1, puc constructs. The piecewise-linear approximation is used in electrical engineering to model nonlinear transfer curves [52]. To arrive at a piecewise-linear model in a systematic manner, the problem was approached as a nonlinear least squares optimization [53]. The NLIN Gauss-Newton 29
38 procedure in SAS was used to fit the data to a piecewise-linear model consisting of two segments with unknown slopes and an unknown breakpoint (Figure 3-6A). The algorithm was not forced to go through the origin. This way, the appropriateness of the fit could later be verified by noting the y-intercept obtained from the slopes and breakpoint numerically computed by the NLIN procedure. A y-intercept of 0.07 was obtained, which is approximately equal to the origin. The change in slope between the two segments (~7X fold) was taken as a means to report the nonlinearity observed in the gfp DTC. As was done for gfp, SAS was used to fit piecewise-linear models to the data for the nptii and cat devices (Figures 3-6B and 3-6C, respectively). Unlike the former, however, the fits that minimized the sum of squared residuals had the first segment consisting of data points for the psc101, p15a, and pmb1 constructs (not shown). The second segment could, thus, not be determined because the puc construct remained as the only available point (i.e. one needs two points to fit a line). As an approximate solution to this problem, a piecewise-linear model was determined for each device by fitting a linear regression to the psc101, p15a, pmb1 and pmb1, puc constructs for the first and second segments, respectively (Figures 3-6B and 3-6C). The two segments for the nptii and cat devices had similar slopes. This was noticeably smaller than the ~7X fold change observed for gfp (Figure 3-6A). Superposition lost at higher expression levels with the addition of gfp Next, superposition experiments were performed to verify the DTC results of the previous section and to determine whether the E. coli system can indeed behave as a linear system under small perturbation conditions. If the nonlinear E. coli system can be approximated as a linear one, the perturbing devices may be studied independent of one another (Figure 3-1C). This, in turn, would allow one to predict the response of E. coli to the complete system (backbone with both cat and gfp devices) from characterization data of the individual devices. In other words, the addition of new devices would not impact the expression levels of the devices present prior. E. coli DH1 cells harboring either the empty plasmid backbones or the various backbones containing cat or/and gfp devices were grown in LB medium. At mid-exponential growth, cells were harvested and total DNA extracted. Plasmid copy number was subsequently quantified using real-time qpcr (Figure 3-7A). The results indicated that the plasmid copy number was unaffected by the addition of cat and/or gfp devices to the backbone with a psc101 origin. Device addition, however, began to have an impact at higher copy numbers. The change in plasmid copy number was most pronounced by the addition of the gfp device, with those resulting from cat not being statistically significant even with the puc replicon. While the growth rate data (Table 3-2) also support this finding, the numbers suggest that a change in the plasmid copy is not necessarily reflected by a corresponding change in the cell doubling time. The larger nonlinearity observed in the gfp DTC (Figure 3-6A) interestingly also manifested itself in superposition experiments involving device transcript levels. Cells containing the psc101, p15a, and puc origins that had been harvested above were used to quantify the transcript levels of the different devices. The latter two replicons were chosen so as to have data points on either side of the DTC breakpoints (Figure 3-6). The 30
39 A B 31

40 C D 32
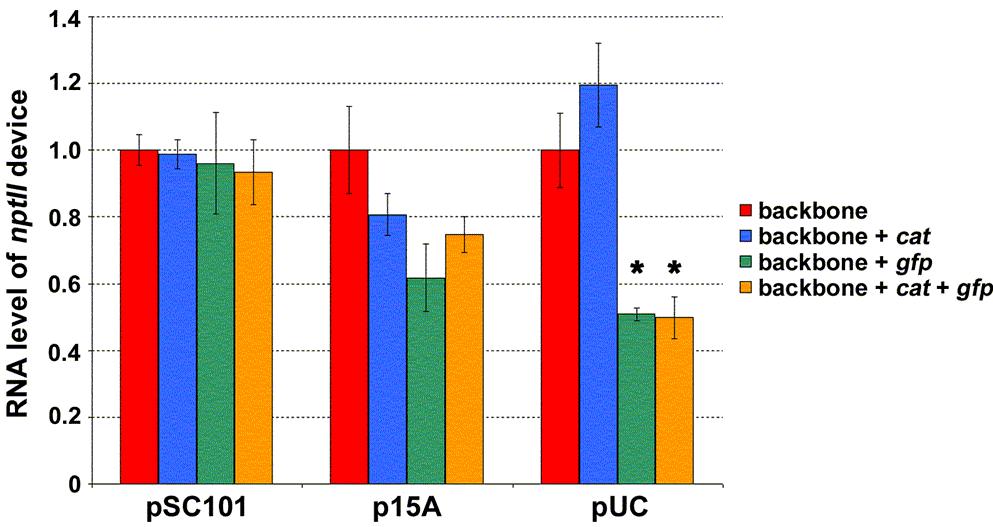
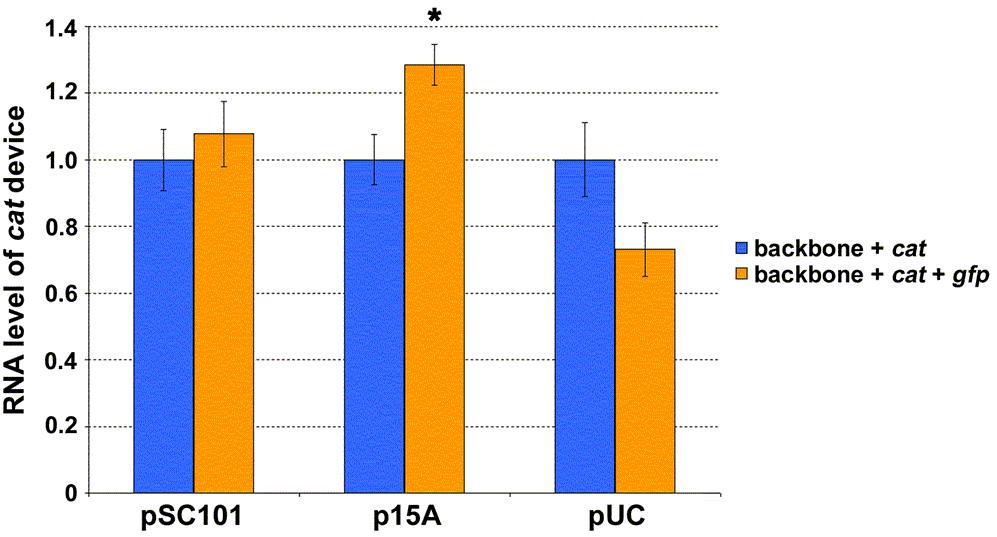
41 Figure 3-7 Testing for the presence of superposition in the model system. For each of the indicated replicons, plasmid copy number (A) and nptii transcript level per plasmid copy (B) were determined for empty backbone and backbone harboring cat or/and gfp devices. Values for each replicon were normalized to that of the empty backbone construct, which was assigned a mean value of one. The difference in value between empty and device harboring backbone was determined statistically for each replicon (P < 0.05, t-test). Asterisks indicate significant difference. C. For each of the indicated replicons, cat transcript level per plasmid copy was determined for backbone containing either cat device alone or both cat and gfp devices. Values for each replicon were normalized to that of the backbone construct with only cat device present, which was assigned a mean value of one. The difference in value between backbone containing either cat device alone or both cat and gfp devices was determined statistically for each replicon (P < 0.05, t-test). Asterisks indicate significant difference. D. For each of the indicated replicons, gfp transcript level per plasmid copy was determined for backbone containing either gfp device alone or both cat and gfp devices. Values for each replicon were normalized to that of the backbone construct with only gfp device present, which was assigned a mean value of one. The difference in value between backbone containing either gfp device alone or both cat and gfp devices was determined statistically for each replicon (P < 0.05, t-test). No significant differences were observed. For all panels, the mean value as determined from two independent experiments (constructs were tested in duplicate during each independent experiment) has been reported. Error bars denote standard error. psc101 origin was selected to investigate whether superposition observed at the plasmid copy level (Figure 3-7A) also applied to device transcript levels. Total RNA was extracted from cells and transcript levels quantified using real-time qpcr (Figures 3-7B, 3-7C, and 3-7D). As the plasmid copy varied among the constructs for a particular replicon (Figure 3-7A), transcript levels were not only normalized to the endogenous 16S but also to the plasmid copy number. That is, values reported are RNA produced per unit plasmid. Superposition would be in effect if the amount of RNA produced by the nptii device (Figure 3-7B) did not change after additional devices had been introduced into the plasmid. That is with superposition, if the plasmid backbone harboring genetic device nptii led to the production of a certain amount of that device s RNA, one would obtain the same amount upon addition of cat and/or gfp devices. Similar arguments apply to superposition for the cat and gfp devices (Figures 3-7C and 3-7D, respectively). As was the case for plasmid copy (Figure 3-7A), the results indicated that nptii transcript level is unaffected by the addition of cat and/or gfp genetic devices to a plasmid with a psc101 replicon (Figure 3-7B). Device addition began to have an impact at higher copy numbers. The changes in nptii transcript level were, once again, the most pronounced by the addition of the gfp device, with those resulting from cat not being statistically significant even with the puc origin. The data for cat and gfp RNA exhibited a similar pattern. Once again, cat or gfp transcript level was unaffected by the addition of the other device to a plasmid with a psc101 replicon (Figures 3-7C and 3-7D). The addition of gfp, 33
42 however, affected cat RNA at the higher copy numbers (Figure 3-7C). This was not the case in the reverse direction. That is, cat device addition did not impact gfp RNA at the higher copy numbers of p15a and puc (Figure 3-7D). These results suggest that the extent of the changes brought about by gfp is large enough to mask those caused by the addition of cat. Discussion The results indicate that the E. coli biological system can exhibit linear system behavior (Figure 3-7). In the model system presented in this chapter, the necessary condition with all three genetic devices present was to use a plasmid backbone harboring the psc101 replicon. That is, the experimental results showed superposition to be present at this copy number. The presence of superposition, however, was not only a consequence of having used the psc101 origin. In the absence of the gfp device, superposition was found even with a puc origin (Figure 3-7). The finding that superposition is possible under different contexts is important. It suggests that the nonlinearity in the E. coli system is not complex to the point of preventing design efforts to elicit a linear system response. A simple mathematical model that captures the DTC results can be derived by noting the rate of change of a molecular entity is a synthesis term minus a degradation term. Assuming that the synthesis of RNA is proportional to the amount of DNA present and that its degradation is proportional to the amount of RNA, the equation for RNA becomes [54] d RNA = α DNA β RNA, (1) dt where α and β are proportionality constants that capture the synthesis and degradation rates, respectively. Under steady-state conditions, the left hand side of equation (1) becomes zero and one arrives at the following equation α RNA =, (2) β SS DNA SS where RNASS and DNASS are the steady-state RNA and copy number of the encoding DNA, respectively. The nonlinearity observed in the piecewise-linear DTCs (Figure 3-6) α may, thus, be modeled by a change in the slope term of equation (2). That is, the β synthesis and/or degradation rate varies for the devices at higher copy numbers. Analysis of RNA degradation after cells had been treated with rifampicin did not reveal a noticeable change in the decay rates of gfp and cat transcripts at the higher copy number of puc relative to p15a (Figure 3-8). This suggests that the larger nonlinearity observed in gfp is due to a modulation in the synthesis rate. The fact that gfp and cat have identical P L promoters in our model system further suggests that the mechanism involved does not affect the initiation of transcription. Perhaps, the stringent response is implicated in this matter. Previous work has indicated that the E. coli stringent response can differentially impact the elongation rate of transcripts [55]. Cells harboring the model system plasmids (Figure 3-2C) with the pmb1 and puc replicons did not grow in M9 minimal medium, suggesting that cells might be in a starvation like condition at the higher copy numbers. This is also supported by the growth rate data in LB medium, with the doubling time 34
43 A βcat p15a puc B βgfp p15a puc 1 2 Figure 3-8 Effect of copy number variation on RNA decay rate β. The fold change in the decay rate β of cat (A) and gfp (B) transcripts as copy number increases from using origin p15a to puc. The cumulative data presented were the result of two independent experiments. The mean value has been reported, with the error bars denoting standard error. Values have been normalized to that of the p15a construct, which was assigned a mean value of one. increasing at the higher copy numbers (Table 3-2). Gene sequence has been shown to influence transcriptional pausing of RNA polymerase in the presence of guanosine tetraphosphate (ppgpp) [56]. Perhaps, the coupling present between transcription and translation in E. coli facilitates this effect, with ribosomal ppgpp synthesis affecting upstream RNA polymerase that is in the process of transcript elongation. Cooperative activity between RNA polymerase and ribosomes has been shown to modulate the elongation rate of transcripts in E. coli [57], with this linkage involving the NusE-NusG complex [58]. It also needs to be acknowledged that copy number was the only perturbing factor considered in our study. The cat and gfp genes were expressed as done previously [50] (see below). As such, the devices have different RBS sequences (strengths). Promoter strength, RBS strength, and codon usage may be coupled perturbing factors because of the cooperative activity between RNA polymerase and ribosomes. Indeed, a range of promoters, RBS strengths, and codon usage need to be 35
44 used to better elucidate the mechanism underlying the large observed nonlinearity in gfp s DTC (Figure 3-6). The results do, however, suggest that the transfer curve-based framework has application in the engineering of biological systems. A correspondence between DTC nonlinearity and the break down of linear system behavior was observed. That is, the gfp device was found to elicit a more nonlinear DTC response from the E. coli system than the other tested devices (~7X change in slope as compared to no change for nptii and cat devices, Figure 3-6), which was reflected in superposition being lost when gfp was present at copy numbers above the psc101 level. While a change in growth rate offers an alternate gauge for nonlinearity, it does not appear to provide one with the same level of accuracy. The doubling time as monitored by OD 600nm only began to change noticeably with the puc replicon (Table 3-2), failing to indicate changes to copy number (Figure 3-7A) and transcript (Figures 3-7B, 3-7C, and 3-7D) due to gfp at the other origins. This indicates the significance of quantitative techniques (such as DTCs) to synthetic biology characterization efforts because growth rate alone is unable to accurately capture changes that take place due to device addition. DTCs may have application in the general characterization of devices. A device could be characterized by cloning it into a standard plasmid and its copy number varied by way of different replicons. Based on the nonlinearity gauged from its resulting DTC, one may subsequently be able to determine whether the device is well suited for eliciting a predictable, linear response from E. coli when used in combination with other devices. Determining factors that impact linear system behavior in E. coli would also be of benefit to synthetic biology. Such knowledge may enable the construction of biological systems using superposition because guidelines for the conditions necessary that ensure linear system behavior would be available. In this research, the focus was on device copy number as the perturbing factor. Promoter strength is another important factor (as are RBS strength, gene length, codon usage, and product function). A library of constitutive promoters has been characterized using the cat and gfp genes [50]. By expressing cat and gfp in the manner done in that study, the model system constructed in this work can be used to investigate the effect promoter strength has on linear system behavior. The results here appear to suggest that the identity of a device s promoter is not the only factor that impacts linearity in its RNA expression profile. While gfp had a promoter identical to that of cat, the former was the most nonlinear in our three-device model system (Figure 3-6). In fact, cat and nptii had similar DTCs in the three-device model system, but yet had different promoters. Comparison of the cat DTCs in the two-device (Figure 3-5B) and three-device (Figure 3-6C) constructs also supports this premise. The cat DTC was primarily linear for both cases. The cat device in one experiment, however, had its native promoter (Figure 3-5B), while the P L promoter was used in the other (Figure 3-6C). Comparison of the DTC results of the two-device (Figure 3-5) and threedevice (Figures 3-6B and 3-6C) constructs also suggest that the amount of nonlinearity in the E. coli system response to devices harboring nptii and cat genes is not impacted greatly by slow-growth conditions. The results from the backbone, two-device, and three-device constructs also suggest that the DTC slope (which is the transfer curve gain) may act as a useful metric for characterizing promoter strength of a gene. The gain of the native nptii promoter was found to be ~1 in the various constructs tested (Figures 3-4, 3-36
45 5A, and 3-6B), with similar values having been found irrespective of the choice of growth medium (Figure 3-4) or a change in growth rate (Figures 3-5A and 3-6B). Small-signal linearization techniques may also have application to other aspects of biological system behavior. Input-output relationships can be defined and experimentally measured to generate transfer curves, where piecewise linear models may subsequently be employed to determine the linear range of the system. Examples could include inducer concentration to activated transcription factor, activated transcription factor to RNA, and RNA to protein transfer curves. Measuring input-output characteristics and applying small-signal linearization techniques have the potential of reducing the complex mathematical equations used to model biological interactions to their simplest form; thereby, permitting predictable, quantitative behavior predictions. The limitation of small-signal linearization techniques is that the linearity property needs to be checked. As was observed in the model system, however, some systems can have a linear regime. So long as experiments are performed within this regime, one can avoid nonlinear effects and apply the simplifications associated with a small-signal linear model. And even if the system is to be operated in the nonlinear regime, it may be possible to introduce nonlinear correction factors to the obtained small-signal linear model. In Equation (2), for instance, this can be modeled by having the magnitudes of α and/or β dependent on the copy number (as opposed to constant values). With the results suggesting that the transfer curve and small-signal concepts used in electrical engineering can likewise be employed towards biological systems, the application of other concepts may also be of benefit to synthetic biology. The transfer curve concept is primarily of use in studying the steady-state behavior of a system. Linear systems can also be studied in the frequency domain by using Fourier techniques, which enable engineers to predict time-domain system response. These techniques have been used previously to study the yeast osmo-adaptation system [59]. Indeed, the application of analysis and design techniques of other established engineering disciplines may enable the systematic forward engineering of biological systems for improved biotechnology applications. Methods Bacterial strains, media, and enzymes E. coli DH10B and DH5α were used for cloning. E. coli DH1 was used for expression work. Luria-Bertani (LB) media was made as described in [31]. M9 minimal media + 0.5% glucose supplemented with micronutrients was made as described in [60]. Restriction enzymes and T4 DNA ligase were purchased from New England Biolabs, with digestion and ligation reactions performed as recommended by the enzyme manufacturer. PCR reactions were performed with Phusion polymerase from Finnzymes, and the primers used were synthesized by Integrated DNA Technologies, Inc. The composition of the PCR reactions, cycle times, and temperatures followed those suggested by the enzyme manufacturer. PCR products were sequenced once cloned into the respective plasmids to ensure that no mutations had been introduced during the amplification process. In cases where single digest cloning was performed, sequencing was also used to select for constructs with inserts in the desired orientation. 37
46 Plasmid construction The plasmid backbones with the replicons of pmpp6, psc101, p15a, pmb1, and puc (Figure 3-2A) were constructed using standard molecular biology techniques [31]. These plasmids were named pamin 82 [GenBank:HQ283397], pamin81 [GenBank:HQ283398], pamin78 [GenBank:HQ283399], pamin79 [GenBank:HQ283400], and pamin80 [GenBank:HQ283401], respectively. The construction of the two-device series of plasmids (Figure 3-2B) proceeded as follows. PCR was used to obtain a spacer and the cat gene (with its corresponding native promoter) as inserts. Primers lacz_1_f and lacz_1_r (Table 3-3) were used to obtain the spacer, with p50gl [35] having been used as template. A spacer was used to create spatial separation between the neighboring nptii and cat devices, and to not have the devices right next to each other. The spacer sequence consisted of a ~600bp fragment taken from within the coding region of the bacterial lacz gene. The cat gene was obtained by using the primers cat_wt_f and cat_wt_r (Table 3-3), with pacyc184 having served as template. The spacer and cat inserts were digested with AvrII,XbaI and XbaI,SacI, respectively, and ligated into a AvrII,SacI digested pamin81 in a three-fragment ligation reaction. The cat genetic device (complete with spacer and terminator) was subsequently transferred into pamin78, pamin79, pamin80, and pamin81 using MluI single digest to arrive at the desired series of plasmids (Figure 3-2B). The construction of the model system series of plasmids (Figure 3-2C) proceeded by first creating a series of cat device (with the P L promoter) containing plasmids. PCR was used to obtain the cat open-reading frame as insert. The primer pairs used were cat_orf_f and cat_orf_r (Table 3-3), with pacyc184 having served as template. This insert was digested with KpnI,MluI, and ligated into pze21 [61] to create pamin92. PCR was subsequently used to obtain the cat gene (with the P L promoter) as insert using the primer pairs PL_F and cat_wt_r (Table 3-3) and pamin92 as template. This insert was digested with AatII,StuI, and ligated into the two-device (Figure 3-2B) series of plasmids to yield a series of cat device (with the P L promoter) containing constructs. Next, work began on constructing a gfp device (with the P L promoter) containing construct with psc101 as the origin. This plasmid was called pamin81+gfp PL. PCR was used to obtain a spacer (different in sequence from that above) and the cat gene as inserts. Primer pairs lacz_2_f and lacz_2_r (Table 3-3) were used for the spacer, and p50gl served as the template. The cat gene was obtained by using the primers cat_wt_f and cat_wt_r (Table 3-3), with pacyc184 having served as template. The spacer here was to create spatial separation between the neighboring cat and gfp devices, and consisted of a ~600bp fragment taken from within the coding region of the bacterial lacz gene. The spacer and cat inserts were digested with AvrII,AatII and AatII,SacI, respectively, and ligated into a AvrII,SacI digested pamin81 in a three-fragment ligation reaction to create pamin93. The cat genetic device (complete with spacer and terminator) was subsequently transferred into pamin81 to create pamin99. PCR was next used to obtain the gfp openreading frame as insert. Primer pairs gfp_f and gfp_r (Table 3-3) were used, with BBa_E0044 [14] serving as the template. This insert was digested with KpnI,HindIII, and ligated into pze21 to create pamin100. PCR was then used to obtain the gfp gene (with P L promoter) using the primer pairs PL_F and gfp_2_r (Table 3-3) and pamin100 38
47 as template. The creation of pamin81+gfp PL subsequently proceeded by performing a three-fragment ligation reaction of this fragment digested with AatII,SacI, the ~2.5kb fragment released from a AvrII,SacI digested pamin93, and the ~2kb fragment released from a AvrII,AatII digested pamin99. The gfp genetic device (complete with spacer and terminator) was finally transferred from pamin81+gfp PL into the cat device (with the P L promoter) containing series of plasmids described prior using BamHI, creating the desired series of plasmids (Figure 3-2C). Sub-cloning was used in order to arrive at the gfp device (with the P L promoter) containing constructs with the other three origins of replication. More specifically, the origins released from a AvrII,SmaI digested pamin78, pamin79, and pamin80 were ligated into pamin81+gfp PL to yield pamin78+gfp PL, pamin79+gfp PL, and pamin80+gfp PL. Bacterial growth conditions E. coli DH1 cells were grown overnight at 30 C, 200 rpm shaking after inoculating 5 ml cultures of LB media (supplemented with 50 μg/ml kanamycin) with single colonies from freshly streaked plates. After sub-culturing (1:50) into shake flasks containing 50 ml of either M9 minimal or LB media (supplemented with 50 μg/ml kanamycin), cells were grown at 30 C, 200 rpm shaking until an OD 600nm of was reached to approximate steady-state conditions. At this time, 1 ml of cells were added to ice chilled tubes with 100 μl of 10% phenol:90% EtOH stop solution [62], mixed, spun down, supernatant removed, and total RNA isolation proceeded immediately thereafter. Another 1 ml of cells were spun down, supernatant removed, and cell pellets subsequently frozen for total DNA isolation at a future date. Collection of bacterial cells for RNA decay measurements E. coli DH1 cells were grown overnight at 30 C, 200rpm shaking after inoculating 5mL cultures of LB media (supplemented with 50μg/mL kanamycin) with single colonies from freshly streaked plates. After sub-culturing (1:50) into shake flasks containing 50mL of LB media (supplemented with 50μg/mL kanamycin), cells were grown at 30 C, 200rpm shaking until an OD 600nm of was reached to approximate steady-state conditions. Rifampicin dissolved in methanol was added at this time to arrest transcription (final concentration = 250μg/mL). Cells were collected at serial time points for analysis of RNA decay after rifampicin treatment. At each time point, 1mL of cells were added to ice chilled tubes with 100μL of 10% phenol:90% EtOH stop solution [62], mixed, spun down, supernatant removed, and frozen for total RNA isolation at a future date. Bacterial total RNA isolation to quantify nptii, cat, and gfp expression levels Bacterial cell pellets were resuspended in 700 μl buffer RLT (Qiagen), to which betamercaptoethanol had been added according to the manufacturer s instructions. Cells were subsequently lysed using 0.1 mm diameter glass beads in the Mini-Beadbeater-8 (Biospec). Following lysis, tube contents were spun down and 500 μl of lysate was transferred to new tubes. Total RNA extraction then proceeded by adding 500 μl of 25:24:1 phenol:chloroform:isoamyl alcohol, vortexing vigorously for ~1 min, allowing the tubes to sit at bench for a few minutes subsequent, and centrifugation for 15 min at 39
48 12000 x g, 4 C. Next, 300 μl of the upper aqueous phase was transferred to a new tube containing 300 μl nuclease free water. RNA extraction continued by adding 600 μl of chloroform to each tube, vigorous vortexing for ~1 min, allowing the tubes to sit at bench for a few minutes subsequent, and centrifugation for 15 min at x g, 4 C. Next, 300 μl of the upper aqueous phase was transferred to a new tube. Following chloroform extraction, total RNA was ethanol precipitated overnight, washed with 70% ethanol, and finally resuspended in 30 μl of nuclease free water. RNA concentration and purity were assayed using a Nanodrop spectrophotometer, and integrity examined on 2% agarose gels. cdna synthesis and real-time qpcr quantification of cellular nptii, cat, and gfp transcript levels Total RNA extracted was treated with Turbo DNase (Ambion) to reduce DNA contamination. First-strand cdna was synthesized by using reverse gene-specific primers (Table 3-4) and SuperScript III Reverse Transcriptase (Invitrogen) following the manufacturer s instructions. Transcript levels were normalized to that of endogenous 16S rrna. The primer sets specific to nptii, cat, gfp, and 16S rrna (Table 3-4) amplified a single product of the expected size as confirmed by the melting temperatures of the amplicons. Real-time qpcr was conducted on a BioRad icycler with 96-well reaction blocks in the presence of SYBR Green under the following conditions: 1X iq SYBR Green Supermix (BioRad), 150 nm nptii, 300 nm cat, 100 nm gfp, or 500 nm 16S primers in a 25 μl reaction. Real-time qpcr cycling was 95 C for 3 min, followed by 40 cycles of 30 sec at 95 C, 30 sec at 60 C, and 30 sec at 72 C. Threshold cycles (Ct) were determined with icycler (BioRad) software for all samples. A standard curve was prepared for quantification. For this purpose, a fourfold dilution series of a total of seven dilutions was prepared from a digested total DNA sample, and each dilution was subjected to qpcr analysis in triplicate with either the nptii, cat, gfp, or 16S specific primers. Obtained Ct values were used by the icycler software package to plot a standard curve that allowed quantification of nptii, cat, gfp, or 16S in the total RNA samples (i.e. unknowns) relative to the RNA sample used to prepare the standard curve. Bacterial total DNA isolation to quantify plasmid copy number The DNA isolation method reported in the previous publications [43, 63] was adopted. Bacterial cell pellets were resuspended in 400 μl of 50 mm Tris/50 mm EDTA, ph 8, by vortex. Cell membranes were permealized by the addition of 8 μl of 50 mg/ml lysozyme (Sigma) in 10 mm Tris/1 mm EDTA, ph 8, followed by incubation at 37 C for 30 min. To complete cell lysis, 4 μl of 10% SDS and 8 μl of 20 mg/ml Proteinase K solution (Invitrogen) were added to each tube, mixed with a syringe with 21 gauge 1.5 inch needle, and incubated at 50 C for 30 min. Proteinase K was subsequently heat inactivated at 75 C for 10 min, and RNA was digested with the addition of 2 μl of 100 mg/ml RNase A solution (Qiagen) followed by incubation at 37 C for 30 min. Total DNA extraction then proceeded by adding 425 μl of 25:24:1 phenol:chloroform:isoamyl alcohol, vortexing vigorously for ~1 min, allowing the tubes to sit at bench for a few minutes subsequent, and centrifugation for 5 min at x g, 4 C. Next, 300 μl of the upper aqueous phase was transferred to a new tube using a wide-opening pipet tip. DNA extraction continued by adding 400 μl of chloroform to each tube, vigorous vortexing for ~1 min, allowing the tubes to sit at bench for a few minutes subsequent, and 40
49 centrifugation for 5 min at x g, 4 C. Next, 200 μl of the upper aqueous phase was transferred to a new tube using a wide-opening pipet tip. Following chloroform extraction, total DNA was ethanol precipitated overnight, washed with 70% ethanol, and finally resuspended in 40 μl of nuclease free water. DNA concentration and purity were assayed using a Nanodrop spectrophotometer, and integrity examined on 1% agarose gels. Real-time qpcr quantification of plasmid copy number Primer sets specific to the nptii and 16S rdna genes were used (Table 3-4). These primers amplified a single product of the expected size as confirmed by the melting temperatures of the amplicons. The nptii gene is a single-copy gene of the plasmids characterized in this study, while 16S is a multi-copy gene of E. coli chromosomal DNA [64] and was used for normalization purposes [43, 45]. Total DNA isolated from each strain was first digested overnight using EcoRI (New England Biolabs) at 37 C. Realtime qpcr was conducted on a BioRad icycler with 96-well reaction blocks in the presence of SYBR Green under the following conditions: 1X iq SYBR Green Supermix (BioRad), 150 nm nptii, or 500 nm 16S primers in a 25 μl reaction. Real-time qpcr cycling was 95 C for 3 min, followed by 40 cycles of 30 sec at 95 C, 30 sec at 60 C, and 30 sec at 72 C. Threshold cycles (Ct) were determined with icycler (BioRad) software for all samples. A standard curve was prepared for quantification. For this purpose, a fourfold dilution series of a total of seven dilutions was prepared from a digested total DNA sample, and each dilution was subjected to qpcr analysis in triplicate with either the nptii or 16S specific primers. Obtained Ct values were used by the icycler software package to plot a standard curve that allowed quantification of nptii or 16S in the digested total DNA samples (i.e. unknowns) relative to the DNA sample used to prepare the standard curve. 41
50 Table 3-3 List of PCR primers used in the cloning of the plasmids constructed in this chapter Primer lacz_1_f lacz_1_r cat_wt_f cat_wt_r cat_orf_f cat_orf_r PL_F lacz_2_f lacz_2_r gfp_f gfp_r gfp_2_r Sequence tattatctcgagtacctaggggtaacagtttctttatgg tattattctagattcgctggtcacttcgatggtttg tattattctagagacgtcgaataaatacctgtgacggaag tattaagagctcaggcctaataactgccttaaaaaaattacg tattatggtacctttcaggagctaaggaagctaaaatg taataaacgcgtccaataactgccttaaaaaaattacg tattatgacgtctccctatcagtgatagagattgacatc tattaacctaggaggatccatgttgccactcgc taataagacgtcatcggtcagacgattcattg tattatggtaccgcatgcgtaaaggagaagaacttttcactggagttgtcc taataaaagcttattaaactgatgcagcgtagttttcgtcgtttgctgcaggccttttg tattaagagctcgaagtgcttcaagcttattaaactgatgcagcgtag Table 3-4 List of real-time qpcr primers used in this study Primer Sequence Reference qpcr_nptii_f gcgttggctacccgtgatat [65] qpcr_nptii_r aggaagcggtcagcccat qpcr_cat_f cgcaaggcgacaaggtg [66] qpcr_cat_r ccatcacaaacggcatgatg qpcr_gfp_f aagcgttcaactagcagacc [50] qpcr_gfp_r aaagggcagattgtgtggac qpcr_16s_f ccggattggagtctgcaact [43] qpcr_16s_r gtggcattctgatccacgattac 42
51 Chapter 4: Plasmid Copy Number Characterization of a Set of BglBrick-Compatible Vectors Background As stated in Chapter 1, one of the earliest contributions of synthetic biology was the creation of the Registry of Standard Biological Parts [14]. A biological part is a DNA sequence that encodes a definable biological function (e.g. a gene, promoter, terminator, RBS, origin). Parts can also be composed of multiple functions (e.g. a gene and its promoter, RBS, and terminator). The registry serves as a repository of biological parts (mostly sent in by undergraduates participating in the International Genetically Engineered Machine competition), while also proposing standard rules that support the physical assembly of the different parts together. The goal of the registry is to promote sharing of parts among members of the synthetic biology community, thereby allowing biological engineers to design and assemble engineered organisms in a more systematic and rapid manner [67]. One problem is that many parts have not been well characterized. Experimental tests have not always been performed that characterize what a particular part does and whether the performance changes with different cell types. In response, the registry has been stepping up efforts to encourage contributors to include documentation on part function and performance [8]. In parallel, a new effort named BIOFAB has received funding from the National Science Foundation to professionally develop and characterize existing and new parts [8]. In the spirit of these efforts, parts conferring origin of replication functionality were further characterized in this chapter. The work here extends that done in the previous chapter by determining the absolute copy number of plasmid that results from a particular replicon (as opposed to the relative quantification done in Chapter 3), the impact (if any) that a change in bacterial cell type has on plasmid copy number, and the effect (if any) on a plasmid s copy number of introducing plasmids with different replicon into the same strain. The characterization data reported here may serve as useful information for future assays that examine linearity by way of transfer curves and/or metabolic pathway design efforts towards producing valuable chemicals in E. coli. It should be noted that the experiments conducted in this chapter were done in the context of a larger team effort to design, construct, and characterize 96 BglBrickcompatible plasmids harboring different origins of replication, selection markers, and promoters [68]. As the manuscript reporting this work is still in progress, details have been omitted here. Results and Discussion Copy number of plasmid in single plasmid strain A set of plasmids compatible with the BglII and BamHI restriction sites (i.e. BglBrick-compatible) was constructed [68]. Four replicons (belonging to different incompatibility groups) were chosen in order to vary the copy number of the constructed 43
52 plasmids. A couple of these origins of replication were also used in the previous chapter, namely p15a [38] and pmb1 [39]. One of the additional replicons utilized here is a mutated version originating from pmpp6 [41], which will be referred to as psc101** [68]. To arrive at the psc101** origin, site-directed mutagenesis was used to introduce a single nucleotide substitution in the pmpp6 origin [68]. This was to eliminate a BglII restriction site present in the latter. The other additional replicon is a derivative of the broad host origin pbbr1. The pbbr1 origin has been widely used in metabolic engineering because of its compatibility with most other replicons, thereby allowing the simultaneous use of plasmid harboring this origin with additional plasmids harboring other replicons [45, 69-70]. Real-time quantitative PCR was used to determine the copy numbers of plasmid [43-45, 71-72] harboring the aforementioned replicons. Plasmid copy numbers were determined for plasmids transformed into both BLR and DH1 E. coli strains. The single copy nptii gene harbored on plasmid served as the target, with the multi-copy 16S rdna gene harbored on host chromosome [64] having been used for normalization purposes [43, 45]. Here, plasmid copy number is defined as the number of copies of plasmid present per chromosomal equivalent in E. coli [73], and absolute plasmid copy numbers were obtained by using BLR and DH1 transgenic strains containing single nptii integration in the chromosome as the reference sample. The plasmid copy number values obtained for strains with a single plasmid of a particular replicon are comparable to those found in literature (Figure 4-1A) [42, 61, 74]. The results suggest that the DH1 and BLR strains do not differentially impact the regulation of plasmid copy number for the psc101**, p15a, and pbbr1 replicons. This is interesting as the replication mechanism of plasmids harboring these origins is different. While the mechanism of pbbr1 has not yet been elucidated, p15a-based plasmids replicate under relaxed control while psc101 (the parent of psc101**) is stringent [33]. The results, however, suggest that the choice of strain does impact the copy number obtained from a pmb1-based plasmid (Figure 4-1A). Interestingly, similar copy numbers were obtained for plasmid harboring the pbbr1 and pmb1 origins in strain DH1 and pbbr1 origin in strain BLR (Figure 4-1A). Perhaps the discrepancy observed in pmb1-based plasmids is due to differences in the concentrations and/or activity levels of the molecular players involved in its replication control. While the specific mechanism underlying this discrepancy is not known, the results here suggest that the pbbr1 origin may be preferable in applications necessitating a higher plasmid copy number. That is, the plasmid copy number appears to be less sensitive to the choice of strain as compared to the pmb1 replicon. The psc101** origin is a derivative of that of pmpp6, and comparable copy numbers for plasmids harboring either one of these replicons was also observed (Figure 4-1B). This was examined for control purposes, and suggests that the point-mutation introduced in pmpp6 to eliminate its BglII restriction site does not greatly affect the plasmid copy number resulting from the replicon. Copy number of plasmid in multi-plasmid strain In order to assess the impact of metabolic burden on plasmid copy number, the copy number of individual plasmids in the context of a three-plasmid system was determined. Here, DH1 and BLR E. coli strains were co-transformed with psc101**, 44
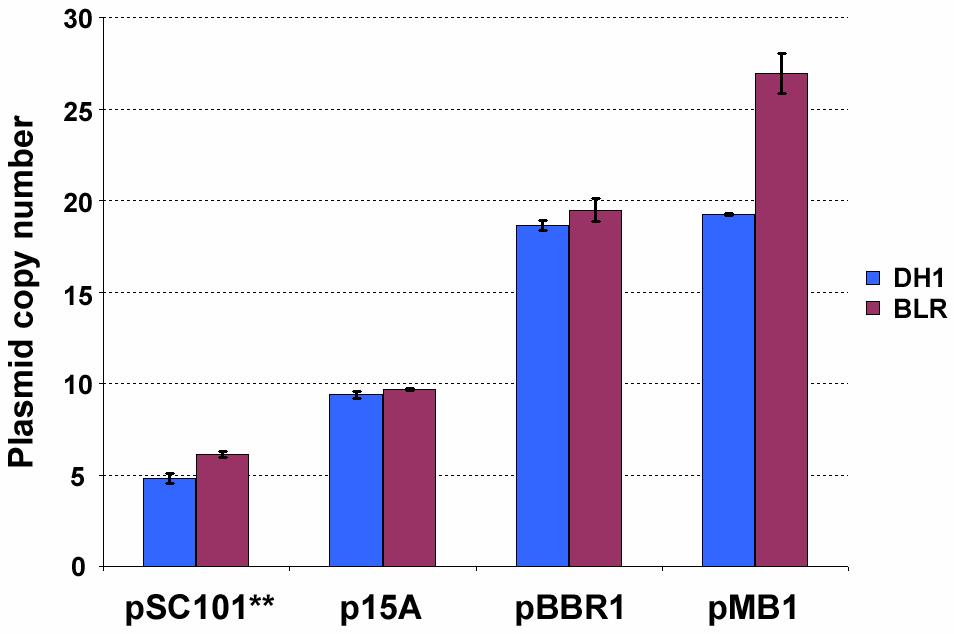

53 A B 45
Orthogonal Ribosome Biofirewall
 1 2 3 4 5 Supporting Information Orthogonal Ribosome Biofirewall Bin Jia,, Hao Qi,, Bing-Zhi Li,, Shuo pan,, Duo Liu,, Hong Liu,, Yizhi Cai, and Ying-Jin Yuan*, 6 7 8 9 10 11 12 Key Laboratory of Systems
! Intended Learning Outcomes:
 Introduction to Part Assembly: Building with BioBrick TM Objective: To simulate a standard method for assembling biological parts. Intended Learning Outcomes: 1. Students will be able to distinguish and
Reading Lecture 3: 24-25, 45, Lecture 4: 66-71, Lecture 3. Vectors. Definition Properties Types. Transformation
 Lecture 3 Reading Lecture 3: 24-25, 45, 55-66 Lecture 4: 66-71, 75-79 Vectors Definition Properties Types Transformation 56 VECTORS- Definition Vectors are carriers of a DNA fragment of interest Insert
Design. Construction. Characterization
 Design Construction Characterization DNA mrna (messenger) A C C transcription translation C A C protein His A T G C T A C G Plasmids replicon copy number incompatibility selection marker origin of replication
DNA Cloning with Cloning Vectors
 Cloning Vectors A M I R A A. T. A L - H O S A R Y L E C T U R E R O F I N F E C T I O U S D I S E A S E S F A C U L T Y O F V E T. M E D I C I N E A S S I U T U N I V E R S I T Y - E G Y P T DNA Cloning
Molecular Genetics Techniques. BIT 220 Chapter 20
 Molecular Genetics Techniques BIT 220 Chapter 20 What is Cloning? Recombinant DNA technologies 1. Producing Recombinant DNA molecule Incorporate gene of interest into plasmid (cloning vector) 2. Recombinant
Supporting Information
 Supporting Information Development of a 2,4-Dinitrotoluene-Responsive Synthetic Riboswitch in E. coli cells Molly E. Davidson, Svetlana V. Harbaugh, Yaroslav G. Chushak, Morley O. Stone, Nancy Kelley-
MIT Department of Biology 7.013: Introductory Biology - Spring 2005 Instructors: Professor Hazel Sive, Professor Tyler Jacks, Dr.
 MIT Department of Biology 7.01: Introductory Biology - Spring 2005 Instructors: Professor Hazel Sive, Professor Tyler Jacks, Dr. Claudette Gardel iv) Would Xba I be useful for cloning? Why or why not?
Molecular Biology: Gene cloning
 Molecular Biology: Gene cloning Author: Prof Marinda Oosthuizen Licensed under a Creative Commons Attribution license. CLONING VECTORS The central component of a gene cloning experiment is the vector or
Chapter 20 Recombinant DNA Technology. Copyright 2009 Pearson Education, Inc.
 Chapter 20 Recombinant DNA Technology Copyright 2009 Pearson Education, Inc. 20.1 Recombinant DNA Technology Began with Two Key Tools: Restriction Enzymes and DNA Cloning Vectors Recombinant DNA refers
Regulation of enzyme synthesis
 Regulation of enzyme synthesis The lac operon is an example of an inducible operon - it is normally off, but when a molecule called an inducer is present, the operon turns on. The trp operon is an example
Genetics. Chapter 9 - Microbial Genetics. Chromosome. Genes. Topics - Genetics - Flow of Genetics - Regulation - Mutation - Recombination
 Chapter 9 - Microbial Genetics Topics - Genetics - Flow of Genetics - Regulation - Mutation - Recombination Genetics Genome (The sum total of genetic material of a cell is referred to as the genome.) Chromosome
Supplementary Information
 Supplementary Information Fluorescent protein choice The dual fluorescence channel ratiometric promoter characterization plasmid we designed for this study required a pair of fluorescent proteins with
3 Designing Primers for Site-Directed Mutagenesis
 3 Designing Primers for Site-Directed Mutagenesis 3.1 Learning Objectives During the next two labs you will learn the basics of site-directed mutagenesis: you will design primers for the mutants you designed
LAB 1: Eau that smell
 LAB 1: Eau that smell Compare 2 competing designs to optimize system performance Acknowledgements: This lab was developed with materials and guidance from the MIT 2006 igem team, as well as technical insights
Genetics Lecture 21 Recombinant DNA
 Genetics Lecture 21 Recombinant DNA Recombinant DNA In 1971, a paper published by Kathleen Danna and Daniel Nathans marked the beginning of the recombinant DNA era. The paper described the isolation of
SYNTHETIC BIOLOGY AND THE HIGH SCHOOL CURRICULUM: LAB 1 _Lab_1
 SYNTHETIC BIOLOGY AND THE HIGH SCHOOL CURRICULUM: LAB 1 http://openwetware.org/wiki/synthetic_biology_and_the_high_school_curriculum: _Lab_1 LAB 1: Eau that smell Comparing 2 competing designs to optimize
Use of In-Fusion Cloning for Simple and Efficient Assembly of Gene Constructs No restriction enzymes or ligation reactions necessary
 No restriction enzymes or ligation reactions necessary Background The creation of genetic circuits and artificial biological systems typically involves the use of modular genetic components biological
Lecture 3 (FW) January 28, 2009 Cloning of DNA; PCR amplification Reading assignment: Cloning, ; ; 330 PCR, ; 329.
 January 28, 2009 Cloning of DNA; PCR amplification Reading assignment: Cloning, ; ; 330 PCR, ; 329.") Lecture 3 (FW) January 28, 2009 Cloning of DNA; PCR amplification Reading assignment: Cloning, 240-245; 286-87; 330 PCR, 270-274; 329. Take Home Lesson(s) from Lecture 2: 1. DNA is a double helix of complementary
Lecture 3 (FW) January 28, 2009 Cloning of DNA; PCR amplification Reading assignment: Cloning, 240-245; 286-87; 330 PCR, 270-274; 329. Take Home Lesson(s) from Lecture 2: 1. DNA is a double helix of complementary
Lecture Four. Molecular Approaches I: Nucleic Acids
 Lecture Four. Molecular Approaches I: Nucleic Acids I. Recombinant DNA and Gene Cloning Recombinant DNA is DNA that has been created artificially. DNA from two or more sources is incorporated into a single
Materials and methods. by University of Washington Yeast Resource Center) from several promoters, including
 from several promoters, including") Supporting online material for Elowitz et al. report Materials and methods Strains and plasmids. Plasmids expressing CFP or YFP (wild-type codons, developed by University of Washington Yeast Resource Center)
Supporting online material for Elowitz et al. report Materials and methods Strains and plasmids. Plasmids expressing CFP or YFP (wild-type codons, developed by University of Washington Yeast Resource Center)
Schematic representation of the endogenous PALB2 locus and gene-disruption constructs
 Supplementary Figures Supplementary Figure 1. Generation of PALB2 -/- and BRCA2 -/- /PALB2 -/- DT40 cells. (A) Schematic representation of the endogenous PALB2 locus and gene-disruption constructs carrying
Artificial Repressors for Controlling Gene Expression in Bacteria
 Artificial Repressors for Controlling Gene Expression in Bacteria Electronic Supplementary Information Table of Contents Methods...2 SI Table 1: List of Oligonucleotides Used for Plasmid Construction...6
Rawan Almujaibel Anas Abu-Humaidan
 8 Rawan Almujaibel...... Anas Abu-Humaidan In the previous lecture the Dr. talked about DNA structure and their 4 types of nitrogen bases. Then he talked about bacterial DNA (chromosomes) and their replication
Genetic Engineering & Recombinant DNA
 Genetic Engineering & Recombinant DNA Chapter 10 Copyright The McGraw-Hill Companies, Inc) Permission required for reproduction or display. Applications of Genetic Engineering Basic science vs. Applied
Recombinant DNA. Lesson Overview. Lesson Overview Recombinant DNA
 Lesson Overview 15.2 Finding Genes In 1987, Douglas Prasher, a biologist at Woods Hole Oceanographic Institute in Massachusetts, wanted to find a specific gene in a jellyfish that codes for a molecule
Antisense RNA Insert Design for Plasmid Construction to Knockdown Target Gene Expression
 Vol. 1:7-15 Antisense RNA Insert Design for Plasmid Construction to Knockdown Target Gene Expression Ji, Tom, Lu, Aneka, Wu, Kaylee Department of Microbiology and Immunology, University of British Columbia
Biotechnology, Synthetic Biology, and Genetic Circuit Design Module Lesson Plan. 1 day. 1 P age
 1 P age Biotechnology, Synthetic Biology, and Genetic Circuit Design Module Lesson Plan 1 day 2 P age Introduction In this single module students will build upon their previous knowledge of basic molecular
Biotechnology and DNA Technology
 11/27/2017 PowerPoint Lecture Presentations prepared by Bradley W. Christian, McLennan Community College CHAPTER 9 Biotechnology and DNA Technology Introduction to Biotechnology Learning Objectives Compare
CHAPTER 2A HOW DO YOU BEGIN TO CLONE A GENE? CHAPTER 2A STUDENT GUIDE 2013 Amgen Foundation. All rights reserved.
 CHAPTER 2A HOW DO YOU BEGIN TO CLONE A GENE? 35 INTRODUCTION In the Program Introduction, you learned that the increase in diabetes in the United States has resulted in a great demand for its treatment,
CHAPTER 20 DNA TECHNOLOGY AND GENOMICS. Section A: DNA Cloning
 Section A: DNA Cloning 1. DNA technology makes it possible to clone genes for basic research and commercial applications: an overview 2. Restriction enzymes are used to make recombinant DNA 3. Genes can
Synthetic Biology and Rational Design Keith Shearwin University of Adelaide
 Synthetic Biology and Rational Design Keith Shearwin University of Adelaide Synthetic biology what is it? Analogy with engineering Learning by building: natural and synthetic gene circuits 1 (1) (2) 2
Figure 1. Map of cloning vector pgem T-Easy (bacterial plasmid DNA)
") Texas A&M University-Corpus Christi CHEM4402 Biochemistry II Laboratory Laboratory 6: Ligation & Bacterial Transformation (Bring your text and laptop to class if you wish to work on your assignment during
Texas A&M University-Corpus Christi CHEM4402 Biochemistry II Laboratory Laboratory 6: Ligation & Bacterial Transformation (Bring your text and laptop to class if you wish to work on your assignment during
Recitation CHAPTER 9 DNA Technologies
 Recitation CHAPTER 9 DNA Technologies DNA Cloning: General Scheme A cloning vector and eukaryotic chromosomes are separately cleaved with the same restriction endonuclease. (A single chromosome is shown
Texas A&M University-Corpus Christi CHEM4402 Biochemistry II Laboratory Laboratory 8: DNA Restriction Digest (II) and DNA Sequencing (I)
 and DNA Sequencing (I)") Texas A&M University-Corpus Christi CHEM4402 Biochemistry II Laboratory Laboratory 8: DNA Restriction Digest (II) and DNA Sequencing (I) We have made considerable progress in our analysis of the gene for
Texas A&M University-Corpus Christi CHEM4402 Biochemistry II Laboratory Laboratory 8: DNA Restriction Digest (II) and DNA Sequencing (I) We have made considerable progress in our analysis of the gene for
Supplementary Information
 Supplementary Information Supplementary Figures Figure S1. Study of mgtl translation in vitro. (A) Detection of 5 LR RNA using wild-type and anti-sd (91-95) substituted templates in a transcription-translation
Overview: The DNA Toolbox
 Overview: The DNA Toolbox Sequencing of the genomes of more than 7,000 species was under way in 2010 DNA sequencing has depended on advances in technology, starting with making recombinant DNA In recombinant
Unit 2: Metabolism and Survival Sub-Topic (2.7) Genetic Control of Metabolism (2.8) Ethical considerations in the use of microorganisms
 Genetic Control of Metabolism (2.8) Ethical considerations in the use of microorganisms") Unit 2: Metabolism and Survival Sub-Topic (2.7) Genetic Control of Metabolism (2.8) Ethical considerations in the use of microorganisms Duncanrig Secondary JHM&MHC 2015 Page 1 of 18 On completion of this
Unit 2: Metabolism and Survival Sub-Topic (2.7) Genetic Control of Metabolism (2.8) Ethical considerations in the use of microorganisms Duncanrig Secondary JHM&MHC 2015 Page 1 of 18 On completion of this
Bootcamp: Molecular Biology Techniques and Interpretation
 Bootcamp: Molecular Biology Techniques and Interpretation Bi8 Winter 2016 Today s outline Detecting and quantifying nucleic acids and proteins: Basic nucleic acid properties Hybridization PCR and Designing
Tala Saleh. Tamer Barakat ... Anas Abu. Humaidan
 7 Tala Saleh Tamer Barakat... Anas Abu. Humaidan Some Information in this lecture may not be mentioned by the Dr. as thoroughly as this sheet. But they cannot be overlooked for a better understanding,
7.1 Techniques for Producing and Analyzing DNA. SBI4U Ms. Ho-Lau
 7.1 Techniques for Producing and Analyzing DNA SBI4U Ms. Ho-Lau What is Biotechnology? From Merriam-Webster: the manipulation of living organisms or their components to produce useful usually commercial
Biotechnology. Chapter 20. Biology Eighth Edition Neil Campbell and Jane Reece. PowerPoint Lecture Presentations for
 Chapter 20 Biotechnology PowerPoint Lecture Presentations for Biology Eighth Edition Neil Campbell and Jane Reece Lectures by Chris Romero, updated by Erin Barley with contributions from Joan Sharp Copyright
Problem Set 8. Answer Key
 MCB 102 University of California, Berkeley August 11, 2009 Isabelle Philipp Online Document Problem Set 8 Answer Key 1. The Genetic Code (a) Are all amino acids encoded by the same number of codons? no
MCB 102 University of California, Berkeley August 11 13, Problem Set 8
 MCB 102 University of California, Berkeley August 11 13, 2009 Isabelle Philipp Handout Problem Set 8 The answer key will be posted by Tuesday August 11. Try to solve the problem sets always first without
BIOLOGY 101. CHAPTER 18: Gene Expression: Turning genes on and off
 BIOLOGY 101 CHAPTER 18: Gene Expression: Turning genes on and off BACTERIAL TRANSFORMATION: Bacteria have the ability to pick up DNA from their surroundings and transcribe it as if it was their own. When
Chapter 8: Recombinant DNA. Ways this technology touches us. Overview. Genetic Engineering
 Chapter 8 Recombinant DNA and Genetic Engineering Genetic manipulation Ways this technology touches us Criminal justice The Justice Project, started by law students to advocate for DNA testing of Death
Certificate of Analysis
 Certificate of Analysis pet6xhn Expression Vector Set Contents Product Information... 1 pet6xhn-n, pet6xhn-c, and pet6xhn-gfpuv Vector Information... 2 Location of Features... 4 Additional Information...
Cell-Free Protein Expression Kit
 Cell-Free Protein Expression Kit Handbook Version v.01, January 2018 Cat# 507024 (Sigma 70 Master Mix Kit, 24 Rxns) Cat# 507096 (Sigma 70 Master Mix Kit, 96 Rxns) Please refer to this product in your publication
Understanding the Cellular Mechanism of the Excess Microsporocytes I (EMSI) Gene. Andrew ElBardissi, The Pennsylvania State University
 Gene. Andrew ElBardissi, The Pennsylvania State University") Understanding the Cellular Mechanism of the Excess Microsporocytes I (EMSI) Gene Andrew ElBardissi, The Pennsylvania State University Abstract: Hong Ma, The Pennsylvania State University The Excess Microsporocytes
Understanding the Cellular Mechanism of the Excess Microsporocytes I (EMSI) Gene Andrew ElBardissi, The Pennsylvania State University Abstract: Hong Ma, The Pennsylvania State University The Excess Microsporocytes
Advancement of Oxygen Biosensor in Escherichia coli
 Rose-Hulman Institute of Technology Rose-Hulman Scholar Rose-Hulman Undergraduate Research Publications 8-30-2017 Advancement of Oxygen Biosensor in Escherichia coli Caitlyn Meiser Rose-Hulman Institute
How Do You Clone a Gene?
 S-20 Edvo-Kit #S-20 How Do You Clone a Gene? Experiment Objective: The objective of this experiment is to gain an understanding of the structure of DNA, a genetically engineered clone, and how genes are
Step 1: Digest vector with Reason for Step 1. Step 2: Digest T4 genomic DNA with Reason for Step 2: Step 3: Reason for Step 3:
 Biol/Chem 475 Spring 2007 Study Problems for Quiz 2 Quiz 2 (~50 pts) is scheduled for Monday May 14 It will cover all handouts and lab exercises to date except the handout/worksheet (yet to be distributed)
Name Per AP: CHAPTER 27: PROKARYOTES (Bacteria) p559,
 p559,") AP: CHAPTER 27: PROKARYOTES (Bacteria) p559, 561-564 1. How does the bacterial chromosome compare to a eukaryotic chromosome? 2. What is a plasmid? 3. How fast can bacteria reproduce? 4. What is a bacterial
AP: CHAPTER 27: PROKARYOTES (Bacteria) p559, 561-564 1. How does the bacterial chromosome compare to a eukaryotic chromosome? 2. What is a plasmid? 3. How fast can bacteria reproduce? 4. What is a bacterial
Biotechnology. Chapter 20. Biology Eighth Edition Neil Campbell and Jane Reece. PowerPoint Lecture Presentations for
 Chapter 20 Biotechnology PowerPoint Lecture Presentations for Biology Eighth Edition Neil Campbell and Jane Reece Lectures by Chris Romero, updated by Erin Barley with contributions from Joan Sharp Copyright
Chapter 4. Recombinant DNA Technology
 Chapter 4 Recombinant DNA Technology 5. Plasmid Cloning Vectors Plasmid Plasmids Self replicating Double-stranded Mostly circular DNA ( 500 kb) Linear : Streptomyces, Borrelia burgdorferi Replicon
pdsipher and pdsipher -GFP shrna Vector User s Guide
 pdsipher and pdsipher -GFP shrna Vector User s Guide NOTE: PLEASE READ THE ENTIRE PROTOCOL CAREFULLY BEFORE USE Page 1. Introduction... 1 2. Vector Overview... 1 3. Vector Maps 2 4. Materials Provided...
Chapter 10 Microbial Genetics: New Genes for Old Germs
 Chapter 10 Microbial Genetics: New Genes for Old Germs Objectives: After reading Chapter Ten, you should understand The structure and complexity of the bacterial chromosome and the significance of plasmids.
Optimizing Synthetic DNA for Metabolic Engineering Applications. Howard Salis Penn State University
 Optimizing Synthetic DNA for Metabolic Engineering Applications Howard Salis Penn State University Synthetic Biology Specify a function Build a genetic system (a DNA molecule) Genetic Pseudocode call producequorumsignal(luxi
ET - Recombination. Introduction
 GENERAL & APPLIED GENETICS Geert Van Haute August 2003 ET - Recombination Introduction Homologous recombination is of importance to a variety of cellular processes, including the maintenance of genomic
GeNei TM Transformation Teaching Kit Manual
 Teaching Kit Manual Cat No. New Cat No. KT07 107385 KT07A 106220 Revision No.: 00060505 CONTENTS Page No. Objective 3 Principle 3 Kit Description 6 Materials Provided 7 Procedure 9 Observation & Interpretation
Design Principles in Synthetic Biology
 Design Principles in Synthetic Biology Chris Myers 1, Nathan Barker 2, Hiroyuki Kuwahara 3, Curtis Madsen 1, Nam Nguyen 1, Michael Samoilov 4, and Adam Arkin 4 1 University of Utah 2 Southern Utah University
GENETICS EXAM 3 FALL a) is a technique that allows you to separate nucleic acids (DNA or RNA) by size.
 is a technique that allows you to separate nucleic acids (DNA or RNA) by size.") Student Name: All questions are worth 5 pts. each. GENETICS EXAM 3 FALL 2004 1. a) is a technique that allows you to separate nucleic acids (DNA or RNA) by size. b) Name one of the materials (of the two
Student Name: All questions are worth 5 pts. each. GENETICS EXAM 3 FALL 2004 1. a) is a technique that allows you to separate nucleic acids (DNA or RNA) by size. b) Name one of the materials (of the two
BIOTECHNOLOGY. Sticky & blunt ends. Restriction endonucleases. Gene cloning an overview. DNA isolation & restriction
 BIOTECHNOLOGY RECOMBINANT DNA TECHNOLOGY Recombinant DNA technology involves sticking together bits of DNA from different sources. Made possible because DNA & the genetic code are universal. 2004 Biology
The Central Dogma. 1) A simplified model. 2) Played out across life. 3) Many points for control.
 A simplified model. 2) Played out across life. 3) Many points for control.") Molecular Biology The Central Dogma 1) A simplified model. 2) Played out across life. 3) Many dis@nct points for control. Molecular Biology DNA: four nucleo@de bases (GC,AT) (2 bits) gene@c code in 3 base
Molecular Biology The Central Dogma 1) A simplified model. 2) Played out across life. 3) Many dis@nct points for control. Molecular Biology DNA: four nucleo@de bases (GC,AT) (2 bits) gene@c code in 3 base
Yesterday s Picture UNIT 3B
 Warm-Up Plasmids are circular pieces of DNA which bacterial cells are able to take up from the environment, then replicate and transcribe. Eukaryotic cells, by contrast, contain large, linear (non-circular)
Molecular Biology Midterm Exam 2
 Molecular Biology Midterm Exam 2 1. The experiments by Frank Stahl and Matthew Messelson demonstrated that DNA strands separate during DNA replication. They showed that DNA replication is what kind of
CHAPTER 9 DNA Technologies
 CHAPTER 9 DNA Technologies Recombinant DNA Artificially created DNA that combines sequences that do not occur together in the nature Basis of much of the modern molecular biology Molecular cloning of genes
Molecular Biology Techniques Supporting IBBE
 Molecular Biology Techniques Supporting IBBE Jared Cartwright Protein Production Lab Head Contact Details: email jared.cartwright@york.ac.uk Phone 01904 328797 Presentation Aims Gene synthesis Cloning
Molecular Cell Biology - Problem Drill 11: Recombinant DNA
 Molecular Cell Biology - Problem Drill 11: Recombinant DNA Question No. 1 of 10 1. Which of the following statements about the sources of DNA used for molecular cloning is correct? Question #1 (A) cdna
March 15, Genetics_of_Viruses_and_Bacteria_p5.notebook. smallest viruses are smaller than ribosomes. A virulent phage (Lytic)
") Genetics_of_Viruses_and_Bacteria_p5.notebook smallest viruses are smaller than ribosomes Adenovirus Tobacco mosaic virus Bacteriophage Influenza virus envelope is derived from the host cell The capsids
Genetics_of_Viruses_and_Bacteria_p5.notebook smallest viruses are smaller than ribosomes Adenovirus Tobacco mosaic virus Bacteriophage Influenza virus envelope is derived from the host cell The capsids
Bacterial Genetics. Stijn van der Veen
 Bacterial Genetics Stijn van der Veen Differentiating bacterial species Morphology (shape) Composition (cell envelope and other structures) Metabolism & growth characteristics Genetics Differentiating
ONTARIO SCIENCE CENTRE. Teacher Guide. Way to Glow Program
 ONTARIO SCIENCE CENTRE Teacher Guide Way to Glow Program Table of Contents Bacterial transformation background information 3 Experimental procedure 5 Expected results 7 Post-program activity sheet 8 Post-program
BACTERIAL GENETICS. How does the DNA in the bacterial cell replicate
 BACTERIAL GENETICS Bacterial genetics is the study of gene structure and function in bacteria. Genetics itself is concerned with determining the number, location, and character of the genes of an organism.
Module Code: BIO00007C
 Examination Candidate Number: Desk Number: BSc and MSc Degree Examinations 2018-9 Department : BIOLOGY Title of Exam: Genetics Time Allowed: 1 Hour 30 Minutes Marking Scheme: Total marks available for
1. What is the structure and function of DNA? Describe in words or a drawing the structure of a DNA molecule. Be as detailed as possible.
 INTRODUCTION In the Program Introduction, you learned that the increase in diabetes in the United States has resulted in a great demand for its treatment, insulin. You also learned that the best way to
Lac Operon contains three structural genes and is controlled by the lac repressor: (1) LacY protein transports lactose into the cell.
 LacY protein transports lactose into the cell.") Regulation of gene expression a. Expression of most genes can be turned off and on, usually by controlling the initiation of transcription. b. Lactose degradation in E. coli (Negative Control) Lac Operon
Regulation of gene expression a. Expression of most genes can be turned off and on, usually by controlling the initiation of transcription. b. Lactose degradation in E. coli (Negative Control) Lac Operon
Genetics and Genomics in Medicine Chapter 3. Questions & Answers
 Genetics and Genomics in Medicine Chapter 3 Multiple Choice Questions Questions & Answers Question 3.1 Which of the following statements, if any, is false? a) Amplifying DNA means making many identical
Section B: The Genetics of Bacteria
 CHAPTER 18 MICROBIAL MODELS: THE GENETICS OF VIRUSES AND BACTERIA Section B: The Genetics of Bacteria 1. The short generation span of bacteria helps them adapt to changing environments 2. Genetic recombination
BIOLOGY 205 Midterm II - 19 February Each of the following statements are correct regarding Eukaryotic genes and genomes EXCEPT?
 BIOLOGY 205 Midterm II - 19 February 1999 Name Multiple choice questions 4 points each (Best 12 out of 13). 1. Each of the following statements are correct regarding Eukaryotic genes and genomes EXCEPT?
Chapter 15 Recombinant DNA and Genetic Engineering. Restriction Enzymes Function as Nature s Pinking Shears
 Chapter 15 Recombinant DNA and Genetic Engineering In this chapter you will learn How restriction enzyme work and why they are essential to DNA technology. About various procedures such as cloning and
Lecture Series 10 The Genetics of Viruses and Prokaryotes
 Lecture Series 10 The Genetics of Viruses and Prokaryotes The Genetics of Viruses and Prokaryotes A. Using Prokaryotes and Viruses for Genetic Experiments B. Viruses: Reproduction and Recombination C.
Haverford College Annual Progress Report: 2012 Formula Grant
 Haverford College Annual Progress Report: 2012 Formula Grant Reporting Period January 1, 2013 June 30, 2013 Formula Grant Overview Haverford College received $18,238 in formula funds for the grant award
Chapter 18. The Exciting World Of Bacterial Genetics
 Chapter 18. The Exciting World Of Bacterial Genetics Why study bacterial genetics? Its an easy place to start history we know more about it systems better understood simpler genome good model for control
Phosphorothioate-based BioBrick cloning (Potsdam) Standard
 Standard") BBF RFC 91: phosphorothioate-based BioBrick cloning 1 Document Version 1.0, October 26, 2012 Phosphorothioate-based BioBrick cloning (Potsdam) Standard igem Team Potsdam 2012 1, Tobias Baumann 1, Kristian
BBF RFC 91: phosphorothioate-based BioBrick cloning 1 Document Version 1.0, October 26, 2012 Phosphorothioate-based BioBrick cloning (Potsdam) Standard igem Team Potsdam 2012 1, Tobias Baumann 1, Kristian
DNA and Biotechnology Form of DNA Form of DNA Form of DNA Form of DNA Replication of DNA Replication of DNA
 21 DNA and Biotechnology DNA and Biotechnology OUTLINE: Replication of DNA Gene Expression Mutations Regulating Gene Activity Genetic Engineering Genomics DNA (deoxyribonucleic acid) Double-stranded molecule
B. Incorrect! Ligation is also a necessary step for cloning.
 Genetics - Problem Drill 15: The Techniques in Molecular Genetics No. 1 of 10 1. Which of the following is not part of the normal process of cloning recombinant DNA in bacteria? (A) Restriction endonuclease
Selected Techniques Part I
 1 Selected Techniques Part I Gel Electrophoresis Can be both qualitative and quantitative Qualitative About what size is the fragment? How many fragments are present? Is there in insert or not? Quantitative
Biology 201 (Genetics) Exam #3 120 points 20 November Read the question carefully before answering. Think before you write.
 Exam #3 120 points 20 November Read the question carefully before answering. Think before you write.") Name KEY Section Biology 201 (Genetics) Exam #3 120 points 20 November 2006 Read the question carefully before answering. Think before you write. You will have up to 50 minutes to take this exam. After
Name KEY Section Biology 201 (Genetics) Exam #3 120 points 20 November 2006 Read the question carefully before answering. Think before you write. You will have up to 50 minutes to take this exam. After
DNA REPLICATION & BIOTECHNOLOGY Biology Study Review
 DNA REPLICATION & BIOTECHNOLOGY Biology Study Review DNA DNA is found in, in the nucleus. It controls cellular activity by regulating the production of, which includes It is a very long molecule made up
Unit 6: Molecular Genetics & DNA Technology Guided Reading Questions (100 pts total)
") Name: AP Biology Biology, Campbell and Reece, 7th Edition Adapted from chapter reading guides originally created by Lynn Miriello Chapter 16 The Molecular Basis of Inheritance Unit 6: Molecular Genetics
Name: AP Biology Biology, Campbell and Reece, 7th Edition Adapted from chapter reading guides originally created by Lynn Miriello Chapter 16 The Molecular Basis of Inheritance Unit 6: Molecular Genetics
Gene Cloning and DNA Analysis: An introduction
 Gene Cloning and DNA Analysis: An introduction T. A. Brown. 6th edition 2010 Published by Blackwell Science Ltd & 140.128.147.174/yclclass/ =>2011 Part I The Basic Principles of Gene Cloning and DNA Analysis
4/3/2013. DNA Synthesis Replication of Bacterial DNA Replication of Bacterial DNA
 4/3/03 3 4 5 6 7 8 9 0 Chapter 8 Microbial Genetics Terminology Genetics: The study of what genes are, how they carry information, how information is expressed, and how genes are replicated Gene: A segment
Biotechnolog y and DNA Technology
 PowerPoint Lecture Presentations prepared by Bradley W. Christian, McLennan Community College C H A P T E R 9 Biotechnolog y and DNA Technology Introduction to Biotechnology Biotechnology: the use of microorganisms,
Lab 5/5a Transformation of E. coli with a Recombinant Plasmid
 Lab 5/5a Transformation of E. coli with a Recombinant Plasmid Lab 2 Pre Lab Readiness Familiarity and Proper use of micropipettes Remember the 1 st and 2 nd stops Aseptic Technique Antibiotic Resistance
HiPer Plasmid DNA Cloning Teaching Kit
 HiPer Plasmid DNA Cloning Teaching Kit Product Code: HTBM022 Number of experiments that can be performed: 5 Duration of Experiment: 4 days Day 1- Preparation of media and revival of E. coli Host Day2-
Exam 2 Key - Spring 2008 A#: Please see us if you have any questions!
 Page 1 of 5 Exam 2 Key - Spring 2008 A#: Please see us if you have any questions! 1. A mutation in which parts of two nonhomologous chromosomes change places is called a(n) A. translocation. B. transition.
462 BCH. Biotechnology & Genetic engineering. (Practical)
") 462 BCH Biotechnology & Genetic engineering (Practical) Nora Aljebrin Office: Building 5, 3 rd floor, 5T304 E.mail: naljebrin@ksu.edu.sa All lectures and lab sheets are available on my website: Fac.ksu.edu.sa\naljebrin
462 BCH Biotechnology & Genetic engineering (Practical) Nora Aljebrin Office: Building 5, 3 rd floor, 5T304 E.mail: naljebrin@ksu.edu.sa All lectures and lab sheets are available on my website: Fac.ksu.edu.sa\naljebrin
CHAPTERS 16 & 17: DNA Technology
 CHAPTERS 16 & 17: DNA Technology 1. What is the function of restriction enzymes in bacteria? 2. How do bacteria protect their DNA from the effects of the restriction enzymes? 3. How do biologists make
Chapter 10 Genetic Engineering: A Revolution in Molecular Biology
 Chapter 10 Genetic Engineering: A Revolution in Molecular Biology Genetic Engineering Direct, deliberate modification of an organism s genome bioengineering Biotechnology use of an organism s biochemical
Recombinant DNA recombinant DNA DNA cloning gene cloning
 DNA Technology Recombinant DNA In recombinant DNA, DNA from two different sources, often two species, are combined into the same DNA molecule. DNA cloning permits production of multiple copies of a specific