Executive Summary. > Plasterboard had the highest actual wastage rate with 32% of materials wasted.
|
|
|
- Ursula Johns
- 6 years ago
- Views:
Transcription

1 Wastage Rate Report
2 Executive Summary BRE (Building Research Establishment) has been sponsored by the Department for Environment Food and Rural Affairs (Defra) to evaluate actual wastage rates for a number of key building products widely used by the construction industry. A detailed study was undertaken to collect waste data relating to construction products selected from the Design for Manufacture Measurement Programme, otherwise known as the SmartLIFE project, managed by BRE. Three construction sites participating in this measurement programme tracked the volume of waste removed from site from the start to the end of the construction phase. The wastage rate of the key selected construction products was obtained by recording the amount of material incorporated into the development compared with the waste leaving the sites. The construction waste product data was compared to the Bills of Quantities information specified and quantity of materials delivered to the sites. This assessment produced actual wastage rates for the 14 key products selected. The difference between standard wastage rates used when procuring materials and the actual waste measured for the selected products on the SmartLIFE projects is provided in this report. The True Costs of Waste, taking into account not only the waste disposal costs paid for removing waste from the construction site but also, material and labour costs of waste production (excluding the carbon impacts of the waste product), is given. The following sites were investigated, and data collected: > Site A consist of 56 units including 35 steel framed houses and 21 brick and block houses > Site B consists of 15 insulated concrete formwork houses and 20 brick and block houses > Site C consist of 15 timber framed houses Site A > The volume of measured waste was nearly twice as much than the volume of waste estimated by using standard wastage rate figures for the nine construction products selected. > The true costs of waste of the measured waste was nearly twice as much as it was estimated by using standard wastage rates of the nine products. > By reducing the measured wastage rate of the selected products to the level that was predicted, i.e. standard wastage rates, Site A could have saved 27,518. > Plasterboard had the highest actual wastage rate with 32% of materials wasted. > The measured wastage rate of mineral wool insulation was 3.2% less than predicted using the standard wastage rate figure for this material. 3.2% savings means a reduction of 1,167 in the true cost of waste. Site B > The volume of measured waste was twice as much than the volume of waste estimated by using standard wastage rate figures for the 11 construction products selected. > The true costs of the measured waste was 2.3 times as much as it was estimated by using standard wastage rates of the 11 products. > By reducing the measured wastage rate of the selected products to the level that was predicted, i.e. standard wastage rates, Site B could have saved 35,455. > Render had the highest actual wastage rate with 51% of the materials wasted.
3 > The measured wastage rate of mineral wool insulation was 1.3% less than predicted using the standard wastage rate figure for this material. 1.3% savings means a reduction of 351 in the true cost of waste. Site C > The volume of measured waste was twice as much than the volume of waste estimated by using standard wastage rate figures for the11 construction products selected. > Recommendations are provided for the key products with guidance on how the wastage rate can be reduced by the different parties, from sourcing the materials to site delivery, and using the products during construction. > The true cost of measured waste from was 2.3 times as much as it was estimated by using standard wastage rates of the 11 products. > By reducing the measured wastage rate of the selected products to the level that was predicted, i.e. standard wastage rates, Site C could have saved 13,413.5 > Plasterboard had the highest actual wastage rate with 31% of the materials wasted. > The true cost of waste calculated for mineral wool insulation and polystyrene floor panels was less in the measured wastage rate than was estimated for both of these products by using standard wastage rates. This represents a saving of approximately 500 for these two products. Causes of waste > In order of magnitude, (greatest to smallest) the main causes of waste observed on the three site were as follows: 1. Methods of work offcuts 2. Over ordering 3. Unsuitable storage / materials exposed to weather conditions 4. Rework done due to unclear drawings / design specification

4 Contents Introduction 02 Methodology 04 Description of the Smart LIFE Projects 04 The construction waste measuring process 08 Bills of Quantities data 09 Measured waste 09 Costs 09 Findings 10 Site A 10 Difference between measured and predicted volume of waste 11 Value of the discarded materials 12 True cost of waste of construction products on Site A 13 Site B 14 Difference between measured and predicted volume of waste 16 Value of the discarded materials 16 True cost of waste of construction products on Site B 18 Site C 20 Difference between the predicted and measured volume of waste 21 Value of the discarded materials 22 True costs of waste of construction products Site C. 23 Construction products procurement and causes of waste 26 Material take back schemes operated on the sites. 27 Material segregation scheme 28 Un-segregated Materials 29 Conclusions 32 Recommendations 34 Wastage Rate Report Prepared for Name Construction Resources and Waste Platform Prepared by Name Szilvia Zakar Position Senior Consultant Approved on behalf of BRE Name Gilli Hobbs Position Director of Resource Efficiency BRE Garston WD25 9XX T + 44 (0) F + 44 (0) E enquiries@bre.co.uk This report is made on behalf of BRE. By receiving the report and acting on it, the client - or any third party relying on it - accepts that no individual is personally liable in contract, tort or breach of statutory duty (including negligence).

5
6 Page 02 Introduction The construction sector is hugely resource intensive, with an estimated 380 million tonnes of resources used each year (CRWP ), accounting for 9-10% of GDP (Defra ). In addition, the sector also produces the largest proportion of waste in England (one third) and 32% of hazardous waste (Defra ). Survey data exists for the amount of inert waste arising from construction, demolition and excavation (CD&E) activities, which was estimated at 90 million tonnes in England for 2005, with 30% going to landfill. In terms of construction projects, resource efficiency and waste can be attributed to, and therefore managed appropriately at each stage of the process (i.e. design, procurement, on-site, operation). Ideally waste should be managed according to the waste hierarchy: reduce, reuse, recycle, recover and finally dispose. To reduce the amount of construction waste produced by the building sector, architects and designers have an important primary role to play in designing developments that produce less waste during the construction process. After the design team, the quantity surveying and procurement team has a significant role to play in reducing the volume of materials ordered for building projects to closely match that which will be incorporated into the development. If resource efficiency is considered at these early stages of the construction process, by the time the construction of buildings and structures starts on-site, costs will have been reduced by removing waste that could be designed and procured out. Clients funding and commissioning developments have higher expectations in terms of sustainability and waste, which are being reflected by procurement practices and the specification of standards such as BREEAM (BRE Environmental Assessment Method) (BRE ) and the setting of waste targets. When materials are specified and procured for building projects it is often the case that wastage rates of the different materials are added onto the quantity of products needed to construct buildings and structures. These wastage rates have been defined through cost books such as Laxtons (Johnson 2005) and Spons (Langdon 2006); whereby a percentage allowance for waste for each material is built in for the purpose of costing products / materials in a construction project. These costing books are frequently used by the industry to price up projects using standard costs for materials and labour. The (Green Guide (GG) to Specifications) (BRE ) also uses the wastage rate figures derived from pricing books used by the industry. For example, hollow lightweight blocks have a 5% allowance for waste; which includes wastage from cut blocks, over ordering, breakages, theft etc. It is important to note that these waste allowances are assumptions which need verification in the field. They have, however, been consulted on with industry and, where available, verifiable industry data has been used. Other than the material pricing books and the GG that lists materials and components including their standard wastage rates, information listing actual or measured wastage rates of building materials and products is not readily available. This project aims to evaluate the difference in standard wastage rates of key construction products with measured wastage rates obtained for the selected key construction products, using information collected from the beginning to the end of the construction phase on three housing developments. BRE (Building Research Establishment) has been sponsored by the Department for Environment Food and Rural Affairs (Defra) to evaluate actual wastage rates for a number of key building products widely used by the construction industry. This project is part of the Construction Resources and Waste Platform s programme of work 6. A detailed study was undertaken to collect waste data derived from the construction products selected from 1 - CRWP 2008, Construction Resources and Waste Roadmap 2008, ( 2 - DEFRA 2007, Waste Strategy for England, London: DEFRA 2007, Consultation on Site Waste Management Plans for the Construction Industry. Online: London DEFRA; available form construction-sitewaste/index.htm.
7 Page 03 the Design for Manufacture Measurement Programme, otherwise known as the SmartLIFE project, managed by BRE. Three construction sites participating in this measurement programme tracked the volume of waste removed from site from the start to the end of the construction phase. The wastage rate of the key selected construction products was obtained by recording the amount of products delivered to the sites and incorporated in the development, compared with the waste leaving the sites. The construction waste product data was compared to the Bills of Quantities information specified and quantity of materials delivered to the sites. This assessment produced actual wastage rates for the key products selected that were ordered, delivered and used in the construction phase of the SmartLIFE project. The difference between standard wastage rates used when procuring materials and the actual waste measured for the selected products on the SmartLIFE projects is given. For the purpose of this study the following sites were investigated and data was collected from under the umbrella of the SmartLIFE project based in Cambridgeshire. > Site A consists of 56 units including 35 steel framed houses and 21 brick and block houses > Site B consists of 15 insulated concrete formwork houses and 20 brick and block houses > Site C consist of 15 timber framed houses This document represents the final report for the project covering the construction period of the Smart LIFE development from September 2006 to February This report presents the results and discusses the findings with recommendations where appropriate. The objectives of the project were as follows: 1. Select the top 14 most used construction products on the three sites, based on information collected via the Design for Manufacture project. 2. Establish the wastage rates for the top 14 construction products based on construction materials purchased for the development and the waste materials that were removed from each individual site. 3. Understand how each of the selected products is specified and ordered. 4. Investigate the main causes of waste occurring for the selected products. 5. Illustrate the environmental benefits or costs using the empirical wastage rates as opposed to using the default wastage rates assigned by the construction industry when purchasing products. 6. Estimate the cost associated with the material wastage rate and costs of removal of the selected products from the sites. 7. Provide recommendations for the key products on how the wastage rate can be reduced by the different parties from sourcing the materials to site delivery and installation. The findings of this project also feed into the True Cost of Waste calculator that has also been developed as part of the Construction Resources and Waste Platform s programme of work. The True Cost of Waste calculator is a web based tool that helps the construction sector calculate the total costs of the waste incurred on a given construction project / development. The true cost of waste takes into account, not only the waste disposal costs paid for removing waste from construction site, but also the carbon impacts, material and labour costs of waste production. By inputting the quantity of different materials required for a given project, the users of the True Cost of Waste calculator will be able to estimate material waste costs and embodied carbon related to those wasted materials. The standard wastage rates of key products and material are used as a default setting in the calculator. These can then be compared with actual/measured wastage rates data, such as those produced in this report. 4 - Building Research Establishment (BRE), 2007 BREEAM: BRE Environmental Assessment Method online]; available from Building Research Establishment (BRE), The Green Guide to Specification: An Environmental Profiling System for Building Materials and Components 3rd Edition, By Jane Anderson, David Shiers, Mike Sinclair Contributor Jane Anderson, Mike Sinclair, Published by Blackwell Publishing, The Construction Resources and Waste Platform is jointly delivered by BRE and AEA, led by an industry steering group. For more information go to
8 Page 04 Methodology Description of the Smart LIFE Projects This report is based on waste data collected on the SmartLIFE project. SmartLIFE is an innovative pilot project led by Cambridgeshire County Council which is dedicated to the delivery and promotion of Modern Methods of Construction (MMC) and sustainable growth. The main aims address the three challenges of housing delivery in growth, as experienced in the Cambridgeshire and Peterborough growth area: > Affordability > Sustainability/Energy Efficiency > Skills/Capacity Shortages in the Construction Industry insulated concrete formwork houses and 20 brick and block houses. The construction of these houses was monitored throughout the build process, including the daily measurement of the waste produced on the three sites. The project information for the three sites is listed in Tab 1, 2, and 3 below. Aim five of the SmartLIFE project, was to deliver a 106 unit affordable housing demonstration in association with the key stakeholders: English Partnerships, Warden Housing, Fenland District Council and BRE. The affordable housing demonstration constructed 106 units on three sites in the Fenland District of Cambridgeshire using standard house types. One consists of 56 units including 35 steel framed houses and 21 brick and block houses; one site consists of 15 timber framed houses and one site consists of 15 Table 1: Site A Client Project Manager Developer Steel Frame Manufacturer Main Contractor Architects Home Group and SmartLIFE BRE Home (Housing Association) Fusion Building Systems Inspace Regeneration Partnerships and New Homes Ltd Churchill Hui Architects Investor/funder English Partnerships, Housing Corporation, Fenland District Council, Cambridge County Council and Department for Communities and Local Government Timescale Start September Practical completion September 2007 Contract value 5,569,236 Output 56 homes (35 light gauge steel frame / 21 traditional) Site area 1.1 hectares Density 50 dwellings/hectare


9 Page 05 Site A consists of 21 traditionally built brick and block dwellings and 35 dwellings using steel frame construction. The off-site construction techniques of the Fusion Building System provide a structure to the house rapidly. The panels in the external leaf of the building are supplied to site encapsulated in fire retarded EPS (expanded polystyrene) insulation, eliminating the need to install insulation on-site.is alit laortisi. Riliquat laor sum Picture 1: Steel frame construction Picture 2: Conventional brick and block houses
 Inspace Regeneration Partnerships and New Homes Ltd Proctor Matthews English Partnerships, Housing Corporation, Fenland District Council, Cambridge County Council and")

10 Page 06 Client Project Manager Developer Insulated concrete formwork (ICF) Main Contractor Architects Investor/funder Home Group and SmartLIFE BRE Home (Housing Association) Polarwall Table 2: Site B (The Hereward Hall Development) Inspace Regeneration Partnerships and New Homes Ltd Proctor Matthews English Partnerships, Housing Corporation, Fenland District Council, Cambridge County Council and Department for Communities and Local Government Timescale Start February 2006 Practical completion 5,569,236 February 2008 Contract value 3,840,261 Output 15 (ICF) units and 20 traditional brick and blockwork cavity construction units Site area 0.73 ha Density 48 dwellings / ha The second SmartLIFE site involved the construction of 15 insulated concrete formwork (ICF) units and 20 traditional brick and blockwork cavity construction units. The ICF units were constructed using the Polarwall external wall system. Blocks of polystyrene are fitted together to form a cavity that is filled with concrete to form the structure of the house. The construction began in September 2006 and was completed in February Picture 3: Steel frame terraced houses Picture 4: Conventional brick and block houses


11 Page 07 Client Project Manager Developer Timber Frame Manufacturer Main Contractor Architects Investor/funder Home Group and SmartLIFE BRE Home (Housing Association) Pinewood Structures Inspace Regeneration Partnerships and New Homes Ltd Avebury Architects Timescale Start September 2006 Practical completion 5,569,236 September 2007 Contract value 1,901, Output 15 homes Site area 0.39 hectares Density 43.5 dwellings/hectare English Partnerships, Housing Corporation, Fenland District Council, Cambridge County Council and Department for Communities and Local Government Table 3: Site C (Beuford Drive Development) Site C site involved the construction of 15 timber framed houses using the Pinewood Structures Ltd timber frame system. The construction used open panel timber frames combined with floor cassettes and light gauge steel framed bathroom pods. The construction began in September 2006 and was completed in October Three different house types were used and a mix of sale, shared ownership and rented houses were constructed. Picture 5: Timber Frame Erection Picture 6: Finished House
12 Page 08 The construction waste measuring process A key component of the SmartLIFE project is monitoring the waste arising throughout the construction phase of the project. A site waste measurement study was carried out on all the SmartLIFE sites in collaboration with Inspace, the main contractor on the project. BRE recorded the construction activities undertaken on the three construction sites, waste produced, as well as measuring water, energy usage and distance travelled for operatives to understand the environmental impact. By observation at selected times, it is possible to build up a picture of all of the activities which occupy the time taken to complete the project and the associated waste produced, cost and environmental impact. Site observers employed by BRE and Inspace were based on site to collect and analyse the data. As a result, the causes of the waste produced during the construction process could be matched with the building products discarded on site. Most of the data was recorded electronically using a handheld computer. Once a day, the observer downloaded the data from the computer into a PC located in the site office, from which the analyst was able to make standard real time analyses of progress and performance. Understanding why delays and wasted effort occur was important in the measurement project. In order to establish these the site observer was in regular contact with the site manager and subcontractors to establish cause and possible action to improve performance. Data relating to the construction materials discarded either in the mixed waste or segregated skips were collected from the three sites. As the construction methods used on the three sites differed, the material waste discarded in the skips placed around the individual sites also reflected this difference. However information on those construction products that were most often used on the three sites were collated. The construction products selected for analysis from the three sites are presented in Table 4. Table 4: Construction products selected for analysis from the three SmartLIFE sites Materials Site C Site A Site B Mortar Render x Screed x x Bricks Concrete Tiles Concrete blocks Weather boarding x x Mineral wool Polystyrene (floor) Kingspan insulation panel x x Polar wall insulation x x Plaster x Plasterboard Chipboard floor x x 14 products in total Site specific number of products:
13 Page 09 For the purpose of this report, waste data for 14 construction products were selected for analysis. On any one construction site during the construction process, thousands of products made of different materials are used. The products in Table 4 were selected as these were the ones most commonly used during the different stages of the construction process. Bills of Quantities data It was necessary to obtain the Bills of Quantities data produced for the three construction sites under the SmartLIFE programme. Bills of Quantities comprise a list of items of work which are briefly described. The Bills also provide a measure of the extent of work and this allows it to be priced 7. In the case of construction projects, the Bills of Quantities list the type and quantity of materials needed to complete different trade work packages on the proposed site. The total quantities of each material selected for analysis were collated from the Bills of Quantities list for the three sites. Standard wastage rate figures, as listed in the Green Guide (GG) material and components specifying book, were applied to the relevant materials selected from the three sites. The volume of waste predicted to arise based on the standard wastage rates figures were calculated for the 14 selected products as used on the three sites. waste, provided an estimate of the total amount of product delivered to site. Costs The true cost of waste not only includes disposal costs of removing the waste from site but also the price paid to purchase that amount of wasted product and pay for site labourers to place the discarded materials into skips for removal from site. To highlight the true cost of waste, the cost of materials priced in the different work packages were calculated for each site. Actual material costs priced in the Bills of Quantities could not be obtained from the project team as this information was commercially sensitive. Therefore, material cost information listed for the relevant work packages along with an hourly general labourer cost was obtained form Laxton s Building Pricing Book ( ). Waste disposal costs to remove the materials from site were provided by the waste management contractor undertaking the waste removal from the three sites. Measured waste The quantities of wasted products on the three sites were measured using site observers to record the type, quantity and cause of waste at regular intervals during the site s working hours. The data was recorded using a hand held computer and at the end of the day the information was downloaded onto an office computer. This information enabled the site teams to construct a detailed knowledge of the waste generation from the beginning to the end of the construction process. Information relating to the actual material deliveries made to the sites could not be obtained for the purpose of this study. As a result, the amount of product incorporated into the development, combined with the measured Laxton s Building Price Book, 2007 (Laxton s Price Book) by V B Jhonson.
14 Page 10 Findings The following section outlines the project s findings based on waste monitoring data collected from the three observed sites. The actual waste quantities generated for the 14 construction products was compared with the wastage rates given by GG material specification book for the 14 products identified. The difference between the actual and standard wastage rate used by the industry is given, highlighting the total cost paid for purchasing, site handling and removing the discarded materials from the sites. Description of the Smart LIFE Projects Site A - Site A was the largest construction site out of the three sites studied for this project. Altogether 56 detached homes were built, out of which 35 were constructed using light gauge steel frame and 21 were traditional brick and block houses. Data on nine construction products were selected for analysis. The products identified in Table 5 were used the most widely on Site A. Materials Mortar Bricks Concrete Tiles Concrete blocks Mineral wool Polystyrene (floor) Polyurethane insulation panel Plaster Plasterboard Table 5: Construction products from Site A Site A Total number of products: 9 Table 6: Site A. Quantity of construction products specified and ordered detailing GG wastage rates and measured wastage rates. Construction Products Minimum Quantity specified (m3) Waste (m3) Minimum Quantity Delivery (m3) GG wastage rate (%) Measured wastage rate (%) Mortar % 14.8% Bricks % 10.6% Concrete roof tiles % 26.7% Concrete blocks % 7.3% Mineral wool 1, , % 2.1% Polystyrene (floor) % 4.3% Polyurethane insulation panel % 16.9% Plaster % 17.7% Plasterboard % 31.9%
15 Page 11 Table 6 outlines the quantity of materials specified in the Bills of Quantities for the nine products used during the construction of the 56 units on site. The figures in the minimum quantity delivery column relate to the quantity of materials delivered to the site. The waste quantities are the actual measurements of the waste products on site from the start to the end of the project. The percentage GG wastage rates are the standard wastage rates used by the Industry for those type of materials. The measured wastage rates percentage figures are based on the actual waste quantities measured on site. Out of the data collected on the nine construction products, plasterboard used for drylining the inner wall and ceiling areas had the highest measured wastage rate (32%). This was followed by concrete roof tiles, a product that was used as a roofing product for all the housing units. The third product with the highest wastage rate was plaster, which was used to cover all the internal wall surfaces. The wastage rate for mortar used to bind the bricks together to form the outer wall areas of the brick and block houses was the 4th highest. Difference between measured and predicted volume of waste Table 7 highlights the difference between the actual volume of waste measured on the Site A project compared to the predicted volume of waste figures used by the industry. Table 7: Measured v. predicted volume of waste recorded on Site A Construction Products Predicted GG waste volume (m3) Measured Waste Volume (m3) Mortar Bricks Concrete roof tiles Concrete blocks Mineral wool Polystyrene (floor) Insulation panel Plaster Plasterboard Total: This was followed by insulati on panels that were used to insulate the walls of the light weight steel frame units. The measured wastage rate of the bricks used to erect the outer and some of the inner wall areas of the brick and block traditional housing units was 5.6 % higher than the wastage rate figures used by the GG for brick and block work package. The actual wastage rate figures measured for concrete blocks used to construct the light weight steel units was 2.3 % higher than the wastage rate figure used by the Industry for brick and block work package. The measured wastage rate of the polystyrene insulation floor panels used in the sub-structure construction of the housing units was 5.7% lower than the standard wastage rate. The measured wastage rate of mineral wool insulation was 3.2 % lower than the standard GG wastage rate.
16 Page 12 The volume of waste figures given in the table above mirrors the findings of the predicted versus measured percentage wastage rate figures given in Table 6. Therefore the top three highest volume of waste measured on site was plasterboard (107.8 m3), followed by concrete roof tiles (13.3 m3) and plaster (22.7 m3). The volume of mortar measured in the waste stream was 35.5 m3 which places this product as the fourth highest volume of material followed by insulation panels (33.9 m3), that was recorded between the wastage rate figures used by the industry and the actual volume of material recorded on Site A. The measured wastage rate volumes of ceramic bricks and concrete blocks was (67.2 m3) and (67 m3) respectively. The measured volume of waste was lower by (34 m3) for mineral wool and (6.6 m3) for polystyrene insulation. Mineral wool and polystyrene insulation products had lower wastage volumes than those predicted by the standard wastage rate figures typically used. Value of the discarded materials To account for the true cost of waste, the value of the discarded materials was calculated for the selected products on Site A. Table 8 presents the findings on the value of materials between the predicted and actual wastage rate figures of the construction products. Table 8: Value of materials between the predicted and actual wastage rates of the products selected Construction Products Value of waste materials (GG rates) ( ) Value of waste materials measured (GG rates) ( ) Mortar 1, ,781.0 Bricks 5, ,080.0 Concrete roof tiles 2, ,039.3 Concrete blocks 3, ,465.2 Mineral wool 1, Polystyrene (floor) 1, Polyurethane 2, ,186.3 insulation panel Plaster 2, ,329.3 Plasterboard 1, ,018.7 Total: 22, ,110.7 The difference between the value of wasted materials, estimated using standard wastage rates, and value of waste materials estimated using the measured wastage rate, was nearly four times higher for plasterboard. This was followed by mortar which was 2.2 times higher. Both the concrete roof tiles and ceramic brick products cost 2.1 times more. The value of insulation panels and concrete blocks in the measured wastage rate was approximately 1.5 times more. Costs paid for the actual quantity of plaster measured in the waste stream was 1.2 higher than it is estimated using the GG predicted wastage rate given for this product.
17 Page 13 The material costs of polystyrene floor panels was 50% less and for mineral wool insulation 25% less than would be assumed when using standard wastage rates for these two products. True cost of waste of construction products on Site A To calculate the true cost of waste paid for the nine products analysed on Site A, the costs of the wasted product, waste disposal costs and labour costs paid for filling up a skip with the wasted product was added together. Table 9 present the finding of the true costs of waste calculated for Site A. Table 9: True cost of waste and the difference between GG and measured wastage rate of nine products analysed from Site A Construction products True cost of waste GG waste = total cost ( ) True cost of waste measured waste = total cost ( ) Difference between GG and measured waste True cost of waste = total cost ( ) Mortar 2, , ,856.6 Bricks 7, , ,857.2 Concrete roof tiles 2, , ,418.6 Concrete blocks 6, , ,836.2 Mineral wool 5, , ,641.4 Polystyrene (floor) 2, , ,396.7 Insulation panel 3, , ,143.2 Plaster 3, , ,759.6 Plasterboard 2, , ,684.6 Total: 36, , ,517.9 The true cost of waste was calculated using the following data as a basis: > Quantity of materials specified in the Bills of Quantities information for the different work packages (m 3 ) > Cost information was obtained from pricing books used by the construction Industry to calculate prices of materials used in the different work packages various 9 > Cost of waste removal for mixed waste in 8 cu yard builders skips 10 : 160 ex VAT 3 > Labour cost paid for filling skips: 30 / m 3 11 The total cost paid for removing the measured waste from Site A was nearly twice as much as would have been paid if the levels had matched the standard wastage rates typically used by industry. The true cost of waste for polystyrene floor panes and mineral wool insulation was less in the measured wastage rate than it was estimated for the GG wastage rate. This represents a saving of approximately 5,000 for these two products. The true cost of waste of GG wastage rate compared to that of the measured wastage rates of nine products from Site A is highlighted in Figure Laxton s Architect and builder s price book; 2008 price for 9 materials specified in the Bills of Quantities for Site A; 10 materials specified in the Bills of Quantities for Site B and 11 materials specified in the Bills of Quantities for Site C Personal communication with Site A team Laxton s Architect and builder s price book; 2008 cost of using general site labour.
18 Page 14 Figure 1: True cost of waste of GG wastage rate compared to the measured wastage rates of the 9 products selected from Site A GG wastage rate Measured wastage rate 18,000 16,000 True cost of waste 14,000 12,000 10,000 8,000 6,000 4,000 2,000 0 Mortar Ceramic Bricks Concrete Roof Tiles Concrete Blocks Mineral Wool Polystyrene (floor) Insulation Panel Plaster Plasterboard Of the nine products, the highest true cost of waste related to the bricks. This was followed by plasterboard, due to the sheer volume generated on site. Both inert and plasterboard materials were segregated on site throughout the construction phase of the project. The cost paid for removing concrete blocks and roof tiles were third and fourth highest for Site A. Since concrete blocks and roof tiles fall under the inert material category, these products were also segregated and sent for recycling form this site. Site B Site B was the second largest construction site out of the three sites studied for this project. Altogether, 35 homes were built out of which 20 were constructed using traditional brick and block construction and 15 were Polarwall insulated concrete houses using the insulation panels as formwork. Blocks of polystyrene are fitted together to form a cavity that is filled with wet concrete to form the structure of the house. Mortar and insulation panels were the fifth and sixth most expensive when considering the total costs. The take back schemes and the procurement methods used for the selected products will be discussed in section 4 of this report.
 Polar wall insulation Plaster Plasterboard Chipboard floor Site B Total number of products: 11 Data on eleven construction products were selected for analysis.")
19 Page 15 Picture 7: Erecting the insulating formwork Table 10: Construction products from Site B Materials Mortar Render Ceramic bricks Concrete roof tiles Concrete blocks Mineral wool Polystyrene (floor) Polar wall insulation Plaster Plasterboard Chipboard floor Site B Total number of products: 11 Data on eleven construction products were selected for analysis. The products identified below were used most widely on Site B. Table 11 below outlines the quantity of materials specified in the Bills of Quantities for the 11 products that were used to construct 35 housing units on Site B. Construction Products Minimum Quantity specified (m3) Waste (m3) Table 11: Site B. Quantity of construction products specified and ordered detailing GG wastage and measured wastage rates Minimum Quantity Delivery (m3) GG wastage rate (%) Measured wastage rate (%) Mortar % 10.0% Render % 51.0% Bricks % 24.0% Roof tiles % 12.0% Concrete blocks % 7.0% Mineral wool % 4.0% Polystyrene (floor) % 17.0% Polar wall insulation % 13.0% Plaster % 8.0% Plasterboard % 48.0% Chipboard floor % 24.0%
20 Page 16 The figures in the minimum quantity delivery column relate to the quantity of materials specified and delivered to the site. The waste volume in the second column relates to the actual measurements of the waste products generated on site from the start to the end of the project. The minimum quantity ordered column outlines the approximate quantity of materials delivered to site. The percentages of the GG wastage rates are the standard wastage rates provided by industry pricing books. The measured wastage rates percentage figures are based on the actual waste quantities measured on site. Out of the data collected on the 11 construction products, render used to cover the outside wall areas of the housing units had the highest wastage rate measured (51%). The second highest wastage rate measured was for plasterboard used for drylining the inner wall areas of all the housing units (48%). The product with the third highest wastage rate was ceramic bricks (24%), followed by chipboard flooring that also measured a rate of 24% wastage. The actual wastage rate of polystyrene floor panels was 17% as opposed to the 10% that was predicted by material pricing books. Mineral wool was the only material on the Site B project that had 1.3% lower measured wastage rate than the standard wastage rate figure. Table 12: Measured v. predicted volume of waste recorded on Site B Construction Products GG waste volume (m 3 ) Measured waste volume (m 3 ) Mortar Render Bricks Roof tiles Concrete blocks Mineral wool Polystyrene (floor) Polarwall insulation Plaster Plasterboard Chipboard floor Total: Difference between measured and predicted volume of waste Table 12 highlights the difference between the actual volume of waste measured on the Site B project compared to the predicted volume of waste figures. The total volume of the measured waste was twice as much as the total volume of waste predicted by using the pricing books.
21 Page 17 Value of the discarded materials To account for the true cost of waste, the value of the discarded materials was calculated for the selected products identified on the Site B Project. Table 13 presents the findings on the value of materials calculated for the predicted and actual wastage rate figures for the 11 construction products selected. The total value of waste materials costed for the measured waste was 2.3 times higher when compared to that predicted using the GG standard rates. Looking at the individual products the difference between the value of waste materials present in the GG wastage rate figure and value of materials calculated for the measured wastage rate was ten times higher for render, for example. This was followed by plasterboard which was slightly below ten times the price paid for the value of the measured waste product compared to the predicted waste product. The measured volume of ceramic bricks cost approximately five times more than it was assumed in the predicted wastage rate figure. This was followed by the chipboard that cost three times more than the value of materials in the predicted wastage rate. The material costs of the concrete roof tiles were 2.4 more than it was costed for the wastage rate used by the Industry for that product. The cost paid for the actual quantity of polystyrene floor panels, mortar and plaster measured in the waste stream was nearly twice as high as it was estimated for the waste figures used by the industry. Table 13: Value of materials between the predicted and actual wastage rates of the products selected Construction Products Value of waste materials (GG rates) ( ) Value of waste materials measured (GG rates) ( ) Mortar ,216.8 Render Bricks 2, ,199.3 Concrete roof tiles 3, ,333.0 Concrete blocks 3, ,666.0 Mineral wool Polystyrene (floor) Polar wall insulation 3, ,563.0 Plaster 1, ,589.4 Plasterboard ,022.7 Chipboard floor ,208.6 Total: 16, ,301.3 Costs paid for the actual quantity of concrete blocks measured in the waste stream were 1.4 times higher and for polar wall insulation were 1.3 times higher. Mineral wool was the only material on the Site B project that had 80% lower material costs for the measured waste wastage when compared with the predicted value used by the industry for this product.
22 Page 18 True cost of waste of construction products on Site B To calculate the true cost of waste paid for the 11 products analysed on Site B, the cost of waste product, waste disposal costs and labour costs paid for filling up a skip with the wasted product was added together. Table 14 presents the finding of the true cost of waste calculated for the Site B Project. Table 14: True cost of waste and the difference between GG and measured wastage rate of nine products analysed from Site A Construction Products True cost of waste GG waste = total cost ( ) True cost of waste Measured waste = total cost ( ) Difference between GG and measured waste True cost of waste = total cost ( ) Mortar 1, , Render , ,045.1 Bricks 2, , ,891.5 Roof tiles 3, , ,889.2 Concrete blocks 6, , ,347.7 Mineral wool 2, , Polystyrene (floor) , Polar wall insulation 4, , ,668.6 Plaster 1, , ,243.6 Plasterboard , ,868.7 Chipboard floor , ,283.2 Total: 25, , ,455.0 The true cost of waste was calculated using the same variables as on the Site A site (see cost figures on page 20). The total cost paid for removing the measured waste from Site B was nearly 2.5 times as much as that estimated when using standard waste rate figures, i.e. 35K more. The true cost of waste for mineral wool insulation was less in the measured wastage rate than was estimated for the GG wastage rate. This represents a saving of approximately 350 for this product. The true cost of waste of GG wastage rate compared to that of the measured wastage rates of 11 products from Site B is highlighted in Figure 2.
23 Page 19 Figure 2: True cost of waste of GG wastage rate compared to the measured wastage rates of the 11 products from Site B GG wastage rate Measured wastage rate 16,000 14,000 True cost of waste 12,000 10,000 8,000 6,000 4,000 2,000 0 Mortar Render Bricks Concrete Roof Tiles Concrete Blocks Mineral Wool Polystyrene (floor) Insulation Panel Plaster Plasterboard Chipboard Floor Out of the 11 products, the true cost of waste of purchasing and removing the wasted products as mixed waste from the site was highest for bricks, followed by plasterboard. Plasterboard was segregated, although this site did not participate in inert material segregation. The cost paid for removing concrete blocks and roof tiles were third and fourth highest for these two products out of the 11 products selected. Polarwall insulation was the fifth highest costing when considering the total costs. The polar wall offcuts were segregated on site and taken back to the supplier s manufacturing plant for recycling. The take back schemes and the procurement methods used for the selected products will be discussed in section 4 of this report.
24 Page 20 Site C Site C was the smallest construction site out of the three sites studied for this project. Altogether 15 houses were built using timber frame construction. Data on 11 construction products were selected for analysis. The products identified in Table 15 were used the most often during the construction of Site C. Table 16 outlines the quantity of materials specified in the Bills of Quantities for the 11 products that were used in constructing the 35 units on Site C. Construction Products Mortar Render screed Bricks Concrete tiles Concrete blocks Mineral wool Polystyrene (floor) Plaster Plasterboard Weather boarding Table 15: Construction products from Site C Site C Total number of products: 11 Materials Minimum Quantity specified (m3) Waste (m3) Table 16: Site C. Quantity of construction products specified and ordered detailing wastage rates used by GG and measured wastage rates. Minimum Quantity Ordered GG % Measured % Mortar % 8.6% Render % 24.0% Screed % 6.4% Bricks % 15.1% Concrete tiles % 12.5% Concrete blocks % 5.7% Mineral wool % 4.0% Polystyrene (floor) % 9.0% Plaster % 21.1% Plasterboard % 31.3% Weather boarding % 22.3%
25 Page 21 The figures in the minimum quantity ordered column relate to the quantity of materials specified and delivered to the site. The waste volume in the second column relates to the actual measurements of the waste products generated on site from the start to the end of the project. The minimum quantity ordered column outlines the approximate quantity of materials delivered to site. The percentages of the GG wastage rates are the standard wastage rates used in industry pricing books. The measured wastage rates percentage figures are based on the actual waste quantities measured on site. Out of the data collected on the 11 construction products, plasterboard used for drylining the internal wall and ceiling areas of the housing units had the highest wastage rate measured (31.3%). The second highest wastage rate measured was for render used to cover the outside wall areas of the houses (24%), followed by weather boarding as the third highest measured wastage rate with 22.3%. This cement based product was used as cladding covering some parts of the outside wall areas. The measured wastage rate of plaster used on the inner wall surfaces of the houses was 21% as opposed to the 5% that is predicted by the material pricing books. The measured wastage rates of brick was 15%, followed by 12% wastage rate of concrete roof tiles used as roofing material on all the houses. The measured wastage rate for mortar was 8.6%. a reduction of 1% in the wastage rate measured for this product. Mineral wool also had a lower measured wastage rate than the GG wastage rate. Difference between the predicted and measured volume of waste Table 17 highlights the difference between the actual volume of waste measured on the Site C project compared to the predicted volume of waste figures. Table 17: Measured v. predicted volume of waste recoded on Site C Products GG waste volume (m3) Measured waste Volume (m3) Mortar Render Screed Ceramic bricks Concrete roof tiles Concrete blocks Mineral wool Polystyrene (floor) Plaster Plasterboard Weather boarding Total: This product was used to bind the bricks together to construct the brick outer skin of the timber frame houses. Screed made out of mortar and cement was used to cover the ground floors of the housing units had 6.4% measured wastage rate. The measured wastage rate of the concrete blocks was 5.7% a figure which was very close to the predicted figure used listed in the GG. The actual wastage rate of polystyrene floor panels was 9% as opposed to the 10% predicted. This is
26 Page 22 The total volume of the measured waste is twice as much as the total combined volume of waste predicted by the pricing books for the selected products used at Site C. The top three highest volume wastes on the Site C project were plasterboard (38 m3), bricks (30 m3) and concrete blocks (13.7 m3). The measured wastage rate volume for mineral wool was lower than that estimated using the standard wastage rate figure. The volume of mortar measured 6.2 m3, this figure was 1.3 times more than anticipated by the predicted wastage rate. The measured volume of plaster was four times higher and screed 1.3 times higher than anticipated. The volume of measured concrete roof tiles was 2.5 times more than anticipated. Although the measured waste volumes of render and weather boarding were relatively low, they were still nearly five times more than would be predicted when using standard wastage rate figures from the GG or pricing books. Value of the discarded materials To account for the true cost of waste, the value of the discarded materials was calculated for the selected products identified on the Site C Project. Table 18 presents the findings on the value of materials calculated for the predicted and actual wastage rate figures of the 11 construction products selected. Table 18: Value of materials between the predicted and actual wastage rates of the products selected. Construction Products Value of waste materials in BQ (GG rates) ( ) Value of waste materials measured (GG rates) ( ) Mortar Render Screed Bricks ,096.7 Concrete tiles ,922.7 Concrete blocks Mineral wool Polystyrene (floor) Plaster ,997.0 Plasterboard ,568.1 Weather boarding Total: 6, ,069.6 The total value of measured waste materials was 2.5 times higher than it is for the GG material wastage rate predicted. The difference between the predicted value of waste materials and the measured value of wasted materials was six times higher for plasterboard. Bricks were twice as much and wasted plaster materials were four times as much. The material was paid for concrete roof tiles were also twice as much than estimated when using the GG wastage rate.
27 Page 23 True costs of waste of construction products Site C To calculate the true cost of the 11 wasted products analysed on the Site C, the cost of the wasted product, waste disposal costs and labour costs paid for filling up a skip with the wasted materials were added together. Table 19 presents the finding of the true costs of waste calculated for the Site C Project. Table 19: True cost of waste and the difference between GG and measured wastage rate of 11 products analysed from Site C Construction Products True cost of waste GG Waste = total cost ( ) True cost of waste Measured Waste = total cost ( ) Difference between GG and measured waste True cost of waste = total cost ( ) Mortar Render Screed Bricks 2, , ,233.1 Concrete tiles , ,225.8 Concrete blocks , Mineral wool 1, , Polystyrene (floor) 1, , Plaster , ,496.9 Plasterboard , ,193.0 Weather boarding Total: 10, , ,413.5 The true cost of waste was calculated using the same variables as on the Site A site (see cost figures on page 20). The true cost of measured waste is 2.3 times as much as it is estimated for the standard wastage rates of the 11 products. The true cost of waste for mineral wool insulation and polystyrene floor panels was less in the measured wastage rate than that estimated using the GG wastage rate. This represents a saving of approximately 500 for these two products.the true cost of waste of GG wastage rate compared to that of the measured wastage rates of the 11 products from Site C is highlighted in Figure 3.
28 Page 24 Figure 3: True cost of waste of GG wastage rate compared to the measured wastage rates of the 11 products from Site C GG wastage rate Measured wastage rate 8,000 7,000 True cost of waste 6,000 5,000 4,000 3,000 2,000 1,000 0 Mortar Render Screed Bricks Concrete Tiles Concrete Blocks Mineral Wool Polystyrene (floor) Plaster Plasterboard Weather boarding Out of the 11 products the true cost of the wasted products either as mixed waste or segregated inert waste from the site was the highest for bricks on this site; this was followed by plasterboard. All the plasterboard waste that was produced on site was taken back to the plasterboard manufacturer for recycling. The cost paid for plaster waste was the third highest on this site, followed by concrete roof tiles (removed as mixed waste). The true cost of waste for mineral wool and polystyrene floor panels was slightly higher when using the GG wastage rate figures. The take back schemes and the procurement methods used for the selected products are discussed in section 4 of this report.
29
30 Page 26 Construction products procurement and causes of waste This section of the report outlines the material take back schemes set up on the project. The main causes of waste are also listed. Procurement methods are critical for both clients and project participants, and are becoming an important and contemporary issue within the building industry. The problem, nevertheless, lies in the fact that there are limited datasets relating to actual or measured wastage rates. The construction industry and working methods allow the design activity to be removed to large extent from the actual construction. This is compounded by different methods of procurements. When Bill of Quantities are used for procuring the materials, the main contractor has stipulated the quantity of materials needed at tender stage. If on site, the contractor proves that the quantities were insufficient he is entitled to a re-measurement in order to increase the level of quantity and hence money due to him. This can lead to excess material being brought to site. The quantity of materials procured for the construction of the SmartLIFE project was based on the Bills of Quantities. Materials bought for the SmartLIFE sites were either purchased by the sub-contractors tendering for the job, or the main contractor who is managing the overall construction work. Table 20 summarises the 14 construction products purchased for the three sites in terms of whether they were procured and ordered by the main contractor or the sub-contractors 52% of the 14 products by volume were procured and ordered by the sub-contractors and 48% of the products were procured and ordered by the main contractor. Main contractor purchase of materials is considered to have negative aspects for waste management. This is because the sub-contractor is free issued the material and in effect only supplies the labour to install it. As the sub-contractor doesn t own the material there can be a tendency to not care as much about the amount that is wasted. It can be better in a waste management perspective for the sub-contractors to purchase the materials because they then own and have an interest in reducing the quantity of materials wasted, therefore reducing costs for purchasing materials. Construction products anlaysed Materials procured and ordered by: Main Contractor Mortar Y Render Materials procured and ordered by: Sub-contractors Screed Y Ceramic bricks Y Concrete roof tiles Y Concrete blocks Y Weather boarding Y Mineral wool Y Y Polystyrene (floor) PU kingspan insulation panel Y Polar wall insulation Y Plaster Y Plasterboard Table 20: Materials procured and ordered by main contractor or sub-contractors Chipboard floor Y Y Y Y Y
31 Page 27 Material take back schemes operated on the sites Plasterboard: This product had the highest measured wastage on all the sites (48%; 32% and 31%) although initially it was anticipated that there would only be 5% plasterboard. All the sub-contractors operated a plasterboard take back scheme with the product s manufacturer. Although the material was directly purchased by the sub-contractors, the main contractor requested that the dry lining subcontractors fully participate in the take back scheme. However, this material take back scheme was not free. The plasterboard offcuts were segregated into 1 m3 bags supplied by the manufacturer which were then collected periodically from the sites and transported back to the plasterboard manufacturing plant for recycling. Each bag costs 25 which had to be paid by the subcontractor. The measured total volume of this product was 269 m3 for the three sites. The plasterboard was well compacted in the bags therefore, assuming no void space, the overall cost to the sub-contractors for the takeback scheme was at least 7,400 for the three sites. Engaging the drylining contractors in this take back scheme meant that the projects do not have to pay for the waste disposal costs for this product. The true cost of waste for plasterboard would have been 13,836.5 for the three sites. This is an overall saving for the project and it was prudent for the main contractor and project team to specify plasterboard take back on all three projects during the early project stages. The high measured wastage rate of plasterboard suggests that the drylining contractors did not actively minimise the volume of plasterboard waste generated on the sites. This may be attributed to the fact that the sub-contactors themselves sub-contracted the work out to different teams who were paid on the size of the wall areas that they cover on a daily basis and therefore there was no incentive to reduce waste or no time to try to incorporate appropriate plasterboard offcuts. Causes of waste: Offcuts were the major cause of plasterboard waste. This is due to the requirement to cut the plasterboard to fit the dimensions of the interior walls and ceilings, as well as, the ease with which the board can be damaged by water ingress, during transportation and storage and whilst handling on site. Polar wall insulation: This product is also known as Insulated Concrete Formwok (ICF). It was only used on Site B with a measured wastage rate of 13%. This material is made with 100% recycled PVC, a byproduct from the window manufacturing process. A take back scheme with the manufacturer was set up before construction work started on the site. The sub-contractors carrying out the structural work on the concrete frame houses were obliged to segregate the offcuts from the general waste and it was removed by the supplier for recycling. The cost of recycling was built into the price of the product, therefore the site did not pay directly for the removal of this material. An area was cordoned off on the site where the offcuts were stored. The measured total volume of this product was 24 m3. This volume would have fitted into approximately 6 x 6.13 m3 skip costing 160 / skip to remove as mixed waste. Therefore the waste disposal cost saved by setting up the material take back scheme for this material on Site B was The true cost of waste for polarwall insulation would have been 1,637. This is an overall saving for the project and it was prudent for the main contractor and project team to specify take back of this material on Site B. Causes of waste: The causes of waste of this material can be attributed to methods of work with offcuts produced during the formwork construction and from the plumbing and electrical insulation.
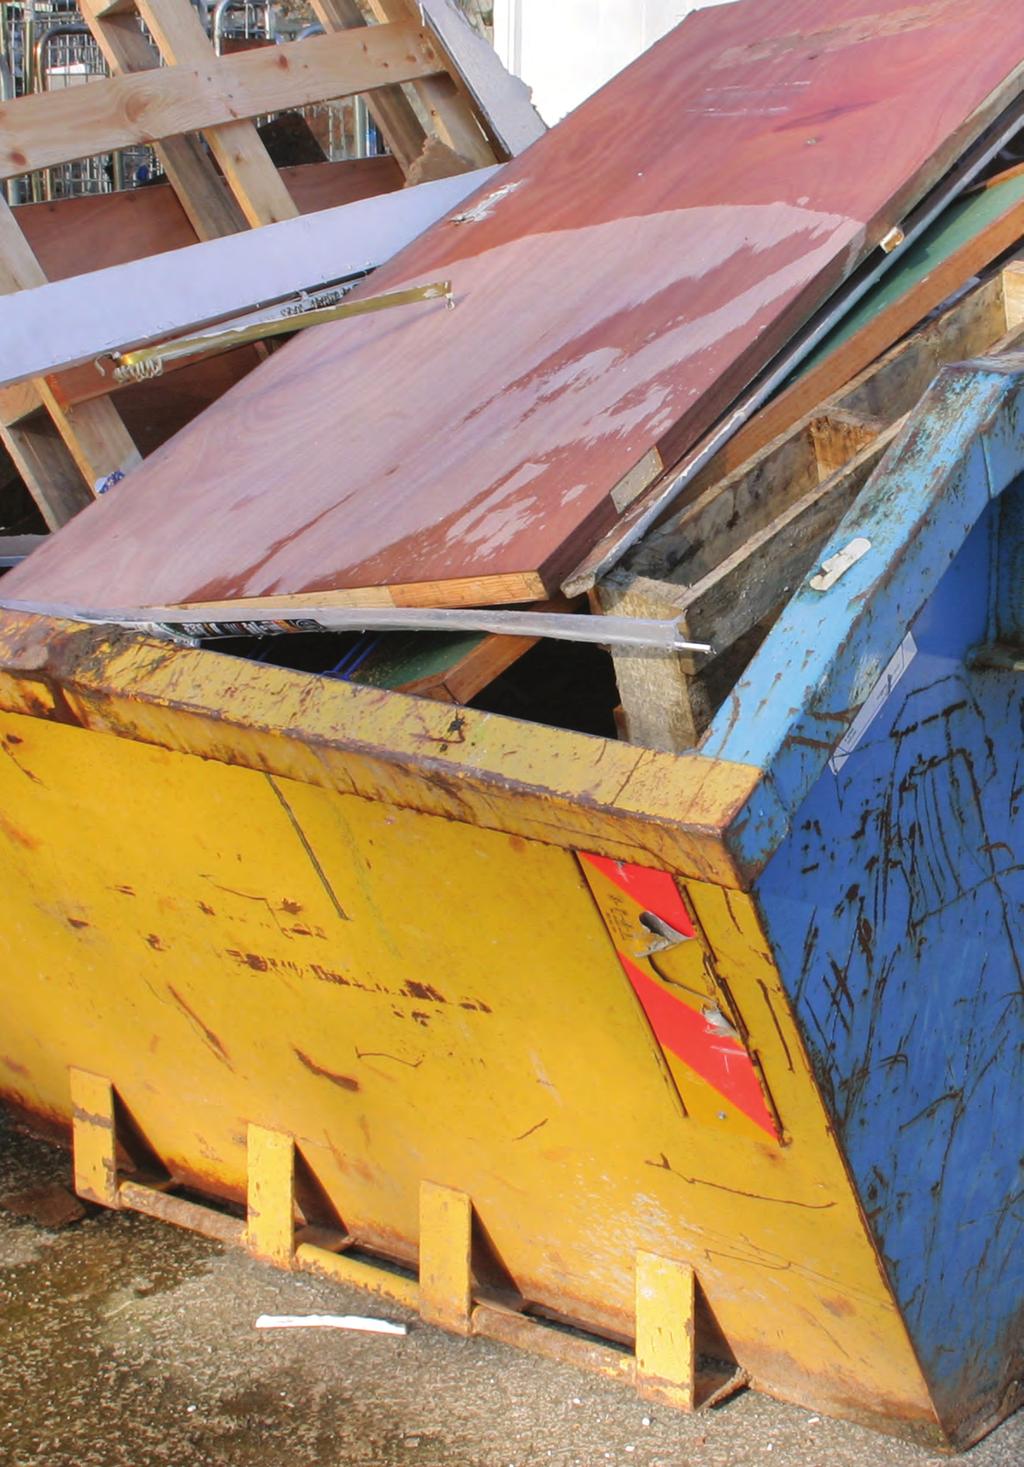
32 Page 28 Material segregation scheme As well as the material take back schemes, the segregation of inert and timber waste was implemented. Inert waste was segregated on Site B only and included products such as bricks, concrete blocks, concrete tiles, mortar and render. Site A and C segregated both inert and timber waste with untreated timber waste such as softwood, timber pallets and packaging was segregated. Concrete roof tiles: The measured wastage rate of this product varied from 12 to 26.7%.. All the concrete roof tile offcuts were segregated on Site B. Altogether 13.3 m3 of this material was re-directed from the general waste stream. The financial savings made on disposal costs by having a reduced price for a segregated 6.13 m3 builders skip, which was VAT instead of VAT. Segregating the concrete roof tiles for recycling equates to a saving of approximately for this site. Causes of waste: Offcuts were the main cause of waste. Site A had a large quantity of surplus material due to over ordering. Concrete blocks This material was used on all three sites and was purchased by the main contractor. The measured wastage rate of this product was (7.3%, 7%, 5.3%). The predicted wastage rate of this product was 5%. The volume of concrete blocks segregated on Site B was 69 m3. Inert material was only segregated on Site B. The financial saving made on disposal costs by using a segregated 6.13 m3 builders skip were approximately 1,700. Causes of waste: Offcuts of concrete blocks were the largest cause of waste. Ceramic bricks Bricks were used on all three sites. Both the main and structural contractors purchased bricks. The measured wastage rate of this product was (10.6%, 24% 15%) compared to the 5% predicted wastage rate. Site B which had the highest wastage rate for bricks participated, segregated the bricks and 66 m3 was diverted from the mixed waste stream. The financial saving by using a segregated 6.13 m3 builders skip was 1,600 for Site B. Causes of waste: The main cause of brick waste can be attributed to offcuts, followed by remedial work to the brickwork Remedial work was undertaken on some of the houses as a result of erecting the brick walls in the wrong position due to detailed design drawings not being issued to the site. This resulted in taking down the walls and rebuilding them using new materials. Render: Render was used on Site B and C and was purchased by the subcontractor. The measured wastage rate of render was (51%, 24%) compared to the predicted wastage rate of 6.7%.11 m3 of render was segregated on Site B which equated to a financial saving of 418. Causes of waste: The wet render was delivered to site in plastic tubs. If render is not used on the same day as it is delivered it will dry out and is not useable. Another cause of waste was surplus of materials delivered to site. Mortar: Mortar was used on all three sites. The measured wastage rate of mortar was (15%, 10%, 8.6%) compared to a predicted wastage rate of 5%. This material was purchased by the main contractor. Site B segregated 15 m3 of mortar which equated to financial savings of approximately 573. Causes of waste: The wet mortar was delivered to site in plastic tubs. If mortar is not used on the same day as it is delivered it will dry out and is not useable. Another cause of waste was surplus of materials delivered to site.
33 Page 29 Un-segregated Materials All the materials listed below were sent away from site as mixed construction waste. This mixed waste was taken to a material recovery facility and the recyable materials were separated, sorted and sent for recycling. Mineral wool: Mineral wool insulation was used on all three sites. Both the main and the structural sub-contractors purchased mineral wool products. The measured wastage rate of this product was (2.1%, 4%, 4%) as opposed to the predicted wastage rate of 5.3%. On all the three sites the measured mineral wool waste was less than predicted. This means that the project saved money on the true cost of waste of mineral wool. Savings achieved on the three sites are as follows: Site A: 3.2% savings means a reduction of 1,167 in the true cost of waste. Site B: 1.3% savings means a reduction of 351 in the true cost of waste. Site C: 1.3% savings a reduction of 364 in the true cost of waste. Causes of waste: Only small pieces of offcuts were discarded. The larger pieces of offcuts were used as noggins and were tucked into wall and ceiling areas behind the plasterboard panels. Using the offcuts not only reduces the mineral wool waste but also provided better insulation properties for the houses. Polystyrene floor panels: Polystyrene floor panels were used under the ground floor areas of all the houses on the three sites. The sub-contractor purchased this material. The measured wastage rate of this product was (4.3%, 17%, 9%) as opposed to the predicted wastage rate of 10%. On Sites A and C the measured polystyrene floor panel waste was slightly less than predicted. This means that the project saved money on the true cost of waste of polystyrene floor panels. Savings achieved on the two sites are as follows: Site A: Site C: 5.7% saving means a reduction of 1397 in the true cost of waste. 1% saving means a reduction of 136 in the true cost of waste Causes of waste: Material was damaged due to inadequate site storage and stormy weather conditions that Site B experienced. Some of the waste was produced as a result of offcuts. Polyurethane insulation panels: This product was used on Site A as an insulation and sound proofing material. The sub-contractor purchased this material. The measured wastage rate of this product was (16.9%) as opposed to the predicted wastage rate of 10%. Causes of waste: The cause of waste recorded for this product was methods of work which resulted in offcuts. Weather boarding: This material was used for outside cladding on Site C only. The main contractor purchased this product. The measured wastage rate of this product was (22.3%) as opposed to the 5% predicted wastage rate. Causes of waste: Weather boarding that is made of cement based material was discarded as a result of offcuts and also as a result of rework done as some of the panels were fitted onto the wrong side of the building and therefore had to be removed. Plaster: This product was used on all three sites for plastering the inner wall and ceiling areas which were covered by plasterboard. The dry lining contractor purchased this product. The measured wastage rate of this product was (17.7%, 8%, 21%) compared to the 5% predicted wastage rate.

34 Page 30 Causes of waste: The high wastage rate can be attributed to the fact that too much plaster was mixed with water daily and could not be used the next day due to drying out. Over ordering of this product was also evident on the sites as full bags of plaster were discarded unused. Screed: This product was only used on the Site C and was purchased by the sub-contractor. Screed is made by mixing mortar and cement together and was used to cover the ground floor areas of the housing units. The measured wastage rate of screed was (6.5%) as opposed to predicted wastage rate of 5%. Causes of waste: Rework was a major cause of waste. The blockwork was not laid accurately before the inside wall areas were surveyed. At this point the screed was laid onto the floor areas. As a result of remedial work done on the brick walls the screed had to be broken out and redone again. Chipboard floor: This product was only used on the Site B and was purchased by the sub-contractor. The measured wastage rate of chipboard floor was (24%) as opposed to the predicted wastage rate of 8%. Causes of waste: The high measured wastage rate can be attributed to large pieces of panel offcuts as the standard sized chipboard panels had to be cut to fit the dimensions of the housing units floor areas.
35
36 Page 32 Conclusions This report provided key evidence that can be used to both influence the practices of the construction industry and the manufacturers of products. Using this data can also influence policy by highlighting those construction materials that are likely to produce the highest volume of waste on construction sites. Measured waste data for 14 construction products have been analysed in terms of finding out the actual wastage rates for the indentified products. The measured wastage rates of the selected products were then compared to the wastage rate used by the Green Guide to Specification (in turn derived from pricing books used by the construction Industry such as Laxtons). Key headline figures at a site and project level for resource usage of the 14 selected products are as follows: > The volume of measured waste was approximately 2.5 times higher than the predicted waste. Reducing the wastage rates to the level that is estimated by the pricing books would result in true cost of waste savings of: Site A 35,455 Site B - 27,518 Site C - 13,413 The overall savings made on the three sites observed could have been 76,386 had wastage rates been in line with standard ones provided in pricing books. > Producing less mineral wool waste than anticipated made a savings of: - Site A: 3.2% savings means a reduction of 1,167 in the true cost of waste. - Site B: 1.3% savings means a reduction of 351 in the true cost of waste. - Site: 1.3% savings a reduction of 364 in the true cost of waste > Producing less polystyrene insulation on Sites A and B than predicted by these sites saved: - Site: 5.7% saving means a reduction of 1397 in the true cost of waste. - Site C: 1% saving means a reduction of 136 in the true cost of waste. > The main causes of waste observed on the three site were as follows in order of magnitude (from greatest to smallest): 1. Methods of work offcuts 2. Over ordering 3. Unsuitable storage / materials exposed to weather conditions 4. Rework done due to unclear drawings / design specification. Analysing the difference between the standard wastage rates of construction products provided by industry pricing books and the measured wastage rates of the 14 products selected from the SmartLIFE site reveals a large discrepancy. This in turn shows that there is plenty of potential to reduce the amount of waste arising and the environmental and financial costs associated with this waste. Standard wastage rates provided in pricing books can also lead to jobs being incorrectly priced and large deviations in the Site Waste Management Plans (SWMP) between forecast waste arising and actual waste arising. The SWMP requires that most construction sites estimate the quantity of the different waste streams the site is expected to produce during the life time a project. A more accurate wastage rate of the different materials would help the site to better predict the quantities of waste produced and the waste minimisation, reuse and recycling schemes that the site need to implement to reduce the volume of waste going to landfill. In most cases the main contractor that oversees the construction work packages has to pay for the waste removal accrued by the sites. Therefore if the wastage rates of the individual products are reduced, the material costs, waste disposal costs and labour costs would also be reduced.
37 Page 33 These costs can be calculated using the formula provided in this report or through using the True Cost of Waste Calculator developed by BRE as part of the Construction Resources and Waste Platform s Programme of work. This calculator also provides a measure of the embodied environmental impacts of the wasted materials, at standard waste rates (as defined by pricing books) or using alternative wastage rates, such as those measured by the site or reported elsewhere. For example, the measured waste quantities of the 14 products discussed in this report could be entered into the True Cost of Waste Calculator. The three sites could have saved approximately 76,386. The majority of these savings would have been made on material costs. Materials prices and construction prices are forecast to rise by 4 to 7% this year 12, thus adding further incentive to reduce wastage rates of construction materials. The trend of rising material costs is highly likely to continue in the future, therefore the purchasing policies used by construction companies could implement actions to reduce waste in order to make the company leaner. Setting up material take back schemes with the main product suppliers would reduce the sites waste disposal costs. On the SmartLIFE project this was demonstrated by returning the plasterboard and the polar wall insulation offcuts to the suppliers manufacturing plant for closed loop recycling. Segregating other materials for off site recycling could cut the cost of waste disposal, as demonstrated on the Site B site. Waste reduction activities need to start from the cause of the waste i.e. how the waste was produced in the first place. The causes of waste were observed on the SmartLIFE sites. This information can be used on the next project incorporating the lessons learnt on the three sites. All three sites encountered problems with the design specification. The drawings given to the subcontractors were not clear or detailed enough which resulted in remedial work. One of the main causes of waste was due to methods of work which meant that a large volume of materials was discarded as offcuts. The over ordering of materials was another main cause of waste recorded on all the sites. Practicing just in time delivery of materials and ordering only the amount that is needed could improve resource efficiency. Ideally, the cause of waste can be allocated to the most relevant part of the supply chain. Surplus materials can stem from a procurement decision, waste packaging from the distributor or manufacturer, and off-cuts from the design. This then points the way to reducing the waste. For example, where waste was caused through site damage, it could be reduced by storing the materials accurately and under covered areas to protect them from weather conditions that could render the materials unusable. It is clear that reducing the measured wastage rates will have a positive effect in terms of reducing the costs of materials bought onto the project, the amount of waste created and its environmental and financial associated costs. However, the most important waste management option is to cut out the waste, i.e. waste reduction or minimisation. The House of Lords Science and Technology Committee s waste reduction report released recently, stated that waste reduction rather than reuse and recycling must now be the priority of the Government E-newsletter: Material Recycling Sustainable Resource Group, The House of Lords Science and Technology Committee: Waste Reduction Report. Released on 20th August 2008.
38 Page 34 Recommendations General recommendations on achieving lower wastage rates across the supply chain are as follows: Manufacturers Manufacturers should consider the resource use and waste relating to the products and materials they supply, across the life cycle of that product. This would flag up the need to reduce waste at the point of installation to far lower levels than have been measured and reported here. This could involve any number of specific activities, such as take back of product and packaging, training and advice relating to efficient installation, provision of pre-cut / pre-assembled products and materials, and improved durability damage prevention. Where distributors are involved in the supply chain, further actions may be useful in terms of improved handling and optimisation of secondary packaging. Clients The client / developer and financial backers of a development can influence site waste management from the outset of a development. The procurement method chosen can produce lower costs and encourage greater cooperation with the supply chain. Target setting for waste minimisation can drive the site teams to keep site waste activities on the agenda throughout the project and to measure their performance against the target set by the client. The inclusion of contractual clauses in the contractors tender documentation to encourage designing out waste, buying materials with high recycled content and setting up material take back schemes for the key construction products used on the development, can also promote lower wastage rates.clients should also ensure a systematic approach through the design and planning stages, and maximise the potential cost and environmental savings. Procurement route The procurement process encompasses the whole life cycle of the contract from identification of the need, design, tendering, appointment processes and contract management, to finalising the contract. The procurement route adopted should tackle a key cultural habit: lack of and/or late involvement of specialist contractors and suppliers in the design and planning process. The most effective procurement process allows the client, designers, contractors and suppliers to work together as an integrated team, partnering with the joint aim of completing the project and meeting the environmental and waste targets set out. Pretender Pre-qualification Stage As part of this process, clients wishing to encourage waste minimisation and improved waste management should evaluate the tendering companies awareness and experience of developing and implementing good practice in managing waste onsite, and their ability to motivate and specify trade contractors and waste service providers to deliver the required performance. Tender requirements The client requirements for waste management should be clearly described in the tender specification. This is the key intervention point in the procurement process where policy objectives, such as sustainability, can be applied. Clients wishing to encourage good practice regarding materials wastage should set outcomebased requirements for construction waste minimisation and management in the tender specification. These requirements may include: > Quantitative KPIs, minimum standards and improvement targets for waste reduction, reuse and recycling or a requirement to agree targets for such parameters and demonstrate their achievement > Minimum requirements for specific elements of work (take back of plasterboard waste). Forms of contract Forms of contract govern the construction industry. Contractual relationships in projects can be complex, with the involvement of many players whose roles and responsibilities vary over the life of the project and beyond. There are various standard forms of contract, which are under constant development in order to reflect best practice, together with emerging case law, legislation and loopholes. Contracts more suited to achieving better waste management and incorporating waste management issues will have the following characteristics:
39 Page 35 > Higher levels of client involvement > Better design management integration > Greater capacity for incorporating change > Clear lines of responsibility for resolving remedials. Main contractors and subcontractors (including quantity surveyors) Contractors and subcontractors are critical in terms of site waste management and improving resource efficiency. It is essential for contractors to have an understanding of the following: > Type of waste being generated > Amount of waste being generated > Cost of the waste quantity surveyors can play an important role here > Current waste management routes. Waste targets set should also involve the supply chain and a full understanding in terms of subcontractors and the wastage they generate. Obviously a certain amount of waste will also be produced from construction activities. It is therefore important that the waste is managed as effectively as possible. Important issues are to ensure that the waste is being reused/recycled with the least environmental impact and to ensure legislation is complied with. Designers Designers play a vital role in resource efficiency, with particular need for attention on the following areas: > Designing the building/layout to reduce the overall amount of material resource usage e.g. consider floor areas, reduction in number of materials, avoid complex designs and encourage straight lines etc. This will eliminate waste being produced. Obviously buildings and systems are not usually designed with the sole purpose to eliminate waste, but avoidance of waste can be achieved within an overall design/ sustainability framework. > Designing out waste within the new build/fit out processes by using products/materials that aid waste reduction e.g. standard sizes, prefabrication, dry trades etc. This will minimise the amount of waste arising from installing these products/materials. > Designing products/systems/buildings that are adaptable for further uses or can be disassembled. This would require working closely with manufacturers at the product design stage e.g. use of equipment which can be debranded, leasing systems. Recommendations relating to improving the evidence base on wastage rates are as follows: > Further studies are needed to validate the information provided in this report on actual wastage rates. This should cover the same products, plus others commonly used in the construction sector. > A common methodology should be agreed for such studies; for example minimum standards of reporting on the amount of product delivered and the amount of waste produced. > As these datasets become available, they should be added to the True Cost of Waste Calculator and published in the public domain. > Discussions should be held with the publishers of pricing books to determine how their wastage rates have been derived and whether they would be interested in updating these in line with actual wastage rates from monitored sites. > Discussions should be held with the technical team involved in the Green Guide to Specification on whether they would be interested in basing their calculations on measured wastage rates. This could also provide an additional incentive for manufacturers to invest their resources in reducing the waste associated with their products (currently under- estimated according to this research). > Evidence should be used to inform voluntary industry agreements to reduce waste arising for particular product sectors. > Provision of benchmarks relating to wastage rates of key construction products can be used in tandem for site-based waste measurement to assess the overall progress of the construction industry towards reducing the amount of construction waste produced by 50% by Construction Resources and Waste Roadmap

40 PROJECT PARTNERS
Benefits of off site manufacture
 Case Study Benefits of off site manufacture Jocelyn Park, Somerset Jocelyn Park is a housing development owned and managed by South Somerset Homes Housing Association. There are 64 homes on site designed
Assessing the costs and benefits of reducing waste in construction
 Assessing the costs and benefits of reducing waste in 20 new build timber-framed houses Value Percentage of 1.36m cost Cost saving potential 21,470 1.58% Additional costs to achieve these savings TOTAL
Assessing the costs and benefits of reducing waste in construction
 Assessing the costs and benefits of reducing waste in New build concrete-framed office Value Percentage of 23m cost Cost saving potential 125,800 0.55% Additional costs to achieve these savings TOTAL POTENTIAL
Assessing the costs and benefits of reducing waste in construction trade packages
 Assessing the costs and benefits of reducing waste in construction trade packages Dense concrete blocks and facing bricks, with mineral wool insulation batts Value Percentage of 100k spend Cost saving
Baselines and benchmarks 2009
 Benchmarks and Baselines 2009 Executive Summary The aim of this work, which has been funded by the Construction Resources and Waste Platform 1, was to produce a set of benchmarks for the arsings for construction
Costs and benefits of reducing waste in construction. Defence sector new build Woolwich single living accommodation modernisation (SLAM)
") Costs and benefits of reducing waste in construction Defence sector new build Woolwich single living accommodation modernisation (SLAM) Value Percentage of 3.2m construction cost Cost saving potential
Costs and benefits of reducing waste in construction Defence sector new build Woolwich single living accommodation modernisation (SLAM) Value Percentage of 3.2m construction cost Cost saving potential
Cambridgeshire County Council County Planning, Minerals and Waste
 Cambridgeshire County Council County Planning, Minerals and Waste Guidance on Waste Audit and Management Strategies for submission in support of a planning application or to fulfil a requirement of a planning
Designing for Deconstruction in the Context of the Passivhaus Standard.
 Proceedings of 3rd Conference: People and Buildings held at Westminster University, School of Architecture and the Built Environment, London, UK, 20th September 2013. Network for Comfort and Energy Use
Material resource efficiency in construction
 Material resource efficiency in construction Supporting a circular economy Katherine Adams and Gilli Hobbs Material resource efficiency in construction Supporting a circular economy Katherine Adams and
CONCRETE BLOCKS Lignacite
 A range of fine textured, loadbearing units, suitable for facing and general purpose applications. Select from a range of sizes, strengths and grades for total design flexibility. Paint Grade General Properties
Classification of fire performance in accordance with BR 135: Annex B: Prepared for: Alsecco (U.K) Ltd Whitebridge Way Stone Staffs.
 Ltd Whitebridge Way Stone Staffs.") Classification of fire performance in accordance with BR 135: Annex B: 2007 Prepared for: Alsecco (U.K) Ltd Whitebridge Way Stone Staffs. ST15 8GH 29 th June 2007 Classification report : 237475-2 Issue
Classification of fire performance in accordance with BR 135: Annex B: 2007 Prepared for: Alsecco (U.K) Ltd Whitebridge Way Stone Staffs. ST15 8GH 29 th June 2007 Classification report : 237475-2 Issue
The Thin-Joint Construction Cost Advantage The 12.4% cost saving building method *
 Page 1 of 7 Davis Langdon were commissioned to undertake a study to provide a detailed comparison between Light Gauge Steel (LGS) Frame construction and H+H UK Ltd thin-joint masonry construction using
CONCRETE BLOCKS Lignacite
 A range of fine textured, loadbearing units, suitable for facing and general purpose applications. Select from a range of sizes, strengths and grades for total design flexibility. Paint Grade General Properties
Reducing construction waste saves money Bridge Learning Campus, Bristol Contractor: Skanska
 Exemplar case study Reducing construction waste saves money Bridge Learning Campus, Bristol Contractor: Skanska Background The Bridge Learning Campus (Bristol) ( BLC ) was used as a test bed for achieving
Module 3 Slabbing, Skimming, Dry Lining and Floors UNIT: 2 Skimming to Plasterboard
 TRADE OF PLASTERING PHASE 2 Module 3 Slabbing, Skimming, Dry Lining and Floors UNIT: 2 Produced by In cooperation with subject matter expert: Terry Egan Some images & text courtesy of Gypsum Industries
The efficient use of materials in regeneration projects
 Linking demolition and new build a step by step guide The efficient use of materials in regeneration projects 5. Key Performance Indicators WRAP works in partnership to encourage and enable businesses
The efficient use of materials in regeneration projects
 Linking demolition and new build a step by step guide The efficient use of materials in regeneration projects 10. Demolition phase The Demolition phase section outlines the planning of the demolition activities
TECHNICAL NOTE #29. University of Pretoria releases energy usage study of walling in SA TECHNICAL CONTRIBUTORS
 TECHNICAL NOTE #29 University of Pretoria releases energy usage study of TECHNICAL CONTRIBUTORS Prof Piet Vosloo, University of Pretoria Prof Dieter Holm, University of Pretoria Neels van Rooyen, University
EMBODIED ENERGY OF DWELLINGS
 EMBODIED ENERGY OF DWELLINGS S.N. Tucker and M.D. Ambrose CSIRO Division of Building, Construction and Engineering, Melbourne, Australia Abstract The concept of sustainable development of human activities
Construction Waste Measurement Guide
 Draft V6 Last updated: February 2013 Construction Waste Measurement Guide A guide to measuring and reporting waste from construction activities 1 Introduction This document provides guidance on how to
BRE Global Assessment Report
 BRE Global Assessment Report An assessment of the fire performance of the Gebrik Insulating Brick Cladding System against BR 135, Third Edition Prepared for: Date: 13 April 2016 Aquarian Cladding Systems
Sips Structural Insulated Panels the Future of House Building has arrived
 Sips Structural Insulated Panels the Future of House Building has arrived Winners of the Best SIPs Home 2016 Sips Eco Panels easi-wall system and easi-roof system are an advanced yet affordable pre-insulated
9/24/2015. Aalto! / ENG + ARC. Asuinrakennusten rakenneratkaisut. Requirements : Sound insulation requirements : Thermal insulation requirements :
 Aalto! / ENG + ARC Asuinrakennusten rakenneratkaisut Requirements : Sound insulation requirements : Thermal insulation requirements : 1 Wall structures : Concrete wall : Concrete outer cover (with cavities)
Waste Management Plan
 Plan Development Divisional Office Client Principal Contractor Principal Designer Lead Designer Location Description of Development Development Start Pewterspear Green Road, Warrington Manchester Neil
Taking the Devil out of the Detail?
 Insulation First Issue March 2017 Taking the Devil out of the Detail? AN EVALUATION OF ψ VALUES FOR KINGSPAN KOOLTHERM CAVITY CLOSER Low Energy Low Carbon Buildings Contents Page Executive Summary 3 Background
Construction Waste And The
 Construction Waste And The Environment Alan Hodgson Senior Environmental Planning Officer Tees Valley Green Business Network Event 23 October 2008 Middlesbrough Covering Revisit once the slides are complete
Resource efficiency pursued through design coordination and waste management
 : Edinburgh International Conference Centre Expansion and Speculative Office Space Resource efficiency pursued through design coordination and Key facts Extensive use of building information modelling
Site Waste management Plan (SWMP)
") Author: M.Graney & Sons Ltd. 1. Project Title: Underpinning, Lower ground floor Extension and Refurbishment Works. 2. Location: 21 Old Church Street, London, SW3 5DL. 3. Nature of Project: The works comprise
Author: M.Graney & Sons Ltd. 1. Project Title: Underpinning, Lower ground floor Extension and Refurbishment Works. 2. Location: 21 Old Church Street, London, SW3 5DL. 3. Nature of Project: The works comprise
The emphasis should be on the contractor to develop the targets for waste reduction and recovery. What is good practice?
 Material change for a better environment Procurement guidance for construction Setting a requirement for Waste Minimisation and Management 2 Setting a requirement for Waste Minimisation and Management
BNPB3: Plasterboard - legislation and policy drivers
 BNPB3: Plasterboard - legislation and policy drivers Version 1.6 This Briefing Note and referenced information is a public consultation document and will be used to inform Government decisions. The information
BS8414 Part 1: 2002 Test on a Phenolic Insulated Rainscreen system. Prepared for: Kingspan Insulation Ltd Pembridge Leominster Herefordshire HR6 9LA
 BS8414 Part 1: 2002 Test on a Phenolic Insulated Rainscreen system Prepared for: Kingspan Insulation Ltd Pembridge Leominster Herefordshire HR6 9LA 8 December 2005 0578 Page 1 of 16 Prepared on behalf
CATEGORY 3 OF THE CODE FOR SUSTAINABLE HOMES
 CATEGORY 3 OF THE CODE FOR SUSTAINABLE HOMES Materials Last month we looked at the first two categories of the Code for Sustainable Homes: Category 1 Energy and CO 2 Emissions, and Category 2 Water. We
Waste Management Policy
 Waste Management Policy Contents 1. Introduction 2. Policy Statement 3. Policy Objectives 4. Application 5. Organisation and Management 6. Glossary of Terms Document Control Information: Last updated on:
Best Practice Construction Waste Procurement: Office Fit-Out of 15 Canada Square, Canary Wharf
 Waste procurement case study Best Practice Construction Waste Procurement: Office Fit-Out of 15 Canada Square, Canary Wharf This case study examines how engagement between the main contractor, client and
THERMAL MASS CHAPTER 6. Understanding thermal mass. Seasonal effects of thermal mass
 CHAPTER 6 THERMAL MASS mud brick concrete block brick The contents of this chapter explain the effect of thermal mass and provide guidelines for its location and extent. Summer and winter effects of thermal
Benefits of off site manufacture
 Case Study Benefits of off site manufacture British Land Ropemaker site, London Ropemaker is a British Land commercial building on a prominent London city site. The site has 586,000 square foot net lettable
Measuring the Impact of Building Materials and the Opportunity for Wood- Based Construction. 12 October 2010 Dr Ed Suttie BRE Timber
 Measuring the Impact of Building Materials and the Opportunity for Wood- Based Construction 12 October 2010 Dr Ed Suttie BRE Timber Introduction Construction industry drivers Key construction materials
FLOORING RESOURCE EFFICIENCY PLAN 1 ST BROADLOOM CARPET MAP MEETING 13 TH OCTOBER 2009
 FLOORING RESOURCE EFFICIENCY PLAN 1 ST BROADLOOM CARPET MAP MEETING 13 TH OCTOBER 2009 Key Findings of Scoping Study FLOORING: Towards a Resource Efficiency Plan Scoping Study February / March 2009 Looked
A Handbook of thermal bridging details incorporating aircrete blocks
 A Handbook of thermal bridging details incorporating aircrete blocks Book 1 Thermal bridging solutions for external wall partial fill cavity details and full fill party wall details Prepared for the Aircrete
Waste Management Solutions. Canberra
 Waste Management Solutions Canberra Bunnings Partners with JUMBOBAG for Waste Removal and Disposal. The Offer A total Waste Management Solution Designed for the building industry Heavy Duty Disposable
BRE Global Test Report
 BRE Global Test Report BS 8414-2 : 2005 Test on a Gebrik Rainscreen Cladding System Prepared for: Isosystems and Aquarian Cladding Systems Date: 21 September 2015 Report Number: P100838-1000 Issue 2 BRE
Terraced Masonry Test Houses in Bradford
 Evaluation of the Party Wall Thermal Bypass in Masonry Dwellings J. Wingfield, D. Miles-Shenton and M. Bell School of the Built Environment Leeds Metropolitan University Leeds LS2 8AJ May 2009 Introduction
GN18: BREEAM Recognised Responsible Sourcing Certification Schemes and BREEAM Scheme Applicability V3.1
 GN18: BREEAM Recognised Responsible Sourcing Certification Schemes and BREEAM Scheme Applicability V3.1 1. Introduction BREEAM awards credits for responsibly sourcing construction products (typically under
Appendix I -1 Demolition Waste Estimates
 Appendix I -1 Demolition Waste Estimates Appendix I-1: Estimated demolition waste generated from the proposed JFH Demolition work Year Waste Mass (tonnes) St Elmo s Substation 2018 626 Westaway Court 2019
The SIPs Process. 1 Why SIPS? What is the typical process for building a home using SIPS Industries? The Factory Process...
 30a Renewable Chase Bibra Lake WA 6163 Tel: (08)9494 2211 Fax: (08)9494 2202 Email: info@sipsindustries.com.au Web: www.sipsindustries.com.au The SIPs Process Contents 1 Why SIPS?... 2 1.1 Energy Efficiency...
Modern Methods of Construction (MMC) & Eco-Building. Now & The Future
 & Eco-Building. Now & The Future") Modern Methods of Construction (MMC) & Eco-Building Now & The Future 1 Presentation: To Begin Setting the Scene: Modern Methods of Construction (MMC) is being driven by legislation Materials, Components
Modern Methods of Construction (MMC) & Eco-Building Now & The Future 1 Presentation: To Begin Setting the Scene: Modern Methods of Construction (MMC) is being driven by legislation Materials, Components
Grant Engineering Ireland ULC Heat Loss Survey Form. Customer Details: Installer Details:
 1 Grant Engineering Ireland ULC Heat Loss Survey Form Customer Details: Name Address Telephone Mobile Email Installer Details: Name Address Telephone Mobile Email Please note: If the main property has
Guidance on U Values from Domestic Heating Design Guide
 Guidance on U Values from Domestic Heating Design Guide The following U Values are from the Domestic Heating Design Guide, and the complete publication is available for purchase from members of the Domestic
MATERIALS AND RESOURCES
 MATERIALS AND RESOURCES MR- P1: STORAGE AND COLLECTION OF RECYCLABLES To reduce the waste that is generated by building occupants and hauled to and disposed of in landfills. PREREQUISITE REQUIREMENTS Provide
Building use, location etc. Option 1 Domestic type Pitched Roof 15, insulation at rafter line (heated habitable room) UV001 NOV 2015 (V2)
 UV001 NOV 2015 (V2)") U-Value & Condensation Risk calculation request form Due to high demand for our free calculation service, priority will be given to U-values requested via correctly completed forms as below. Please complete
U-Value & Condensation Risk calculation request form Due to high demand for our free calculation service, priority will be given to U-values requested via correctly completed forms as below. Please complete
Measuring the environmental performance of construction materials: The Green Guide to Specification Flooring and Internal Partitioning
 Measuring the environmental performance of construction materials: The Green Guide to Specification Flooring and Internal Partitioning BREEAM Materials, BRE Global February 2009 Overview Sustainability
An introduction to Part L U-values
 December 2010 An introduction to Part L This document provides a wide selection of building fabric constructions with their associated. It has been produced a support to our publication An introduction
BRE Global Test Report
 BRE Global Test Report Classification of fire performance in accordance with BR 135: 2013 Annex B. Prepared for: Date: 02 July 2014 Report Number: 287129 Iso Systems and Aquarian Cladding Systems BRE Global
BRE Global Classification Report
 BRE Global Classification Report Kingspan Ltd. BENCHMARK Engineered Façade system - Metallic Hook on Cassette. Classification of fire performance in accordance with BR 135: 2013 Annex B Prepared for: Kingspan
Benefits of the WRAP SWMP Template. Birmingham, 1 April 2008
 Benefits of the WRAP SWMP Template Birmingham, 1 April 2008 Dehlia Farrow Associate Director Environment, Halcrow Use of WRAP SWMP Template Improve your project s waste and resource efficiency Demonstrate
Reducing and recycling plasterboard waste on a site where space is a constraint
 Plasterboard case study Reducing and recycling plasterboard waste on a site where space is a constraint This case study describes the approaches taken to design out, recover and recycle plasterboard waste
Construction Waste Minimization and Reuse Management
 Construction Waste Minimization and Reuse Management Mr.M.KalilurRahman 1, Mr.S.S.Janagan 2 1 Student M.E., (CE&M), Gnanamani College of Engineering, Namakkal-637018, Tamilnadu, India 2 Assistant Prof,
Floors Walls Roofs. Jabfill Premium. APPLICATION: Full-fill Cavity Wall Insulation PRODUCTS: Vencel Resil Limited
 Floors Walls Roofs APPLICATION: Full-fill Cavity PRODUCTS: Vencel Resil Limited Head Office: Infinity House, Anderson Way, Belvedere, Kent DA17 6BG Tel: 020 8320 9100 Fax: 020 8320 9110 Technical Services:
wonderwall LIGHTWEIGHT CLADDING SYSTEM FINISHED WITH HIGH QUALITY CLAY BRICK SLIPS BRE CERTIFIED Cladding solutions Uniclass L513:P332 CI/SfB
 Cladding solutions Uniclass L513:P332 CI/SfB EPIC E239:X32 (41) Xg2 wonderwall LIGHTWEIGHT CLADDING SYSTEM FINISHED WITH HIGH QUALITY CLAY BRICK SLIPS BRE CERTIFIED FEATURES AND BENEFITS Using the Wonderwall
Defining a Fabric Energy Efficiency Standard for zero carbon homes
 Defining a Fabric Energy Efficiency Standard for zero carbon homes Appendix D Cost analysis The views and recommendations within this report are those of the Task Group and do not necessarily reflect the
Insulated Concrete Formwork (ICF)
") Insulated Concrete Formwork (ICF) If you have ever been to a Homebuilding & Renovating Show, you cannot have failed to notice various stands full of polystyrene building blocks. Maybe you have stopped
Insulated Concrete Formwork (ICF) If you have ever been to a Homebuilding & Renovating Show, you cannot have failed to notice various stands full of polystyrene building blocks. Maybe you have stopped
environmental impact of vertical cladding daniel doran and Jane anderson
 environmental impact of vertical cladding daniel doran and Jane anderson environmental impact of materials titles in this series environmental impact of floor finishes incorporating the green guide tables
*X227/12/01* X227/12/01 BUILDING CONSTRUCTION HIGHER NATIONAL QUALIFICATIONS 2014 FRIDAY, 6 JUNE 9.00 AM AM
 X227/12/01 NATIONAL QUALIFICATIONS 201 FRIDAY, 6 JUNE 9.00 AM 11.00 AM BUILDING CONSTRUCTION HIGHER 100 marks are allocated to this paper. Attempt all questions in Section A (0 marks). Attempt any two
External Walls Thermal Performance
 External Walls Thermal Performance Data Sheet 8 October 2017 Uniclass L3221 :A4 EPIC F611 :X221 CI/SfB Ff2 (Ajv) Introduction This data sheet gives guidance for the specification of blocks in conjunction
COPYRIGHTED MATERIAL. Contents. 1 Making Buildings 3. 3 Wood Foundations and. Preface to the Sixth Edition xi. Sitework 31
 Contents Preface to the Sixth Edition xi 1 Making Buildings 3 Learning to Build 4 Buildings and the Environment 5 The Work of the Design Professional 11 The Work of the Construction Professional 19 Trends
THE EFFECTS OF THE LANDFILL TAX AND AGGREGATES LEVY BY AN ANALYSIS OF AGGREGATES MARKETS SINCE British Aggregates Association
 THE EFFECTS OF THE LANDFILL TAX AND AGGREGATES LEVY BY AN ANALYSIS OF AGGREGATES MARKETS SINCE 1990 Prepared for: British Aggregates Association Date: THE EFFECTS OF THE LANDFILL TAX AND AGGREGATES LEVY
Batheaston Primary School, Northend, Bath
 Page 1 of 6, Northend, Bath Main Contractor: H Mealing & Sons Ltd, The Yard, Northend, Bath, BA1 7ES. Project: has undergone refurbishment works to introduce a new hall, reception, classrooms and a kitchen
/504 Level 2 Technical Award in Designing and Planning the Built Environment the Built Environment Theory Exam
 670--004/504 Level Technical Award in Designing and Planning the Built Environment the Built Environment Theory Exam June 018 1 The list below shows different urban environments in order of increasing
A metric for the construction sector. The Net Waste Method testing a new standard for measuring waste neutrality
 A metric for the construction sector The Net Waste Method testing a new standard for measuring waste neutrality WRAP works in partnership to encourage and enable businesses and consumers to be more efficient
Modern Methods of Construction (MMC)
") Real Estate Issue one Modern Methods of Construction (MMC) Introduction In the Real Estate business with companies actively competing for tenants to occupy their buildings to sustain their income flow
Real Estate Issue one Modern Methods of Construction (MMC) Introduction In the Real Estate business with companies actively competing for tenants to occupy their buildings to sustain their income flow
TRUE COST. of waste in whole life costing FINAL REPORT
 TRUE COST of waste in whole life costing FINAL REPORT True cost of waste in WLC Contents Introduction 02 Limitations of the study 02 WLC and terminology 03 Definitions of whole life costing 03 Practices
Defining a Fabric Energy Efficiency Standard for zero carbon homes
 Defining a Fabric Energy Efficiency Standard for zero carbon homes Appendix A Work Group 1 Form and Fabric The views and recommendations within this report are those of the Task Group and do not necessarily
Factsheet no. 2: SEGRO warehouse, Slough, UK
 Factsheet no. 2: SEGRO warehouse, Slough, UK Relocated warehouse building Slough, UK Project summary Client: Contractor: Architect: Structural engineers: Steel fabricator: Duration SEGRO Francis Construction
Thermal comfort in a 21st century climate
 CIBSE Briefing Thermal comfort in a 21st century climate Addressing the impact of climate change on the built environment Summary This briefing summarises the key findings of research* commissioned by
BS :2005 test on a Kingspan Benchmark External Wall Insulation System
 BS 8414-2:2005 test on a Kingspan Benchmark External Wall Insulation Prepared for: Kingspan Ltd. Carrickmacross Road Kingscourt County Cavan Ireland 7 September 2011 0578 Page 1 of 30 Prepared on behalf
Overview. Introduction to Housing Solutions 2-3. Why Modular Housing 4-5. Standarised Designs Apartments Warranties.
 Housing Overview Introduction to Housing Solutions Why Modular Housing Standarised Designs Apartments Warranties Flexible Design 2-3 4-5 6-13 14-17 18 19 Click here for more information on Buy Case Studies
HOW DO YOU IDENTIFY THE BEST PRACTICABLE ENVIRONMENTAL OPTION FOR CONSTRUCTION AND DEMOLITION WASTE?
 HOW DO YOU IDENTIFY THE BEST PRACTICABLE ENVIRONMENTAL OPTION FOR CONSTRUCTION AND DEMOLITION WASTE? Authors: Katherine Tebbatt Adams (Centre for Resource Management, Building Research Establishment, UK)
Site Waste Management Plans A guide for the construction industry and supply chain
 GG899 www.envirowise.gov.uk Envirowise Advice Line: 0800 585794 Notes:...... Envirowise - sustainable practices, sustainable profits. Envirowise is a Government-funded programme dedicated to putting the
Construction Technology Revision Guide
 Construction Technology Revision Guide Sub structures and Super structures Super structure (Wall, floors roof) Sub structure (Foundations) 2 Thermal Insulation Thermal insulation helps to prevent heat
Housing Easy Guide: Cavity Walls
 This Easy Guide on cavity walls aims to provide an overview of this method of construction for housing. The guidance is a practical introduction to the characteristics, performance benefits and latest
Target Zero Waste Home Construction
 Target Zero Waste Home Construction Project Objective How close to a zero waste to land fill construction is possible? Project Strategy This project is focused on avoid & reduce as the key drivers. Project
AIR BARRIER DESIGN PRINCIPLES AN OVERVIEW.
 AIR BARRIER DESIGN PRINCIPLES AN OVERVIEW www.stromatech.com AIR BARRIER DESIGN PRINCIPLES Building Regulations Approved Document Parts L1A & L2A currently requires that new buildings have to achieve a
A blueprint for reducing waste and cutting costs
 A blueprint for reducing waste and cutting costs An average 3-bed unit produces between 5 and 13 tonnes of construction waste. Reducing this could save 250-500 per unit. Five corporate-level actions and
A Handbook of thermal bridging details incorporating aircrete blocks
 A Handbook of thermal bridging details incorporating aircrete blocks Book 2 Thermal bridging solutions for external wall full fill cavity details Prepared for the Aircrete Products Association by the BBA
A handbook of thermal bridging details incorporating Porotherm blocks
 A handbook of thermal bridging details incorporating Porotherm blocks Book 7 Thermal bridging solutions for external wall cavity details using Porotherm Prepared for Wienerberger Ltd by the BBA Constructive
Testing a Prefabricated Floor System. Prepared for: Lee O Connor Director Grants of Shoreditch Ltd. 21 October Client report number
 Testing a Prefabricated Floor System Prepared for: Lee O Connor Director Grants of Shoreditch Ltd 21 October 2005 Client report number 226-135 1 Testing a Prefabricated Floor System Prepared by Name David
Insulation options. Calculating U-Values
 April 2017 Data Sheet 8 Aggregate concrete blocks External walls thermal performance Uniclass L3221 :A4 CI/SfB EPIC F611 :X221 Ff2 (Ajv) Concrete Block Association The Old Rectory, 8 Main Street, Glenfield
Innovative waste management approach achieves exemplary recovery rates
 : University of the West of Scotland, Ayr Campus Innovative waste management approach achieves exemplary Key facts The new campus was designed to achieve a BREEAM rating of Excellent. 96% of the 1,200
Real Stone Cladding mm sandstone ashlar. Thin Sandstone Ashlar Catalogue
 12 15 20 mm sandstone ashlar Thin Sandstone Ashlar Catalogue 12 15 20 mm ashlar 1 SANDSTONE ASHLAR 12 15 20 MM Ashlar sandstone is the most desired and expensive stone finish for any facade. It is now
 The Insulbrick Building System www.insulbrick.com.au 2 Insulbrick Insulated Concrete Formwork for Australian Standards Insulbricks provide a fire retardant expanded polystyrene [EPS] formwork for casting
Floors Walls Roofs. Jablite Premium board Jablite board. APPLICATION: Internal Wall PRODUCTS: Vencel Resil Limited
 Floors Walls Roofs APPLICATION: Internal Wall PRODUCTS: Jablite Premium board Jablite board Vencel Resil Limited Head Office: Infinity House, Anderson Way, Belvedere, Kent DA17 6BG Tel: 020 8320 9100 Fax:
developing a strategic approach to construction waste 20 year strategy draft for comment
 20 year strategy draft for comment Contents Developing a strategic approach to construction waste 20 year strategy 3 Background 3 Approach to developing a strategy 3 Forward look at construction and impacts
McGrath works in partnership with Hackney Homes
 Case study: Achieving good practice waste recovery McGrath works in partnership with Hackney Homes Hackney Homes is using a partnering approach across the whole supply chain, to deliver the Decent Homes
PROTECTION OF SINGLE PLY MEMBRANE ROOF SYSTEMS DURING CONSTRUCTION AND SERVICE
 Guidance document SGD10/11 PROTECTION OF SINGLE PLY MEMBRANE ROOF SYSTEMS DURING CONSTRUCTION AND SERVICE 1.0 Introduction 2.0 Design 2.1 End use considerations 2.1.1 Balcony or roof terrace 2.1.2 Location
Wind uplift testing on the Click Fit PV mounting system to MCS012. Prepared for: Gary Bowden Cleaner Air Solutions UK Ltd.
 Wind uplift testing on the Click Fit PV mounting system to MCS012 Prepared for: Gary Bowden Cleaner Air Solutions UK Ltd 4 th October 2010 Prepared by Name Dr P Blackmore Position Associate Director, Building
ENVIRONMENTAL PROFILES OF CONSTRUCTION MATERIALS, COMPONENTS AND BUILDINGS FOR THE UK.
 ENVIRONMENTAL PROFILES OF CONSTRUCTION MATERIALS, COMPONENTS AND BUILDINGS FOR THE UK. Jane Anderson, Suzy Edwards,-, Prashant Kapoor and lan Dickie Centre for Sustainable Construction BRE, Garston, Watford,
CI/SfB (41) x M2 June 2005 EPS
 x M2 June 2005 EPS") CI/SfB (41) x M2 June 2005 EPS INNOVATION PermaRock is the leading name in external wall insulation (EWI) and architectural façade systems in the United Kingdom, having pioneered the development of external
CI/SfB (41) x M2 June 2005 EPS INNOVATION PermaRock is the leading name in external wall insulation (EWI) and architectural façade systems in the United Kingdom, having pioneered the development of external
Appendix 6: Mapping of 21844VIC to 22216VIC
 Appendix 6: Mapping of to 22216VIC Mapping table from Certificate II in Building and Construction (Bricklaying, Carpentry, Solid Plastering) to Construction (Bricklaying, Carpentry, Ceiling Lining, Wall
The right solutions. However, it is inevitable that with the introduction of any new construction system the question arises How does it compare?
 Value assessment. The right solutions. We Believe We believe that Porotherm offers both short and long term value to all involved in the building process - from bricklayer to client and everyone in between.
Pinewood Structures, established in 1981, has become one of the UK s largest suppliers of timber frame structures.
 Private Developers About Us Pinewood Structures, established in 1981, has become one of the UK s largest suppliers of timber frame structures. Operating from a 5 acre site with 46,000 sq-ft of factory