Monotonic and Fatigue Flexural Behaviour of RC Beams Strengthened with Prestressed NSM CFRP Rods
|
|
|
- Neal Rodgers
- 6 years ago
- Views:
Transcription
1 Monotonic and Fatigue Flexural Behaviour of RC Beams Strengthened with Prestressed NSM CFRP Rods by Moataz Assad Badawi A thesis presented to the University of Waterloo in fulfillment of the thesis requirement for the degree of Doctor of Philosophy in Civil Engineering Waterloo, Ontario, Canada, 27 Moataz Badawi 27
2 AUTHOR S DECLARATION FOR ELECTONIC SUBMISSION OF A THESIS I hereby declare that I am the sole author of this thesis. This is a true copy of the thesis, including any required final revisions, as accepted by my examiners. I understand that my thesis may be made electronically available to the public. Moataz Badawi ii
3 Abstract The use of near surface mounted (NSM) carbon fibre reinforced polymer (CFRP) reinforcement is a recent and a promising technique for increasing the flexural capacity and the fatigue life of reinforced concrete (RC) flexural members. Prestressing the NSM CFRP rod may be utilized for a further enhancement in the monotonic and fatigue flexural response of RC beams. The aim of this study is to investigate the effectiveness of strengthening RC beams with nonprestressed and prestressed CFRP rods to increase the monotonic and fatigue flexural strength of the beams. Twenty-two RC beams were fabricated. Five beams were not strengthened and acted as control to simulate an existing structural member. The other beams were divided into groups that were strengthened with non-prestressed CFRP rod (% prestressed), and prestressed CFRP rod (4%, or 6% prestressed of the CFRP rod tensile strength). A beam from each group was tested under monotonic load and acted as a reference beam for those tested under cyclic loads. The test results showed that strengthening the RC beams with NSM CFRP rods increased both the monotonic flexural capacity and the fatigue strength. An increase in the yield and ultimate load of 26% and 5% was achieved, when the beams were strengthened with non-prestressed CFRP rod compared to the control beam. Also, the flexural stiffness of the strengthened beam was slightly enhanced by 16% over that of the control beam. When the beams were strengthened with prestressed CFRP rod (4% and 6%), considerable improvements in the cracking, yield, and ultimate loads were achieved as well as the flexural stiffness (serviceability). In a comparison iii
4 to the control beam, an increase up to 91% in the yield load and 79% in the ultimate load were obtained, in addition to 52.6% improvement in the flexural stiffness (pre-yielding) when a prestressed NSM CFRP rod was applied. A model to predict the flexural behaviour of the beams (control, non-prestressed, 4%, and 6% prestressed strengthened beams) under monotonic loading using section analysis is presented. It includes a model for flexural crack spacing considering the effect of the CFRP reinforcement, and the transfer length model. For an easy use, the monotonic flexural behaviour model is adopted in a computer language (Visual Basic 6). A model based on strain-life approach is also utilized to predict the fatigue life of the beams at various load ranges for all tested RC beams. For a given load range, by obtaining the nominal maximum and minimum stresses using the monotonic flexural model, the fatigue life of a beam is estimated by accounting for the effect of notch (ribs of the reinforcing bars), and the effect of mean stress. In summary, this study presents the first North American experience by using prestressed NSM CFRP rod for strengthening RC beams. Using such high prestressing levels of 4% and 6% with NSM strengthening method is considered the original contribution for monotonic flexural behaviour. Under cyclic loading, investigating the fatigue behaviour and constructing the fatigue life curves for RC beams strengthened with non-prestressed NSM CFRP rod is a considerable iv
5 contribution to the very limited information available in the literature. This study also includes the inventiveness of testing the fatigue response of the RC beams strengthened with prestressed NSM CFRP rod. A monotonic flexural model of strengthened RC beams with non-prestressed and prestressed NSM CFRP strengthened beams was developed to predict load versus deflection, strain in the concrete, strain in the tension and compression steel reinforcement, and strain in CFRP rod. The model is verified with the experimental results with excellent agreement. A model using strain-life approach was also developed to predict the fatigue life of non-prestressed and prestressed beams with a reasonable accuracy. v
6 Acknowledgements First of all, all praise to Allah (God) for giving me the strength and the patience to have this work completed. I thank my supervisors Prof. Khaled Soudki and Prof. Timothy Topper for their help, guidance, patience, and support. Without them, this scientific piece of work would not be done. I would like to express gratitude to Prof. Jeffery West who was supportive and helpful during the experimental work. Prof. B. Benmokrane and Prof. G. Glinka are deeply thanked for their constructive comments to enhance the quality of this thesis. All the technicians at University of Waterloo are greatly thanked in particular Mr. Ken Bowman who was always there for me at every stage of the experimental work. All the graduate students help at our group in the laboratory work is appreciated. Special thanks go to Ms. Maria El Zeghayar who was not only there for help in the laboratory, but also for her spiritual support and her continuous motivation. Saudi Arabian Cultural Bureau is thanked for their financial support during my educational path. vi
7 Dedication To My Mother and My Father vii
8 Table of Contents Chapter 1 Introduction General Objectives Thesis Structure...4 Chapter 2 Background and Literature Review Fibre Reinforced Polymers (FRP s) Fibres Matrix Strengthening of RC Structures Strengthening of RC Beams with Non-prestressed FRP Reinforcement Externally Bonded FRP (EB FRP) Near Surface Mounted FRP (NSM FRP) Strengthening of RC Beams with Prestressed FRP Reinforcement Externally Bonded Prestressed FRP (EB FRP) Reinforcement Near Surface Mounted FRP (NSM FRP) Fatigue Steel Concrete Fibre Reinforced Polymer (FRP) Fatigue Behaviour of RC Beams Fatigue Behaviour of RC Beams Strengthened with FRP Reinforcement...29 Chapter 3 Experimental Program Test Matrix Specimen Design Configurations Specimen Fabrications Material Properties Concrete Steel Reinforcement Carbon Fibre Reinforced Polymer (CFRP) Rod and Epoxy Strengthening Methods Using NSM Technique Non-prestressed NSM CFRP Rod Strengthened RC Beams...44 viii
9 3.5.2 Prestressed NSM CFRP Rod Strengthened RC Beams Shear Strengthening for the Prestressed Strengthened Beams Test Set-up and Instrumentation...52 Chapter 4 Monitoring of Prestressing and Transfer Length Load versus Time Relationship Strain in the CFRP Rod versus Time Relationship Load versus Slip Relationship Transfer Length Summary of Transfer Length Results An Empirical Model to Predict the Transfer Length Summary...71 Chapter 5 Monotonic Test Results of RC Beams General Behaviour Modes of Failure Effect of Prestressing Load-Deflection Relationship Cracking Load Yield Load Ultimate Load Flexural Stiffness Ductility Strain Behaviour Concrete Steel Reinforcement CFRP Rod Linearity of Strain Profile (Strain Compatibility) Summary...12 Chapter 6 Fatigue Test Results for the RC Beams Fatigue Failure Modes Fatigue Failure of the Tension Steel Reinforcement Fatigue Failure of the CFRP Rod Fatigue Bond Failure...18 ix
10 6.2 Deflection versus Number of Cycles Strain in the Concrete versus Number of Cycles Strain in the Tension Steel Reinforcement versus Number of Cycles Slip in the CFRP Rod versus Number of Cycles Strain in the CFRP Rod versus Number of Cycles Fatigue Life Summary Chapter 7 Monotonic Flexural Model Concept of the Model Flexural Crack Spacing Model Assumptions of the Model Material Properties Concrete Tension and Compression Steel Reinforcement CFRP Rod An Estimation of RC Beam Deflection Sectional Analysis Equilibrium Requirements for Sectional Analysis Pre-cracking Stage Pre-yielding Stage Post-yielding Stage Calculation Procedure Control and Non-prestressed Strengthened RC Beams Prestressed Strengthened RC Beams Computer Program and Verification of the Model Computer Program (NSM-FRP) Verification of the Model Chapter 8 Fatigue Life Prediction Model The Strain-Life Approach Steel Fatigue Properties Stress-Strain History The Elastic Stress Concentration Factor (K t ) x
11 8.5 The Fatigue Notch Factor (K f ) An Estimation of Fatigue Life The Fatigue Life Prediction Model A Comparison of the Predictions with the Experimental Fatigue Data Control Beams Non-prestressed Strengthened Beams Prestressed Strengthened Beams Summary...25 Chapter 9 Conclusion, Recommendations, and Future Work Conclusion and Recommendations Prestressing and Transfer Length Monotonic Flexural Behaviour Results Fatigue Results Future Work...21 xi
12 List of Figures Figure 1.1: Thesis structure... 1 Figure 2.1: Components of composite materials... 7 Figure 2.2: Stress-strain relationships for different fibres and steel (ACI committee 44R, 1996)... 7 Figure 2.3: Tensile stress-strain relationships for the composite FRP and its components (reproduced from ACI committee 44R, 1996)... 9 Figure 2.4: Necessity of concrete structure strengthening... 1 Figure 2.5: RC beams strengthened with FRP Reinforcement: a) control, b) strengthened with non-prestressed FRP, c) strengthened with prestressed FRP (Nordin et al., 21) Figure 2.6: Load-deflection of test results, non-prestressed and prestressed beams, (Nordin and Taljsten, 26)... 2 Figure 2.7: Fatigue failure in a reinforcing steel bar (Badawi and Soudki, 26) Figure 2.8: Fatigue terms used in the analysis Figure 2.9: S-N curve for ferrous alloys Figure 2.1: Effect of mean stress on the fatigue life of the steel (Tilly and Tan, 1979) Figure 2.11: Fatigue damage stages of steel (Bannantine et al., 199) Figure 2.12: Stress-strain curves for concrete under repeated compressive load (Neville, 1996) Figure 2.13: Modified Goodman Chart for fatigue life of concrete (Neville, 1996) Figure 2.14: Relationship between the maximum strain and relative number of cycles of concrete under compressive cyclic loading (Neville, 1996) Figure 2.15: Fatigue damage phases in composite materials Figure 2.16: Effect of layers on the flexural fatigue behaviour of strengthened RC beams, left: two layers, right: three layers (Shahawy and Beitelman,1999) Figure 2.17: Fatigue life of the non-strengthened and strengthened beams with GFRP (Christos et al., 21) Figure 2.18: The S-N curve (Aidoo et al., 24) Figure 3.1: Dimensions and steel reinforcement details of the RC beams... 4 Figure 3.2: Fabrication process of the RC beams xii
13 Figure 3.3: NSM CFRP application process Figure 3.4: A schematic drawing of the set-up of the prestressing system Figure 3.5: Photos of the prestressing set-up system Figure 3.6: Live end of the prestressing set-up Figure 3.7: Dead end of the prestressing set-up... 5 Figure 3.8: Photos of the ends of the prestressing set-up Figure 3.9: CFRP U-wrap strengthening for the prestressed strengthened beams Figure 3.1: Strain gauge instrumentation of the RC beams Figure 3.11: Loading test set-up of the RC beams Figure 4.1: Load-time relationship before releasing the applied prestressing force in a typical 4% prestressed strengthened beam Figure 4.2: Load-time relationship before releasing the applied prestressing force in a typical 6% prestressed strengthened beam Figure 4.3: Strain readings in the CFRP rod versus time after release (4% prestressed strengthened beams) Figure 4.4: Strain readings in the CFRP rod versus time after release (6% prestressed strengthened beams)... 6 Figure 4.5: Load-slip of the CFRP rod for 4% prestressed strengthened beams Figure 4.6: Load-slip of the CFRP rod for 6% prestressed strengthened beams Figure 4.7: Strain readings versus the distance from the end of the bonded length for the 4% prestressed strengthened beams after 7 days from release of the prestressing force Figure 4.8: Strain readings versus the distance from the end of the bonded length for the 6% prestressed strengthened beams after 7 days from release of the prestressing force Figure 4.9: Transfer length of the prestressed strengthened beams Figure 4.1: Analytical prediction of the transfer length for the 4% prestressed strengthened beams Figure 4.11: Analytical prediction of the transfer length for the 6% prestressed strengthened beams Figure 4.12: Forces and stresses acting on an element of CFRP rod bonded with epoxy Figure 4.13: Bond stress for 4% prestressed NSM CFRP rod xiii
14 Figure 4.14: Bond stress for 6% prestressed NSM CFRP rod Figure 5.1: Effect of FRP strengthening on the behaviour of the RC beam Figure 5.2: Modes of failure of the tested beams Figure 5.3: Shear cracks along the NSM groove Figure 5.4: Effect of prestressing level on the mode failure Figure 5.5: Effect of prestressing on stress-strain behaviour of materials of RC beams... 8 Figure 5.6: Load-deflection curves of the tested beams Figure 5.7: Effect of CFRP prestressing level on the cracking load Figure 5.8: Effect of prestressing on the yield load Figure 5.9: Effect of prestressing level on the ultimate load Figure 5.1: Effect of prestressing level on the strain of CFRP rod Figure 5.11: Strain in the tension steel reinforcement versus the applied load Figure 5.12: Normalized pre-cracking flexural stiffness... 9 Figure 5.13: Normalized pre-yielding flexural stiffness Figure 5.14: Normalized post-yielding flexural stiffness Figure 5.15: Effect of prestress on stiffness Figure 5.16: Ductility index of the tested beams Figure 5.17: Compressive strain in concrete for the tested beams Figure 5.18: Concrete compressive strain at ultimate load versus the prestressing level Figure 5.19: Tension steel reinforcement strains versus applied load Figure 5.2: Strains in the CFRP rod versus applied load Figure 5.21: Strain profile of the section of the control beam at various levels of loading Figure 5.22: Strain profile of the section of the non-prestressed strengthened beam... 1 Figure 5.23: Strain profile of the section of the 4% prestressed strengthened beam... 1 Figure 5.24: Strain profile of the section of the 6% prestressed strengthened beam Figure 5.25: Neutral axis locations versus the applied load Figure 6.1: Fatigue failure due to a rupture in the reinforcing steel bar Figure 6.2: Effect of prestressing on the fatigue life of the prestressed strengthened beams. 17 Figure 6.3: Fatigue failure in the CFRP rod (6% prestressed strengthened beam) Figure 6.4: Fatigue bond failure of the 4% prestressed strengthened beam xiv
15 Figure 6.5: Shear stress distribution in the CFRP rod Figure 6.6: Tensile strains in the CFRP rod for the beam that failed by fatigue bond failure Figure 6.7: Deflection versus normalized number of cycles for the control beams Figure 6.8: Deflection versus normalized number of cycles for non-prestressed strengthened beams Figure 6.9: Deflection versus normalized number of cycles for the 4% prestressed strengthened beams Figure 6.1: Effect of CFRP rod slip on the deflection behaviour Figure 6.11: Deflection versus normalized number of cycles for the 6% prestressed strengthened beams Figure 6.12: Compressive strain in concrete versus the number of normalized cycles for the control beams Figure 6.13: Strain in concrete versus the number of normalized cycles for the nonprestressed strengthened beams Figure 6.14: Strain in concrete versus normalized number of cycles for the 4% prestressed strengthened beams Figure 6.15: Strain in concrete versus normalized number of cycles for the 6% prestressed strengthened beams Figure 7.1: Concept of the monotonic flexural model Figure 7.2: Development of flexural cracks of a beam Figure 7.3: Un-cracked region in the beam Figure 7.4: Stress-strain relationship of concrete Figure 7.5: Stress-strain relationship of steel reinforcement Figure 7.6: Stress-strain relationship of CFRP rod Figure 7.7: Equivalent compressive stress in concrete Figure 7.8: Internal stresses of prestressed strengthened beam at pre-cracking stage Figure 7.9: Strain, stress distribution and internal forces at pre-cracking stage Figure 7.1: Strain, stress distribution and internal forces at pre-yielding stage Figure 7.11: Strain, stress distribution, and internal forces at post-yielding stage Figure 7.12: Main flowchart of the model xv
16 Figure 7.13: Flowchart of the un-cracked section analysis Figure 7.14: Flowchart of the cracked section analysis Figure 7.15: Flowchart of the initial strain and cambering of the prestressed beams Figure 7.16: Flowchart of the deflection calculation Figure 7.17: Outputs of the program Figure 7.18: Experimental and analytical load-tension steel reinforcement strain Figure 7.19: Experimental and analytical load-concrete strain Figure 7.2: Experimental and analytical load-cfrp strain for the strengthened beams Figure 7.21: Comparisons of experimental and analytical load-deflection curves Figure 8.1: Applied cyclic load versus time Figure 8.2: Logarithm of the true cyclic stress amplitude versus the logarithm of the cyclic plastic strain amplitude Figure 8.3: Local stress and strain using Neuber s rule Figure 8.4: Stress-strain loading and unloading behaviour of steel at a notch Figure 8.5: Tensile stress distribution in the tension steel reinforcement and concrete Figure 8.6: Effect of mean stress on the fatigue life of the steel (Tilly and Tan, 1979) Figure 8.7: Flowchart of the fatigue analysis using strain-life approach Figure 8.8: Predicted hysteresis loops at various load ranges for the control beam Figure 8.9: Fatigue life of the control beams (experimental versus analytical) Figure 8.1: Predicted hysteresis loops at various load ranges for the non-prestressed strengthened beams... 2 Figure 8.11: Fatigue life of the non-prestressed strengthened beams... 2 Figure 8.12: Effect of the CFRP rod slip on the mean stress of the steel reinforcement Figure 8.13: Effect of the CFRP slip on the local stress and stain of the steel reinforcement 22 Figure 8.14: Predicted hysteresis loops at various load ranges for the 4% prestressed strengthened beams Figure 8.15: Fatigue life of the 4% prestressed strengthened beams Figure 8.16: Predicted hysteresis loops at various load ranges for the 6% prestressed strengthened beams Figure 8.17: Fatigue life of the 6% prestressed strengthened beams xvi
17 Figure A- 1: Load-deflection for the control beam Figure A- 2: Load-compressive strain in concrete for the control beam Figure A- 3: Load-strain in tension steel for the control beam Figure A- 4: Load-deflection for the non-prestressed strengthened beam Figure A- 5: Load-compressive strain in concrete for the non-prestressed strengthened beam Figure A- 6: Load-strain in tension steel for the non-prestressed strengthened beam Figure A- 7: Load-strain in CFRP rod for the non-prestressed strengthened beam Figure A- 8: Load-deflection of the 3% prestressed strengthened beam Figure A- 9: Load - compressive strain in concrete for the 3% prestressed strengthened beam Figure A- 1: Load - strain in tension steel for the 3% prestressed strengthened beam Figure A- 11: Load - strain in CFRP rod for the 3% prestressed strengthened beam Figure A- 12: Load-deflection for the 4% prestressed strengthened beam Figure A- 13: Load-compressive strain in concrete for the 4% prestressed strengthened beam Figure A- 14: Load-strain in tension steel for the 4% prestressed strengthened beam Figure A- 15: Load-strain in CFRP rod for the 4% prestressed strengthened beam Figure A- 16: Load - deflection for the 5% prestressed strengthened beam Figure A- 17: Load - strain in concrete for the 5% prestressed strengthened beam Figure A- 18: Load - strain in tension steel for the 5% prestressed strengthened beam Figure A- 19: Load - strain in CFRP rod for the 5% prestressed strengthened beam Figure A- 2: Load-deflection for the 6% prestressed strengthened beam Figure A- 21: Load-compressive strain in concrete for the 6% prestressed strengthened beam Figure A- 22: Load-strain in tension steel for the 6% prestressed strengthened beam Figure A- 23: Load-strain in CFRP rod for the 6% prestressed strengthened beam Figure B- 1: Load versus deflection for the control beam (load range: 1%-55%) Figure B- 2: Load versus deflection for the control beam (load range: 1%-65%) Figure B- 3: Load versus deflection for the control beam (load range: 1%-75%) xvii
18 Figure B- 4: Load versus deflection for the control beam (load range: 1%-8%) Figure B- 5: Load versus compressive strain in concrete for the control beam (load range: 1%-55%) Figure B- 6: Load versus compressive strain in concrete for the control beam (load range: 1%-65%) Figure B- 7: Load versus compressive strain in concrete for the control beam (load range: 1%-75%) Figure B- 8: Load versus compressive strain in concrete for the control beam (load range: 1%-8%) Figure B- 9: Load versus strain in tension steel for the control beams Figure B- 1: Load versus deflection for the non-prestressed strengthened beam (load range: 6.7%-45%) Figure B- 11: Load versus deflection for the non-prestressed strengthened beam (load range: 6.7%-5%) Figure B- 12: Load versus deflection for the non-prestressed strengthened beam (load range: 6.7%-6%) Figure B- 13: Load versus deflection for the non-prestressed strengthened beam (load range: 6.7%-65%) Figure B- 14: Load versus strain in concrete for the non-prestressed strengthened beam (load range: 6.7%-45%) Figure B- 15: Load versus strain in concrete for the non-prestressed strengthened beam (load range: 6.7%-5%) Figure B- 16: Load versus strain in concrete for the non-prestressed strengthened beam (load range: 6.7%-6%) Figure B- 17: Load versus strain in concrete for the non-prestressed strengthened beam (load range: 6.7%-65%) Figure B- 18: Load versus strain in tension steel for the non-prestressed strengthened beams Figure B- 19: Load versus deflection for the 4% prestressed strengthened beam (load range: 5.7%-5%) xviii
19 Figure B- 2: Load versus deflection for the 4% prestressed strengthened beam (load range: 5.7%-6%) Figure B- 21: Load versus deflection for the 4% prestressed strengthened beam (load range: 5.7%-65%) Figure B- 22: Load versus deflection for the 4% prestressed strengthened beam (load range: 5.7%-75%) Figure B- 23: Load versus strain in concrete for the 4% prestressed strengthened beam (load range: 5.7%-5%) Figure B- 24: Load versus strain in concrete for the 4% prestressed strengthened beam (load range: 5.7%-6%) Figure B- 25: Load versus strain in concrete for the 4% prestressed strengthened beam (load range: 5.7%-65%) Figure B- 26: Load versus strain in concrete for the 4% prestressed strengthened beam (load range: 5.7%-75%) Figure B- 27: Load versus strain in tension steel for the 4% prestressed strengthened beams Figure B- 28: Load versus deflection for the 6% prestressed strengthened beam (load range: 5.8%-5%) Figure B- 29: Load versus deflection for the 6% prestressed strengthened beam (load range: 5.8%-55%) Figure B- 3: Load versus deflection for the 6% prestressed strengthened beam (load range: 5.8%-65%) Figure B- 31: Load versus deflection for the 6% prestressed strengthened beam (load range: 5.8%-68.8%) Figure B- 32: Load versus deflection for the 6% prestressed strengthened beam (load range: 5.8%-72.5%) Figure B- 33: Load versus deflection for the 6% prestressed strengthened beam (load range: 5.8%-77.5%) Figure B- 34: Load versus strain in concrete for the 6% prestressed strengthened beam (load range: 5.8%-5%) xix
20 Figure B- 35: Load versus strain in concrete for the 6% prestressed strengthened beam (load range: 5.8%-55%) Figure B- 36: Load versus strain in concrete for the 6% prestressed strengthened beam (load range: 5.8%-65%) Figure B- 37: Load versus strain in concrete for the 6% prestressed strengthened beam (load range: 5.8%-68.8%) Figure B- 38: Load versus strain in concrete for the 6% prestressed strengthened beam (load range: 5.8%-72.5%) Figure B- 39: Load versus strain in tension steel for the 6% prestressed strengthened beams xx
21 List of Tables Table 2-1: Mechanical properties of different FRP s (ISIS Canada, 21)... 8 Table 2-2: Mechanical properties of matrices (ACI committee 44R, 1996)... 9 Table 2-3: A summary of researches conducted on strengthening RC beams under monotonic loading Table 2-4: A summary of researches conducted on strengthening RC beams under fatigue loadings Table 3-1: Test matrix of the experimental program Table 3-2: Fatigue properties of steel reinforcement (Heffernan, 1997) Table 5-1: Summary of test results Table 6-1: Fatigue test results Table 7-1: Summary of the experimental and analytical results Table 8-1: Coefficients of the cyclic stress-strain curve and SWT Equation for the reinforcing steel bars (Heffernan, 1997) xxi
22 Chapter 1 Introduction 1.1 General Rehabilitation and strengthening of reinforced concrete structures and bridges are major challenges facing structural engineers. Most of the infrastructure is usually subjected to repeated loads, which cause a structure to failure at a load level below its static capacity. Thus, fatigue loads (repeated loads) should be taken into consideration in the rehabilitation of concrete structures. Furthermore, these structures that have been built more than several decades may need to be strengthened and upgraded to meet the current service load demands. Several methods of strengthening reinforced concrete (RC) structures using various materials have been studied and applied in the rehabilitation field. The most recent type of material used is fibre reinforced polymer (FRP) reinforcement. FRP has proven to be an excellent strengthening material for rehabilitation of RC structures compared to other traditional strengthening materials. This is due to the fact that it has a small weight to volume ratio, which makes application easier, a high strength to weight ratio, and non corrosive properties, which enhance the durability performance of RC structures. In addition, FRP has a high fatigue strength under repeated loads (fatigue). The use of the FRP can be either as internal reinforcement for a new construction, or as surface or near surface mounted (NSM) reinforcement (rod/strip) for strengthening an 1
23 existing reinforced concrete (RC) structure. Recently, using FRP as NSM is considered to be a promising method for strengthening and rehabilitating RC structures (Asplund, 1949; De Lorenzis et al., 2; El-Hacha et al., 24; Yost et al., 24; Liu et al., 26). The advantages of using NSM FRP strengthening compared to other FRP strengthening techniques are numerous. In the NSM technique, the FRP is typically embedded in a pre-cut groove in the concrete structural member and bonded by epoxy, which protects the FRP material from any physical impact or vandalism. In strengthening of the negative moment region of a continuous slab, for example where the surface may be exposed to physical and environmental damage, the NSM technique does not require a protection for the FRP because it is embedded in epoxy, whereas for externally bonded FRP, a protection is needed. 1.2 Objectives Recently, the use of fibre reinforced polymer (FRP) as near surface mounted (NSM) reinforcement has attracted a considerable attention. However, there are only limited number of studies on NSM FRP strengthening available in the literature, namely for non-prestressed, and prestressed reinforcement. The majority of the studies investigated the effectiveness of non-prestressed NSM FRP strengthening on the flexural response of RC beams under monotonic loads, while only a few of studies investigated the fatigue flexural behaviour by testing limited number of specimens. According to the author s knowledge, there is only one study that was conducted to investigate the flexural behaviour of RC beams strengthened with prestressed NSM FRP material under monotonic loading (Nordin et al., 21; Nordin 2
24 and Taljsten, 26). To date, the flexural fatigue behaviour of RC beams strengthened with prestressed NSM FRP material has not been investigated. Therefore, the main contribution of the current study is to investigate the effectiveness and feasibility of using non-prestressed and prestressed NSM CFRP rods for flexural strengthening of reinforced concrete (RC) members under monotonic and cyclic loading. The research is comprised of experimental and analytical programs to achieve the following objectives: To investigate the monotonic flexural strength of RC beams strengthened with nonprestressed, and prestressed CFRP rods; To determine the fatigue strength of RC beams strengthened with non-prestressed, and prestressed CFRP rods; To evaluate the transfer length of the prestressed CFRP rod at different levels of prestressing; To develop an analytical model to predict the monotonic flexural response of RC beams, in particular to those that are strengthened with non-prestressed and prestressed NSM CFRP rods; To predict the fatigue life of all beams (control, strengthened with non-prestressed and prestressed NSM CFRP rod beams) at various load ranges by accompanying the strain-life approach with the transfer length mode, and monotonic flexural behaviour model and; To develop a computer program written in the Visual Basic (VB) language using the models developed in this thesis to predict both the flexural behaviour of RC beams strengthened with non-prestressed and prestressed NSM CFRP rods. 3
25 1.3 Thesis Structure The thesis is divided into nine chapters as shown in Figure 1.1. Chapter One provides an introduction, and describes the objectives of this study, and the organization of the thesis. Chapter Two provides background material including information on fibre reinforced polymer (FRP) materials, fatigue of steel, FRP, and concrete. It also presents a survey of the recent available literature on the use of NSM technique to strengthen RC beams under monotonic and fatigue loadings for the non-prestressed and prestressed FRP reinforcement. Chapter Three describes the experimental program, specimen fabrication, test instrumentation, prestressing and loading test set-up. The monitoring of the prestressing process and the experimental estimation of the transfer length of the prestressed CFRP rod are presented in Chapter Four. It also includes a proposed model based on shear lag theory to predict the prestressing force along the prestressed CFRP rod. Chapter Five discusses the results obtained from testing the reinforced concrete (RC) beams (control and strengthened) under monotonic loading. In Chapter Six, a discussion of the results obtained from testing the RC beams under cyclic loading and their behaviour is provided. An analytical model that predicts the flexural response of the RC beams (non-strengthened and strengthened) is presented in Chapter Seven. Chapter Eight presents an analytical model that predicts the fatigue life of RC beams using strain-life approach (fatigue analysis) accompanied with the monotonic flexural model. Conclusions, recommendations, and future work are provided in Chapter Nine. 4
26 Thesis Chapter 1 Chapter 2 Chapter 3 Chapter 4 Chapter 5 Chapter 6 Chapter 7 Chapter 8 5 Introduction Background and Literature Experimental Program Monitoring of prestressing and Transfer Length Monotonic Test Results Fatigue Test Results Monotonic Flexural Model Fatigue Life Model Chapter 9 Conclusions, Recommendations and Future Work Figure 1.1: Thesis structure 1
27 Chapter 2 Background and Literature Review Several strengthening methods have been used to rehabilitate RC structures (i.e. enlarging the member s cross section, adding steel or FRP plate to the tension face, and externally posttensioning for RC beams). Using these methods has shown an improvement in the flexural behaviour of the up-graded RC beam, but with some limitations on their use. Enlarging the cross section of the concrete member may be limited by a lack of available space. Also, it increases the dead load on the structure. Using steel plates for flexural strengthening gives an increase in strength, even-though, it adds more dead load onto the structure (Lerchental, 197; Kajfasz et al., 197; Swamy et al., 1987; Jones et al., 1988; Oehlers, 1992). A disadvantage of exposed steel reinforcement in case of using externally bonded steel plate is that in time, it may corrode. In case of externally post-tensioning application, the strengthening materials (steel) are usually exposed to the environmental exposure, therefore a protection is needed. Fibre reinforced polymers (FRP) are the best alternative and more attractive than the previously mentioned types of strengthening due to their light-weight, chemically resistance and high fatigue strength and ease of application (ISIS, 21). 2.1 Fibre Reinforced Polymers (FRP s) Fibre reinforced polymers (FRP s) are composite materials that consist of two components: fibres and matrix as shown in Figure 2.1 (Gibson, 1994). The properties of the FRP materials are mainly determined by the choice of fibres and their volume fraction. In civil engineering 6

. Fibres Matrix Figure 2.1: Components of composite materials Figure 2.")
28 applications, three types of fibres are commonly used namely, Aramid (AFRP), Glass (GFRP), and Carbon (CFRP) (ISIS, 21; ACI Committee 44R, 1996). They generally have a higher ultimate strength than that of the conventional reinforcing steel, and exhibit linear-elastic behaviour until they fail by rupture (sudden failure). The stress-strain behaviour of the three types of fibres is presented in Figure 2.2 in comparison with a reinforcing steel bar and a steel tendon (ACI Committee 44R, 1996). Fibres Matrix Figure 2.1: Components of composite materials Figure 2.2: Stress-strain relationships for different fibres and steel (ACI committee 44R, 1996) 7
29 2.1.1 Fibres Carbon fibres have superior strength compared to others (aramid and glass) as shown in Table 2.1. Fibres function as load carrying components in the FRP composites and provide a tensile strength, that basically depends on three factors: the type of fibres (carbon, glass, and aramid), the amount of fibres (volume fraction), and the orientation of the fibres (, 45, 9 ). Table 2-1: Mechanical properties of different FRP s (ISIS Canada, 21) Material Modulus of Elasticity (GPa) Ultimate Elongation (%) CFRP GFRP AFRP Matrix A matrix is usually a polymer in the composite that binds the fibres together. It is function in the composite material is to transfer the load to the fibres, and to protect the fibres from mechanical and environmental damage (Jones, 1999). It is important to emphasize that the matrix should have a higher strain to fracture than the fibres (Figure 2.3). If not, the matrix will crack before the fibres fail resulting in un-protected fibres. Two main types of matrix, polyester and epoxy, are used. Their mechanical properties are given in Table
30 Fibre Tensile Stress Fibre Composite Resin Strain Figure 2.3: Tensile stress-strain relationships for the composite FRP and its components (reproduced from ACI committee 44R, 1996) Table 2-2: Mechanical properties of matrices (ACI committee 44R, 1996) Tensile Tensile Density Ultimate Material Strength Modulus (kg/m 3 ) strain (MPa) (GPa) (%) Polyester Epoxy Strengthening of RC Structures Over the last decades, traffic loads on infrastructures such as bridges have become heavier and more frequent. It is expected that this tendency will continue. Also, our knowledge of the structural behaviour has increased and led to an awareness that some existing structures are overloaded. Impact loads due to accidents can damage bridges leading to a deficiency in structural capacity that may not be able to carry the existing service load. Moreover, 9
31 sometimes, mistakes or construction errors may result in an inadequate load carrying capacity in the structure. For example in the USA, approximately 3% of the bridges (6, bridges) are deficient in load carrying capacity and require strengthening (Xanthakos, 1996; Mallet, 1994; and Norris et al., 1997). The reasons for structural deficiency are graphically illustrated as shown in Figure 2.4. Structure Capacity Strengthening Minimum design load Current capacity Structure Capacity Impact load Strengthening Minimum design load Structure Capacity Minimum design load Strengthening New Minimum design load time time time Construction Fault Impact Load Increased Demand Figure 2.4: Necessity of concrete structure strengthening To overcome these deficiencies in the structural performance, and to maintain these infrastructures under service, structural upgrading is needed. Using FRP materials to strengthen RC structures is one of the methods used lately, and it can be applied as externally bonded or near surface mounted with non-prestressed or prestressed FRP reinforcement. North American guidelines and codes are available and address the design and specifications for using FRP to strengthen RC structures (ACI committee 44R, 1996; CSA S-86, 22; CSA S6, 26; 22; ISIS, 21). 1
32 2.3 Strengthening of RC Beams with Non-prestressed FRP Reinforcement Strengthening of RC beams has been intensively investigated during the last two decades using FRP materials with their various forms (sheet/strip/rod). They have been either externally bonded or embedded near the surface of a beam. Most of the researchers investigating the strengthening of RC structures have rehabilitated concrete members using non-prestressed FRP strips/laminates. Summary of most test results found in the literature using FRP material (externally/near surface bonded) for strengthening RC beams is presented in the following sub-sections Externally Bonded FRP (EB FRP) The use of FRP for strengthening RC structures has been studied by numerous researchers since 197 (ISIS, 21). Saadatmanesh and Ehsani (1989) studied the effect of using different areas of glass FRP (GFRP) on flexural strengthening. The test results showed that flexural strength increased with increasing area of the GFRP sheets. McKenna (1993) investigated the use of CFRP and GFRP to strengthen reinforced concrete beams under monotonic loading. All beams were monotonically loaded. Their test results showed that a significant increase in the flexural capacity of the strengthened RC beams was observed. Triantafillou and Pleveris (1992) performed an analytical study to predict modes of failure of RC beams strengthened with FRP sheets under static loads. The results of their model were later supported by testing a series of RC beams. They found that de-bonding of FRP limited the number of FRP layers that could be used. 11
33 Hutchinson and Rahimi (1993) tested thirty 2.1 m long RC beams under monotonic loading to investigate the changes in flexural behaviour when the beams were strengthened with GFRP and CFRP sheets. Various variables were studied including FRP type and thickness. Their experimental results showed that using either GFRP or CFRP remarkably increased the flexural capacity of their RC beams. Spadea et al. (21) investigated the strength and ductility of RC beams repaired with bonded CFRP laminates. Various CFRP layouts were studied including an external bonded CFRP plate, with external anchorages and with modified external anchorages (bonding CFRP plates on the CFRP U-wrap on the side of the beam). It was found that bonding an external CFRP plate to strengthen the RC beams increased the flexural strength but at the expense of ductility (reduction in ductility). They also concluded that the ductility were consistent, close, and similar for a range of RC beams strengthened with EB CFRP plate with and without external anchorages. Brena et al. (23) studied the increase in the flexural capacity of RC beams strengthened with CFRP composites. Four different layouts were investigated: bonded CFRP laminates on the soffit of the beams with and without CFRP U-wraps and CFRP composites bonded on each side of the beams within the tension zone with and without CFRP U-wraps. All the strengthened beams exhibited a stiffer behaviour than their companion control beams. They also showed a higher ultimate load compared to the control beams. Providing CFRP U-wrap was able to delay or prevent the de-bonding of the flexural CFRP composite sheet. 12
34 Alagusundaramoorthy et al. (23) studied the flexural behaviour of RC beams strengthened with CFRP sheets or fabric with and without anchorages. Two types of CFRP materials (pultruded / fabric) were investigated. Two amounts (16.4 mm 2 and mm 2 ) of pultruded CFRP area were considered. It was reported that the increase was 49% and 4% for strengthened beams with CFRP sheet and fabric respectively. A 58% increase was achieved when anchorages were used Near Surface Mounted FRP (NSM FRP) Using FRP as a near surface mounted technique was studied by De Lorenzis et al. (2). Both shear and flexural strengthening were investigated. Their test results showed that for flexurally strengthened RC beams, an increase of 44% of the ultimate strength was achieved compared to the capacity of the control beam. Hassan and Rizkalla (22, 23) investigated the feasibility of using different strengthening systems as well as different types of FRP for flexural strengthening of large scale prestressed concrete beams. The test results showed that the use of NSM FRP was feasible and cost effective for strengthening concrete bridge members. Yost et al. (24) studied the structural performance of retrofitted concrete flexural members using a near surface mounted CFRP method. They reported an increase of 3% and 78% in the yield load and ultimate strength compared to the values for the control beam, respectively. They also found that the bond strengths between the CFRP reinforcement, the 13
35 epoxy and the adjacent concrete were adequate to develop the full tensile capacity of the CFRP reinforcement. El-Hacha et al. (24) investigated the feasibility of using near surface mounted CFRP strengthening on RC beams. They reported that a full composite action between the NSM strips and the concrete was achieved. An increase in the flexural capacity of the strengthened RC beams was observed. El-Hacha and Rizkalla (24) also conducted a study on the flexural strengthening of RC beams using NSM FRP technique. Various variables were examined: number of the FRP rod/strip, form of FRP: strip/rod and type of FRP: glass and carbon. They found in their study that using NSM reinforcement for flexural strengthening with CFRP strip had a higher load carrying capacity than those of the CFRP rod for the same axial stiffness. Such result was explained as a possibility of an early de-bonding that occurred between the CFRP rod and epoxy interface. Barros and Fortes (25) and Barros et al. (26) investigated the effectiveness of CFRP laminates as a NSM for structural strengthening. They examined different variables which are number of CFRP laminate, different steel reinforcement ratios, and different depths of the cross-section. It was found that an increase of 91% as an average was obtained. It is also reported that a high deformability of the strengthened RC beams was assured and an increase in the rigidity of the beam of 28% corresponding to the serviceability limit state analysis. 14
36 Jung et al. (26) performed an experimental investigation on the flexural behaviour of RC beams strengthened with NSM CFRP reinforcement. Two amounts of CFRP strip were examined, namely 21mm 2 and 35mm 2. They reported that the NSM strengthened specimens utilized the CFRP reinforcement more efficiently than those of externally bonded strengthened beams. An analytical evaluation of RC beams strengthened with NSM strips was presented by Kang et al. (26). The study focused on the relation between the ultimate strength and the depth of the NSM groove size and the spacing between the CFRP strips. They concluded that the minimum spacing between the NSM groove (for multiple number of CFRP strips) and from the edge of the beam should exceed 4 mm to ensure that each CFRP strips behaved independently. Aidoo et al. (26) conducted a full-scale experimental investigation on repairing of RC interstate bridge using CFRP materials. Three types of strengthening methods were investigated: externally bonded, NSM, and powder actuated fasteners. All methods showed an increase in the load-carrying capacity of the girders. They reported that in particular, the externally bonded and NSM CFRP methods behaved better than the powder actuated fastener method, although the NSM showed a significantly higher ductility and was explained to be due to the better bond chrematistics. 15
37 2.4 Strengthening of RC Beams with Prestressed FRP Reinforcement Prestressing of the strengthening FRP materials has many advantages. It provides a better utilization of the FRP reinforcement, reduces the stress in the internal steel reinforcement, and increases the yield load of a beam. It also decreases the crack width size and the mean crack spacing resulting in more durable structures. Several studies have shown an increase in the yield load of 5% compared to un-strengthened beams and up to 25% compared to beams strengthened with non-prestressed strengthening materials (Wight, 1998; Nordin et al., 21). Figure 2.5 shows behaviour typical of RC beams strengthened with non-prestressed and prestressed strengthening CFRP rods (Nordin et al., 21). As shown, the cracking loads of the control and non-prestressed strengthened beams are at almost the same load level, which for prestressed strengthened beams, there is a noticeable increase in the cracking load level compared to the other two beams (Region A). The yield load for the non-prestressed strengthened beam has a higher level of load than that of the control beam. When the strengthening materials are prestressed, the enhancement in the yield load is almost double the enhancement obtained by non-prestressed CFRP rods (Region B). 16
38 Figure 2.5: RC beams strengthened with FRP Reinforcement: a) control, b) strengthened with non-prestressed FRP, c) strengthened with prestressed FRP (Nordin et al., 21) Externally Bonded Prestressed FRP (EB FRP) Reinforcement Strengthening of RC structures with prestressed FRP materials under monotonic loading has been investigated by number of researchers. Usually, three modes of failure are expected in RC beams strengthened with externally prestressed bonded FRP materials: a crushing of the concrete, a rupture of the FRP, or de-bonding of FRP resulting in a sudden drop in the load that constitutes a brittle failure regardless if the tension steel reinforcement has yielded or not (Meier and Kaiser, 1991; Meier et al., 1992; Gorden and Hollaway, 1998). Triantafillou and Deskovic (1991) reported an analysis of the problem of providing the maximum achievable prestress level without experiencing a de-bonding failure in the end zone. They found that a higher prestress level can be achieved by increasing the length of bond. It was also concluded that for prestressed FRP strengthened RC beams, an additional 17
39 mechanical anchor at the ends would increase the potential of using prestressing technique for externally bonded FRP materials. Later, Triantafillou et al. (1992) verified their analytical model by performing an experimental test. A reasonable agreement was achieved between their model and the obtained experimental results. It was also found that excellent flexural behaviour was obtained in terms of strength, stiffness, and ductility. A similar study was conducted by Quantrill and Hollaway (1998). Two different span lengths (1. m and 2.3 m) of RC beams were studied with two levels of prestressed CFRP plate (ranging from 17.5% % of the CFRP plate tensile strength). The losses after prestressing were monitored and the lengths over which the force was transferred to the CFRP plate were found to be 15mm and 2mm for 1. m and 2.3 m span beams, respectively. Prestressing the plate before bonding it to the beam increased the flexural stiffness, the cracking, the yield and the ultimate loads. The results also showed that a beam strengthened with prestressed CFRP plate exhibited a similar or slightly increased level of ductility compared to non-prestressed strengthened beams. This conclusion might be dependant on the type of failure. Wight et al. (21) studied the flexural strengthening of RC beams using prestressed sheets mechanically anchored at the ends. A prestressing level of 2MPa in the CFRP sheet was examined. They reported that prestressing of CFRP sheets to strengthen RC structures was an effective and practical method. It was also concluded that prestressed CFRP sheets could 18
40 remarkably improve the serviceability of reinforced concrete structures. For a further research, it was recommended that a higher prestressing level needs to be investigated. Huang et al. (25) performed a study to evaluate the effectiveness of using GFRP sheet (nonprestressed and prestressed) to strengthen two types of RC beams: tee and inverted tee section. Based on their test results, it was concluded that using GFRP sheet for strengthening RC beams increased the flexural performance. An outstanding enhancement in the flexural behaviour was obtained for beams strengthened with prestressed GFRP sheet in terms of the ultimate strength and deflection Near Surface Mounted FRP (NSM FRP) The use of prestressed NSM FRP to strengthen RC beams under static loadings was examined by Nordin and Täljsten (26). Fifteen full-scale RC beams (4mm 2mm 3mm) were tested. Different bonded lengths and two type of CFRP (a medium modulus of elasticity: 16GPa and a high modulus of elasticity: 25GPa) were investigated. Figure 2.6 shows their test results in terms of the load versus mid-span deflection. It was found that using prestressed quadratic CFRP rods increased the cracking, yield and ultimate loads of the strengthened beams with respect to the reference beam. Based on their monotonic test results, they concluded that the fatigue life of RC beams strengthened with prestressed NSM CFRP material might be improved (no fatigue experimental tests were conducted). Also, they concluded that, the combination of a higher cracking load and smaller crack widths would enhance the durability of the structure. Furthermore, the force transfer between the 19
41 structure and CFRP rod worked well in the laboratory conditions without a need for a mechanical anchor device. The losses in strain (stress) ranged from % at the centre and % at the ends. According to the author s knowledge, this is the only study that was carried out to assess and evaluate the strengthening of RC beams using prestressed FRP materials as NSM technique. Figure 2.6: Load-deflection of test results, non-prestressed and prestressed beams, (Nordin and Taljsten, 26) 2.5 Fatigue It has been recognized for years that a metal when subjected to a repeated load (repeated stresses) will fail at a stress much lower than that required to cause rupture by a single application of the load. This fatigue failure occurs by a sudden rupture of a metal that in most cases occurs without warning. Fatigue failure is often accompanied by a fracture surface that shows two kinds of surface: one smooth and the other rough as shown in Figure 2.7. The smooth surface is caused by rubbing of the crack faces during crack propagation, while the 2

42 rough surface is produced during a ductile failure when the cross section of the member is no longer able to carry the applied load. The progress of the fracture is sometimes indicated by a series of rings also called beach marks that progress inward from the point of fatigue crack initiation. Rough surface Smooth surface Figure 2.7: Fatigue failure in a reinforcing steel bar (Badawi and Soudki, 26) Fig 2.8 shows a stress versus time plot for a fatigue test together with definitions of some of the terms used in the analysis of the fatigue data. The terms defined are stress ratio, alternating, maximum, minimum, and mean stress. Results of fatigue tests are often plotted as a S-N curve. The S-N curve plots stress versus number of cycles to failure on logarithmic scales as shown in Figure 2.9. The value at which the curve becomes horizontal is taken to be the endurance limit (the maximum stress, which can be applied over an infinite number of cycles without a fatigue failure occurrence) for ferrous alloys. The endurance limits for steels are typically in the range of 35% to 6% of the tensile strength. 21
43 Figure 2.8: Fatigue terms used in the analysis Figure 2.9: S-N curve for ferrous alloys Steel The fatigue strength of reinforcing steel is affected by a combination of geometry and bar size. The deformations on the reinforcing bars that provide the bond between the reinforcing steel and concrete act as stress raisers with a stress concentration factor (Kt), which is the ratio of 22
44 the maximum stress to the average stress, and is greater than one. The value of the stress concentration depends on the geometry of the structure at the lugs: the more abrupt the transition in cross section at the lugs, the higher the local stress, and the higher the value of the (Kt). For instance, for ribs those have a smaller angle with respect to the axis of the reinforcing bar, they have a higher fatigue life for a given nominal stress. The increase in the local stress causes a reduction in the fatigue strength of the structure (Bannantine et al., 199). Typical values of the stress concentration factor for reinforcing bar fall between 1.5 and 2. based on the recommendation given by the American Concrete Institute (ACI committee 215, 1996). The fatigue life of a reinforcing bar is also affected by the size of the reinforcing steel diameter. A larger bar diameter is associated with a lower fatigue life. This phenomenon is partly due to a higher probability of having larger flaws in the larger diameter bars than those of the smaller ones because of their greater volume and partly because the lug geometries used in the bar changes with size and produces increased stress concentrations (Bannantine et al., 199). There is an effect of mean stress, the average of the maximum and minimum stress of the repeated load, on fatigue strength. Figure 2.1 gives an example of the effect of mean stress on the fatigue life of steel. As the mean stress increases, the fatigue life of steel decreases (Tilly and Tan, 1979). 23
45 Figure 2.1: Effect of mean stress on the fatigue life of the steel (Tilly and Tan, 1979) The increase in fatigue damage with stress cycling in a metal is sometimes divided into three stages. The first stage termed initiation consists of the formation and growth of a small fatigue crack to some chosen size. Often, this size is taken to be the crack size of which fatigue test coupons fail. The second stage consists of the subsequent propagation of the crack to the size at which failure occurs. The last stage is complete rupture of a component. Each of these stages is illustrated on a stress amplitude versus cycles graph in Figure Fatigue cracks in smooth samples usually starts at a small discontinuity such as a grain boundary inclusion, an impurity, or a slip band notch. The crack then continuously extends with cycles of the repeated load. Initial crack growth in uni-axial fatigue is usually on the plane of maximum shear stress range followed by a change to the plane of maximum tensile stress range. The crack grows until the cross section of the steel component becomes too small to carry the applied load and fast fracture takes place. 24
46 Figure 2.11: Fatigue damage stages of steel (Bannantine et al., 199) Concrete Plain concrete can fail at stress levels less than its static ultimate strength when subjected to repeated loading. The normalized fatigue strength of a specimen for a given number of cycles is defined as the fraction of the static strength that can be supported repeatedly for that number of cycles (ACI committee 215, 1996). A number of factors affect the fatigue life of concrete including the range of stress, the rate of loading, the stress gradient, and the load history. Concrete usually shows a softening in its stress-strain behaviour under repeated loading as it is shown in Figure In concrete, a modified Goodman chart, which relates the stress range and mean stress applied to concrete for various values of fatigue life as shown in Figure 2.13 is used to predict the fatigue life. The maximum stress corresponding to a given fatigue life and minimum stress is given. In concrete, the fatigue damage may be divided into three phases in terms of increasing maximum strain. In the first stage, which is called the initiation phase, the strain increases rapidly, but at a progressively decreasing rate, with increasing number of cycles. The second 25
47 phase is defined as the stability state phase. The strain increases linearly with increasing number of cycles. The last phase represents instability; strain increases at a progressively increasing rate until failure occurs. Figure 2.14 shows an example of a plot of the relationship between the maximum strain versus the relative number of cycles representing the three stages of the fatigue damage in concrete (Neville, 1996). Figure 2.12: Stress-strain curves for concrete under repeated compressive load (Neville, 1996) Figure 2.13: Modified Goodman Chart for fatigue life of concrete (Neville, 1996) 26
48 Figure 2.14: Relationship between the maximum strain and relative number of cycles of concrete under compressive cyclic loading (Neville, 1996) Fibre Reinforced Polymer (FRP) FRP materials generally exhibit a good fatigue resistance, in particular for high modulus fibres such as aramid and carbon (ACI committee 44R, 1996). The high modulus FRP materials have a better fatigue resistance than reinforcing steel for a repeated load of 1 millions cycles (Schwarz, 1992). A study conducted by Gorty (1994) showed that CFRP rods exhibited a better fatigue resistance than that of the steel. It was also found that the modulus of elasticity of the CFRP rod did not change when the material was subjected to cyclic loading. The fatigue failure mechanism in FRP materials is different from that of steel or concrete. Usually, four phases occur before FRP fails in fatigue. The first phase is cracking of the matrix followed by interfacial de-bonding. Then, a delamination between the fibres and matrix occurs. Finally, a FRP composite fails after sufficient fibres breaking causing the remaining fibres to fail in tension. The fatigue damage phases of the composite materials are illustrated in Figure
49 Figure 2.15: Fatigue damage phases in composite materials Fatigue Behaviour of RC Beams Normally, reinforced concrete beams are designed to be under-reinforced in flexure resulting in yielding of the reinforcing steel followed by a compressive crushing of the concrete. The fatigue life of these beams is usually controlled by the fatigue life of the reinforcing steel as reported by ACI Committee 215 (1996). Therefore, the failure mode of an under-reinforced concrete beam subjected to cyclic load is by fracture of the tension reinforcement. Tilly and Tan (1979) conducted a study to investigate the fatigue performance of a reinforcing bar under two environmental conditions, uni-axially loaded in air and loaded in flexure 28
50 where the bar was embedded in concrete. It was found that the difference in the fatigue life at a given stress between the two types of tests was small. Bishara (1982) studied the behaviour of reinforced concrete beams under fatigue loads. He found that cyclic loading caused an increase in the measured steel strain at the locations of the flexural cracks of 7%. He also noted that the flexural rigidity of the beams was slightly reduced as a result of an observable increase in the deflection that accompanied concrete softening. The fatigue behaviour of RC beams was also studied by Heffernan (1997) and Heffernan and Erki (24). They found that an increase of 2% to 6% in the tensile stress of the reinforcing bars that was attributed to softening of concrete, which occurred in beams subjected to cyclic load Fatigue Behaviour of RC Beams Strengthened with FRP Reinforcement There has been a considerable amount of research on the flexural fatigue behaviour of RC beams strengthened with non-prestressed FRP reinforcement (Barnes and Mays, 1999; Rosenboom et al., 24; Gheroghiu et al., 26) Shahawy and Beitelman (1999) studied the effect of using different numbers of CFRP laminate layers on the fatigue behaviour of strengthened RC beams. It was found that using three layers of CFRP laminates resulted in a greater flexural rigidity of the strengthened 29
51 beams compared to that of the beams strengthened with only two layers of CFRP laminate (Figure 2.16). Christos et al. (21) performed a study to examine the effects on the fatigue performance of reinforced concrete beams of adding GFRP composite reinforcement. Seventeen RC beams were tested; nine of them were strengthened with GFRP materials. Their fatigue test results are shown in Figure In all the fatigue specimens, a failure was initiated by a failure in fatigue of the reinforcing steel. De-bonding of the GFRP gave rise to a secondary failure mechanism. As shown in Figure 2.17, the fatigue strength of the strengthened RC beams was greater than that of the non-strengthened beams at all fatigue lives. The authors stated that for a given applied stress range in the reinforcing steel; the fatigue life for strengthened and non-strengthened beams was the same. 3

52 Figure 2.16: Effect of layers on the flexural fatigue behaviour of strengthened RC beams, left: two layers, right: three layers (Shahawy and Beitelman,1999) Figure 2.17: Fatigue life of the non-strengthened and strengthened beams with GFRP (Christos et al., 21) 31
53 Aidoo et al. (24) studied the fatigue behaviour of a large-scale reinforced concrete bridge girder strengthened with two CFRP composite materials. The two types of CFRP materials were CFRP plate applied to the beam using an epoxy based adhesive and CFRP fabric applied using an epoxy-based adhesive by a hand lay-up procedure. It was found that the fatigue behaviour of the strengthened beams was controlled by the reinforcing steel. It was also concluded that the fatigue life of the RC beams was increased by the application of FRP strengthening (Figure 2.18) due to a reduction in the tensile stress carried by the steel. They also stated that the observed increase in the fatigue life was dependant on the quality of the bond between the concrete and the composite materials. The CFRP plate retrofit showed a better response under fatigue conditions than did the fabric retrofit. Figure 2.18: The S-N curve (Aidoo et al., 24) In another study, Aidoo et al. (24) carried out a study to investigate the behaviour of RC bridge girders retrofit with CFRP materials under cyclic loading. Three different methods of 32
54 strengthening were studied: a conventional adhesive applied CFRP, NSN CFRP and a proprietary CFRP retrofit using powder actuated fasteners. They concluded in their study that in the first type of strengthening methods, the bond strength was maintained under fatigue loading. A similar study was conducted by Quattlebaum et al. (24) using the same methods of CFRP strengthening. Based on their test results, it was found that all the strengthening methods increased the strength over that of the control beam. It was also observed that the NSM method of strengthening showed a moderately ductile behaviour (ductility index of 1.9). All the strengthened beams experienced degradation in the bond under cyclic loading. Brena et al. (25) preformed a study on the fatigue behaviour of RC beams strengthened with CFRP sheets. Two types of strengthening configurations were investigated in their study. One group of specimens was strengthened with unidirectional carbon fibre sheets bonded onto the tension face of the beam with epoxy resin on-site and a second group was strengthened with pultruded CFRP plate bonded onto the sides of the beam near the tension face. Some of the beams were subjected to overloading before strengthening. They found that the overloaded beams strengthened with pultruded plates failed by fatigue de-bonding along the interface between the concrete and plate. It was also found that the maximum stress in the CFRP plate ranged from 5~15% of the plate s ultimate stress. It is worth noting that these values are considerably lower than the limit provided by the ACI 44 design guide (ACI Committee 44R, 1996). 33
55 Another study was conducted by Ekenel et al. (26) to assess the effect of fatigue loading on the flexural performance of RC beams strengthened with FRP fabric. Various FRP products and anchorages were investigated, namely CFRP fabric bonded by epoxy with and without anchor spikes, and CFRP pre-cured laminates bonded with epoxy that had a wedge anchor. They found that FRP strengthening increased the fatigue life of the beams by decreasing the stress in the reinforcing steel and reducing the crack propagation rate. The change in the flexural stiffness at 2 million cycles was almost the same for all the beams - a reduction of about 15% compared to the stiffness during the initial cycle. Carolin et al. (25) carried out a study to investigate the effect of strengthening RC beams with CFRP plate and NSM during static and cyclic loading. Their test results showed that the cyclic load did not significantly affect the strengthening. They also concluded that using a cementatious bonding agent together with NSM performed well when it cured under static conditions. A study on the fatigue behaviour of RC beams strengthened with GFRP s was conducted by Catalin (26). Two levels of cyclic loading was investigated namely, low (15%-35% of the yield load) and high level (35%-75% of the yield load) of cyclic loading. They concluded that the stiffness of the beams deteriorated rapidly in the case of high level cycling. It was also reported that the CFRP-concrete interface degraded more for the high level than for the load level of cycled beams. 34
56 Toutanji et al. (26) studied the cyclic behaviour of RC beams strengthened with CFRP sheets bonded by inorganic matrix. The beams were tested under different levels of fatigue loadings. They concluded that the fatigue failure occurred by steel breaking first and then followed by a rupture in the CFRP sheet. They also stated that by using CFRP sheets for strengthening, the fatigue live significantly increased by 55%. A recent study was carried out by Rosenboom and Rizkalla (26) on the behaviour of prestressed concrete strengthened with various CFRP systems under fatigue loadings. Six strengthening systems were examined: 1 CFRP bar NSM, 2 CFRP strip NSM, 1 CFRP strip externally bonded, 3, 4, and 5 plies of externally bonded CFRP sheets. Based on their test results, it was concluded that strengthening using CFRP materials could reduce the stress ratio in the prestressing strands due to their effectiveness in controlling crack widths, and due to the enhancement of overall stiffness. They also stated in their conclusion that the deterioration of the bond between the CFRP pre-cured laminates and concrete during fatigue loading was a concern, and it needed further research. The summary of most studies conducted on using CFRP reinforcement for strengthening of RC beams under monotonic and fatigue loadings is given in Table 2.3 and 2.4. These tables show the significance of the current research to investigate the monotonic and fatigue behaviour of both non-prestressed and prestressed strengthened beams. 35
57 Table 2-3: A summary of researches conducted on strengthening RC beams under monotonic loading Researchers Year Comment FRP Application (EB,NSM) Non-prestressed Prestressed Saadamanesh and Ehasani 199 Different amount of GFRP EB Non-prestressed Triantafillou and Plevris 1992 Prediction of modes of failure EB Non-prestressed Hutchinson and Rahimi 1993 Different types of FRP EB Non-prestressed Spadea et al. 21 Different CFRP layouts in terms of external CFRP anchorages EB Non-prestressed Bener et al. 23 Different CFRP layouts (on the soffit and on the side of the RC beams) EB Non-prestressed Alagusundaramoorthy et al. 23 two types of CFRP (pultruded/sheet), two amounts of CFRP with and without anchorages EB Non-prestressed Triantafillou and Deskovic 1991 Study the maximum prestressing level before debonding failure EB Prestressed Triantafillou et al Effect of strengthening EB Prestressed Jerrett et al Different amount of prestressed CFRP EB Prestressed Quontrillou and Hollaway 1998 Different span lengths, two levels of prestressing (17.5%-41.7%) EB Prestressed Wight et al. 21 Multiple layers of prestressed CFRP sheets (2MPa prestressed level) EB Prestressed Hung et al. 25 Two types of RC beams (T and inverted T section) EB Prestressed De Lorenis et al. 2 Effect of strengthening NSM Non-prestressed Hassan and Rizkalla 22 Different strengthening methods, different types of FRP NSM Non-prestressed Yost et al. 24 Effect of strengthening NSM Non-prestressed El-Hacha et al. 24 Feasibility of using NSM strengthening NSM Non-prestressed El-Hacha and Rizkalla 24 No. of FRP, type of FRP, form of FRP NSM Non-prestressed Barros and Fortes 24 No of FRP, steel reinforcement ratio, depth of the beam NSM Non-prestressed Jung et al. 25 Area of FRP NSM Non-prestressed Aidoo et al. 26 Effect of strengthening NSM Non-prestressed Nordin et al. 25 Different prestressing levels (Max of 27%) NSM Prestressed Badawi and Soudki 26 Two levels of prestressing (4% and 5%) NSM Prestressed 36
58 Table 2-4: A summary of researches conducted on strengthening RC beams under fatigue loadings Researchers Year Comment FRP Application (EB,NSM) Non-prestressed Prestressed Different No. of FRP laminate layers, different Heffernan 1997 EB Non-prestressed fatigue loadings Shahawy and 1999 Different No. of FRP laminate layers EB Non-prestressed Beitelman Christos et al. 21 Study the fatigue life EB Non-prestressed Aidoo et al. 24 Two strengthening systems (CFRP plate and CFRP sheet) EB Non-prestressed Quattlebaum et al. 24 Different strengthening systems EB Non-prestressed Carolin et al. 25 Effect of cyclic loading on the CFRP strengthening EB Non-prestressed Brena et al. 25 Two strengthening systems (CFRP plate and CFRP sheet) EB Non-prestressed Ekenel et al. 26 Different FRP products, different types of anchorage EB Non-prestressed Catalin 26 Two different levels of cyclic loading EB Non-prestressed Toutanji et al. 26 Different levels of fatigue loading EB Non-prestressed Rosenboom and Rizkalla 26 Different strengthening systems EB Non-prestressed Aidoo et al. 24 Different strengthening systems NSM Non-prestressed Quattlebaum et al. 24 Different strengthening systems NSM Non-prestressed Rosenboom and Rizkalla 26 Different strengthening systems NSM Non-prestressed Badawi and Soudki 26 Analytical prediction of fatigue life NSM Prestressed 37
59 Chapter 3 Experimental Program The experimental program consisted of twenty-two RC beams. The RC beams were divided into four groups, a control group, a non-prestressed strengthened group, and two groups strengthened by CFRP rods to 4%, and 6% of their ultimate static strength. In this chapter, a description of the test specimen and its different fabrication stages, the procedure used to strengthen the RC beams (non-prestressed and prestressed CFRP rod); the instrumentations and the test-up are provided. 3.1 Test Matrix Twenty-two RC beams were fabricated and tested based on the test matrix given in Table 3.1. The beams were divided into four groups: control beams, non-prestressed strengthened beams, 4% prestressed strengthened beams, 6% prestressed strengthened beams (the percentage of prestressing represents the percentage of the ultimate static capacity of the CFRP rod). Each group had a specimen that was monotonically loaded to failure, while the other four beams from each group were subjected to repeated fatigue loads. Group D included 6 beams tested under fatigue loads in addition to the monotonic beam. To study the effect of the prestressing level, two additional beams were tested at 3% and 5% prestress level, and their results are provided in Appendix A. 38
60 For the fatigue specimens, the minimum loads given in Table 3.1 are equal to 1% of the ultimate strength of the control beams. This minimum level of loading was kept constant for all beams. The main purpose of maintaining the same minimum level of loading is to represent the dead load on the structure, which would usually be the same for both the control and strengthened beams (no dead load would be added to the structure due to the CFRP rods used in the strengthening of the RC beams). The maximum loads were chosen to achieve fatigue lives ranging between 3, and 1,, cycles (taken as a run-out limit). Table 3-1: Test matrix of the experimental program GROUP DESCRIPTION LOADING MIN LOAD * (%) MAX LOAD (%) A B C D Control Beams Non-Prestressed Beams 4% Prestressed Beams 6% Prestressed Beams Monotonic - - Fatigue 1 55 Fatigue 1 65 Fatigue 1 75 Fatigue 1 8 Monotonic - - Fatigue Fatigue Fatigue Fatigue Monotonic - - Fatigue Fatigue Fatigue Fatigue Monotonic - - Fatigue Fatigue Fatigue Fatigue Fatigue Fatigue * A percentage of the ultimate static capacity of the beam that is equivalent to 6.5kN 39
61 3.2 Specimen Design Configurations The specimen dimensions are shown in Figure 3.1. It had a total length of 35 mm with a clear span of 33 mm. The dimensions of the cross section were 152 mm wide by 254 mm deep. They were reinforced with 2 No. 15M rebars as tension reinforcement and 2 No. 1M as compression reinforcement. 8 mm 75mm No.1M No.15M Note: all dimensions in mm Figure 3.1: Dimensions and steel reinforcement details of the RC beams A typical concrete cover of 3 mm was used. Enough shear reinforcement was provided in an amount calculated to ensure that the beams would fail in flexure, however as it will be seen, additional reinforcement had to be added later. Eight millimetres stirrups spaced at 75 mm centre to centre were used. For the strengthened beams, a groove of mm was cut into the bottom face of beams to allow the placement of the CFRP rod in the beams as near surface 4
62 mounted (NSM) reinforcement. The CFRP strengthening reinforcement was in all cases, one 9.5 mm diameter CFRP rod placed at the centre of the NSM groove. 3.3 Specimen Fabrications Twenty-two steel cages were assembled. To measure the strain in the tension and compression reinforcement during prestressing and loading, four strain gauges were mounted at the mid-span of the beam on each rebar (two on the tension rebars and two on the compression rebars). In order to place the strain gauges, the surface of the reinforcing bar was ground to remove the ribs and to flatten the surface, and was cleaned. After wiring the strain gauges, they were coated with wax to prevent and protect them from damage during the placement of the concrete. Then, the reinforcing steel cages were placed into wooden forms that had been previously prepared and lubricated with oil for easy stripping. A ready mix concrete was poured into the forms. During curing, the RC beams were covered with wetted burlap and plastic sheets for at least seven days. Figure 3.2 provides photographs of different stages of the RC beam fabrication. 41


63 Strain gauges mounted on steel Steel cages inside the form Concrete placing process Concrete curing Figure 3.2: Fabrication process of the RC beams 3.4 Material Properties As previously stated, the materials used in the fabrication of the RC beams were concrete, reinforcing steel, and carbon fibre reinforced polymer rods. Their engineering properties are given in the following sections Concrete Two batches of concrete were used in this study. For the first concrete batch, the 28-day specified strength based on standard (CSA A ) compression test was found to be 4MPa (an average value obtained by testing three cylindrical concrete specimens). The 28- day compressive strength of the second concrete batch was 45MPa. Beams made from the first 42
64 batch of concrete were used for the control and non-prestressed strengthened beams. Beams made using the second batch of concrete were used to fabricate the prestressed strengthened beams. The tensile strengths of the 4MPa and 45MPa concrete were estimated using the equation provided in clause of CSA A standard (24). The calculated values were 3.8 and 4.1 MPa, respectively Steel Reinforcement Three specimens were tested under monotonic loading to failure. The test results showed the average yield stress of the reinforcing steel to be 44MPa with a modulus of elasticity of 19GPa. The ultimate strength was found to be 56MPa. The cyclic and fatigue properties of the reinforcing steel are given in Table 3.2 (Heffernan, 1997). Table 3-2: Fatigue properties of steel reinforcement (Heffernan, 1997) Fatigue property Value Cyclic strength coefficient (k') 99 Cyclic strain hardening (n').1276 Fatigue strength coefficient (σ'f) 848 Fatigue ductility coefficient (ε'f).2393 Fatigue strength exponent (b) -.64 Fatigue ductility exponent (c) Carbon Fibre Reinforced Polymer (CFRP) Rod and Epoxy The mechanical properties of the carbon fibre polymer rods were provided by the manufacturer (Hughes Bros). Based on the data sheet provided, the average ultimate strain obtained by testing eight samples is given as.145 (1.45%), and the modulus of elasticity is 43
65 given as 136 GPa. As discussed in chapter two, the CFRP exhibits a linear elastic behaviour up to failure. Therefore, the ultimate strength of the CFRP rod based on the failure strain would be about 197MPa. Sikadur 3 epoxy was used for bonding. This epoxy was chosen for its excellent engineering properties. It has a high strength and a high modulus. It also has a high creep resistance under long term loads (prestressing application). As provided by the manufacturer, its tensile strength at seven days is 24.8MPa; it has an elongation to failure of 1%, and a modulus of elasticity of 2.69GPa. The bond strength of Sikadur 3 varies based on the curing conditions and the bonded materials. For hardened concrete to hardened concrete after a two-day moist cure, the bond strength is 18.6 MPa, while after a two day dry cure; it is 22 MPa according to ASTM C Strengthening Methods Using NSM Technique Near surface mounted (NSM) FRP is one of the recent strengthening methods used for the rehabilitation of reinforced concrete structures. The structure is strengthened by bonding the FRP to the concrete in a slit (groove). In this study, two types of NSM CFRP strengthening techniques, specifically non-prestressed and prestressed are examined Non-prestressed NSM CFRP Rod Strengthened RC Beams For non-prestressed strengthening, the unstressed CFRP rod was placed into a groove pre-cut into the concrete. The groove was made by making two parallel cuts as deep as the desired 44
66 depth of NSM groove with a diamond concrete saw. Afterwards, the concrete between the two cuts was broken out leaving a rough surface. Then after cleaning the groove, it was half filled with epoxy and the FRP rod was placed and pressed into the centre of the groove. Then, the remaining space in the groove was completely filled with epoxy. The epoxy was levelled with a spatula and cured for at least seven days before testing. Figure 3.3 shows photographs of NSM FRP application process. Making cuts Chopping concrete NSM groove Placing CFRP rod Pressing CFRP rod Levelling epoxy Figure 3.3: NSM CFRP application process Prestressed NSM CFRP Rod Strengthened RC Beams A special prestressing set-up, shown in Figure 3.4, was used that facilitated a safe release of the prestressing force in the rods. A bolted anchor that was developed at the University of Waterloo (Al-Mayah, 24) was used to prestress the CFRP rod. The procedure to embed the 45
67 reinforcing CFRP rod is similar to that used for the non-prestressed strengthened beams, except that the CFRP rod is prestressed to the desired force, before the epoxy is poured and cured. Again, a groove was made in the concrete. Then, the CFRP rod was stressed to the desired force (4% or 6% of its static tension capacity) by means of a hydraulic jack acting on the clamp anchor (1) as shown in Figures 3.4, 3.5, 3.6 and 3.7. Once the desired force was reached, the screw adjustor was tightened to lock the clamp anchor (2). Then, after the groove was completely filled with epoxy, the hydraulic jack was unloaded. At this point, the prestressing force acted against the clamp anchors (2) and (3). The epoxy was allowed to cure for at least six days before the prestressing force was released. Then, the clamp anchors were slowly loosened to give a slow transfer of the force to the beam by the adhesion of the epoxy between CFRP rod and epoxy interface. This technique of strengthening provides stresses on the beams that partially counteract to the stresses eventually obtained from the applied load during testing. Several strain gauges were mounted on the tension and compression reinforcement at the mid-span section and on the CFRP rod at several locations at the ends of the bonded length in the beam to measure the stress distribution along the CFRP rod. Their readings were used to estimate the prestressing force and the transfer length of the prestressed CFRP rod required to develop the full prestressing force in the CFRP rod. Linear variable differential transducers (LVDT s) were used to measure the slip of the CFRP rod that occurred at the time of release of the prestressing force at each end of the beam. In 46
68 releasing the prestressing force, as mentioned earlier, a slow release of the force was obtained by gradually unscrewing the bolts of the clamp anchor. This procedure allows a stable equilibrium of shear stresses between the rod and the surrounding concrete to be reached without a rapid transfer at the free end. The test set-up is shown in Figure 3.8. Bearing Steel Plate CFRP Rod Clamp Anchor (1) Hydraulic Jack Wedge Steel Plate RC Beam Load Cell Clamp Anchor (3) Screw Adjustor Load Cell Clamp Anchor (2) Figure 3.4: A schematic drawing of the set-up of the prestressing system 47


69 Figure 3.5: Photos of the prestressing set-up system 48
70 Steel C- Section Hydraulic Jack Steel C- Section Clamp Anchor Steel Plate CFRP Rod RC Beam Clamp Anchor Hydraulic Jack Screw Adjustor Clamp Anchor Steel Plate Load Cell CFRP Rod Steel C-Section Steel Plate RC Beam Figure 3.6: Live end of the prestressing set-up 49
71 Clamp Anchor Load Cell CFRP Rod Steel Plate RC Beam CFRP Rod Load Cell Clamp Anchor RC Beam Steel Plate Figure 3.7: Dead end of the prestressing set-up 5
72 LVDT Near End Far End Figure 3.8: Photos of the ends of the prestressing set-up Shear Strengthening for the Prestressed Strengthened Beams Due to a premature failure in the bond between the CFRP rod and epoxy under cyclic loading that will be discussed in Chapter 6, an additional shear strengthening was used to ensure a fatigue failure in the tension reinforcement before a fatigue bond failure would occur. The strengthening method was achieved by the use of a CFRP U-wrap at each of the end zones of the beam. Two reasons for using this method of strengthening were: first, that the CFRP provide confinement to help prevent splitting of the concrete, and second to prevent shear cracks near the end of the bonded length of the prestressed CFRP rod so that the bond between the free end and the first shear crack would act as an anchorage for the prestressed CFRP rod. The CFRP U-wrap strengthening scheme used is show in Figure 3.9. A 3 mm wide CFRP sheet was bonded at 1 mm from the location of the support. 51
73 CFRP U-Wrap 25mm 3mm 1mm 35mm Figure 3.9: CFRP U-wrap strengthening for the prestressed strengthened beams 3.6 Test Set-up and Instrumentation Linear variable differential transducers (LVDT s) and strain gauges were used to measure beam deflection and strains (in steel, concrete, and CFRP), respectively. As mentioned previously in Section , four 5 mm strain gauges (12Ω, gauge factor: 2.11) were placed on the reinforcing steel (compression and tension) at the mid-span section to measure the maximum compressive and tensile steel strains. For non-prestressed strengthened beams, an additional strain gauge was mounted on the CFRP rod at the mid-span section. Another strain gauge was placed on the concrete to measure the compressive strain in the concrete on the top side of the beam. Figure 3.1 shows a schematic drawing of the strain gauge locations. As shown, on the steel and CFRP 5-mm strain gauges (12Ω, gauge factor: 2.11) were used and a 7-mm gauge (12Ω, gauge factor: 2.11) was placed on the concrete. For prestressed strengthened beams, additional six strain gauges were placed on the CFRP rod at several locations within 5 mm from the end of the bonded length. 52
74 Mid-Span Section 7 mm strain gauges 5 mm strain 5 mm strain Figure 3.1: Strain gauge instrumentation of the RC beams Both the monotonically and cyclically loaded beams were tested to failure in a four point bending fixture using a Servo controlled hydraulic actuator of 222kN (5kips) capacity (Figure 3.11). The rate of loading was 1.5 mm/min (stroke-control) for the monotonic loading and a cyclic loading frequency of 1.5 Hz (load-control) was used for the fatigue loading. Three LVDTs were used to monitor the vertical deflections at the mid-span, under one of the loading points, and under the mid point of the shear-span section. The load, the strains, and the vertical displacement were recorded by a National Instrument data acquisition system. The test was stopped once the beam failed. Failure for the monotonic beams occurred by crushing of the concrete at the compression face of the beam after yielding of the tension reinforcement, rupture of the CFRP rod, or de-bonding of the CFRP rod. For cyclically loaded beams, the beam was first loaded to the maximum load of the load range and then unloaded to the mean value of the load range. Then, cyclic loading about this mean load 53
75 was applied. The mode of failure for the cyclic loaded beams was by a fatigue failure of one or both tension reinforcing bars. For all failures, a sudden drop in the load and a sudden large increase in the vertical deflection occurred. P Load cell Steel spreader beam Steel pedestal RC beam LVDT s Steel plate 11 mm 11 mm 11 mm 33 mm a) Schematic b) Photo Figure 3.11: Loading test set-up of the RC beams 54
76 Chapter 4 Monitoring of Prestressing and Transfer Length In this chapter, monitoring of the CFRP rod prestressing and release for both 4% and 6% prestressed strengthened beams are presented. A discussion of the test results for each of the two prestressing levels is given, and a brief summary that combines the findings for both prestressing levels is provided. An empirical model to predict the transfer length based on experimental results is also proposed. Results for four typical RC beams strengthened to 4% and 6% of the ultimate strength of the prestressed CFRP rod are presented herein. In the prestressing application, the CFRP rod experiences two stages in terms of its prestressing profile which occur before and after the release of the gripping anchors. After prestressing the CFRP rod and filling the NSM grooves with epoxy (Sikadur 3), the beams were left for at least 6 days to allow for curing of the epoxy before releasing the force (un-tightening the clamp anchor). This defines the first stage. The second stage starts, when the clamp anchors holding the forces at each end of the beam were released, and the force in the CFRP rods was transferred to the RC beams by means of bond (adhesion). Thereafter, the beam was left for one day, which allowed most of the initial losses of the force in the prestressed CFRP rod to take place. The test results obtained are given in terms of a strain in the CFRP rod versus time plot, a prestressing force in the rod at release versus slip in the CFRP rod plot, and a strain versus distance from the end of the bonded length of the rod plot. 55
77 4.1 Load versus Time Relationship A CFRP rod prestressed to 4% of its capacity was used in the 4% prestressed strengthened beam group. This is equivalent to an initial prestressing force of 55kN in terms of applied load on the CFRP rod. After achieving the desired load level, the clamp anchor was used to maintain the force for 6 days until the epoxy cured (there was an almost constant prestressing profile along the CFRP rod). Figure 4.1 shows the force readings of the two load cells (far and near end) used to measure the load in a typical 4% prestressed strengthened beam. 1 9 Far End Load Cell Near End Load Cell 8 7 Load (kn) Time (min) Figure 4.1: Load-time relationship before releasing the applied prestressing force in a typical 4% prestressed strengthened beam There is a small difference between the forces recorded for the near and the far end, which is presumably due to friction between the rod and the epoxy. All the other beams exhibited the same behaviour. Also, a similar behaviour was obtained for the 6% prestressed strengthened beams as shown in Figure 4.2 for a typical 6% prestressed strengthened beam. 56
78 1 9 8 Prestressing Force (kn) Near End Load Cell Far End Load Cell Time (minutes) Figure 4.2: Load-time relationship before releasing the applied prestressing force in a typical 6% prestressed strengthened beam 4.2 Strain in the CFRP Rod versus Time Relationship Seven 5-mm strain gauges (12Ω, gauge factor: 2.11) were mounted on each CFRP rod at various locations. As the region most affected by the release of the prestressing force is located near the end of the bonded length, strain gauges were placed close to the ends of the bonded lengths of the CFRP rods at distances ranging from 25 mm to 6 mm. To avoid destruction of the bond within these critical zones due to the installation of the strain gauges (strain gauges covered with wax for protection did not transfer bond force), the number of strain gauges was limited to three at each end. An additional strain gauge was located at the mid-span of the bonded length to measure the strain in the CFRP rod (far from the stress concentrations due to anchor gripping and to bending due to misalignment of the CFRP rod). Figure 4.3 plots the strain in the CFRP rod versus time for four typical 4% prestressed strengthened beams. The strain readings did not show significant changes before the release of the anchors except that after the prestressing application, there was a small initial 57
79 reduction in the prestressing force (relaxation). As shown in Figure 4.3, after the clamp anchors at the ends of the beams were removed (after 6 days), reductions in the strain gauge readings occurred that increased with time and proximity of the strain gauge location to the end of the bonded length. The strain gauge that was located closest to the end of the beam (25 mm from the end of the bonded length) showed the greatest reduction in strain, in all cases indicating that the largest slip occurred at the end of the bonded length. The mid-span strain gauge measured a maximum drop of 2% in the strain from the initial value. Therefore, before reaching the mid-span of the bonded length, a transfer of almost the entire prestressing load had taken place. The other strain gauges located between (25 mm and 5 mm) showed that the strain and the force in the prestressing rod decreased with distance from the end of the bonded length. The distance at which the full prestressing force is achieved within the CFRP rod defines the transfer length of the prestressing force. It will be discussed later in this chapter. The strain readings at three locations within the region of the end of the bonded length of the 6% prestressed strengthened beams were also recorded. Again in Figure 4.4, the behaviour of the strain readings in the prestressed CFRP rod exhibits a pattern of reductions in strain with time and decrease from the bonded end similar to those of the 4% prestressed CFRP rod. The total loss of prestressing force decreased from 1% at the end of the bonded length (free of stress) to 2% at the mid-span section of the bonded length (maximum stress in the prestressed CFRP rod). The adhesion bond of the epoxy developed almost the full prestressing force in the rod over a relatively short length for both prestressing levels (4% and 6%). 58
80 Strain in CFRP rod (micro-strain) Mid-span 1 mm from the end of the bonded length 15 mm from the end of the bonded length 2 mm from the end of the bonded length Time after release (min) Strain in CFRP rod (micro-strain) Mid-span 25 mm from the end of the bonded length 5 mm from the end of the bonded length 125 mm from the end of the bonded length Time (min) Strain in CFRP rod (micro-strain) Mid-Span 25 mm from the end of the bonded length 5 mm from the end of the bonded length 75 mm from the end of the bonded length Time after release (min) Strain in CFRP rod (micro-strain) Mid-Span 2 mm from the end of the bonded length 3 mm from the end of the bonded length 4 mm from the end of the bonded length Time after release (min) Strain in CFRP rod (micro-strain) Mid-Span 3 mm from the end of the bonded length 4 mm from the end of the bonded length 5 mm from the end of the bonded length Time after release (min) Strain in CFRP rod (micro-strain) Mid-Span 1 mm from the end of the bonded length 2 mm from the end of the bonded length 3 mm from the end of the bonded length Time after release (min) Strain in CFRP rod (micro-strain) Mid-Span 2 mm from the End of the Bonded Length 3 mm from the End of the Bonded Length 4 mm from the End of the Bonded Length Time after release (min) 8 75 Mid-Span 7 5 mm from the end of the bonded length mm from the end of the bonded length Time after release (min) Strain in CFRP rod (micro-strain) Figure 4.3: Strain readings in the CFRP rod versus time after release (4% prestressed strengthened beams) 59
81 Strain in CFRP rod (micro-strain) Mid-Span 25 mm from the end of the bonded length 5 mm from the end of the bonded length 75 mm from the end of the bonded lengtht Time after release (min) Strain in CFRP rod (micro-strain) Mid-Span 3 mm from the end of the bonded length 4 mm from the end of the bonded length 5 mm from the end of the bonded length Time after release (min) Strain in CFRP rod (micro-strain) Mid-Span 25 mm from the end of the bonded length 5 mm from the end of the bonded length 75 mm from the end of the bonded length Time after release (min) Strain in CFRP rod (micro-strain) Mid-Span 15 mm from the end of the bonded length 3 mm from the end of the bonded length 45 mm from the end of the bonded length Time after release (min) Strain in CFRP rod (micro-strain) Mid-Span 1 mm from the end of the bonded length 2 mm from the end of the bonded length 3 mm from the end of the bonded length Time after release (minutes) Strain in CFRP rod (micro-strain) Mid-Span 15 mm from the end of the bonded length 3 mm from the end of the bonded length 45 mm from the end of the bonded length Time after release (minutes) Mid-Span mm from the end of the bonded length 5 2 mm from the end of the bonded length Time after release (minutes) Strain in CFRP rod (micro-strain) Strain in CFRP rod (micro-strain) Mid-Span 4 mm from the end of the bonded length 5 mm from the end of the bonded length 6 mm from the end of the bonded length Time after release (minutes) Figure 4.4: Strain readings in the CFRP rod versus time after release (6% prestressed strengthened beams) 6
82 4.3 Load versus Slip Relationship The end displacement (end slip) in the CFRP rod, when the clamp anchors were released, was measured using two linear variable differential transducers (LVDT s), one located at each end of the beam (Chapter 3). Figure 4.5 gives plots at each end of the beams (far and near ends) of end slip versus prestressing force for beams strengthened with 4% prestressed CFRP rod. The final end slip in the CFRP rod, after removing the clamp anchors, had a minimum value of.76 mm and a maximum value of 1.15 mm. This variation in the end slip is attributed to changes in the rate of release of the prestressing force. When the release was rapid, a higher value of end slip was obtained than when the release was slower. Controlling the process of release was difficult, and thus considerable variations in the rate of release and the measured slip of the CFRP rod were observed. 61
83 6 5 Far End Load Cell 6 5 Far End Load Cell Near End Load Cell 4 4 Load (kn) 3 Load (kn) Slip (mm) Slip (mm) Specimen No.1 Specimen No Far End Load Cell Near End Load Cell 6 5 Far End Load Cell Near End Load Cell 4 4 Load (kn) 3 Load (kn) Slip (mm) Slip (mm) Specimen No.3 Specimen No.4 Figure 4.5: Load-slip of the CFRP rod for 4% prestressed strengthened beams As in the 4% prestressed strengthened beams, the slip between the CFRP and the beam in the 6% prestressed beams was measured at the time of release of the prestressing force using LVDTs installed at the ends of the beam. The load-slip relationship for the 6% prestressed CFRP rod is shown in Figure 4.6. A nearly linear slip versus prestressing force in the CFRP rod was observed during the release of the first 5% (approximately 4kN) of the total prestressing force. Then, during the release of the remaining force, there was a larger rate of increase in the slip with changes in the prestressing force in the rod. The maximum slip in the CFRP rod was 2.6 mm and the minimum value was 1.1 mm. 62
84 9 8 Near End 9 8 Far End Near End 7 7 Prestressing Force (kn) Prestressing Force (kn) Slip in CFRP Rod (mm) Slip in CFRP Rod (mm) Specimen (1) Specimen (2) 9 8 Far End Near End 9 8 Near End Far End 7 7 Prestressing Force (kn) Prestressing Force (kn) Slip in CFRP Rod (mm) Slip (mm) Specimen (3) Specimen (4) Figure 4.6: Load-slip of the CFRP rod for 6% prestressed strengthened beams 4.4 Transfer Length The transfer length is the length from the end of the bonded portion of the beam to the point at which the full prestressing force is achieved. All the strain gauges were located within 5 mm from the end of the bonded length. Plots of the strain readings in the CFRP rod versus the distance from the end of the bonded length for all beams (4% prestressed strengthened beams) are given in Figure
85 8 8 Strain in the CFRP Rod (micro-strain) Experimental Data Strain in CFRP Rod (micrp-strain) Experimental Data Distance from the End of the Bonded Length (mm) Distance from the End of the Bonded Length (mm) Specimen No.1 Specimen No Experimental Data 8 7 Experimental Data Strain in CFRP Rod (micro-strain) Strain in CFRP Rod (micro-strain) Distance from the End of the Bonded Length (mm) Distance from the End of the Bonded Length Specimen No. 3 Specimen No. 4 Figure 4.7: Strain readings versus the distance from the end of the bonded length for the 4% prestressed strengthened beams after 7 days from release of the prestressing force The dashed lines in the graphs represent a fit to the strain readings for the CFRP rods. The minimum value of the transfer length estimated from the fit was about 24 mm (for a slow release of prestressing force). This value is about 25 times the CFRP rod diameter. On other hand, a value of 58 mm was recorded (for a quick release of prestressing force), which is about 62 times the diameter of the CFRP rod. Most of the specimens exhibited transfer lengths ranging between 2 mm and 3 mm except for one beam (specimen No. 2), which had a transfer length of 56 mm. It is believed that the larger transfer length for this beam was due to the sudden release in the prestressing force that led to an increase in the local 64
86 damage in the bond between the CFRP rod and epoxy within the end region of the bonded length. The transfer length for the 6% prestressed CFRP rods varied from 23 mm to 4 mm (Figure 4.8). This corresponds to 24 to 41 times the rod diameter Strain in CFRP Rod (micro-strain) Strain in CFRP Rod (micro-strain) Distance from the End of Bonded Length (mm) Distance from the End of the Bonded Length (mm) Specimen (1) Specimen (2) Strain in CFRP Rod (micro-strain) Distance from the End of the Bonded Length (mm) Strain in CFRP Rod (micro-strain) Distance from the End of the Bonded Length (mm) Specimen (3) Specimen (4) Figure 4.8: Strain readings versus the distance from the end of the bonded length for the 6% prestressed strengthened beams after 7 days from release of the prestressing force 4.5 Summary of Transfer Length Results In summary, to estimate the average transfer length of each configuration of the two prestressing levels (4% and 6%), a normalization of the final strain reading to the initial strain reading for every strain gauge was done. Thus, normalized values must fall between 65
87 two values, (1% losses) and 1 (% losses). These normalized values are utilized to empirically estimate the average transfer length by plotting the normalized strain versus the distance from the end of the bonded length as given in Figure 4.9 (a: 4% prestressed strengthened beams, and b: 6% prestressed strengthened beams). Normalized stress in CFRP rod ( f f / f i ) Normalized stress in CFRP rod ( f f / f i ) Distance from the end of the bonded length (mm) a) 4% Prestressed Strengthened Beams Distance form the end of the bonded length (mm) b) 6% Prestressed Strengthened Beams Figure 4.9: Transfer length of the prestressed strengthened beams 66
88 4.6 An Empirical Model to Predict the Transfer Length A semi-empirical model is proposed to predict the variation of the prestressing stress in the CFRP rod along the beam at transfer. The model is based on best fit of the measured prestress profile using an exponentional expression as follows: f s Bx = f (1 exp ) (4-1) pre where, f s : The prestressing stress in the CFRP rod for a given distance ( x ) from the end of the bonded length, f pre : The upper limit of the stress in the CFRP rod or the maximum prestressing stress, B: A factor to account for the epoxy type, thickness of the epoxy, prestressing level, and a method of release. It is obtained from the best fit of the experimental results, x : The distance from the end of the bonded length. A best-fit of the measured data using Equation (4-1) gave a value of the constant (B) of.1 for both the 4% and 6% prestressing levels. Figure 4.1 and 4.11 show the best-fit curves using Equation (4-1) together with experimental results for 4% and 6% prestressed NSM CFRP rod, respectively. 67
89 Normalized stress in CFRP rod ( f f / f i ) Best-fit Distance from the end of the bonded length (mm) Figure 4.1: Analytical prediction of the transfer length for the 4% prestressed strengthened beams Normalized stress in CFRP rod ( f f / fi ) Best-fit Distance from the end of the bonded length (mm) Figure 4.11: Analytical prediction of the transfer length for the 6% prestressed strengthened beams 68
90 The bond stress along the prestressed CFRP rod is estimated by differentiating Equation (4-1) to give the following expression. df s dx pre Bx = f B exp (4-2) The forces and stresses acting on an element of the CFRP rod are shown in Figure For equilibrium of the element: ( f + df ) A f A 2 r τ dx s s cfrp s cfrp = π (4-3) CONCRETE EPOXY τ τ f s CFRP ROD f s +df s τ dx Figure 4.12: Forces and stresses acting on an element of CFRP rod bonded with epoxy 69
91 Rearranging Equation (4-3) yields to: df s dx 2 τ = (4-4) r By substituting Equation (4-2) into Equation (4-4), the shear stress on the prestressed NSM CFRP rod can be expressed as follows: Bx 2 f pre B exp τ = (4-5) r In order to estimate the bond stress along the prestressed CFRP rod, Equation (4-4) is used in the form: r Δf r ( f s f s ) s j i τ = = (4-6) Δx 2 ( x x ) 2 j i Figure 4.13 and 4.14 shows the results obtained from Equation (4-5) together with experimental results (Equation (4-6). 7
92 Analytical Experimental- Upper bound Experimental- Lower bound Bond stress (MPa) Distance from the end of the bonded length (mm) Figure 4.13: Bond stress for 4% prestressed NSM CFRP rod Analyitical Experimental - Upper bound Experimental - Lower bound Bond stress (MPa) Distance from the end of the bonded length (mm) Figure 4.14: Bond stress for 6% prestressed NSM CFRP rod 4.7 Summary In summary, the main findings of the current chapter are: 71
93 The mechanical clamp used in the prestressing process provided a good mechanical anchor for prestressing the near surface mounted CFRP rod, After releasing the prestressing force, the greatest reduction in the strain (stress) of the prestressed CFRP rod occurred at the end of the bonded length. The reduction continuously decreased with distance from the end of the bonded length until the transfer length was achieved, The transfer length for prestressed NSM CFRP rod (4% and 6% prestressing level) using epoxy adhesive is short, An empirical model with an exponential form gives a good fit to the transfer length data. 72
94 Chapter 5 Monotonic Test Results of RC Beams The test results for four monotonically loaded beams, control beam without CFRP strengthening, non-prestressed CFRP strengthened beam, 4% and, 6% prestressed CFRP strengthened beams, are presented. This chapter presents the load-deflection behaviour and the modes of failure of all the beams tested. The effect of NSM CFRP strengthening on their cracking, yielding and ultimate loads is discussed. The change in the load versus strain behaviours of the concrete, steel reinforcement, and CFRP reinforcement due to strengthening and prestressing are also discussed. 5.1 General Behaviour During monotonic loading, the load-deflection relationship of a typical reinforced concrete (RC) beam exhibits three stages: a pre-cracking stage, a post-cracking/pre-yielding stage, and a post-yielding stage. These stages are separated by the cracking and yielding loads. A beam strengthened with a CFRP rod exhibits similar load-deflection behaviour, but higher cracking, yielding, and ultimate loads. Figure 5.1 schematically shows the effect of strengthening on the load versus deflection of RC beams. The cracking load is a level at which the tensile stress at the bottom of the beam is higher than the tensile strength of the concrete. This leads to the initiation of flexural cracks and a reduction in the flexural stiffness of the beam. The yield load is defined as the load level at 73
95 which the tension steel reinforcement yields. The ultimate load corresponds to a load drop due to crushing in concrete (control), or FRP rupture, or excessive slippage (strengthened beam). The transition loads between critical stages depend on the concrete strength, amount of the reinforcing steel, and amount of FRP reinforcement (for strengthened beam). For example, a large amount of tension steel reinforcement and/or FRP reinforcement can cause crushing in the concrete before the steel yields. P ult Strengthened Beam P y Load P ult P y Existing Beam Δ y Δ y Δ ult Δ ult Deflection Figure 5.1: Effect of FRP strengthening on the behaviour of the RC beam The flexural stiffnesses in the load-deflection relationship can be approximated by the following linear expressions: 74
96 k uncr P cr = (5-1) Δ cr k cracked Py Pcr = (5-2) Δ Δ y cr k post Pult Py yield = (5-3) Δ Δ ult y where, kuncr : The un-cracked flexural stiffness of the beam, Pcr : The cracking load of the beam, Δcr : The deflection corresponding to the cracking load of the beam, kcr : The cracked flexural stiffness of the beam, Py : The yield load of the beam, Δy : The deflection corresponding to the yield load of the beam, kpost-yield : The post-yield flexural stiffness of the beam, Pult : The ultimate load of the beam, Δult : The deflection corresponding to the ultimate load of the beam. Another important parameter obtained from the load-deflection curve for RC beams is their ductility. The ductility of a beam is a measure of its inelastic ability, and it is expressed by various ways. In this study, ductility index (DI) is taken as the ratio of the ultimate deflection to the yield deflection of the beam as given in Equation (5-4) is used. 75
97 DI Δ ult = (5-4) Δ yield 5.2 Modes of Failure Generally, two primary modes of failure are possible in a RC beam (control or strengthened beam): crushing in concrete before yielding of the tension reinforcing steel (an over reinforced beam) and a crushing in the concrete after the steel yields (an under reinforced beam) with or without FRP rod ruptures. Bond failure by slippage of FRP rod in the NSM groove is an undesirable premature failure mode. In the current study, the control beam exhibited a typical under-reinforced concrete beam behaviour (crushing of the concrete after the yielding of the tension steel reinforcement, Figure 5.2 (a)). For the strengthened beams, the mode of failure was different for the nonprestressed and prestressed strengthened beams. The non-prestressed strengthened beam exhibited yielding in the tension reinforcing steel followed by crushing of the concrete (Figure 5.2 (b)). However, after concrete crushing, the beam was able to maintain the maximum load for a significant amount of further deflection. During this deflection, shear cracks developed along the groove of the NSM on the soffit of the beam (Figure 5.3). Failure of the prestressed strengthened beams (4% and 6%) was due to a yielding in the tension reinforcing steel followed by a sudden rupture of the CFRP rod (Figure 5.2 c and d). 76


")

 d) 6%")


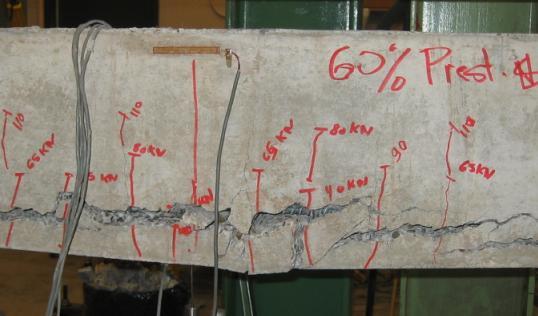
98 a) Control Beam (concrete crushing) b) Non-prestressed Strengthened Beam (concrete crushing) c) 4% Prestressed Strengthened Beam (CFRP rupture) d) 6% Prestressed Strengthened Beam (CFRP rupture) Figure 5.2: Modes of failure of the tested beams 77
.")
99 Figure 5.3: Shear cracks along the NSM groove A map of the modes of failure is given in Figure 5.4. Two modes of failure were observed for the strengthened beams. The % prestressed strengthened beams failed by concrete crushing after the steel yielded (Mode I). Crushing of concrete after yielding of the tension reinforcement occurred at a low level of prestressing (Mode I). As the prestressing level increased, the mode of failure changed to yielding in the reinforcing steel followed by rupture in the CFRP rod. There was a reduction in the concrete strain at ultimate load (Mode II). At very high prestressing level, the beam would fail like an over strengthened beam by a rupture of the CFRP rod before yielding of the steel or crushing of the concrete (Mode III). 78
100 Concrete Strain at Top Fibre of εcu Mode (I) Yielding of steel followed by concrete crushing Modes of Failure Mode (II) Yielding of steel followed by CFRP rupture Mode (III) CFRP rupture before yielding of steel % Prestressing Level 1% Figure 5.4: Effect of prestressing level on the mode failure 5.3 Effect of Prestressing Due to prestressing, the initial unloaded stresses and strains in all mediums of a prestressed beam (concrete, steel reinforcement, and CFRP rod) will have non-zero values. Figure 5.5 shows the initial strains (stresses) in the CFRP rod, concrete (compression face of the beam) and the tension steel reinforcement. Because prestressing gives rise to an initial tensile strain in the CFRP rod in an unloaded beam, the applied load required to cause the additional strain to rupture is less than for a non-prestressed strengthened beam in which the initial strain is zero. Prestressing gives rise to an initial compressive strain in the reinforcing steel and increases the load at which the steel yields. 79
101 Due to an initial tensile concrete strain in the top face of the beam by prestressing, a higher applied load is required to recover the tensile strain to reach the ultimate compression strain. Same effect is for the tension steel reinforcement, whereby an initial pre-compression strain is induced by prestressing. Stress-strain due to prestressing σ σfrpu Stress-strain due to loading after prestressing σ CFRP σp σfrpu-σp εp εfrpu ε εfrpu-εp ε Concrete σ σult σ σult + σp σult εp σp ε ε σ σ Tension Steel σy+ σp σy εp σp ε εy εy+εp ε Figure 5.5: Effect of prestressing on stress-strain behaviour of materials of RC beams 8
102 5.4 Load-Deflection Relationship The load-deflection curves for the beams tested are plotted in Figure 5.6. The beams exhibited three regimes (pre-cracking, pre-yielding, and post-yielding stages) typical of RC beam. A summary of load and deflection values at cracking stage, yielding stage and ultimate stage are given in Table % Prestressed 4% Prestressed % Prestressed Load (kn) 8 6 Control 4 2 Control % Prestressed 4% Prestressed 6% Prestressed Deflction (mm) Figure 5.6: Load-deflection curves of the tested beams Table 5-1: Summary of test results Stage Cracking Yielding Ultimate Pcr Δcr Py Δy Pult Δult Beam (kn) (mm) (kn) (mm) (kn) (mm) Control Non-prestressed % Prestressed % Prestressed
103 5.4.1 Cracking Load The beam will crack, once the tensile stress at the extreme bottom fibre of concrete exceeds the tensile strength of the concrete due to a flexural loading exceeds the tensile strength of the concrete. The tensile strength of concrete may be taken as being equal to 1% of its compressive strength or calculated using Equation (5-5) (CSA-A ). f = (5-5) r '.6 f c where, f r : The tensile strength of the concrete, MPa, ' f c : The compressive strength of the concrete, MPa. The cracking load of the control beam was found to be 1.2kN with a corresponding deflection of 1.86 mm. When the beam was strengthened with non-prestressed (% Prestressed) CFRP rod, an increase in the cracking load was obtained together with a small decrease in the corresponding deflection. The changes were about 7% and -5.4% for cracking load and deflection, respectively. A remarkable increase in the cracking load was obtained when the beam was strengthened with a prestressed CFRP rod. The increases were approximately 3 to 4 times for the cracking load of the control beam for the 4% and 6% prestressing levels, respectively. 82
104 The changes in cracking loads and strains can be estimated from an elastic analysis of the beam. From mechanics, the cracking load of a beam prestressed with NSM CFRP rod can be calculated as follows. The eccentric prestressing force causes two types of stresses on the concrete beam section: an axial compressive stress (axial force) and a bending stress (due to moment caused by the eccentricity of the CFRP rod). These stresses are: Pprestress σ axial = (5-6) A section P b prestress e yb σ bending = (5-7) I section P t prestress e yt σ bending = (5-8) I section where, σ axial : The axial compressive stress due to prestressing force ( P prestress ), P prestress : The applied prestressing force, A sec tion : The area of the cross-section of the beam, b σ bending : The bending stress on the bottom fibre of the beam section, e : The eccentricity of the applied prestressing force, y b : The distance from the bottom fibre to the neutral axis of the concrete beam section, I sec tion : The moment of inertia of the cross-section, t σ bending : The bending stress on the top fibre of the beam section, 83
105 y t : The distance from the top fibre to the neutral axis of the concrete beam section. At the cracking load of a beam strengthened with a prestressed CFRP rod, the total stress due to prestressing, self-weight, and applied load in the extreme bottom fibre of the cross-section of the beam will be equal or greater than the tensile strength of the concrete. This yields the following expression. f r M applied yb P P prestress prestress e yb M s. w yb + (5-9) I A I I section section section section where, M applied : The applied moment due to loading, M s. w : The moment due to self-weight of the beam. Based on the four-point bending scheme of loading used in this study, and substituting Equation (5-5) and rearranging Equation (5-9) in terms of cracking load ( P cr ), Equation (5-9) can be rewritten as: P cr P I ' prestress section.6 I sec tion f c + + Pprestress e yb M s. w Asec tion a y 2 b y b (5-1) 84
106 where, P cr : The cracking load of the prestressed strengthened beam, a : The shear span length in the four point bending loading fixture. Figure 5.7 gives the cracking load versus the prestressing levels for the analytical (Equation 5-1) and experimental results. The analytical results show a reasonably good agreement with experimental data. Prestressing of a CFRP strengthening rod increases the cracking loads, and gives narrower flexural crack widths and smaller deflection, which is advantageous in terms of the serviceability and durability of a structural element. The maximum allowable prestressing level is restricted to a 6% of the ultimate static capacity of the rod (ACI 44, 1996). The main purpose of this limitation is to prevent a creep rupture in the CFRP rod. Cracking Load (kn) Experiemntal Analytical 6% of static capacity of the CFRP Rod Cracking Cracking on the bottom on the fibre top fibre of the of the beam beam 1 Note: Cracking load of the control beam: 1.2 kn Prestressing Level (%) Figure 5.7: Effect of CFRP prestressing level on the cracking load 85
107 5.4.2 Yield Load As defined previously, the yield load of a RC beam is the load causing yielding of the tension steel reinforcement. The control beam had a yield load of 55.1 kn at a mid-span deflection of 23.5 mm. When the beam was strengthened with non-prestressed CFRP rod, an increase of 26% in the yield load and an increased deflection of 26.3 mm at the mid-span section were observed. An increases of 72.4% and 9.6% of the yield load of the control beam were obtained for the 4% and 6% prestressed strengthened beams, respectively. Figure 5.8 shows a good agreement between the experimental results and the analytical model (presented later in Chapter 7). Also, it should be noted that the increase in the yield load is approximately linear with the applied prestress level Yield load (kn) Yield laod of the control beam: 55.1kN Experimental Analytical Prestressing level (%) Figure 5.8: Effect of prestressing on the yield load 86
108 5.4.3 Ultimate Load The definition of the ultimate load used herein is the maximum applied load resisted by a beam or the load just before a sudden drop in the load if this occurs. For the control beam, the failure occurred by concrete crushing preceded by yielding of the tension steel reinforcement. The ultimate load was 64.3kN at a maximum mid-span deflection of 85.3 mm. When the beam was strengthened with non-prestressed CFRP, a similar mode of failure was obtained. During further loading after concrete crushing, the load was maintained at the same level during a significant increase in deflection. Shear cracks developed in the NSM groove within the mid-span region and traveled towards the ends of the beam. The ultimate load was about 96.5kN with a corresponding mid-span deflection of mm. Comparing the ultimate load of the non-prestressed beam to the control beam, an increase of 5.1% was achieved. In prestressed beams strengthened with a CFRP rod, a further increase in the ultimate load was achieved. The ultimate load for the 4% CFRP prestressed beam was kN. This is an increase equal to 79.2% of the ultimate of the control beam. The increase compared to the ultimate load of the non-prestressed beam is 19.4%. For the 6% level of prestressing, the ultimate load was kN, which is 2.6% less than for the 4% prestressed strengthened beam. The observed changes in the ultimate strength of the beam with prestressing level together with an analytical prediction taken from Chapter 7 are shown in Figure 5.9. As the prestressing level increases, the ultimate capacity of the strengthened RC beam increases. Beyond a given prestressing level, a reduction in the ultimate capacity is observed. This is schematically shown and described in Figure
109 Ultimate load (kn) Experimental Ultimate load of the control beam: 64.3 kn Analytical Prestressing level (%) Figure 5.9: Effect of prestressing level on the ultimate load Note: P 3 > P 2 > P 1 P 3 P 2 Applied Load P 1 4% Prestressed Non-prestressed 6% Prestressed 4% of rupture strain 6% of rupture strain CFRP Strain Rupture Strain Figure 5.1: Effect of prestressing level on the strain of CFRP rod 88
110 It is worth noting that although the ultimate strength is less for the 6% prestressing level than for the 4% level, serviceability and fatigue life are expected to improve with an increase in prestress from 4% to 6%. This is based on the fact that as the prestress level increases, higher compressive strains are induced in the tension steel reinforcement. This is shown in Figure For the 6% prestressed beam strengthened with CFRP rod, a higher compressive strain is obtained than that for the 4% prestressed strengthened beam at a zero level of applied load (Figure 5.11). As the beams are loaded to a given load (P), a smaller strain is found for 6% prestressed strengthened beam than for the 4% one. Thus, for a given applied fatigue load cycle, the mean stress will be lower and thus the fatigue life is expected to be greater for the 6% prestressed beam than for the 4% prestressed beam. Applied load on the P 6% Prestressed Strengthened Beam 4% Prestressed Strengthened Beam Initial strain Initial strain Strain at P Strain at P Yield strain Compressive strain Tensile strain Strain in the tension steel reinforcement Figure 5.11: Strain in the tension steel reinforcement versus the applied load 89
111 5.4.4 Flexural Stiffness The changes in the flexural stiffnesses (pre-cracked, pre-yielding and post-yielding) caused by strengthening and prestressing the RC beams, are discussed below. Pre-cracking flexural stiffness The greatest flexural stiffness in a RC beam occurs before cracking. In this region, the entire section (un-cracked section) of the beam resists the external applied load. Strengthening the beam as well as increasing the cracking load and its corresponding deflection, also increases the moment of inertia and therefore the pre-cracking flexural stiffness. It can be seen in Figure 5.12 that the pre-cracking flexural stiffness of the beam increases as the prestressing level increases. A maximum value is recorded at a 6% prestressed strengthened beam with an approximate increase of 45% compared to that of the control beam. 1.6 Normalized pre-cracking flexural stiffness (k pre-cracking /K pre-cracking (control) ) k pre-cracking (control) = 5484 N/mm Prestressing level (%) Figure 5.12: Normalized pre-cracking flexural stiffness 9
112 Pre-yielding flexural stiffness The post-cracking flexural stiffness is the slope of the load between cracking load and the load causing yielding steel. There is a continuous increase in the stiffness as defined herein. The prestressing effect of strengthening on the pre-yield flexural stiffness is less at a high level of prestressing. Figure 5.13 shows an increase of 5% in the post-cracking flexural stiffness to that of the control beam was obtained. 2 Normalized pre-yielding flexural stiffness (k pre-yield /k pre-yield (control) ) k pre-yield (control) = 275 N/mm Prestressing level (%) Figure 5.13: Normalized pre-yielding flexural stiffness Post-yielding flexural stiffness Post-yield stiffness is defined as the slope of the portion of the load-deflection curve between the steel yield load and failure. A remarkable effect is found when the RC beam is strengthened with NSM CFRP rod. The post-yielding flexural stiffnesses for the %, 4%, and 6% prestressed strengthened beams are 3, 5.4, and 6 times greater than that of the control 91
113 beam, respectively. Their stiffness values normalized to that of the control beam are plotted versus prestressing levels in Figure In general, as prestressing level increases, the location of the neutral axis increases in distance from the extreme top fibre of the beam cross section. This results in a larger un-cracked zone in the cross section and a higher cracked moment of inertia leading to a stiffer flexural rigidity of the beam (Figure 5.15). 8 Normalized post-yielding flexural stiffness (k post-yield /k post-yield(control) ) k post-yield (control) = 149 N/mm Prestressing level (%) Figure 5.14: Normalized post-yielding flexural stiffness 92
114 Un-cracked c1 c2 c3 c4 Cracked Control Nonprestressed 4% Prestressed Strengthened 6% Prestressed Strengthened Note: c 1 < c 2 < c 3 < Figure 5.15: Effect of prestress on stiffness Ductility The ductility index is the ratio of the deflection at the ultimate load to the deflection at a load causing yielding in the tension steel reinforcement. Typically, an under-reinforced concrete beam exhibits a high value of ductility index (DI). The larger the amount of reinforcing material is used in a beam for given dimensions and concrete compression strength; the lower will be the value of the ductility index (DI). Another reason for a ductility reduction is the applied prestressing force. A high prestressing level as noted previously reduces the deflection at which the CFRP rod ruptures. Figure 5.16 plots a best-fit of the ductility index data for the beams tested. The ductility index decreases continuously as the prestressing level increases. For a range of prestressing between % and 6% used in the present tests, there is a roughly linear relationship between the reduction of the ductility index of the strengthened beams (%, 4%, and 6% prestressed) and the prestressing level. The reductions in the ductility index compared to the control beam for the %, 4% and 6% prestressed strengthened beam are 3.6%, 47.2%, and 63.9%. Based on the analytical model provided in Chapter 7, the 93
115 ductility index will equal unity at the prestressing level of 82% at which the yielding and ultimate loads are the same Ductility Index Yield load = ultimate load.5 Ductility Index of the Control Beam: Prestressing Level (%) Figure 5.16: Ductility index of the tested beams 5.5 Strain Behaviour The strains in the tension steel reinforcement, the CFRP reinforcement, and the compressive face of the concrete were measured during prestressing (Chapter 4) and loading (Chapter 5 and 6). In this sub-section, the strain histories of these elements in the RC beams tested are presented and discussed Concrete Figure 5.17 plots the applied load versus compressive strains for the compression faces of the concrete of the beams (control, and %, 4%, and 6% prestressed strengthened beams). As previously noted, the control and % prestressed strengthened beam failed by concrete 94
116 crushing. Evidence of this failure mode is seen in the large compressive strains exhibited by these beams in Figure When the beam was strengthened with 4% and 6% prestressed CFRP rod, the mode of failure changed to rupture of the CFRP rod. The initial tensile strains in the concrete at the extreme top fibre of the section due to prestressing are neglected in the graph for two reasons. The first reason is that their magnitudes are very small compared to the compressive strains at failure. The second reason is that due to presence of hair shrinkage cracks in the beam before prestressing stresses near these cracks will in any case remain near zero during prestressing. 14 4% Prestressed 12 6% Prestressed Load (kn) Control % Prestressed 4% Prestressed 6% Prestressed % Prestressed Control Strain in Concrete (micro-strain) Figure 5.17: Compressive strain in concrete for the tested beams 4 2 The load level at a given concrete strain increases as the beam is strengthened and then prestressed. The presence of the CFRP rod and an increase in the prestressing force both result in a reduction of the cracked portion of the cross-section of the beam so that, the applied compression force on the concrete is distributed on a larger un-cracked cross- 95
117 sectional area. This leads to a neutral axis closer to the bottom of the section and lowers the concrete strains. Figure 5.18 is a plot of the concrete strain at the ultimate load. Regions corresponding to two of the three possible modes of failure discussed in Section 5.3 (mode I and mode II) are indicated in the figure. 35 Crushing strain of concrete 3 Concrete Strain (micro-strain) Mode I Best-fit Mode II Prestressing Level (%) Figure 5.18: Concrete compressive strain at ultimate load versus the prestressing level Steel Reinforcement The tension steel reinforcement was monitored with strain gauges placed at the mid-span section of the beam on both rebars. Prestressing of the CFRP rod induces initial compressive strains in the tension steel reinforcement at the time of prestressing. Afterwards under loading, the tension steel reinforcement is positively (tensile) strained and as the load increases the compressive strain is removed and a tensile strain is induced in the tension steel reinforcement (when the strain is reduced to zero, the tension steel reinforcement is said to be decompressed). Figure 5.19 (a and b) plots the load versus strain in the two tension 96
118 reinforcement bars during loading. As shown, the control and % prestressed strengthened beam have zero strain at zero load. The increase in the yield load of the % prestressed beam is due to the fact that the tensile force in the beam induced by the external load is shared by the tension steel reinforcement and the CFRP rod. For the 4% and 6% prestressed beam, the yield load is further increased because of the initial compressive strains due to prestressing, which increases the range of load required to reach the yield stress in the steel (See Section 5.4). Under fatigue loading, the lower strain reading for a given maximum load level will result in a lower mean stress and a longer fatigue life for a given load range % Prestressed 1 4% Prestressed 8 8 6% Prestressed Load (kn) 6 4% Prestressed Load (kn) % Prestressed % Prestressed Control 2 % Prestressed Control 4% Prestressed 6% Prestressed Strain in Steel (micro-strain) Control 2 % Prestressed Control 4% Prestressed 6% Prestressed Strain in Steel (micro-strain) a) Rebar (1) b) Rebar (2) Figure 5.19: Tension steel reinforcement strains versus applied load CFRP Rod The tensile strain in the CFRP rod was also monitored under monotonic loading. Figure 5.2 shows the applied load versus the strain in the CFRP rod. The % prestressed (nonprestressed) strengthened beam failed by concrete crushing at a maximum CFRP tensile strain of about 11 με. The ultimate strain of the CFRP rod is reached for the two prestressed 97
119 strengthened beams (about 136 and 12 με for the 4% and 6% prestressed beams, respectively). The difference in the two ultimate strain measurements is probably due to the distance of the strain gauge from flexural cracks. The closer the strain gauge is to a flexural crack, the higher will be the strain measured (the crack acts as a stress raiser). The strain readings in the prestressed CFRP rod after prestressing are shown in the figure as an initial strain at zero load. In both beams (4% and 6%), the CFRP strain readings beyond the cracking load fall together up to the yield load % Prestressed 4% Prestressed 6% Prestressed % Prestressed 8 Load (kn) 6 6% Prestressed 4 4% Prestressed 2 Strain due to prestressing Strain due to loading Strain in the CFRP Rod (micro-strain) Figure 5.2: Strains in the CFRP rod versus applied load 5.6 Linearity of Strain Profile (Strain Compatibility) To examine strain compatibility between the concrete, the steel reinforcement, and the CFRP rod and the linearity of the strain profile across the cross section, strain readings for all (concrete, steel, and CFRP) are plotted versus the depth of the cross section of the beam in Figure 5.21 for the control beam. 98
120 Distance from the bottom of the beam (mm) Top Concrete Compression Steel Tension Steel kn 2 kn 3 kn 4 kn 5 kn Strain (micro-strain) Figure 5.21: Strain profile of the section of the control beam at various levels of loading The results show that the strain profiles are close to linear. A similar set of data for the nonprestressed strengthened beam plotted in Figure 5.22 also nearly linear strain profiles. Since, the compatibility in the strain is valid for the CFRP rod, the CFRP rod acts as part of a composite section (there is full-composite action and no slip between the CFRP and the concrete). When the beams were strengthened with prestressed CFRP rod (4% and 6%), the strain profiles show an acceptable linear profiles across the depth of the section in Figure 5.23 and Figure 5.24, respectively. 99
121 Distance from the bottom of the beam (mm) Tension Steel Top Concrete Compression Steel 1 kn 2 kn 3 kn 4 kn 5 kn 6 kn 7 kn CFRP Rod Strain (micro-strain) Figure 5.22: Strain profile of the section of the non-prestressed strengthened beam Distance from the bottom of the beam (mm) Tension Steel Compression Steel 1 kn 2 kn 3 kn 4 kn 5 kn 6 kn 7 kn 8 kn 9 kn 1 kn CFRP Rod Strain (micro-strain) Figure 5.23: Strain profile of the section of the 4% prestressed strengthened beam 1
122 Distance from the bottom of the beam (mm) Tension Steel Compression Steel 1 kn 2 kn 3 kn 4 kn 5 kn 6 kn 7 kn 8 kn 9 kn 1 kn CFRP Rod Strain (micro-strain) Figure 5.24: Strain profile of the section of the 6% prestressed strengthened beam Based on the above strain profiles, the neutral axes of all beams (control, non-prestressed strengthened, 4%, and 6% prestressed strengthened beam) versus the load level are plotted in Figure Neutral Axis, C (mm) Control Beam Non-Prestressed Beam 4% Prestressed Beam 6% Prestressed Beam C Applied Load (kn) Figure 5.25: Neutral axis locations versus the applied load 11
123 It can be noted that the location of the neutral axis from the top face of the beam decreases as the load level increase for all beams. This behaviour is expected since the flexural crack propagates upward as the load increases. It is also important to show that the largest neutral axis is obtained for the location of the neutral axis of the 4% and 6% prestressed strengthened beams closer to the top of the beam is consistent with greater stiffnesses (compared to the control and non-prestressed beams) exhibited by these beams. 5.7 Summary Based on the test results presented in this chapter, the main findings are: The NSM technique is very effective in increasing the flexural capacity of a RC beam. With non-prestressed strengthened RC beam, a reasonable reduction in the ductility is obtained with respect to that of the control beam; Prestressing the CFRP rod up to 4% of its capacity as NSM greatly increases the flexural performance in terms of cracking, yielding, and ultimate load. It also shows a higher flexural strength than the 6% prestressed strengthened beam; Prestressing the NSM CFRP rod up to 6% gives the greatest enhancement in the flexural behaviour over all the other beams, but a small reduction in the ultimate capacity compared to that of 4% prestressed beam; As the prestressing level increases, there is a continuous enhancement in the preyielding and post-yielding flexural stiffness. However, the degree of enhancement is less for pre-yielding and post-yielding flexural stiffness between 4% and 6% prestressing; 12
124 Using NSM CFRP rod for strengthening results in a reduction in the ductility of the flexural element and prestressing further lowers the ductility; Strain linearity across the beam cross section and compatibility between the CFRP rod and concrete was observed for all beams and monotonic load levels. 13
125 Chapter 6 Fatigue Test Results for the RC Beams This chapter presents and discusses the test results for the cyclically loaded beams. Data for deflection versus number of cycles is discussed and related to the cyclic behaviour of the constituent materials used in the beam specimens (concrete, tension reinforcement steel, and CFRP). The deformation of each of these materials under cyclic loading is presented in terms of the measured strains versus cycles as a percent of the number of cycles of fatigue life. At the end of the chapter, the fatigue life curves for all the specimen configurations (control, non-prestressed, 4% and 6% prestressed strengthened beams) and a brief summary of the main findings are provided. Cyclic behaviour of the test beams is given in Appendix B. 6.1 Fatigue Failure Modes Three modes of failure were observed for the cyclically loaded RC beams. A fatigue failure in the tension steel reinforcement was the usual mode of failure. The second mode of failure was a fatigue failure of the bond between the prestressed CFRP rod and the epoxy, which occurred in a few cases. The last mode, a fatigue failure in the prestressed CFRP rod, occurred only once for a test with a high prestress level accompanied by a large load range. The mechanisms describing these modes of failure are given in the following sections. 14


126 6.1.1 Fatigue Failure of the Tension Steel Reinforcement For the current specimen design, most of the beams failed by a fatigue failure in the tension steel reinforcement due to cyclic loading as shown in Figure 6.1. This mode of failure was expected since the stress range in the tension steel reinforcement was high enough to cause a fatigue failure in the steel before a fatigue failure would occur in the CFRP rod. All of the control beams, the non-prestressed beams, the 4% prestressed beams, and most of the 6% prestressed strengthened beams, failed in this mode of failure. This is consistent with reports in the literature that CFRP reinforcement exhibits a higher fatigue life than that of the mild steel reinforcement (Jones, 1997). But, when the beam was strengthened with a prestressed CFRP rod, other modes of failures that are presented in the following sections occurred in some beams. Figure 6.1: Fatigue failure due to a rupture in the reinforcing steel bar 15
127 6.1.2 Fatigue Failure of the CFRP Rod The second mode of failure observed was a fatigue failure of the CFRP rod. This mode of failure occurred for only one beam. That beam was strengthened with a 6% prestressed CFRP rod and loaded at the highest load range (load range of 74.7kN). When the CFRP rod was tensioned, it caused an initial tensile strain in the CFRP rod and an initial compressive strain in the tension steel reinforcement. These initial induced strains changed the mean stresses and the fatigue lives of the steel and the CFRP rod. As the prestressing level of the CFRP rod increases, its mean stress increases and its fatigue life decreases, whereas, for the tension steel reinforcement an increase in the prestressing level leads to a decreased mean stress and an increased fatigue life. At some prestressing level, fatigue failure in the prestressed CFRP will occur before the steel reinforcement fails. As schematically shown in Figure 6.2, which gives fatigue life curves for fatigue failure in the steel reinforcement and the CFRP rod at various levels of CFRP prestress, the fatigue life curves for failure of the CFRP rod decrease and the fatigue life curves for failure of the tension steel reinforcement increase with an increase in prestressing force. As a result, at a high prestressing level, the beams strengthened with a prestressed CFRP rod exhibit two modes of fatigue failure. At high applied loads ranges, a fatigue failure in the CFRP rod occurs, while at lower load ranges, the failure occurs by fatigue failure in the tension steel reinforcement. The point at which the failure changes from fatigue failure in the CFRP rod to fatigue failure in the tension steel reinforcement is shown in Figure 6.2 as the transition point. At this point, fatigue failures in the CFRP rod and in the tension steel reinforcement occur at the same number of cycles. 16

 Figure 6.2: Effect of prestressing on the fatigue life of the prestressed strengthened beams Figure 6.")
128 Figure 6.3 shows a photograph of the 6% prestressed strengthened beam that failed by rupture of the prestressed CFRP rod at a large load range. CFRP reinforcement fatigue Steel reinforcement fatigue Low Prestressed CFRP Rod Load Range Transition point Moderate Prestressed CFRP Rod High Prestressed CFRP Rod High Prestressed strengthened beams Moderate Prestressed strengthened beams Low Prestressed strengthened beams Control beams Nf (No. of cycles to failure) Figure 6.2: Effect of prestressing on the fatigue life of the prestressed strengthened beams Figure 6.3: Fatigue failure in the CFRP rod (6% prestressed strengthened beam) 17


129 6.1.3 Fatigue Bond Failure The third mode of failure observed was a fatigue bond failure (Figure 6.4). Initially, after prestressing, the interfacial stress in the CFRP rod is highest at the end of the bonded length and decreases with distance from the end of the bonded length as illustrated in Figure 6.5. At the point, where the prestressing force in the CFRP rod is fully achieved (both beams had same transfer length of 35 mm from the end of the bonded length), the interfacial stress approaches zero. However under cyclic loading, shear/flexural cracks start to develop leading to a redistribution of the interfacial shear stresses between the CFRP rod and the concrete. It remains a maximum at the end of the bonded length, but it drops to zero at crack locations (Figure 6.5). Figure 6.4: Fatigue bond failure of the 4% prestressed strengthened beam When a CFRP U-wrap was provided, the first shear crack was shifted away from the support to a distance of 6 mm and hence the anchorage length increased to this length. On the 18
130 other hand, in the un-wrapped beam, the first shear crack was only 25 mm away from the support. Thus, the average interfacial shear stress was smaller in the wrapped beams than in the unwrapped beams. Therefore under cyclic loading, a bond fatigue failure was more likely for unwrapped than for wrapped beams. Three strain gauges mounted near the end of the bonded length of the beam (2 mm, 3 mm, and 4 mm from the end of the bonded length) gave the data shown in Figure 6.6 for the beam that failed in bond. The total strains represent the initial strains due to prestressing and the strain due to loading. As the number of cycles increased, the readings of all of the strain gauges decreased. The strain gauge closest to the end of the bonded length showed the greatest initial decrease in strain. As the number of cycles increased, the force in the prestressed CFRP rod at all gauged locations continued to decrease approaching zero value. Once, the tensile strain in the CFRP rod is equal zero, it means that the transfer of the stresses between the concrete and the CFRP rod does not occur and a local bond failure has happened. This local de-bonding was accompanied by a continuous increase in the slip between the prestressed CFRP rod and the epoxy with an increasing number of cycles. To decrease the slip between the prestressed CFRP rod and the epoxy, the interfacial stress between the CFRP rod and epoxy was reduced by using CFRP U-wraps. When CFRP U- wraps were applied to the beam, the shear stresses within the anchorage length were smaller than those of unwrapped beams. This led to a reduced slip between the prestressed CFRP rod and the concrete, and increased the number of cycles required to cause a fatigue bond failure so that a fatigue failure in the tension steel rather than a bond failure occurred. 19
131 With CFRP U-wrap (longer anchorage length) LC Without CFRP U-wrap (shorter anchorage length) CL Interfacial stress Tensile stress Shear stress Transfer Length Tensile stress Transfer Length Prestressing (Before Loading) P/2 CL P/2 L C Interfacial stress τave Interfacial stress τave Tensile stress Tensile stress 6 mm 25mm After Loading Figure 6.5: Shear stress distribution in the CFRP rod 11
132 1 9 FIRST CYCLE RC BEAM 1 9 1, CYCLEs RC BEAM Strain in the C FR P (m icro-strain) Strain in the C FRP (micro-strain) Due to loading Total Strain Distance from the support (mm) 1 Due to loading Total Strain Distance from the support (mm) 1 9 1, CYCLES RC BEAM 1 2, CYCLES RC BEAM Strain in the CFRP (micro-strain) Strain in the CFRP (m icro-strain) Due to loading Total Strain 1 Due to loading Total Strain Distance from the support (mm) Distance from the support (mm) 1 4, CYCLES RC BEAM 1 45, CYCLES RC BEAM Strain in the CFRP (micro-strain) 8 Due to loading Total Strain Strain in the CFRP (micro-strain) 8 Due to loading Total Strain Distance from the support (mm) -2 Distance from the support (mm) Figure 6.6: Tensile strains in the CFRP rod for the beam that failed by fatigue bond failure 111
133 6.2 Deflection versus Number of Cycles The deflection of a beam under cyclic loading is affected by the behaviour of the concrete, the compression and tension steel, and the CFRP reinforcement. Figure 6.7 shows the deflections of the control beams, at various load ranges versus the number of cycles normalized to the fatigue lives of the specimens. The maximum deflection in the RC beams increased as the number of cycles increased Deflection (mm) Control (load range: 1%-55%) Control (load range: 1%-65%) 5 Control (load range: 1%-75%) Control (load range: 1%-8%) Percent of the number of cycles to failure (%) Figure 6.7: Deflection versus normalized number of cycles for the control beams The deflection behaviour for the control beams under repeated loads shows three stages. There is an increase in deflection during the first 1% of the specimen fatigue life. Thereafter, the deflections remained constant in the second phase, followed by an increase just before failure. Only one specimen loaded at a load range of 1%-8%, showed an unusual increase in 112
134 the deflection after 55% of its fatigue life. This result may be due to an instrumentation problem. As shown in Figure 6.8, the non-prestressed strengthened beams exhibit a deflection versus number of cycles behaviour similar to that of the control beams, except that just before failure, there was a pronounced increase in the deflection at onset of failure Deflection (mm) Non-Prestressed (load range: 6.8%-45%) Non-Prestressed (load range: 6.7%-5%) 5 Non-Prestressed (load range: 6.7%-6%) Non-Prestressed (load range: 6.7%-65%) Percent of the number of cycles to failure (%) Figure 6.8: Deflection versus normalized number of cycles for non-prestressed strengthened beams For the 4% prestressed strengthened beams, a slow continuous increase in the deflection with an increasing number of cycles followed a more rapid initial increase (Figure 6.9). The continuous increase in the deflection of the beams with an increasing number of cycles under 113
135 cyclic loading was accompanied by slip between the CFRP rod and the epoxy as shown in Figure Deflection (mm) % Prestressed (load range: 5.7%-5%) 4% Prestressed (load range: 5.7%-6%) 5 4% Prestressed (load range: 5.7%-65%) 4% Prestressed (load range: 5.7%-75%) Percent of the number of cycles to failure (%) Figure 6.9: Deflection versus normalized number of cycles for the 4% prestressed strengthened beams It is worth noting that the beam loaded at the lowest load range of 5.7%-5% exhibited larger deflection readings than two of the beams loaded at higher load ranges. This beam had a large slip during the first cycle of loading as shown in Figure 6.1. During that cycle, the recorded slip in the prestressed CFRP rod at the north end was about 1.1 mm, which was accompanied with an increase in the deflection of the beam from about 12.5 mm to 19 mm. 114
136 North End (load range: 5.7%-5%) South End (load range: 5.7%-5%) Deflection (mm) % Prestressed (load range: 5.7%-5%) Slip in CFRP Rod (mm) Normalized No. of Cycles to the Fatigue Life (%) Normalized No. of Cycles to the Fatigue Life (%) Figure 6.1: Effect of CFRP rod slip on the deflection behaviour For the 6% prestressed strengthened beams, the deflection behaviour shown in Figure 6.11 is similar to that of the 4% prestressed strengthened beams. It is important to emphasize however, that the beams had different modes of failure. The strengthened beam loaded at the highest load range had an initial increase in deflection after which the deflection became stable. This beam failed by a bond fatigue failure in spite of strengthening by a CFRP U-wrap. The beam was previously loaded at a load range of 5.8%-5% and had been classified as a runout after 1,5, cycles of loading. During the time when the beam was loaded at the 5.8%- 5% load range, a small amount of slip between the prestressed CFRP rod and the epoxy was recorded. A fatigue failure in the prestressed CFRP rod occurred when the beam was then loaded at a load range of 5.8%-72.5%. This beam exhibited a continuous increase in deflection until failure. It had a fatigue life much shorter than that expected for a fatigue failure of the tension steel reinforcement. A larger deflection was observed for the beam loaded at a load range of 5.8%-65% than expected based on the deflections of the other beams. This was attributed to a large initial slip in the CFRP rod at the beginning of loading. The deflection increases with increasing number of cycles for the 6% prestressed beams was similar to that 115
137 for other beams (control, non-prestressed, and 4% prestressed strengthened beams). There was an initial increase in the deflection due to concrete softening followed by stabilization until near failure. Just before fatigue failure, a sudden large increase in deflection was observed. The data acquisition system recorded the data (deflection, slip, and strains) only up to 3% of fatigue life for the beam that was loaded at a load range of 5.8%-55% Deflection (mm) % Prestressed (load range:5.8%-5%) 6% Prestressed (load range:5.8%-55%) 6% Prestressed (load range:5.8%-65%) 6% Prestressed (load range:5.8%-68.8%) 6% Prestressed (load range:5.8%-72.5%) 6% Prestressed (load range:5.8%-77.5%) Percent of the number of cycles to failure (%) Figure 6.11: Deflection versus normalized number of cycles for the 6% prestressed strengthened beams 6.3 Strain in the Concrete versus Number of Cycles As discussed in Chapter two, plain concrete softens early in its loading history under cyclic loading (Neville. 1999). When compression steel is present in the concrete as in the beam specimens used in this work (compression reinforcement of 2 No. 1 mm deformed rebars), the reduction in concrete force as it creeps, is partly offset by an increase in stress and force in 116
138 the steel as it is compressed. Concrete softening and creep strains were therefore lower than they would have been for plain concrete. Figure 6.12 plots the compressive strains in the concrete versus the percent of the normalized number of cycles to failure for the control beams at various load ranges. In all cases, there is some initial softening of the concrete followed by a stable maximum compressive strain until failure. As expected, the maximum compressive strains in the concrete increased with increases in load range. Maximum Strain in Concrete (micro-strain) Percent of the number of cycles to failure (%) Control (load range: 1%-55%) -2 Control (load range: 1%-65%) Control (load range: 1%-75%) -4 Control (load range: 1%-8%) Figure 6.12: Compressive strain in concrete versus the number of normalized cycles for the control beams The strain behaviour in the concrete of the non-prestressed strengthened beams was similar to that of the control beams. Figure 6.13 shows the compressive strain readings in the concrete versus the percent of the normalized number of cycles of the fatigue life of the 117
139 specimens. The compressive strain readings of the concrete show a small increase during the first 1% of the fatigue life for each specimen. Maximum Strain in Concrete (micro-strain) Non-Prestressed (load range: 6.7%-45%) -2 Non-Prestressed (load range: 6.7%-5%) -4 Non-Prestressed (load range: 6.8%-6%) Non-Prestressed (load range: 6.7%-65%) Percent of the number of cycles to failure (%) Figure 6.13: Strain in concrete versus the number of normalized cycles for the nonprestressed strengthened beams The concrete compressive strain readings versus the normalized number of cycles for the 4% prestressed strengthened beams are shown in Figure This strain versus cycle behaviour of the concrete is similar to that of the control and non-prestressed strengthened beams. Due to prestressing, the compressive strain in the concrete at a given load is much smaller than it was when the beam was strengthened with non-prestressed CFRP rod (Chapter 5). Thus, the maximum strain in the prestressed strengthened concrete beams at the beginning of a test was much less than it was for the non-prestressed beams. This is due to the initial tensile strain induced in the compression face of the beam by prestressing (under loading, the maximum strain is the sum of the tensile strain due to prestressing, and the compressive strain due to 118
140 loading). For the beam tested at a load range of 5.7%-5%, there was a continuous increase in the maximum compressive strain in the concrete with increasing number of cycles up to failure. This beam had a much larger slip in the CFRP rod during cyclic loading (2. mm) than the beams loaded at other load ranges. Maximum strain in concrete (micro-strain) Percent of the number of cycles to failure (%) % Prestressed (load range: 5.7%-5%) 4% Prestressed (load range: 5.7%-6%) 4% Prestressed (load range: 5.7%-65%) 4% Prestressed (load range: 5.7%-75%) Figure 6.14: Strain in concrete versus normalized number of cycles for the 4% prestressed strengthened beams The changes in concrete strain with the number of cycles for the 6% prestressed strengthened beams (Figure 6.15) were similar to those of the 4% prestressed strengthened beams. Strain gauges failed at 5% and 2% of the fatigue lives of specimens that were loaded at load ranges of 5.8%-5% and 5.8%-55%, respectively. The compressive strains in the concrete for the beam that was loaded at 5.8%-65% exhibited an initial increase during the first 22% of the fatigue life. This increase was accompanied by an initial increase in the slip of the prestressed CFRP rod (Section 6.6). When slip occurred, it led to a reduction in the 119
141 prestressing force in the CFRP rod (Section 6.7) and a larger deflection in the beam. As a result, the flexural cracks increased in length, and higher compressive strains were induced in the concrete. Maximum strain in concrete (micro-strain) Percent of the number of cycles to faliure (%) % Prestressed (load range:5.8%-5%) 6% Prestressed (load range:5.8%-55%) 6% Prestressed (load range:5.8%-65%) 6% Prestressed (load range:5.8%-68.8%) 6% Prestressed (load range:5.8%-72.5%) Figure 6.15: Strain in concrete versus normalized number of cycles for the 6% prestressed strengthened beams 6.4 Strain in the Tension Steel Reinforcement versus Number of Cycles As mentioned in Chapter 3, a strain gauge was mounted on each tension reinforcing bar at the mid span section. Figure 6.16 shows the maximum tensile strains versus cycles as a percentage of the number of cycles to failure for a control beam (loaded at a load range of 1%-75%). Both reinforcing bars (right and left) showed a similar behaviour until at a given number of cycles, one of the reinforcing bars exhibited a sudden increase in its maximum tensile strain, while the second rebar showed a sudden reduction in the maximum tensile strain indicating that it had failed. As the fatigue crack in the failing bar rapidly increased in length just before 12
142 failure, there was a transfer of load from the cracked rebar to the intact rebar, a rapid decrease in the maximum load and the tensile strain in the cracked rebar, and an increase in the maximum load and the maximum tensile strain in the intact rebar. Figure 6.17 illustrates schematically the tensile stress distributions in a rebar before and after a fatigue crack leads to failure of a rebar. Within the constant moment region, the initial stresses in the tension steel are equal at the flexural crack locations. Once a fatigue crack propagates through a rebar, the stresses in the failed rebar will be zero at the location of the fatigue crack. As distance from the fatigue crack increases, the stress in the rebar increases and approaches the stress for an uncracked bar Strain in tension steel reinforcement (micro-strain) Right reinforcing bar 25 Left reinforcing bar Fatigue Life (%) Figure 6.16: Typical strain in the tension steel reinforcement versus normalized number of cycles (Control beam: 1%-75%) 121
143 Before initiation of the fatigue crack After initiation of the fatigue crack Constant Moment Region Fatigue crack Strain gauge Stress in the reinforcing bar (at the bottom fibre) After initiation of the fatigue crack Flexural crack location Flexural crack location Flexural crack location Flexural crack location Flexural crack location Before initiation of the fatigue crack Stress in the reinforcing bar (at the top fibre) Figure 6.17: Effect of a fatigue crack on the stress (strain) of a tension steel reinforcing bar The maximum tensile strain versus normalized number of cycles for the control beams is shown in Figure Initially, there is a small increase in the strain range of the tension steel reinforcement due to softening of the concrete. Thereafter, the strain stabilizes until one of 122
144 the tension reinforcing bars fails by fatigue. This is accompanied by an increase in the force and the strain readings of the second reinforcing bar as previously described. 7 Maximum Strain in Tension Steel (micro-strain) Control (load range: 1%-55%) 1 Control (load range: 1%-65%) Control (load range: 1%-75%) Control (load range: 1%-8%) Percent of the number of cycles to failure (%) Figure 6.18: Strain in the tension steel reinforcement versus normalized number of cycles for the control beams The maximum tensile reinforcement strains for the non-prestressed strengthened beams show a strain versus number of cycles pattern that is similar to that of the control beams. Figure 6.19 shows the maximum strain readings for the two tension reinforcing bars versus the normalized number of cycles for a typical non-prestressed strengthened beam (6.7%-6%). The behaviour is similar to that of the control beams. 123
145 Maximum strain in tensoin steel (micro-strain) Tension Reinforcing Bar (1) Tension Reinforcing Bar (2) Percent of the number of cycles to failure (%) Figure 6.19: Strain in the tension steel reinforcement versus normalized number of cycles (Non-prestressed strengthened beam: 6.7%-6%) Figure 6.2 shows a plot of the strain readings for the tension reinforcing bars versus normalized number of cycles for various load ranges for the non-prestressed strengthened beams. The behaviour is similar to that of the control beams. The readings of maximum tensile strain in the tension reinforcing bars versus number of cycles for the 4% prestressed strengthened beams are plotted in Figure There was an initial increase in the maximum tensile strain in both rebars (1 and 2) due to an initial slip of the CFRP rod. A period of nearly stable strains was observed followed by a decrease in the strain in one rebar (2) at 35% of the fatigue life of the specimen. In contrast, there was little change in the strain in the strain of second rebar before failure. 124
146 Maximum strain in tension steel (micro-strain) Non-Prestressed (load range: 6.7%-45%) Non-Prestressed (load range: 6.7%-5%) Non-Prestressed (load range: 6.7%-6%) Non-Prestressed (load range: 6.7%-65%) Percent of the number of cycles to failure (%) Figure 6.2: Strain in the tension steel reinforcement versus normalized number of cycles for the non-prestressed strengthened beams 2 18 Maximum strain in tension steel (micro-strain) Tension Reinforcing Bar (1) 2 Tension Reinforcing Bar (2) Percent of the number of cycles to failure (%) Figure 6.21: Strain in the tension steel reinforcement versus normalized number of cycles (4% prestressed strengthened beam: 5.7%-6%) Figure 6.22 shows the maximum strain in the tension steel versus normalized cycles for the 4% prestressed strengthened beams. After an initial change in the maximum tensile strain in 125
147 steel, the steel strains showed little change until failure. For the beam loaded at 5.7%-75%, the maximum tensile strain at the end of the first load application was much larger than for the other beams loaded at lower load ranges calculations indicated that there was yielding of the reinforcing steel. Maximum strain in tension steel (micro-strain) % Prestressed (load range: 5.7%-5%) 4% Prestressed (load range: 5.7%-6%) 4% Prestressed (load range: 5.7%-65%) 4% Prestressed (load range: 5.7%-75%) Percent of the number of cycles to failure (%) Figure 6.22: Strain in the tension steel reinforcement versus normalized number of cycles for the 4% prestressed strengthened beams Data for maximum tensile strain in the tension steel reinforcement versus the normalized number of cycles to fatigue failure for the 6% prestressed strengthened beams as shown in Figures 6.23 and 6.24 are similar to the data for the other beams (control, non-prestressed, and 4% prestressed strengthened beams). The strains in the beams stabilized after 5% of their fatigue lives and remained stable until 95% of their fatigue lives. 126
148 3 275 Maximum strain in tension steel (micro-strain) Tension Reinforcing Bar (1) 25 Tension Reinforcing Bar (2) Percent of the number of cycles to failure (%) Figure 6.23: Strain in the tension steel reinforcement versus normalized number of cycles (6% prestressed strengthened beam: 5.8%-68.8%) Maximum sstrain in tension steel (micro-strain) % Prestressed (load range:5.8%-5%) 6% Prestressed (load range:5.8%-55%) 6% Prestressed (load range:5.8%-65%) 6% Prestressed (load range:5.8%-68.8%) 6% Prestressed (load range:5.8%-72.5%) 6% Prestressed (load range:5.8%-77.5%) Percent of the number of cycles to failure (%) Figure 6.24: Strain in the tension steel reinforcement versus normalized number of cycles for the 6% prestressed strengthened beams 127
149 6.5 Slip in the CFRP Rod versus Number of Cycles Slip in the prestressed CFRP rod causes a redistribution of the stresses in all of a beam s constituent materials (concrete, compression and tension steel reinforcement and CFRP rod). When slip between the CFRP rod and the epoxy occurred under cyclic loading, the prestressing force in the prestressed CFRP rod was reduced. The mean compressive stress increased in the compression steel and the concrete, while the tension steel underwent an increase in its tensile mean stress. This caused the beam to fail at a fatigue life much shorter than would have been the fatigue life of a beam that did not experience slip between the CFRP rod and the concrete. In the current study, the slip of the CFRP rod was measured only for the prestressed strengthened beams. That is because, the prestressed CFRP rod had a high initial stress due to prestressing, whereas the non-prestressed rod had no stress. Thus, under cyclic loading, the slip between the CFRP rod and the concrete is likely to be greater in the beams with prestressed CFRP than in the beams with non-prestressed CFRP reinforcement. Plots of slip between the prestressed CFRP rod and the concrete versus the percentage of the normalized number of cycles for the 4% prestressed strengthened beams are given in Figure It can be seen that when there was slip, most of it occurred within the first 1% of the fatigue life of a specimen. The maximum slip recorded was about 2.mm for a beam tested at a load range of 5.7%-5%. 128
150 North End (load range: 5.7%-5%) South End (load range: 5.7%-5%) Slip in CFRP rod (mm) Percent of the number of cycles to failure (%) Slip in CFRP rod (mm) Load range: 5.7%-5% North End (load range: 5.7%-6%) 1.3 South End (load range: 5.7%-6%) Percent of the number of cycles to failure (%) Slip in CFRP rod (mm) Load range: 5.7%-6% North End (load range: 5.7%-65%) 1.3 South End (load range: 5.7%-65%) Percent of the number of cycles to failure (%) Load range: 5.7%-65% Figure 6.25: Slip versus normalized number of cycles for the 4% prestressed strengthened beams 129
151 The 6% prestressed strengthened beams had values of slip between the prestressed CFRP rod and the epoxy smaller than those of the 4% prestressed beams except for the beam that was reloaded at a 5.8%-77.5% range after 1,5, cycles at a 5.8%-5% range (Figure 6.26). The measured end slip of the prestressed CFRP rod after loading at 5.8%-5% for 1,5, cycles was.16 mm. Once the beam was reloaded at a higher load range of 5.8%-77.5%, the beam failed by a combination of two mechanisms, a bond failure between the prestressed CFRP and the epoxy in one of the end zones followed by splitting of the concrete along the entire length of the beam. The maximum slip recorded in the 6% prestressed strengthened beams was about.16mm. 13
152 1.9.8 North End South End North End South End Slip in CFRP rod (mm) Slip in CFRP rod (mm) Percent of the number of cycles to failure (%) Percent of the number of cycles to failure (%) Load range: 5.8%-5% Load range: 5.8%-55% North End South End North End South End Slip in CFRP rod (mm) Slip in CFRP rod (mm) Percent of the number of cycles to failure (%) Percent of the number of cycles to failure (%) Load range: 5.8%-65% Load range: 5.8%-68.8% Slip in CFRP rod (mm) 1 North End.9 South End Percent of the number of cycles to failure (%) Slip in CFRP rod (mm) 1 North End.9 South End Percent of the number of cycles to failure (%) Load range: 5.8%-72.5% Load range: 5.8%-77.5% Figure 6.26: Slip versus normalized number of cycles for the 6% prestressed strengthened beams 131
153 6.6 Strain in the CFRP Rod versus Number of Cycles Most of the strain gauges on the CFRP rod were damaged long before the fatigue life was reached. Figure 6.27 shows the measured strains in the CFRP rod versus the number of cycles normalized as a percent of the fatigue life for the 4% prestressed strengthened beams. There was a small increase in strains at the beginning of cyclic loading, which is attributed to softening of the concrete. Then, the maximum strain readings remained constant until failure. For the 6% prestressed strengthened beams, the strain gauges survived long enough that most strain readings for the CFRP rod were valid. The results in terms of strain versus the percentage of the fatigue life are shown in Figure There was an initial increase in the maximum strain that is attributed to concrete softening (micro-cracking). Then, there was a reduction in the maximum strain in some specimens (5.8%-5%, 5.8%-65%, and 5.8%-68.8%) during cyclic loading. These beams had a large amount of slip between the CFRP rod and the concrete. That led to a reduced prestressing force. The maximum tensile strain in the CFRP rod for the beam tested at a 5.8%-55% load range showed a remarkable increase in strain readings after about 1% of its fatigue life followed by failure of the strain gauge. The beam loaded at 5.8%-65% showed an early reduction in the maximum tensile strain. This is believed to be due to slip in the prestressed CFRP rod leading to a reduction in its prestressing force. The maximum tensile strain in the beam loaded from 5.8%-72.5% of its capacity exhibited a continuous decrease up to failure. It is important to point out that except for the beams loaded at a 5.8%-72.5% and 5.8%-77.5% load range, the beams failed by fatigue of the 132
154 tension steel. The former beam failed by a fatigue failure in the CFRP rod, while the latter failed by a fatigue bond failure. 35 Maximum strain in CFRP rod (micro-strain) % Prestressed (load range:5.7%-5%) 4% Prestressed (load range:5.7%-6%) 5 4% Prestressed (load range:5.7%-65%) 4% Prestressed (load range:5.7%-75%) Percent of the number of cycles to failure (%) Figure 6.27: Strain in the CFRP rod versus normalized number of cycles for the 4% prestressed strengthened beams 4 35 Strain in CFRP rod (micro-strain) % Prestressed (load range:5.8%-5%) 6% Prestressed (load range:5.8%-55%) 6% Prestressed (load range:5.8%-65%) 6% Prestressed (load range:5.8%-68.8%) 6% Prestressed (load range:5.8%-72.5%) 6% Prestressed (load range:5.8%-77.5%) Percent of the number of cycles to failure (%) Figure 6.28: Strain in the CFRP rod versus normalized number of cycles for the 6% prestressed strengthened beams 133
155 6.7 Fatigue Life A run-out for fatigue failure of the tension steel reinforcement is taken herein to be 1,, cycles. Table 6-1 and Figure 6.29 give fatigue life data for the control, non-prestressed, 4% prestressed, and 6% prestressed strengthened beams. The fatigue endurance limit for the control beams was found to be a 29kN load range when the minimum cyclic load was 6.5kN. All of the beams that are discussed here failed by a fatigue failure of the tension reinforcing bars. When the beams were strengthened with a non-prestressed CFRP rod, there was an increase in the fatigue limit. The run-out limit for the beams was then 36kN. This amounts to an increase of 24% in the fatigue limit compared to that of the control beams. Despite some scatter, the test results obtained fall close to a log linear curve. Table 6-1: Fatigue test results Group Description Load Range No. of Cycles Mode of Failure 1%-55% Run-out No Failure 1%-65% 34, Tension Steel A Control Beam 1%-75% 17, Tension Steel 1%-8% 9, Tension Steel 1%-85% 39, Tension Steel B Non-prestressed 6.7%-45% 1,3, Tension Steel 6.7%-5% 63, Tension Steel Strengthened 6.7%-6% 22, Tension Steel Beams C D 4% Prestressed Strengthened Beams 6% Prestressed Strengthened Beams 6.7%-65% 13, Tension Steel 5.7%-5% 34, Tension Steel 5.7%-6% 15, Tension Steel 5.7%-65% 14, Tension Steel 5.7%-65% 45, Bond 5.7%-75% 28, Tension Steel 5.8%-5% Run-out No Failure 5.8%-55% 58, Tension Steel 5.8%-65% 24, Tension Steel 5.8%-68.8% 18, Tension Steel 5.8%-72.5% 2,4 CFRP Rod 5.8%-77.5% 6,2 Bond 134
156 Load Range (kn) Control Beams Control Beams (El Refai, 27) Non-prestressed Strengthened Beams 4% Prestressed Strengthened Beams 6% Prestressed Strengthened Beams Number of cycles to failure (N f ) Figure 6.29: Fatigue life of the control, non-prestressed, 4% prestressed, and 6% prestressed strengthened beams A further increase in the fatigue limit was observed, as shown in Figure 6.29, when the beams were strengthened with a 4% prestressed CFRP rod. The fatigue endurance limit increased to a 41kN load range. The increases in the fatigue limit were 41% and 14% compared to those of the control and non-prestressed strengthened beams, respectively. As expected (Chapter 5) and shown in Figure 6.29, the highest fatigue limit was obtained for the 6% prestressed strengthened beams. Based on the experimental fatigue data, two curves are fitted and plotted in the graph for these tests given in Figure 6.3. The solid curve represents the fitted fatigue life curve for failure of the tension steel reinforcement. The dashed curve represents a fatigue life curve for the CFRP rod (the gentle slope assumed for 135
157 the FRP is consistent with results reported in the literature, Jones, 1999). At a load range of 75kN, failure occurred by fatigue of the CFRP rod. A fatigue bond failure was obtained for the beam tested at a load range of 82kN. This beam had been previously loaded at a load range of 5kN and was a run-out (1,5, cycles). A maximum slip of.15 mm in the CFRP rod was recorded, when the beam was loaded at 5kN load range. The fatigue limit of the 6% prestressed strengthened beams was 5kN. The increases were 72%, 39%, and 22% higher than those for the control, non-prestressed, and 4% prestressed strengthened beams, respectively. It is worth mentioning that higher fatigue lives would have been obtained for all the prestressed strengthened beams if no slip between the CFRP rod and the epoxy had occurred % Prestressed Strengthened Beams 8 Load Range (kn) Fatigue failure of CFRP reinforcement Fatigue failure of tension steel reinforcement Number of cycles to failure (N f) Figure 6.3: Fatigue life of the 6% prestressed strengthened beams 136
158 6.8 Summary Based on the fatigue test results presented herein, the main findings are: Three modes of fatigue failure occurred depending on the prestressing level of the CFRP rod. For the control and non-prestressed CFRP strengthened beams, a fatigue rupture in the tension reinforcing bar occurred. For the 4% prestressed strengthened beams, two modes of failure occurred: a bond failure and fatigue failure of the tension reinforcing bars. At the highest level of prestressing (6%), three modes of failure occurred: a bond fatigue failure, a fatigue failure in the prestressed CFRP rod, and a fatigue failure in the tension reinforcing bars; Using a CFRP rod without prestressing increased the fatigue limit of the strengthened beams by 24% compared to the control beam fatigue limit; Strengthening the RC beams with a 4% prestressed NSM CFRP rod increased the fatigue limit by 41% compared to the fatigue limit of the control beams; Using a 6% prestressed CFRP rod further increased the fatigue limit of the strengthened beams. An increase of 72% (5kN) compared to the strength of the control beam was achieved; Prestressing the CFRP rod to a high level (6% of its capacity) caused a fatigue failure in the prestressed CFRP rod before a fatigue failure in the tension steel reinforcement at a high load range. This is attributed to the high mean stress in the CFRP rod due to the prestressing level and the high load range. Prestressing increases the initial tensile strain (and stress) in the CFRP rod and the compressive strain (and stress) in the tension steel; 137
159 A fatigue bond failure was observed for some specimens. The failure was accompanied by a continuous slipping of the CFRP rod at one end of the beam followed by splitting of the concrete cover at the same end, which travelled towards the other end of the beam. In other prestressed beams, with smaller values of slip between the CFRP rod and the concrete, this kind of failure did not occur; The CFRP U-wraps placed at the ends of the fatigue beams reduced the bond degradation (slip) between the prestressed CFRP rod and the epoxy. 138
160 Chapter 7 Monotonic Flexural Model This chapter presents a non-linear flexural model to predict the monotonic behaviour of RC beams prestressed with NSM CFRP rods. The model predicts load, deflection, concrete strain, steel reinforcement strain, and CFRP rod strain at various loading stages. 7.1 Concept of the Model The concept used to predict the flexural behaviour of the RC beams (control, non-prestressed NSM, and prestressed NSM) is based on dividing the beam into a number of elements (sections). These elements fall into: un-cracked and cracked regions as shown in Figure 7.1. The length of the elements within the cracked zone is set equal to the average flexural crack spacing. The un-cracked region is also analyzed using elements having length equal to the average flexural crack spacing. P/2 P/2 P P UNCRACKED ZONE FULLY CRACKED ZONE UNCRACKED ZONE Figure 7.1: Concept of the monotonic flexural model 139
161 7.2 Flexural Crack Spacing Model Figure 7.2 shows schematically, the development of flexural cracks during loading. In the beginning, at a level of loading less than the cracking load, the beam is divided into uncracked elements. When the load reaches the cracking load, equally spaced flexural cracks develop within the maximum moment region (constant moment region). This region will be divided into cracked elements. Outside this region, the beam will be analyzed using uncracked elements with the element size taken to be equal to the average crack spacing. As the load increases, new flexural cracks are initiated. At ultimate stage, all flexural cracks are considered completely developed (crack stabilization state). The un-cracked and cracked regions of the beam are estimated as described below. The un-cracked zone extends from the support of the beam to the first flexural or shear crack. The length of the un-cracked zone is not constant during loading. It depends on the cracking moment, the external applied load, and the prestressing level (prestressed strengthened beam) as shown in Figure 7.3. All the elements within that length are analyzed as un-cracked sections. 14
162 P/2 P/2 P<Pcr P/2 P/2 P=Pcr P/2 P/2 Pcr < P < Py P/2 P/2 Py < P < Pult Figure 7.2: Development of flexural cracks of a beam Note: P is the external applied load P/2 P/2 Ma4 (Ma1 < Ma2 < Ma3< Ma4) Ma3 Cracking Moment (Mcr) Ma = Mcr Sun3 Sun2 Sun1 Ma2 Ma1 Applied Moment (Ma) l/3 l/3 l/3 l Note: Ma1, Ma2,Ma3, Ma4: are external applied load Figure 7.3: Un-cracked region in the beam 141
163 Thus, considering the effect of prestressing, the un-cracked length (Sun) can be described by Equation (7-1) and (7-2). l = 2 S un applied M < M cr (7-1) S un l = 3 M applied M cr M prestress M applied > M cr (7-2) where, S un : The un-cracked length of un-cracked zone, l : The length of the beam, M cr : The cracking moment of the beam, M applied : The external applied moment, M prestress : The prestressing moment at a given section. The fully cracked zone extends over the region in which the moment is higher than the cracking moment. An equation suggested by Euro-Code 2 is used to predict the average flexural crack spacing - Equation (7-3). s m φ = k1k 2 (7-3) ρ = A eff s ρ eff (7-4) Acef 142
164 2.5 b c. c. A cef = min (7-5) ( h c) b 3 where s m : The flexural crack spacing of the RC beam, k 1 : The bond coefficient (.8 for high bond rebars and 1.6 for plain rebars), k 2 : The strain distribution coefficient (.5 for bending and 1. for pure tension), φ : The diameter of the reinforcing bar, ρ eff : The effective reinforcement ratio, A s : The area of the tension reinforcement, A cef : The area of concrete in tension, b : The width of the beam cross section, c.c. : The concrete cover, h : The depth of the beam, c : The neutral axis location. For CFRP strengthened beams, Equation (7-3) is modified to account for the modular ratio of the reinforcing materials (steel and CFRP). The revised equation can be rewritten as follows: 143
165 s m φ = k1k 2 (7-6) ( ρ ) eff equivalent where, As + n A E frp (ρ eff ) equivalent = (7-7) A cef E frp n E = (7-8) E s where, A frp : The area of the FRP reinforcement, n : Modular ratio of CFRP reinforcement relation to steel, E E s : Young s Modulus of the steel reinforcement, E frp : Young s Modulus of the CFRP reinforcement. The calculated flexural crack spacing of the control beam was found to be 74 mm compared to an observed average value of 8 mm in the beam tests. On the other hand, for a strengthened beam, the flexural crack spacing is found using Equation (7-6) to be 71 mm which is smaller than that of the control beam. The predicted flexural crack spacing shows a reasonable agreement to that experimentally measured (76 mm). The total number of cracked elements ( k ) is calculated using Equation (7-9). 144
166 k l 2S = sm un (7-9) Using an element size equal to the average crack spacing, the total number of un-cracked elements ( m ) within the un-cracked length at any given load is given by Equation (7-1). Sun m = (7-1) s m Thus, the total number of elements ( n ), un-cracked and cracked, for half of the beam is as follows. k n = m + (7-11) Assumptions of the Model Several assumptions summarized as follows are utilized in the current model: Plane sections remain plane after bending; Perfect bond exists between the concrete, the steel, and the CFRP rod; Shear effects are neglected. 7.4 Material Properties The beams have three materials: concrete, steel reinforcement and CFRP reinforcement. The stress-strain relationships are assumed to be as follows. 145
167 7.4.1 Concrete Concrete is assumed to have a parabolic stress-strain relationship as shown in Figure 7.4. The stress in the concrete vs. corresponding strain can be expressed as given by Equation (7-12) (Collins and Mitchell, 1987). f c = f ' c 2ε ε ε o ε o 2 (7-12) ' c 2 f ε o = (7-13) E c 45 c ' E c = f (7-14) where, f c : The concrete stress corresponding to a given concrete strain (ε ), ' f c : The concrete compressive strength, ε : The concrete stain corresponding to a given concrete stress ( f c ), ε o : The concrete strain corresponding to the concrete compressive strength, E c : The Young s modulus of concrete. 146
168 Stress (MPa) Strain (mm/mm) -5 Figure 7.4: Stress-strain relationship of concrete Tension and Compression Steel Reinforcement The compression and tension reinforcement are assumed to be elastic-plastic with a 1% strain hardening slope (bi-linear behaviour), the idealized stress-strain relationship is shown in Figure 7.5. Equation (7-15) gives the expression for steel stress vs. corresponding strain. f s = ε s f y E s + ε ε s y E ( ε ε ) ε ε (7-15) sp s y s y E SP =.1E s (7-16) 147
169 where, f : The steel stress corresponding to a given steel strain ( ε ), s s f : The steel yield stress corresponding to the steel yield strain ( ε ), y y ε : The steel strain corresponding to a given steel stress ( f ), s s ε : The steel yield strain corresponding to the steel yield stress ( f ), y y E s : The modulus of steel before yielding (pre-yielding stage), E SP : The modulus of steel after yielding (post-yielding stage) Stress (MPa) Strain (mm/mm) Figure 7.5: Stress-strain relationship of steel reinforcement CFRP Rod Figure 7.6 shows the stress-strain curve of the CFRP rod used which is linearly elastic up to failure. The relationship is given in Equation (7-17). 148
170 f cfrp = ε (7-17) E cfrp cfrp where, f : The CFRP stress corresponding to a given CFRP strain ( ε ), cfrp cfrp ε : The CFRP strain corresponding to a given CFRP stress ( f ), cfrp cfrp E cfrp : The Young s modulus of the CFRP rod Stress (MPa) Strain (mm/mm) Figure 7.6: Stress-strain relationship of CFRP rod 7.5 An Estimation of RC Beam Deflection The maximum deflection of the RC beam at the mid-span is estimated based on an integration of the curvatures in the un-cracked and cracked sections of along one half of the beam length. It is given by: 149
171 l 2 Δ = x φ dx (7-18) Using numerical integration, Equation (7-18) can be rewritten as follows. Δ mid i n = = span i= 1 x φ s (7-19) i i m where, Δ mid span : The mid-span deflection of the beam, n : The number of element within the half of the beam length, x i : The distance between the support to a given element (i ), φ i : The curvature at a given element (i ), s m : The flexural crack spacing. 7.6 Sectional Analysis Section analysis is used to estimate the strains and the curvatures along the length of the beam. In the control and non-prestressed strengthened beams, the initial strains in the constituent materials (concrete, steel reinforcement, and CFRP rod) are zero. But, in the prestressed strengthened beams, these initial strains have non-zero values due to prestressing. 15
172 Initial Strains due to Prestressing: When the beam is strengthened with prestressed CFRP rod, initial strains are induced in the constituent materials (concrete, compression, tension, and CFRP rod). These strains are calculated using the basic principles of mechanics and the model assumption of Section 7.4. The initial strain in the CFRP rod due to prestressing can be estimated using Equation (7-2). P i ε cfrp i = (7-2) Acfrp E cfrp Pr estress where, ε cfrp i : The initial strain in the CFRP rod due to prestressing force ( P i ), P i : The prestressing force at a given element (i ), A cfrp : The cross-sectional area of the CFRP rod, E cfrp : Young Modulus of the CFRP. The initial strains due to prestressing in the extreme top and bottom fibres of the concrete, compression and tension reinforcement can estimated as follows. Pi A = Pi ei y t + I sec tion section ε t (7-21) i Ec Pi Pi ei y b A tion I sec section ε b = (7-22) i E c 151
173 ' Pi Pi ei ( yt d ) + A tion I ' sec sec tion ε s = (7-23) i E c Pi Pi ei ( yb h + d) A I = section section ε s (7-24) i Ec where, ε t : The initial strain in the concrete at the top fibre of beam cross section due to i prestressing, P i : The prestressing force at a given element (i ), e i : The eccentricity of the prestressing force from the neutral axis for a given element (i ), y t : The distance between the top fibre of the beam cross section to the neutral axis of a given element (i ), E c : Young Modulus of concrete, ε b i : The initial strain in the concrete at the bottom fibre of beam cross section due to prestressing, y b : The distance between the bottom fibre of the beam cross section to the neutral axis of a given element (i ), ' ε s i : The initial strain in the compression steel reinforcement due to prestressing, 152
174 ' d : The distance from the centre of the compression steel reinforcement to the top fibre of the beam cross section, ε s i : The initial strain in the tension steel reinforcement due to prestressing, h : The depth of the cross section of the beam, d : The distance between the centre of the tension steel reinforcement to the top fibre of the beam cross section Equilibrium Requirements for Sectional Analysis For any given section, the resultant of the internal forces (concrete, steel reinforcement and CFRP reinforcement) in the section equals zero and the internal moment of the section equals to the external applied moment. The equilibrium of the internal forces can be expressed as given in Equation (7-25). ' ' cdac + f s das f ctdact f sdas f cfrpdacfrp = f A A A ' c s ct As A cfrp (7-25) And the moment equilibrium is given in Equation (7-26) as follows. ' ' fc ydac + fs ydas fct ydact fs ydas fcfrp ydacfrp = A A A ' c s ct As Acfpr M ext (7-26) 153
175 where, A c : The area of concrete in compression, f c : The compression stress of concrete, A ct : The area of concrete in tension, f ct : The tension stress of concrete, ' A s : The area of the compression steel reinforcement, ' f s : The stress in the compression steel reinforcement, A s : The area of the tension steel reinforcement, f s : The stress in the tension steel reinforcement, A cfrp : The area of the CFRP reinforcement, f cfrp : The stress in the CFRP reinforcement, y: The vertical distance from the neutral axis to the corresponding force, M ext : The external applied bending moment. The actual concrete compressive stress in the compression zone can be simplified by replacing it with an equivalent rectangular block as shown in Figure 7.7. This block can be obtained by using the stress-block factors, α1 and β1 given in Equation (7-27) and (7-28) (Collins and Mitchell, 1987). 154
176 α1 f c Actual concrete compressive stress h Neutral Axis c β1c f's Equivalent concrete compressive stress fs b Cross Section fcfrp Stress Distribution Figure 7.7: Equivalent compressive stress in concrete 2 ε c 1 ε c α 1β1 = 3 (7-27) ε co ε co ε c 4 ε co β 1 = (7-28) 2ε c 6 ε co where, α 1 : The ratio of the average stress in the compression stress block to the concrete strength, β 1 : The ratio of the depth of the compression stress block to the depth of the neutral axis, ε c : The strain at extreme top fibre of concrete for a given load level, ε co : The corresponding strain in concrete to the concrete compressive strength. 155
177 The magnitude of the resultant compressive concrete force and its location from the neutral axis of the section are given by Equation (7-29) and (7-3) (Collins and Mitchell, 1987): C c c ' = f c b dy = α 1β 1 f ccb (7-29) y c f c = c f b y dy c b dy 1 = c β c 2 c 1 (7-3) where, C c : The resultant concrete compression force at a given stress ( f c ), y c : The distance between the neutral axis to the equivalent concrete compression force location. The concrete tensile stress used in the equilibrium equations (7-25 and 7-26) is determined as follows. When the tensile stress at the extreme bottom fibre of concrete is less than the tensile strength of concrete ( f r ), the magnitude and location of the concrete tensile force is given by Equations (7-31) and (7-32), respectively as follows: 156
178 A ct 1 f ct d Act = b f r ( h c) (7-31) 2 A ct f ct y d A ct 1 = b 3 f r ( h c) 2 (7-32) f ' r.6λ f c = (7-33) where, f r : The modulus of rupture of concrete, λ : Factor to account for concrete density Pre-cracking Stage In the pre-cracked stage, the tensile stress in the concrete at the extreme bottom fibre of the section is less than the tensile strength of concrete. This means that the entire section (fullcomposite action) is acting to resist the external applied load. Thus, the gross moment of inertia (Ig) is used at this stage. All elements within the beam are considered to be un-cracked. Prestressed Strengthened Beam For the prestressed beam, the calculation procedure for the strains and the deflections is different from the control and non-prestressed strengthened beam. The strains in the beam have initial values that depend on the prestressing level. The beam is considered to have 157
179 elastic behaviour within the pre-cracking stage, and thus the neutral axis location can be found by using superposition as shown in Figure 7.8. Stress due to -P/A P.e y/isec Prestressing Mex y/isec Final Stress (-) (+) (+) (+) (-) + = + = (-) (-) (+) (-) Cross-section Prestressing External Moment Figure 7.8: Internal stresses of prestressed strengthened beam at pre-cracking stage The strains in the top and bottom concrete section: M ext i yt I sec tion ε c = ε c (7-34) i E c M ext i yb I section ε t = ε t + (7-35) i E c 158
180 The strains in tension and compression steel reinforcement: ( d y ) M ext i t I sec tion ε s = ε s + (7-36) i E c ( y d ) M ext i t I sec tion ε s = ε s (7-37) i E c The strain in the CFRP rod: ( d y ) M ext i f t I sec tion ε cfrp = ε cfrp + (7-38) i E c The strains in concrete, steel reinforcement and CFRP rod are related linearly as shown in Figure 7.9. These strains can be expressed in terms of the extreme top compressive strain of concrete as follows. ' ' ( c d ) ε s = ε c (7-39) c 159
181 ( d c ) ε s = ε c (7-4) c ( d f c) ε cfrp = ε c (7-41) c ( h c) ε t = ε c (7-42) c where, ε c : The strain at the extreme top fibre of the cross section, ' ε s : The strain in the compression steel reinforcement, ε s : The strain in the tension steel reinforcement, ε cfrp : The strain in the CFRP reinforcement (rod), ε t : The strain at the extreme bottom fibre of the cross section. 16
182 Cross-Section Strain Distribution Stress Distribution Equivalent Forces Control h ds d' c N.A εs εc ε's fc f s Tc Ts C s Cc b εt ft Strain Distribution Stress Distribution Equivalent Forces Prestressed Non-Prestressed ds h df ds h df d' c d' c b N.A Initial strain profile due to prestressing b N.A εs εfrp εt εs εfrp εt εc ε's ft fc Tc Ts Tfrp Strain Distribution Stress Distribution Equivalent Forces εc ε's fs ffrp fc ft εfrp (load)+εfrp(pre)+εfrp(c) f s f s Tc Ts Tfrp C s Cc C s Cc Figure 7.9: Strain, stress distribution and internal forces at pre-cracking stage The force and moment equilibrium equation for the control, non-prestressed, and prestressed strengthened beams can be rewritten as given in Equation (7-43) and (7-48). Control Beam 1 ' 1 bf cc + As fs bfct ( h c) As fs 2 2 = (7-43) 161
183 162 ext s s ct s s c M c d f A c h bf d c f A c bf = + ) ( ) ( 3 1 ) ' ( ' ' (7-44) Non-Prestressed Strengthened Beam ) ( ' ' = + cfrp cfrp s s ct s s c f A f A c h bf f A c bf (7-45) 2 2 ) ( 3 1 ) ' ( ' ' 3 1 c h bf d c f A c bf ct s s c + ext s s M c d f A c d f A f cfrp cfrp = ) ( ) ( (7-46) Prestressed Strengthened Beam s s ct s s c f A c h bf f A c bf + ) ( ' ' ) ( ) ( ) ( = + + load cfrp cfrp cfrp c cfrp pre cfrp E A ε ε ε (7-47) ) ( ) ( 3 1 ) ( ' ' ' c d f A c h bf d c f A c bf s s s s ct c + ( ) ext f load cfrp CFRP cfrp M c d E A c cfrp pre cfrp = + + ) ( ) ( ) ( ε ε ε (7-48)
184 7.6.3 Pre-yielding Stage When the tensile stress in the extreme bottom fibre of the concrete exceeds the tensile strength of concrete, flexural cracks appear and the beam is considered to be composed of cracked sections. The stress distribution in a section will change as shown in Figure 7.1. Cross-Section Strain Distribution Stress Distribution Equivalent Forces Control h ds d' c N.A εs εc ε's fs fc f s Tc Ts Cs Cc b εt Strain Distribution Stress Distribution Equivalent Forces Prestressed Non-Prestressed ds h df ds h df d' c d' c b N.A Initial strain profile due to prestressing b N.A εs εfrp εt εs εfrp εt εc ε's fc Ts Tfrp Strain Distribution Stress Distribution Equivalent Forces εc ε's fs ffrp fs ffrp fc f s Ts Tfrp εcfrp (load)+ εcfrp (pre)+ εcfrp (c) Cs Cc Cs Cc Figure 7.1: Strain, stress distribution and internal forces at pre-yielding stage 163
185 The force and moment equilibrium equations can be expressed for the pre-yielding stage as follows. Control Beam ' ' ' α β bcf A f A f (7-49) 1 1 c + s s s s = c c 1 ' ' ' + As f s ( c d ' 1β1 β1 α bcf ) As f s ( d c ) = M ext (7-5) 2 Non-Prestressed Strengthened Beam ' ' ' α β bcf A f A f A f (7-51) 1 1 c + s s s s CFRP CFRP = c c 1 ' ' ' + As f s ( c d ' 1β1 β1 α bcf ) As f s ( d c ) Acfrp f cfrp ( d f c ) = M ext (7-52) 2 Prestressed Strengthened Beam ' ' ' α 1β1bcf c + As f s As f s AcfrpEcfrp ε cfrp + ε + cfrp = ( ) cfrp ε (7-53) ( ) ( load ) pre c ' 1 α ' ' ' 1 β 1bcfc c β 1 + As f s ( c d ) As f s( d c ) 2 A cfrp E CFRP ( d f c) M ext ε cfrp + ε cfrp + ε cfrp = (7-54) pre c ( load ) ( ) ( ) 164
186 7.6.4 Post-yielding Stage The post-yielding stage starts when the tension steel reinforcement yields. The stress and strain distributions in a section during the post-yielding stage are given in Figure Cross-Section Strain Distribution Stress Distribution Equivalent Forces Control h ds d' c N.A εs εc ε's fs fc f s Tc Ts Cs Cc b Strain Distribution Stress Distribution Equivalent Forces d' c N.A εc ε's fc f s Cc Cs h df ds b εs εfrp fs ffrp Ts Tfrp d' c Initial strain profile due to prestressing N.A Strain Distribution Stress Distribution Equivalent Forces εc ε's fc f s Cc Cs h df ds b εs εfrp fs Ts ffrp Tfrp εcfrp (load)+ εcfrp (pre)+ εcfrp (c) Figure 7.11: Strain, stress distribution, and internal forces at post-yielding stage 165
187 The force and moment equilibrium equations can be written as follows: Control Beam ( f +.1E ( ε ε )) ' ' ' 1 β1bcfc + As f s As y SP s y = α (7-55) ( f y +.1 ESP ( ε s y ) ) ( d c M ext c c 1 ' ' ' + As f s ( c d ' 1β1 β ) As ε α bcf ) = (7-56) 2 Non-Prestressed Strengthened Beam ( f +.1E ( ε ε )) A f ' ' ' 1 β1bcf c + As f s As y SP s y cfrp cfrp = α (7-57) ( f +.1E ( ε ε ))( d c ) ' 1 α ' ' ' 1 β 1bcfc c β + As f s ( c d ) As y SP s y 2 A f ( d c) = M (7-58) cfrp cfrp f ext Prestressed Strengthened Beam α β bcf + A f A ( f +.1E ( ε ε )) ' ' ' 1 1 c s s s y SP s y A cfrp E cfrp ( ε + ε + ε ) = (7-59) cfrp ( pre) cfrp ( c) cfrp ( load ) 1 ' ( f +.1E ( ε ))( d ) ' ' ' 1 1bf cc α β c β + As f s ( c d ) A ε s y SP s y c 2 1 A E ( ε + ε + ε )( d c) = M (7-6) cfrp cfrp cfrp ( pre) cfrp ( c) cfrp ( load ) f ext 166
188 It should be noted that each element in the beam is dealt with based on the applied load level for that element to calculate the stresses, strains, and deflection of the beam. For example, at ultimate stage, the constant moment region will be analyzed as a post-yielding stage. Part of the shear span is analyzed as pre-yielding stage. Sections near the support may be analyzed as un-cracked section (pre-cracking). 7.7 Calculation Procedure Control and Non-prestressed Strengthened RC Beams The calculation procedure to predict the load-deflection for a given element within the beam (control and non-prestressed) is given as follows: Assume a given external applied load on the beam; Calculate the external moment for the element being analyzed; Assume a strain (higher than the initial strain) at the compression fibre of concrete (for prestressed beam) at the given element; Calculate the equivalent stress block factors ( α 1 ) and ( β 1 ) of the compression stress of the concrete using Equations (7-27) and (7-28); Calculate the neutral axis depth using force equilibrium equations; Calculate the stresses and strains in the compression, tension steel and CFRP reinforcement; Calculate the internal moment; Compare the calculated internal moment to the assumed external moment; 167
189 Perform a trial and error procedure by revising the assumed value of the concrete strain, until the internal and external moments are equal; Calculate the curvature of the given element (i ); Calculate the deflection of the given element (i ); Repeat the procedure for all elements within the half length of the beam; Calculate the deflection for the given applied external load; Repeat the procedure for new values of the external load. The above procedure is summarized in a flowchart as shown in Figure It includes the call functions for the un-cracked and cracked section analysis that are given in Figure 7.13 and 7.14, respectively. The flowchart for calculating initial strains and camber in prestressed strengthened beams is given in Figure 15. The flowchart for calculation of the mid-section deflection is given in Figure Prestressed Strengthened RC Beams The calculation procedure for the prestressed strengthened beam is slightly different from the control and the non-prestressed strengthened beams due to initial strains induced in the section. The summary is given as follows. Calculate the initial strains in the section due to prestressing; Calculate the initial deflection of the beam (camber); Assume an external applied load; Calculate the stresses and the strains at given element (i ); 168
190 Calculate the neutral axis of the section based on the stress profile produced; Calculate the curvature at a given element (i ); Calculate the deflection at a given element (i ); Increase the external applied load by certain increment; Repeat the procedure until the external applied load equal to the cracking load of the beam; Beyond the cracking load, the same procedure for the control and non-prestressed strengthened beams is used considering the total strain in the CFRP rod (prestressing strain and decompression strain in the concrete at the level of the CFRP rod). 169
191 Start Input dimensions of the beam Input the material properties No Is the beam strengthened? Yes Calculate the average flexural crack Calculate the average flexural crack spacing of control beam (Sm) spacing of strengthened beam(sm) Divide the beam into number of element (i) based on (Sm) Is the beam Prestressed? No Yes Call Initial strains and cambering Calculate the Mcr Pext =. Pext = Pext +.1 i = i = i + 1 Calculate the Mext for element (i) Call Deflection Calculation Yes i < n No Yes Mint < Mcr No Save P and Δ Call Un-cracked Section Call Cracked Section εs >.3 No Yes Stop Figure 7.12: Main flowchart of the model 17
192 Un-cracked Section No Is the beam prestressed? Yes Assume initial compression strain in concrete εci =. Calculate the stresses and the strains To due external applied load εci = εci +.1 Calculate the total stresses and strains (prestressing and loading) Calculate the neutral axis depth (c) using force equilibrium equation Calculate the neutral axis location Calculate the internal moment (Mint) Error =.1 Mint Solution = Mext - Mint No Solution < Error Yes Return Figure 7.13: Flowchart of the un-cracked section analysis 171
193 Cracked Section Assume initial compression strain in concrete εci = initial strain (prestressing) εci = εci +.1 Calculate α and β Calculate the neutral axis depth (c) using force equilibrium equation Calculate the strains (compression, tension, and CFRP reinforcement) No εs < εy Yes Calculate the internal moment (Mint) (plastic region of steel) Calculate the internal moment (Mint) (elastic region of steel) Calculate the neutral axis depth (c) using force equilibrium equation Error =.1 Mint Solution = Mext - Mint No Solution < Error Yes Return Figure 7.14: Flowchart of the cracked section analysis 172
194 Initial strains and cambering Calculate the transfer length (Chapter 4) Calculate the strains and strains for a given element (i) Call Deflection calculation Return Figure 7.15: Flowchart of the initial strain and cambering of the prestressed beams Deflection calculation Calculate the distance from element (i) to the support Calculate the incremental deflection at element (i) Add the incremental deflection of element (i) to the accumulative deflection of other elements at the given load Return Figure 7.16: Flowchart of the deflection calculation 173
195 7.8 Computer Program and Verification of the Model The model was coded using Visual Basic 6 into a computer program called NSM-FRP. The NSM-FRP is divided into three sub-programs based on the condition of the beam: control, non-prestressed strengthened and prestressed strengthened beam. The predictions from the model were compared with the experimental results Computer Program (NSM-FRP) Inputs for the program include the cross-section of the beam, NSM groove size, amount of reinforcement and material properties (concrete, steel reinforcement, and CFRP reinforcement). It also allows specifying the prestressing level of the FRP reinforcement. The output of the program includes a graphical representation of the load-deflection, loadstrain in concrete, load-strain in the compression and tension steel reinforcement, load-strain in the FRP reinforcement, and moment-curvature relationship. Figure 7.17 shows the plots of the different relationships for the 4% Prestressed strengthened beam. The program also provides the user with an option to save the output results into a text file. 174


196 a) Load-deflection b) Moment-Curvature c) Load-compression steel strain d) Load-tension steel strain e) Load-concrete strain f) Load- CFRP strain Figure 7.17: Outputs of the program 175
Strengthening of Reinforced Concrete Beams using Near-Surface Mounted FRP Mohamed Husain 1, Khaled Fawzy 2, and Mahmoud Nasr 3
 ISSN: 239-5967 ISO 900:2008 Certified Volume 4, Issue 5, September 205 Strengthening of Reinforced Concrete Beams using Near-Surface Mounted FRP Mohamed Husain, Khaled Fawzy 2, and Mahmoud Nasr 3 Abstract-
Ultimate strength prediction for reinforced concrete slabs externally strengthened by fiber reinforced polymer (FRP)
") Ultimate strength prediction for reinforced concrete slabs externally strengthened by fiber reinforced polymer (FRP) Abstract This paper presents the potential use of externally bonded fiber reinforced
Ultimate strength prediction for reinforced concrete slabs externally strengthened by fiber reinforced polymer (FRP) Abstract This paper presents the potential use of externally bonded fiber reinforced
Performance of NSM FRP strengthened concrete slabs at low temperatures
 Fourth International Conference on FRP Composites in Civil Engineering (CICE8) 22-24July 8, Zurich, Switzerland Performance of NSM FRP strengthened concrete slabs at low temperatures P. Burke, L.A. Bisby
STRENGTHENING OF UNBONDED POST-TENSIONED CONCRETE SLABS USING EXTERNAL FRP COMPOSITES
 STRENGTHENING OF UNBONDED POST-TENSIONED CONCRETE SLABS USING EXTERNAL FRP COMPOSITES F. El M e s k i 1 ; M. Harajli 2 1 PhD student, Dept. of Civil and Environmental Engineering, American Univ. of Beirut;
AN INNOVATIVE DUCTILE COMPOSITE FABRIC FOR STRENGTHENING CONCRETE STRUCTURES. Abstract
 AN INNOVATIVE DUCTILE COMPOSITE FABRIC FOR STRENGTHENING CONCRETE STRUCTURES Nabil F. Grace, Lawrence Technological University, Southfield, MI George Abdel-Sayed, University of Windsor, Windsor, ON Wael
DETERMINATION OF ULTIMATE FLEXTURAL CAPACITY OF STRENGTHENED BEAMS WITH STEEL PLATES AND GFRP INTRODUCTION
 13 th World Conference on Earthquake Engineering Vancouver, B.C., Canada August 1-6, 2004 Paper No. 3242 DETERMINATION OF ULTIMATE FLEXTURAL CAPACITY OF STRENGTHENED BEAMS WITH STEEL PLATES AND GFRP Javad
CRACKING BEHAVIOR AND CRACK WIDTH PREDICTIONS OF CONCRETE BEAMS PRESTRESSED WITH BONDED FRP TENDONS
 CRACKING BEHAVIOR AND CRACK WIDTH PREDICTIONS OF CONCRETE BEAMS PRESTRESSED WITH BONDED FRP TENDONS Weichen XUE Professor Tongji University Siping Road 1239#, Shanghai 200092, China xuewc@tongji.edu.cn*
PRELOADING EFFECT ON LOAD CAPACITY AND DUCTILITY OF RC BEAMS STRENGTHENED WITH PRESTRESSED CFRP STRIPS
 PRELOADING EFFECT ON LOAD CAPACITY AND DUCTILITY OF RC BEAMS STRENGTHENED WITH PRESTRESSED CFRP STRIPS Renata Kotynia Ph.D., Assistant Professor Technical University of Lodz, Poland Al. Politechniki 6,
Fatigue and Overloading Behavior of Steel Concrete Composite Flexural Members Strengthened with High Modulus CFRP Materials
 Fatigue and Overloading Behavior of Steel Concrete Composite Flexural Members Strengthened with High Modulus CFRP Materials M. Dawood 1 ; S. Rizkalla 2 ; and E. Sumner 3 Abstract: Due to corrosion and
STRENGTHENING STEEL-CONCRETE COMPOSITE BRIDGES WITH HIGH MODULUS CARBON FIBER REINFORCED POLYMER (CFRP) LAMINATES
 LAMINATES") Composites in Construction 2005 Third International Conference, Hamelin et al (eds) 2005 ISBN xxxxx Lyon, France, July 11 13, 2005 STRENGTHENING STEEL-CONCRETE COMPOSITE BRIDGES WITH HIGH MODULUS CARBON
Composites in Construction 2005 Third International Conference, Hamelin et al (eds) 2005 ISBN xxxxx Lyon, France, July 11 13, 2005 STRENGTHENING STEEL-CONCRETE COMPOSITE BRIDGES WITH HIGH MODULUS CARBON
THE DESIGN OF EXTERNALLY BONDED REINFORCEMENT (EBR) FOR REINFORCED CONCRETE STRUCTURES BY MEANS OF FIBRE REINFORCED POLYMERS (FRP)
 FOR REINFORCED CONCRETE STRUCTURES BY MEANS OF FIBRE REINFORCED POLYMERS (FRP)") THE DESIGN OF EXTERNALLY BONDED REINFORCEMENT (EBR) FOR REINFORCED CONCRETE STRUCTURES BY MEANS OF FIBRE REINFORCED POLYMERS (FRP) Introduction Dott. Ing. Giovanni Cerretini Studio Technica (studio@technica.net)
THE DESIGN OF EXTERNALLY BONDED REINFORCEMENT (EBR) FOR REINFORCED CONCRETE STRUCTURES BY MEANS OF FIBRE REINFORCED POLYMERS (FRP) Introduction Dott. Ing. Giovanni Cerretini Studio Technica (studio@technica.net)
BEHAVIOR OF INFILL MASONRY WALLS STRENGTHENED WITH FRP MATERIALS
 BEHAVIOR OF INFILL MASONRY WALLS STRENGTHENED WITH FRP MATERIALS D.S. Lunn 1,2, V. Hariharan 1, G. Lucier 1, S.H. Rizkalla 1, and Z. Smith 3 1 North Carolina State University, Constructed Facilities Laboratory,
Tests on FRP-Concrete Bond Behaviour in the presence of Steel
 Tests on FRP-Concrete Bond Behaviour in the presence of Steel M. Taher Khorramabadi and C.J. Burgoyne Engineering Department, University of Cambridge Trumpington St., Cambridge, UK ABSTRACT The bond behaviour
Louisiana Transportation Research Center
 Louisiana Transportation Research Center Final Report 488 Repairing/Strengthening of Bridges with Post-tensioned FRP Materials and Performance Evaluation by C. S. Cai, Ph.D., P.E. Miao Xia Louisiana State
Seismic Performance of GFRP-RC Exterior Beam-Column Joints with Lateral Beams
 Seismic Performance of GFRP-RC Exterior Beam-Column Joints with Lateral Beams By Shervin Khalili Ghomi A Thesis submitted to the Faculty of Graduate Studies of The University of Manitoba in partial fulfillment
Structural health monitoring of structures repaired with FRP
 Structural Studies, Repairs and Maintenance of Heritage Architecture IX 567 Structural health monitoring of structures repaired with FRP Y. Khalighi Department of Civil Engineering, The University of British
Seismic Retrofit Of RC Columns With Inadequate Lap-Splice Length By External Post-Tensioned High-Strength Strips
 Seismic Retrofit Of RC Columns With Inadequate Lap-Splice Length By External Post-Tensioned High-Strength Strips M. Samadi Department of civil engineering., Mashhad Branch, Islamic Azad University, Mashhad,
Effect of Bar-cutoff and Bent-point Locations on Debonding Loads in RC Beams Strengthened with CFRP Plates
 CICE 2010 - The 5th International Conference on FRP Composites in Civil Engineering September 27-29, 2010 Beijing, China Effect of Bar-cutoff and Bent-point Locations on Debonding Loads in RC Beams Strengthened
Assessment of Long-Time Behavior for Bridge Girders Retrofitted with Fiber Reinforced Polymer
 Journal of Civil Engineering and Architecture 9 (2015) 1034-1046 doi: 10.17265/1934-7359/2015.09.003 D DAVID PUBLISHING Assessment of Long-Time Behavior for Bridge Girders Retrofitted with Fiber Reinforced
Address for Correspondence
 Research Paper SHEAR STRENGTHENING OF DIFFERENT BEAMS USING FRP Patel Mitali R 1, Dr.R.K.Gajjar 2 Address for Correspondence 1 Research Scholar, 2 Professor and Head, Applied Mechanics Department, L. D.
Moment curvature analysis of concrete flexural members confined with CFRP grids
 Materials Characterisation V 131 Moment curvature analysis of concrete flexural members confined with CFRP grids A. Michael & P. Christou Department of Civil Engineering, Frederick University, Cyprus Abstract
Retrofitting of Reinforced Concrete Beam with Externally Bonded CFRP
 IJIRST International Journal for Innovative Research in Science & Technology Volume 2 Issue 07 December 2015 ISSN (online): 2349-6010 Retrofitting of Reinforced Concrete Beam with Externally Bonded CFRP
6. Performing Organization Code 7. Author(s) 8. Performing Organization Report No.
 8. Performing Organization Report No.") 1. Report No. FHWA/TX--1776-2 4. Title and Subtitle Technical Report Documentation Page 2. Government Accession No. 3. Recipient s Catalog No. Increasing the Flexural Capacity of Typical Reinforced Concrete
1. Report No. FHWA/TX--1776-2 4. Title and Subtitle Technical Report Documentation Page 2. Government Accession No. 3. Recipient s Catalog No. Increasing the Flexural Capacity of Typical Reinforced Concrete
Upgrading the shear strength of non-ductile reinforced concrete frame connections using FRP overlay systems
 Upgrading the shear strength of non-ductile reinforced concrete frame connections using FRP overlay systems Mohamad J. Terro Associate Professor. Civil Engineering Department, Kuwait University. Sameer
DESIGN GUIDELINES FOR BRIDGE DECK SLABS REINFORCED by CFRP and GFRP
 ------------ DESIGN GUIDELINES FOR BRIDGE DECK SLABS REINFORCED by CFRP and GFRP Tarek Hassan 1, Amr Abdelrahman 2, Gamil Tadros 3, and Sami Rizkalla 4 Summary The use of carbon and glass fibre reinforced
Application of Tensioned CFRP Strip Method to an Existing Bridge
 SP-230 66 Application of Tensioned CFRP Strip Method to an Existing Bridge by A. Tateishi, A. Kobayashi, Y. Hamada, T. Takahashi, and H. Yasumori Synop nopsis: s: Tensioned carbon fiber reinforced polymer
Bond Characteristics of GFRP Sheet on Strengthened Concrete Beams due to Flexural Loading
 Bond Characteristics of GFRP Sheet on Strengthened Concrete Beams due to Flexural Loading Rudy Djamaluddin, Mufti Amir Sultan, Rita Irmawati, and Hino Shinichi Abstract Fiber reinforced polymer (FRP) has
Experimental Study of Reinforced Concrete (RC) Beams Strengthened by Carbon Fiber Reinforced Polymer (CFRP): Effect of Beam Size and Length of CFRP.
 Beams Strengthened by Carbon Fiber Reinforced Polymer (CFRP): Effect of Beam Size and Length of CFRP.") Experimental Study of Reinforced Concrete (RC) Beams Strengthened by Carbon Fiber Reinforced Polymer (CFRP): Effect of Beam Size and Length of CFRP. Mohit Jaiswal Assistant Professor, Department of Civil
Experimental Study of Reinforced Concrete (RC) Beams Strengthened by Carbon Fiber Reinforced Polymer (CFRP): Effect of Beam Size and Length of CFRP. Mohit Jaiswal Assistant Professor, Department of Civil
Repair of glulam beams using GFRP rods
 Structural Studies, Repairs and Maintenance of Heritage Architecture XI 417 Repair of glulam beams using GFRP rods G. M. Raftery & A. M. Harte Department of Civil Engineering, National University of Ireland,
STATIC AND FATIGUE PERFORMANCE OF 40 YEAR OLD PRESTRESSED CONCRETE GIRDERS STRENGTHENED WITH VARIOUS CFRP SYSTEMS
 STATIC AND FATIGUE PERFORMANCE OF 40 YEAR OLD PRESTRESSED CONCRETE GIRDERS STRENGTHENED WITH VARIOUS CFRP SYSTEMS O. A. ROSENBOOM, Dr. T. K. HASSAN Department of Civil, Construction, & Environmental Engineering,
Strengthening of prestressed concrete hollow-core slab openings using near-surface-mounted carbonfiber-reinforced
 Strengthening of prestressed concrete hollow-core slab openings using near-surface-mounted carbonfiber-reinforced polymer reinforcement Karam Mahmoud, Steven Foubert, and Ehab El-Salakawy Precast, prestressed
SEISMIC RETROFIT OF BEAM-COLUMN JOINTS WITH FRP SHEETS
 B-4 ADVANCED COMPOSITE MATERIALS IN BRIDGES AND STRUCTURES MATÉRIAUX COMPOSITES D'AVANT GARDE POUR PONTS ET CHARPENTES Winnipeg, Manitoba, Canada, September 22 24, 28 / 22, 23 et 24 septembre 28 SEISMIC
1. INTRODUCTION. (a) Sand/ Fabric-coated (b) Sand-coated deformed. (c) Helical wrapped/ribbed Fig.1 FRP anchors with different outer surfaces
 Sand/ Fabric-coated (b) Sand-coated deformed. (c) Helical wrapped/ribbed Fig.1 FRP anchors with different outer surfaces") S2B3 Interface Bond Strength of Helical Wrapped GFRP Ground Anchors Weichen Xue Prof., Department of Building Engineering, Tongji University, Shanghai, China Yuan Tan PhD candidate, Department of Building
S2B3 Interface Bond Strength of Helical Wrapped GFRP Ground Anchors Weichen Xue Prof., Department of Building Engineering, Tongji University, Shanghai, China Yuan Tan PhD candidate, Department of Building
Beam Pull Out Tests of NSM FRP and Steel Bars in Concrete
 Fourth International Conference on FRP Composites in Civil Engineering (CICE2008) 22-24July 2008, Zurich, Switzerland Beam Pull Out Tests of NSM FRP and Steel Bars in Concrete D. G. Novidis and S. J. Pantazopoulou
Experimental investigation of the use of CFRP grid for shear strengthening of RC beams
 Journal of Asian Concrete Federation Vol. 2, No. 2, Dec. 2016, pp. 117-127 ISSN 2465-7964 / eissn 2465-7972 http://dx.doi.org/10.18702/acf.2016.12.2.2.117 Experimental investigation of the use of CFRP
Flexural Behavior of Reinforced Concrete Beams Strengthened with CFRP Sheets and Epoxy Mortar
 University of New Haven Digital Commons @ New Haven Civil Engineering Faculty Publications Civil Engineering 8-2008 Flexural Behavior of Reinforced Concrete Beams Strengthened with CFRP Sheets and Epoxy
REVIEW ON SHEAR SLIP OF SHEAR KEYS IN BRIDGES
 REVIEW ON SHEAR SLIP OF SHEAR KEYS IN BRIDGES Benjamin Raison R; Freeda Christy C PG student, School of Civil Engineering, Karunya University. Associate Professor, School of Civil Engineering, Karunya
PrestressedConcreteInvertedTeeBeamswithCFRPforBuildingStructures
 Global Journal of Researches in Engineering: E Civil And Structural Engineering Volume 17 Issue 3 Version 1. Type: Double Blind Peer Reviewed International Research Journal Publisher: Global Journals Inc.
Site Director: Dr. Sami Rizkalla Associate Director: Dr. Rudi Seracino Date: February 1 st, 2011
 Site Director: Dr. Sami Rizkalla Associate Director: Dr. Rudi Seracino Date: February 1 st, 2011 AltusGroup, Inc. Freyssinet, Inc. Fyfe Company, LLC Grancrete, Inc. Martin Marietta Composites Nippon Steel
8.0 Structural strengthening
 Page 8 1 8.0 Structural strengthening In this section Section Page 8.1 Introduction 8 2 8.2 Approvals 8 2 8.3 Durability 8 2 8.4 Existing structure material strengths 8 3 8.5 Strengthening of flexural
with Fillers Department of Civil Engineering, National Taipei University of Technology, Taiwan, R.O.C
 A Study on the Mechanical Behaviour of the BFRP Decks with Fillers Yeou-Fong Li 1* and Chia-Hou Wu 1 1 Department of Civil Engineering, National Taipei University of Technology, Taiwan, R.O.C * 1, Sec.
INNOVATIVE FIBRE REINFORCED BRIDGE DECK MODULES ABSTRACT
 INNOVATIVE FIBRE REINFORCED BRIDGE DECK MODULES Heather Crocker, ISIS Canada, Winnipeg, MB Emile Shehata, Wardrop Engineering Inc., Winnipeg, MB Rick Haldane-Wilsone, Wardrop Engineering Inc., Winnipeg,
1. INTRODUCTION. Fig.1 Dimension of test specimen
 F1B04 Evaluation of a Shear Wall Reinforced with Glass FRP Bars Subjected to Lateral Cyclic Loading Nayera Mohamed PhD candidate, Department of Civil Engineering, University of Sherbrooke, Sherbrooke,
INNOVATIVE HYBRID WEARING SURFACES FOR FRP BRIDGE DECKS
 16 TH INTERNATIONAL CONFERENCE ON COMPOSITE MATERIALS INNOVATIVE HYBRID WEARING SURFACES FOR FRP BRIDGE DECKS Riyad S. Aboutaha Syracuse University Keywords: FRP decks, bridge decks, wearing surfaces Abstract
ADVANCED MATERIALS IN BRIDGES
 ADVANCED MATERIALS IN BRIDGES FATIGUE BEHAVIOUR OF MMFX CORROSION-RESISTANT REINFORCING STEEL Siebren J. DeJong and Colin MacDougall Department of Civil Engineering, Queen's University, Ontario, Canada
Metallic Structures. Zhao. Xiao-Ling. FRP-Strengthened (CJ*; CRC Press. Taylor & Francis Croup. Taylor & Francis Croup, an informa business
 FRP-Strengthened Metallic Structures Xiao-Ling Zhao (CJ*; CRC Press Taylor & Francis Croup Boca Raton London New York CRC Press is an imprint of the Taylor & Francis Croup, an informa business Contents
FUNDAMENTAL CHARACTERISTICS OF HIGH MODULUS CFRP MATERIALS FOR STRENGTHENING OF STEEL-CONCRETE COMPOSITE BEAMS
 FUNDAMENTAL CHARACTERISTICS OF HIGH MODULUS CFRP MATERIALS FOR STRENGTHENING OF STEEL-CONCRETE COMPOSITE BEAMS Mina Dawood, Sami Rizkalla and Emmett Sumner Constructed Facilities Laboratory North Carolina
Deflection Assessment of an FRP-Reinforced Concrete Bridge. By Danielle K. Stone, Andrea Prota, and Antonio Nanni
 Deflection Assessment of an FRP-Reinforced Concrete Bridge By Danielle K. Stone, Andrea Prota, and Antonio Nanni Synopsis: Serviceability of FRP-reinforced concrete structures remains a highly relevant
Parametric Study of Continuous Concrete Beam Prestressed with External Tendon
 Parametric Study of Continuous Concrete Beam Prestressed with External Tendon Assistant Professor, College of Engineering, Diyala University, Iraq ABSTRACT This paper presents the results of a parametric
Strengthening Concrete Sections by FRP Materials
 Strengthening Concrete Sections by FRP Materials SULTAN ERDEMLİ GÜNASLAN Civil Engineering Department Dicle University Engineering Faculty, Diyarbakır TURKEY sultanerdemli@gmail.com MURAT ARDA UĞURLU Civil
Behavior of Concrete-Filled FRP Tubes Under Bending, Axial Loads, and Combined Loading. Amir Fam, Bart Flisak and Sami Rizkalla
 Behavior of Concrete-Filled FRP Tubes Under Bending, Axial Loads, and Combined Loading Amir Fam, Bart Flisak and Sami Rizkalla ABSTRACT Innovative hybrid systems such as the concrete-filled fiber reinforced
Analysis of concrete columns Reinforced by Fiber Reinforced Polymers Bars Mohamed Husain, Hilal Hassan, Eman Salama
 Analysis of concrete columns Reinforced by Fiber Reinforced Polymers Bars Mohamed Husain, Hilal Hassan, Eman Salama Abstract The results of an analytical investigation achieved by using ANSYS software
CFRP STRENGTHENING OF CONCRETE BRIDGES WITH CURVED SOFFITS
 CFRP STRENGTHENING OF CONCRETE BRIDGES WITH CURVED SOFFITS Nagaraj Eshwar Dr Tim Ibell Dr Antonio Nanni Graduate Research Assistant Senior Lecturer Jones Professor CIES, # 223 ERL University of Bath CIES,
PRESTRESSED CONCRETE DESIGN
 PRESTRESSED CONCRETE DESIGN A01_Prestressed Concrete Design_FM.indd i 4/29/2013 4:00:08 PM A01_Prestressed Concrete Design_FM.indd ii PRESTRESSED CONCRETE DESIGN Praveen Nagarajan Department of Civil Engineering
Flexural Performance of Reinforced Concrete Beams with a Layer of Expansive Strain-hardening Cement -based Composite(SHCC)
") Flexural Performance of Reinforced Concrete Beams with a Layer of Expansive Strain-hardening Cement -based Composite(SHCC) Hae Jun Yang, June Su Kim, Sung Ho Kim & Hyun Do Yun Chungnam National University,
Flexural Performance of Reinforced Concrete Beams with a Layer of Expansive Strain-hardening Cement -based Composite(SHCC) Hae Jun Yang, June Su Kim, Sung Ho Kim & Hyun Do Yun Chungnam National University,
BRIDGE REHABILITATION USING FRP- CASE STUDIES PEDRAM MOJARRAD SIKA AUSTRALIA
 BRIDGE REHABILITATION USING FRP- CASE STUDIES PEDRAM MOJARRAD SIKA AUSTRALIA BRIDGE STRENGTHENING 2 November 26, 2015Title of Presentation / Meeting Name SIKA FRP PRODUCT RANGE MAIN FRP STRENGTHENING MATERIALS
FLEXURAL IMPROVEMENT OF PLAIN CONCRETE BEAMS STRENGTHENED WITH HIGH PERFORMANCE FIBRE REINFORCED CONCRETE
 Nigerian Journal of Technology (NIJOTECH) Vol. 36, No. 3, July 17, pp. 697 74 Copyright Faculty of Engineering, University of Nigeria, Nsukka, Print ISSN: 331-8443, Electronic ISSN: 2467-8821 www.nijotech.com
Tension and compression testing of fibre reinforced polymer (FRP) bars
 bars") University of Wollongong Research Online Faculty of Engineering and Information Sciences - Papers: Part A Faculty of Engineering and Information Sciences 2015 Tension and compression testing of fibre reinforced
University of Wollongong Research Online Faculty of Engineering and Information Sciences - Papers: Part A Faculty of Engineering and Information Sciences 2015 Tension and compression testing of fibre reinforced
Strengthening steel bridges with new high modulus CFRP materials
 Strengthening steel bridges with new high modulus CFRP materials M. Dawood, E. Sumner & S. Rizkalla North Carolina State University Raleigh, North Carolina, U.S.A. D. Schnerch, Wiss, Janney, Elstner Associates,
THE EFFECT OF FATIGUE LOADING ON BOND STRENGTH OF CFRP BONDED STEEL PLATE JOINTS
 Proceedings of the International Symposium on Bond Behaviour of FRP in Structures (BBFS 2005) Chen and Teng (eds) 2005 International Institute for FRP in Construction THE EFFECT OF FATIGUE LOADING ON BOND
Wood-based beams strengthened with FRP laminates Improved performance with pre-stressed systems
 COST Action FP1004 Final Meeting 15 April 17 April 2015 Lisbon, Portugal Wood-based beams strengthened with FRP laminates Improved performance with pre-stressed systems Robert Kliger and Reza Haghani -
MECHANICAL CHARACTERIZATION OF SANDWICH STRUCTURE COMPRISED OF GLASS FIBER REINFORCED CORE: PART 1
 Composites in Construction 2005 Third International Conference Lyon, France, July 11 13, 2005 MECHANICAL CHARACTERIZATION OF SANDWICH STRCTRE COMPRISED OF GLASS FIBER REINFORCED CORE: PART 1 S.V. Rocca
Concrete-filled fiber reinforced polymer tube-footing interaction in bending
 Fourth International Conference on FRP Composites in Civil Engineering (CICE2008) 22-24July 2008, Zurich, Switzerland Concrete-filled fiber reinforced polymer tube-footing interaction in bending Y. C.
STATIC AND FATIGUE BEHAVIOR OF CFRP-STRENGTHENED RC BRIDGE GIRDERS SUBJECTED TO VEHICLE OVERLOADING
 Advanced Steel Construction Vol. 11, No. 3, pp. 359-371 (215) 359 STATIC AND FATIGUE BEHAVIOR OF CFRP-STRENGTHENED RC BRIDGE GIRDERS SUBJECTED TO VEHICLE OVERLOADING Xiao-Yan Sun 1, Jian-Guo Dai 2, Hai-Long
Sustainable Shear Behaviour of 2-Span Continuous Reinforced Concrete T-Beams with CFRP Strips
 Sustainable Shear Behaviour of 2-Span Continuous Reinforced Concrete T-Beams with CFRP Strips Abdul Aziz Abdul Samad 1,*, Marwan B.S. Alferjani 2, Noorwirdawati Ali 1, Noridah Mohamad 2, Mohd Hilton Ahmad
FINITE ELEMENT ANALYSIS OF REINFORCED CONCRETE BRIDGE PIER COLUMNS SUBJECTED TO SEISMIS LOADING
 FINITE ELEMENT ANALYSIS OF REINFORCED CONCRETE BRIDGE PIER COLUMNS SUBJECTED TO SEISMIS LOADING By Benjamin M. Schlick University of Massachusetts Amherst Department of Civil and Environmental Engineering
Repair and upgrading of concrete structures with FRP materials
 Repair and upgrading of concrete structures with FRP materials by Professor Björn Täljsten Luleå University of Technology Sto Scandinavia AB Definitions Maintenance: Keep a structure performance at original
Applications of FRP Projects in Egypt
 Applications of FRP Projects in Egypt Abdel-Hady Hosny Emeritus Professor Ain Shams University, Cairo, Egypt Abdel-Hady Hosny received his PhD degree from Leeds Univ., Chairman of the Egyptian Engineering
Fiber-Reinforced Polymer Bond Test in Presence of Steel and Cracks
 ACI STRUCTURAL JOURNAL TECHNICAL PAPER Title no. 108-S69 Fiber-Reinforced Polymer Bond Test in Presence of Steel and Cracks by Mehdi Taher Khorramabadi and Chris J. Burgoyne The understanding of failure
EXPERIMENTAL ANALYSIS ON THE SHEAR BEHAVIOUR OF RC BEAMS STRENGTHENED WITH GFRP SHEETS
 EXPERIMENTAL ANALYSIS ON THE SHEAR BEHAVIOUR OF RC BEAMS STRENGTHENED WITH GFRP SHEETS Ugo Ianniruberto Department of Civil Engineering, University of Rome Tor Vergata, ITALY Via del Politecnico, 1, 00133
Slenderness ratio effect on the behavior of steel and carbon-frp reinforced concrete-filled FRP tubes
 Slenderness ratio effect on the behavior of steel and carbon-frp reinforced concrete-filled FRP tubes H. M. Mohamed 1, R. Masmoudi 2, and Y. Shao 3 1 Postdoctoral Fellow, University of Sherbrooke, Sherbrooke,
Carder 1. FABRICATION AND CYCLIC LOADING OF SUPER-ELASTIC SHAPE MEMORY ALLOY REINFORCED POLYMER Rachel Carder
 Carder 1 FABRICATION AND CYCLIC LOADING OF SUPER-ELASTIC SHAPE MEMORY ALLOY REINFORCED POLYMER Rachel Carder Carder 2 INTRODUCTION Fiber-reinforced polymers (FRP) have increased in demand for civil engineering
SERVICEABILITY LIMIT STATES OF CONCRETE BEAMS PRESTRESSED BY CFRP BARS
 SERVICEABILITY LIMIT STATES OF CONCRETE BEAMS PRESTRESSED BY CFRP BARS by Amr A. Abdelrahman(l) and Sami H. Rizkalla(2) Abstract The non-corrosive and high strength-to-weight ratio characteristics of carbon
In-plane testing of precast concrete wall panels with grouted sleeve
 In-plane testing of precast concrete wall panels with grouted sleeve P. Seifi, R.S. Henry & J.M. Ingham Department of Civil Engineering, University of Auckland, Auckland. 2017 NZSEE Conference ABSTRACT:
NONLINEAR FINITE ELEMENT ANALYSIS OF SHALLOW REINFORCED CONCRETE BEAMS USING SOLID65 ELEMENT
 NONLINEAR FINITE ELEMENT ANALYSIS OF SHALLOW REINFORCED CONCRETE BEAMS USING SOLID65 ELEMENT M. A. Musmar 1, M. I. Rjoub 2 and M. A. Abdel Hadi 1 1 Department of Civil Engineering, Al-Ahliyya Amman University,
RESPONSE OF SUBSTANDARD REINFORCING DETAILS T CONNECTIONS UPGRADED WITH CONCRETE COVERS AND CFRP
 Fourth Asia-Pacific Conference on FRP in Structures (APFIS 2013) 11-13 December 2013, Melbourne, Australia 2013 International Institute for FRP in Construction RESPONSE OF SUBSTANDARD REINFORCING DETAILS
Study of the bond behavior of carbon fibre reinforced polymer bars
 Study of the bond behavior of carbon fibre reinforced polymer bars S.B. Singh and Aditi Chauhan In this study, experiments were conducted to find the bond characteristics of three different carbon fibre
SEISMIC RETROFITTING OF REINFORCED CONCRETE COLUMNS USING CARBON FIBER REINFORCED POLYMER (CFRP)
") Asia-Pacific Conference on FRP in Structures (APFIS 7) S.T. Smith (ed) 7 International Institute for FRP in Construction SEISMIC RETROFITTING OF REINFORCED CONCRETE COLUMNS USING CARBON FIBER REINFORCED
Asia-Pacific Conference on FRP in Structures (APFIS 7) S.T. Smith (ed) 7 International Institute for FRP in Construction SEISMIC RETROFITTING OF REINFORCED CONCRETE COLUMNS USING CARBON FIBER REINFORCED
Nonlinear Analysis of Shear Dominant Prestressed Concrete Beams using ANSYS
 Nonlinear Analysis of Shear Dominant Prestressed Concrete Beams using ANSYS Job Thomas Indian Institute of Science, Bangalore, India Ananth Ramaswamy Indian Institute of Science, Bangalore, India Abstract
PERFORMANCE STUDY OF RETROFITTED GRAVITY LOAD DESIGNED WALL FRAME STRUCTURES (SC-140)
") PERFORMANCE STUDY OF RETROFITTED GRAVITY LOAD DESIGNED WALL FRAME STRUCTURES (SC-140) *A. Ahmed 1, K. H. Tan 1 1 Department of Civil and Environmental Engineering National University of Singapore, Singapore,
PERFORMANCE STUDY OF RETROFITTED GRAVITY LOAD DESIGNED WALL FRAME STRUCTURES (SC-140) *A. Ahmed 1, K. H. Tan 1 1 Department of Civil and Environmental Engineering National University of Singapore, Singapore,
RC BEAMS STRENGTHENED WITH GFRP PLATES. I: EXPERIMENTAL STUDY
 RC BEAMS STRENGTHENED WITH GFRP PLATES. I: EXPERIMENTAL STUDY By Hamid Saadatmanesh, 1 Associate Member, ASCE, and ' Mohammad R. Ehsani, 2 Member, ASCE ABSTRACT: The static strength of reinforced concrete
International Journal of Scientific & Engineering Research, Volume 6, Issue 2, February-2015 ISSN
 1325 A Comparative Study on Beam Strengthened with Externally Bonded FRP Material Tanni Alam Dola and Md. Zakaria Ahmed Department of Civil Engineering, Bangladesh University of Engineering and Technology,
REHABILITATION OF RC BUILDINGS USING STRUCTURAL WALLS
 REHABILITATION OF RC BUILDINGS USING STRUCTURAL WALLS Ahmed GHOBARAH 1 And Maged YOUSSEF 2 SUMMARY A developed macroscopic model is applied to the analysis of an example structure to demonstrate the use
Repair of Earthquake-Damaged RC Columns with FRP Wraps
 ACI STRUCTURAL JOURNAL Title no. 94-S20 TECHNICAL PAPER Repair of Earthquake-Damaged RC Columns with FRP Wraps by Hamid Saadatmanesh, Mohammad R. Ehsani, and Limin Jin An investigation was conducted into
The Hashemite University Department of Civil Engineering. Dr. Hazim Dwairi. Dr. Hazim Dwairi 1
 Department of Civil Engineering Lecture 2.1 Methods of Prestressing Advantages of Prestressing Section remains uncracked under service loads Reduction of steel corrosion (increase durability) Full section
STRENGTHENING OF MASONRY WITH NEAR SURFACE MOUNTED FRP BARS. Abstract
 STRENGTHENING OF MASONRY WITH NEAR SURFACE MOUNTED FRP BARS J. Gustavo Tumialan, University of Missouri-Rolla, Rolla, MO Nestore Galati, University of Missouri-Rolla, Rolla, MO Sinaph M. Namboorimadathil,
Investigation on Behaviour of Reinforced Concrete Beam Column Joints Retrofitted with FRP Wrapping
 International Journal of Civil Engineering Research. ISSN 2278-3652 Volume 5, Number 3 (2014), pp. 289-294 Research India Publications http://www.ripublication.com/ijcer.htm Investigation on Behaviour
LOAD TEST EVALUATION OF FRP-STRENGTHENED STRUCTURES
 The 7 th International Conference on FRP Composites in Civil Engineering International Institute for FRP in Construction LOAD TEST EVALUATION OF FRP-STRENGTHENED STRUCTURES Nestore GALATI Senior Design
ARAB REPUBLIC OF EGYPT
 ARAB REPUBLIC OF EGYPT MINISTRY OF HOUSING, UTILITIES AND URBAN UTILITIES HOUSING AND BUILDING NATIONAL Chapter 1 RESEARCH CENTER EGYPTIAN CODE OF PRACTICE FOR THE USE OF FIBER REINFORCED POLYMER ( FRP)
Strengthening of Wooden Cross arms in 230 kv Transmission Structures using Glass Fibre Reinforced Polymer (GFRP) Wrap
 Wrap") Strengthening of Wooden Cross arms in 230 kv Transmission Structures using Glass Fibre Reinforced Polymer (GFRP) Wrap by Arash Shahi A thesis presented to the University of Waterloo in fulfillment of the
Strengthening of Wooden Cross arms in 230 kv Transmission Structures using Glass Fibre Reinforced Polymer (GFRP) Wrap by Arash Shahi A thesis presented to the University of Waterloo in fulfillment of the
The American University in Cairo The School of Sciences and Engineering
 The American University in Cairo The School of Sciences and Engineering IMPACT OF ELEVATED TEMPERATURE, CHEMICAL AND WORKMANSHIP ON PERFORMANCE OF BEAMS WITH NEAR SURFACE MOUNTED FRP BARS A Thesis Submitted
Behaviour of Post-Installed GFRP Adhesive Anchors in Concrete
 NSERC Industrial Research Chair in Innovative FRP Composites for Infrastructures Behaviour of Post-Installed GFRP Adhesive Anchors in Concrete Prepared by: Ehab A. Ahmed, Ehab El-Salakawy, and Brahim Benmokrane
GROUND ANCHOR TENDONS IN CARBON FIBRE-REINFORCED POLYMERS
 GROUND ANCHOR TENDONS IN CARBON FIBRE-REINFORCED POLYMERS Tony Barley, Single Bore Multiple Anchor Ltd, Harrogate, UK John Hartley, Excel Composites Ltd, Runcorn, UK Abstract Carbon fibre plates and flat
EXPERIMENTAL STUDY ON RC COLUMNS RETROFITTED BY FRP AND SUBJECTED TO SEISMIC LOADING
 EXPERIMENTAL STUDY ON RC COLUMNS RETROFITTED BY FRP AND SUBJECTED TO SEISMIC LOADING Raphaelle SADONE, Marc QUIERTANT Université Paris Est - IFSTTAR - SOA 58 Boulevard Lefebvre, 75015 PARIS r.sadone@hotmail.fr*;
YASMEEN TALEB OBAIDAT. STRUCTURAL RETROFITTING OF CONCRETE BEAMS USING FRP - Debonding Issues. Structural Mechanics.
 STRUCTURAL RETROFITTING OF CONCRETE BEAMS USING FRP - Debonding Issues YASMEEN TALEB OBAIDAT Structural Mechanics Doctoral Thesis Department of Construction Sciences Structural Mechanics ISRN LUTVDG/TVSM--11/123--SE
Extreme Loading for Structures Version 3.1
 Extreme Loading for Structures Version 3.1 Corrosion Effects Option April 2010 1. Introduction Corrosion of gusset plates was identified as one of the main causes for failure in the catastrophic collapse
Upgrading Missouri Transportation Infrastructure: Solid RC Decks Strengthened with FRP Systems
 TRB paper Number: 00-1177 Upgrading Missouri Transportation Infrastructure: Solid RC Decks Strengthened with FRP Systems First Author: Tarek Alkhrdaji, Ph.D. Candidate, University of Missouri-Rolla Center
SERVICEABILITY OF CONCRETE BEAMS PRESTRESSED BY FmRE REINFORCED PLASTIC TENDONS AMR A. ABDELRAHMAN. DOCTOR OF PmLOSOPHY
 SERVICEABILITY OF CONCRETE BEAMS PRESTRESSED BY FmRE REINFORCED PLASTIC TENDONS by AMR A. ABDELRAHMAN A Dissertation Submitted to the Faculty of Graduate Studies in Partial FulfIlment of the Requirements
Effect of FRP strengthening on the behavior of shear walls with opening
 CICE 2010 - The 5th International Conference on FRP Composites in Civil Engineering September 27-29, 2010 Beijing, China Effect of FRP strengthening on the behavior of shear walls with opening M. Asfa
PUNCHING SHEAR STRENGTH OF GFRP REINFORCED DECK SLABS IN SLAB- GIRDER BRIDGES
 IV ACMBS MCAPC 4 th International Conference on Advanced Composite Materials in Bridges and Structures 4 ième Conférence Internationale sur les matériaux composites d avant-garde pour ponts et charpentes