Forest Watershed Services on an Old Frontier in the Brazilian Amazon
|
|
|
- Anastasia Cook
- 6 years ago
- Views:
Transcription
1 Forest Watershed Services on an Old Frontier in the Brazilian Amazon Yu Wu, NC State University; Katrina Mullan, University of Montana; Trent Biggs, San Diego State University; Jill Caviglia-Harris, Salisbury University; Daniel Harris, Salisbury University; Erin O. Sills, NC State University CAMP RESOURCES AUGUST 7, 2017


2 Research question Reduce water? 1. Does the Amazon forest provide watershed services to downstream farms? Improving water quality; Regulating flow 2. If so, what is the value of those services? Sources: World Resources Institute

3 3

4 Arc of Deforestation


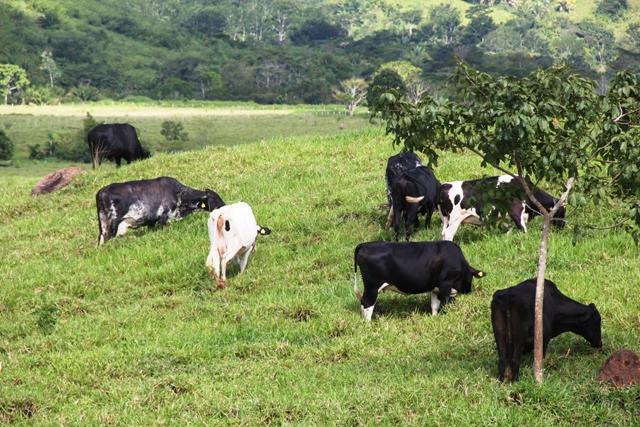
5 The Ouro Preto do Oeste region, Rondônia, Brazil


6

7 Ecosystem process? Economic Value Production function Hedonic pricing Travel cost Contingent valuation Nonmarket valuation methods
8 Three-stage analytical framework (Freeman et al. 1992) Ecosystem flows: quantity or rates of stream flows Stage 2 Stage 1 Milk productivity Stage 3 Profits of milk production in monetary terms Change in Forest Cover Change in Watershed Services Change in productivity Valuation of profits/welfare change Today
9 Property-level panel dataset Support provided by the National Science Foundation SES , SES , SES and National Socio- Environmental Synthesis Center (SESYNC) 1. Four-waves farm household survey Livestock ownership Agricultural production Household and property characteristics 2. Land cover at the lot level Annual LandSat images, 30m pixels Decision tree classifier with spectral mixture analysis 3. Spatial data farm boundaries road networks, market locations biophysical conditions 196, 196, 406, 646 properties 1996 ~ 9000 properties 1996 ~ 9000 properties Hydrological data ~ 9000 properties
 1. Four-waves farm household survey 1996 2000 2005 2009 Livestock ownership Agricultural production Household and property characteristics 2.")

10 Property-level panel dataset Support provided by the National Science Foundation SES , SES , SES and National Socio- Environmental Synthesis Center (SESYNC) 1. Four-waves farm household survey Livestock ownership Agricultural production Household and property characteristics 2. Land cover at the lot level Annual LandSat images, 30m pixels Decision tree classifier with spectral mixture analysis 3. Spatial data farm boundaries road networks, market locations biophysical conditions 196, 196, 406, 646 properties 1996 ~ 9000 properties 1996 ~ 9000 properties Hydrological data ~ 9000 properties
11 Hydrological data Size of watershed corresponding to the lot Proxy for flow on the lot Land cover on the watershed identified Precipitation (monthly) Maximum and Minimum Temperature (monthly) Low flow runoff mean of the 10% lowest flows (m3/day) calculated for each survey year at two watersheds in the study area (Jaru river and Jamari river). 11
12 Hydrological data Size of watershed corresponding to the lot Proxy for flow on the lot Land cover on the watershed identified Precipitation (monthly) Maximum and Minimum Temperature (monthly) Low flow runoff mean of the 10% lowest flows (m3/day) calculated for each survey year at two watersheds in the study area (Jaru river and Jamari river). 12

 Low flow runoff mean of the 10%")

13 Hydrological data Size of watershed corresponding to the lot Proxy for flow on the lot Land cover on the watershed identified Precipitation (monthly) Maximum and Minimum Temperature (monthly) Low flow runoff mean of the 10% lowest flows (m3/day) calculated for each survey year at two watersheds in the study area (Jaru river and Jamari river). 13

14 Mature forest cover in the Ouro Preto do Oeste region 14
15 Econometric model

16 Econometric model
17 0 Frequency Model specification: full set of interaction terms between forest cover and other determinants of watershed services Classify watershed size (small, medium, large) Small (< 100 ha): 123 lots Medium (100 ha ~1000 ha): 148 lots Large ( 1000 ha): 33 lots Total: 304 lots (year 2009) Watershed size (ha)
18 Descriptive Statistics Dependent Variables Determinants of watershed services Prices Variable Obs. Mean Std. Dev. Min Max Milk per cow, dry (liters) Milk per cow, wet (liters) Milk per hectare, dry (liters) Milk per hectare, wet (liters) Area of watershed (ha) Area of forest in the watershed (ha) Rainfall in dry season (mm) Rainfall in wet season (mm) Year Milk price, dry (R$/liter) Milk price, wet (R$/liter) Distance to market (km) Other proxies for fixed inputs (human and natural capital): household head age and education, household size, soil suitability, slope, lot age, lot size, municipality fixed effects, and temperature.
19 Marginal effects of ln(forest) by year (Four-year unbalanced panel, n=307) Year 1996 *ln(forest) Year 2000 *ln(forest) Year 2005 *ln(forest) Year 2009 *ln(forest) ln (Milk per cow) ln (Milk per ha) Dry Wet Dry Wet FE RE FE RE FE RE FE RE ** * ** (0.055) (0.028) (0.066) (0.033) (0.038) (0.023) (0.027) (0.047) * *** (0.049) (0.026) (0.059) (0.030) (0.034) (0.021) (0.024) (0.042) * ** * *** ** (0.044) (0.020) (0.053) (0.023) (0.031) (0.017) (0.019) (0.038) ** ** ** * (0.043) (0.020) (0.052) (0.023) (0.030) (0.017) (0.019) (0.037)
20 Marginal effects of ln(forest) by year (Four-year unbalanced panel, n=307) Year 1996 *ln(forest) Year 2000 *ln(forest) Year 2005 *ln(forest) Year 2009 *ln(forest) ln (Milk per cow) ln (Milk per ha) Dry Wet Dry Wet FE RE FE RE FE RE FE RE ** * ** (0.055) (0.028) (0.066) (0.033) (0.038) (0.023) (0.027) (0.047) * *** (0.049) (0.026) (0.059) (0.030) (0.034) (0.021) (0.024) (0.042) * ** * *** ** (0.044) (0.020) (0.053) (0.023) (0.031) (0.017) (0.019) (0.038) ** ** ** * 0 Minimum flow in dry season (m3/day) (0.043) (0.020) (0.052) (0.023) (0.030) (0.017) (0.019) (0.037)
21 Marginal effects of ln(forest) by year (Four-year unbalanced panel, n=307) Year 1996 *ln(forest) Year 2000 *ln(forest) Year 2005 *ln(forest) Year 2009 *ln(forest) ln (Milk per cow) ln (Milk per ha) Dry Wet Dry Wet FE RE FE RE FE RE FE RE ** * ** (0.055) (0.028) (0.066) (0.033) (0.038) (0.023) (0.027) (0.047) * *** (0.049) (0.026) (0.059) (0.030) (0.034) (0.021) (0.024) (0.042) * ** * *** ** 50 (0.044) (0.020) (0.053) (0.023) (0.031) (0.017) (0.019) (0.038) ** ** ** * 0 Total precipitation in dry season (mm) (0.043) (0.020) (0.052) (0.023) (0.030) (0.017) (0.019) (0.037)
22 Marginal effects of ln(forest) by watershed size (Four-year unbalanced panel, n=307) Small *ln(forest) Medium *ln(forest) Large *ln(forest) ln (Milk per cow) ln (Milk per ha) Dry Wet Dry Wet FE RE FE RE FE RE FE RE ** * *** ** (0.036) (0.016) (0.045) (0.019) (0.024) (0.014) (0.031) (0.016) * ** (0.052) (0.017) (0.064) (0.020) (0.035) (0.016) (0.044) (0.018) (0.169) (0.058) (0.211) (0.066) (0.114) (0.054) (0.146) (0.059) Note: *, **, ***, **** indicate significance at the 10%, 5%, 1%, and 0.1% levels


23 Small watershed (<100 HA) Large watershed (>1000 HA)
24 Robustness Test Marginal effects of ln(forest in 1km buffer of the lot) (Four-year unbalanced panel, n=319) ln (Milk per cow) ln (Milk per ha) Dry Wet Dry Wet ln(forest 1km buffer) FE RE FE RE FE RE FE RE * ** ** ** (0.058) (0.025) (0.070) (0.029) (0.039) (0.021) (0.049) (0.025)
25 Robustness Test Marginal effects of ln(secondary forest in the watershed) watershed size (Four-year unbalanced panel, n=308) ln (Milk per cow) ln (Milk per ha) Dry Wet Dry Wet FE RE FE RE FE RE FE RE Small *ln(forest) * (0.029) (0.020) (0.035) (0.024) (0.019) (0.016) (0.025) (0.019) Medium *ln(forest) (0.025) (0.017) (0.031) (0.019) (0.017) (0.013) (0.022) (0.016) Large *ln(forest) (0.062) (0.046) (0.075) (0.054) (0.041) (0.035) (0.052) (0.043)
26 Robustness Test Marginal effects of ln(secondary forest in the watershed) by year (Four-year unbalanced panel, n=308) ln (Milk per cow) ln (Milk per ha) Dry Wet Dry Wet FE RE FE RE FE RE FE RE Year 1996 *ln(forest) (0.029) (0.023) (0.035) (0.027) (0.019) (0.017) (0.024) (0.021) Year 2000 *ln(forest) ** 0.068* 0.080*** 0.041* 0.030* 0.072** 0.054** (0.029) (0.024) (0.035) (0.028) (0.020) (0.017) (0.024) (0.021) Year 2005 *ln(forest) (0.022) (0.017) (0.027) (0.020) (0.015) (0.013) (0.018) (0.015) Year 2009 *ln(forest) * (0.024) (0.018) (0.029) (0.021) (0.016) (0.013) (0.020) (0.016)
27 Findings based on the above model Upstream deforestation (mature forest) associated with an increase in milk production per hectare Consistent with forest science forests can reduce surface runoff both because trees use water and because they allow more infiltration. Consistent with animal science milk cattle needs a large amount of water to produce milk. The effect is the same in wet and dry seasons; The effect is largest in small watersheds and dry years. Evapotranspiration, i.e. trees are acting as pumps rather than sponges. Effect of secondary forest on milk productivity is positive when water abundant Secondary forest on any one pixel lasts an average of 5 years and is not left to be converted into forest in the future. Instead the areas are re-burned within 5 years to create pasture.
28 Findings based on the above model Upstream deforestation (mature forest) associated with an increase in milk production per hectare Consistent with forest science forests can reduce surface runoff both because trees use water and because they allow more infiltration. Consistent with animal science milk cattle needs a large amount of water to produce milk. Caveats: The effect is the same in wet and dry seasons; The Forest effect may is have largest a positive in small effect watersheds regionally and by dry contributing years. to precipitation. As forests become scarcer, they may matter more for water quality. Evapotranspiration, i.e. trees are acting as pumps rather than sponges. Effect of secondary forest on milk productivity is positive when water abundant Secondary forest on any one pixel lasts an average of 5 years and is not left to be converted into forest in the future. Instead the areas are re-burned within 5 years to create pasture.

29 Next steps Dynamic effects - with lagged forest cover - lagged investments in milk production Location of forest in the watershed Distinguish watershed inside and outside the property Monetary valuation of productivity impacts

30 Thank you! 30
WAS VON THÜNEN RIGHT? CATTLE INTENSIFICATION AND DEFORESTATION IN BRAZIL 1. Francisco Fontes 2 and Charles Palmer 3
 WAS VON THÜNEN RIGHT? CATTLE INTENSIFICATION AND DEFORESTATION IN BRAZIL 1 Francisco Fontes 2 and Charles Palmer 3 Department of Geography and Environment & Grantham Research Institute on Climate Change
Linking water and climate change: a case for Brazil
 Linking water and climate change: a case for Brazil Eunjee Lee Sustainability Science fellow, Harvard Kennedy School with Prof. Paul Moorcroft, Angela Livino and Prof. John Briscoe Outline 1. Overview:
Agriculture and Climate Change Rural Urban Linkages. Erick Fernandes, Adviser, Agriculture & Rural Development
 Agriculture and Climate Change Rural Urban Linkages Erick Fernandes, Adviser, Agriculture & Rural Development 75% of the world s poor are rural and most are involved in farming In the 21st century, agriculture
Linking Remote Sensing and Economics: Evaluating the Effectiveness of Protected Areas in Reducing Tropical Deforestation
 Linking Remote Sensing and Economics: Evaluating the Effectiveness of Protected Areas in Reducing Tropical Deforestation Joe Maher 1 and Xiaopeng Song 2 1 University of Maryland, Department of Agricultural
Water Budget III: Stream Flow P = Q + ET + G + ΔS
 Water Budget III: Stream Flow P = Q + ET + G + ΔS Why Measure Streamflow? Water supply planning How much water can we take out (without harming ecosystems we want to protect) Flood protection How much
Water Budget III: Stream Flow P = Q + ET + G + ΔS
 Water Budget III: Stream Flow P = Q + ET + G + ΔS Why Measure Streamflow? Water supply planning How much water can we take out (without harming ecosystems we want to protect) Flood protection How much
1.6 Influence of Human Activities and Land use Changes on Hydrologic Cycle
 1.6 Influence of Human Activities and Land use Changes on Hydrologic Cycle Watersheds are subjected to many types of changes, major or minor, for various reasons. Some of these are natural changes and
What is runoff? Runoff. Runoff is often defined as the portion of rainfall, that runs over and under the soil surface toward the stream
 What is runoff? Runoff Runoff is often defined as the portion of rainfall, that runs over and under the soil surface toward the stream 1 COMPONENTS OF Runoff or STREAM FLOW 2 Cont. The types of runoff
Vulnerability of hydrological ecosystem services to climatic extremes in a Mediterranean river basin
 Vulnerability of hydrological ecosystem services to climatic extremes in a Mediterranean river basin Marta Terrado, Vicenç Acuña, Driss Ennaanay, Heather Tallis, Sergi Sabater CLIMATIC EXTREMES AND HYDROLOGICAL
Linking Historical and Future Land-Use Change to the Economic Drivers and Biophysical Limitations of Agricultural Expansion in the Brazilian Cerrado
 Linking Historical and Future Land-Use Change to the Economic Drivers and Biophysical Limitations of Agricultural Expansion in the Brazilian Cerrado NASA LCLUC NNX11AE56G Michael T Coe 1, Marcia Macedo
Hydrologic Engineering Center Hydrologic Modeling System (HEC-HMS) Sunil KUMAR Director, National Water Academy
 Sunil KUMAR Director, National Water Academy") Hydrologic Engineering Center Hydrologic Modeling System (HEC-HMS) Sunil KUMAR Director, National Water Academy 22 April 2015 NWA, Pune Exercise Objective: To determine hydrological Response of the given
Hydrologic Engineering Center Hydrologic Modeling System (HEC-HMS) Sunil KUMAR Director, National Water Academy 22 April 2015 NWA, Pune Exercise Objective: To determine hydrological Response of the given
Rock Creek Floodplain Analysis
 Rock Creek Floodplain Analysis www.co.washington.or.us By Jon Franczyk 1996 Flood, www.co.washington.or.us 1996 Flood, www.co.washington.or.us Project Outline Project Goals Introduction Background Study
Re-plumbing Roadside Ditch Networks
 Re-plumbing Roadside Ditch Networks Ditches Improving management to reduce flooding, water pollution, and in-stream erosion and habitat degradation Rebecca Schneider Dept. Natural Resources Cornell University,
Mato Grosso in the context of global climate change
 Mato Grosso in the context of global climate change Area: 906,807 km² Population: 2,800,000 Capital: Cuiabá Mato Grosso in the context of global climate change MATO GROSSO: IN THE HEART OF SOUTH AMERICA
ENVS 435: Watershed Management. 3 Credits INSTR.: Dr. R.M. Bajracharya
 ENVS 435: Watershed Management 3 Credits INSTR.: Dr. R.M. Bajracharya Unit 1: Introduction - Watershed Concepts Definitions of watershed The elevated line separating the head streams which are tributaries
Biogeochemical Consequences of Land Use Transitions Along Brazil s Agricultural Frontier
 Biogeochemical Consequences of Land Use Transitions Along Brazil s Agricultural Frontier Gillian Galford* 1,2, John Mustard 1, Jerry Melillo 2, Carlos C. Cerri 3, C.E.P. Cerri 3, David Kicklighter 2, Benjamin
Amazon Deforestation
 Title Amazon Deforestation 40% increase between 2001 and 2002! Recent advert by Paddy Power. Read more on this story here Title Amazon Deforestation What is deforestation? 40% increase between 2001 and
Services Generation Account (Levels 0, 1 and 2)
") Services Generation Account (Levels 0, 1 and 2) Project: Advancing the SEEA Experimental Ecosystem Accounting Overview: Services Generation 1. Learning objectives 2. Review of Level 0 (5m) What is it?
Services Generation Account (Levels 0, 1 and 2) Project: Advancing the SEEA Experimental Ecosystem Accounting Overview: Services Generation 1. Learning objectives 2. Review of Level 0 (5m) What is it?
Survey on grassland ecosystem services in the CR. Exchange on TEEB Processes in European Countries 12 October 2011, Isle of Vilm
 Survey on grassland ecosystem services in the CR Exchange on TEEB Processes in European Countries 12 October 2011, Isle of Vilm Ecosystem services of grasslands in the CR survey conducted 2010 2011 consortium:
WATERSHED. Maitland Valley. Report Card 201
 Maitland Valley WATERSHED Report Card 201 The Maitland Valley Conservation Authority has prepared this report card as a summary on the state of our forests, wetlands, surface water, and ground water resources.
Title How fast is the Amazon rainforest. disappearing?
 Title How fast is the Amazon rainforest disappearing? 40% increase between 2001 and 2002! Title How fast is the Amazon rainforest disappearing Q1. What is deforestation? 40% increase between 2001 and 2002!
Conserving Agricultural Biodiversity in China: Lessons from the Millennium Ecosystem Assessment
 Conserving Agricultural Biodiversity in China: Lessons from the Millennium Ecosystem Assessment Jeffrey A. McNeely Chief Scientist IUCN-The World Conservation Union jam@hq.iucn.org 20 June 2006 Beijing
WATER FROM THE CLOUDS
 WATER FROM THE CLOUDS 814 mm per year on land or 110 000 km 3 56% is evapotranspirated by forests and natural landscapes 5% is evapotranspirated by rainfed agriculture 39% available for human uses (irrigation,
The effects of the short-term Brazilian sugarcane expansion in stream flow: Monte Mor basin case study
 The effects of the short-term Brazilian sugarcane expansion in stream flow: Monte Mor basin case study Hernandes, TAD; Scarpare, FV; Seabra, JEA; Duft, DG; Picoli, MCA; Walter, A Overview 12,000,000 10,000,000
Case Study: City of Nagoya, Japan
 Policies, Measures, and Collaboration for integrated implementation of SDG 6.5, 11.3 and 11.5 toward sustainable IWRM and Water-Resilient City Case Study: City of Nagoya, Japan Yumiko Asayama Manager of
Expanding irrigated agriculture in the floodplains of Cambodia. Prepared by Ponh Sachak for the 4 th Regional Stakeholder Forum
 Expanding irrigated agriculture in the floodplains of Cambodia Prepared by Ponh Sachak for the 4 th Regional Stakeholder Forum 20-22 November 2014 Content 1. Introduction 2. Water Resources in Cambodia
Measuring and Valuing Natural Assets: Ecosystem Services. Steve Polasky University of Minnesota & Natural Capital Project
 Measuring and Valuing Natural Assets: Ecosystem Services Steve Polasky University of Minnesota & Natural Capital Project Introduction Ecosystems, including agricultural systems, provide a wide array of
Introduction to a MODIS Global Terrestrial Evapotranspiration Algorithm Qiaozhen Mu Maosheng Zhao Steven W. Running
 Introduction to a MODIS Global Terrestrial Evapotranspiration Algorithm Qiaozhen Mu Maosheng Zhao Steven W. Running Numerical Terradynamic Simulation Group, Dept. of Ecosystem and Conservation Sciences,
CHAPTER FIVE Runoff. Engineering Hydrology (ECIV 4323) Instructors: Dr. Yunes Mogheir Dr. Ramadan Al Khatib. Overland flow interflow
 Instructors: Dr. Yunes Mogheir Dr. Ramadan Al Khatib. Overland flow interflow") Engineering Hydrology (ECIV 4323) CHAPTER FIVE Runoff Instructors: Dr. Yunes Mogheir Dr. Ramadan Al Khatib Overland flow interflow Base flow Saturated overland flow ١ ٢ 5.1 Introduction To Runoff Runoff
Engineering Hydrology (ECIV 4323) CHAPTER FIVE Runoff Instructors: Dr. Yunes Mogheir Dr. Ramadan Al Khatib Overland flow interflow Base flow Saturated overland flow ١ ٢ 5.1 Introduction To Runoff Runoff
Pu Wang Department of Natural Resources Cornell University
 Pu Wang Department of Natural Resources Cornell University PES and poverty alleviation PES and wealth disparity China s ecological and socioeconomic contexts Current PES policies and projects in China
2
 1 2 3 4 5 6 The program is designed for surface water hydrology simulation. It includes components for representing precipitation, evaporation, and snowmelt; the atmospheric conditions over a watershed.
Tangible benefits of technological prospection and prefeasibility studies in SHP projects Ing. Sergio Armando Trelles Jasso
 5 th and 6 th December 2012, Panama City, Panama Tangible benefits of technological prospection and prefeasibility studies in SHP projects Ing. Sergio Armando Trelles Jasso Agenda Artisanal vs Technological
USING ARCSWAT TO EVALUATE EFFECTS OF LAND USE CHANGE ON WATER QUALITY. Adam Gold Geog 591
 USING ARCSWAT TO EVALUATE EFFECTS OF LAND USE CHANGE ON WATER QUALITY Adam Gold Geog 591 Introduction The Soil and Water Assessment Tool (SWAT) is a hydrologic transport model with an objective to predict
Simple toolbox for worldwide topography based soils reclassification for initialization of SWAT
 Simple toolbox for worldwide topography based soils reclassification for initialization of SWAT Daniel R. Fuka, Charlotte MacAlister, Solomon Seyoum, Todd Walter, Zachary Easton Cornell University IWMI
Module 3. Lecture 4: Introduction to unit hydrograph
 Lecture 4: Introduction to unit hydrograph (UH) The unit hydrograph is the unit pulse response function of a linear hydrologic system. First proposed by Sherman (1932), the unit hydrograph (originally
Journal of Environmental Economics and Management
 Journal of Environmental Economics and Management 61 (2011) 95 106 Contents lists available at ScienceDirect Journal of Environmental Economics and Management journal homepage: www.elsevier.com/locate/jeem
Linking climate change control and development policies: the Brazilian case
 Linking climate change control and development policies: the Brazilian case Presentation at the Conference on Global Warming: Looking Beyond Kyoto Yale Center for the Study of Globalization October 21-22,
CEE6400 Physical Hydrology
 CEE6400 Physical Hydrology Midterm Review Learning Objectives (what you should be able to do) Hydrologic data, the hydrologic cycle and water balance (HW 1) Work with hydrologic data, quantify uncertainty
Household production and forest clearing: the role of farming in the development of the Amazon
 Environment and Development Economics 9: 181-202 2004 Cambridge University Press DOr: 10.1017/S1355770X03001165 Printed in the United Kingdom Household production and forest clearing: the role of farming
Maitland Valley WATERSHED
 Maitland Valley WATERSHED Report Card 2018 Maitland Conservation has prepared this report card as a summary of the state of your forests, wetlands, and water resources. WHERE ARE WE? We are one of 36 Conservation
New pressures to reduce deforestation of the Brazilian Amazon
 New pressures to reduce deforestation of the Brazilian Amazon Paulo Barreto Senior Researcher IMAZON www.imazon.org.br E mail: pbarreto@imazon.org.br Presented at the Brazil Institute t Woodrow Wilson
Mission. Selected Accomplishments from Walnut Gulch. Facilities. To develop knowledge and technology to conserve water and soil in semi-arid lands
 USDA-ARS Southwest Watershed Research Center Mission Sound Science for Watershed Decisions To develop knowledge and technology to conserve water and soil in semi-arid lands ARS Watershed Locations Selected
Technical Memorandum. 1.0 Introduction
 Technical Memorandum To: Jennifer Saran and Christie Kearney, Poly Met Mining, Inc. Project: 23/69-0862.12 100 001 c: Keith Hanson and Tina Pint, Barr Engineering Co. Disclaimer: This is a working document.
Calculating a Pollution Potential Index for Storm Water Runoff at the Watershed Scale Ranking watersheds for potential non-point pollution
 Calculating a Pollution Potential Index for Storm Water Runoff at the Watershed Scale Ranking watersheds for potential non-point pollution Philip Dougherty GISC 6387 7-27-2006 Introduction Non-point source
International Bank for Reconstruction and Development International Development Association
 International Bank for Reconstruction and Development International Development Association PROGRESS REPORT TO THE BOARD OF EXECUTIVE DIRECTORS ON THE IMPLEMENTATION OF THE MANAGEMENT ACTION PLAN IN RESPONSE
Water and Climate Change
 Water and Climate Change Building Community Consensus for a Sustainable Future for Iowa and the World Kristie J. Franz Jean Goodwin Bill Gutowski Chris Rehmann Bill Simpkins Leigh Tesfatsion Al Wanamaker
The Fourth Assessment of the Intergovernmental
 Hydrologic Characterization of the Koshi Basin and the Impact of Climate Change Luna Bharati, Pabitra Gurung and Priyantha Jayakody Luna Bharati Pabitra Gurung Priyantha Jayakody Abstract: Assessment of
MODELING PHOSPHORUS LOADING TO THE CANNONSVILLE RESERVOIR USING SWAT
 MODELING PHOSPHORUS LOADING TO THE CANNONSVILLE RESERVOIR USING SWAT Bryan Tolson 1 & Christine Shoemaker 2 1. PhD Student, 2. Professor School of Civil & Environmental Engineering Cornell University PWT
Biology 112 Introduction to Ecology QZ Urbanization
 10. Urbanization 1. Which event took place during the first urban revolution? A. People moved into cities for the first time. B. Modern cities developed as commerce replaced farming as the main way to
river modelling keeping low flows in mind
 Incorporating surfacegroundwater interactions into river modelling keeping low flows in mind David Rassam 11 February 2013 CSIRO LAND WATER; WATER FOR A HEALTHY COUNTRY FLAGSHIP Outline of presentation
contribution of SWAT modelling to integrated land use governance
 Biofuel impacts on ecosystem services, biodiversity and human well-being the contribution of SWAT modelling to integrated land use governance Lorenzo Di Lucia, Nicole Kalas, Jeremy Woods Imperial College
Water Resources Status in Danube River Basin. SWAT Conference_ Spain, Toledo June 2011
 Water Resources Status in Danube River Basin SWAT Conference_ Spain, Toledo June 2011 Objectives Objectives Building and calibratîng a hydrologic model of Danube Basin Using SWAT and SWAT CUP Quantifying
Agroforestry Systems for Climate Change Mitigation and Adaptation. Shibu Jose H.E. Garrett Endowed Professor and Director
 Agroforestry Systems for Climate Change Mitigation and Adaptation Shibu Jose H.E. Garrett Endowed Professor and Director Claims Galore!! Agroforestry promises to create synergies between efforts to mitigate
Lecture 1 Integrated water resources management and wetlands
 Wetlands and Poverty Reduction Project (WPRP) Training module on Wetlands and Water Resources Management Lecture 1 Integrated water resources management and wetlands 1 Water resources and use The hydrological
M.L. Kavvas, Z. Q. Chen, M. Anderson, L. Liang, N. Ohara Hydrologic Research Laboratory, Civil and Environmental Engineering, UC Davis
 Assessment of the Restoration Activities on Water Balance and Water Quality at Last Chance Creek Watershed Using Watershed Environmental Hydrology (WEHY) Model M.L. Kavvas, Z. Q. Chen, M. Anderson, L.
21st Century Climate Change In SW New Mexico: What s in Store for the Gila? David S. Gutzler University of New Mexico
 21st Century Climate Change In SW New Mexico: What s in Store for the Gila? David S. Gutzler University of New Mexico gutzler@unm.edu Silver City, NM June 5, 2008 Global Warming in the 20th/Early 21st
Otonabee Region WATERSHED
 Otonabee Region WATERSHED Report Card 2018 Otonabee Conservation has prepared this report card as a summary of the state of your forests, wetlands, and water resources using data from 2012 to 2016. WHERE
Application of SWAT Model in land-use. change in the Nile River Basin: A Review
 Application of SWAT Model in land-use change in the Nile River Basin: A Review By: Marwa Ali, Okke Batelaan and Willy Bauwens 15-6-2011 Application of SWAT Model in land-use 1 change in the Nile River
Ecological Restoration Strategies for Cattle Ranching Landscapes of the Azuero
 COURSE REPORT Ecological Restoration Strategies for Cattle Ranching Landscapes of the Azuero ELTI Focal Training Sites District of Pedasi, Province of Los Santos September 25-30, 2016 A field course organized
Water Resource Sustainability of the Palouse Region: A Systems Approach
 Water Resource Sustainability of the Palouse Region: A Systems Approach M.S. Thesis Defense Ramesh Dhungel Department of Civil Engineering Date: November 12, 2007 Committee: Dr. Fritz Fiedler Dr. Chuck
Yosio Edemir Shimabukuro a, b René Beuchle b Rosana Cristina Grecchi b Dario Simonetti b Frédéric Achard b
 Assessment of Deforestation and Forest Degradation due to Selective Logging and Fires using Time Series of Fraction Images derived from Landsat ETM+ images Yosio Edemir Shimabukuro a, b René Beuchle b
Exploiting linkages between soil quality, biodiversity and agricultural production
 Exploiting linkages between soil quality, biodiversity and agricultural production Andrew Gillison Center for Biodiversity Management Queensland, Australia Theme 1.1 Limitations to African Agriculture
ScienceDirect. Land capability analysis based on hydrology and soil characteristics for watershed rehabilitation
 Available online at www.sciencedirect.com ScienceDirect Procedia Environmental Sciences 28 (2015 ) 142 147 The 5th Sustainable Future for Human Security (SustaiN 2014) Land capability analysis based on
MODULE 1 RUNOFF HYDROGRAPHS WORKSHEET 1. Precipitation
 Watershed MODULE 1 RUNOFF HYDROGRAPHS WORKSHEET 1 A watershed is an area of land thaaptures rainfall and other precipitation and funnels it to a lake or stream or wetland. The area within the watershed
Watersheds and the Hydrologic Cycle
 Watersheds and the Hydrologic Cycle The Global Hydrologic Cycle Water Cycle in Florida Florida Water Facts Surface Area = 170,452 km 2 Average Rainfall = 140 cm (55 ) Total Annual Rain = 238 billion m
Available online at ScienceDirect. Procedia Environmental Sciences 33 (2016 ) Suria Darma Tarigan*
 Suria Darma Tarigan*") Available online at www.sciencedirect.com ScienceDirect Procedia Environmental Sciences 33 (2016 ) 386 392 The 2 nd International Symposium on LAPAN-IPB Satellite for Food Security and Environmental Monitoring
Available online at www.sciencedirect.com ScienceDirect Procedia Environmental Sciences 33 (2016 ) 386 392 The 2 nd International Symposium on LAPAN-IPB Satellite for Food Security and Environmental Monitoring
UTILIZING GEOGRAPHIC INFORMATION SYSTEMS TO IDENTIFY AND MONITOR CONCENTRATED ANIMAL FEEDING OPERATIONS IN DUPLIN COUNTY, NC
 UTILIZING GEOGRAPHIC INFORMATION SYSTEMS TO IDENTIFY AND MONITOR CONCENTRATED ANIMAL FEEDING OPERATIONS IN DUPLIN COUNTY, NC Sean Burke Graduate Student Department of Geography and Geology University of
Tracking the Effectiveness of Climate Finance: The Cases of the Amazon and the Brazilian Climate Funds. CCXG Seminar September 2013
 Tracking the Effectiveness of Climate Finance: The Cases of the Amazon and the Brazilian Climate Funds CCXG Seminar September 2013 Agenda 1. Landscape of Brazil and Climate Change 2. Overview of BNDES
Lecture 9A: Drainage Basins
 GEOG415 Lecture 9A: Drainage Basins 9-1 Drainage basin (watershed, catchment) -Drains surfacewater to a common outlet Drainage divide - how is it defined? Scale effects? - Represents a hydrologic cycle
Measuring discharge. Climatological and hydrological field work
 Measuring discharge Climatological and hydrological field work 1. Background Discharge (or surface runoff Q s) refers to the horizontal water flow occurring at the surface in rivers and streams. It does
Effect of Land Surface on Runoff Generation
 Effect of Land Surface on Runoff Generation Context: Hydrologic Cycle Runoff vs Infiltration Infiltration: Process by which water on the ground surface enters the soil Runoff: Water (from rain, snowmelt,
Tropical Forest Restoration Strategies
 COURSE REPORT Tropical Forest Restoration Strategies ELTI Focal Training Sites Azuero (Province of Los Santos, Panama) Agua Salud Project (Province of Colon, Panama) June 2 8, 2016 A field-based course
Lecture 11: Water Flow; Soils and the Hydrologic Cycle
 Lecture 11: Water Flow; Soils and the Hydrologic Cycle Water Flow in Soils Types of Water Flow in Soil Saturated flow: Soil pores completely filled with water; controlled by the hydrostatic potential After
AIACC Regional Study AS07: Southeast Asia Regional Vulnerability to Changing Water Resource and Extreme Hydrological Events due to Climate Change
 AIACC Regional Study AS07: Southeast Asia Regional Vulnerability to Changing Water Resource and Extreme Hydrological Events due to Climate Change Progress report: period mid-year 2003 Brief Summary: In
The Islamic University of Gaza- Civil Engineering Department Sanitary Engineering- ECIV 4325 L5. Storm water Management
 The Islamic University of Gaza- Civil Engineering Department Sanitary Engineering- ECIV 4325 L5. Storm water Management Husam Al-Najar Storm water management : Collection System Design principles The Objectives
1 n. Flow direction Raster DEM. Spatial analyst slope DEM (%) slope DEM / 100 (actual slope) Flow accumulation
 slope DEM / 100 (actual slope) Flow accumulation") 1 v= R S n 2/3 1/2 DEM Flow direction Raster Spatial analyst slope DEM (%) Flow accumulation slope DEM / 100 (actual slope) 0 = no cell contributing 215 = 215 cell contributing towards that cell sqrt (actual
1 v= R S n 2/3 1/2 DEM Flow direction Raster Spatial analyst slope DEM (%) Flow accumulation slope DEM / 100 (actual slope) 0 = no cell contributing 215 = 215 cell contributing towards that cell sqrt (actual
BAEN 673 / February 18, 2016 Hydrologic Processes
 BAEN 673 / February 18, 2016 Hydrologic Processes Assignment: HW#7 Next class lecture in AEPM 104 Today s topics SWAT exercise #2 The SWAT model review paper Hydrologic processes The Hydrologic Processes
Using Hansen's Global Forest Cover Change Datasets to Assess Forest Loss in Terrestrial Protected Areas
 Using Hansen's Global Forest Cover Change Datasets to Assess Forest Loss in Terrestrial Protected Areas A Case Study of the Philippines Armando Apan (Prof.), L.A. Suarez, Tek Maraseni & Allan Castillo
Degradation of of Forest Ecosystems
 Degradation of Forest Ecosystems NREM 612 Dr. Bruland I. Definitions: >250, forester, geographer, legal, etc. A. What constitutes a forest? 1. Sometimes clear boundaries bet. forest & non-forest, otherwise
LAND USE PLANNING FOR MAMMINASATA METROPOLITAN WATER AVAILABILITY, SOUTH SULAWESI, INDONESIA
 LAND USE PLANNING FOR MAMMINASATA METROPOLITAN WATER AVAILABILITY, SOUTH SULAWESI, INDONESIA Roland Alexander Barkey 1, Muh. Faisal M. 2 1 Research & Development Center for Natural Heritage, Biodiversity
Property Rights and Collective Action for Pro-Poor Watershed Management
 Property Rights and Collective Action for Pro-Poor Watershed Management Watersheds are simultaneously managed at various social and spatial scales, from microcatchments to transnational river systems and
Ecosystem Services: Provision, Value & Policy. Steve Polasky University of Minnesota & Natural Capital Project
 Ecosystem Services: Provision, Value & Policy Steve Polasky University of Minnesota & Natural Capital Project Introduction Ecosystems provide a wide array of goods and services of value to people Human
Lab #2. Marcelo Almeida EEOS 121
 Marcelo Almeida EEOS 121 Lab #2 Materials: two adjacent topo maps showing the Pine Tree Brook Watershed 11" X 17" xerox of a topographic map of the Pine Tree Brook watershed 11" X 17" piece of velum tracing
Ecological Restoration Strategies for Cattle Ranching Landscapes of the Azuero
 COURSE REPORT Ecological Restoration Strategies for Cattle Ranching Landscapes of the Azuero District of Pedasi, Province of Los Santos June 22-26, 2015 A field course organized by: The Environmental Leadership
Estimating annual irrigation water requirements
 Estimating annual irrigation water requirements Findings from the Sustainable dairy farm systems for profit project M5 Project Information Series - Studies on Mutdapilly Research Station and subtropical
Fillmore One to seven million acre-feet in storage depending on calculation assumption; surface area is 20,100 acres.
 Where does the City of Santa Paula obtain its water? Currently, the City of Santa Paula obtains its water supply from the court-adjudicated Santa Paula Groundwater Basin (Basin) and in lieu surface water
Deforestation. Becky Herman, Marion High School
 Instructional Sequence/Procedure (Req.): 1. Have students read the handout on deforestation upon entering the classroom. Give them enough time to read it. (Handout: http://www.pachamama.org/effects-of-deforestation)
Research on Ecosystem stability and transitions at PIK
 Research on Ecosystem stability and transitions at PIK Kirsten Thonicke Speaker of the working group Ecosystem stability and transitions in the Research Domain Earth System Analysis Deputy Chair of Research
Gray s Creek. Gray s Creek
 Gray s Creek 1 Grades F + Forest Conditions B Wetland Conditions C - Surface Water Quality This Watershed Report Card outlines the environmental information for the Gray s Creek watershed as of 2017. The
BCI Criterion 4.2. Smallholders. Conversion Risk Assessment Procedure. Version 0.1
 BCI Criterion 4.2 Conversion Risk Assessment Procedure Smallholders Version 0.1 Identification Name of producer: Name of Production Unit: Location (administrative unit, province/state and country): Area
Bench terraces on loess soil China - 土坎梯田, 梯地
 Bench terraces on loess soil China - 土坎梯田, 梯地 A Terrace is a structural SLM practice with a raised flat platform built on the slope to reduce soil loss and runoff on the slope, increase the rainfall infiltration
Appendix G Preliminary Hydrology Study
 Appendix G Preliminary Hydrology Study Preliminary Hydrology Study VESTING TTM 72608 Long Beach, CA Prepared for: The Long Beach Project, LLC 888 San Clemente, Suite 100 New Port Beach, CA May 28, 2014
OPAL. Offset Portfolio Analyzer and Locator. version 1.1.0
 OPAL Offset Portfolio Analyzer and Locator version 1.1.0 A tool for integrating biodiversity and ecosystem services into impact assessment and offset portfolio design User s Guide User s guide authored
M.L. Kavvas, Z. Q. Chen, M. Anderson, L. Liang, N. Ohara Hydrologic Research Laboratory, Civil and Environmental Engineering, UC Davis
 Assessment of the Restoration Activities on Water Balance and Water Quality at Last Chance Creek Watershed Using Watershed Environmental Hydrology (WEHY) Model M.L. Kavvas, Z. Q. Chen, M. Anderson, L.
Crop Land Use Change Data and Modeling: Case Study of Brazil
 Crop Land Use Change Data and Modeling: Case Study of Brazil Gbadebo ( Debo) Oladosu Keith Kline Virginia Dale January 13, 2009 Objectives Examine recent changes in cropland area/yield in Brazil and role
Amazon Scenarios: Modeling modeling interactions among land use, climate, and fire
 Amazon Scenarios: Modeling modeling interactions among land use, climate, and fire PI: Dan Nepstad (WHRC) (http://whrc.org) Co-PIs & Collaborators: Robert Kaufmann (BU), Paulo Moutinho, Ane Alencar (IPAM),
Runoff Volume: The Importance of Land Cover
 Runoff Volume: The Importance of Land Cover Grade Level: 9-12 Time: 1-2 class periods Learning Objectives: - Quantify the volume of water that runs off different land uses in a watershed. - Analyze the
SPATIAL-TEMPORAL ADJUSTMENTS OF TIME OF CONCENTRATION
 JOURNAL O LOOD ENGINEERING J E 1(1) January June 2009; pp. 21 28 SPATIAL-TEMPORAL ADJUSTMENTS OF TIME OF CONCENTRATION Kristin L. Gilroy & Richard H. McCuen Dept. of Civil and Environmental Engineering,
Ponds. Pond A water impoundment made by excavating a pit, or constructing a dam or an embankment.
 POND SITE SELECTION AND CONSTRUCTION Uses, Planning, & Design David Krietemeyer Area Engineer USDA-NRCS June 20, 2008 Uses Considerations for Location of Commonly Used Terms Pond A water impoundment made