First Flush Water Quality Results 2016
|
|
|
- Roderick Reeves
- 6 years ago
- Views:
Transcription


1 First Flush Water Quality Results 2016

2 First big rain of the season Freshwater runoff enters storm drains High pollution Sample at outfalls to ocean Oct 14 th : 0.45 in What is First Flush?


3 Partners

4 Objectives Better understand pollutant loads during the first significant rain of the season Identify what pollutants are of greatest concern and where Provide information to support water quality improvements Establish a continuous and consistent water quality dataset
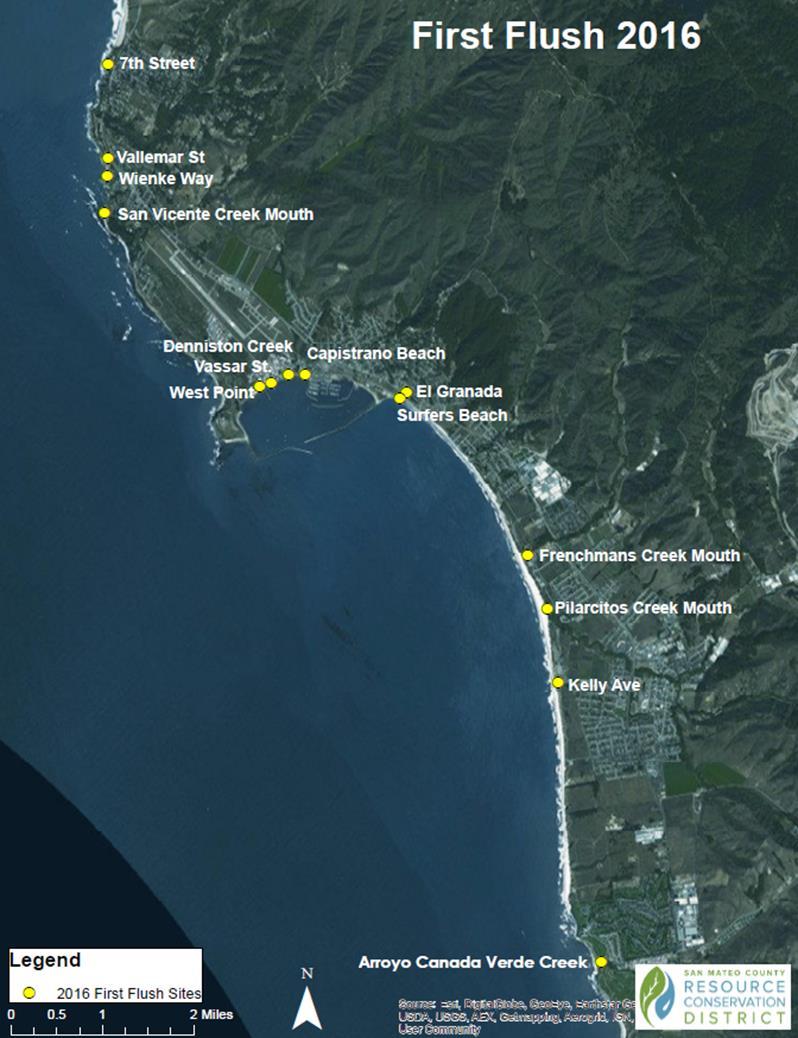
5 Montara/Moss Beach: 7 th Street Vallemar Street Weinke Way San Vicente Creek Mouth Pillar Point Harbor: West Point Ave Vassar Street Capistrano Street Denniston Creek El Granada: El Granada Storm drain Surfers Beach Half Moon Bay: Frenchmans Creek Pilarcitos Creek Mouth Arroyo Canada Verde Creek Kelly Ave 2016 Sample Sites
6
7 What are we testing? Pollutant Potential Sources Effects Fecal Indicator Bacteria (E. Coli, Enterococcus) Nutrients (Nitrate, Orthophosphate) Feces of warm blooded animals (ex: pet waste, human sewage) Fertilizers, pesticides detergents, human waste Indicator for human pathogens and health impacts Eutrophication/harmful algal blooms-ecosystem and recreation impacts Metals (Copper, Zinc, Lead) Total Suspended Solids Brake pads, tires, streets, industrial waste, roofs, gutters, downspouts Construction sites, erosion, agricultural runoff Impacts to aquatic organisms and human health Sedimentation, respiratory effects in organisms

8 Physical Tests Transparency ph Electrical conductivity Water temperature Observations: trash, odor, bubbles, scum, oil

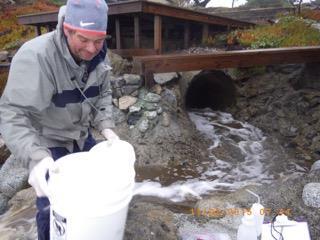
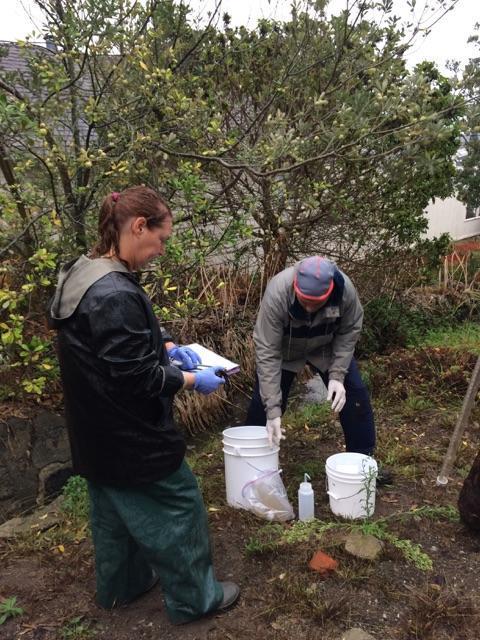
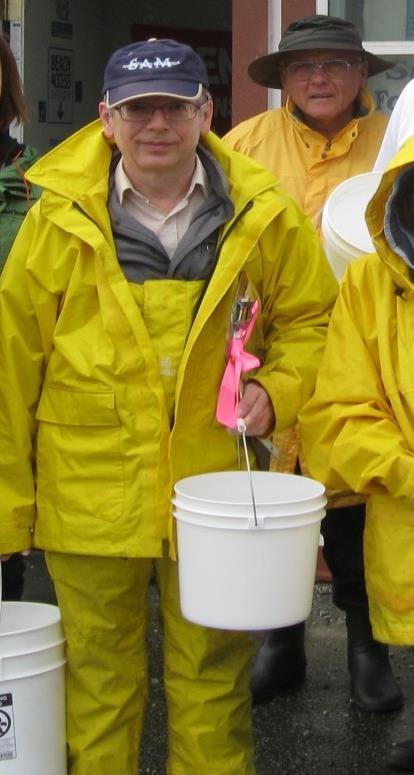
9 Train and Mobilize Volunteers
 9 of the")

10 Data Analysis First Flush sites First Flush Historic ( ) 9 of the 14 sites Comparisons between sites, over time and against Water Quality Objectives (WQOs)
11 Dates Nov 1, 2008 Oct 13, 2009 Oct 17, 2010 Oct 5,2011 Oct 22, 2012 Oct 31, 2014 Nov 2,2015 Oct 14, 2016 Actual Rainfall 0.42 in 2.86 in 0.52 in 0.88 in 0.71 in 0.14 in 0.64 in 0.45 in
12 Dry Run vs First Flush San Vicente Creek Mouth Parameter Dry Run First Flush Water Quality Objective E. Coli (MPN/100 ml) Entercoccus (MPN/100 ml) <235 MPN/100 ml <104 MPN/100 ml NO 3 -N (mg/l) < 2.25 mg/l O-PO 4 -P (mg/l) ND 0.1 <0.12 mg/l Copper (µg/l) ND 7 <30 µg/l Lead (µg/l) ND ND <30 µg/l Zinc (µg/l) ND 36 < 200 µg/l TSS (mg/l) ND 79 <500 mg/l * Red indicates exceedance of water quality objectives
13 E. coli 2016 Detection Limit: 24,196 WQO<235 All sites exceeded WQO except Arroyo Canada Verde
14 E. coli 2016 (1:100 Dilution) Detection Limit: 241,960 WQO<235 Capistrano St. highest of all sites in all counties (32 sites)
15 WQO < 235 Surfers South consistently high
16 Enterococcus 2016 Detection Limit: 24,196 WQO<104 All sites exceeded WQO
17 Enterococcus 2016 (1:100 Dilution) Detection Limit: 241,960 WQO<104 All sites exceeded WQO
18 WQO < 104 Capistrano Street consistently high
19 Copper 2016 WQO<30
20 Vassar exceeded WQO every year
21 Zinc 2016 WQO < 200
22 West Point exceeded WQO most frequently
23 Lead 2016 WQO<30
24
25 Nitrate 2016 WQO< 2.25 West Point had highest concentration in all counties
26 West Point consistently high
27 Orthophosphate 2016 WQO<0.12
28 El Granada SD exceeded WQO every year
29 Total Suspended Solids 2016 WQO<500
30
: 96% exceedance Metals Copper: 57% exceedance Zinc: 43% exceedance Lead 0% exceedance Nutrients")
31 2016 Results Summary Bacteria (E. Coli and Enterococcus): 96% exceedance Metals Copper: 57% exceedance Zinc: 43% exceedance Lead 0% exceedance Nutrients Orthophosphate: 71% exceedance Nitrate: 0% exceedance Total Suspended Solids: 0% exceedance
32 Historic Results Summary Pollutant Exceedance Rate ( ) Locations of most exceedances and/or highest values Bacteria 100% Surfers and Capistrano Orthophosphate 72% Surfers and El Granada Copper 56% West Point and Vassar Zinc 27% West Point and Vassar TSS 2% San Vicente Creek Mouth Nitrate 0% West Point Lead 0% Vassar
 Zinc 1) Bacteria 2) Orthophosphate 1) Bacteria 2) Orthophosphate 3) Copper 4) Zinc Not a historic")
33 Historic Pollutants at Historic Sites Pollutants numbered from highest priority to lowest 1) Bacteria 2) Copper 3) Orthophosphate 4) Zinc 1) Bacteria 2) Orthophosphate 1) Bacteria 2) Orthophosphate 3) Copper 4) Zinc Not a historic sampling site
34 Next Steps Continue collecting data during first flush to document trends along the San Mateo coast for a wide variety of pollutants Use data with other relevant information to promote efforts to reduce pollution in coastal SMC Pinpoint sources for certain pollutants and areas of concern Scope solutions and implement remediation measures
35 Thank you! Questions? Brittani Bohlke San Mateo County Resource Conservation District ext 104
First Flush 2015: Midcoast Storm Drains
 First Flush 2015: Midcoast Storm Drains What is First Flush? First big rain of the season Freshwater runoff enters storm drains High pollution Sampled at outfall to ocean Nov 2 nd : 0.64 in Partners Objectives
Dry Run & First Flush 2011 Monitoring Report
 Monterey Bay Sanctuary Citizen Watershed Monitoring Network 299 Foam Street Monterey, CA 93940 Bus. (831) 647-4227 Fax (831) 647-4250 Dry Run & First Flush 2011 Monitoring Report Prepared by: Lisa Emanuelson,
Dry Run & First Flush 2012 Monitoring Report
 Monterey Bay Sanctuary Citizen Watershed Monitoring Network 99 Pacific Street, Bldg 455, Monterey, CA 93940 Bus. (831) 647-4227 Fax (831) 647-4250 Dry Run & First Flush 2012 Monitoring Report Prepared
MRSWMP Dry Run/ First Flush Summary
 Monterey Bay Sanctuary Citizen Watershed Monitoring Network 299 Foam Street Monterey, CA 93940 Bus. (831) 647-4227 Fax (831) 647-4250 2009-2010 MRSWMP Dry Run/ First Flush Summary Prepared by: Lisa Emanuelson,
2009 First Flush Program Final Report
 2009 First Flush Program Final Report City Purchase Order #25-10001 Prepared for: City of Santa Cruz Department of Public Works Prepared by: Greg Pepping Executive Director Coastal Watershed Council 345
Dry Run & First Flush 2014 Monitoring Report
 Monterey Bay Sanctuary Citizen Watershed Monitoring Network 99 Pacific Street, Bldg 455, Monterey, CA 93940 Bus. (831) 647-4227 Fax (831) 647-4250 Dry Run & First Flush 2014 Monitoring Report Prepared
First Flush 2008 Monitoring Report
 Monterey ay Sanctuary itizen Watershed Monitoring Network 299 Foam Street Monterey, A 9394 us. (831) 647-4227 Fax (831) 647-425 First Flush 28 Monitoring Report Prepared by: Lisa Emanuelson, Volunteer
Water Quality Report Card for Santa County Snapshot Day Results: May 5, 2012
 Water Quality Report Card for Santa County Snapshot Day Results: May 5, 2012 Prepared by: Debie Chirco-Macdonald Monitoring Coordinator Coastal Watershed Council 345 Lake, Suite F, Santa Cruz, CA 95062
First Flush 2007 Monitoring Report
 Monterey Bay Sanctuary Citizen Watershed Monitoring Network 299 Foam Street Monterey, CA 9394 Bus. (83) 647-4227 Fax (83) 647-425 First Flush 27 Monitoring Report Prepared by: Anna Holden-Martz, Citizen
2011 Central Coast Regional Snapshot Day Summary Report
 2011 Central Coast Regional Snapshot Day Summary Report Prepared for: City of Santa Cruz Department of Public Works Prepared by: Debie Chirco-Macdonald Program Coordinator Coastal Watershed Council 345
Acidity and Alkalinity:
 Evaluation of Pollution Sources to Lake Glenville Quarterly Report December 2018 Kimberlee K Hall, PhD Environmental Health Program, Western Carolina University Summary Chemical and microbial analysis
GULF OF MEXICO - SEGMENT 2501
 GULF OF MEXICO - SEGMENT 2501 GULF OF MEXICO - SEGMENT 2501 LAND COVER BACTERIA CHLOROPHYLL A Impairment Concern No Impairments or Concerns GULF OF MEXICO - SEGMENT 2501 OTHER IMPAIRMENTS Bays & Estuaries
Stormwater Monitoring Report 2009
 Morro Bay National Estuary Program s Implementation Effectiveness Program Stormwater Monitoring Report 2009 Agreement Number 08-309-550-1 Task 11.5 Submitted by Ann Kitajima, Program Manager April 26,
City of Texarkana, Arkansas. Storm Water Pollution
 City of Texarkana, Arkansas Storm Water Pollution STORM WATER GUIDE What is Storm Water Pollution? Stormwater can provide a toxic discharge which can enter into a lake, river or coastal water system. As
Chapter 9: Stormwater Pollution in the Fairy Creek Catchment
 Chapter 9: Stormwater Pollution in the Fairy Creek Catchment Kelly Peden Australia s beaches are a key component of its cultural identity, but this symbol is not as clean as could be. Beach pollution is
5.0 LOS ANGELES RIVER WATERSHED MANAGEMENT AREA
 5.0 LOS ANGELES RIVER WATERSHED MANAGEMENT AREA 5.1 Watershed Description 5.1.1 Watershed Land Use, Percent Impervious, and Population The Los Angeles Watershed Management Area has more than half its area
4.0 SAN GABRIEL RIVER WATERSHED MANAGEMENT AREA
 4.0 SAN GABRIEL RIVER WATERSHED MANAGEMENT AREA 4.1 Watershed Description 4.1.1 Watershed Land Use, Percent Impervious, and Population Land use in the San Gabriel River Watershed Management Area is approximately
Factsheet: Town of Deep River Water Quality and Stormwater Summary
 79 Elm Street Hartford, CT 06106-5127 www.ct.gov/deep Affirmative Action/Equal Opportunity Employer Factsheet: Town of Deep River Water Quality and Stormwater Summary This document was created for each
Water Quality Assessment for the Town of Caswell Beach, 2008
 Water Quality Assessment for the Town of Caswell Beach, 2008 UNCW-CMS Report 08-02 Report to: Town of Caswell Beach 1100 Caswell Beach Rd. c/o Mr. Jim Carter, Town Administrator Caswell Beach, N.C. 28465
Factsheet: Town of Trumbull Water Quality and Stormwater Summary
 79 Elm Street Hartford, CT 06106-5127 www.ct.gov/deep Affirmative Action/Equal Opportunity Employer Factsheet: Town of Trumbull Water Quality and Stormwater Summary This document was created for each town
Factsheet: Town of Hamden Water Quality and Stormwater Summary
 79 Elm Street Hartford, CT 06106-5127 www.ct.gov/deep Affirmative Action/Equal Opportunity Employer Factsheet: Town of Hamden Water Quality and Stormwater Summary This document was created for each town
Executive Summary EXECUTIVE SUMMARY. ES.1 Monitoring Program Objectives. ES.2 Summary of Monitoring Results
 EXECUTIVE SUMMARY ES.1 Monitoring Program Objectives The following are the major monitoring program objectives, as outlined in the Municipal Stormwater Permit: Assess compliance with the Municipal Stormwater
Factsheet: City of West Haven Water Quality and Stormwater Summary
 79 Elm Street Hartford, CT 06106-5127 www.ct.gov/deep Affirmative Action/Equal Opportunity Employer Factsheet: City of West Haven Water Quality and Stormwater Summary This document was created for each
Nutrient distributions and the interaction between coastal wetlands and the nearshore of Lake Ontario
 Nutrient distributions and the interaction between coastal wetlands and the nearshore of Ontario Krista Chomicki and Gary Bowen International Association of Great s Research, 25 Type Durham Region Coastal
Factsheet: Town of East Lyme Water Quality and Stormwater Summary
 79 Elm Street Hartford, CT 06106-5127 www.ct.gov/deep Affirmative Action/Equal Opportunity Employer Factsheet: Town of East Lyme Water Quality and Stormwater Summary This document was created for each
The Snapshot CONODOGUINET CREEK WATERSHED SNAPSHOT
 CONODOGUINET CREEK WATERSHED SNAPSHOT ABOVE: CONODOGUINET CREEK AT RT 74 BRIDGE FACING DOWNSTREAM The Snapshot The Conodoguinet Watershed Snapshot was a collaborative effort to engage local citizens in
State of the San Lorenzo River Symposium Saturday, April 11, 2015 Greg Pepping, Executive Director Coastal Watershed Council
 State of the San Lorenzo River Symposium Saturday, April 11, 2015 Greg Pepping, Executive Director Coastal Watershed Council Coastal Watershed Council Santa Cruz-based 501(c)(3) Established 1995 Science-based
Little Cypress Bayou Special Study - Subwatershed 1.10
 - Subwatershed 1.1 Sabine River Authority of Texas August 31, 21 Prepared in Cooperation with the Texas Natural Resource Conservation Commission Under the Authorization of the Texas Clean Rivers Act Table
Dog River Watershed Management Plan
 Dog River Watershed Management Plan Preliminary Water Quality Data Analysis Doug Robison, PWS ESA is where solutions and service meet. Water Quality - Regulatory Primer Designated Use Categories Swimming
Impacts of Rainfall Events on Water Quality in the Houston Metro Area
 Impacts of Rainfall Events on Water Quality in the Houston Metro Area Hanadi Rifai and Anuradha Desai Civil and Environmental Engineering University of Houston, Houston, TX Acknowledgments TCEQ EPA Houston
Tackling Non-point Source Water Pollution in British Columbia
 Water Quality Clean Water Tackling Non-point Source Water Pollution in British Columbia Our well-being depends on sustainable supplies of clean water for our physical health and for a healthy environment
Pamela Reitsma Environmental Scientist Narragansett Bay Commission
 Pamela Reitsma Environmental Scientist Narragansett Bay Commission Narragansett Bay Commission Narragansett Bay Commission (NBC) is a quasi-state agency which oversees the two largest WWTFs in Rhode Island:
WATER QUALITY MONITORING IN THE LOXAHATCHEE ESTUARY
 WATER QUALITY MONITORING IN THE LOXAHATCHEE ESTUARY Rebecca Wilder Town of Jupiter Utilities Bud Howard Loxahatchee River District TOWN OF JUPITER UTILITIES PRESENTATION OUTLINE Loxahatchee River District
EAST FORK SAN JACINTO RIVER - SEGMENT 1003
 EAST FORK SAN JACINTO RIVER - SEGMENT 1003 EAST FORK SAN JACINTO RIVER - SEGMENT 1003 LAND COVER BACTERIA Impairment Concern No Impairments or Concerns Perennial Stream Perennial Stream Segment Number:
The Status of Pompeston Creek, : From Data to Action. Pompeston Creek Watershed Association
 Pompeston Creek Watershed Association P.O. Box 2883 Cinnaminson, NJ 08077 (856) 235-9204 www.pompestoncreek.org The Status of Pompeston Creek, 1998-2008: From Data to Action Pompeston Creek Watershed Association
Grants Pass Water Quality Monitoring
 Grants Pass Water Quality Monitoring 2003-2005 Rogue Valley Council of Governments April 2005 Rogue Valley Council of Governments Natural Resources Department 155 North First Street Central Point, Oregon
PROTECTING OUR WATERWAYS: STORMWATER POLLUTION REDUCTION EFFORTS
 PROTECTING OUR WATERWAYS: STORMWATER POLLUTION REDUCTION EFFORTS Public Information Meeting ~ May 2, 2018 Public Works Stormwater Management Division OVERVIEW Surface Water Quality Protection Municipal
21st International Conference of The Coastal Society THE SURFRIDER FOUNDATION S BLUE WATER TASK FORCE
 21st International Conference of The Coastal Society THE SURFRIDER FOUNDATION S BLUE WATER TASK FORCE Mara Dias, Surfrider Foundation Charlie Plybon, Surfrider Foundation The Surfrider Foundation is a
DC STORMWATER PLAN CONSOLIDATED TOTAL MAXIMUM DAILY LOAD (TDML) IMPLEMENTATION PLAN
 IMPLEMENTATION PLAN") DC STORMWATER PLAN CONSOLIDATED TOTAL MAXIMUM DAILY LOAD (TDML) IMPLEMENTATION PLAN CONTENTS Introduction 1 The Challenge 5 The Solution 7 Tracking Progress 11 What can you do? 15 INTRODUCTION The DC Stormwater
DC STORMWATER PLAN CONSOLIDATED TOTAL MAXIMUM DAILY LOAD (TDML) IMPLEMENTATION PLAN CONTENTS Introduction 1 The Challenge 5 The Solution 7 Tracking Progress 11 What can you do? 15 INTRODUCTION The DC Stormwater
Wood Canyon Emergent Wetland Project. City of Aliso Viejo 12 Journey, Suite 100 Aliso Viejo, CA 92656
 Wood Canyon Emergent Wetland Project City of Aliso Viejo 12 Journey, Suite 100 Aliso Viejo, CA 92656 Introduction Wood Canyon is located within Aliso and Wood Canyon Regional Park in southwest Orange County,
SIERRA CLUB. Protect America s Environment. For our Families For our Future. 85 Second Street San Francisco, California 94105
 SIERRA CLUB Protect America s Environment. For our Families For our Future 85 Second Street San Francisco, California 94105 SAFE DRINKING WATER IS ESSENTIAL FOR HEALTHY COMMUNITIES WATER POLLUTION IS A
Storm Water Products
 Storm Water Products What are Catch Basin inserts Compact water filtering systems that are designed to be installed into existing roadside drains commonly called a catch basin Catch basin insert The StormBasin
Christchurch Wastewater Treatment Plant
 Christchurch Wastewater Treatment Plant Annual Monitoring Report July 213 - June 2 CHRISTCHURCH WASTEWATER TREATMENT PLANT SHUTTLE DRIVE OFF PAGES ROAD PO BOX 7341 CHRISTCHURCH NEW ZEALAND TEL 64-3-941-571
San Mateo/Cristianitos Creek Baseline Water Quality Monitoring Subproject Data Report. Orange County Coastkeeper. August
 San Mateo/Cristianitos Creek Baseline Water Quality Monitoring Subproject Data Report Orange County Coastkeeper August 25 2008 Table of Contents Page Project Map 3 Executive Summary 4 Background 6 Project
Coastal Water Ways. Want to Know How to Protect Your Water Quality? Volume 1, Issue 1. Coastal Waccamaw Stormwater Education Consortium
 Volume 1, Issue 1 Want to Know How to Protect Your Water Quality? We re going to help! This article is the first in a series of informational and educational tools for property owners concerned about water
SUMMARY REPORT. Brik Zivkovich, M.S., EIT Graduate Engineering Intern, Master Planning Program
 SUMMARY REPORT BY: Holly Piza, P.E. Project Manager, Master Planning Program Brik Zivkovich, M.S., EIT Graduate Engineering Intern, Master Planning Program SUBJECT: Water quality summary report of the
Portland Water District Sebago Lake Watershed Monitoring Programs Crooked River Monitoring (1977 to 2016) Brie Holme
 Brie Holme") Portland Water District Sebago Lake Watershed Monitoring Programs Crooked River Monitoring (1977 to 2016) Brie Holme Introduction Sebago Lake is the primary drinking water supply for 200,000 people in
Portland Water District Sebago Lake Watershed Monitoring Programs Crooked River Monitoring (1977 to 2016) Brie Holme Introduction Sebago Lake is the primary drinking water supply for 200,000 people in
Oso Creek and Oso Bay Data Report
 Oso Creek and Oso Bay Data Report February 2011 Prepared by: Texas Stream Team River Systems Institute Texas State University San Marcos This report was prepared in cooperation with the Texas Commission
Monterey Bay Sanctuary Citizen Watershed Monitoring Network 99 Pacific Street Monterey, CA Bus. (831)
") Monterey Bay Sanctuary Citizen Watershed Monitoring Network 99 Pacific Street Monterey, CA 93940 Bus. (831) 647-4227 MONTEREY REGIONAL STORMWATER MANAGEMENT PROGRAM SUMMARY DATA ANALYSIS AND GRAPHIC DISPLAY
Monterey Bay Sanctuary Citizen Watershed Monitoring Network 99 Pacific Street Monterey, CA 93940 Bus. (831) 647-4227 MONTEREY REGIONAL STORMWATER MANAGEMENT PROGRAM SUMMARY DATA ANALYSIS AND GRAPHIC DISPLAY
Redwood Shores Lagoon November 2016 Monthly Water Quality Monitoring Report
 Redwood Shores Lagoon November 2016 Monthly Water Quality Monitoring Report Prepared for Redwood City Public Works Services Department 1400 Broadway Redwood City, CA 94063-2594 Prepared by Clean Lakes,
Redwood Shores Lagoon February 2019 Monthly Water Quality Monitoring Report
 Redwood Shores Lagoon February 2019 Monthly Water Quality Monitoring Report Prepared for Redwood City Public Works Services Department 1400 Broadway Redwood City, CA 94063-2594 Prepared by Clean Lakes,
AGENDA CHANNEL ISLANDS HARBOR TASK FORCE SPECIAL MEETING
 A. Roll Call B. Pledge of Allegiance C. New Business AGENDA CHANNEL ISLANDS HARBOR TASK FORCE SPECIAL MEETING Monday, October 22, 2018, 6:00pm Performing Arts Center, Ventura Room 800 Hobson Way, Oxnard,
Santa Rosa Creek Water Quality Results 2004
 Santa Rosa Creek Water Quality Results 24 Community Clean Water Institute Site Description: SRC4: Off 3rd Street in downtown Santa Rosa. Behind the Vineyard Hotel just West of Highway 11 along the Prince
Chemical and Microbiological Quality of Stormwater Runoff Affected by Dry Wells; A Case Study in Millburn, NJ
 Chemical and Microbiological Quality of Stormwater Runoff Affected by Dry Wells; A Case Study in Millburn, NJ Leila Talebi 1, Robert Pitt 2 1 PhD Candidate, Department of Civil, Construction and Environmental
CITY OF NORTH MYRTLE BEACH OCEAN OUTFALL PROGRAM
 CITY OF NORTH MYRTLE BEACH OCEAN OUTFALL PROGRAM Reduction of Pollutant Load as a Stormwater Management Option Strategies and Tools to Protect and Restore Coastal Water Quality Kevin D. Blayton, PE City
Presentation to Surfside Stormwater Committee. 8/21/2012 Ken Harth, Surfside Beach VM Field Leader Susan Libes, Coastal Carolina University
 Presentation to Surfside Stormwater Committee 8/21/2012 Ken Harth, Surfside Beach VM Field Leader Susan Libes, Coastal Carolina University Surfside Volunteer Water Quality Monitoring Program Goals Why
Redwood Shores Lagoon May 2017 Monthly Water Quality Monitoring Report
 Redwood Shores Lagoon May 2017 Monthly Water Quality Monitoring Report Prepared for Redwood City Public Works Services Department 1400 Broadway Redwood City, CA 94063-2594 Prepared by Clean Lakes, Inc.
Redwood Shores Lagoon August Monthly Water Quality Monitoring Report
 Redwood Shores Lagoon August Monthly Water Quality Monitoring Report Prepared for Redwood City Public Works Services Department 1400 Broadway Redwood City, CA 94063-2594 Prepared by Clean Lakes, Inc. P.
2017 Water Quality Year in Review
 Lake Pontchartrain Basin Foundation Water Quality Program Pontchartrain Basin Sampling Program How Clean is Lake Pontchartrain s Water? 2017 Water Quality Year-in-Review In 2017, LPBF Water Quality Program
Portland Water District Sebago Lake Watershed Monitoring Programs Crooked River Monitoring (1977 to 2017) Brie Holme
 Brie Holme") Portland Water District Sebago Lake Watershed Monitoring Programs Crooked River Monitoring (1977 to 2017) Brie Holme Introduction Sebago Lake is the primary drinking water supply for 200,000 people in
Portland Water District Sebago Lake Watershed Monitoring Programs Crooked River Monitoring (1977 to 2017) Brie Holme Introduction Sebago Lake is the primary drinking water supply for 200,000 people in
Environmental Services
 215 Environmental Services River Water Quality Summary for the Twin Cities Metropolitan Area In 215, Metropolitan Council Environmental Services (MCES) river monitoring was conducted at six automated and
Impact of Orange County Sanitation District Wastewater Disinfection on Beach Water Quality
 Impact of Orange County Sanitation District Wastewater Disinfection on Beach Water Quality Coastal Coalition March 27, 2014 Presented By: Dr. Samuel Choi Orange County Sanitation District Environmental
IMPROVING WATER QUALITY FLOWING TO THE OCEAN AND BAY
 Issue Background Findings Conclusions Recommendations Responses Attachments IMPROVING WATER QUALITY FLOWING TO THE OCEAN AND BAY Issue Statement What are city and County agencies doing to improve the quality
West Souris River Technical Water Quality Report Summary
 Page 1 West Souris River Technical Water Quality Report Summary SAMPLING BACKGROUND INFORMATION Surface water quality data have been collected by the Water Quality Management Section, Manitoba Water Stewardship,
The Ocean Begins at Your Front Door
 The Ocean Begins at Your Front Door Follow these simple steps to help reduce water pollution: Household Activities Do not rinse spills with water. Use dry cleanup methods such as applying cat litter or
Norwalk Harbor Report Card
 Norwalk Harbor Report Card C+ Following the water s trail from your house, into the river, and to the Harbor The way land is used in a watershed has a significant effect on water quality. In areas where
MS4 Assessment Program to Satisfy Part V. Monitoring Requirements
 MS4 Assessment Program to Satisfy Part V. Monitoring Requirements Submitted by City of Boynton Beach MS4 Permit No. FLS000018-004 The purpose of this document is to outline the City of Boynton Beach Stormwater
Newcastle Creek Community Watershed Water Quality Objectives Attainment Report
 Newcastle Creek Community Watershed Water Quality Objectives Attainment Report Environmental Quality Section Environmental Protection Division West Coast Region 2013 Report Prepared by: Clayton Smith.
TMDL: Search for Natural Source Exclusion EWELINA MUTKOWSKA COUNTY STORMWATER PROGRAM MANAGER
 TMDL: Search for Natural Source Exclusion EWELINA MUTKOWSKA COUNTY STORMWATER PROGRAM MANAGER Presentation at California Marine Affairs & Navigation Conference (CMANC) January 15, 2015 Outline Background
National Science Content Standards: A: Science as Inquiry E: Science and Technology
 National Science Content Standards: A: Science as Inquiry E: Science and Technology To develop an understanding of water quality monitoring and an appreciation of the methods used to keep water safe and
2009 Columbia River Water Quality Monitoring Data Report
 2009 Columbia River Water Quality Monitoring Data Report Table of Contents Page Introduction......3 Map of Columbia Basin....4 Maps of Portland and Wenatchee Area Sites..5 Maps or Columbia Gorge East and
ALISO CREEK WATERSHED RUNOFF MANAGEMENT PLAN WATER QUALITY DATA ASSESSMENT 2013 ANNUAL REPORT ORANGE COUNTY STORMWATER PROGRAM
 ALISO CREEK WATERSHED RUNOFF MANAGEMENT PLAN WATER QUALITY DATA ASSESSMENT 2013 ANNUAL REPORT ORANGE COUNTY STORMWATER PROGRAM Contents 1.0 Introduction... 1 2.0 Watershed Setting and BMPs... 2 3.0 BMP
Texas Watch Volunteer Water Quality Monitoring Program 2006 Mary s Creek Data Summary
 Texas Watch Volunteer Water Quality Monitoring Program 26 Mary s Creek Data Summary Narrative Summary of Mary s Creek Mary s Creek is an unclassified, perennial stream flowing 6 miles southwest from Pearland,
ILLICIT DISCHARGE INDICATOR THRESHOLDS MEMORANDUM
 ILLICIT DISCHARGE INDICATOR THRESHOLDS MEMORANDUM Prepared for Washington State Department of Ecology Prepared by Herrera Environmental Consultants, Inc. Note: Some pages in this document have been purposely
Water Monitoring in Spa Creek: A Summary
 Water Monitoring in Spa Creek: A Summary Written by: Alexis Jones & Blake Harden Edited by: Hannah Krauss Water monitoring is very important in order to determine the health of the Chesapeake Bay and its
POLLUTION. Bob Crabtree, WRc plc. Stormwater: What About Quality?
 SOURCE APPORTIONMENT OF URBAN POLLUTION Bob Crabtree, WRc plc Stormwater: What About Quality? 12 th May 2011, Arup Campus, Solihull Sewage, why with rain dilute? Your rain with sewage why pollute? Each
Continuous records for the Chariton River indicate that 2004 was an average water year, with total flow approximately equal to the average annual
 2004 Rathbun Report Iowa State University Limnology Laboratory John A. Downing, Ph.D. George Antoniou, Assistant Scientist For Rathbun Land and Water Alliance August 31, 2005 A. Tributaries Personnel of
Long-Term Volunteer Lake Monitoring in the Upper Woonasquatucket Watershed
 Long-Term Volunteer Lake Monitoring in the Upper Woonasquatucket Watershed Linda Green URI Watershed Watch 1-87-95, lgreen@uri.edu WATER QUALITY IS A REFLECTION OF THE ACTIVITIES IN THE LANDS AND WATERS
City of Delray Beach MS4 Assessment Program: Part V. Monitoring Requirements MS4 Permit No. FLS
 City of Delray Beach MS4 Assessment Program: Part V. Monitoring Requirements MS4 Permit No. FLS 000018 004 The purpose of this document is to outline the assessment program for the City of Delray Beach
What s In your Watershed Reeder Creek
 What s In your Watershed Reeder Creek Stephen Penningroth, Ph.D. Executive Director, Community Science Institute, Ithaca, NY Three Brothers Winery, Geneva, NY October 29, 2015 Sponsored by the Seneca Lake
SAN BERNARD RIVER ABOVE TIDAL - SEGMENT 1302
 SAN BERNARD RIVER ABOVE TIDAL - SEGMENT 1302 SAN BERNARD RIVER ABOVE TIDAL - SEGMENT 1302 LAND COVER BACTERIA DISSOLVED OXYGEN NUTRIENTS Impairment Concern No Impairments or Concerns SAN BERNARD RIVER
«225 «146. ^_ Texas Stream Team. !. Monitoring Station. "/ USGS Flow Station # Wastewater Outfall. Location Map. Morgan's Point. La Porte.
 95 5'0"W UPPER CEDAR GALVESTON BAYOU TIDAL BAY - - SEGMENT 0901 2421 95 0'0"W 94 55'0"W 94 50'0"W 29 45'0"N 29 45'0"N Trinity Bay «225 Tabbs Bay Location Map 29 40'0"N SPENCER HWY Big Island Slough SENS
Baseline Assessment of Root River Water Quality within the City of Racine
 Baseline Assessment of Root River Water Quality within the City of Racine May 31st to October 31st, 2007 Project Team: Dr. Julie Kinzelman (Principal Investigator) Emily Junion, BS Tristan Begotka History
The Business of Clean Water. Bringing private sector leadership to water quality in Baltimore
 The Business of Clean Water Bringing private sector leadership to water quality in Baltimore Who is the Waterfront Partnership? Incorporated in 2005 in response to maintenance and management issues in
2017 Annual Surface Water Quality Summary Regional Watershed Monitoring Program
 2017 Annual Surface Water Quality Summary Regional Watershed Monitoring Program Environmental Monitoring and Data Management Restoration and Infrastructure Division Acknowledgements Funding and/or in-kind
After reviewing data collected from ISLAND POND, STODDARD, the program coordinators have made the following observations and recommendations.
 OBSERVATIONS & RECOMMENDATIONS After reviewing data collected from ISLAND POND, STODDARD, the program coordinators have made the following observations and recommendations. Thank you for your continued
Morro Bay National Estuary Program s Implementation Effectiveness Program For the Morro Bay Watershed. Stormwater Monitoring Report 2015
 Morro Bay National Estuary Program s Implementation Effectiveness Program For the Morro Bay Watershed Stormwater Monitoring Report 215 Loan Agreement Number 12-81-55 Task 3.4 Submitted by Morro Bay National
Section 2 Stormwater Management Program Water Quality Assessment
 Section 2 Stormwater Management Program Water Quality Assessment 2.1 Stormwater Management Area Assessments Local Environmental Setting The, population 10,350 according to 2000 US census, generally lies
Appendix B: Inventory of Data Sources
 Appendix B: Inventory of Data Sources LIST OF DATA SOURCES AND REFERENCES TO SUPPORT WATER QUALITY IMPROVEMENT PLAN FOR THE SOUTH ORANGE COUNTY WATERSHED MANAGEMENT AREA November 4, 2015 Orange County
Phosphorus Treatment Advanced Removal Mechanisms and Amended Design for Stormwater BMPs. Imbrium Systems
 Phosphorus Treatment Advanced Removal Mechanisms and Amended Design for Stormwater BMPs Imbrium Systems Overview Phosphorus Basics NPS Loads Stormwater BMP performance Advanced Phosphorus Removal Mechanism
Newport Bay Water Quality Programs and Projects
 Newport Bay Water Quality Programs and Projects City of Newport Beach/UCI Water Quality Meeting November 9, 2017 David Webb 1 Director of Public Works Newport Beach Statistics Newport Bay Watershed Partnership
Trisha Robinson, MPH Supervisor, Waterborne Diseases Unit Waterborne Diseases Unit
 What s in the Water? Trisha Robinson, MPH Supervisor, Waterborne Diseases Unit Waterborne Diseases Unit Potential Sources of Fecal Contamination Stormwater Urban Runoff Pet Waste Human Waste Domesticated
Septic System Impacts on Stormwater and Impaired Waterbodies. December 8, 2016 Tim Denison, Johnson Engineering Marcy Frick, Tetra Tech
 Septic System Impacts on Stormwater and Impaired Waterbodies December 8, 2016 Tim Denison, Johnson Engineering Marcy Frick, Tetra Tech Presentation Overview Charlotte County: Many areas adjacent to impaired
Manitoba Water Quality Standards, Objectives, and Guidelines Dwight Williamson, Manager Water Quality Management Section Manitoba Conservation
 Manitoba Water Quality Standards, Objectives, and Guidelines 2002 Dwight Williamson, Manager Water Quality Management Section Manitoba Conservation 1 Outline Brief history Review process Overview of proposed
EUTROPHICATION. Student Lab Workbook
 EUTROPHICATION Student Lab Workbook THE SCIENTIFIC METHOD 1. Research Background literature research about a topic of interest 2. Identification of a problem Determine a problem (with regards to the topic)
Water Resources/Water Quality
 Water Resources/Water Quality From where does your drinking water come? How much land should be set aside for aquifer protection? Why should we care about Barton Springs? What are the effects (if any!)
Hoosier Creek Watershed All of Ely drains into Hoosier Creek, which runs north to south along the west side of Ely. Hoosier Creek, Hydrologic Unit Cod
 Hoosier Creek Watershed All of Ely drains into Hoosier Creek, which runs north to south along the west side of Ely. Hoosier Creek, Hydrologic Unit Code (HUC) 8 07080208, drains into the Coralville Reservoir,
Evaluation of Water Quality in. Sylvia Heaton Water Bureau, MDNRE
 Evaluation of Water Quality in Ford and Belleville Lakes Sylvia Heaton Water Bureau, MDNRE Objectives of 2010 TMDL Reevaluation Evaluate nutrient (total phosphorus) levels in Ford and Belleville Lakes
Clean water. From nature.
 Clean water. From nature. Natural Treatment System Save water. Do your part. Did you know that over watering or a broken sprinkler on your property can contribute to ocean pollution? Excess watering creates
by Keith Kennedy Manager of Environmental Programs North Central Texas Council of Governments
 by Keith Kennedy Manager of Environmental Programs North Central Texas Council of Governments What is NPDES? National Pollutant Discharge Elimination System USEPA outfall permitting program Storm water