The Snapshot CONODOGUINET CREEK WATERSHED SNAPSHOT
|
|
|
- Ira Chapman
- 5 years ago
- Views:
Transcription

 partnered with the Alliance for Aquatic Resource Monitoring (ALLARM) at Dickinson College to lead four seasonal monitoring events.")

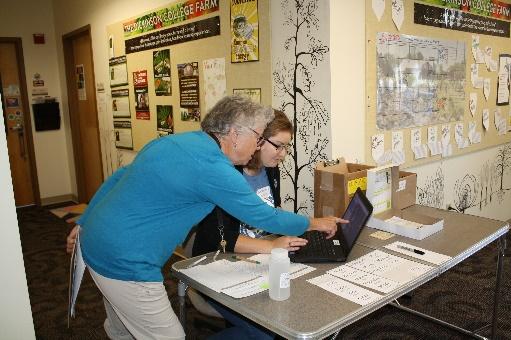
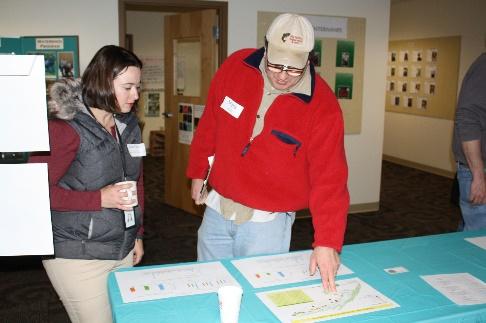
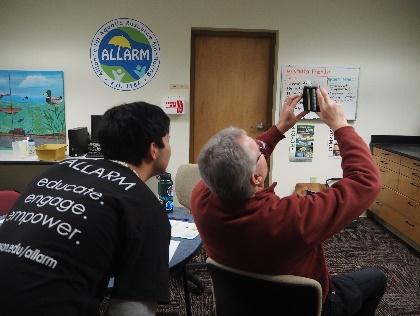
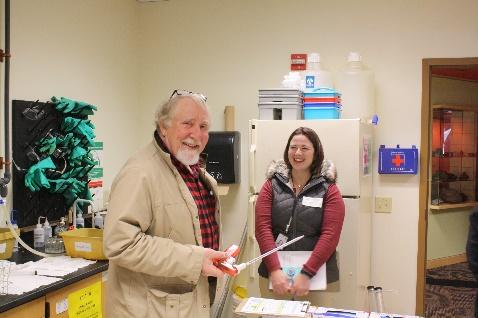
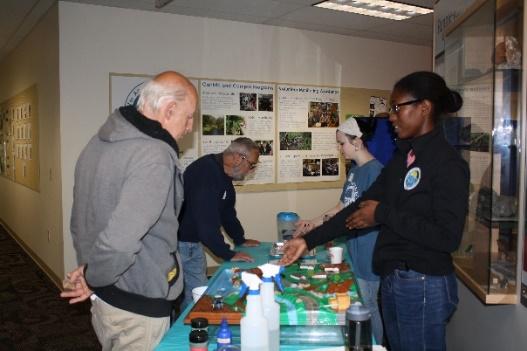
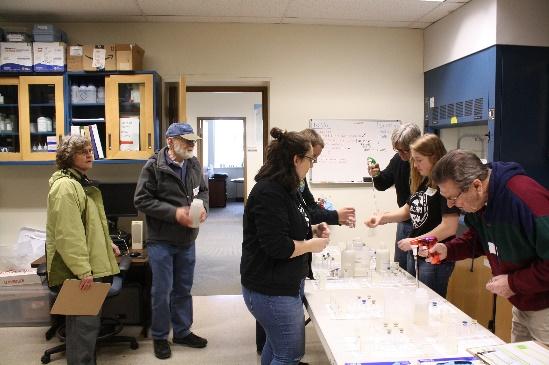
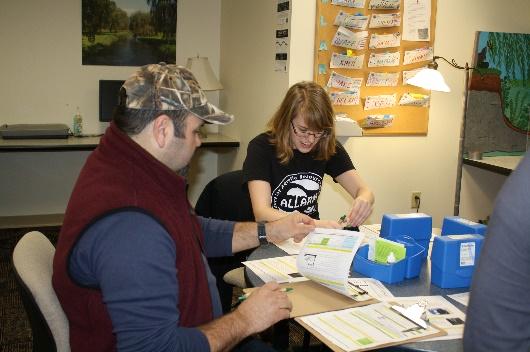
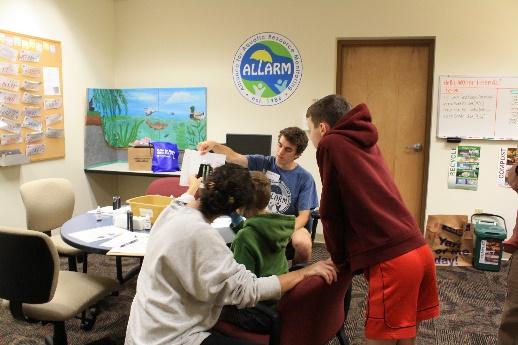
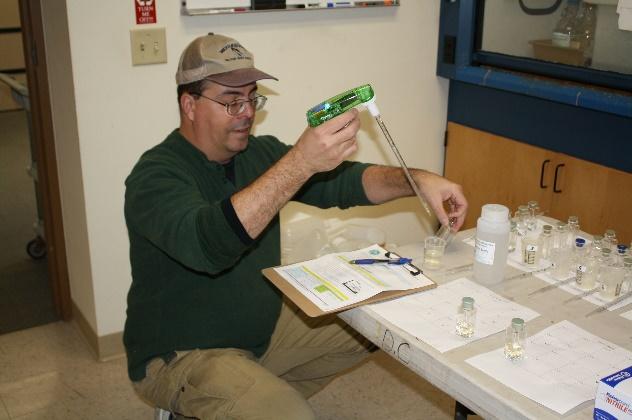
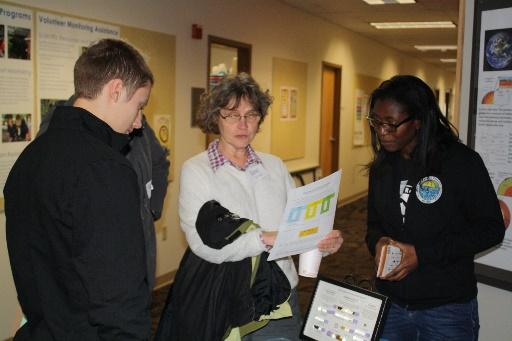
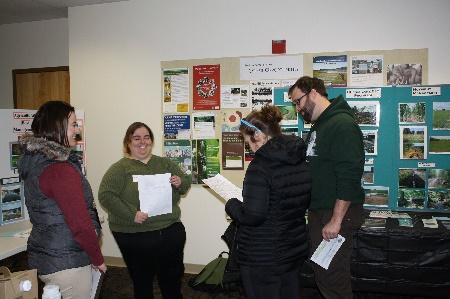
1 CONODOGUINET CREEK WATERSHED SNAPSHOT ABOVE: CONODOGUINET CREEK AT RT 74 BRIDGE FACING DOWNSTREAM The Snapshot The Conodoguinet Watershed Snapshot was a collaborative effort to engage local citizens in collecting water quality data to analyze the current health of the Conodoguinet Creek and its tributaries. It was the first watershed-wide water monitoring program to collect these data in twelve years! The Cumberland County Conservation District (CCCD) partnered with the Alliance for Aquatic Resource Monitoring (ALLARM) at Dickinson College to lead four seasonal monitoring events. Local partners included the Big Spring Watershed Association, Conodoguinet Creek Watershed Association, and Middle Spring Watershed Association. Further goals of the Snapshot included educating the public on topics related to watershed protection and non-point source pollution, providing hands-on experiences for volunteers in the field and in the lab, and sharing data with local groups and interested community members. Volunteers collected water samples and measured temperature and conductivity in the stream, then brought their samples to ALLARM s Community Aquatic Research Laboratory to measure nitratenitrogen, orthophosphate, and ph. Volunteers also visited educational booths provided by ALLARM student Watershed Coordinators, Cumberland County Conservation District, and Conodoguinet Creek Watershed Association. The four seasonal events occurred on July 8th, September 30th, December 2nd (2017), and March 3rd (2018). Between 20 and 29 sites were monitored during each event, by volunteers. The Snapshot was ALLARM s second local partnership through its Environmental Protection Agencyfunded Chesapeake Monitoring Cooperative, a six-year grant to help promote community based monitoring and integrate data into understanding the health of the Chesapeake Bay watershed. The PA Department of Environmental Protection provided support under Section 319 of the Clean Water Act (administered by the U.S. Environmental Protection Agency.) Parameters Read about the water quality parameters measured and how they relate to stream health. Page 2 Above and below: ALLARM student Watershed Coordinators help volunteers measure and interpret their sampling results. Results and Conclusions Check out the figures, maps, and conclusions from the four Snapshot events. Page 3
, and is usually found at greater depths. DO is very important for fish and benthic macroinvertebrates.")

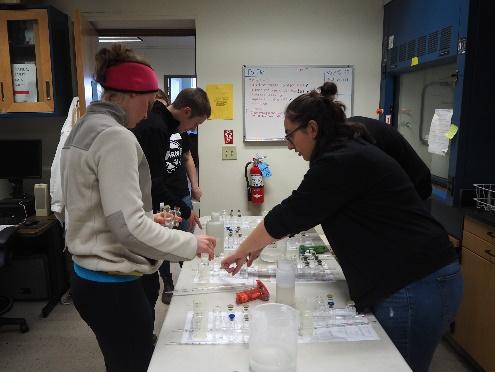
2 Parameters Reference map of the Conodoguinet Creek Watershed. TEMPERATURE Temperature is the amount of heat present in water, which controls the amount of oxygen it can hold. Cold water retains more dissolved oxygen (DO), and is usually found at greater depths. DO is very important for fish and benthic macroinvertebrates. Warm water is found closer to the surface and increases the rate of algal growth, aquatic plants, photosynthesis, and respiration. Aquatic organisms, like trout or catfish, prefer specific temperature ranges. Higher water temperatures promote bacterial growth and disease. Shoreline vegetation helps to cool water temperatures. Sources that affect temperature include: Urban/suburban stormwater runoff Exposure to sunlight/presence of shade Soil erosion/turbidity Insufficient cooling towers at plants 2 ph ph is the measure of water acidity, valued on a scale of As ph increases, acidity decreases. ph levels at either extreme create an inhospitable environment for most aquatic plants and organisms. Most natural waters have a range of Presence of limestone in bedrock makes most waters more basic. Sources that affect ph include: Acid rain deposition Acid or alkaline waste industrial processes CONDUCTIVITY Conductivity is the measure of the ability of water to pass an electrical current. It is affected by the amount of inorganic dissolved solids that carry a charge (ions) like nitrates, phosphates, sodium, calcium, iron, etc. Inorganic compounds can be used to trace spills of certain materials, but not oil-based or organic compounds. Organic substances do not conduct electricity well. Higher water temperatures tend to have higher conductivity. Distilled water conductivity ranges from µs/cm, whereas some industrial waters have levels of 10,000 µs/cm. Sources that affect conductivity include: Geology of the area Failing sewage system/wastewater treatment plants Agricultural runoff Road salts Industrial discharge NITRATE Nitrate is the most abundant, inorganic form of nitrogen (NO3). It is an essential Volunteers prepare samples for nutrient and ph analysis in the ALLARM lab.

 created by bacteria and used by plants. Typical water quality standards report total phosphorus, which includes orthophosphates.")
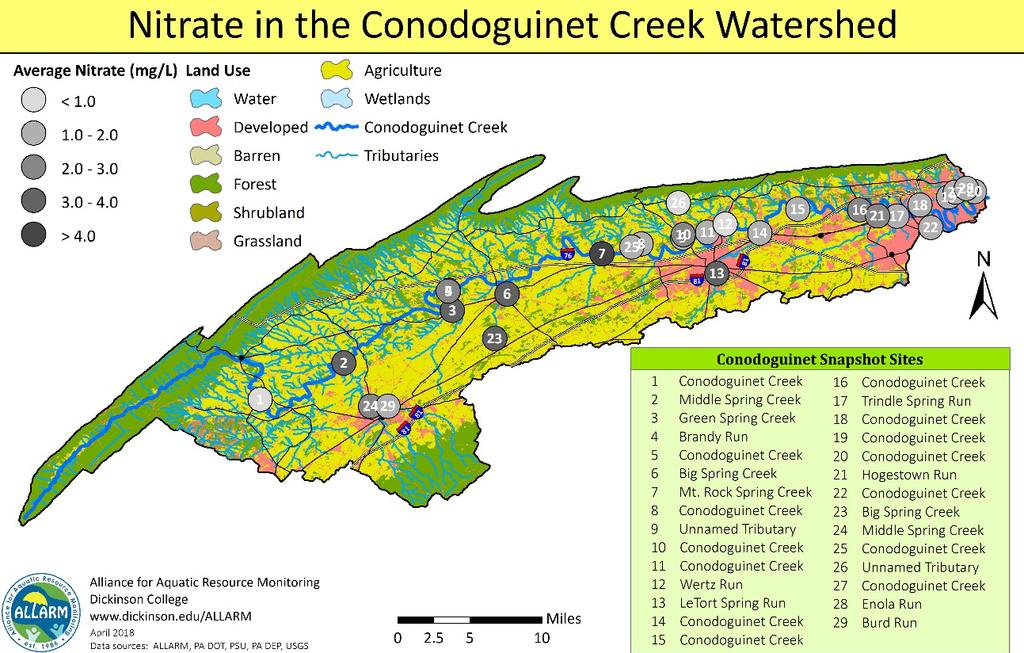
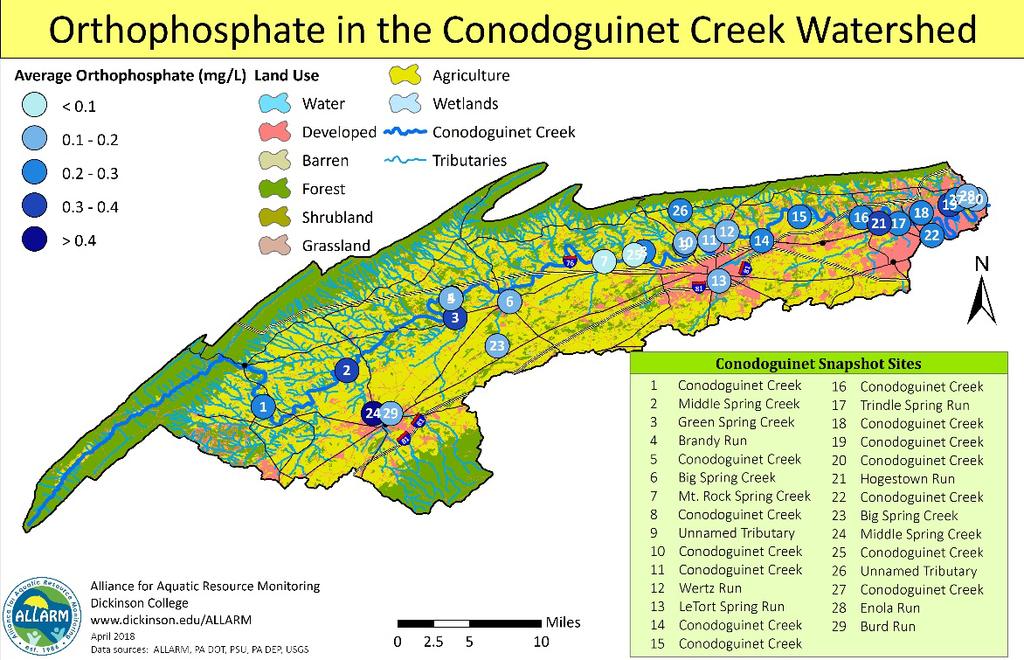
3 3 nutrient required by all organisms for building proteins. High levels of nitrate can lead to decreased plant and fish diversity, eutrophication, and algal blooms. Nitrate is a large contributor to nutrient pollution in waterways in agriculture-dominated areas or near sewage treatment plants. Sources that affect nitrogen include: Fertilizer runoff from lawns and croplands Runoff from livestock feeding and manure storages Sewage treatment plants and on-site septic systems ORTHOPHOSPHATE Orthophosphate is the reactive form of phosphate (PO4) created by bacteria and used by plants. Typical water quality standards report total phosphorus, which includes orthophosphates. An excess of orthophosphates can also lead to eutrophication and algal blooms. Unlike nitrogen, phosphorus is more commonly found attached to sediment and not dissolved in the water column. Most sewage treatment plants have total phosphorus standards of 1-2 mg/l. Sources that affect phosphorus include: Soil and rocks Fertilizer runoff from lawns and croplands Runoff from livestock feeding and manure storage areas Sewage treatment plants and on-site septic systems Soaps and other personal care products Watershed Context The Conodoguinet Creek watershed drains more than 500 square miles of the Cumberland Valley. The headwaters begin in Horse Valley, next to the Kittatinny Range. The creek winds through the northern part of Cumberland County until it meets the Susquehanna River. The main-stem of the Conodoguinet Creek is approximately 90 miles long, and the watershed contains more than 680 small streams! GEOLOGY The Conodoguinet Creek has two major types of bedrock. To the north of the creek is primarily shale. To the south of the creek is primarily limestone. See the temperature or ph maps as a reference. Limestone is included in the Carbonate geology category on the map (light blue). Limestone plays an important role in affecting the water chemistry of streams. Components of carbonate rocks work to keep the ph of the stream from changing too much and becoming more acidic. This capability means limestone streams are often more basic in ph, and cooler in temperature all year, with few changes. The two geologies also exhibit large differences in runoff potential. Water is not able to penetrate through shale, so it runs off of the soil in these areas more frequently in larger amounts. In limestone regions, water can flow down into the rock layer and below, so there is generally less runoff from the land. LAND USE There are many land uses throughout the Conodoguinet Creek watershed. Common types include forests, agricultural fields and pasture, and developed rural, suburban, and urban landscapes. See the nitrate, orthophosphate, or conductivity results maps below as a reference. DID YOU KNOW? Conodoguinet means A Long Way with Many Bends in a Native American language.
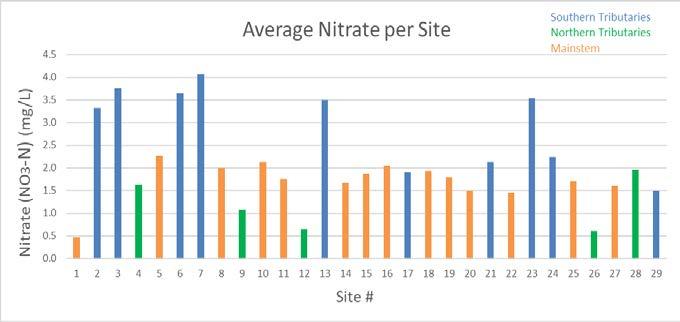
4 4 Results Data interpretation splits the results into three categories based on geography and provides comparisons to streams with similar geological backgrounds. The resulting conclusions are based on average values from sites that were sampled 2-4 times during the year. It should be noted that heavy rain events occurred before the summer (July) and spring (March) Snapshots, thus potentially diluting concentrations of various parameters for each of those events. Certain sites were also not accessible in the winter Snapshot due to open hunting season. Site 1 was located in Franklin County, all others sites were within Cumberland County. 10 sites were selected from southern tributaries and 5 sites were in northern tributaries. The main-stem of the Conodoguinet had 14 sites at different reaches of the creek. In general, the northern tributary sites held the lowest average conductivity, nitrate, orthophosphate, and ph values of the Snapshot. The temperature average was higher than that of the southern tributaries. Sites in the southern tributaries displayed the highest average conductivity, nitrate, and orthophosphate values. The ph average was almost equal to the mainstem. The temperature average was the lowest of the three geographies. The main-stem of the Conodoguinet was notably higher in temperature than the northern or southern tributes. It had an equally high ph average as the southern tributaries. The downstream portion of the main-stem Conodoguinet showed increasing trends in all parameters. None of the average temperature or ph results occurred outside of the water quality standard ranges set by the PA Code. Conductivity, nitrate, and orthophosphate results were also within ideal ranges. Examining the results per site location would provide a more detailed picture of watershed health than a general geographical comparison. More frequent sampling would provide a better idea of individual stream and whole watershed health. General Conclusions by Geography Temperature ( F) Average Water Temperature ph (standard units) Average ph per Location Average Conductivity Average Orthophosphate Conductivity (μs/cm) Orthophosphate (PO4)(mg/L) Average Nitrate SUMMARY CONCLUSIONS: Nitrate (NO3-N) (mg/l) : Highest conductivity, nitrate, phosphate, and ph values. Lowest temperature values : Lowest conductivity, nitrate, phosphate, and ph values Main-stem: Highest temperature and ph values. All five parameters increased from the upstream to the downstream section of the creek.


5 Individual Site Results Note: Temperature results only include the sites that were sampled all 4 times, to avoid skewed averages based on larger seasonal differences. 5
6 6


 at Dickinson College Chesapeake Monitoring")
7 7 Conclusions Different types of land use can lead to various pollutants finding their way into waterways in the form of non-point source pollution. Their origin cannot be traced to one drain or pipe. Examples include nitrogen from fertilizers or phosphate from septic systems. Excess sediment from erosion is a large challenge to water quality. Temperatures in waterways increase from the heat generated from streets, roofs, and parking lots, so stormwater pollution is also a continuous issue for developed areas. Therefore, more developed and agricultural lands tend to add larger amounts of pollutant-heavy runoff into small streams and eventually larger waterways. The results of the Snapshot are consistent with this assertion, as the southern tributaries contained the highest nutrient and conductivity levels. The less developed, more forested land surrounding the northern tributaries produced lower nutrient and conductivity results. The main-stem acted like a mixing pot of these various inputs, but showed increasing trends in all five parameters downstream where development is much more prevalent. Identifying these pollutant patterns can lead to the installation of best management practices such as rain barrels, rain gardens, riparian buffer zones, and infiltration areas. These areas capture some of the pollutants, naturally treat runoff, and help to reduce human impacts. Remember, we all live downstream! FUNDING Funding and other support for this project was provided by: Alliance for Aquatic Resource Monitoring (ALLARM) at Dickinson College Chesapeake Monitoring Cooperative Cumberland County Conservation District Pennsylvania Association of Conservation Districts Pennsylvania Department of Environmental Protection United States Environmental Protection Agency PARTNERS Additional partners of the Snapshot included: Big Spring Watershed Association Conodoguinet Creek Watershed Association Middle Spring Watershed Association


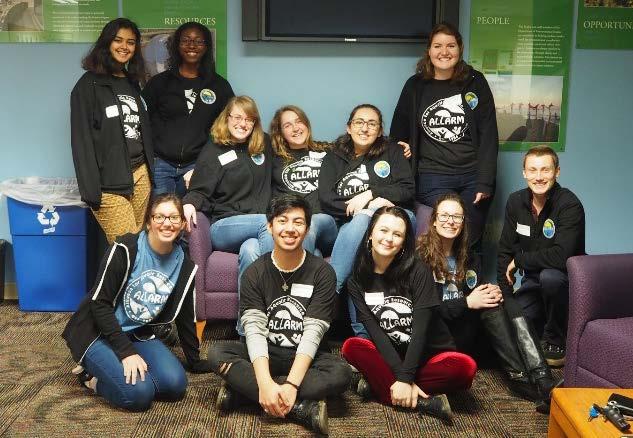
8 Thank you to all the volunteers and staff who were essential to making the Snapshot a success!
Acidity and Alkalinity:
 Evaluation of Pollution Sources to Lake Glenville Quarterly Report December 2018 Kimberlee K Hall, PhD Environmental Health Program, Western Carolina University Summary Chemical and microbial analysis
Eutrophication: Tracing Nutrient Pollution Back to Penns Creek
 Eutrophication: Tracing Nutrient Pollution Back to Penns Creek Nutrients are substances that life depends on for growth and reproduction. However, when these nutrients enter our planets waterways in excess,
Results from the 2017 Water Quality Monitoring Program
 Results from the 217 Water Quality Monitoring Program As part of a larger project, this summer the BWC conducted water sampling throughout the Belleisle Bay to get a baseline of data and determine the
Santa Rosa Creek Water Quality Results 2004
 Santa Rosa Creek Water Quality Results 24 Community Clean Water Institute Site Description: SRC4: Off 3rd Street in downtown Santa Rosa. Behind the Vineyard Hotel just West of Highway 11 along the Prince
Fact Sheet. Chesapeake Bay Water Quality
 Fact Sheet Chesapeake Bay Water Quality Water quality is a critical measure of the Chesapeake Bay s health. For the Bay to be healthy and productive, the water must be safe for people and must support
WATERSHED. Maitland Valley. Report Card 201
 Maitland Valley WATERSHED Report Card 201 The Maitland Valley Conservation Authority has prepared this report card as a summary on the state of our forests, wetlands, surface water, and ground water resources.
Water Monitoring in Spa Creek: A Summary
 Water Monitoring in Spa Creek: A Summary Written by: Alexis Jones & Blake Harden Edited by: Hannah Krauss Water monitoring is very important in order to determine the health of the Chesapeake Bay and its
Maitland Valley WATERSHED
 Maitland Valley WATERSHED Report Card 2018 Maitland Conservation has prepared this report card as a summary of the state of your forests, wetlands, and water resources. WHERE ARE WE? We are one of 36 Conservation
Pennsylvania Pequea and Mill Creek Watershed Section 319 National Monitoring Program Project
 Pennsylvania Pequea and Mill Creek Watershed Section 319 National Monitoring Program Project Figure 36: Pequea and Mill Creek (Pennsylvania) Watershed Project Location 231 T-1 C-1 T1-3 T-4 C1-2 T2-3 T-2
Pennsylvania Senior Environment Corps. Table of Contents Part 2 Getting Started:. 21 Chemical Analysis... 22
 Table of Contents Part 2 Getting Started:. 21 Chemical Analysis.... 22 3 Chapter 2: Getting Started 21 Chemical Analysis of the Water Dependent on your area, you may measure for several parameters. In
Water Quality indicators and How Human Activities Affect Water Quality
 Water Quality indicators and How Human Activities Affect Water Quality Name: Online Assignment: Period: Date: Purpose: to learn how to evaluate water quality and how pollution can make water unavailable
Understanding Nutrients and Their Affects on the Environment
 Understanding Nutrients and Their Affects on the Environment Humans & Ecosystems Humans are just like ecosystems, too much or too little of a nutrient is bad for the system. Nutrient management is a balancing
Grants Pass Water Quality Monitoring
 Grants Pass Water Quality Monitoring 2003-2005 Rogue Valley Council of Governments April 2005 Rogue Valley Council of Governments Natural Resources Department 155 North First Street Central Point, Oregon
Lake Washington. Water Quality Assessment Report. Copyright 2012 PLM Lake & Land Management Corp.
 Lake Washington 2012 Water Quality Assessment Report Copyright 2012 PLM Lake & Land Management Corp. Water Quality Report On May 22nd, June 18th, July 30th, August 29th, and September 27 th, 2012, PLM
PINEY RUN WATERSHED 2005 PROFILE
 PINEY RUN WATERSHED 25 PROFILE Table of Contents Page Watershed Description Water Quality Studies Stream Monitoring Water Chemistry Conditions Water Bacteria Conditions Stream Habitat Conditions Aquatic
Long Prairie River Watershed Restoration and Protection Strategies (WRAPS) Report Summary
 Report Summary") Long Prairie River Watershed Restoration and Protection Strategies (WRAPS) Report Summary Minnesota has adopted a watershed approach to address the state s 80 major watersheds (denoted by 8-digit hydrologic
Long Prairie River Watershed Restoration and Protection Strategies (WRAPS) Report Summary Minnesota has adopted a watershed approach to address the state s 80 major watersheds (denoted by 8-digit hydrologic
Aquatic Science Unit 2. Water Quality and Water Pollution
 Aquatic Science Unit 2 Water Quality and Water Pollution What is a healthy water body? In your own words, take a moment to describe what you believe are some of the characteristics of a healthy stream
Frequently Asked Questions - Fertilizers -
 What is fertilizer? What is phosphorus? What is nitrogen? How do I know if the fertilizer is phosphorus or nitrogen free? Which number on the bag of fertilizer is phosphorus and which is nitrogen? Is low
Redwood Shores Lagoon November 2016 Monthly Water Quality Monitoring Report
 Redwood Shores Lagoon November 2016 Monthly Water Quality Monitoring Report Prepared for Redwood City Public Works Services Department 1400 Broadway Redwood City, CA 94063-2594 Prepared by Clean Lakes,
Redwood Shores Lagoon February 2019 Monthly Water Quality Monitoring Report
 Redwood Shores Lagoon February 2019 Monthly Water Quality Monitoring Report Prepared for Redwood City Public Works Services Department 1400 Broadway Redwood City, CA 94063-2594 Prepared by Clean Lakes,
CLMP+ Report on Grass Lake (Anoka County) Lake ID# CLMP+ Data Summary
 Lake ID# CLMP+ Data Summary") CLMP+ Report on Grass Lake (Anoka County) Lake ID# 02-0113-00 2012-2013 CLMP+ Data Summary October 2014 Authors Shannon Martin, MPCA Editing and graphic design Public Information Office Staff The (MPCA)
CLMP+ Report on Grass Lake (Anoka County) Lake ID# 02-0113-00 2012-2013 CLMP+ Data Summary October 2014 Authors Shannon Martin, MPCA Editing and graphic design Public Information Office Staff The (MPCA)
A Claytor Nature Center Stream Monitoring Experience
 A Claytor Nature Center Stream Monitoring Experience Conduct field investigations in which distinctions are made among observations, hypotheses, results and conclusions Perform a visual habitat assessment
Norwalk Harbor Report Card
 Norwalk Harbor Report Card C+ Following the water s trail from your house, into the river, and to the Harbor The way land is used in a watershed has a significant effect on water quality. In areas where
Quittapahilla Creek Watershed Implementation Plan
 Quittapahilla Creek Watershed Implementation Plan Introduction Founded in 1997, the Quittapahilla Creek Watershed Association has been working with landowners, private organizations and public agencies
EUTROPHICATION. Student Lab Workbook
 EUTROPHICATION Student Lab Workbook THE SCIENTIFIC METHOD 1. Research Background literature research about a topic of interest 2. Identification of a problem Determine a problem (with regards to the topic)
Redwood Shores Lagoon May 2017 Monthly Water Quality Monitoring Report
 Redwood Shores Lagoon May 2017 Monthly Water Quality Monitoring Report Prepared for Redwood City Public Works Services Department 1400 Broadway Redwood City, CA 94063-2594 Prepared by Clean Lakes, Inc.
CHAPTER 15 WATER POLLUTION. INTO THE GULF Researchers try to pin down what s choking the Gulf of Mexico
 CHAPTER 15 WATER POLLUTION INTO THE GULF Researchers try to pin down what s choking the Gulf of Mexico SAVING THE BAY Teams of researchers try to pin down what s choking the Chesapeake Water pollution
TMDL Report for Chesapeake Bay Shellfish Waters: Ware Creek, Taskinas Creek, and Skimino Creek Bacterial Impairments (VADEQ, 2010)
") As part of a long term commitment to environmental stewardship, James City County volunteers and staff have been gathering information about stream health throughout the County since 2008. The goal of
As part of a long term commitment to environmental stewardship, James City County volunteers and staff have been gathering information about stream health throughout the County since 2008. The goal of
Analyses for geochemical investigations traditionally report concentrations as weight per volume of the measured ions (mg/l of NO 3 , NO 2
 Nitrate-Nitrogen 55 Nutrients The nutrients nitrogen and phosphorus occur naturally and also may be introduced to groundwater systems from urban and agricultural fertilizer applications, livestock or human
Tioga County Conservation District Watershed Program
 Tioga County Conservation District Watershed Program What is a watershed? A watershed is the land area that drains into a stream, river, or body of water. In Tioga County, there are seven major watersheds,
Bear Creek/Bear Lake Upper Watershed Information and Education Plan
 Bear Creek/Bear Lake Upper Watershed Information and Education Plan Addressing Stormwater Pollution Prevention and the Muskegon Lake Area of Concern Eutrophication Beneficial Use Impairment (BUI) 2010
CREEKS OF THE MIDDLE FOX RIVER 2016 Progress Report
 CREEKS OF THE MIDDLE FOX RIVER 2016 Progress Report Brewster approximately three years after dam removal Presented by the Sierra Club Valley of the Fox Water Sentinels ILLINOIS CHAPTER PRESERVING THE FOX
Ecosystems: Nutrient Cycles
 Ecosystems: Nutrient Cycles Greeks, Native Peoples, Buddhism, Hinduism use(d) Earth, Air, Fire, and Water as the main elements of their faith/culture Cycling in Ecosystems the Hydrologic Cycle What are
Basics of Water Quality Sheila Murphy
 Basics of Water Quality Sheila Murphy Water quality: The chemical, physical, and biological characteristics of water, usually in respect to its suitability for a particular purpose Water quality can include:
 Good Morning! Bruce Gilman Department of Environmental Conservation and Horticulture Finger Lakes Community College 3325 Marvin Sands Drive Canandaigua, New York 14424 585-785- 1255 gilmanba@flcc.edu Northern
Biology. Slide 1 of 33. End Show. Copyright Pearson Prentice Hall
 Biology 1 of 33 2 of 33 3-3 Cycles of Matter How does matter move among the living and nonliving parts of an ecosystem? 3 of 33 Recycling in the Biosphere Recycling in the Biosphere Energy and matter move
Big Chetac and the Red Cedar River Watershed. Dan Zerr University of Wisconsin-Extension Natural Resource Educator
 Big Chetac and the Red Cedar River Watershed Dan Zerr University of Wisconsin-Extension Natural Resource Educator The Water Cycle An area that all drains to a particular stream, river, lake, or ocean.
Appendix X: Non-Point Source Pollution
 Appendix X: Non-Point Source Pollution Sources Nonpoint source of pollution, unlike pollution from industrial and sewage treatment plants, comes from many different sources. Nonpoint source pollution is
Redwood Shores Lagoon August Monthly Water Quality Monitoring Report
 Redwood Shores Lagoon August Monthly Water Quality Monitoring Report Prepared for Redwood City Public Works Services Department 1400 Broadway Redwood City, CA 94063-2594 Prepared by Clean Lakes, Inc. P.
Riparian Buffers and Stream Restoration
 Riparian Buffers and Stream Restoration Why focus on riparian areas? Link land and water on any given site and link landscapes together in a watershed Riparian corridors protect the circulatory system
Biology. Slide 1 of 33. End Show. Copyright Pearson Prentice Hall
 Biology 1 of 33 2 of 33 Recycling in the Biosphere Recycling in the Biosphere Energy and matter move through the biosphere very differently. Unlike the one-way flow of energy, matter is recycled within
Jackson Lake Analysis
 Jackson Lake Analysis Lake Zones Lake Zones Limnetic Zone- open water far from shore Light penetrates shallow, allowing photosynthesis Supports phytoplankton (algae, protists, cyanobacteria) which then
Phase III Watershed Implementation Plans
 Phase III Watershed Implementation Plans Including programmatic outcomes in your planning to provide co-benefits for your community and reduce pollution Rachel Felver Chesapeake Bay Program Director of
3 3 Cycles of Matter Slide 1 of 33
 1 of 33 Recycling in the Biosphere Recycling in the Biosphere Energy and matter move through the biosphere very differently. Unlike the one-way flow of energy, matter is recycled within and between ecosystems.
Dirty Water. Adapted from: Dirty Water in Living in Water. National Aquarium in Baltimore, Grade Level: all. Duration: 1-2 class periods
 Dirty Water Adapted from: Dirty Water in Living in Water. National Aquarium in Baltimore, 1997. Nitrogen and Phosphorus Grade Level: all Duration: 1-2 class periods Setting: classroom or laboratory Summary:
Chesapeake Bay Restoration -- Phase III JULY 13, 2018
 Chesapeake Bay Restoration -- Phase III ANN JENNINGS JULY 13, 2018 POTOMAC WATERSHED ROUNDTABLE FORUM Virginia Achieves Midpoint Clean Water Goals 3 2017 60% 2025 ecoreportcard.org Overall bay health in
Interpreting Lake Data
 Interpreting Lake Data Indiana Clean Lakes Program The Indiana Clean Lakes Program was created in 1989 as a program within the Indiana Department of Environmental Management's (IDEM) Office of Water Management.
Water Quality Assessment in the Thames River Watershed
 Water Quality Assessment in the Thames River Watershed Nutrient Trends Karen Maaskant, Upper Thames River Conservation Authority 2015 Lake St. Clair Conference October 21, 2015 Outline Thames River watershed,
4. What is Item A called? a. Eckman dredge b. Secchi disk c. Van Dorn sampler d. Ponar sampler
 Envirothon Questions for AQUATICS station April 24, 2013 1. Eutrophication often results in large fish kills. What is the major cause of these fish kills? a. Oxygen has been depleted due to the decay of
Hydrology and Water Quality. Water. Water 9/13/2016. Molecular Water a great solvent. Molecular Water
 Hydrology and Water Quality Water Molecular Water Exists as an equilibrium But equilibrium altered by what is dissolved in it Water Molecular Water a great solvent In reality, water in the environment
Hydrology and Water Quality. Water. Water 9/11/2018. Molecular Water a great solvent. Molecular Water
 Hydrology and Water Quality Water Molecular Water Exists as an equilibrium But equilibrium altered by what is dissolved in it Water Molecular Water a great solvent In reality, water in the environment
REPORT. Report No: 2013/0958 Prepared For: Natural Resources Committee Prepared By: Dean Olsen, Environmental Resource Scientist Date: 11 July 2013
 REPORT Document Id: A544088 Report No: 2013/0958 Prepared For: Natural Resources Committee Prepared By: Dean Olsen, Environmental Resource Scientist Date: 11 July 2013 Subject: Waianakarua River Water
CBF Water Quality Interactive Map
 CBF Water Quality Interactive Map Student and adult groups that take part Often, they measure the water chemistry to evaluate the be doing it when you come out with us! By compiling these points on a map
3 3 Cycles of Matter
 3 3 Cycles of Matter Recycling in the Biosphere Energy - one way flow matter - recycled within and between ecosystems. biogeochemical cycles matter Elements, chemical compounds, and other forms passed
QUICK FACTS. Stream Miles: Impaired Stream Miles: 0. DEP Listed Impairments: None. Watershed Municipalities:
 7.7 FISHING CREEK Description Fishing Creek originates in northern West Hanover Township and flows west between Blue and Second Mountains in a narrow valley. Numerous small tributaries enter the stream
3 3 Cycles of Matter. EOC Review
 EOC Review A freshwater plant is placed in a salt marsh. Predict the direction in which water will move across the plant s cell wall, and the effect of that movement on the plant. a. Water would move out
Ellen Bailey. UWW Educator training January 13,
 Ellen Bailey UWW Educator training January 13, 2017 ellen.bailey@usu.edu 801-536-4432 Utah Water Watch Partnership between USU Extension and the DWQ Started in 2012 Trained 750+ volunteers, monitoring
The Status of Pompeston Creek, : From Data to Action. Pompeston Creek Watershed Association
 Pompeston Creek Watershed Association P.O. Box 2883 Cinnaminson, NJ 08077 (856) 235-9204 www.pompestoncreek.org The Status of Pompeston Creek, 1998-2008: From Data to Action Pompeston Creek Watershed Association
Lesson Overview. Cycles of Matter. Lesson Overview. 3.4 Cycles of Matter
 Lesson Overview 3.4 THINK ABOUT IT A handful of elements combine to form the building blocks of all known organisms. Organisms cannot manufacture these elements and do not use them up, so where do essential
10/17/ Cycles of Matter. Recycling in the Biosphere. How does matter move among the living and nonliving parts of an ecosystem?
 2 of 33 3-3 Cycles of Matter How does matter move among the living and nonliving parts of an ecosystem? 3 of 33 Recycling in the Biosphere Recycling in the Biosphere Energy and matter move through the
Gray s Creek. Gray s Creek
 Gray s Creek 1 Grades F + Forest Conditions B Wetland Conditions C - Surface Water Quality This Watershed Report Card outlines the environmental information for the Gray s Creek watershed as of 2017. The
Jean Unmuth Wisconsin DNR
 Spring Creek Watershed Project Jean Unmuth Wisconsin DNR Cooperators Friends of Scenic Lodi Valley Lodi Public High School Columbia County LWCD UWSP CWS City of Lodi Wisconsin DNR Spring Cr. Watershed
Cycles of Ma,er. Lesson Overview. Lesson Overview. 3.4 Cycles of Matter
 Lesson Overview Cycles of Ma,er Lesson Overview 3.4 Cycles of Matter THINK ABOUT IT A handful of elements combine to form the building blocks of all known organisms. Organisms cannot manufacture these
INVESTIGATING WATERSHEDS
 NAME DATE PARTNER(S) INVESTIGATING WATERSHEDS Rainfall or any form of precipitation collects on lawns, streets, and fields and runs directly into streams or into storm drains (where it is piped to streams).
Interpreting Lake Data
 Interpreting Lake Data Indiana Clean Lakes Program The Indiana Clean Lakes Program was created in 1989 as a program within the Indiana Department of Environmental Management's (IDEM) Office of Water Management.
Sugar Creek Watershed Watershed Number:
 Watershed Watershed Number: 512511 Location Map Mercer Jessam ine %g 27 %g15 41 Harrodsburg Burgin %g 152 %g 39 %g1268 Sugar C reek W atershed Richm ond %g1355 %g 876 Madison %g 34 %g 595 Boyle Danville
Water Resources/Water Quality
 Water Resources/Water Quality From where does your drinking water come? How much land should be set aside for aquifer protection? Why should we care about Barton Springs? What are the effects (if any!)
Nutrients and Water Quality in the East Souris River Watershed
 Nutrients and Water Quality in the East Souris River Watershed Phosphorus and nitrogen occur naturally and are important plant nutrient sources in water bodies. However, several human factors have created
Pollutant Types and Sources
 Pollutant Types and Sources FSA STORMWATER BMP SEMINAR SEPTEMBER 11, 2015 Prevailing thoughts about nutrient pollution and stormwater 1. Nutrient pollutant load estimates are commonly represented by a
Chapter 2: Conditions in the Spring Lake Watershed related to Stormwater Pollution
 Chapter 2: Conditions in the Spring Lake Watershed related to Stormwater Pollution To identify the primary causes and consequences of stormwater discharges to Spring Lake and its adjoining waterbodies,
Portage Lake CASS COUNTY
 Portage Lake 11-0204-00 CASS COUNTY Summary Portage Lake is located near Bena, MN in Cass County. It covers 1,539 acres, which places it in the upper 10% of lakes in Minnesota in terms of size. Portage
TAPPAN LAKE 9/30/2014 RAPID WATERSHED INVENTORY INTRODUCTION
 TAPPAN LAKE 9/30/2014 RAPID WATERSHED INVENTORY Profile Contents Introduction Physical Description Land Use Map Resource Concerns Census and Social Data Progress/Status References INTRODUCTION Tappan Lake
CLMP+ Report on Fleming Lake (Aitkin County)
") CLMP+ Report on Fleming Lake (Aitkin County) Lake ID# -5-5-6 CLMP+ Data Summary July 7 Authors Shannon Martin Contributors/acknowledgements Terry Dahlberg Sandy Dahlberg Pam Anderson For questions regarding
CLMP+ Report on Fleming Lake (Aitkin County) Lake ID# -5-5-6 CLMP+ Data Summary July 7 Authors Shannon Martin Contributors/acknowledgements Terry Dahlberg Sandy Dahlberg Pam Anderson For questions regarding
HARPETH RIVER MAIN STEM DISSOLVED OXYGEN STUDY
 HARPETH RIVER MAIN STEM DISSOLVED OXYGEN STUDY September 18, 2002 Report prepared by David J. Wilson Introduction Dissolved oxygen (dissolved O 2, a.k.a. DO) is essential for fish and benthic macroinvertebrates.
CBP Implementation Plan
 York County Conservation District CBP Implementation Plan March 2014 York County Conservation District 118 Pleasant Acres Road York, PA 17402 Phone: (717) 840-7430 www.yorkccd.org 1 Table of Contents Introduction
City of Texarkana, Arkansas. Storm Water Pollution
 City of Texarkana, Arkansas Storm Water Pollution STORM WATER GUIDE What is Storm Water Pollution? Stormwater can provide a toxic discharge which can enter into a lake, river or coastal water system. As
Little Bay Water Quality Report Card Spring 2014
 Little Bay Water Quality Report Card Spring 2014 Little Bay is a small, semi-enclosed estuary located in the heart of Rockport, Texas. Estuaries, where freshwater from rivers and streams mixes with salt
Know What You re Monitoring! Since not all of us are water chemists, here is a brief understanding of what your different tools measure
 1 Know What You re Monitoring! Since not all of us are water chemists, here is a brief understanding of what your different tools measure Extech EC400 meters Salinity (SAL) Total Dissolved Solids (TDS)
West Souris River Technical Water Quality Report Summary
 Page 1 West Souris River Technical Water Quality Report Summary SAMPLING BACKGROUND INFORMATION Surface water quality data have been collected by the Water Quality Management Section, Manitoba Water Stewardship,
How Ecosystems Work Section 2. Chapter 5 How Ecosystems Work Section 2: Cycling of Materials DAY 1
 Chapter 5 How Ecosystems Work Section 2: Cycling of Materials DAY 1 The Carbon Cycle The carbon cycle is the movement of carbon from the nonliving environment into living things and back Carbon is the
Fact Sheet. Pennsylvania s Chesapeake Bay Tributary Strategy Goals for Nutrient and Sediment Reduction and Habitat Restoration
 Fact Sheet Commonwealth of Pennsylvania Department of Environmental Protection Pennsylvania s Chesapeake Bay Tributary Strategy Goals for Nutrient and Sediment Reduction and Habitat Restoration Why were
Wisconsin River. Hardest Working River In the Nation
 Hardest Working River In the Nation Hardest Working River In The Nation Largest Basin In Wisconsin 430 miles in length 20% of Wisconsin, with diverse land use 14,776 mi2 catchment at Prairie du Sac Dam
TORCH LAKE TOWNSHIP WATER QUALITY ACTION PLAN
 TORCH LAKE TOWNSHIP WATER QUALITY ACTION PLAN Elk-River-Chain-of-Lakes Gaps Analysis Project The Watershed Center Grand Traverse Bay Tip of the Mitt Watershed Council Michigan Department of Natural Resources
Reporting Period: 01/01/2010 to 12/31/2010. Understanding the Level 2 Stream Monitoring Data Report
 Squaw Creek, 10030147 Squaw Creek Latitude: 45.32639, Longitude: -88.945564 Jim Waters, Wolf River Trout Unlimited Andy Killoren, Wolf River Trout Unlimited Reporting Period: 01/01/2010 to 12/31/2010 Understanding
Ploof s Creek South. Johannes Creek. Grand Lake, Ploof s Creek South, Johannes Creek. Introduction
 524 4th Street South Sauk Centre, MN 56378 320.352.2231 Grand Lake, Ploof s Creek South, Johannes Creek Introduction Since the 2012 monitoring season, the Grand Lake Improvement District (Grand LID) and
Reporting Period: 01/01/2008 to 12/31/2008. Understanding the Level 2 Stream Monitoring Data Report
 Panther Creek, 10010222 Panther Creek Latitude: 44.6216, Longitude: -90.568054 Carol Vedra, Beaver Creek Science Center Steven Hemersbach, Beaver Creek Citizen Science Center Reporting Period: 01/01/2008
Starting Your Own Water Monitoring Program
 Starting Your Own Water Monitoring Program By initiating your own citizen-based watershed group, you can serve your community by leading and taking part in activities to protect and restore your local
Water Quality Assessment for the Town of Caswell Beach, 2008
 Water Quality Assessment for the Town of Caswell Beach, 2008 UNCW-CMS Report 08-02 Report to: Town of Caswell Beach 1100 Caswell Beach Rd. c/o Mr. Jim Carter, Town Administrator Caswell Beach, N.C. 28465
Section 319 Incremental Project Proposal for Elks Run Watershed West Virginia Stream Code:WVP-1
 1 Section 319 Incremental Project Proposal for Elks Run Watershed West Virginia Stream Code:WVP-1 in the Potomac Direct Drains Watershed Jefferson County, WV 2010 Anticipated need for 319 funding $55,000
The Hypoxic Zone in the Gulf of Mexico
 The Hypoxic Zone in the Gulf of Mexico References Council Committee on Environmental and Natural Resources. 2003. An Assessment of Coastal Hypoxia and Eutrophication in U.S. Water. National Science and
Resource. ph must be measured in the field. The ph will change if the water is collected and stored, and will not reflect the true value at the site.
 Resource ph What is ph? ph is a measurement of how acidic or alkaline (basic) the water is. ph is measured on a scale of 0 to 14, with 0 being the most acidic, and 14 being the most basic. Distilled water,
ELK RAPIDS TOWNSHIP WATER QUALITY ACTION PLAN
 ELK RAPIDS TOWNSHIP WATER QUALITY ACTION PLAN Elk-River-Chain-of-Lakes Gaps Analysis Project The Watershed Center Grand Traverse Bay Tip of the Mitt Watershed Council Michigan Department of Natural Resources
Reporting Period: 01/01/2008 to 12/31/2008. Understanding the Level 2 Stream Monitoring Data Report
 St Croix River at Old HWY 53 At Gordon, 163118 Saint Croix River Latitude: 46.252617, Longitude: -91.79963 Susan Peterson, Friends of the Saint Croix Headwaters James Heim, Friends of the Saint Croix Headwaters
Anthropogenic Impacts on Bays and Watersheds. HI-MOES Presentation 2009 The Kohala Center Kohala Watershed Partnership
 Anthropogenic Impacts on Bays and Watersheds HI-MOES Presentation 2009 The Kohala Center Kohala Watershed Partnership Some Common Terms Watershed = An area of land that drains into a common destination
PROTECTING OUR WATERWAYS: STORMWATER POLLUTION REDUCTION EFFORTS
 PROTECTING OUR WATERWAYS: STORMWATER POLLUTION REDUCTION EFFORTS Public Information Meeting ~ May 2, 2018 Public Works Stormwater Management Division OVERVIEW Surface Water Quality Protection Municipal
Reservoir age, increasing human population,
 B-6249 02/12 Eagle Mountain Watershed Management Brent Clayton, Justin Mechell, David Waidler and Clint Wolfe* Reservoir age, increasing human population, and changing land uses have prompted the development
Fishing and Boating: Past, Present, and Restoration Thoughts
 Fishing and Boating: Past, Present, and Restoration Thoughts West Branch Susquehanna River Douglas Austen Pennsylvania Fish and Boat Commission West Branch Basin Stream Resources Miles Category 1,249
Scientific overview: Water quality functions of coastal buffers
 Scientific overview: Water quality functions of coastal buffers Caitlin Chaffee, Coastal Policy Analyst RI Coastal Resources Management Council November 21, 2013 Buffer Zone Setback = Minimum Distance
The Importance of Riparian Forests
 The Importance of Riparian Forests By Jean Llewellyn Monroe County is the second fastest growing county in Pennsylvania. This rapid growth can be problematic because uncontrolled and unregulated growth
Analysis of Chlorophyll-a and other data collected in the Illinois River Watershed from
 Analysis of Chlorophyll-a and other data collected in the Illinois River Watershed from 1996-2003 By W.J. Andrews and D.N. Mott USGS Oklahoma Water Science Center For the Oklahoma Clean Lakes and Watersheds