PROJECTED USE OF INNOVATIVE/ALTERNATIVE ON-SITE SEWAGE TREATMENT SYSTEMS IN EASTHAM, UNDER CURRENT REGULATIONS AND POLICIES
|
|
|
- Brook Nichols
- 6 years ago
- Views:
Transcription
1 PROJECTED USE OF INNOVATIVE/ALTERNATIVE ON-SITE SEWAGE TREATMENT SYSTEMS IN EASTHAM, UNDER CURRENT REGULATIONS AND POLICIES PREPARED BY BARNSTABLE COUNTY DEPARTMENT OF HEALTH AND THE ENVIRONMENT MAY 2007 PROJECT FUNDING BY BARNSTABLE COUNTY WASTEWATER IMPLEMENTATION COMMITTEE

2 PROJECTED USE OF INNOVATIVE/ALTERNATIVE ON-SITE SEWAGE TREATMENT SYSTEMS IN EASTHAM, UNDER CURRENT REGULATIONS AND POLICIES PREPARED BY SUSAN RASK, M.S., R.S. BARNSTABLE COUNTY DEPARTMENT OF HEALTH AND THE ENVIRONMENT SUPERIOR COURT HOUSE, RT. 6A BARNSTABLE, MASSACHUSETTS PROJECT FUNDING BY BARNSTABLE COUNTY WASTEWATER IMPLEMENTATION COMMITTEE 2
3 PROJECTED USE OF INNOVATIVE/ALTERNATIVE ON-SITE SEWAGE TREATMENT SYSTEMS IN EASTHAM, UNDER CURRENT REGULATIONS AND POLICIES INTRODUCTION Wastewater management is one of the largest planning and financial tasks that a town as a whole can undertake. Decisions about wastewater management become increasingly more complicated in areas where onsite septic systems occupy the same parcel as drinking water wells, such as occurs in Eastham. As Eastham develops strategies to deal with drinking water and wastewater needs, it is crucial that the town have a good assessment of the existing situation, and a reasonable projection of how the situation will develop should they continue on a course of action dictated by present regulations and policies. Using local policies and criteria provided, this report endeavors to project the number of advanced onsite treatment systems (also called innovative/alternative or I/A systems) that will be installed over the next 20 years, provided an alternate wastewater or drinking water strategy is not implemented. As the project scope was developed, the Eastham Board of Health expressed a desire to integrate information developed by the Barnstable County Department of Health and Environment into their ongoing town-wide drinking water study and municipal water supply planning efforts. Accordingly, project effort was expended to allow the integration of location and performance data from alternative septic systems into the town s overall water quality database. Primarily however, the present study is meant to provide projections of the extent and costs of onsite alternative septic systems that will ensue under existing policies. This report is meant to facilitate comparison with other feasible options for wastewater treatment or installation of a municipal public water supply that the town may investigate. BACKGROUND In 2005, Barnstable County Department of Health and Environment initiated a study with the town of Eastham to examine the role that Innovative/Alternative (I/A) on-site septic systems might play in Eastham s future ground- and surface- water protection efforts. This project was initiated out of a primary concern that Eastham currently has no municipal water supply, and all parcels in town are served by on site septic systems and drinking water wells. Eastham has a number of neighborhoods with very small parcels (<10,000 square feet) and significant areas of fresh and saltwater wetlands. Because of these constraints, it is not always possible to locate septic components in conformance with required setbacks to wells, building foundations, parcel lines and wetlands. As a result of these issues, the Eastham Board of Health has required the installation of a number of I/A septic systems for new construction and for upgrades of older non-conforming systems that cannot meet regulatory setbacks. Eastham is in the process of conducting a program to test water quality in all residential drinking water wells. The goal of the program is to assess water quality throughout the town and identify impaired areas. The program was accomplished over a 3 year period, with one-third of all homeowners testing the first year, another third testing the second year, and the last third testing during the third year. The initial 3 year round of testing was completed in 2005 and will continue in the future on the same basis, with every residence being tested every 3 rd year. Results of the first three year round of sampling show that widespread areas of Eastham have groundwater nitrate levels above the natural background level of < 1 mg/l (ppm). Groundwater nitrate levels above 1 mg/l generally indicate that the groundwater is receiving human nitrogen impacts; these can be from septic systems, fertilizers, or atmospheric deposition. Septic systems are generally recognized the primary source of nitrogen to groundwater on Cape Cod. In addition, 59 wells, located throughout the town, are being tested on an annual basis for 10 years (Ten Year Trend Study), to establish data showing long term trends in water quality throughout the town. The town has completed 6 years of this study. In response to these concerns, the Eastham Board of Health, Water Resources Advisory Board and Wastewater Management Committee are presently evaluating comprehensive management alternatives that include 1
4 municipal public water supply and wastewater management. Concurrent with these efforts, the town boards are also considering the town-wide end result of their current management strategy that relies, in part, on the requirement of I/A on-site systems to address Eastham's groundwater and coastal water quality issues. This study was funded by Barnstable County through its Wastewater Implementation Committee to assist the town of Eastham in projecting how many I/A systems might potentially be installed over the coming 20 years. The primary task of this work was to evaluate the present parcel by parcel management strategy that relies on regulatory setbacks and other requirements that encourage or require the use of I/A systems. A second task was to provide information relative to the cost of installing and operating I/A systems so that this management strategy can be compared in context to comprehensive management alternatives of wastewater treatment facilities and/or the provision of a municipal drinking water supply. PROJECT TASKS The scope of work for this project was developed in conjunction with the Eastham Health Department, and encompassed four tasks, as follows: TASK 1 Using Eastham s drinking water quality database, existing septic system permitting information, and assessor s database, identify and use GIS software to graphically display: Map/parcel location of all currently permitted I/A systems Map/parcel location of all properties with public water supplies Map/parcel location of all properties where number of bedrooms exceeds 1 bedroom (BR) per 10,000 s.f. parcel size (based on Title 5 requirement that restricts design flow to 440 gpd/acre, equivalent to bedroom density of 4 BR/40,000 s.f. or 1BR/10,000 s.f.). Map/parcel display of the most recent nitrate level detected in the parcel drinking water well, for all parcels tested throughout town. TASK 2 Create database linkages so that information from the Barnstable County Department of Health and Environment I/A tracking database can be directly downloaded to Eastham s drinking water quality database. These linkages will allow the Eastham Health Agent to log into the Barnstable County I/A database and search, retrieve and download information on I/A system location and effluent water quality results. TASK 3 Using the criteria discussed below that trigger the installation of I/A technology, examine parcel data to create projections of where and how many I/A systems may be installed town-wide in the future. This was projected over a 20 year timeline, assuming that I/A systems will be installed at time of new construction or system failure/upgrade if one of the criteria is triggered. TASK 4 Using information developed in Task 3, use present value costs to project total cost over 20 years for installation and operation of all I/A systems installed under various scenarios. In order to assess total costs of these systems, including installation and operating costs, the present value (PV) of these costs over the life of each system was calculated (Lindeburg, 1986). Present value analysis considers the time value of money using a discount rate. This adjusts expenditures in future years to current dollars so that costs incurred throughout the life of the system can be understood in present dollars. These costs can then be compared to other solutions, such as installation of a municipal water system or small cluster or satellite collection and treatment systems. Criteria for Installation of Innovative/Alternative On-Site Sewage Treatment Systems After discussion with the Eastham Health Department, several criteria that trigger the installation of I/A systems were used to make projections of how many, and where, I/A systems might be installed in the future. These criteria were as follows: 2
5 Criteria 1. The Eastham Board of Health currently has several policies that generally require installation of I/A systems upon installation of a new septic system. These policies include: 1. Installation of an I/A system when a new or upgraded soil absorption system (SAS) cannot be installed at least 100 feet from a drinking water well as required by 310 CMR The State Environmental Code Title V: Minimum Requirements for the Subsurface Disposal of Sanitary Sewage. 2. Installation of an I/A system when a new or upgraded SAS cannot be installed at least 75 feet from the edge of a wetland resource (Note: this criteria is more restrictive than state regulations, 310 CMR 15.00, which require a 50 foot setback between SAS and edge of wetland resource) Criteria 2. Eastham has a number of small volume public water supplies. A public water supply is defined by state regulation as any source of water that serves more than 25 persons per day for more than 60 days per year. In Eastham, most restaurants and motels have wells that are classified as public water supplies. There are a number of restrictions in state regulations, 310 CMR (Drinking Water Regulations) and 310 CMR (Title 5), on the placement of septic systems within the Zone I and Interim Wellhead Protection Areas (IWPA) of public supply wells. For new construction, 310 CMR prohibits the installation of septic system components within the Zone 1 protective radius of a public water supply well. The Zone I for small volume wells (those serving typical restaurants and motels) is a minimum 100 ft radius around the well. Many of these businesses are located on small parcels, with existing septic systems inside the 100 ft. radius, and little space on the parcel to locate the system elsewhere. When these systems fail and must be upgraded, DEP will require I/A technology be installed if the new system cannot be located outside the Zone 1. In addition, 310 CMR and require installation of I/A technology in the following circumstances: 1. For septic upgrades with no addition of design flow, when the septic system will be located in the Interim Wellhead Protection Area or mapped Zone II of a public water supply, and has a design flow greater than 2000 gpd. 2. For new construction (as defined in 310 CMR 15.00) in nitrogen sensitive areas, which include the Interim Wellhead Protection Area and mapped Zone IIs of a public water supply, when sewage design flow exceeds 440 gpd per acre. Criteria CMR requires installation of I/A technology for new residential construction on parcels served by both drinking water wells and on-site septic systems, when sewage design flow exceeds 440 gpd per acre (4 bedrooms/40,000 s.f. or 1 bedroom/10,000 s.f. ). 310 CMR Maximum Feasible Compliance, and DEP Policy Title 5 Program s Guidance On System Upgrades In Areas Subject To Nitrogen Loading Limitations, suggest that Boards of Health should consider requiring installation of I/A technology for upgrades of existing septic systems in nitrogen sensitive areas, when the existing system exceeds the 440 gpd/acre standard and well water analysis demonstrates increased nitrogen concentrations in nearby drinking water wells. The above criteria were used to evaluate and make reasonable projections about the number of I/A systems may be installed in town in the coming 20 years. The number of I/A systems that might reasonably be installed as a result of each criteria were considered individually, so that each criteria can be considered separately. Lastly, a simple economic analysis, using present value of an of an individual I/A system, was applied to these 3
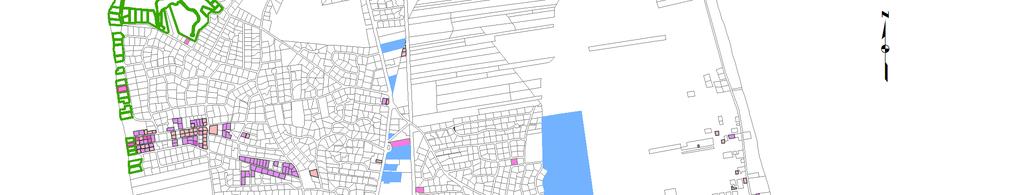
6 projections to better understand the immediate and long term costs associated with installation of I/A systems, which allows these costs to be compared with other potential infrastructure solutions. RESULTS Eastham has approximately 6152 parcels. Of these, 5049 are residential (single family, multi-family and condominiums). Using Criteria 1-3, projections were made to determine where I/A systems might be installed at time of next septic upgrade. These results are shown on Maps 1 through 5 in Appendix 1. Criteria 1: Existing I/A systems As of February 2007, Eastham has 116 innovative/alternative (I/A) systems permitted, although some of these are not yet installed. Most of these have been installed as a result of Criteria 1, Board of Health policies that require the use of I/A technology when setbacks to wells or wetlands cannot be met. These parcels are shown in bright pink on Map 1. Criteria 1: SAS cannot be located at least 100 ft. from all drinking water wells (locus parcel well and abutter s wells). There was insufficient information in town records to show the location of all wells and dwelling foundations. This meant it was not possible, on a parcel-by-parcel basis, to determine if each soil absorption system (SAS) and other septic components could be installed in conformance with the required 100 ft setback to wells. As an alternative, the following criteria were used to project whether an I/A system would be required in the future at time of septic upgrade. 1. All parcels of <10,000 s.f. size were projected to have I/As installed in the future. This decision was made for two reasons. First, virtually all developed parcels of <10,000 s.f. exceed the 1 BR per 10,000 s.f. limitation of Title 5. Second, physical size limitations of these parcels make if difficult, if not impossible, to install the SAS to meet the required 100 ft. setback to locus parcel well and all abutting parcel wells. This is especially true when a small parcel is surrounded by other very small parcels, as is common in the neighborhoods where these <10,000 s.f. parcels exist. 2. Parcels greater than 10,000 s.f. but less than 20,000 s.f. may not be able to meet well setbacks. For these parcels, the size of abutting parcels in the neighborhood was examined on a parcel-by-parcel basis. Where surrounding parcels were small (all consistently less than 20,000 s.f. or where a significant number, but not all, were in the 10,000 s.f. range) future installation of I/A technology was assumed. Also, parcels where wetland buffers covered a significant portion of the parcel (precluding use of this area for installation of the SAS) were projected to have I/A systems. 3. Parcels of size > 20,000 s.f. were generally assumed not to need I/A systems. Parcels of this size are usually large enough to accommodate septic systems and wells with required setbacks, including proper setback to wells on abutting parcels. I/A systems were generally not projected on these parcels. However, these parcels were also examined under Criteria 3 to see whether they exceeded the 1 BR per 10,000 s.f. requirement. Results: There are 276 parcels under 10,000 s.f. with well and septic; all of these are projected to have I/A systems installed. These parcels are shown in peach color on Map 2. There are an additional 282 parcels of area >10,000 s.f. but <20,000 s.f. located in areas with small parcels and where at least some of the wells in the area have shown elevated levels of nitrates (2-5 mg/l). These parcels are shown in purple in Map 2. This analysis produces a total possible 498 parcels projected to have I/A systems installed in the future. It is important to note that most of these parcels will also be projected under Criteria 3 to have I/A systems due to exceedances of allowed bedroom density. These parcels are also generally clustered in a few subdivisions, making these areas potentially amenable to the construction of small wastewater collection and treatment systems. 4
7 Criteria 1: SAS cannot be located at least 75 ft. from edge of wetland. There was insufficient information in town records to show the location of dwelling footprints on each parcel and so it was not possible, on a parcel-by-parcel basis, to determine if each SAS could be installed in conformance with the town-required 75 ft setback to wetlands. As an alternative, the following was used as a predictor for whether an I/A system would be required in the future: Assessor data provided information about total parcel size and the size of all building footprints. Massachusetts and Cape Cod Commission GIS wetland coverage information was also available. Using this information, the following was calculated for each parcel: Available Area for SAS = Total parcel size - (Area covered by building footprint + Area covered by wetland + area covered by 75 ft buffer from edge of wetland + Area covered by 10 ft. setback around entire parcel line). A determination was made that a minimum of 3000 s.f. is reasonably needed to install septic system components in accordance with required setbacks from building foundations. If the calculated Available Area for SAS was less than 3000 s.f., it was assumed that the Board of Health requirement for installation of a septic components outside the 75 ft wetland buffer would generally not be met, and the Board of Health would require installation of I/A technology at time of septic upgrade. In these cases, installation of an I/A system was projected. Results: Analysis shows that 472 parcels meet the criterion of less than 3000 s.f. area available for installation of an SAS outside of all buffers (wetland, foundation and parcel lines) and will likely have I/A systems installed. These parcels are shown in green outline on Map 1. Criteria 2. Properties with public water supply wells. Restaurants, other food service establishments, and motels that serve water to more than 25 persons per day for more than 60 days per year are considered under Massachusetts regulations, 310 CMR 22.00, to be Transient, Non-Community Public Water Supplies. Each public supply well is surrounded by a Zone 1 protective radius, inside which no sources of contamination (including septic systems, chemical storage, or parking) may be located. For most small volume wells, this Zone 1 area is a 100 ft. radius surrounding the well. Many Transient, Non-Community Public Water Supplies are located on small parcels, and some have existing septic systems located inside the 100 ft. Zone 1 radius. DEP views these situations as grandfathered until the septic system fails. The upgraded system must be located with all components outside the Zone 1 radius. If this is not possible, and the septic system must be installed within the Zone 1 area, DEP will require I/A technology be installed at time of upgrade. Public supply wells are also assigned a Zone II or an Interim Wellhead Protection Area (IWPA) radius. This area is commonly referred to as the Zone of Contribution to the well, and DEP limits land uses in this area to protect drinking water quality. For large municipal supply wells, the Zone II is defined by performing extensive hydrogeological research to determine what land area contributes to the water supply. Most Transient, Non- Community Public Water Supplies do not have defined Zone IIs, but have a default IWPA radius around the well. Massachusetts Drinking Water Regulations specify that, for sources with approved pumping rates <100,000 gpd, the IWPA is determined by multiplying the approved pumping rate (in gallons per minute) by 32 and adding 400. A default IWPA radius is usually applied to transient non-community (TNC) and non-transient non-community (NTNC) wells when there is no metered rate of withdrawal or no approved pumping rate. Most small motels and restaurants, which are classified as transient, non-community wells, pump only up to several thousand gallons of water per day. For these wells, the pumping rate in gallons per minute is negligible, and DEP recognizes the IWPA to be the minimum 400 ft. radius surrounding the well. Zone II s and IWPAs are defined by 310 CMR 15.00, the State Environmental Code Title V as nitrogen sensitive areas, subject to a restriction of 440 gpd/acre sewage design flow. For most Transient, Non-Community Public Water supplies, this 400 ft radius typically covers or extends beyond the parcel area. This makes it difficult to locate the septic system outside the IWPA where it would not be subject to the 440 gpd/acre standard. If the septic system cannot be located outside the IWPA, and if design flow exceeds 440 gpd/acre, DEP will require installation of I/A technology at the time of next system upgrade. In addition, if the septic system is located in the IWPA and design flow exceeds 2000 gpd, DEP 5
8 regulations require installation of I/A technology, regardless of whether the design flow exceeds 440 gpd/acre (in practical terms, there are very few systems with design flows over 2000 gpd that have sufficient land area to meet the 440 gpd/acre standard). Because most Transient, Non-Community Public Water supplies will fall into either one or both of the above situations, all parcels in Eastham identified as having public water supplies were projected to have I/A systems installed. Results: There are 49 public water supplies in Eastham. All of these are projected to have I/A systems installed at some time in the future. These parcels are shown in blue on Map 1. It is important to note that the Lower Cape Water Management Task Force (1998) identified the Route 6 corridor as an area for a limited public water supply. This area is densely developed, involves a major roadway, and has multiple land uses that threaten the water quality of small volume public supply wells and private wells in this area. If municipal water supply were to be provided to the Route 6 corridor, it is assumed that the existing small volume public supply wells at restaurants and motels would be abandoned, eliminating the necessity to install I/A systems on these parcels. Criteria 3. Residential parcels where number of existing bedrooms exceeds 1BR/10,000 s.f. (i.e. the parcel exceeds the 440 gpd/acre flow limitation imposed by Title 5 in nitrogen sensitive areas) 310 CMR The State Environmental Code Title V section (2) specifically states No system serving new construction in areas where the use of both on-site systems and drinking water supply wells is proposed to serve the facility shall be designed to receive or shall receive more than 440 gallons of design flow per day per acre from residential uses.... DEP adopted this standard as part of the 1995 revision to Title 5. DEP based this upon a nitrogen mass balance loading model which factored in nitrogen contributions from wastewater, roof and road runoff, and fertilizers and also factored in groundwater recharge from pervious and impervious areas (Massachusetts Department of Environmental Protection, 1995). DEP s nitrogen loading model calculates that sewage design flow of 440 gpd/acre (equivalent to bedroom density of 4 BR/acre) will result in a total nitrogen concentration in groundwater of 7.10 mg/l on a parcel-by-parcel basis. The 440 gpd/acre standard is intended to keep drinking water supplies below the 10 mg/l drinking water standard. This criteria applies to new construction, where proposed design flows exceed 110 gpd (1 BR) per 10,000 s.f. of parcel size. In combination with information about parcels showing elevated nitrates in drinking wells, below, the Board of Health could use this criteria to evaluate whether to require I/A systems at time of system upgrade on individual parcels with existing septic systems. Parcels were identified as having the equivalent of 4 BR/acre, 5 BR/acre, 6 BR/acre, 7 BR/acre or 8+ BR/ acre. Since many parcels are less than 1 acre (Title 5 acre, defined as 40,000 s.f.) parcels were evaluated based on number of bedrooms per 10,000 s.f. parcel size. Eastham Assessor data on number of existing bedrooms and parcel square footage was used for the analysis. Bedroom equivalency was determined by multiplying the number of bedrooms on the parcel by 10,000 s.f. then dividing by the total square footage of the parcel; this gave the number of bedrooms per 10,000 s.f.. This number was multiplied by 4 to create the equivalent number of bedrooms per acre. The resulting number was rounded down to the next whole number, since bedrooms can only be constructed as whole numbers. For example, a six bedroom home on a 45,000 s.f. parcel is equivalent to 5 bedrooms per acre, calculated as follows: 6 bedrooms x 10,000 s.f = 60,000/45,000 = x 4 = 5.3; this would be considered as equivalent to 5 bedrooms per acre. Bedroom equivalency was determined as follows: Parcels with <1.25 bedrooms per 10,000 s.f. were considered equivalent to 4 BR or 440 gpd design flow per acre; Parcels with >1.25 but <1.5 bedrooms per 10,000 s.f. were considered equivalent to 5 BR or 550 gpd design flow per acre; Parcels with >1.5 but <1.75 bedrooms per 10,000 s.f. were considered equivalent to 6 BR or 660 gpd design flow per acre; 6
9 Table 1. Number of parcels in Eastham shown categorized by number of bedrooms per acre equivalency. Bedrooms per acre equivalency Number of Parcels % of Total Number of Parcels in Town < Note: The cumulative total of all parcels >4 BR/acre equals 45.1% of all parcels in town; the cumulative total of all parcels >6 BR/acre equals 25.1 % of all parcels in town. Parcels with >1.75 but <2.0 bedrooms per 10,000 s.f. were considered equivalent to 7 BR or 770 gpd design flow per acre; Parcels with >2 bedrooms per 10,000 s.f. were considered equivalent to at least 8 BR or 880 gpd design flow per acre; Results: Parcels that are primarily residential use were examined for this analysis. Bedroom density on each parcel is represented on Map 3 as various black and white patterns. Nitrate levels from the most recent well water analysis for each parcel are also shown on this map. Parcels equivalent to 4 BR/acre or less: there are a total of 2331 parcels that meet the requirements of Title 5 for design flow in nitrogen sensitive areas. This represents approximately 38% of the total parcels in town. Parcels equivalent to 5 BR/acre: 1256 parcels; this represents approximately 20% of the total parcels in town. Parcels equivalent to 6 BR/acre: 625 parcels; this represents approximately 10% of the total parcels in town. Parcels equivalent to7 BR/acre: 393 parcels; this represents approximately 6.5% of the total parcels in town. Parcels equivalent to 8 BR/acre or more: 524 parcels; this represents approximately 8.5% of the total parcels in town. Of these 524, 119 parcels have bedroom density equivalent to 12 BR/acre or more. Cumulatively, there are 2798 parcels that exceed the 4 BR/acre design flow loading standard; this represents 46% of the total parcels in town, and exceeds the 2331 residential parcels that do meet the 4 BR/acre standard. If the town were to decide to require I/A systems at the time of upgrade for all homes where bedroom density exceeds 4 BR/acre, this would result in the installation of 2798 I/A systems. As a more realistic scenario, the town might consider requiring installation of I/A systems only for those parcels with bedroom density of 6 BR/acre or more. These parcels constitute 25% of the total number of parcels in town. DEP s nitrogen loading model predicts that bedroom density of 4 BR/acre results in a groundwater nitrate concentration of 7.10 mg/l. Using DEP s model, increasing bedroom density by 50% would raise the resulting groundwater nitrate concentration by as much as 50%, to mg/l. Not all properties are occupied year round, and not all bedrooms are occupied to the extent used in the model, so actual groundwater nitrates will likely be somewhat less than predicted by the model. If the town were to decide to require I/A technology only for properties with density of 6 BR/acre or more, this would result in a projected installation of 1542 I/As. 7
10 Criteria 3. Areas identified by Eastham drinking water study as having a significant number of parcels with nitrates > 5 mg/l. Widespread testing of residential wells has collected data which are being used to assess overall drinking water quality in the town, and to identify if there were clearly defined areas with impaired water quality. Results from three years of residential well sampling on a total of 4002 parcels were evaluated. This data is current through April, Results are summarized in Table 2 and shown on Map 3. Results : 1059 parcels showed nitrate levels below 1 mg/l, and 926 had nitrates of mg/l. Cumulatively, this constitutes 49.6% of the total number of parcels sampled. The natural background level of nitrate in groundwater on Cape Cod is usually considered to be 0.5 mg/l or less. Groundwater with nitrate <1 mg/l is considered to be unimpacted by human nitrogen sources. Groundwater with 1-2 mg/l nitrate shows a minimal but detectable level of human impact parcels, or 40.7% of the total, were found in the nitrate range 2 to 5 mg/l. Groundwater with nitrates in this range should be considered to be above background levels and showing moderate impacts from human nitrogen sources. Cumulatively, 3618 parcels, or 90.3% of all parcels tested are showing nitrates in the 1-5 mg/l range. Although there are no health threats from nitrates in drinking water at this level, these drinking wells are clearly receiving some level of impact from septic systems. 293 parcels, or 7.4 % of the total tested, were found with nitrate in the 6-9 mg/l range. These wells are considered to be significantly impacted by nitrogen. 76 parcels, 2% of the total, show nitrates at 10 mg/l or above. A number of samples were found in the range of mg/l, with a maximum sample level of 51 mg/l. Nitrates at this level exceed the 10 mg/l drinking water standard and are considered to be a threat to human health. Unless another source of nitrogen, such as fertilizer, can be identified, wells with nitrate levels above 10 mg/l must be considered to be directly impacted by septic effluent. These results can be compared to historical data on nitrates in Eastham drinking wells, from water samples analyzed by the Barnstable County Department of Health and Environment Laboratory from (Rask, 1997), and with water quality data for the Nauset lens compiled by the Cape Cod Commission for (Cape Cod Planning and Economic Development Commission, 1987). These results are summarized in Table 3 and shown graphically in Figure 1. Comparison of historical and recent data shows a clear downward trend in the percentage of wells that can be considered to be unimpacted by human nitrogen (nitrate levels <1 mg/l). In the time period, 61.8% of all wells tested showed nitrate <1; this value dropped to 39.4% in the period , and has further dropped in current samples to 26% of all wells tested. Similarly, wells that are considered to be beginning to receive human nitrogen impacts (nitrate levels of >1 but <3 mg/l) have risen from 24.3% of the total in , to 36.1 % in , and now make up 40% of all samples tested in The number of wells that can be considered to be moderately (nitrate levels >3 but <5 mg/l) or significantly (nitrate levels >5 but <10 mg/l) impacted has also increased over time. Moderately impacted wells increased from 6.7% in , to 12.3% in , to 19% of current samples. Significantly impacted wells increased from 5.1% in , to 8.9% in , to 12.4% of current samples. It is well documented that increasing housing density is correlated with increased nitrate levels in groundwater (Figure 2). Septic systems are recognized as the largest source of nitrate to groundwater on Cape Cod. Increases in housing density that have occurred over the last 30 years, and increased period of occupancy (traditionally seasonal homes being occupied for longer periods, up to year round usage) of many existing homes has resulted in greater volumes of wastewater being disposed of to the groundwater and for longer periods of time each year. High density housing means that sewage is being disposed of on almost all available land surface, making it inevitable that large areas of groundwater will be impacted. The widespread areas in Eastham that are showing drinking water with nitrates in the 1 to 5 mg/l range are likely the result of this effect. In addition, where house parcels are small and contain both private wells and septic systems, high density increases the chances that cross contamination, where a well intercepts it s own or a neighbor s sewage plume, will occur. This is the most likely explanation for wells where nitrate levels 6 mg/l are found, because these wells generally appear to be randomly distributed. 8
11 Table 2. Summary of Results of Private Drinking Water Well Analysis for Nitrates, Eastham. Data through April Nitrate Level, mg/l Number of Samples % of Total < Comments 49.6% of samples in range <1-1.99, minimal or no human nitrogen impact % of samples in range , moderate nitrogen impact > Total % of samples in range , significant nitrogen impact 2.3% of samples in range >10, above human health drinking water standard Table 3. Comparison of Recently Sampled Nitrate Levels in Drinking Water Wells with Historical Data Results Shown as Percent of Total Samples in Each Range of Nitrate. Nitrate range, mg/l Current Data Nauset Lens Degree of Nitrogen Impact Natural background level; unimpacted Beginning to show human impact Moderate impact Significant impact Above human health drinking water standard 9
12 Figure 1. Comparison of Nitrates in Eastham Residential Wells During 3 Periods, ; ; and Nitrate Levels in Eastham Residential Wells, Showing Percent of Total Samples in Each Range Percent of Samples Current Data Nauset Lens 0 < Nitrate Range, mg/l Figure 2. Nitrate concentrations in groundwater below areas of Cape Cod having different densities of buildings. Data from Persky, Housing density is shown in number of houses per hectare. For reference, 1 Hectare= 2.47 Acres. frequency of occurance (percent) Truro Wellfleet Eastham Winter population density in 1990 units are people/hectare (federal land is included) Truro Wellfleet Eastham frequency of occurance (percent) 0 high sparsely settled town direction of increasing nitrate levels quality of drinking water densely settled town low 0 0 sampled nitrate levels 10 from (mg/l of nitrate) 10
13 SUMMARY OF PROJECTED NUMBER OF I/A SYSTEMS Under the criteria above, a maximum number of 3960 I/A systems might be installed over the coming years, as septic systems are upgraded: 93 currently permitted I/As 276 Criteria 1A: parcels <10,000 s.f. 282 Criteria 1A: parcels >10,000 s.f. but <20,000 s.f. 472 Criteria 1B: insufficient setback to wetlands 49 Criteria 2: parcels with public supply wells 2798 Criteria 3: bedroom density > 4 BR/acre 3970 Total Some of these projections should be given further consideration. Under the wetland buffer criteria requiring installation of I/As if there is < 3000 s.f. outside all buffers, 472 parcels are projected to have I/A systems installed. Some of these parcels have wetland coverage over all or most of the parcel and may not be buildable, so this number is probably an overestimation. Parcel-by parcel analysis shows that approximately 100 parcels are probably not buildable, reducing projected I/As to 372 under this criteria. It is reasonable to assume that most parcels of <10,000 s.f. size will require the installation of I/A systems. On parcels of this size, it is very difficult to install a Title 5 septic system in conformance with all required setbacks including setbacks to the owner s and all abutter s wells. In addition, almost all of these parcels have houses with more than 1 bedroom existing and so exceed the 4 BR/acre equivalency standard. Under this criteria, 276 parcels are projected to have I/A s installed and this seems to be a reasonable assumption. For parcels of >10,000 but <20,000 s.f., the town will need to consider, probably on a case by case basis, whether I/A systems should be installed at time of septic upgrade. Some of these parcels will need Title 5 setback variances to wells, which will likely trigger Board of Health requirements for installation of I/A systems. Another scenario is to use Criteria 3 to examine parcels of this size which have drinking water with elevated nitrates and bedroom density above the 4 BR/acre standard. Per DEP s Policy Title 5 Program s Guidance On System Upgrades In Areas Subject To Nitrogen Loading Limitations, the Board of Health is urged to consider the use of I/A systems for septic upgrades when the existing system exceeds the 440 gpd/acre standard and well water analysis demonstrates increased nitrogen concentrations in nearby drinking water wells. For example, there are 90 parcels of size >10,000 but <20,000 s.f., with greater than 4 bedroom/acre density whose most recently tested nitrate level is 3 mg/l or greater; parcels such as these might reasonably be required to have I/A systems installed. These are shown pink on Map 4. Using a more conservative determination for installation of I/A systems, there are 147 parcels (of any size) with bedroom density >6 BR/acre and nitrates at 5 mg/l or above. These are shown in light blue on Map 4. Using these criteria, a more conservative assumption as to how many I/A systems could be installed is: 93 currently permitted I/As 276 Criteria 1A: parcels <10,000 s.f. 372 Criteria 1B: insufficient setback to wetlands 49 Criteria 2: parcels with public supply wells 90 Criteria 3: parcels of 10-20,000 s.f. and with >4BR/acre equivalent and nitrates >3 mg/l 147 Criteria 3: bedroom density >6 BR/acre and nitrates > 5 mg/l 1027 Total Parcels with densities of more than 4 bedrooms per acre and elevated nitrates are situations where DEP s policy would clearly encourage Boards of Health to require the installation of I/A systems. However, visual analysis of the location of these systems (Map 4) show that they are widely and randomly distributed. It is important to recognize that the random distribution of wells showing elevated nitrates is most likely due to short circuiting of wells and septic systems. The likelihood of short circuiting, where a well intercepts a septic plume and therefore shows elevated nitrate levels, is increased in areas where numerous wells and septic systems exist in close proximity. 11
14 Installing I/A systems on these parcels is probably not an effective solution because 1) installing an I/A system is not a guarantee that well water quality on that parcel will improve, if the well is short circuiting with a septic system located on a different parcel; and 2) the random and scattered distribution of these parcels means that even if I/A systems were installed on all projected parcels, it would likely not have significant impact on improving groundwater and drinking water quality. For these reasons, installation of I/A systems is not recommended for this scenario. Perhaps the most realistic assumption about where and how many I/A systems will be installed is: 93 currently permitted I/As 276 Criteria 1A: parcels <10,000 s.f. 372 Criteria 1B: insufficient setback to wetlands 49 Criteria 2: parcels with public supply wells 282 Criteria 1A: parcels >10,000 s.f. but <20,000 s.f. in areas of small parcels, with the recognition that these parcels will need to be evaluated on a case-by-case basis 1072 Total This cumulative total is shown on Map 5 (Note: all 472 parcels identified as.having insufficient setback to wetlands are shown; it is also recognized that not all of these parcels will have I/A systems installed). It is important to note that the installation of municipal water supply throughout town would eliminate the need for most of these systems, with the exception of those installed due to insufficient setback to wetlands. ECONOMIC ANALYSIS The installation of an I/A on-septic treatment system is often viewed as an easy, readily available, and relatively inexpensive solution for remediating wastewater problems. It is important to recognize that I/A systems have significant ongoing operation and maintenance costs. When these costs are considered, it becomes clear that I/A systems are not inexpensive in the long term, and impose significant management burdens on both the homeowner and the town to ensure that they are operated reliably to meet nitrogen reduction requirements. In order to allow Eastham to compare the costs of widespread installation of I/A systems with other possible solutions for protecting ground- and drinking water quality, an economic present value analysis of the cost of I/A systems was performed. Present value analysis considers the time value of money using a discount rate. This adjusts expenditures in future years to current dollars so that costs incurred throughout the life of the system can be understood in present dollars. These costs can then be compared to other solutions, such as installation of a municipal water system or cluster/satellite wastewater collection and treatment systems. To perform present value analysis, several items of data are needed. These include planning and construction costs, maintenance costs over the life of the system, expected life of the system, and a discount rate. The following assumptions were made about these costs. It is difficult to assign an average cost for installation of a standard Title 5 system because the largest percentage of the cost of the system is related to the amount of site preparation and construction method needed for installation of the soil absorption system, and this is highly variable from parcel to parcel. For purposes of this discussion, we assume an average cost of installation of a standard Title 5 system on a parcel which is level, where minimal site preparation is needed, and with soils generally composed of medium sand to be roughly $10,000: $2000 engineering and permitting costs, and $8000 component purchase and installation costs. The installation of an I/A treatment unit is roughly an additional $10,000 above the cost of the Title 5 system. Homeowners who install an I/A system have an initial capital expenditure of approximately $20,000 that must be paid upon system installation, with no way to pay these costs over time other than by repayment of direct loans. Where there are significant site constraints, such as high groundwater elevations which necessitate construction of a mounded soil absorption system (as is the case on parcels close to wetlands, where I/A systems are often required) construction costs can be much higher, in the range of $30,000-$40,000. Initial cost of installing I/A components of a system was assumed to be $10,000. This cost covers direct purchase costs of the unit, installation and electrical wiring. It does not include fees for engineering, or installation 12
15 of the remaining required Title 5 components, most notably the soil absorption system, which is an additional significant expense. For initial analysis, the costs of designing and installing the remaining Title 5 components were excluded, so that the cost of I/A treatment alone could be analyzed. The following annual operation and maintenance costs were assumed: average O&M contract cost of $1200 (this assumes quarterly maintenance and sampling of the system and includes annual lab costs for four rounds of water sample analysis) and $350 electricity cost to operate the I/A components. The produces a estimated total annual average cost of $1550 to operate an individual I/A system. Periodic replacement cost for system parts such as pumps, blowers, and filter media was not included in these costs, as these components vary from one technology type to another, and insufficient information is available from vendors to accurately estimate how often these parts must be replaced and at what cost. I/A system lifespan was assumed to be 20 years. Interest or discount rate was assumed to be 5%. The discount rate is the expected risk free rate of return a homeowner would earn on money they would use to invest in a new system, and is often based on reasonable expectations of interest yields in financial vehicles such as savings accounts or certificates of deposit (Williams 2005). Present value analysis is performed according to the equation (Williams, 2005): PV where N = Co+ MCk k= 1 k ( 1+ r) PV= present value of costs C o = purchase and installation costs MC k = annual maintenance costs in years k=1 to N r = nominal discount rate k = 0 to N years, k=0 is the installation year N= last year of system life We used PV= present value of costs C o = $10,000 MC k = annual maintenance costs of $1550 per year in years k=1 to N r = 5% or.05 k = 0 to 20 years, k=0 is the installation year N= 20 years The results of this calculation show that the present value of an individual I/A system is $34, or roughly $35, Annualized costs to the homeowner would be approximately $ The spreadsheet used by Williams (2005) for performing these calculations can be found at: This is an interactive spreadsheet that automatically performs present value calculations, allowing the user to change parameters including initial cost, annual maintenance costs, interest rate, or life of system. Our calculations using this spreadsheet are shown in Figure 3. If the initial capital cost of installing the required Title 5 components in addition to the I/A components is included in this analysis, purchase and installation costs, C o, are estimated at $20,000 ($10,000 for Title 5 components, plus $10,000 for I/A components). This brings the present value to approximately $45, with annualized costs of approximately $3600. These results are shown in Figure 4. However, it must be recognized that, if the cost of construction of the Title 5 components is greater than a $10,000 average value, present value may be significantly higher than calculated here. Therefore, $45, should be considered to be a minimum number to be used for present value when Title 5 components of the system are included. Including purchase and installation costs for both the Title 5 and I/A components of the system may be a more appropriate monetary analysis, because it represents the real cost to the homeowner who has to upgrade a septic system with I/A treatment, and may be the most appropriate number to use to compare with costs of installing other collection and treatment options. 13
16 Figure 3. Spreadsheet used to calculate Present Value of I/A system, including I/A components only Lifecycle Cost Analysis of Home Wastewater Treatment Systems DATA Present Value Calculations Installation and Construction Cost Data Installation and Cost Annual Annual Non-Annual Septic Tank ($) Year Construction Share Incentive Maintenance Maintenance Absorption Field ($) 0 $10,000 $0 Lagoon Construction ($) 1 $0.00 $1, $0.00 Labor ($) 2 $0.00 $1, $0.00 Machine Hire ($) 3 $0.00 $1, $0.00 Other Materials ($) 4 $0.00 $1, $0.00 Other Costs ($) $10,000 5 $0.00 $1, $0.00 Land Cost ($) $0 6 $0.00 $1, $0.00 Total Installation and Construction Cost $10,000 7 $0.00 $1, $ $0.00 $1, $0.00 Maintenance Costs 9 $0.00 $1, $0.00 Annual Maintenance Cost ($) $1, $0.00 $2, $0.00 Inflation Rate for Maintenance Cost (decimal form 0.XX) $0.00 $2, $ $0.00 $2, $0.00 Periodic or Non-annual Maintenance Cost ($) 13 $0.00 $2, $0.00 Years Between Maintenance Events 14 $0.00 $2, $0.00 Enter $ Amount Directly in Appropriate Years 15 $0.00 $2, $ $0.00 $2, $0.00 Cost Sharing 17 $0.00 $2, $0.00 Construction Cost Share Payment ($) 18 $0.00 $2, $0.00 Annual Incentive Payment ($) 19 $0.00 $2, $0.00 Years for Annual Payment ($) 20 $0.00 $2, $ $0.00 $0.00 $0.00 Other Data 22 $0.00 $0.00 $0.00 Annual % Discount Rate (decimal form) $0.00 $0.00 $0.00 System Life (years) $0.00 $0.00 $ $0.00 $0.00 $ $0.00 $0.00 $ $0.00 $0.00 $ $0.00 $0.00 $0.00 Results 29 $0.00 $0.00 $0.00 Total Present Value >>> $34, $0.00 $0.00 $0.00 Annualized Cost >>> $2, PV >> $10,000 $0 $0.00 $24, $0.00 Enter data is light green cells Enter non-annual maintenance costs in column J. Results are reported in yellow cells 14
17 Figure 4. Spreadsheet used to calculate Present Value of I/A system, including cost of Title 5 and I/A components. Lifecycle Cost Analysis of Home Wastewater Treatment Systems DATA Present Value Calculations Installation and Construction Cost Data Installation and Cost Annual Annual Non-Annual Septic Tank ($) Year Construction Share Incentive Maintenance Maintenance Absorption Field ($) 0 $20,000 $0 Lagoon Construction ($) 1 $0.00 $1, $0.00 Labor ($) 2 $0.00 $1, $0.00 Machine Hire ($) 3 $0.00 $1, $0.00 Other Materials ($) 4 $0.00 $1, $0.00 Other Costs ($) $20,000 5 $0.00 $1, $0.00 Land Cost ($) $0 6 $0.00 $1, $0.00 Total Installation and Construction Cost $20,000 7 $0.00 $1, $ $0.00 $1, $0.00 Maintenance Costs 9 $0.00 $1, $0.00 Annual Maintenance Cost ($) $1, $0.00 $2, $0.00 Inflation Rate for Maintenance Cost (decimal form 0.XX) $0.00 $2, $ $0.00 $2, $0.00 Periodic or Non-annual Maintenance Cost ($) 13 $0.00 $2, $0.00 Years Between Maintenance Events 14 $0.00 $2, $0.00 Enter $ Amount Directly in Appropriate Years 15 $0.00 $2, $ $0.00 $2, $0.00 Cost Sharing 17 $0.00 $2, $0.00 Construction Cost Share Payment ($) 18 $0.00 $2, $0.00 Annual Incentive Payment ($) 19 $0.00 $2, $0.00 Years for Annual Payment ($) 20 $0.00 $2, $ $0.00 $0.00 $0.00 Other Data 22 $0.00 $0.00 $0.00 Annual % Discount Rate (decimal form) $0.00 $0.00 $0.00 System Life (years) $0.00 $0.00 $ $0.00 $0.00 $ $0.00 $0.00 $ $0.00 $0.00 $ $0.00 $0.00 $0.00 Results 29 $0.00 $0.00 $0.00 Total Present Value >>> $44, $0.00 $0.00 $0.00 Enter data is light green cells Enter non-annual maintenance costs in column J. Results are reported in yellow cells Annualized Cost >>> $3, PV >> $20,000 $0 $0.00 $24, $
18 In Eastham, many of the I/A systems projected for installation would not be required if municipal water is installed. Because septic systems will still be in use, homeowners at these properties will still bear the cost of standard Title 5components when building a house or upgrading a failed septic system. For comparison with the cost of municipal water, the present value cost for the I/A unit alone, $35,000.00, is the more appropriate cost to use. Comparison of present value I/A costs with other treatment options The present value cost of $35,000 per I/A system (or $45,000 if including the cost of installation of Title 5 components) or can be compared against several other projects being proposed in other towns on Cape Cod. These projects both involve the construction of small sewage collection and treatment systems for a limited number of homes. In that sense, they may be similar to scenarios that Eastham could consider for building small collection and treatment systems to serve neighborhood areas. The costs associated with these projects are rough estimates, and are presented for general comparison purposes only. In general, most towns structure the cost of installation of cluster or satellite wastewater collection and treatment systems so that homeowners pay the costs as betterments over a 20 year period. Initial capital cost to the homeowner is usually minimal. This can be contrasted to a homeowner who installs an I/A system who typically has an initial capital cost of at least $20,000 to purchase and install the I/A treatment unit and other standard Title 5 components. The town of Barnstable is considering a proposed project to sewer the area around Lake Wequaquet. This project would involve approximately 1315 homes. Sewage would be treated at the existing Barnstable Wastewater Treatment Facility, so the cost of constructing a treatment facility is not included in projected costs. Also, the large sewer mains that would collect sewage from the project area and convey it to the wastewater treatment facility already exist, which further reduces project cost. Because the topography in the proposed area is uneven, the proposed collection system consists of a combination of gravity sewers, pumping stations and low pressure sewers with grinder pumps installed at some homes. Four possible sewer designs were developed and evaluated for this project. Life cycle cost for the most cost effective system, which includes construction costs, equipment replacement costs, and O&M costs, is estimated in 2003 dollars at $26,346, or $19, per home to be served (Tighe and Bond, 2003). This cost does not include the one-time cost for the installing the service connection between the building and the street line (estimated to be several thousand dollars) but does include the cost of purchase and maintenance of grinder pumps for the homes where these would be required. It also does not include annual sewer fees charged by the wastewater treatment facility; these fees are based on water usage and average $450 for a single family home with 4 occupants (Town of Barnstable Water Pollution Control Facility, personal communication). Perhaps more directly comparable is the proposed sewering project to serve the New Silver Beach area in Falmouth. This project involves a gravity sewer collection system for 220 homes. Sewage is projected to flow to a small treatment plant to be located on municipally owned property (a school); effluent would also be disposed of on this property, eliminating the cost of purchasing land for effluent disposal. Cost of constructing the sewage collection system and treatment plant has been recently estimated in current dollars at $12.2 million, or roughly $55,000 per home (Falmouth Nutrient Group October 12, 2006 meeting via George Heufelder, personal communication). Annual costs to homeowners for wastewater treatment (sewer fees) are projected at $300. If the $55, amount is amortized over 20 years at a typical 5% interest rate, it results in a total cost of approximately $82, per home served. The addition of $300 annual sewer fees, adjusted for inflation at 3%, results in an additional cost to the homeowner of approximately $ over 20 years. DISCUSSION The installation of individual I/A systems is often assumed to be the easiest and least expensive option for remediating existing sewage problems. It is important to recognize that, over the long term, most I/A systems installed for nitrogen removal will have significant annual O&M costs. This in turn significantly increases life cycle costs to the point where these systems may not be significantly less costly than installing small collection and treatment systems. All wastewater treatment systems, whether onsite I/A systems or larger treatment units, require operator oversight if they are to perform reliably to produce wastewater of desired quality. O&M costs are a significant amount of the total cost of wastewater treatment over time. When I/A systems are installed at individual homes, 16
19 each homeowner must bear the full cost of O&M for his system. Conversely, O&M costs for larger collection systems, while they may be somewhat higher than for an individual system, are spread over a larger number of owners, resulting in lower costs for individual owners. It is also important to note that different treatment options may produce significantly different water quality results, especially for nitrogen removal. Individual onsite I/A units are recognized by MA DEP as capable of producing, at best, 50% removal of nitrogen. If we assume that typical sewage effluent has a total nitrogen concentration of 38 mg/l TN, a 50 % reduction in total nitrogen results in effluent of 19 mg/l TN. Larger treatment units, such as might be used to collect wastewater from a small neighborhood, are typically able to remove up to 75% of the total nitrogen, to a level as low as 10 mg/l TN in finished effluent. Larger satellite package plants with groundwater discharge permits that require more oversight by operators, can be expected to remove at least 75% of the total nitrogen to a level of 10 mg/l TN, and some newer technologies, with operator oversight, may remove as much as 90% of total nitrogen, to a level as low as 5 mg/l TN. Individual on-site I/A systems typically show highly variable performance over time, especially in their capability to remove nitrogen. This is because domestic wastewater is variable in strength and volume from hour to hour within a day, from day to day within greater time periods, and from household to household depending on water use practices. Most single family I/A systems are not designed with surge capacity which can result in slugs of water passing through the treatment unit with insufficient residence time for complete treatment. All of these factors combine to produce inconsistent wastewater treatment. In addition, I/A treatment systems rely on a biological community of bacteria to treat wastewater. When systems are used only seasonally or intermittently, it will take a number of weeks for this biological community to become established and functioning; this may result in poor wastewater treatment for the first 4-6 weeks of use, which means that these systems may not be particularly effective at seasonally occupied homes. Lastly, the 50% reduction of nitrogen expected from onsite I/A systems is almost certainly not going to reduce nitrogen in wastewater to a level low enough to be protective of coastal embayments. It is anticipated that in watersheds to embayments that are identified as nitrogen impacted, as much as 100% of the nitrogen will have to be removed in order to protect marine water quality and ecosystem integrity. In these critical watershed areas, 50% nitrogen reduction is unlikely to meet nitrogen goals, implying that onsite I/As may often not be a good choice as a solution for protecting embayment water quality. All of these factors treatment to lower nitrogen levels, more consistent treatment, and O&M costs spread over a larger number of users appear to make small collection and treatment systems a better value for money spent. It is also important to recognize that the installation of a significant number of I/A systems will impose a substantial management burden upon the town. Barnstable County Department of Health and Environment currently employs one full time staff member to oversee compliance with O&M and sampling requirements for approximately 1100 I/A systems permitted Cape wide, including those in Eastham. If Eastham commits to a similar number of I/A systems, it would likely have to assume oversight of its own systems, and this will require staff dedicated to this job. The estimated present value cost of $35,000 per homeowner per I/A system does not take into account the costs to the town to staff this position, which will be significant over a 20 year period. If Eastham commits to a large number of I/A systems, creation of a wastewater management district that is responsible for system operation might be the most efficient way to ensure that systems are properly operated and maintained. Creation of a wastewater management district potentially offers a number of advantages. The town could hire or contract with operators to perform O&M services for all systems in the district, which would ensure consistent O&M procedures. Consistent O&M may enhance system performance. O&M services could occur automatically, with homeowners being billed for service. This eliminates a substantial amount of effort currently spent on follow-up with non-compliant owners who do not maintain O&M contracts. Creation of a management district should allow more efficient provision of O&M services, possibly reducing homeowner costs to operate their systems. We estimate that one operator could be responsible for O&M for up to 600 systems, if systems are inspected twice per year. If systems are inspected four times per year, one operator could manage up to 300 systems. CONCLUSIONS AND RECOMMENDATIONS To best address these issues, Eastham should continue its on-going comprehensive wastewater and drinking water supply planning. This type of planning will allow the town to make decisions that are the most cost effective and sufficiently protective of drinking and surface water quality. 17
20 Parcels projected under various scenarios to have I/A systems installed as a result of bedroom density, elevated nitrates and/or small parcel size should not be considered for I/A installation in isolation. These parcels are distributed throughout areas where well water testing has demonstrated widespread nitrogen impact and should be viewed as indicative of a larger groundwater nitrogen problem. It would not be effective to install I/A systems on these parcels alone, because doing so will not solve the larger problem: existing density of housing is too great in many areas to be protective of drinking water quality for parcels with septic systems and private wells. Installing I/A systems randomly on a few of these parcels will not have a significant impact on improving drinking water quality in these neighborhoods. Similarly, in areas where parcels are of insufficient size to accommodate the required separation between wells and septic systems, the installation of I/A systems is at best a temporary solution. Separation between septic systems and wells is predicated upon a concern for pathogen migration from the sewage disposal area to the drinking water well. I/A treatment systems were not designed for pathogen removal and most have only limited pathogen removal capability. To protect human health and drinking water quality in the long term, areas with small parcels will need either municipal drinking water or sewage collection and treatment systems. Of the numerous I/A systems that might be installed under the various scenarios investigated in this report, it is important to note that the vast majority will not needed if Eastham chooses to install a municipal drinking water system throughout town. Installation of municipal water will save substantial amounts money for homeowners who otherwise would be required to install and pay for operation of I/A systems. It will also alleviate a significant management burden that would be imposed upon the town to ensure that I/A systems are operated, maintained and monitored as required. Eastham has not yet received the results of the Massachusetts Estuaries Project for the Nauset embayment. These results will determine the total maximum daily loads (TMDLs) of nitrogen that are protective of embayment water quality and will define the amount of nitrogen that must be removed from the contributory watersheds to this embayment. With this information, the town can assess whether I/A systems will be capable of removing sufficient nitrogen to meet these goals and can decide what role I/A systems may play in long-term wastewater solutions. It is hoped that the information developed through this project will bring focus to this discussion and assist Eastham as it goes forward with water supply and wastewater planning. 18
21 REFERENCES Cape Cod Planning and Economic Development Commission, State of the Aquifer Report Lindeburg, Michael R Civil Engineering Reference Manual, Professional Publications, Inc., Belmont, CA. Massachusetts Department of Environmental Protection, Training Manual for the State Environmental Code, Title 5, Appendix 10, Nitrogen Loading Calculations Massachusetts Department of Environmental Protection Title 5 Program s Guidance On System Upgrades In Areas Subject To Nitrogen Loading Limitations, Policy # BRP/DWM/PeP-P99-5 Rask, Susan G., Drinking Water Quality on Cape Cod. Environment Cape Cod, Vol. 1, No. 2 Tighe and Bond, Lake Wequaquet, Long Pond and Cape Cod Community College Sewer Extension Preliminary Design Report. Williams, Jeffrey R., G. Morgan Powell, and Rodney D. Jones, A Survey and Analysis of the Costs of Individual Onsite Septic Tank and Lagoon Treatment Systems in Small Flows Quarterly vol. 6 no. 1, National Environmental Services Center, West Virginia University, Morgantown, WV. 19
22 APPENDIX 1 Maps


23 21
24 Map 1. Northern half of Eastham 22


25 Map 1. Southern half of Eastham 23


26 24
27 Map 2. Northern half of Eastham 25
28 Map 2. Southern half of Eastham 26


29 27

30 Map 3. Northernmost third of Eastham 28


31 Map 3. Middle third of Eastham 29

32 Map 3. Southernmost third of Eastham 30


33 31


34 Map 4. Northern half of Eastham 32
35 Map 4. Southern half of Eastham 33


36 34


37 Map 5. Northern half of Eastham 35


38 Map 5. Southern half of Eastham 36
Commonwealth of Massachusetts Title 5 Official Inspection Form Subsurface Sewage Disposal System Form - Not for Voluntary Assessments
 s Name Inspection results must be submitted on this form. Inspection forms may not be altered in any way. Please see completeness checklist at the end of the form. Important: When filling out forms on
Commonwealth of Massachusetts Title 5 Official Inspection Form Subsurface Sewage Disposal System Form - Not for Voluntary Assessments
 Owner Inspection results must be submitted on this form. Inspection forms may not be altered in any way. Please see completeness checklist at the end of the form. Important: When filling out forms on the
Cape Wide Buildout Analysis to Support Regional Wastewater Planning
 Cape Wide Buildout Analysis to Support Regional Wastewater Planning Final Report Submitted to the MA Department of Environmental Protection July 31, 2012 The Cape Cod Commission is developing a Regional
Commonwealth of Massachusetts Title 5 Official Inspection Form. Subsurface Sewage Disposal System Form - Not for Voluntary Assessments
 Inspection results must be submitted on this form. Inspection forms may not be altered in any way. Please see completeness checklist at the end of the form. Important: When filling out forms on the computer,
Commonwealth of Massachusetts Title 5 Official Inspection Form Subsurface Sewage Disposal System Form - Not for Voluntary Assessments
 Inspection results must be submitted on this form. Inspection forms may not be altered in any way. Important: When filling out forms on the computer, use only the tab key to move your cursor - do not use
COMPARISON OF COSTS FOR WASTEWATER MANAGEMENT SYSTEMS APPLICABLE TO CAPE COD
 COMPARISON OF COSTS FOR WASTEWATER MANAGEMENT SYSTEMS APPLICABLE TO CAPE COD Guidance to Cape Cod Towns Undertaking Comprehensive Wastewater Management Planning Prepared for: Association to Preserve Cape
CHAPTER 6 SANITARY SEWER SUB-ELEMENT
 CHAPTER 6 SANITARY SEWER SUB-ELEMENT Page 1 of 10 CHAPTER 6 SANITARY SEWER SUB-ELEMENT A. OVERVIEW The following Future Land Use categories are considered to be urban and require the provision of sanitary
COMMONWEALTH OF MASSACHUSETTS EXECUTIVE OFFICE OF ENVIRONMENTAL AFFAIRS DEPARTMENT OF ENVIRONMENTAL PROTECTION
 COMMONWEALTH OF MASSACHUSETTS EXECUTIVE OFFICE OF ENVIRONMENTAL AFFAIRS DEPARTMENT OF ENVIRONMENTAL PROTECTION ONE WINTER STREET, BOSTON, MA 02108 617-292-5500 MITT ROMNEY Governor KERRY HEALEY Lieutenant
Proposed Wastewater Nitrogen Management Bylaw for Wareham, MA
 Proposed Wastewater Nitrogen Management Bylaw for Wareham, MA Presentation to Town Meeting Dr. Joe Costa Buzzards Bay National Estuary Program April 30, 2007 Wareham s Watersheds The Problem with Nitrogen
EXECUTIVE SUMMARY February 6, 2007
 HOLLISTON BOARD OF HEALTH REGULATIONS FOR THE SITING, CONSTRUCTION, INSPECTION, UPGRADE, REPAIR AND EXPANSION OF ON-SITE WASTEWATER DISPOSAL SYSTEMS. EXECUTIVE SUMMARY February 6, 2007 The present Board
Initial Alternative Scenarios and Model Results
 3 2008 Initial Alternative Scenarios and Model Results 3.1 Introduction Following the release of the Needs Assessment Report, the Mashpee Sewer Commission identified five different management scenarios
Healthy Drinking Waters
 Healthy Drinking Waters for M A S S A C H U S E T T S S a f e a n d h e a l t h y l i v e s i n s a f e a n d h e a l t h y c o m m u n i t i e s Drinking Water Wells When you turn on the faucet to get
INDIAN HILLS SOURCE WATER PROTECTION PLAN MEETING JANUARY 11, 2017
 INDIAN HILLS SOURCE WATER PROTECTION PLAN MEETING JANUARY 11, 2017 Jefferson County Public Health Environmental Health Services Division Our Mission: Promoting and protecting health across the lifespan
Wastewater Treatment & Water Supply Alternatives Analysis
 Wastewater Treatment & Water Supply Alternatives Analysis Lake Sallie & Lake Melissa Chain of Lakes Prepared for Pelican River Watershed District February 2008 Table of Contents 1.0 EXECUTIVE SUMMARY...
INFRASTRUCTURE ELEMENT SANITARY SEWER SUB-ELEMENT
 INFRASTRUCTURE ELEMENT SANITARY SEWER SUB-ELEMENT GOALS, OBJECTIVES & POLICIES GOAL, OBJECTIVES & POLICIES GOAL SS. SANITARY SEWER PUBLIC SERVICE. It is the goal of the City of Casselberry to provide,
Land Use Office, PO Box 197, 6683 County Road 13, Conejos CO Phone #: Fax:
 Application to: Application for On-Site Wastewater Treatment System Permit Install New System $250.00 Repair to Tank or Leach Field $125.00 Inspect Existing system $125.00 (Permit Fees are payable to CONEJOS
VT DEC Stormwater Program. Vermont Stormwater Rules 2017 Update
 VT DEC Stormwater Program Vermont Stormwater Rules 2017 Update Stormwater Rule Why update Changes, new standards Timing and process for rule adoption Stormwater Rule Why Update? Required by Act 64- Vermont
MEMO. To: From: Date: April 4, Subject: Montana Department of. Environmental Quality. Potential Developers. Montana DEQ
 Montana Department of Environmental Quality MEMO To: From: Potential Developers Montana DEQ Date: April 4, 2011 Subject: Work Camps, Trailer Courts, and other facilities. This guidance document has been
Herring River (Eastham)
") WATERSHED REPORT: LOWER CAPE Herring River (Eastham) WATER THREAT LEVEL LOW EASTHAM Introduction to the Watershed Reports In 2001, the Massachusetts Estuaries Project (MEP) was established to evaluate
WATERSHED REPORT: LOWER CAPE Herring River (Eastham) WATER THREAT LEVEL LOW EASTHAM Introduction to the Watershed Reports In 2001, the Massachusetts Estuaries Project (MEP) was established to evaluate
Utilities Extension Project (UEP) North 2. Northwest Cape Coral Neighborhood Association Meeting September 18, 2014
 North 2. Northwest Cape Coral Neighborhood Association Meeting September 18, 2014") Utilities Extension Project (UEP) North 2 Northwest Cape Coral Neighborhood Association Meeting September 18, 2014 1 North 2 Service Area 4.27 Sq Miles Estimated Project Amount $137 Million North 1 Service
Utilities Extension Project (UEP) North 2 Northwest Cape Coral Neighborhood Association Meeting September 18, 2014 1 North 2 Service Area 4.27 Sq Miles Estimated Project Amount $137 Million North 1 Service
Application for On-Site Wastewater Treatment System Permit
 Application for On-Site Wastewater Treatment System Permit FEES: (Permit Fees are payable to CONEJOS COUNTY TREASURER and are Non-Refundable.) Install New System $250.00-Pre-construction Repair Tank STA/Leach/Drain
SECTION 13 REGIONAL WASTEWATER PLANNING
 SECTION 13 REGIONAL WASTEWATER PLANNING 13.1 Introduction Regional wastewater planning is needed with the expected growth in Caldwell County. Evaluation of several options regarding collection treatment
Wilson Lake. Septic Survey Report. September Prepared For: The Wilson Lake Association. Prepared By: The Acton Wakefield Watersheds Alliance
 Wilson Lake Prepared For: The Wilson Lake Association Septic Survey Report Prepared By: The Acton Wakefield Watersheds Alliance September 2016 Support By: The Maine Department of Environmental Protection
Reference Guideline #1. Hydrogeological Impact Assessment
 Reference Guideline #1 Hydrogeological Impact Assessment Reference Guideline #1 Hydrogeological Impact Assessment Hydrogeological assessments are required for some subdivision applications when triggered
OPTION ONE: Collective Management of Decentralized Onsite Wastewater Treatment and Disposal Systems
 APPENDIX B OPTION ONE: Collective Management of Decentralized Onsite Wastewater Treatment and Disposal Systems Option one is a community-generated option, not authored by CHS Engineers (the consultant).
Borough of Hightstown (1104) Introduction
 Introduction") (1104) Introduction This municipal chapter is an element of the prepared by the Planning Division in accordance with N.J.A.C. 7:15. Hightstown Borough, an established, self-governing municipality, is located
(1104) Introduction This municipal chapter is an element of the prepared by the Planning Division in accordance with N.J.A.C. 7:15. Hightstown Borough, an established, self-governing municipality, is located
Septic Improvement Program FAQs
 Septic Improvement Program FAQs Where does our waste go after we flush the toilet? Thanks to the simple push of a lever, waste remains out of sight and out of mind. According to the US EPA, about one-third
TRI-TOWN SEPTAGE TREATMENT FACILITY EVALUATION. August 2005
 TRI-TOWN SEPTAGE TREATMENT FACILITY EVALUATION August 2005 TRI-TOWN SEPTAGE TREATMENT FACILITY EVALUATION AUGUST 2005 Prepared For: Wastewater Management Steering Committee Town of Orleans, Massachusetts
City of Greater Sudbury Infrastructure Background Study APPENDIX A.1. Guideline for Sewage and Water Services
 City of Greater Sudbury Infrastructure Background Study APPENDIX A.1 Guideline for Sewage and Water Services GUIDELINE D-5 Planning for Sewage & Water Services Legislative Authority: Environmental Protection
Gallatin County. Regional Wastewater Management System Feasibility Study - Phase II Working Draft Report 9/17/2010
 Gallatin County Regional Wastewater Management System Feasibility Study - Phase II Working Draft Report 9/17/2010 Prepared for: Gallatin County 311 West Main Bozeman, MT 59715 406-582-3192 Prepared by:
Town of Dennis Regulations for Subsurface Disposal of Sewage
 December 8, 2005 Town of Dennis Regulations for Subsurface Disposal of Sewage FINDINGS The Board of Health of the Town of Dennis finds that: 1. the groundwater underlying this town is the sole source of
PERC-RITE DRIP DISPERSAL DESIGN GUIDE FOR SEPTIC TANK OR ADVANCED TREATMENT EFFLUENT MASSACHUSETTS
 PERC-RITE DRIP DISPERSAL DESIGN GUIDE FOR SEPTIC TANK OR ADVANCED TREATMENT EFFLUENT MASSACHUSETTS This Design Guide is to assist you in preparing for the design of a Perc-Rite Drip Dispersal System for
Stormwater and Nitrogen Management Options for Wareham, MA
 Stormwater and Nitrogen Management Options for Wareham, MA The Problem with Nitrogen Nitrogen management A Workshop for the Wareham Planning Board by the Buzzards Bay Project National Estuary Program 9/30/02
Chapter DRINKING WATER
 Whatcom County Code Chapter 24.11 DRINKING WATER Page 1 of 30 Sections: 24.11.010 Authority. 24.11.020 Purpose. 24.11.030 Adoption by reference. 24.11.040 Definitions. 24.11.050 General requirements. 24.11.060
Private Sewage Permit Application
 Kneehill County 1600-2 Street NW Three Hills, AB T0M 2A0 Phone: 403-443-5541 Fax: 403-443-5115 Private Sewage Permit Application Permit Number Permit Type: Owner Contractor Development Permit Number: Application
Issues for Council Discussion June 5, 2008
 Issues for Council Discussion June 5, 2008 Carbonate Rock Program Changes The Carbonate Rock Program was amended to reflect changes made to the respective GPOs Clarified that karst in not strictly a surface
DECENTRALIZED WASTEWATER SOLUTIONS FOR A HISTORIC MILL VILLAGE. Justin Jobin, Lorraine Joubert and George Loomis*
 DECENTRALIZED WASTEWATER SOLUTIONS FOR A HISTORIC MILL VILLAGE Justin Jobin, Lorraine Joubert and George Loomis* ABSTRACT This report summarizes results of the Chepachet Village Decentralized Wastewater
Final Report: Appendix A. Water Balance Analysis Assumptions
 Bridgewater State University Virtual Commons - Bridgewater State University Phase I Final Report Taunton River Watershed Project 2008 Final Report: Appendix A. Water Balance Analysis Assumptions Recommended
Source Water Assessment Program (SWAP) Report for Heath Elementary School
 Report for Heath Elementary School") Source Water Assessment Program (SWAP) Report for Heath Elementary School What is SWAP? The Source Water Assessment Program (SWAP), established under the federal Safe Drinking Water Act, requires every
Source Water Assessment Program (SWAP) Report for Heath Elementary School What is SWAP? The Source Water Assessment Program (SWAP), established under the federal Safe Drinking Water Act, requires every
SITE EVALUATION REQUEST FORM
 State of Ohio Environmental Protection Agency SITE EVALUATION REQUEST FORM FOR SEWAGE AND OTHER WASTEWATER DISPOSAL SYSTEMS IN AREAS NOT SERVED BY PUBLIC SANITARY SEWERS The enclosed form should be completed
West Virginia Department of Health & Human Resources Department of Health
 SS-182A Rev 6/07 West Virginia Department of Health & Human Resources Department of Health Application for a Permit to Install or Modify an Onsite Sewage Disposal System Property Owner Phone (H) (W) Address
TASK IV: ANALYSIS OF MILLBROOK SEWER AND WATER SYSTEM CONSUMPTION CHARGES AND SEWER CAPITAL ASSESSMENTS
 TASK IV: ANALYSIS OF MILLBROOK SEWER AND WATER SYSTEM CONSUMPTION CHARGES AND SEWER CAPITAL ASSESSMENTS PREPARED FOR: VILLAGE OF MILLBROOK, NY PREPARED BY: This document was prepared with funds provided
ARIZONA CONSERVATION REQUIREMENTS. Management Plans MUNICIPAL CONSERVATION REQUIREMENTS
 ARIZONA CONSERVATION REQUIREMENTS Management Plans The Arizona Groundwater Management Code establishes the legal framework for conserving water in Arizona's most populous areas. To help achieve its goals,
Contact Information Owner s Name Home Phone Cell Phone Mailing Address City Zip Code
 Henry & Stark County Health Department Environmental Health 4424 US Hwy 34, Kewanee, IL 61443 309-852-0197--309-852-3115 www.henrystarkhealth.com Henry County Stark County Received by: Amount Received:
MARION COUNTY COMPREHENSIVE PLAN 2035
 0 0 0 GOAL : the County shall ensure safe, effective, and efficient wastewater treatment systems that protect the quality of surface water, groundwater, and springsheds are established and maintained,
Chapter 2 Screening Approach and Criteria
 Chapter 2 Screening Approach and Criteria CHAPTER 2 SCREENING APPROACH AND CRITERIA 2.1 INTRODUCTION As discussed in Chapter 1, the purpose of this report is to identify and screen alternative technologies,
Project Name: Add a unique name that appropriately identifies the submission
 PTAPP Online Municipal Tracking Tool Instructions Project Name: Add a unique name that appropriately identifies the submission Municipal Project: Check this box if the project is part of municipal efforts
DRAFT. Rhode Island Wastewater Information System (RIWIS) A Statewide Web-based Information System for Community Wastewater Management
 A Statewide Web-based Information System for Community Wastewater Management") Rhode Island Wastewater Information System (RIWIS) A Statewide Web-based Information System for Community Wastewater Management RIWIS Recommended Fields for Property Information Page DRAFT RIWIS RECOMMENDED
Rhode Island Wastewater Information System (RIWIS) A Statewide Web-based Information System for Community Wastewater Management RIWIS Recommended Fields for Property Information Page DRAFT RIWIS RECOMMENDED
Contact Information Owner s Name Home Phone Cell Phone Mailing Address City Zip Code
 Henry & Stark County Health Department Environmental Health 4424 US Hwy 34, Kewanee, IL 61443 309-852-0197--309-852-3115 www.henrystarkhealth.com Henry County Stark County Received by: Amount Received:
Appendix A Literature Review - Septic System Performance Criteria, Technologies, and Cost Factors
 Appendix A Literature Review - Septic System Performance Criteria, Technologies, and Cost Factors TECHNICAL MEMORANDUM Appendix A - Literature Review Septic System Performance Criteria, Technologies,
Pennichuck Brook Watershed Buildout Analysis December 2003
 INTRODUCTION The Pennichuck Brook watershed (Figure 1) includes approximately 17,700 acres within the communities of Amherst, Hollis, Merrimack, Milford and Nashua and is the primary drinking water supply
ROCKY LEDGE PUBLIC WATER PROGRAM QUESTIONS AND ANSWERS. Working Document, Last Updated August 24, 2017
 ROCKY LEDGE PUBLIC WATER PROGRAM QUESTIONS AND ANSWERS Working Document, Last Updated August 24, 2017 What Properties are included in the Rocky Ledge Public Water Program (RLPWP)? The RLPWP includes the
VILLAGE OF BELLEDUNE
 VILLAGE OF BELLEDUNE * P.O. Box 1006 * 2330 Main Street * Belledune, NB * E8G 2X9 * Tel.: (506) 522-3700 * Fax: (506) 522-3704 * e-mail: bell001@nbnet.nb.ca or bell002@nbnet.nb.ca * Web Site: www.belledune.com
COST ANALYSIS OF PUBLIC WASTEWATER VERSUS ONSITE WASTEWATER Danna L. Revis 1
 COST ANALYSIS OF PUBLIC WASTEWATER VERSUS ONSITE WASTEWATER Danna L. Revis 1 ABSTRACT A cost analysis of constructing and operating an onsite sewage system versus constructing a connection and subscribing
Capital Improvements
 Capital Improvements CITY OF WINTER PARK CHAPTER 7: CAPTIAL IMPROVEMENTS ELEMENT CAPITAL IMPROVEMENTS ELEMENT DATA, INVENTORY & ANALYSIS Introduction The Capital Improvements Element (CIE) is required
CHAPTER 10 NATURAL GROUNDWATER AND AQUIFER RECHARGE ELEMENT
 CHAPTER 10 NATURAL GROUNDWATER AND AQUIFER RECHARGE ELEMENT Page 1 of 7 G:\Comp\Adopted Comprehensive Plans\15. Cylce 16-2 and 16-3\Elements not changed\ Groundwater & Aquifer A. OVERVIEW CHAPTER 10 NATURAL
Potable Water Supply, Wastewater & Reuse Element
 Potable Water Supply, Wastewater & Reuse Element GOAL ONE: HIGH QUALITY AND AFFORDABLE POTABLE WATER WILL BE AVAILABLE TO MEET THE EXISTING AND PROJECTED DEMANDS OF PINELLAS COUNTY UTILITY CUSTOMERS. 1.1.
Klickitat County. On-Site Sewage System. Construction Manual
 Homeowner OSS Design and Construction Guide Klickitat County On-Site Sewage System Construction Manual Minimum standards and recommendations expected for the construction of on-site wastewater treatment
OAKLAND COUNTY HEALTH DIVISION SANITARY CODE ARTICLE II - GROUNDWATER PROTECTION
 OAKLAND COUNTY HEALTH DIVISION SANITARY CODE ARTICLE II - GROUNDWATER PROTECTION INDEX OF CODE SECTION 1 SECTION 2 SECTION 3 SECTION 4 SECTION 5 SECTION 6 DEFINITIONS RESIDENTIAL BUILDING SITES COMMERCIAL
ON-SITE SEWAGE PERMITTING PROCESS
 Whitman County Environmental Health ON-SITE SEWAGE PERMITTING PROCESS STEP I. SOIL & SITE EVALUATION Complete the front page of the OSS Site Evaluation Application and schedule an appointment with an Environmental
COMMISSIONERS OF PUBLIC WORKS of the CITY OF CHARLESTON, SOUTH CAROLINA DEVELOPMENT POLICIES
 COMMISSIONERS OF PUBLIC WORKS of the CITY OF CHARLESTON, SOUTH CAROLINA DEVELOPMENT POLICIES TABLE OF CONTENTS DEFINITIONS WATER POLICIES Water System Extensions.... W88001 Water System Activation / Service
PUTNAM COUNTY COMPREHENSIVE PLAN EXHIBIT DD INFRASTRUCTURE ELEMENT
 COMPREHENSIVE PLAN EXHIBIT DD D. Infrastructure Element (Sanitary Sewer, Potable Water, Solid Waste, Drainage and Natural Groundwater Aquifer Recharge) Goals, Objectives and Policies GOAL D.1: Putnam County
ONSITE SEPTIC DISPOSAL PERMIT APPLICATION
 OFFICE 518.747.5212 --------------FAX 518.747.2493 ONSITE SEPTIC DISPOSAL PERMIT APPLICATION (Clerk s Office Use Only) APPLICATION NO: DATE : FEE PAID: Requirements, Fees and Instructions (Please use dark
SUPPLEMENTAL PLUMBING ORDINANCE
 SUPPLEMENTAL PLUMBING ORDINANCE SECTION 1: TITLE This Ordinance shall be known as the Plumbing Ordinance and is referred to herein as the Ordinance. SECTION 2: LEGAL AUTHORITY This Ordinance is adopted
CITY OF HAMILTON LYNDEN RURAL SETTLEMENT AREA...
 TABLE OF CONTENTS 13.0 CITY OF HAMILTON LYNDEN RURAL SETTLEMENT AREA... 13-1 13.1 Definitions... 13-1 13.2 City Of Hamilton Lynden Rural Settlement Area Source Protection Plan Policies... 13-1 13.3 Policies
Acton Massachusetts: Innovative Water Resources Management Now and in the Future
 Acton Massachusetts: Innovative Water Resources Management Now and in the Future Brent L. Reagor, RS Environmental Health Specialist Acton Health Department Background on Acton Wastewater Management Watershed
DRIP EMITTER SYSTEM STUDY GUIDE
 DRIP EMITTER SYSTEM STUDY GUIDE Minimum Criteria for Pressurized Subsurface Absorption Fields Utilizing Emitters. Subsurface systems utilizing emitters may be used in lieu of conventional or other alternative
Enviro-Septic Wastewater Treatment Systems Design and Installation Manual Vermont State Attachment
 Enviro-Septic Wastewater Treatment Systems Design and Installation Manual Vermont State Attachment The information in this manual is subject to change without notice. Your suggestions and comments are
PERC-RITE DRIP DISPERSAL DESIGN GUIDE FOR SEPTIC TANK OR ADVANCED TREATMENT EFFLUENT MASSACHUSETTS
 PERC-RITE DRIP DISPERSAL DESIGN GUIDE FOR SEPTIC TANK OR ADVANCED TREATMENT EFFLUENT MASSACHUSETTS This Design Guide is to assist you in specifying a Perc-Rite Drip Dispersal System for General Use or
Q&A Guidance for Implementing Revised COMAR ; Best Available Technology for Removal of Nitrogen (BAT)
") Q&A Guidance for Implementing Revised COMAR 26.04.02.07; Best Available Technology for Removal of Nitrogen (BAT) As of January 1, 2013, the requirements of COMAR 26.04.02.07 are as follows: COMAR 26.04.02.07
Q&A Guidance for Implementing Revised COMAR 26.04.02.07; Best Available Technology for Removal of Nitrogen (BAT) As of January 1, 2013, the requirements of COMAR 26.04.02.07 are as follows: COMAR 26.04.02.07
Update to Facility Capacity Charges Methodology and Schedule. A study for El Dorado Irrigation District. prepared by. Bartle Wells Associates
 APPENDIX A Update to Facility Capacity Charges Methodology and Schedule A study for El Dorado Irrigation District prepared by Bartle Wells Associates Principal Consultants Doug Dove, President Catherine
Managing On-Site Wastewater Disposal Systems
 Managing On-Site Wastewater Disposal Systems Problem In the Buzzards Bay drainage basin, 43% of the population, or more than 100,000 people, use on-site wastewater disposal systems. Moreover, most of the
PWP 2015 IRP Exhibit 1. Renewable Energy - Distributed PV Potential Assessment
 PWP 2015 IRP Exhibit 1 Renewable Energy - Distributed PV Potential Assessment Background During the 2014 PWP Integrated Resource Plan (IRP) process, Black & Veatch developed a number of renewable energy
Regulation of Sewage Disposal Systems to Protect Surface Waters and Pond Water Quality
 REVISED 7/20/2016 Regulation of Sewage Disposal Systems to Protect Surface Waters and Pond Water Quality 1. Purpose and Authority 1.1 The Brewster Board of Health ( Board ) concludes that the protection
The ~ommonwealth of Nassachusetts
 DEVAL L. PATRICK GOVERNOR The ~ommonwealth of Nassachusetts Executive Ofice of Energy adenvironmentafflffairs 100 cambridge Street, Suite 900 Boston, MA 02114 TIMOTHY P. MURRAY LIEUTENANT GOVERNOR July
Chapter 3 Dispersion BMPs
 Chapter 3 Dispersion BMPs 3.1 BMP L611 Concentrated Flow Dispersion 3.1.1 Purpose and Definition Dispersion of concentrated flows from driveways or other pavement through a vegetated pervious area attenuates
WATER SUPPLY & WASTEWATER DISPOSAL STUDY WELLFLEET, MA
 WATER SUPPLY & WASTEWATER DISPOSAL STUDY WELLFLEET, MA 980 Washington Street, Suite 325N Dedham, MA 02026 49 Edge Hill Road Newton, MA 02467 October 2001 TABLE OF CONTENTS EXECUTIVE SUMMARY...1 INTRODUCTION...4
EVALUATION AND APPRAISAL REPORT OF THE INDIAN RIVER COUNTY COMPREHENSIVE PLAN DRAFT SANITARY SEWER SUB-ELEMENT
 EVALUATION AND APPRAISAL REPORT OF THE INDIAN RIVER COUNTY COMPREHENSIVE PLAN DRAFT SANITARY SEWER SUB-ELEMENT 2008 INDIAN RIVER COUNTY COMMUNITY DEVELOPMENT DEPARTMENT 1801 27TH STREET VERO BEACH, FLORIDA
Memorandum #9 [11/17, DRAFT #3] 1
![Memorandum #9 [11/17, DRAFT #3] 1](/thumbs/87/97328534.jpg "Memorandum #9 [11/17, DRAFT #3] 1") Memorandum #9 DATE: January 31, 2017, Revised 11/15/2017 PROJECT NO.: 527116088 TO: Lisa Barrett, Planning Manager FROM: Christopher Dougherty, AICP, Planner CC: Patricia Tyjeski, AICP, Senior Planner
Memorandum #9 DATE: January 31, 2017, Revised 11/15/2017 PROJECT NO.: 527116088 TO: Lisa Barrett, Planning Manager FROM: Christopher Dougherty, AICP, Planner CC: Patricia Tyjeski, AICP, Senior Planner
White Township Municipal Build Out Report
 White Township Municipal Build Out Report Prepared by the State of New Jersey Highlands Water Protection and Planning Council in Support of the Highlands Regional Master Plan: Report on the Results of
Wakulla County Comprehensive Plan July 2013 GOALS, OBJECTIVES AND POLICIES
 GOALS, OBJECTIVES AND POLICIES INFRASTRUCTURE ELEMENT Goal 1: To provide needed public facilities in a manner that protects investments in existing facilities and supports orderly, efficient growth while
OF CONTENTS 14.0 COUNTY OF BRANT...
 TABLE OF CONTENTS 14.0 COUNTY OF BRANT... 14-1 14.1 Definitions... 14-1 14.2 County Of Brant Source Protection Plan Policies... 14-2 14.3 Policies Addressing Prescribed Drinking Water Threats... 14-6 14.4
WQMP AMENDMENT REVIEW CHECKLIST
 State of New Jersey Highlands Water Protection and Planning Council 100 North Road (Route 513) Chester, New Jersey 07930-2322 (908) 879-6737 (908) 879-4205 (fax) www.highlands.state.nj.us WQMP AMENDMENT
PERMITTED USES: Within the MX Mixed Use District the following uses are permitted:
 6.24 - MX - MIXED USE DISTRICT 6.24.1 INTENT: The purpose of the MX Mixed Use District is to accommodate the development of a wide-range of residential and compatible non-residential uses (including major
Pequannock Township Municipal Build Out Report
 Pequannock Township Municipal Build Out Report Prepared by the State of New Jersey Highlands Water Protection and Planning Council in Support of the Highlands Regional Master Plan: Report on the Results
Chapter Nine, Potable Water Subelement City of St. Petersburg Comprehensive Plan
 POTABLE WATER SUBELEMENT Chapter Nine, Potable Water Subelement Sections: 9.1.1 INTRODUCTION 9.1.2 GOAL, OBJECTIVES AND POLICIES ISSUE: Rehab/Upgrade of Potable Water Facilities ISSUE: Extension of Potable
Onsite Water Supply and Sewage Disposal. Department of Environmental Health Washtenaw County, Michigan
 Onsite Water Supply and Sewage Disposal Department of Environmental Health Washtenaw County, Michigan Sewage System Overview Septic Tank Separates liquid wastes from solid wastes Anaerobic breakdown of
2008 Source Water Assessment MISHNOCK WELLHEAD PROTECTION AREA SUMMARY
 2008 Source Water Assessment MISHNOCK WELLHEAD PROTECTION AREA SUMMARY The Kent County Water Authority (KCWA) maintains three wellfields: the Mishnock Wellfield, the Spring Lake Wellfield and the East
Ohio s Sewage Treatment System Rules
 Ohio s Sewage Treatment System Rules Residential Water and Sewage Program Bureau of Environmental Health ODH Sewage Rules Process 1 How is sewage treated across the state? Public sewage system permitted
6.13 Utilities and Service Systems
 6.13 6.13.1 Introduction This section describes impacts for utilities and service systems that would result from construction and operation of the CEQA Alternatives. 6.13.2 Regulatory Setting There are
MITIGATION PLAN SEAWATER INTRUSION
 MITIGATION PLAN SEAWATER INTRUSION A. OVERVIEW The Island County Health Department has identified the western area of Sections 8 and 17, Township 31 North, Range 2 East, W. M. (east of Race Road) as being
Unit 1 - Introduction, Testing Criteria, and Design Criteria 1-1 Introduction 1-2 Testing Criteria Requirements 1-3 System Design Requirements
 Unit 1 - Introduction, Testing Criteria, and Design Criteria 1-1 Introduction 1-2 Testing Criteria Requirements 1-3 System Design Requirements What You Will Learn in This Lesson In this lesson, you will
13.0 CITY OF HAMILTON LYNDEN RURAL SETTLEMENT AREA
 TABLE OF CONTENTS 13.0 CITY OF HAMILTON LYNDEN RURAL SETTLEMENT AREA... 13-1 13.1 Definitions... 13-1 13.2 City Of Hamilton Lynden Rural Settlement Area Source Protection Plan Policies... 13-1 13.3 Policies
Model Riparian Buffer Ordinance.
 Model Riparian Buffer Ordinance. This is a sample riparian buffer ordinance written as an amendment to an existing zoning ordinance. This ordinance complies with the state minimum standards for river corridor
COMMONWEALTH OF MASSACHUSETTS EXECUTIVE OFFICE OF ENERGY & ENVIRONMENTAL AFFAIRS DEPARTMENT OF ENVIRONMENTAL PROTECTION
 COMMONWEALTH OF MASSACHUSETTS EXECUTIVE OFFICE OF ENERGY & ENVIRONMENTAL AFFAIRS DEPARTMENT OF ENVIRONMENTAL PROTECTION ONE WINTER STREET, BOSTON, MA 02108 617-292-5500 DEVAL L. PATRICK Governor TIMOTHY
Comparison State Policy Requirements, Proposed LAMP and Current County Regulations
 Connection to a Public Sewer STANDARD: Prohibits installation of new or replacement Systems when a public sewer is located within 200 feet from a building or a lot that abuts and is served by a public
Pennsylvania s Chesapeake Bay Tributary Strategy Implementation Plan for Sewage Facilities Planning
 The strategy outlined in this guidance document is intended to supplement existing requirements. Nothing in the strategy shall affect regulatory requirements. The information herein is not an adjudication
COUNTY OF MENDOCINO LOCAL AGENCY MANAGEMENT PLAN (LAMP) PART 3
 PART 3") COUNTY OF MENDOCINO LOCAL AGENCY MANAGEMENT PLAN (LAMP) PART 3 3.2 Local Agency Monitoring and Reporting Responsibilities Annual Report. Mendocino County shall submit a report to the Regional Water Quality
COUNTY OF MENDOCINO LOCAL AGENCY MANAGEMENT PLAN (LAMP) PART 3 3.2 Local Agency Monitoring and Reporting Responsibilities Annual Report. Mendocino County shall submit a report to the Regional Water Quality
CAPE COD. Regional Wastewater Management Plan Overview
 CAPE COD Regional Wastewater Management Plan Overview JANUARY 2013 Table of Contents OVERVIEW...1 THE PROBLEM...2 SHARED RESOURCES AND A SHARED PROBLEM...3 PRINCIPLES OF THE CAPE COD REGIONAL WASTEWATER
This is a digital document from the collections of the Wyoming Water Resources Data System (WRDS) Library.
 Library.") This is a digital document from the collections of the Wyoming Water Resources Data System (WRDS) Library. For additional information about this document and the document conversion process, please contact
This is a digital document from the collections of the Wyoming Water Resources Data System (WRDS) Library. For additional information about this document and the document conversion process, please contact