ISBN:
|
|
|
- Maximilian McCoy
- 6 years ago
- Views:
Transcription


1 ISBN: ICSRD 2013 Sustainable Rural Development - Towards a Better World Editorial Boards: 1. Prof. Robert C. Creese, Ph.D. PE. CCE. / West Virginia University, USA 2. Prof. Yan Wang, Ph.D. / Georgia Institute of Technology, USA 3. Prof. Dr. Budi Indra Setiawan / Bogor Agricultural University, INDONESIA 4. Prof. Dr. Taku Nishimura / The University of Tokyo, JAPAN 5. Prof. Dr. Zulkifli Yusop / Universiti Teknologi Malaysia, MALAYSIA 6. Dr. Hideto Ueno / Ehime University, JAPAN 7. Dr. Tetsuya Araki / The University of Tokyo, JAPAN 8. Dr. Yasei Oikawa / Tokyo University of Agriculture and Technology, JAPAN COLLABORATIVE: PARTNERS:
2
3 OF INTERNATIONAL CONFERENCE ON SUSTAINABLE RURAL DEVELOPMENT 2013 Sustainable Rural Development Towards a Better World Purwokerto, Central Java, INDONESIA, August 25-26, 2013 Editorial Board: 1. Prof. Robert C. Creese, Ph.D. PE. CCE. / West Virginia University, USA 2. Prof. Yan Wang, Ph.D. / Georgia Institute of Technology, USA 3. Prof. Dr. Budi Indra Setiawan / Bogor Agricultural University, INDONESIA 4. Prof. Dr. Taku Nishimura / The University of Tokyo, JAPAN 5. Prof. Dr. Zulkifli Yusop / Universiti Teknologi Malaysia, MALAYSIA 6. Dr. Hideto Ueno / Ehime University, JAPAN 7. Dr. Tetsuya Araki / The University of Tokyo, JAPAN 8. Dr. Yosei Oikawa / Tokyo University of Agriculture and Technology, JAPAN OF INTERNATIONAL CONFERENCE ON SUSTAINABLE RURAL DEVELOPMENT 2013 Published by: Department of Agricultural Engineering, Jenderal Soedirman University Jl. Dr. Soeparno, Karangwangkal, Purwokerto Phone/Fax
4 OF INTERNATIONAL CONFERENCE ON SUSTAINABLE RURAL DEVELOPMENT 2013 Sustainable Rural Development Towards a Better World Purwokerto, Central Java, INDONESIA, August 25-26,
5 OF INTERNATIONAL CONFERENCE ON SUSTAINABLE RURAL DEVELOPMENT 2013 Sustainable Rural Development Towards a Better World Purwokerto, Central Java, INDONESIA, August 25-26, 2013 PREFACE i
6 OF INTERNATIONAL CONFERENCE ON SUSTAINABLE RURAL DEVELOPMENT 2013 Sustainable Rural Development Towards a Better World Purwokerto, Central Java, INDONESIA, August 25-26, 2013 ii
7 OF INTERNATIONAL CONFERENCE ON SUSTAINABLE RURAL DEVELOPMENT 2013 Sustainable Rural Development Towards a Better World Purwokerto, Central Java, INDONESIA, August 25-26, 2013 PREFACE Distinguished Guests, Speakers and Participants, Welcome to ICSRD-2013! I am so pleased to see so many colleagues, professors, researchers and students from around the world in one place! It gives me a great pleasure to welcome all of you most cordially at the official opening of the ICSRD-2013 in our little yet beautiful city: Purwokerto, Indonesia. ICSRD-2013 is hosted by Department of Agricultural Engineering, Jenderal Soedirman University (UNSOED), Indonesia. This conference is co-sponsored by Directorate General of Higher Education, Kemdikbud, Republic of Indonesia and Jenderal Soedirman University, Purwokerto, Indonesia. I would like to convey our indebtedness to the President of UNSOED for the generous contributions. The ICSRD-2013 provides a very unique opportunity for all of us to share our ideas and recent findings on all aspects of sustainable rural development. Here at this conference we can meet colleagues from our own specialty areas or ones with same passions in sustainable rural development. The ICSRD Steering Committees has been busy to bring an exciting array of session topics and discussions. An impressive list of keynote speakers and invited speakers from US, Japan, India, Malaysia and Indonesia has been assembled for the opening ceremony and plenary sessions. I would like to take this moment to express a very special thank you for their involvement and commitment. Ladies and Gentlemen, Your support and participation have made the ICSRD-2013 a successful event. ICSRD-2013 is representing by extraordinary professionals from 9 different countries. The quality of technical programs is excellent, and the spectrum of topics is broad and current. I would like to thank the members of the Organizing committee who have helped to organize the meeting. The ICSRD-2013 Organizing Committee members have worked extremely hard to prepare this outstanding conference, despite the limited preparation time. We only have 3 months from the time we officially announce the conference to the opening ceremony. We are so proud to have 127 participants, representing 9 countries and 15 Indonesian universities and government agencies. Enjoy your participation in the ICSRD We are committed to provide the utmost hospitality. Please feel free to ask questions or concerns. We are here to serve you. Wish each one of you a memorable time visiting our city, our country. Thank you and have a wonderful day! Warm Regards, Sidharta Sahirman, Ph.D. ICSRD-2013 Chair iii
8 OF INTERNATIONAL CONFERENCE ON SUSTAINABLE RURAL DEVELOPMENT 2013 Sustainable Rural Development Towards a Better World Purwokerto, Central Java, INDONESIA, August 25-26, 2013 iv
9 OF INTERNATIONAL CONFERENCE ON SUSTAINABLE RURAL DEVELOPMENT 2013 Sustainable Rural Development Towards a Better World Purwokerto, Central Java, INDONESIA, August 25-26, 2013 LIST OF CONTENTS v
10 OF INTERNATIONAL CONFERENCE ON SUSTAINABLE RURAL DEVELOPMENT 2013 Sustainable Rural Development Towards a Better World Purwokerto, Central Java, INDONESIA, August 25-26, 2013 vi
11 OF INTERNATIONAL CONFERENCE ON SUSTAINABLE RURAL DEVELOPMENT 2013 Sustainable Rural Development Towards a Better World Purwokerto, Central Java, INDONESIA, August 25-26, 2013 Preface... List of Contents... iii vii A. KEYNOTE SPEAKERS 1. Sustainability Innovation Through First-Principles Modelling and Simulation Lijuan He, Masoumeh Aminzadeh, and Yan Wang Utilization of Organic Wastes in Local Area to Improve Plant Production and Soil Quality for Building Sustainable Agricultural Systems in Japan Hideto UENO B. INVITED SPEAKERS 1. Homegarden Intensification through Cooperation among Different Stakeholders: Case Studies from Indonesia and Vietnam Yosei OIKAWA, Vu-Linh NGUYEN, and Masaaki YAMADA Field Evaluation of Infiltration Models under Oil Palm Plantation: Stemflow and Throughfall Areas M. Askari, F.A. Ahmad, A.M. Mohd Sayuti, C.B.S. Teh, Suhartono, H. Saito, Z. Yusop, and K. Wijaya Environmental Sustainability of Biodiesel Production in Indonesia Armansyah H.Tambunan Managing Concern: Indonesian Sustainability in Rice Production, A Rice Breeding Perspective Suprayogi C. SUPPORTING PAPERS 1 st Topic: Sustainable Agriculture, Agricultural Productivity, and Modern Technologies 1. Enhanced Water Use Efficiency for Irrigated Rice in Indonesia with System of Rice Intensification (SRI) Chusnul Arif, Budi Indra Setiawan, Hanhan Ahmad Sofiyuddin, Lolly Martina Martief, Masaru Mizoguchi, and Ardiansyah Direct Seeding Plantation Rice System is One of Alternative in Agriculture Water Conservation Management Engineering at Farm Level Nurpilihan Bafdal Modeling Water Movement in Limited Strip-Tillage with Strip Shallow Irrigation for Crop Cultivation Concept Y. I. Intara and A. Sapei Circular-Shaped Emitter as Alternative to Increase Irrigation Efficiency Satyanto K. Saptomo, Budi I. Setiawan, KMS Ferry Rahman, Yudi Chadirin, Popi R. D. Mustaningsih, and Chusnul Arif Suitability Analysis of East Borneo Marginal Lands for Food Estate Sidharta Sahirman, Muhammad Rifan, and Ardiansyah Study of Rice Growth and Yield as Well as the Available of N, P, K Soil Content Given by Local Micro Organisms in System of Rice Intensification Rice Fields in the Cilacap District Windi Haryanto, Ardiansyah, and Ismangil Wireless Sensor Network (WSN) Application using Zigbee for Monitoring Displacement Object Dwi Kurniawan, Imron Rosyadi, and Azis Wisni Widhi N vii
12 OF INTERNATIONAL CONFERENCE ON SUSTAINABLE RURAL DEVELOPMENT 2013 Sustainable Rural Development Towards a Better World Purwokerto, Central Java, INDONESIA, August 25-26, Preliminary Experimental Investigation on Use of Low-Cost Components to Construct Instrument for Nondestructively Measuring Optical Characteristics of Golden Banana (Musa acuminata) A. Margiwiyatno, Siswantoro, and R. Ediati nd Topic: Biodiversity, Agriculture, and Food Security 1. Mathematical Model for Estimating Staple Food Stock in Temanggung Regency Anton Timur Application of Natural Preservation on Coconut Sap and Quality Profile Evaluation of Solidified Coconut Sugar Karseno, Tri Yanto, Pepita Haryanti, and Retno Setyawati Ge Interaction Assesment of Sr Sweet Corn Yield Based on Additive Main Effect and Multiplicative Interaction (AMMI) and Biplot in West Java Syafi i M, Melati R, Waluyo B, and Ruswandi D Improving Beef Cattle Production System for Sustainable Rural Development in Central Java Akhmad Sodiq, Suwarno and Arif Harnowo Sidhi Biotic Investigation on Acacia Species in Kordofan Region Sudan Against Climate Change Maymoona A. Eisa, Zeinab M. Hammad, and Osman E. A. Abdelkareem Physical and Chemical Cracteristics of Modified Corn Starch Nur Aini, V. Prihananto, and Gunawan Wijonarko Amino Acids Composition and Minerals Content of Potato Tubers Cultivar Eigenheimer and Granola C. Wibowo and N. Bafdal Dimensional Analysis for Measuring Coefficient of Unit Surface Conductance of Steelbalss for Non Cooking Oil Frying Application Siswantoro, Sidharta Sahirman, and Agus Margiwiyatno rd Topic: Renewable Energy for Sustainable Rural Development 1. A Grid Tied Photovoltaic System Using Three-Phase Five-Level Current- Source Inverter with Controlled Reactive Power Suroso, Daru Tri Nugroho, Winasis, and Toshihiko Noguchi A Comprehensive Evaluation Effort of Current Situation in Kupang City as Local Government to Achieve Indonesia Government Target in Reducing CO 2 E Emission Based on Analysis of Kupang Input-Output Table Adrianus AMHEKA, Yoshiro HIGANO, Takeshi MIZUNOYA, and Helmut YABAR th Topic: Energy, Environment, and Sustainable Development 1. Sustainable Development through Effective Waste Management in India: Opportunities at Community Level Upendra D. Patel, Rajiv K. Sinha, and Margi U. Patel Hydrothermal Synthesis of AG 3 PO 4 Photocatalyst for Phenol Decomposition under Visible Light Irradiation Uyi Sulaeman, Eva Vatonah, Anung Riapanitra, Ponco Iswanto, Shu Yin, and Tsugio Sato viii
13 OF INTERNATIONAL CONFERENCE ON SUSTAINABLE RURAL DEVELOPMENT 2013 Sustainable Rural Development Towards a Better World Purwokerto, Central Java, INDONESIA, August 25-26, th Topic: Environmental and Social Impact Assessment of Rural Development Programs 1. Enhancing Social Capital of Local Chicken Farmers in Cianjur, West Java for Sustainable Rural Development Moch. Sugiarto In Situ Bioremediation of Glyphosate Herbicide Using Trichoderma Viride Strain FRP 3 Novi Arfarita, Budi Prasetya, Yulia Nuraini, and Tsuyoshi Imai A Sustainable Smallholder Rubber Model: A Partnership between Private Company and Local Communities Muhammad Ridwansyah Agricultural Manpower Dynamic and Change of Economic Structure in Central Java Timotius Setiawan Human Capital and Survival of Small Scale Food Processing Firms Under Economic Crisis in Central Java Indonesia Palmarudi Mappigau and Agussalim M Impact of Climate Change on Hydrology of Gunungsewu Karst Area and Local Community Adaptation Sudarmadji Impack of Development in Bogor Municipality on The Local Greenhouse Gas Emission Arief Sabdo Yuwono Comparative Study Agriculture Development Programs for Poverty Reduction Evidences from Indonesia and China Muhamad Rusliyadi Sustainable Livelihood Strategies after Merapi Volcanic Eruption (Aspects of Sustainable Rural Development) Nugroho Hari Purnomo and Widodo Hariyono Application of Small Scale Program of Farmer Participation on Land and Water Conservation Measures to Simulate Realistics Waterhed Management Sahid Susanto, Chandra Setyawan, and Sukirno th Topic: Community Health 1. Criterias Identification of Eye Diseases in Order to Develop an Expert System for Early Diagnosis of Glaucoma Retno Supriyanti, Guruh Syahroni, Sri Wisnu Respati, Yogi Ramadhani, and Tutik Ida Rosanti The Hepatoprotective Effect of Ethanol Extract of Plantain (Plantago major L.) on Drug Induced Hepatotoxic Rat (Rattus norvegicus) Model E Sutrisna, A A Fitriani, I A Salim, A M Maskoen, M Sujatno, and H S. Sastramihardja Potential Analysis of Cottonwood Parasite (Dendropthoe Pentandra) Stem Extract in Decreasing of Mutant P53 Protein Expression on Cervical Cancer Cell (Hela Cells) in Vitro Gamal and Efriko Septananda Wareness and Willingnes to Health Policy: An Empirical Study with Reference to Malang Indonesia Gamal ix

14 OF INTERNATIONAL CONFERENCE ON SUSTAINABLE RURAL DEVELOPMENT 2013 Sustainable Rural Development Towards a Better World Purwokerto, Central Java, INDONESIA, August 25-26, Nigella sativa Gel Improves Granulation and Re-Epithelialization Tissue of Diabetic Rats Yunita Sari, Dhadhang Wahyu K, Saryono, Arington IG, and Nakatani Toshio Posters 1. Green House Effect Solar Dryers: An Appropriate Technology Pro-The Poor Yuwana Initial Screening of Green Super Rice (GSR) Lines and Sub 1 Gene Containing Varieties for Seedling Stage Drought Tolerance Untung Susanto, Rina Hapsari Wening, Made Jana Mejaya, and Jauhar Ali Climate Variability: Need for Collective Action in Conserving Agro- Biodiversity K.C. Siva balan, B. Swaminathan, and S. Nithila Application of Irradiation Mutation Technique Into Early Maturing Rice Variety ( Day) for the Development of Improved Agronomic Performance-Ultra Early Maturing (< 90 Days) Rice Variety Mohamad Yamin Samaullah and Untung Susanto On Farm Trial of Green Super Rice (GSR) Pre-Released Variety in Raifed Lowland Areas of Indramayu Mohamad Yamin Samaullah, Untung Susanto, and Made Jana Mejaya Life Cycle GHG Emission and Energy Consumption for Production of Biodiesel Using Catalyst from Crude Palm Oil and Curde Jatropha Curcas Oil in Indonesia Kiman Siregar, Armansyah H. Tambunan, Abdul K. Irwanto, Soni S. Wirawan, and Tetsuya Araki Prototype Reactor Design for Biodiesel Production Based Coconut Oil Nurul Rizki Ramadhan, Arief RM Akbar, and Susi Response Surface Methodology for Regeneration of Lithium Bromida in Absorption Refrigeration System Using Vacuum Membrane Distillations Bayu Rudiyanto, Tsair-Wang Chung, and Armansyah H. Tambunan Biodiesel Production Based Coconut Oil by Esterification and Transesterification Process Nurul Rizki Ramadhan, Arief RM Akbar, and Susi Assesssment of Socio Economic and Environmental Impact of Community Water Supply Schemes in Kandy District D.M.C.S. Mimrose, E.R.N. Gunawardena, and H.B. Nayakakorala Global Rice Trade and Some Issues of Restriction Evi Nurifah Julitasari Bare Soil Surface Temperature Determination from Energy Balance Equation Ardiansyah, Sho Shiozawa, and Budi Indra Setiawan Hydram Pump for Water Supply at Banteran Village, Sumbang Sub-District, Purwokerto Putri Rieski Imanda, Reza Kusuma N, Ardiansyah, and Afik Hardanto Isolation and Identification of Indigenous Microbe for Production of Bioethanol from Nypa Fruticans Wiludjeng Trisasiwi, Gunawan Wijonarko, and Melisa Riska Putri x
15 KEYNOTE SPEAKERS
16
17 KEYNOTE SPEAKERS SUSTAINABILITY INNOVATION THROUGH FIRST-PRINCIPLES MODELLING AND SIMULATION Lijuan He, Masoumeh Aminzadeh, and Yan Wang Georgia Institute of Technology, Atlanta, USA s: ABSTRACT The rapid growth of global population demands food and energy consumption. To meet the world s future food and sustainability needs for biofuels and renewable materials, organizations of research and development (R&D) face a grand challenge of providing innovative and viable solutions to meet the pace of such demands. The traditional experimental centered R&D approach cannot bring new materials and solutions fast and cost-effective enough. The modeling and simulation (M&S) based approach can help accelerate the new materials development process and provide necessary guidance for physical prototypes and design optimization. In this paper, a first-principles M&S approach is proposed to drive sustainability innovation. From a set of desired material properties, M&S methods in different time and length scales can be used to simulate the functions of materials. The outputs of the simulation are the estimation of macroscopic properties which can be used as metrics to evaluate and optimize the atomic configuration for the design purpose. The proposed approach is demonstrated by examples of converting cellulose to amylose and interaction between glucose and water. Keywords: modeling and simulation, biomass production, density functional theory, molecular dynamics INTRODUCTION The global demand for food could be doubled in the next four decades because of the rapid growth of population. The food and biofuels consumptions bring double challenges to agriculture world-wide. Solutions of renewable materials, biomanufacturing, sustainable food and energy production are some of the major research issues for researchers in both academia and industry. How to generate innovative solutions in fast-pace and cost-effective ways is always a central topic. Scientists and engineers in research and development (R&D) organizations traditionally depend on extensive laboratory experiments to try out possible solutions, then scale-up is sought to bring the new materials to production scales. The downside is its long development cycle, because the trials-and-errors in physical experiments require substantial R&D times. In recent years, modeling and simulation (M&S) has been adopted by researchers as one of the three pillars for scientific advancement, in addition to theory and experiment. M&S based research requires less resource than physical experiments in general. It only requires computers, which nowadays have become commodities even in most developing countries. In addition, various M&S tools are openly available for researchers to use. The capital investment threshold for M&S related research is much lower than those that require special experimental equipment. More importantly, computational results from M&S studies can provide the guidance and rationale for more efficient experiments instead of pure trials-and-errors. This will significantly reduce the development time for new products and materials. M&S based R&D have been extensively used in industries such as manufacturing, medicine, transport, finance, and others. Computer models of new products are generated, evaluated, and optimized by the so-called virtual prototypes before physical prototypes are built and tested. For new materials development, molecular level simulation tools are also available, such as molecular dynamics (MD) [1, 2]. and kinetic Monte Carlo (KMC) [3]. They provide insights of detailed chemical and physical processes at atomistic level. These details are important to design new materials or processes, 1
18 KEYNOTE SPEAKERS Sustainable Rural Development-Towards A Better World Purwokerto, August 25-26, 2013 such as new fertilizer for grain production, new catalyst for biofuel production, biodegradable packaging materials, and many others. In this paper, we present a first-principles approach to develop sustainable solutions for food processing. First-principles or ab initio approaches rely on the foundational propositions or laws of physics to create models. In contrast, empirical approaches build models from experimental observations. Various empirical or semi-empirical approaches have been developed to model and simulate some processes, including the widely used MD. The empirical models are based on experimental data fitting (e.g. to generate empirical force fields or potentials in MD) instead of established laws of physics. They can be used to replicate phenomena but do not provide the fundamental understanding. In addition, experimental data at nanoscales are not easy to collect. Insufficient data is the major hurdle to build accurate and precise empirical models. In contrast, first-principles modeling and simulation approaches, such as quantum Monte Carlo (QMC) [4] methods and the density functional theory (DFT) [5], solve the fundamental Schrödinger equation to find electronic configurations thus the system potential energy, which have been applied in computational chemistry and physics. Theoretically all physical and chemical properties can be computed and predicted precisely by solving the Schrödinger equation if there were no computational limitation. The first-principles simulation approach can reduce the dependency of new materials development on experiments. Particularly, new chemicals are being generated in the processes, which could potentially pose risks to environment and safety. Future production of nanomaterials in large quantity should ensure that it does not put employees and general public in danger. Risks associated with manufacturing processes should be assessed at conceptual stages of process design. To avoid the unnecessary risks of conducting empirical studies, first-principles simulation approaches are extremely valuable to assess unknown effects of any new chemicals without physical experiments. In this paper, we demonstrate that DFT and MD simulations can be used in designing the processes in food production. Cellulose, one of the most abundant renewable polysaccharide on earth, cannot be digested by human beings directly. It would be significant to the food engineering if cellulose can be cost-effectively converted to amylose which is one type of the starch that is one of the most important dietary components for human beings. Here the conversion from cellulose to amylose is studied using DFT simulation. The process involves transition from β-d-glucose to α-d-glucose units. In order to better understand the process, the transition from β-d-glucose to α-d-glucose is studied as well by DFT simulation. In addition, the interaction between glucose and water is studied using MD simulation. In the remainder of the paper, nanoscale M&S tools are introduced in Section II. The proposed first-principles multiscale simulation framework is presented in Section III. The demonstrations of this framework for food processing are described in Section IV. NANOSCALE MODELING AND SIMULATION TOOLS In this section, the most used nanoscale M&S tools are introduced, including density functional theory, molecular dynamics, and kinetic Monte Carlo simulation. Density Functional Theory DFT simulates electronic structure at atomistic scale. Its formulation is based on a theorem of Hohenberg and Kohn, which states that the ground-state properties of a many-electron system may be obtained by minimizing a functional of the electron number density. With the electron density expressed in terms of the one-electron wave functions of the non-interacting system, the energy functional includes the components of kinetic energy of the non-interacting system, the interaction between the electron and ions as the potential energy, the Hartree term that represents pair-wise electron-electron Coulomb repulsion, and an exchange-correlation potential that approximates the many-particle interactions. By minimizing the total energy functional, one could find the ground-state wave functions and thus the total energy level. Numerically the Kohn-Sham equations as the approximated version of Schrödinger equation are solved iteratively until self-consistent solutions are obtained. 2
19 KEYNOTE SPEAKERS Molecular Dynamics MD is a simulation approach to model molecular systems with physical interaction between particles by solving the Newton's equations of motion. The interaction is characterized by the inter-atomic potential energy, which is a function of atomic positions. The physical forces between atoms are computed as the gradient of the potential, which leads to the changes of atoms' momenta and subsequently positions. For a system with N atoms in a three-dimensional spatial domain with Cartesian coordinates, its 6N dimensional phase space consists of 3N values of positions and 3N values of momenta. The state of the system is a point in the phase space, and the MD simulation is to numerically compute a trajectory in the phase space. MD simulation is designed to describe molecules behaviors at time scales from femto seconds to nano seconds. It is inefficient in simulating long-term behavior over micro seconds or longer. Because most computational time is spent on thermal behaviors of atoms at the femto-second scale, the most interesting behaviors are actually much slower and are rare events, which are hardly observable in simulation. During a physical or chemical process, changes of macroscopic properties indicate the occurrence of a process. MD simulation provides an insight into what is the fundamental reason at molecular level that causes these macroscopic changes. Statistical thermodynamics allows to infer macroscopic properties from positions of molecules which are outputs of MD simulation [6]. Kinetic Monte Carlo In contrast to MD, KMC is much more efficient in simulating the infrequent transition or reaction processes with longer times than thermal vibrations. KMC does not simulate a system based on its continuous evolution along time as in MD. Instead, it defines a discrete set of states of the system (i.e. all possible configurations). It simulates state transitions between states which are triggered by events (also called processes in chemistry-oriented literature) that cause state changes. In physical processes, each snapshot of the system at a time where atoms are located in space is a state of the KMC model. In chemical reactions, the numbers of different species naturally form the states. Reactions themselves are the events. FIRST-PRINCIPLES MULTISCALE SIMULATION FRAMEWORK FOR MATERIALS AND PROCESS DESIGN In this section, we present a first-principles multiscale simulation framework for materials design. The framework is shown in Figure 1. From a set of desired material properties, an initial representative atomic configuration is determined. The first principles simulation method such as DFT is used to calculate the potential energy, which can determine the inter-atomic potential as the input of MD simulation. In addition, DFT is also used to search stable states with minimum energy on a potential energy surface (PES) and transition states that are associated with reactions or transitions. With the information of reaction or transition rates as the inputs, KMC simulation can be conducted to simulate reactions or phase transitions. The outputs of the MD and KMC simulation are estimations of macroscopic properties, which can be used as metrics to evaluate and optimize the atomic configuration for the purpose of design. The simulation results provide engineers and scientists a comprehensive understanding of the material properties at different length and time scales. Atomistic simulation results can also help visualize the process of the interactions between molecules. 3
20 KEYNOTE SPEAKERS Sustainable Rural Development-Towards A Better World Purwokerto, August 25-26, 2013 Material properties Model representative atomic configuration Update MD model Input Potential energy Output Update KMC model Input PES minima: ->states PES saddle points: ->transition rates Output First principles simulation (DFT/QMC) Figure 1. The proposed first principles multiscale simulation framework for material design Simulation methods are developed with their respective target length and time scales. Scale complexity is inherent in simulation during materials design. At the quantum scale, electrons behave according to the first principles of quantum mechanics. At the atomistic scale, atoms and molecules aggregate or disperse based on the potential energy level as a result of the electron density distribution. At the mesoscale or larger, collective behavior of all atoms and molecules can be observed. Based on the observed behavior of all atoms and molecules, the material properties can be analyzed. For length scale, simulation at the atomistic scale is required for understanding the structures at nanoscale, yet the analysis of material properties requires the simulation at the mesoscale or larger. For time scale, electronic and molecular configurations change at the scales of femto seconds or shorter, whereas the changes of material structures at mesoscale or larger may last seconds. Computational efficiency and effectiveness should be both considered in simulation for materials and process design. In addition to calculation of macroscopic properties, MD visualization also provides insight into how molecules interact with each other during a process. The visualization can be used to verify some propositions that relate molecular characteristics to observable chemical and physical properties. There are many propositions that discuss how different types of soluble material dissolve in water. They suggest what molecular characteristics increases the solubility of the materials in water. For example, materials with permanent dipoles are soluble in water to a very large extent. Solution of some di-atomic molecules is justified by induced dipoles due to the strong permanent dipoles of water molecules. The high solubility of salt in water can be attributed to the inter-atomic forces between ion charges and water dipoles [7]. MD visualizations provide valuable knowledge of the relation between the chemical structure of molecule and its macroscopic properties, which can play an important role in the study of food characteristics and food processing. DEMONSTRATIONS In this section, we illustrate the first-principles multiscale simulation framework by three examples, the transition from β-d-glucose to α-d-glucose, the transition from cellulose to amylase, and the interaction between α-d-glucose and water. 4


21 KEYNOTE SPEAKERS Cellulose, a chain of several hundred to ten thousand of anhydroglucose units linked by β-1,4-glycosidic bonds, is a common structure component of plant cell walls. Cellulose cannot be digested by human beings directly. Amylose, a linear chain of α D-glucose units linked by α-1,4-glycosidic bonds, is one type of the starch. With the interaction of the enzyme, part of the anhydroglucose units in non-food cellulose can be converted into amylose. It would be significant to food engineering if a systematic way to design enzyme for such conversion is available. A well-designed enzyme could significantly reduce the cost of the transformation from cellulose to amylose. Here, we demonstrate how the first principles multiscale simulation scheme can be used to design the enzyme systematically. Cellulose and amylose are composed by β-d-glucose and α-d-glucose units separately. The transition from cellulose to amylose involves breaking the β-1,4-glycosidic bonds and formation of the α-1,4-glycosidic bonds. In order to better understand the transition process from cellulose to amylose, the transition from β-d-glucose to α-d-glucose is studied first. Then the transitions from cellobiose to amylose with and without the interaction of enzyme are studied separately. Transition from β-d-glucose to α-d-glucose The crystal structure of β-d-glucose (C 6 H 12 O 6 ) is orthorhombic with a 9.29, b 12.65, c 6.7 Ǻ [8]. The crystal structure of α-d-glucose is also orthorhombic but with a 10.36, b 14.84, c 4.97 Ǻ [9]. For both β-d-glucose and α-d-glucose, each unit cell includes four molecules and the space group is P Here, we simplify the crystal structure by including only one molecule with reduced lattice length due to the limits of computation. Figure 2 shows the structure of β-d-glucose and α-d-glucose with only one molecule in one unit cell. (a) β-d-glucose (b) α-d-glucose Figure 2. Comparison between β-d-glucose to α-d-glucose Geometry optimization or relaxation based on the ab initio molecular dynamics (CPMD) is performed first on both β-d-glucose and α-d-glucose using the software tool Quantum-Espresso [10]. Since the Quantum-Espresso requires the initial and final states have the same lattice length, the size of the unit cell for both structures is set to be a 4.6, b 6.56, c 6.19 Ǻ. When the optimized structures with minimum energy for the initial and final states are obtained, the transition path search is conducted using the built-in the nudged elastic band (NEB) method in Quantum-Espresso. A total of seven images are used to represent the path. The resulted minimum energy path (MEP) is shown in Figure 3. The saddle point is located at the 5 th image. The MEP represents the most likely transition path with the saddle point that indicates the activation energy for the transition. 5


 [12].")
22 KEYNOTE SPEAKERS Sustainable Rural Development-Towards A Better World Purwokerto, August 25-26, 2013 Energy (ev) Initial state Final state Figure 3. Results of MEP for transition from β-d-glucose to α-d-glucose by the NEB method Transition from cellulose to amylose During the process of converting cellulose to amylose, cellulose is firstly enzymatically hydrolyzed into cellobiose which is a major product of primary enzymatic cellulose hydrolysis[11]. Then with the interaction of cellobiose phosphorylase (CBP), cellobiose is converted into glucose-1-phosphate (G-1-P) and D-glucose. Finally, amylose is synthesized from G-1-P with the interaction of potato αpg (PGP) [12]. Here, we only study the process from cellobiose to amylose with the unit cell defined as two linked glucose molecules. The crystal structure of cellubiose is monoclinic with a , b , c Ǻ [13]. The detailed information of the atomic coordinates in one unit cell is included in [13].The structures are shown in Figure 44. (a) cellobiose (b) glucose-1-phosphate (c) amylose Figure 4. Comparison between cellobiose and amylose 6


23 KEYNOTE SPEAKERS Energy (ev) Initial state Final state Figure 5. Results of MEP for transition from cellobiose to amylose by the NEB method Energy (ev) Initial state Final state Figure 6. Results of MEP for transition from cellobiose to glucose-1-phosphate by the NEB method Similar to the transition of glucose, geometry optimization is first performed for the structure of the cellobiose and amylose. Then the built-in NEB method in Quantum Espresso is used to search the saddle point. After the NEB search, the energy level of seven images are ev, eV, eV, eV, eV, eV, eV respectively. The located saddle point is the 3 rd image, as shown in Figure 5. The effect of the enzyme to the energy barrier is studied. Here, we only study the conversion process from cellobiose to G-1-P and D-glucose. Here the HPO 4 2 is used as the enzyme. The parameters of bond length and angles for HPO 4 2 can be found in [14]. The same procedure is applied as we did to the transition of glucose. The energy level of six images are e 7 V, eV, e7V, eV, eV, eV respectively. The located saddle point is the 4 rd image, as shown in Figure 6. 7


24 KEYNOTE SPEAKERS Sustainable Rural Development-Towards A Better World Purwokerto, August 25-26, 2013 Interaction between α-d-glucose and water Here we use MD to simulate and visualize the interaction between α-d-glucose and water. Glucose is a macromolecule consisting of 24 atoms. They have little tendency to dissolve in other solutes. Chemists suggest that their solutes usually have some distinguishing specific characteristics such as strong permanent dipoles. MD simulation of water and glucose solution can visualize the interaction of glucose macromolecule with water as well as how glucose molecules are surrounded by water molecules. The orientation of water molecules around glucose molecules suggests which types of forces or induced dipoles cause the solution of glucose into water. These conclusions drawn based on MD visualization provide insight into what makes water a good solute for glucose. LAMMPS [15] is used in this study. A simulation box consisting of 100 water molecules and 10 glucose molecules are built. Periodic boundary conditions are selected so as to reduce the effects of physical boundary. The internal structure of molecules is constrained by the SHAKE algorithm [16]. The simulation is performed under isothermal-isobaric ensemble at the constant temperature of 300 K. A glucose molecule in simulation is shown in Figure 7. Figure 7 shows a snapshot of the simulation. A molecule of glucose is surrounded by a large number of water molecules. The associated dipole orientations of the water molecules are shown. By close investigation of the MD snapshots, it is seen that the water molecule dipoles are oriented such that they are aligned with the expected induced dipoles of glucose. In other words, the electronegative sides of water dipoles are directed such that they attract the electropositive sides of glucose as expected. This indeed is known to be the most significant intermolecular force that makes it possible for glucose to dissolve in water. Figure 7. Glucose molecule built for MD simulation Figure 8. A snapshot of simulation of interaction of glucose molecule with water (pink and cyan represent O and H atoms of water; green, red, and blue represent C, O, and H atoms of glucose) 8
25 KEYNOTE SPEAKERS CONCLUDING REMARKS In this paper, a first-principles multiscale simulation framework for material and process design is presented. From a set of desired material properties, an initial representative atomic configuration can be determined. Then the first-principles approach such as DFT is used to determine the potential energy. With the information of potential energy, simulation approaches are used to evaluate material properties at their respective time and length scales. The outputs of the simulation are estimation of the macroscopic properties which can be used as metrics to evaluate and optimize atomic configuration for design purpose. In addition, the simulation results provide engineers and scientists a comprehensive understanding of the material properties at different scales. The framework is demonstrated by three examples. For the transition from β-d-glucose to α-d-glucose as well as transition from cellulose to amylose is conducted by using DFT approach in Quantum Espresso. The interaction between glucose and water is studied using MD simulation. Here we only focus on visualizing the interaction between glucose and water, which is an important aspect of MD simulation study. As an extension, DFT can be used to calculate energy of various food and biofuel systems at nanoscale. Once the MEP and saddle points on PES are estimated, the associated rates for reactions and transitions can be calculated. MD simulation can be used to calculate the properties of the process. The calculated reaction and transition rates are also the inputs for KMC simulation. KMC can simulate molecular systems that are much larger than what MD can do. ACKNOWLEDGEMENT This work was supported in part by the NSF grant CMMI REFERENCE [1]. J.A. McCammon, G.B. R., M. Karplus, Dynamics of folded proteins, Nature, 267 (1977) 16. [2]. T. Hansson, C. Oostenbrink, W. van Gunsteren, Molecular dynamics simulations, Curr. Opin. Struct. Biol., 12 (2002) [3]. A.F. Voter, Introduction to the kinetic Monte Carlo method, in: Radiation Effects in Solids, Springer, 2007, pp [4]. D. Ceperley, B. Alder, Quantum monte carlo, Science. v231, 555 (1986). [5]. R.G. Parr, Density functional theory, Annual Review of Physical Chemistry, 34 (1983) [6]. L.J. Porter, J. Li, S. Yip, Atomistic modeling of finite-temperature properties of β-sic. I. Lattice vibrations, heat capacity, and thermal expansion, J. Nucl. Mater., 246 (1997) [7]. J.C. Kotz, P.M. Treichel, G.C. Weaver, Chemistry & chemical reactivity, Thomson Brooks/Cole, [8]. W. Ferrier, The crystal and molecular structure of beta-d-glucose, Acta Crystallographica, 16 (1963) [9]. T. McDonald, C. Beevers, The crystal and molecular structure of alpha-glucose, Acta Crystallographica, 5 (1952) [10]. P. Giannozzi, S. Baroni, N. Bonini, M. Calandra, R. Car, C. Cavazzoni, D. Ceresoli, G.L. Chiarotti, M. Cococcioni, I. Dabo, QUANTUM ESPRESSO: a modular and open-source software project for quantum simulations of materials, J. Phys.: Condens. Matter, 21 (2009) [11]. Y.H.P. Zhang, L.R. Lynd, Toward an aggregated understanding of enzymatic hydrolysis of cellulose: noncomplexed cellulase systems, Biotechnol. Bioeng., 88 (2004) [12]. C. You, H. Chen, S. Myung, N. Sathitsuksanoh, H. Ma, X.-Z. Zhang, J. Li, Y.-H.P. Zhang, Enzymatic transformation of nonfood biomass to starch, Proceedings of the National Academy of Sciences, 110 (2013) [13]. S. Chu, G. Jeffrey, The refinement of the crystal structures of-d-glucose and cellobiose, Acta Crystallographica Section B: Structural Crystallography and Crystal Chemistry, 24 (1968)
26 KEYNOTE SPEAKERS Sustainable Rural Development-Towards A Better World Purwokerto, August 25-26, 2013 [14]. B. Schneider, M. abel, P. Hobza, Geometry of the phosphate group and its interactions with metal cations in crystals and ab initio calculations, Journal of the American Chemical Society, 118 (1996) [15]. LAMMPS. [16]. J.-P. Ryckaert, G. Ciccotti, H.J. Berendsen, Numerical integration of the cartesian equations of motion of a system with constraints: molecular dynamics of n-alkanes, Journal of Computational Physics, 23 (1977)
27 KEYNOTE SPEAKERS UTILIZATION OF ORGANIC WASTES IN LOCAL AREA TO IMPROVE PLANT PRODUCTION AND SOIL QUALITY FOR BUILDING SUSTAINABLE AGRICULTURAL SYSTEMS IN JAPAN Hideto Ueno Faculty of Agriculture, Ehime University, Japan ABSTRACT Resource management in local area has become one of the most important issues in agriculture. Modern agriculture system requires a higher amount of fossil fuels and mineral resources for fertilizers, agrochemicals, machine fuels, processing, transportation, and so on. It produces greenhouse gas and reduces the precious and limited resources of the future generations. It is the time to shift the modern agricultural systems toward sustainable agriculture systems. In Japan, the government has encouraged recycling organic wastes discharged from agriculture, industries and household garbage, because almost of potassium and phosphate rocks for fertilizers used in Japan has been imported from foreign countries and the price of the raw materials for the fertilizers increased these years. Furthermore, Japanese agriculture is facing to many issues on decrease in number of agriculture household and farm yard area, and aging of farmers. The situation becomes more serious year by year. As a result, food self-sufficiency of Japan decreased to only 40%. Here some topics we studied on agricultural recycle of wastes and low-input approach are summarized and discussed. There is one of the globally largest cotton industrial factories in Ozu, Ehime prefecture, Japan. It has discharged a large amount of cotton wastes and incinerated them. For recycling the cotton waste, cotton mulch sheet for agriculture was developed. It can not only suppress weeds growth, but also save cost and labor for removing the mulch sheet after harvest because the sheet is biodegradable and easily incorporated into soil, leading to increase soil carbon and improve soil fertility. Furthermore it can decrease the soil temperature and make possible to cultivate a high quality lettuce even in hot summer. In paddy rice cultivation, the cotton mulch sheet could be also used for direct seeding method. Now it is used by organic rice cultivation in Japan. Recently our study appeared that the sheet had a high performance on environmental conservation due to the reason that the sheet could absorb the excess amount of nutrients such as nitrogen at early cultivation stage. Eventually the system reduced the amount of nutrients loss from the field soil to streams, rivers and other water systems. In addition, the absorbed nutrients in the sheet was supplied around flowering stage and taken up by rice efficiently, and contributed to a high quality of rice production. Application of organic matter to soil is one of the most important field managements for sustainable crop production. It can improve chemical properties such as nutrients enrichment, ph adjustment, increase in cation exchange capacity; biological properties such as diversifying biological communities, activating biological metabolism; physical properties such as increase in water capacity and permeability and enhancing soil-softness for root expanding. However, information and techniques of organic matter application were required for crop production with a high quality and a stable yield, because organic materials wasted have various origins and characteristics on decomposition rate, nutrient balance and contaminants. To assess nutrient efficiency of organic matter applied and environmental effects, my research group has studied precisely on the nutrient dynamics in the soil amended with several organic materials by using 15 N tracer. As organic materials, tea leaf, coffee and kitchen garbage composts were used in vegetables cultivation such as radish, spinach and Chingensai (Brassica rapa var. chinensis). The growth and yield of the vegetables grown in soil amended with tea compost showed the same level as that with chemical fertilizer. On the other hand, the treatments with coffee or kitchen composts obtained a lower yield. The rates of nitrogen efficiency (recovery %) of the compost were lower, ranging from 3.6 to 39.5% than that of chemical fertilizer, ranging from 22.4 to 61.2%. The yields closely related to N uptake by crops and amount of available N content in soil. Because tea compost was more easily-decomposable than coffee and kitchen composts, tea compost could release and supply a higher amount of available nitrogen 11
28 KEYNOTE SPEAKERS Sustainable Rural Development-Towards A Better World Purwokerto, August 25-26, 2013 to soil and crops, and reached the same level of yield of chemical fertilizer. From the viewpoint of vegetable quality, lower concentrations of nitrate were obtained in all treatments with composts than that with chemical fertilizer. The compost application improved vegetables quality clearly. Low input is one of the fundamental factors for building sustainable agriculture system. An organic rice cultivation system with legume was established. Input to farm yard is only seeds of legumes such as white clover or hairy vetch, except for irrigation water and rice seedlings. The legume seeded after rice cultivation grew during fallow period and could fix enough amount of nitrogen for rice cultivation and dig up other nutrients from the deeper soil layer than the rice root zone. The captured nutrients would release during the next rice cultivation period. This system has provided a stable rice yield as same as the conventional level for 6 years. Because of no application of pesticide and herbicide, the environment in the field also provided a plenty of habitats for wild life and insects, it created a unique biological community and avoid irruption of harmful insects. As mentioned above, application of recycled organic wastes to farm soils can provide advantageous effects on soil health, environmental conservation, efficient use of resources, however, some organic materials may pollute the soil and water due to the contamination with heavy metals, agrochemicals, antibiotics or other toxic substances. Even in the case of the organic matter from food industry, excessive application to soil has negative effects on soil productivity and agricultural ecosystems. Prior to use materials wasted, we must analyze the risks and take it in consideration deeply. Mottainai is a word of Japanese language and usually used to say among Japanese people in daily life for long time. It means roughly "what a waste!" or "Don't waste." Wangari Maathai, a Novel Peace Prize recipient in 2004, uses this word as a slogan for environmental conservation and sustainable development with the 4Rs; reduce, reuse, recycle and repair. Agriculture has the best platform which can utilize organic wastes efficiently, enrich people s life and has unlimited possibilities for the future. 12
29 INVITED SPEAKERS
30
31 INVITED SPEAKERS HOMEGARDEN INTENSIFICATION THROUGH COOPERATION AMONG DIFFERENT STAKEHOLDERS: CASE STUDIES FROM INDONESIA AND VIETNAM Yosei OIKAWA 1, Vu-Linh NGUYEN 2, and Masaaki YAMADA 1 1 Tokyo University of Agriculture and Technology 2 Bach Ma National Park, Vietnam yosei@ cc.tuat.ac.jp ABSTRACT Case studies of homegarden intensification explore its potential and limitations for sustainable rural development in the Asian tropics. Based on fieldwork, biomass flows and stakeholder relations were revealed of coconut-sugar production system in Banyumas District, Central Java Province, Indonesia, and for vegetable production system in the buffer zone of Bach Ma National Park, Thua Thien Hue Province, Vietnam. Both systems have been sustained with external inputs: fuel for making coconut-sugar, and organic fertilizers for growing vegetable. Cooperation among local stakeholders was observed facilitating more profitable and sustainable homegarden management of family farms with limited resources. Keywords: coconut sugar, rice husk charcoal, manure, organic fertilizer, local biomass INTRODUCTION Agroforestry homegardens have been popular production systems in the tropics. Tropical homegardens consist of an assemblage of plants, which may include trees, shrubs, vines, and herbaceous plants, growing in or adjacent to a homestead or home compound [1]. Many homegarden studies have been conducted to describe the diverse characteristics of homegardens, and scholars have observed the various evolutions of homegardens under changing rural and suburban environments [2]. Although homegarden structure has been degraded or simplified by commercialization in some regions [3], it has also been fostered through the establishment and expansion of complex agroforestry systems [4]. The intensification of homegardens has been one approach to rural development [5]. Its early focus was mainly the dietary improvement of households [6]. Until now, few homegarden systems seem to have been applied and disseminated as sustainable livelihood models in developing regions. While paddy and upland fields have been intensified through the Green Revolutions of rice and wheat, respectively, homegarden systems are too complex and small in scale for tangibly increasing production and income of each and all crops involved. Therefore, homegardens are often referred in the context of self-sufficiency, but partially commercialized by the introduction of commodity crops. In this paper, in case studies of Indonesia and Vietnam, the authors discuss potentials and limitations of homegarden intensification through cooperation among stakeholders, for biomass inputs in commercial farm production, and thus realizing sustainable rural development. METHODS Field observations were made since 1994 in coconut-sugar producing homegardens of Banyumas District, Central Java Province, Indonesia [7], and since 2008 in organic vegetable farms of Bach Ma National Park Buffer Zone of Thua Thien Hue Province, Vietnam [8] (Fig. 1), in order to understand the characteristics of homegarden intensification in each location. The biomass flow charts of both cases were drawn with focus on coconut sugar and vegetables, the major commodities in homegardens. Besides, relationships among stakeholders in both cases were analyzed to explore the possibilities and limitations of homegarden intensification. 15
32 INVITED SPEAKERS Sustainable Rural Development-Towards A Better World Purwokerto, August 25-26, 2013 Bach Ma National Park, Thua Thien Hue Province, Vietnam Banyumas district, Central Java Province, Indonesia Java Island Figure 1. Study sites RESULTS AND DISCUSSION Coconut sugar making in central Java, Indonesia In the Banyumas District of Central Java Province, Indonesia, homegarden coconut-sugar has long been an important income source, particularly during the economic growth of Indonesia from mid-20th century to present. The more coconut sugar is produced for income, the more fuel is needed for boiling coconut flower sap. If homegardens consist of various tree species, farmers may collect firewood in their own gardens, whereas if only coconut trees are planted for sugar, firewood may become insufficient for boiling sap, and household members should gather firewood in the neighboring gardens with owners consent, or buy fuel such as rice straw and kerosene from the market [7]. Observations by the first author in 1994 and 1999 outline the biomass flows of coconut-sugar making in homegardens (Fig. 2). Most sugar making households obtained fuel for boiling sap in their homegardens, while some collected firewood from private or communal scrublands on the slopes, or harvested dead stems and branches from the state-owned forests. In the case of villages surrounded by paddy fields, households also used rice husk and straw for boiling sap of coconut inflorescence. Some of these coconut-sugar producers found it necessary to purchase fuel from other sources. Homegardens Coconut trees Flower sap Fallen leaves, branches & firewood Boiling sap State forests Firewood Shrub gardens on the slope Firewood Paddy Fields Rice husk and straw Coconut sugar Fig. 2. Biomass flows of coconut-sugar making observed in Banyumas District in the 1990s 16
33 INVITED SPEAKERS As shown in Fig. 2, homegarden coconut-sugar production requires sufficient fuel or firewood supply. To increase productivity, more options are needed such as energy-saving stoves for boiling sap efficiently, high sap-yielding coconut varieties, and post-harvest or processing technology for improving quality of the coconut-sugar product. Marketing also holds the key to increased household income from these homegardens. Local and international cooperation among stakeholders may also facilitate intensification and sustainable production of coconut sugar. Fig. 3 is based upon the above case study and lessons from a coconut-sugar producer group Sekar Mancung, founded in 2009 in Kemawi Village, Banyumas District, and from the Indonesian NGO Yayasan Dian Tama in West Kalimantan in collaborations with Yayasan Dian Desa in Yogyakarta (refer to Honey Coconut website accessed on July 25, 2013). In the course of fostering producer groups or cooperatives, the local NGOs, universities, and public research institutes have made orchestrated contributions in development and dissemination of energy-saving stoves for production of crystallized coconut-sugar (Fig. 3, upper left). As shown in the upper right section of Fig. 3, increased fuel use can be backed up by local cooperation with fuel suppliers, who may access local biomass, including rice husks and straw from rice growers and firewood from state forests. Research institutes Coconut owners Sugar producers Research & Development of products & improved stoves Local NGOs Universities Middlemen/local traders Producers groups Village children Scholarship Intl. NGOs / exporters Fuel suppliers Rice husk Rice straw Rice growers Firewood State forests Domestic consumers Foreign consumers Fig. 3. Cooperation among stakeholders for coconut sugar making in homegardens Previously, producers had no choice but to sell coconut sugar to middlemen or local traders at their quotes. The producer group Sekar Mancung enabled its members to negotiate product prices with buyers. The members engaged in tapping palm-inflorescence sap on the tall and slippery coconut trunks signed up labor insurance. When the first author visited Sekar Mancung in 2012, the group of thirty associates exported products with an international organic food certificate. Besides, the NGO Yayasan Dian Tama has been exporting coconut sugar to foreign countries since 1998, with its partial profits contributed to local schoolchildren in the form of Honey Coconut Scholarship (Fig. 3, bottom right). Cooperation among homegarden coconut-sugar stakeholders thus represents a promising means of rural development. B. Vegetable growing in the buffer zone of Bach Ma National Park, Vietnam In the buffer zone of Bach Ma National Park, Thua Thien Hue Province, Vietnam, the residents have expanded their farmland and acacia plantations into the areas bordering the core zone through the devolution of land usufruct from the Park to the local communes. In collaboration with the Park, the Tokyo University of Agriculture and Technology has conducted a grassroots technical cooperation project through the JICA Partnership Program over 5 years from
34 INVITED SPEAKERS Sustainable Rural Development-Towards A Better World Purwokerto, August 25-26, 2013 to The project, whose title Technical Cooperation Project for Improving Rural Living and Nature Conservation by Multipurpose Use of Charcoal and Wood Vinegar in the Bach Ma National Park has been abbreviated to the Bach Ma Charcoal Project, aimed to improve rural livelihood in the Park s buffer zone through charcoal applications in both agriculture and animal husbandry. We especially focused on the technology transfer of Charcoal-applied Environmentally Friendly Farming with Livestock (CEFL) Model to local farmers. The biomass flows of this CEFL Model are summarized in Fig. 4. First, a farmer makes rice husk charcoal (RHC). Second, a small amount of RHC powder is fed to piglets for preventing diarrhea, and RHC is scattered in the pigpen to reduce odor. Third, pig manure is mixed with rice husk, RHC and rice bran (as well as manure from cattle and water buffalo) to make organic fertilizer Bokashi Than or charcoal bokashi, by fermenting all ingredients at temperatures of approximately C. Then, local farmers apply Bokashi Than to vegetable gardens and sell their organic produce at the market. The CEFL Model is consisted of the following features that facilitate farmers active participation: 1. simple and easy to implement 2. low cost with agro-wastes utilization 3. reducing agrochemicals and antibiotics application 4. increasing farm income and food self-sufficiency The project organized CEFL training workshops for more than 150 farmers who would support the idea of this model and practice it. At the Khe Su Hamlet, 12 farmers developed CEFL Model vegetable plots in their homegardens. Pig Manure Homegardens Cattle & water buffalo Rice husk charcoal Charcoal organic fertilizer Bokashi Than Livestock farms Pig & cattle Rice mill Rice husk Rice bran Paddy Fields Unhusked rice Vegetables Fig. 4. Biomass flows of vegetable growing in Homegardens through the Bach Ma Charcoal Project Before participating in the Bach Ma Charcoal Project, those model farmers used to collect firewood from their acacia plantations for trading with vegetable at the local market. Although their homegardens had been planted with perennial crops such as coconut palm, areca palm, mango, jackfruit, rambutan, and food crops such as maize, sweet potato, and cassava, few would grow vegetable. In the project, the Khe Su farmers took to vegetable production using Bokashi Than charcoal-based organic fertilizer in their homegardens. They started up with 200m 2 vegetable plot each, and later some expanded their plots. However, manure, rice husk, and rice bran were in short in the hamlet due to its few livestock and limited rice production. Therefore the project initially had to supply these materials from other hamlets. The CEFL Model originally intended for individual farms with sufficient agro-waste supply was modified to be based upon cooperation among local stakeholders, including vegetable growers, livestock breeders and rice growers (Fig. 5). The National Park has been providing services related to environmental education and eco-tourism for 18
35 INVITED SPEAKERS visitors, tourists, and rural and urban residents since before implementation of the Bach Ma Charcoal Project (Fig. 5, left side). Some locals living in the buffer zone were loggers or non-timber forest product (NTFP) collectors depredating the Park s protected forests. The Park intended to alter their activities by providing with income sources through eco rural tourism. Vegetable growing in homegardens was added as an alternative economic option for villagers in the buffer zone. Universities & research institutes Technical support National Park Visitor Center Environmental Education & Eco-rural tourism Khesu Vegetable Hamlet growers Loggers Using organic & settlers fertilizer Direct selling Local residents Park canteen Livestock breeders Manure Supplying materials Rice husk & bran Rice mill Serving as local food Rice growers Urban residents, tourists in Hue and Danang cities Domestic & international visitors to National Park Fig. 5. Stakeholders of vegetable growing in homegardens in Bach Ma Charcoal Project To strengthen technical support to the vegetable growers on their use of Bokashi Than charcoal organic fertilizer, collaborators from Hue University of Agriculture and Forestry and the Hue Center for Agricultural Research and Development were also invited to participate in the project activities, including training workshops, field demonstrations, study tours, and so on. In the beginning of the project in 2010, the Khe Su model farmers yet could not fulfill local market demands. They often consumed the harvests themselves because the vegetables were delicious (crispy and sweet). Gradually, the farmers increased commercial production and sold the harvests directly to local residents at the market. Today, the National Park canteen also serves healthy food for tourist and the staff, using vegetable from the Khe Su farmers. Although the CEFL Model is considered suitable for small-scale mixed farming, vegetable growers can also cooperate with other stakeholders to increase production, as shown in Fig. 5. Once in 2012, a buyer of organic produce promoted Khe Su vegetables in Da Nang City for a brief period, and found it unsustainable business. Following this experience, Khe Su farmers targeted local consumers at the nearby Cau Hai Market, so that they could ship and sell their harvest by themselves at their group booth. C. The role of cooperation in private homegardens Homegardens are planted and maintained by members of households, and their products are intended primarily for household consumption [1]. Adding to these primary purposes, the case studies illustrated the potential of homegarden intensification to provide increased incomes for rural households. Both systems have been sustained with external inputs: firewood for coconut-sugar making and organic fertilizer made from rice husk, rice husk charcoal, rice bran, and manure for vegetable production. In both cases, cooperation among stakeholders can promote more sustainable and profitable homegarden production for small-scale farmers who have limited private lands and resources. To establish more sustainable and developed homegarden systems, homegarden intensification should integrate various types of land use and biomass. Besides as we have observed, NGO facilitation may encourage increased cooperation among local and international stakeholders. 19
36 INVITED SPEAKERS Sustainable Rural Development-Towards A Better World Purwokerto, August 25-26, 2013 ACKNOWLEDGMENT Y. Oikawa thanks Dr. Karseno and Dr. Krissandi Wijaya for arranging the field visits in the Banyumas District in September 2012 that suggested the framework of this study. REFERENCES [1]. P.K.R. Nair, An Introduction to Agroforestry, Dordrecht: Kluwer Academic Publishers, 1993, ch 7, pp [2]. G. Michon and F. Mary, Conversion of Traditional Village Gardens and New Economic Strategies of Rural Households in the Area of Bogor, Indonesia, Agroforestry Systems, Vol. 25, pp.31-58, Jan [3]. M. Yamada and H.M.L. Osaqui, The Role of Homegardens in Agroforestry Development: Lessons from Tomé-Açu, a Japanese Brazilian Settlement in The Amazon, in Tropical Homegardens: A Time-Tested Example of Sustainable Agroforestry, B.M. Kumar and P.K.R. Nair Eds. Dordrecht: Springer, 2006, ch. 17, pp [4]. O.S. Abdoellah, H.Y. Hadikusumah, K. Takeuchi, S. Okubo, and Parikesit, Commercialization of Homegardens in an Indonesian Village: Vegetation Composition and Functional Changes, in Tropical Homegardens: A Time-Tested Example of Sustainable Agroforestry, B.M. Kumar and P.K.R. Nair Eds. Dordrecht: Springer, 2006, ch. 13, pp [5]. J.N. Pretty, J.I.L. Morison, and R.E. Hine, Reducing Food Poverty by Increasing Agricultural Sustainability in Developing Countries, Agriculture, Ecosystems and Environment, vol. 95, no. 1, pp April [6]. G. Marten, A Nutritional Calculus for Home Garden Design: Case-Study from West Java, in Tropical Home Gardens, K. Landauer and M. Brazil, Eds. Tokyo: United Nations University Press, 1990, ch. 13, pp [7]. Y. Oikawa, A Preliminary Survey on Coconut-sugar-making Homegardens in Relation to Fuel Procurement in Banyumas, Central Java. Tropics, vol. 7, no.3/4, pp , May [8]. V.L. Nguyen, Bach Ma Charcoal Project. Ifpra World. [Online]. June 2012 pp Available: 20
37 INVITED SPEAKERS FIELD EVALUATION OF INFILTRATION MODELS UNDER OIL PALM PLANTATION: STEMFLOW AND THROUGHFALL AREAS M. Askari 1, F.A. Ahmad 2, A.M. Mohd Sayuti 2, C.B.S. Teh 3, Suhartono 4, H. Saito 5, Z. Yusop 6, and K. Wijaya 7 1 Lecturer, Institute of Environmental and Water Resources Management, Universiti Teknologi Malaysia (UTM), Malaysia 2 Graduated, Universiti Teknologi Malaysia (UTM), Malaysia 3 Lecturer, Universiti Putra Malaysia, Malaysia 4 Post-Doctoral fellow with Department of Mathematics, Universiti Teknologi Malaysia 5 Lecturer, University of Tokyo 6 Professor in Environmental Hydrology, Universiti Teknologi Malaysia 7 Lecturer, Jenderal Soedirman University (UNSOED), Indonesia muhaskari@utm.my and zulyusop@utm.my ABSTRACT Although the performance of infiltration models has been well tested for subtropical areas, only a few is given to tropical areas especially those for stemflow and throughfall areas underneath oil palm plantation. Distinguishing both areas are attributed not only by their behavior in distributing rainfall into soil surface, but also characterized by different organic content and soil compaction. Experiments were carried out at both areas of an oil palm tree with a tension disc infiltrometer. Cumulative infiltrations from the tension disc infiltrometer were used to define the objective function to be minimized during optimization of the parameters of the ten infiltration models. The performances of the models were evaluated with consideration of root mean square error and paired student's t-test of the selected model error. All infiltration models performed well for oil palm plantation on sandy loam soil. The two areas exhibited contrasting hydraulic properties as indicated by saturated hydraulic conductivity. On average, values of this parameter for the stemflow area of an oil palm tree were five times higher compared to those of the throughfall area. Green-Ampt model, Smith model, Mezencev model, and Philip model performed better than the other infiltration models among their categories. The research also indicated that two-parameter Philip infiltration model is recommended as the best description of the relationship between cumulative infiltration and time at two areas underneath oil palm plantation over the least square method. Keywords: infiltration models, oil palm, stemflow, throughfall. INTRODUCTION Infiltration is affected by rainfall intensity [1] and the physical properties of soils, such as initial soil water content and saturated hydraulic conductivity [2]; soil texture and structure [3], [4], [5]; vegetation cover, and plant root density. Generally, cumulative infiltration is higher with high initial soil water content, and higher with higher soil saturated hydraulic conductivity. Existing soil organic matter produced by trees increases the friability of stiff, tight soils, and makes the soil crumbly to accelerate soil structural development then increase infiltration capacity [6], [7]. Existing tree root will improve soil structure and thus infiltration [8], [9]. Previous studies have paid attention to the effects of stemflow as a main source of tree induced infiltration and soil water movement ([9], [10], [11], [12], [13]). For the last five years, [14] observed that for a heavy storm event, the cumulative stemflow per infiltration area along the downslope sides of the tree trunk was 18.9 times the cumulative open-area rainfall. In addition, [15] evaluated that the amount of stemflow under the banana stem was up to six times higher than in the row of downstream area. Moreover, several studies have modeled flow under stemflow and throughfall areas of different vegetations such as olive tree [13], banana plant [15], [16], tall stewartia [17], and ponderosa pine [18]. Malaysia and Indonesia are the two largest producer of palm oil in the world. Oil palm covers 5 million ha or 15% of Malaysia s total land area [19]. The expansion area dominantly originates from land conversion of rubber. Even though Malaysia receives between 2000 to 3000 mm of annual rainfall, 21
38 INVITED SPEAKERS Sustainable Rural Development-Towards A Better World Purwokerto, August 25-26, 2013 about 41 to 51% of gross rainfall was intercepted by its canopy [20], [21]. In addition, the use of harvesting machine could compact the soil and reduce the infiltration. A number of infiltration models were systematically and extensively reviewed, presented, and summarized by [22], and [2]. Although many researchers have taken efforts to successfully compare and evaluate those infiltration models in different scenarios under field conditions [23], [24], [25], [26], [27], [28], [29], [30], [31], [32], most of that research was conducted in agricultural fields. An evaluation of those infiltration models under field condition at stemflow and throughfall areas underneath oil palm plantation is still lack. Therefore, the objectives of present study are (1) to summarize and choose appropriate infiltration models used for soil underneath oil palm plantation, (2) to estimate and assess those parameters involved with those infiltration models, and (3) to evaluate the prediction ability of those infiltration models for the soil underlying oil palm plantation. THE MODELS Models to estimate cumulative infiltration rates used in this study are summarized in Table 1. TABLE 1: SUMMARY OF INFILTRATION MODELS Models Descriptions Green-Ampt Homogenous, uniform initial moisture content, good prediction [23], [33] Kostiakov Simplest model, basic infiltration rate of soil not accounted [23] Horton Based on work-energy principle, ponding is assumed [23] Philip Moisture content represented by an infinite series [23] Smith Mezencev Parlange Collis-George Brutsaert Swartzendruber & Clague Suitable for uniform initial moisture content profile before redistribution, homogeneous soil [22] Flexible model, basic infiltration rate of soil is considered [23]. Due to limitation of Kostiakov s equation to explain the infiltration at longer time [34] For estimating cumulative infiltration with constant surface water content, uniform initial water content and homogeneous soil [22] Due to limitation of Green-Ampt model which do not mimic the observed behavior of simple soils at long times and the Horton model did not at short times [35] Applied for uniform antecedent water content, homogeneous soil, and describe water ponded into a semi-infinite [22] For estimating cumulative infiltration with constant surface water content, uniform initial water content and homogeneous soil [22] The equation of each infiltration models (Table 1) are listed in Table 2. TABLE 2: INFILTRATION MODEL EQUATIONS Models Equation Green-Ampt Kostiakov Ks t Lf ho hf s i F L f F 1 1 t L f ln 1 ho hf 1 kt Horton F f t f f 1 e c k 0 c 22
39 INVITED SPEAKERS Philip Smith Mezencev Parlange Collis-George F S t 1 2 Ct 1 b A t t F f t o c 1 b 1 F f c t t 1 F K s t S K 1 exp 2 s t K 2 s S S 2 tanh K t F K t N s s N K 2 s S Brutsaert F K s t s K 1 s 1 K t S 2 Swartzendruber & Clague S 2 1 S F Kst K 2 s K t 1 2 s S K t 1 exp s S 1 2 F = cumulative infiltration, L f = length of wetting front, s = saturated moisture content, i = initial moisture content, t = time, K s = saturated hydraulic conductivity, h 0 = pressure head at surface, h f = pressure head at wetting front, f 0 = initial infiltration rate, f c = final infiltration rate, k = infiltration decay factor, α; β, N = constants, S = sorptivity, C = parameter depend on soil diffusivity and moisture retention characteristics, A; b = parameters depends on soil characteristic, t 0 = initial time when runoff start. METHODOLOGY The field experiments were carried out at an oil palm plantation in Johor Darul Takzim, Malaysia (at 01 33'50.1'' E and '09.6'' N). The plantation was established around 18 years ago. A tension disc infiltrometer was used to conduct field infiltration experiments underneath and between oil palm trees to obtain soil hydraulic properties for stemflow (SA) and throughfall (TA) areas, respectively. Three successive tensions of -5, -2, and 0 cm H 2 O were applied in all disc infiltrometer experiments. The disc infiltrometer had a diameter of 20 cm and was made of the nylon mesh. To get good contact between the disc and the soil, a thin layer of sand of ~ 2 mm was placed at the top of the soil. The sand layer was moistened immediately before placing the disc membrane on the soil in order to prevent air entry into the disc. Having finished the field experiments, laboratory measurements were carried out to determine initial water contents, bulk densities, porosities and root density of the undisturbed soil taken from stemflow and throughfall areas before field experiment started. The infiltration models were categorized into 4 groups by taking into account the number of unknown parameters. The parameters of the models were then optimized by minimizing the objective function which is the sum of squares error between observed and estimated cumulative infiltration for the tension of 0 cm H 2 O. The performances of the models were evaluated within each group by considering its root mean square error (RMSE). The comparison of the best model between each group was carried out using paired student's t-test based on the prediction accuracy (error) of each selected model. 23
40 Cumulative infiltration, Q (cm) Cumulative infiltration, Q (cm) INVITED SPEAKERS Sustainable Rural Development-Towards A Better World Purwokerto, August 25-26, 2013 RESULTS AND DISCUSSION Laboratory experiment Table 3 below summarized the laboratory measurements of the soil physical properties. TABLE 3: LABORATORY MEASUREMENTS. Location Initial moisture (cm 3 cm -3 ) Bulk density (g/cm 3 ) Porosity (%) Organic content (g/cm 3 ) Stemflow area Throughfall area Based on the USDA soil classification, the soil at the plantation is sandy loam (76.6% of sand, 13.0% of clay, and 10. 3% of silt). Based on laboratory measurements, the stemflow area has a high porosity and a high organic content (see Table 3). The occurrence of higher soil organic matter not only will strengthen the soil aggregates but also enhance soil capacity in holding and storing water. This is because soil organic matters minimizes soil compaction, provide pores, and is able to store a quantity of water which corresponds to a multiple of the organic matters weight [36]. A. Field measurement From the field infiltration measurement using the tension disc infiltrometer, we obtained cumulative infiltrations for stemflow and throughfall areas. Figure 1 shows cumulative infiltrations for both areas. Notice the three different slopes represent pressure heads (h = -5, -2 and 0 cm H 2 O). The steepest slope attributed 0 cm H 2 O and the gentlest slope indicated -5 cm H 2 O. Stemflow area required 70 minutes to allow water infiltrate 800 cm into the soil. However, the throughfall area needed 130 minute to penetrate water 500 cm into the soil. The results from cumulative infiltration curves show that the infiltration rate for stemflow area is faster rather than throughfall area. This is due to effect of the organic content (see Table 3). As explained by [6] and [7], existing soil organic matter produced by trees increases the friability of stiff, tight soils, and makes the soil crumbly to accelerate soil structural development then increase infiltration capacity Observed (SA) 800 Observed (TA) Time, T (minute) Time, T (minute) Figure 1: Cumulative infiltration rate for stemflow (top) and throughfall (bottom) areas for three consecutive pressure head (h = -5, -2 and 0 cm H 2 O). 24
41 INVITED SPEAKERS B. Model parameters The models were categorized into 4 groups which is five unknown parameters based model (Green-Ampt), four unknown parameters based model (Smith), three unknown parameters based model (Horton, Mezencev, Collis-George, Brutsaert, and Swartzendruber & Clague), and two unknown parameters based model (Kostiakov, Philip, and Parlange). The optimized parameter values for the ten infiltration models for both areas are listed in Table 4 - Table 11. Those were optimized by minimizing the objective function which is the sum of squares error between observed and estimated cumulative infiltration for the tension of 0 cm H 2 O. TABLE 4: THE OPTIMIZED PARAMETERS OF GREEN-AMPT UNDERNEATH OIL PALM PLANTATION Model Green-Ampt K S θ S θi h 0 h f Stemflow area Throughfall area INFILTRATION MODEL FOR SANDY LOAM SOIL K s = saturated hydraulic conductivity (cm/min), s = saturated moisture content (cm 3 /cm 3 ), i = initial moisture content (cm 3 /cm 3 ), h 0 = pressure head at surface (cm H 2 O), h f = pressure head at wetting front (cm H 2 O). TABLE 5: THE OPTIMIZED PARAMETERS OF SMITH INFILTRATION MODEL FOR SANDY LOAM SOIL UNDERNEATH OIL PALM PLANTATION Model Smith f C (cm/min) A B t 0 (min) Stemflow area Throughfall area TABLE 6: THE OPTIMIZED PARAMETERS OF HORTON INFILTRATION MODEL FOR SANDY LOAM SOIL UNDERNEATH OIL PALM PLANTATION Model Horton f C (cm/min) f 0 (cm/min) k Stemflow area Throughfall area TABLE 7: THE OPTIMIZED PARAMETERS OF MEZENCEV INFILTRATION MODEL FOR SANDY LOAM SOIL UNDERNEATH OIL PALM PLANTATION Mezencev Model f C (cm/min) Stemflow area Throughfall area TABLE 8: THE OPTIMIZED PARAMETERS OF COLLIS-GEORGE INFILTRATION MODEL FOR SANDY LOAM SOIL UNDERNEATH OIL PALM PLANTATION Model Collis-George S (cm/min 0.5 ) K S (cm/min) N Stemflow area Throughfall area
42 INVITED SPEAKERS Sustainable Rural Development-Towards A Better World Purwokerto, August 25-26, 2013 TABLE 9: THE OPTIMIZED PARAMETERS OF BRUTSAERT INFILTRATION MODEL FOR SANDY LOAM SOIL UNDERNEATH OIL PALM PLANTATION Brutsaert Model S (cm/min 0.5 ) K S (cm/min) Stemflow area Throughfall area TABLE 10: THE OPTIMIZED PARAMETERS OF SWARTZENDRUBER & CLAGUE INFILTRATION MODEL FOR SANDY LOAM SOIL UNDERNEATH OIL PALM PLANTATION Model Swartzendruber & Clague S (cm/min 0.5 ) K S (cm/min) Stemflow area Throughfall area TABLE 11: THE OPTIMIZED PARAMETERS OF KOSTIAKOV, PHILIP, AND PARLANGE INFILTRATION MODELS FOR SANDY LOAM SOIL UNDERNEATH OIL PALM PLANTATION Models Kostiakov Philip Parlange S C S K S Stemflow area Throughfall area S = sorptivity (cm/min 0.5 ), C = parameter depend on soil diffusivity and moisture retention characteristics (cm/min), K s = saturated hydraulic conductivity (cm/min). From Table 4 - Table 11, the two areas exhibited contrasting hydraulic properties as indicated by saturated hydraulic conductivity (K s ). Notice final infiltration rate (f c ) of Smith model, Horton model and Mezencev model attributed similar magnitude with saturated hydraulic conductivity as well as of Kostiakov model and C of Philip model. The characteristic of saturated hydraulic conductivity for stemflow area ranges from cm/min with average value of 0.18 cm/min meanwhile those for throughfall area ranges from cm/min with average value of 0.03 cm/min. Notice, on average, values of the properties for the stemflow area were about five times higher compared to those for the throughfall area. This may be caused by the physical properties of both areas. Notice, high percentage of organic content contributes significant difference on this matter as well as the effect of the bulk density. The values agreed well with those obtained from inverse estimation using Hydrus 2D/3D which is cm/min and cm/min for throughfall and stemflow areas, respectively [37]. C. Model performance The values of the root mean square error (RMSE) for those ten infiltration models for both areas are listed in Table 12. Mezencev model as the modified Kostiakov model had the lowest RMSE among three unknown parameters based model (Horton, Mezencev, Collis-George, Brutsaert, and Swartzendruber & Clague) followed by Brutsaert model, Swartzendruber & Clague model, Horton model, and Collis-George model. As compared to the original Kostiakov model, Mezencev model performed better. The additional term t f c contributes positive effect into the ability of the model to fit observed data. Similar to the result presented by [27] and [38] for silt loam, sandy clay loam and sand soil textures, among three-parameters model, Mezencev model was found to be best in fitting measured infiltration and in prediction ability for cumulative infiltration. Among two unknown parameters based model (Kostiakov, Philip, and Parlange), the theoretically based Philip model was found to have the lowest RMSE. On the other word, it was found to be the best, among two parameters model, in fitting measured infiltration and in prediction ability for cumulative infiltration. 26
43 INVITED SPEAKERS As one of the theoretically based soil infiltration models, Philip model was regarded as one of the most predictive models [31]. Among the most predictive models (Green-Ampt, Smith, Mezencev, and Philip), rank 1 st in Table 12, Smith model had the lowest RMSE compared to Mezencev model, Philip model and Green-Ampt model. However, having conducted paired student's t-test based on the prediction accuracy (error) of those models, notice there is no statistically significant difference among them. With the hypothesized mean difference of the prediction accuracy (error) between the models equals to zero, and the alpha level equals to 0.05, it was found that probability (T<=t) for two-tail is always more than the alpha level. It means that we accepted the hypothesized mean difference of the prediction accuracy (error) between the models equals to zero. On the other word, there was no statistically significant difference among Green-Ampt model, Smith model, Mezencev model, and Philip model. Nevertheless, in the present study, by considering number of parameters (two unknown parameters), Philip model was regarded as one of the most predictive models among others. TABLE 12: RMSE OF THE TEN INFILTRATION MODELS FOR SANDY LOAM SOIL UNDERNEATH OIL PALM PLANTATION Root Mean Square Error Models Stemflow Throughfall Mean Rank area area Green-Ampt 5.26E E E-03 1 a Smith 3.79E E E-03 1 a Mezencev 3.83E E E-03 1 a Brutsaert 4.12E E E-03 2 Swartzendruber & Clague 4.12E E E-03 3 Horton 4.12E E E-03 4 Collis-George 8.04E E E-03 5 Philip 4.12E E E-03 1 a Kostiakov 4.71E E E-03 2 Parlange 7.84E E E-03 3 Superscript a attributed that probability (T<=t) for two tail is always more than the alpha level (0.05). Same superscript means there is no statistically significant difference among the models. CONCLUSION The present study was conducted to evaluate the performance of ten classical infiltration models at stemflow and throughfall areas underneath oil palm plantation. The infiltration models investigated and compared included Green-Ampt model, Kostiakov model, Horton model, Philip model, Smith model, Mezencev model, Parlange model, Collis-George model, Brutsaert model, and Swartzendruber & Clague model. Mezencev model performed better among others with consideration to root mean square error. Paired student's t-test indicated that two-parameters Philip model performed as good as Mezencev model and Smith model in describing the relationship between cumulative infiltration and infiltration time for the researched oil palm plantation underlined by sandy loam soil. REFERENCES [1]. T. Dunne, W. Zhang, and B. F. Aubry, Effects of rainfall, vegetation, and microtopography on infiltration and runoff, Water Resour. Res., vol. 27, no. 9, pp , [2]. J. R. Williams, Y. Ouyang, J.-S. Chen, V. Ravi, and D. S. B. D. G. Jewett, Estimation of infiltration rate in vadose zone: Application of selected mathematical models, United States Environmental Protection Agency, Office of Research and Development,
44 INVITED SPEAKERS Sustainable Rural Development-Towards A Better World Purwokerto, August 25-26, 2013 [3]. J. Diamond and T. Shanley, Infiltration rate assessment of some major soils, Irish Geography, vol. 36, no. 1, pp , [4]. Y. A. Pachepsky and W. J. Rawls, Soil structure and pedotransfer functions, Eur. J. Soil Sci., vol. 54, no. 3, pp , [5]. M. Askari, T. Tanaka, B. I. Setiawan, and S. K. Saptomo, Infiltration characteristics of tropical soil based on water retention data, J. Japan Soc. Hydrol. and Water Resour., vol. 21, pp , [6]. D. A. Martin and J. A. Moody, Comparison of soil infiltration rates in burned and unburned mountainous watersheds, Hydrol. Process., vol. 15, no. 15, pp , [7]. A. J. Franzluebbers, Water infiltration and soil structure related to organic matter and its stratification with depth, Soil Tillage Res., vol. 66, no. 2, pp , [8]. B. Lange, P. Lüescher, and P. F. Germann, Significance of tree roots for preferential infiltration in stagnic soils, Hydrology and Earth System Sciences, vol. 13, no. 10, pp , [9]. M. Askari, Infiltration and Soil Water Movement underneath Japanese Red Pine and Oak Trees, University of Tsukuba, Japan, [10]. A. J. Pressland, Soil moisture redistribution as affected by throughfall and stemflow in an arid zone shrub community, Aust. J. Bot., vol. 24, no. 5, pp , [11]. T. Tanaka, M. Tsujimura, and M. Taniguchi, Infiltration area of stemflow-induced water, Ann. Rep., Inst. Geosci., Univ. Tsukuba, vol. 17, pp , [12]. Aboal J. R., Jiménez M. S., Morales D., and J. M. Hernández, Rainfall interception in laurel forest in the Canary Islands, Agricultural and Forest Meteorology, vol. 97, no. 2, pp , [13]. J. A. Gómez, J. V Giráldez, and E. Fereres, Analysis of infiltration and runoff in an olive orchard under no-till, Soil Science Society of America Journal, vol. 65, no. 2, pp , [14]. W.-L. Liang, K. Kosugi, and T. Mizuyama, Heterogeneous Soil Water Dynamics around a Tree Growing on a Steep Hillslope, Vadose Zone J., vol. 6, no. 4, pp , Nov [15]. J. Sansoulet, Y.-M. Cabidoche, P. Cattan, S. Ruy, and J. Simunek, Spatially Distributed Water Fluxes in an Andisol under Banana Plants: Experiments and Three-Dimensional Modeling, Vadose Zone J., vol. 7, no. 2, pp , May [16]. P. Cattan, S. M. Ruy, Y. M. Cabidoche, A. Findeling, P. Desbois, and J. B. Charlier, Effect on runoff of rainfall redistribution by the impluvium-shaped canopy of banana cultivated on an Andosol with a high infiltration rate, Journal of Hydrology, vol. 368, no. 1 4, pp , [17]. W.-L. Liang, K. Kosugi, and T. Mizuyama, A three-dimensional model of the effect of stemflow on soil water dynamics around a tree on a hillslope, J. Hydrol., vol. 366, no. 1 4, pp , [18]. H. Guan, J. Simunek, B. D. Newman, and J. L. Wilson, Modelling investigation of water partitioning at a semiarid ponderosa pine hillslope, Hydrological Processes, vol. 24, no. 9, pp , [19]. MPOB, Malaysian oil palm statistics: Overview of the Malaysian oil palm industry 2011, [20]. A. Damih, Keberkesanan Pemintasan Air Hujan oleh Pokok Kelapa Sawit di Dalam Mengurangkan Air Larian Permukaan, BSc thesis. Universiti Teknologi Malaysia, [21]. A. Bentley, Interception Loss in Sedenak Oil Palm Plantation, BSc thesis. Universiti Teknologi Malaysia., [22]. V. Ravi, J. R. Williams, and D. S. Burden, Estimation of infiltration rate in the vadose zone: compilation of simple mathematical models, US Environmental Protection Agency, Office of Research and Development, [23]. S. A. Al-Azawi, Experimental evaluation of infiltration models, Journal of Hydrology (N2), vol. 24, no. 2, [24]. B. Davidoff and H. M. Selim, Goodness of Fit for Eight Water Infiltration Models1, Soil Science Society of America Journal, vol. 50, no. 3, p. 759, [25]. J. S. C. Mbagwu, Testing the goodness of fit of infiltration models for highly permeable soils under different tropical soil management systems, Soil and Tillage Research, vol. 34, no. 3, pp , [26]. S. K. Mishra and V. P. Singh, Another look at SCS-CN method, Journal of Hydrologic Engineering, vol. 4, no. 3, pp , [27]. M. K. Shukla, R. Lal, and P. Unkefer, Experimental evaluation of infiltration models for different land use and soil management systems, Soil science, vol. 168, no. 3, pp ,
45 INVITED SPEAKERS [28]. N. Chahinian, R. Moussa, P. Andrieux, and M. Voltz, Comparison of infiltration models to simulate flood events at the field scale, Journal of Hydrology, vol. 306, no. 1 4, pp , [29]. M. Rashidi and K. Seyfi, Field Comparison of Different Infiltration Models to Determine the Soil Infiltration for Border Irrigation Method, Am Eurasian J Agric Environ Sci, vol. 2, no. 6, pp , [30]. K. S. Zadeh, A. Shirmohammadi, H. J. Montas, and G. Felton, Evaluation of infiltration models in contaminated landscape, Journal of Environmental Science and Health Part A, vol. 42, no. 7, pp , [31]. S. G. Dashtaki, M. Homaee, M. H. Mahdian, and M. Kouchakzadeh, Site-dependence performance of infiltration models, Water resources management, vol. 23, no. 13, pp , [32]. J. D. Valiantzas, New linearized two-parameter infiltration equation for direct determination of conductivity and sorptivity, Journal of Hydrology, vol. 384, no. 1, pp. 1 13, [33]. M. Nasseri, Y. Daneshbod, and H. Seyyedian, GREEN AND AMPT INFILTRATION EQUATION: COMPARISON OF TWO ANALYTIC DIRECT METHODS, Iranian Journal of Science \& Technology, Transaction B, Engineering, vol. 32, no. B5, pp , [34]. A. Furman, A. W. Warrick, D. Zerihun, and C. A. Sanchez, Modified Kostiakov infiltration function: Accounting for initial and boundary conditions, Journal of irrigation and drainage engineering, vol. 132, no. 6, pp , [35]. S. K. Mishra, J. V Tyagi, and V. P. Singh, Comparison of infiltration models, Hydrological Processes, vol. 17, no. 13, pp , [36]. W. W. Emerson, Water-retention, organic-c and soil texture, Soil Research, vol. 33, no. 2, pp , [37]. M. Askari, Z. Yusop, F. Yusof, C. Teh, and H. Saito, Infiltration under Oil Palm Plantation: Heterogeneitis from Canopy to Interspace, Final Report. Research Management Center, Universiti Teknologi Malaysia, [38]. R. Duan, C. B. Fedler, and J. Borrelli, Field evaluation of infiltration models in lawn soils, Irrigation Science, vol. 29, no. 5, pp , Dec
46 INVITED SPEAKERS Sustainable Rural Development-Towards A Better World Purwokerto, August 25-26,

47 INVITED SPEAKERS Enviromental Sustainability of Biodiesel Production in Indonesia Armansyah H. Tambunan 31

48 INVITED SPEAKERS Sustainable Rural Development-Towards A Better World Purwokerto, August 25-26,

49 INVITED SPEAKERS 33

50 INVITED SPEAKERS Sustainable Rural Development-Towards A Better World Purwokerto, August 25-26,

51 INVITED SPEAKERS 35

52 INVITED SPEAKERS Sustainable Rural Development-Towards A Better World Purwokerto, August 25-26,

53 INVITED SPEAKERS 37

54 INVITED SPEAKERS Sustainable Rural Development-Towards A Better World Purwokerto, August 25-26,

55 INVITED SPEAKERS 39
56 INVITED SPEAKERS Sustainable Rural Development-Towards A Better World Purwokerto, August 25-26,

57 INVITED SPEAKERS 41
58 INVITED SPEAKERS Sustainable Rural Development-Towards A Better World Purwokerto, August 25-26,


59 INVITED SPEAKERS MANAGING CONCERNS: INDONESIAN SUSTAINABILITY IN RICE PRODUCTION, A RICE BREEDING PRESPECTIVE Suprayogi, Ph.D 43


60 INVITED SPEAKERS Sustainable Rural Development-Towards A Better World Purwokerto, August 25-26,

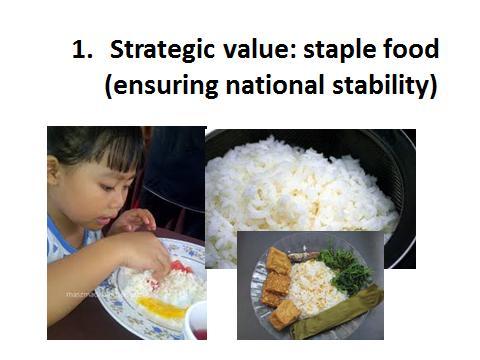
61 INVITED SPEAKERS 45


62 INVITED SPEAKERS Sustainable Rural Development-Towards A Better World Purwokerto, August 25-26,

63 INVITED SPEAKERS 47


64 INVITED SPEAKERS Sustainable Rural Development-Towards A Better World Purwokerto, August 25-26,

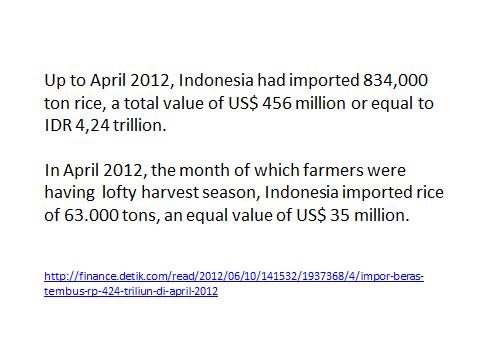
65 INVITED SPEAKERS 49


66 INVITED SPEAKERS Sustainable Rural Development-Towards A Better World Purwokerto, August 25-26,

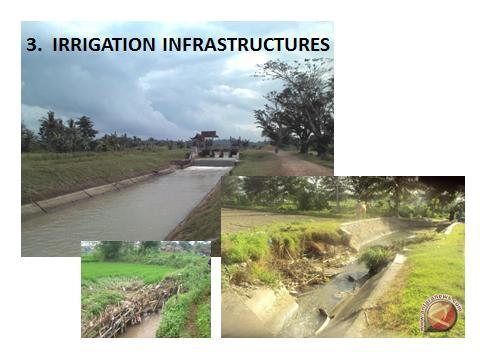
67 INVITED SPEAKERS 51


68 INVITED SPEAKERS Sustainable Rural Development-Towards A Better World Purwokerto, August 25-26,

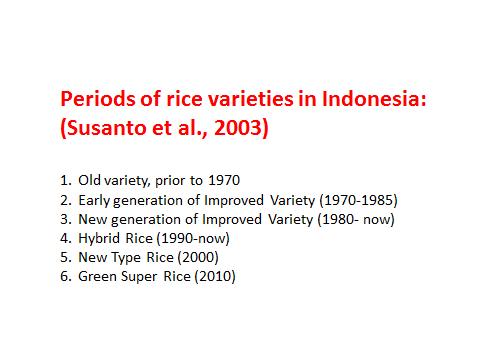
69 INVITED SPEAKERS 53


70 INVITED SPEAKERS Sustainable Rural Development-Towards A Better World Purwokerto, August 25-26,

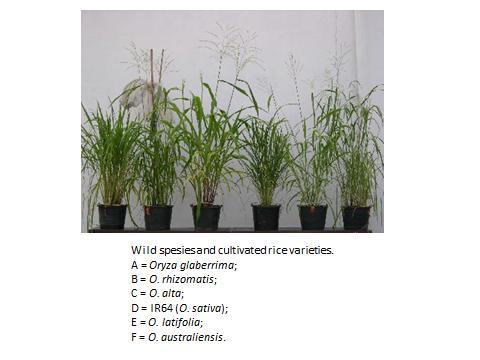
71 INVITED SPEAKERS 55

72 INVITED SPEAKERS Sustainable Rural Development-Towards A Better World Purwokerto, August 25-26,

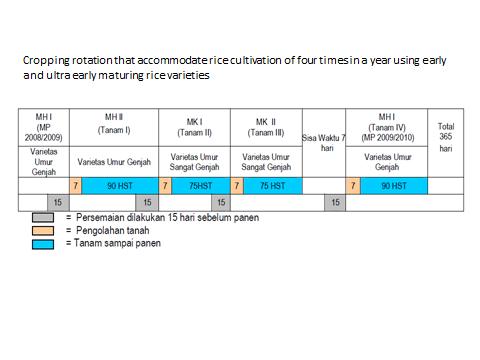
73 INVITED SPEAKERS 57


74 INVITED SPEAKERS Sustainable Rural Development-Towards A Better World Purwokerto, August 25-26,

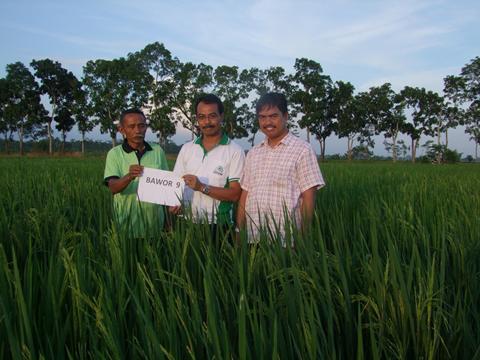
75 INVITED SPEAKERS 59
76 INVITED SPEAKERS Sustainable Rural Development-Towards A Better World Purwokerto, August 25-26,

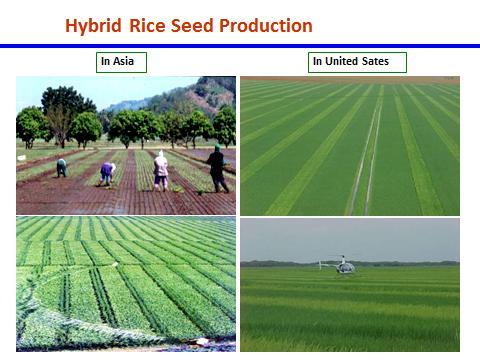
77 INVITED SPEAKERS 61


78 INVITED SPEAKERS Sustainable Rural Development-Towards A Better World Purwokerto, August 25-26,

79 INVITED SPEAKERS 63


80 INVITED SPEAKERS Sustainable Rural Development-Towards A Better World Purwokerto, August 25-26,

81 INVITED SPEAKERS 65


82 INVITED SPEAKERS Sustainable Rural Development-Towards A Better World Purwokerto, August 25-26,

83 INVITED SPEAKERS 67


84 INVITED SPEAKERS Sustainable Rural Development-Towards A Better World Purwokerto, August 25-26,

85 INVITED SPEAKERS 69
86 INVITED SPEAKERS Sustainable Rural Development-Towards A Better World Purwokerto, August 25-26,
87 1 st TOPIC
88
89 1 st TOPIC ENHANCED WATER USE EFFICIENCY FOR IRRIGATED RICE IN INDONESIA WITH SYSTEM OF RICE INTENSIFICATION (SRI) Chusnul Arif 1, Budi Indra Setiawan 1, Hanhan Ahmad Sofiyuddin 2, Lolly Martina Martief 2, Masaru Mizoguchi 3, and Ardiansyah 4 1 Department of Civil and Environmental Engineering, Bogor Agricultural University, Indonesia 2 Experimental Station for Irrigation, Research Center for Water Resources, Ministry of Public Work, Indonesia 3 Department of Global Agricultural Sciences, the University of Tokyo, Japan 4 Department of Agricultural Engineering, Jenderal Soedirman University, Indonesia chusnul_arif@ipb.ac.id ABSTRACT Conventional rice cultivation with continuous flooding irrigation that commonly used in rice production characterized by insufficient water use because the quantity of irrigation water is usually supplied to the field is greater than plant water requirement. The current study was performed to evaluate System of Rice Intensification (SRI) practice in raising water use efficiency for sustainable rice production in Indonesia particularly in the rainy season. Achieving this goal, a field experiment was conducted in Karang Sari Village, Bekasi, West Java, Indonesia during the first rice season 2007/2008 (December 2007 to April 2008) in the rainy season. Here, two cultivation practices with different regimes were compared i.e., SRI regime and Conventional Practice (CP) regime. As the results, it was clearly observed that SRI regime raised water use efficiency index up to 37.6% by saving water input up to 26.07% compared to CP regime. The SRI regime also reduced excess water through percolation and runoff significantly. The SRI regime also resulted in better yield and crop performance compared to continuous flooding irrigation even if not significant. The main reason is that under SRI with intermittent irrigation, aerobic condition was created. This condition promoted higher activity of the plants for the establishment of a larger and deeper root as reported previous studies. Therefore, the results suggested that SRI is suitable way to raise water use efficiency without decreasing yield for irrigated rice in Indonesia. Keywords: water management, water use efficiency, paddy fields, system of rice intensification INTRODUCTION Rice (Oryza sativa L.) has become the most important staple food in Indonesia, and it covers the largest agricultural area. The total harvested area and rice production in 2011 were 13.2 million ha and 65.8 million tons, respectively [1]. Recently, the challenges related to improving rice productivity in Indonesia have been increasing due to the increased population and reduced arable area. In addition, climate change issues have been affecting paddy irrigation water requirements during the rainy and dry seasons [2]. Commonly in Indonesia, rice is cultivated under continuous flooding irrigation by maintaining the depth of water between 2 and 5 cm to control weeds, reduce the frequency of irrigation, and secure against possible future shortage of water due to the unreliable water delivery system. Consequently, agriculture is the largest consumer of fresh water especially for irrigation. The data in 2010 showed that water used for irrigation was 89% following by fisheries (7%), domestic and industrial (4%) and livestock (0.2%) [3]. Continuous flooding irrigation is less efficient because the quantity of irrigation water is usually greater than actual water requirement. This weakens water saving effects, causing large amounts of surface runoff, seepage and percolation [4]. Hence, an alternative rice production with less water input is needed to ensure a sufficient food supply. From previous findings, rice is highly possible to be produced by water saving regimes under system of rice intensification (SRI) in which continuous flooding irrigation is no longer essential to gain high yields and biomass production [5, 6, 7]. SRI is well-known as a set of crop management practices for 73
90 1 st TOPIC Sustainable Rural Development-Towards A Better World Purwokerto, August 25-26, 2013 raising the productivity of rice by changing the management of plants, soil, water, and nutrients. Although some critics were dismissed to SRI [8, 9, 10], its benefits have been validated in 42 countries of Asia, Africa and Latin America [11]. In SRI paddy fields, intermittent irrigation is applied in which the field is allowed to dry during particular time instead of keeping them continuously flooding, a practice called alternate wetting and drying irrigation [12]. Many researchers have been conducted to verify this system. As the results, it was clearly observed that this system can increase water use efficiency significantly by saved water input as provided data for different countries, e.g., in Japan [13], 38.5% in Iraq [14], 43.9% in China [7]. The results revealed that the increasing water use efficiency by SRI varied among different countries. This was due to different climate, rice variety and soil type among the countries. However, only few information have been reported on enhancing water use efficiency under SRI compared to conventional practice in Indonesia, e.g. Sato et. al [6] in eastern Indonesia. The aim of the current study is to investigate enhancing water use efficiency by SRI practice in western Indonesia particularly in the rainy season. METHODOLOGY Field Location and Rice Cultivation This study was conducted in the paddy fields in Karang Sari village, district of Cikarang Timur, Bekasi, West Java, Indonesia during the first rice season 2007/2008 (December 2007 to April 2008) in the rainy season. The soil was alluvial and had a heavy clay texture with a soil ph of 5.8 and a low organic matter content (1.7%). Here, we prepared six plots and each plot was a 9.6 m x 18 m rectangular shape. All plots were planted with the local variety of rice (Oryza sativa L), Sintanur, a hybrid rice variety. Three plots were planted by SRI practice consisting some elements such as single planting of young seedling (10 days after seedling) spaced at 30 x 30 cm, using an organic fertilizer at 7 tons/ha and no chemical fertilizer. Moreover, indigenous microorganisms grown in a bamboo sprout and fruits mixture were supplied to the field 10, 20, 30, 40 and 50 days after transplanting (DAT). The indigenous microorganisms enhance the biological activity of the soil [15]. Meanwhile, others plots were planted by conventional practice with some elements such as old seedling (30 days after seedling), spaced at 20 x 20 cm, using chemical fertilizer based on guideline of agricultural department officer. Plant growth was observed and recorded every ten days, starting from 15 DAT. For each plot, we measured plant height and number of tillers/hill to assess effects of cultivation practices on plant performances. Irrigation Regimes The detail irrigation regimes, SRI and Conventional practice (CP) were illustrated in Figure1. Here, the experimental design was a single factorial design with three replications. Data were analyzed by one-way analysis of variance (ANOVA) hypothesizing irrigation regime to be the significant source of variation. For the SRI regime, the soil was kept moist but with no standing water during vegetative stage, i.e., stage I (initial) and stage II (crop development stages), then shallow standing water ranging in depth from 5 to 2 cm was applied during reproductive stage (stage III) and finally water was drained to maintain saturated soil until harvesting day (stage IV). Meanwhile, for CP regime, the field was maintained by ponding water with the interval 2-5 cm water depth during planting period except stage I, then in the stage IV, water was drained to maintain saturated soil until harvesting day. 74

91 1 st TOPIC Figure 1. Irrigation regimes in this study Water Balance and Water Use Efficiency in the Field Water balance analysis was performed to determine the water supply and water use within the crop season in daily basis based on the following equation: ds WL P(t) I(t) Gw(t) Qr(t) DP(t) ETc(t) (1) dt ds where is the change in water depth (mm), WL is water level measured from soil surface (mm), P is dt precipitation (mm), I is irrigation water (mm), Gw is groundwater (mm), Qr is runoff (mm), DP is deep percolation (mm) and ETc is crop evapotranspiration (mm). Here, Gw, water that comes from the ground, was assumed to be zero due to the negligible rate. Here, precipitation (P) was measured by a rain gauge and water level (WL) was measured by a piezometer. Meanwhile, runoff was defined as excess water from precipitation that was removed from the field artificially to maintain desired water levels during the planting period and its rate was measured by a water meter. Then, the change in water depth was calculated based on a soil retention curve by using Genuchten model [16]. To calculate and estimate the other parameters, such as percolation, crop evapotranspiration, and irrigation water, Microsoft Excel s Solver was used as described by Abdel-Fattah et al. [17] and the guide to use it could be referred to Morrison [18]. In this study, we tried to find the combination of the parameters to minimize the following error: Error for theperiod S o S m (2) where, S o is daily-observed soil water storage (water depth mm), S m is model based soil water storage (mm) estimated by the Excel Solver estimation. Water use efficiency index is defined as a measure of crop yield (dry matter) per unit water supplied, by following equation [12]: 75
92 Plant height (cm) Tiller number per hill 1 st TOPIC Sustainable Rural Development-Towards A Better World Purwokerto, August 25-26, 2013 WUE (kg/ha/mm) Yield (kg/ha) (3) Irrigation water (mm) Furthermore, we calculated water productivity (WP) to look up another water-rice production relationship. In paddy fields, WP is calculated using the following equation [12]: Yield (kg/ha) WP (kg/ha/mm) (4) ETc (mm) where, ETc is crop evapotranspiration (mm) derived from water balance analysis previously. RESULTS AND DISCUSSION Plant Growth and Yield Plant performance between two cultivation practices are shown in Figure 2. In the SRI practice, with the same physiological age, the plant height was higher than that in the conventional practice. This is probably due to the plant had greater growth potential of root and shoot by the application of young seedling and wider spacing [11]. Moreover, SRI promotes increased plant activity in roots and shoots due to optimal water and oxygen availability under mostly aerobic soil conditions [19]. However, in the last growth stage, both the plant heights were comparable with the maximum plant height of 136 cm for both practices A 40 B SRI Conventional Days after sowing Days after sowing Figure 2. Comparing plant growth between SRI practice and conventional practice: (A) plant height, (B) tiller number per hill The same trend was seen for the tiller number per hill. The tiller number in the SRI was higher than that in the conventional particularly in the initial, crop development and late stages. It showed that under SRI with wider spacing, the ability of rice tillering could be enhanced to some extent when the plant had a wider space to grow. Rice tillering could also be enhanced by application of straw mulching under nonflooded irrigation as reported by the previous study [20]. Overall, in both practices, rice tiller number gradually increased and reached a peak at about 65 days after sowing (Figure 2B). The maximum tiller number per hill was 48 and 42 for the SRI and conventional practices, respectively. Water availability in the field Both cultivation practices were irrigated to maintain the water level at the interval level during the crop season, as described previously (Figure 1). However, measurement of the actual water level was quite different from that of the desired water level, as affected by high precipitation in the rainy season as 76
93 Irrigation (mm) Water level 1 st TOPIC shown in Figure 3 and Figure 4. This occurred when the restarting of irrigation time was determined visually and the natural environment was unpredictable, particularly in terms of precipitation. Even if it was kept saturated for 7 to 20 days after transplanting (DAT), the actual water level dropped below the soil surface, particularly within 12 to 17 DAT due to the high evaporation that occurred on some days. Furthermore, the actual water level increased dramatically on 20 DAT and reached approximately 10 cm above the soil surface in both regimes. This was caused by a high amount of precipitation (136 mm) over three days SRI: System of Rice Intensification Precipitation (mm) Observed water level (mm) Calculated water level Irrigation (mm) threshold Precipitation Estimated irrigation water (mm) Runoff (mm) 0 50 Runoff (mm) Days after transplanting Figure 3. Water availability of SRI in the field Within the period of 20 to 40 DAT, water stresses were likely to exist for both water management regimes, as illustrated by the lowest water level in Figure 2 and Figure 3. At that time, the water level reached 5.8 cm below the soil surface and 0.8 cm above the soil surface for the SRI and the CP practices, respectively. This condition occurred when precipitation was limited within this periods and minimum irrigation was supplied to the field. 77
94 Irrigation (mm) Water level (mm) 1 st TOPIC Sustainable Rural Development-Towards A Better World Purwokerto, August 25-26, 2013 Table 1. Water balance components between the practices Water balance components SRI CP Inflow: Precipitation (mm) 920±0a 920±0a Irrigation water (mm) 289±32a 390±11b Total Inflow (mm) 1209± ±11 Outflow: Crop evapotranspiration (mm) 292±6a 290±5a Runoff (mm) 808±34a 876±11b Percolation (mm) 108±10a 143±1b Total Outflow (mm) 1208± ±17 Error between inflow and outflow (%) 1.61% 0.54% the values showed the average ± standard deviation a, b significant at p< CP: Conventional Practice Precipitation (mm) Observed water level (mm) Calculated water level Irrigation (mm) threshold Precipitation Estimated irrigation water (mm) Days after transplanting Runoff (mm) Figure 4. Water availability of conventional practice in the field The Excel Solver estimation was able to estimate all of the non-measurable variables with high accuracy shown as low cumulative error values of 1.61% and 0.54% for the SRI and the CP, respectively (Table 1). The higher water input in the CP regime did not result in higher water consumption represented by crop evapotranspiration. Instead, this regime significantly increased the water loss through percolation by up to 24% (Table 1). Thus, the SRI regime can be considered as an alternative way to reduce percolation during the crop growth period, as also investigated in a previous study [21]. The percolation rate depends on the physical soil condition and it rate increases when the 78
95 1 st TOPIC depth of water standing in the field increases [22, 23, 24]. The increasing standing water in the field will increase hydrostatic pressure, thus this situation stimulate downward movement of excess water in the soil to be percolation. Consequently, the CP regime with ponding water 2-5 cm in the field contributed to higher percolation rate compared to the SRI regime. Moreover, the CP regime also contributed to higher runoff significantly compared to the SRI regime (Table 1). These results suggested that the application of continuous flooding irrigation for irrigated rice was insufficient in water use because more excess water occurred through percolation and runoff. Water Use Efficiency Table 2 presents the water use efficiency index, water saving, and productivity in both irrigation regimes. It was clearly observed that the SRI can save a substantial amount of water, so the water use efficiency index can be increased significantly up to 37.6%. The higher value of the index was due to the minimum irrigation water in the SRI with comparable amounts of water consumption in both regimes (Table 2). Also, the excess water through percolation and runoff can be minimized by the application of the SRI. The increasing of water use efficiency index also was affected by high precipitation in the rainy season. Therefore, minimum irrigation water was needed especially for the SRI. However, for the dry season with different pattern of precipitation and weather conditions, the increasing of water use efficiency index for SRI is probably different with the current values. In addition, the current study revealed that water productivity for both regimes was not significantly different (Table 2). The comparable values of water productivity were caused by the comparable crop evapotranspiration and yield between the SRI and the CP regimes (Table 2). The comparable yield was obtained from the similar plant performances between the regimes, as shown in Figure 2, which reveals no significant differences in plant height and number of tillers/hills during the crop season. The similar result was also reported by the previous study [25]. They reported that during two rice seasons in China (1999 and 2000), there was no significant difference in yield between continuous flooding and intermittent irrigations. As early mention, SRI resulted in better yield and plant performances compared to conventional practice even if not significant. The main reason is that under SRI, aerobic condition was created. This condition promoted higher activity of the plants for the establishment of a larger and deeper root system [15]. Also, this condition enhanced shoot activities when optimal water and oxygen available under intermittent irrigation [19]. These results suggested that SRI is suitable way to increase water use efficiency without decreasing yield at the same time. CONCLUSIONS The main findings of this study were that SRI enhanced water use efficiency index significantly by up 37.6% in the rainy season. Also, this regime can save water input up to 26.07% compared to conventional practice (CP). The SRI regime reduced excess water through percolation and runoff significantly. The SRI regime also resulted in better yield and crop performance compared to CP regime even if not significant. The main reason is that under intermittent irrigation, aerobic condition was created. This condition promoted higher activity of the plants for the establishment of a larger and deeper root reported previous studies. Therefore, the results suggested that intermittent irrigation is suitable way to raise water use efficiency without decreasing yield for irrigated rice in Indonesia particularly in the rainy season. More experiments particularly in the dry season will be meaningful to examine water use efficiency index under SRI regime with different pattern of precipitation and weather conditions. 79
96 1 st TOPIC Sustainable Rural Development-Towards A Better World Purwokerto, August 25-26, 2013 ACKNOWLEDGMENTS We are grateful to the Directorate of Higher Education, Ministry of National Education, Republic of Indonesia for generous financial support through grant of International Research Collaboration and Scientific Publication. Also, the study was partially supported by GRENE (Green Network of Excellence) project of MEXT in Japan. 80 REFERENCES [1] Statistics Indonesia. Production, Harvested area, Productivity of Rice and Crops in Indonesia, Accessed from 4 April 2013 [2] De Silva CS, E K Weatherhead, J W Knox, J A Rodriguez-Diaz. Predicting the impacts of climate change A case study of paddy irrigation water requirements in Sri Lanka. Agric Water Manag 93 pp , 2007, doi: /j.agwat [3] Radhika, S. Amirwandi, Ratna Hidayat, Muhammad Fauzi, Waluyo Hatmoko. Kebutuhan air di Indonesia. Kolokium Hasil Litbang Sumber Daya Air Bandung 2 May 2012 [4] Bouman B.A.M. Water-efficient management strategies in rice production. International Rice Research Note 26 (2) pp , 2001 [5] Zhao LM, Wu LH, Wu MY, Li YS. Nutrient uptake and water use efficiency as affected by modified rice cultivation methods with reduced irrigation. Paddy Water Environ 9 (1) pp , doi: /s [6] Sato S, Yamaji E, Kuroda T. Strategies and engineering adaptions to disseminate SRI methods in large-scale irrigation systems in Eastern Indonesia. Paddy Water Environ 9 (1) pp , doi: /s [7] Lin XQ, Zhu DF, Lin XJ. Effects of water management and organic fertilization with SRI crop practices on hybrid rice performance and rhizosphere dynamics. Paddy Water Environ 9 (1) pp , doi: /s y [8] Sinclair TR, Cassman KG. Agronomic UFOs. Field Crop Res 88 (1) pp doi: /j.fcr [9] Sheehy JE, Peng S, Dobermann A, Mitchell PL, Ferrer A, Yang JC, Zou YB, Zhong XH, Huang JL. Fantastic yields in the system of rice intensification: fact or fallacy? Field Crop Res 88 (1) pp doi: /j.fcr [10] Dobermann A. A critical assessment of the system of rice intensification (SRI). Agr Syst 79 (3) pp doi: /s x(03) [11] Uphoff N, Kassam A, Harwood R. SRI as a methodology for raising crop and water productivity: productive adaptations in rice agronomy and irrigation water management. Paddy Water Environ 9 pp doi: /s [12] Van der Hoek W, Sakthivadivel R, Renshaw M, Silver JB, Birley MH, Konradsen F. Alternate wet/dry irrigation in rice cultivation: a pratical way to save water and control malaria and Japanese encephalitis? Research Report 47. International Water Management Institute, Colombo, Sri Lanka, [13] Chapagain T, E Yamaji. The effects of irrigation method, age of seedling and spacing on crop performance, productivity and water-wise rice production in Japan. Paddy Water Environ 8 pp , doi: /s [14] Hameed KA, Mosa AKJ, Jaber FA. Irrigation water reduction using System of Rice Intensification compared with conventional cultivation methods in Iraq. Paddy Water Environ 9 (1) pp , doi: /s [15] Uphoff N, and Kassam, A. Case study: The system of rice intensification. Cornell International Institute of Food Agriculture and Development (CIIFAD) NY 14853, USA [16] Van Genuchten MT. A Closed-form Equation for Predicting the Hydraulic Conductivity of Unsaturated Soils. Soil Sci Soc Am J 44 pp , 1980 [17] Abdel-Fattah YR, El-Enshasy HA, Soliman NA, El-Gendi H. Bioprocess Development for Production of Alkaline Protease by Bacillus pseudofirmus Mn6 Through Statistical Experimental Designs. J Microbiol Biotechn 19 (4) pp doi: /jmb
97 1 st TOPIC [18] Morrison FA. Using the Solver add-in in Microsoft Excel. Michigan Technological University Web [19] Yang JC, Zhang JH. Crop management techniques to enhance harvest index in rice. J Exp Bot 61 (12) pp , doi: /jxb/erq112 [20] Wang D, Li H. X, Qin J. T, Li D. M, Hu F. Growth characteristics and yield of late-season rice under no-tillage and non-flooded cultivation with straw mulching. Rice Science, 17(2) pp [21] Mao Zhi. Environmental impact of water-saving irrigation for rice. In Irrigation scheduling: From theory to practice. Proceedings of the ICID/FAO Workshop on Irrigation Scheduling, Rome, Italy, September Rome: FAO [22] Tuong TP, Bhuiyan SI. Increasing water-use efficiency in rice production: farm-level perspectives. Agr Water Manage 40 (1) pp , [23] Guerra LC, Bhuiyan SI, Tuong TP, Barker R. Production more rice with less water from irrigated systems. SWIM Paper 5. International Water Management Institute, Colombo, Srilanka, [24] Kalita PK, Kanwar RS, Rahman MA. Modeling Percolation Losses from a Ponded Field under Variable Water-Table Conditions. Water Resour Bull 28 (6) pp , doi: /j tb04014.x [25] Belder P, Bouman B A M, Spiertz J H J, Peng S, Castaneda A R, Visperas R M. Crop performance, nitrogen and water use in flooded and aerobic rice. Plant Soil 273 pp doi: /s
98 1 st TOPIC Sustainable Rural Development-Towards A Better World Purwokerto, August 25-26,
99 1 st TOPIC DIRECT SEEDING PLANTATION RICE SYSTEM IS ONE OF ALTERNATIVE IN AGRICULTURE WATER CONSERVATION MANAGEMENT ENGINEERING AT FARM LEVEL Nurpilihan Bafdal Lecturer at Department of Agricultural Industry Technology, Padjadjaran University ABSTRACT In general the water requirement of low land rice such as paddy needs more water 1 liter/second/ha on his growth, but the planning for the improvement of the development of irrigation should be different to the historical kind of agricultural uses, environment such as soil physics, the size of land climate conditions especially rainfall, growing stage period and paddy varieties. In Asia countries the traditional form of agricultural water used still exist. Traditional way of irrigation water management on farm level for low land rice is countinos flooding water with 8-15 cm depth during whole paddies growth. This type could make finite amount of water area and needs high amount of water. On farm level should introduce a technology which is low amount of water for low land rice. Nurpilihan (2000) was carried out experiment and obtain that the direct seeding plantation rice system (DPRS), with various water flooding treatment should contribute to improve irrigation from paddies stage. The objective of the study were to determine the effect of varying flooding depths of the stages (vegetative and reproductive) with direct seeding plantation rice system on response of paddy yield, number of tillers, paddy height and water use efficiency. Results of the study showed that: 1. The numbers of tillers under all treatment were found decreasing after 78 days after transplanting. More number of tiller (68.3) were observed in treatment A1 while least number of tillers were found at treatment A4 with 28 days after transplanting. 2. All treatment resulted in different amount of growth paddy yield but no significantly effect between flooding irrigated water on paddy yield 3. The treatment A3 gave the highest per liter of water used (0.770 gram). Water used efficiency shallow flooded treatment was higher while treatment A5 gave the lowest return per liter of water used (0,550 gram) 4. Muddy condition during whole paddy growth could give available water and show significant effect for all treatment, so muddy condition good technology to introduce for the farmers. Keywords: Direct Seeding Plantation Rice System (DSPRS), muddy condition INTRODUCTION Paddy (Oryza sativa L.) is dominantly on Asia crop, which is requires an effective water management practice during its growth periode. In the Asia region, Indonesia is one of the major paddy producing country, although the average yield reported is only 5 ton/ha. One of reasoning the low yield is due to the inadequate supply of water; hence in order to maximize the production and irrigation water application system as a whole, researcher should be found of new plantation rice system such as effective water management. Irrigation is the artificial supply of water to the soil for the purpose of increased crop production. In many parts of the world the amount and timing of rainfall are inadequate and inappropriate to meet the moisture requirement of crops, and irrigation becomes essential to raise crops near to their maximum yield in such areas. The demand for water in various sectors is increasing day by day, due the climate change water is no longer considered to be an unlimited resources, so its efficient utilization in agriculture demands very careful study. In general the water requirement of low land rice such as paddy needs 1 liter/second/ha, but the planning for the improvement of the development of irrigation should be different to the historical kind of agricultural uses, environment such as soil physics, the size of land, climate conditions especially rainfall, growing stage period and paddy varieties. 83
100 1 st TOPIC Sustainable Rural Development-Towards A Better World Purwokerto, August 25-26, 2013 Indonesia have two season; these are wet season and dry season. During the dry season, irrigation water availability is limited for crop production so the efficient and judicious use of this water is necessary in order to get maximum crop yields. For the optimum paddy growth needs to optimize the allocation of water and reducing the amount of water needed for irrigation efficiency with create new technology of water conservation engineering that are available for low land rice. Nurpilihan (2000), was carried out the research on Study of The Influence of Water Flooding to the Growth, Yield and Water Management of Direct Seeding Plantation Rice System. METHODOLOGY Nurpilihan (2000), was carried out the experiment: The Influence of Water Flooding to the Growth, Yield and Water Efficiency of Rice on DSPRS. The experiment was carried out from September at Sukamandi of low land rice Membramo variety at West Java Indonesia. The altitudes are 10 meters above sea levels. The experimental design was Randomized Block Design with four replications. The experimented treatments were water flooding (A), the irrigation treatment consisted of continuous flooding depth of water and muddy conditions with varies of paddy crop stages these are: a1: continuous flooding with 2-3 cm standing depth of water a2: muddy condition (0 1 cm water depth) a3: muddy condition on vegetative stage, continuous flooding with 2 3 cm standing depth of water on reproductive phase and muddy condition on maturing stage a4: muddy condition on vegetative and reproductive stage and continuous flooding with 2-3 cm standing depth of water on maturing stage a5: continuous flooding with 2-3 cm standing depth of water on vegetative stage and muddy condition on reproductive until maturing stage RESULTS AND DISCUSSION Measured of plant height will start when paddy growth is 28 days after planted and with 10 days interval. Table 2 below showed the effect between flooding standing depth water of DSPRS with days after planting on heights of paddy. Table 2. The effect of flooding standing depth water of DSPRS on heights of paddy crops of varies days after planting. Treatments Heights of Paddy Crop 28 DAP 38 DAP 48 DAP 58 DAP 68 DAP 78 DAP 88 DAP 98 DAP A a a a a 94.8 a a a a A c b c c c c c c A b b c d c c c bc A d c d c b d d d A a a b b d b b b Note: The mean values of heights of paddy crop not followed by the same small letters are significantly defferent of test level at 5 % of Duncan test. 84

101 1 st TOPIC Figure 1 Below showed chart of the effect between flooding standing depth water of DSPRS on heights of paddy crops of varies days after planting. Figure 1. The effect between flooding standing depth water of DSPRS on heights of paddy crop of varies days after planting Plant heights were different in all treatments and period stage of paddy crop. Taller plants were noticed in treatment A1 (96,85 cm) with 78 days after planting; were observed in continuous flooded with 2-3 cm standing depth of water(treatment A1) and shorted plants ( 44,62 cm) were noticed in treatment A4 with 28 days after planting. The results from Table 2 showed that flooding irrigated water give not significantly effected after reproductive stage of paddy height; while on vegetative stage of paddy showed high water requirements. Number of Tiller Results showed that were significantly the effect of flooding standing depth water on number of tillers with DSPRS (Table 3 below): Table 3. The effect of flooding standing depth water of DSPRS on number of tillers of varies days after planting Treatments The Number of Tillers 28 DAP 38 DAP 48 DAP 58 DAP 68 DAP 78 DAP 88 DAP 98 APD A b 49.4 ab 54.6 a 60.7 a 68.3 a 65.7 a 63.3 a 65.7 a A b 46.5 bc 49.4 b 51.9 b 56.1 b 64.7 bc 54.4 b 64.2 a A b 47.3 bc 49.6 b 53.6 b 57.5 b 55.5 b 55.2 b 55.8 a A b 45.0 c 47.6 b 49.3 b 50.7 c 52.1 c 50.3 c 48.7 b A a 51.6 a 52.8 a 63.7 a 66.7 a 65.9 a 61.2 a 50.2 a Note : The mean values of number of tillers not followed by the same small letters are significantly different of test level 5% of Duncan test. 85

102 1 st TOPIC Sustainable Rural Development-Towards A Better World Purwokerto, August 25-26, 2013 Figure 2 below showed the effect of flooding standing depth water of DSPRS on number of tillers of varies days after planting. Figure 2. The effect of flooding standing water of DSPRS on number of tillers of varies days after planting The number of tillers of paddy plants were observed increasing upto 38 days after transplanting (Tabel 3). The number of tillers under all treatments were found decreasing after 78 days after transplanting and it continued upto 98 days after transplanting. More number of tiller (68.3) were observed in treatment A1 while least number of tiller were found at treatment A4 with 28 days after transplanting. At harvest stage all treatments had almost equal number of tillers and were significant effect except treatment A4 Grain Yield No significantly effect between flooding irrigated water on grain paddy yield of all treatments. Table 4 showed that effect of flooding irrigated water with DSPRS on grain paddy yield as below: Table 4. The effect of flooding standing depth water of DSPRS on grain paddy yield/plot (gram) Treatments Grain Paddy Yield /plot (gram) A1 A2 A3 A a 5330 a 5510 a 5895 a A a Note: The mean values of paddy yield not followed by the same small letters are significantly different of test level at 5% of Duncan test. All treatments resulted in different amount of grain paddy yield but no significantly effect between flooding irrigated water on paddy yield. Although no significantly effect of paddy grain yield of all treatment but the yield under treatment A4 was 5895 gram which was highest among all treatments, were the least paddy grain yield was found under treatment A5 (5165 gram).the problems are could the farmers good enough skills to apply irrigated water to the paddy fields as the all treatments?; and could the farmers knows the correlation between scheduling of irrigation with the critical mass of paddy stages?. The experts and researchers should give special attentions to the new technology such as DSPRS; paddy growing stages and water application training to farmers especially for low land rice s farmers. 86

103 1 st TOPIC Figure 3 below showed the effect of flooding standing depth water of DSPRS on grain paddy yield. Figure 3. The effect flooding standing depth water of DSPRS on grain paddy yield Water Used Efficiency Water used efficiency is a ratio between grain paddy yield/ plot (gram) with total water requirements for experiment per plots (liter) Water used efficiency = Paddy yields (grams) Total water requirement/plot (liters) The treatment A3 gave the higest per litre of water used (0,770 gram). Water used efficiency shallow flooded treatment was higher while the treatment A5 gave the lowest return per litre of water used (0,550 gram). Muddy condition during whole paddy growth could give available water and showed non significantly effect for all treatments, so muddy conditions good way to introduced for the farmers (Table 5). Table 5. The effect of flooding standing depth water of DSPRS on water used efficiency Treatment Water Used Efficiency (gram/liter) A1 A2 A3 A4 0,410 c 0,825 a 0,770 ab 0,665 ab A5 0,550 bc Note: The mean values of water used efficiency not followed by the same small letters are significantly different of test level at 5% of Duncan test. 87
104 1 st TOPIC Sustainable Rural Development-Towards A Better World Purwokerto, August 25-26, 2013 Figure 4 below showed the effect flooding standing depth water of DSPRS on water used efficiency. Figure 4. Chart the flooding standing depth water of DSPRS on water used efficiency CONCLUSIONS 1. Direct seeding plantation rice system (DSPRS) responses of paddy yield, number of tillers, paddy height, and water efficiency and also effect of varying flooding depths of paddy growing stages such as vegetative and reproductive. 2. The methode with 0-1 cm flooding depth or muddy condition results in best yield of rice, and become an alternative better way for an efficient water management on paddy field especially during dry season when water resources is stricly limited. 3. Direct Seeding Plantation Rice System is one of altenative way in which could conserved the water supply to the minimum volume of water requirement of low land rice. It could also keep available a water conservation sustainable during whole paddies growth. 4. No significantlly effect between flooding standing depth water with muddy condition on grain paddy yields (Tabel 4).So if farmers have a good enough skill to determine paddy periode stages, better applied a muddy condition compared with flooding standing depth water at paddies field. 5. The treatment A2 gave a highest grain per litre of water used (0,825 gram/litre) while the treatments of A3 (0,770 gram/litre) and A4 (0,665 gram/litre) gave a non significantly effect on water used efficiency. So treatment A2 is one of alternative ways ia agriculture water management engineering at paddy field especially during dry season. REFERENCES [1] De Datta, SK., Principles and Practices of Rice Production. John Willey & Son. New York. [2] Matsushima, S.,1992. The Stage of Water Resources Development and The Macro Classification of the Existing irrigation in Japan. Seminar Paper on Agricultural Engineering and Technology, Bogor Indonesia. [3] Nurpilihan B., The Influence of Water Flooding to The Growth, Yield and Water Efficiency of Rice on Direct Seeding Plantation Rice System. Research Report ; Agriculture Industrial Technology Faculty of Padjadjaran University, West Java Indonesia. [4] Nurpilihan B, Estimation of water Requirement of Evavotranspiration by Using Models Penman; Radiation; Blaney Criddle and Pan Evaporation. Thesis Master of Agriculture Engineering. AIT s Library Bangkok Thailand. [5] Widyantoro and Ardjasa Development of Direct Seed Plantation Rice System. Seminar Paper in Aplication of Technology Packet, Bandar Lampung Indonesia. [6] Suzuki, and Nurpilihan B., 1992., Water Requirements of Low Land Rice at Babakan Siliwangi West Java Indonesia. Joint Research Between Universitas Padjadjaran and Public Services West Java Indonesia. 88
105 1 st TOPIC MODELING WATER MOVEMENT IN LIMITED STRIP-TILLAGE WITH STRIP SHALLOW IRRIGATION FOR CROP CULTIVATION CONCEPT Y. I. Intara 1 and A. Sapei 2 1 Mulawarman University, Agro-technology, Department of Agricultural Faculty. Samarinda, Indonesia 2 Bogor Agricultural University (IPB), Civil and Agricultural Environment, Department of Agricultural Technology Faculty, Bogor, Indonesia izmi_6@yahoo.com ABSTRACT Dry land is one of land resources which potentially used for food crop cultivation, especially in the areas which have light to medium technical obstacles. The development of technology to improve soil quality in marginal lands to be productive lands is still widely open for agricultural development in Indonesia. Rooting medium quality can be improved by changing soil tillage method and observing the proper crop irrigation technology. It can be the solution for improvement traditional crop cultivation in clay loam soil. This study aimed to obtain a new concept of water movement model in a minimally-tilled clay soil with strip shallow irrigation for improvement traditional crop cultivation. The concept is limited soil-tillage with strip shallow irrigation method, water supply technique, and crop water requirement. Method used in this study includes developing water movement model (software development) in a minimally-tilled clay soil with subsurface irrigation. In the final stages, research also conducted water movement analysis testing apparatus in the laboratory, field validation of the subsurface irrigation performance, and cultivation technique testing to chili pepper growth (Capsicum annuuml.). The development of water movement simulation on a limited strip-tillage with subsurface irrigation uses the concept to quantify the amount of water in the soil. The analysis of movement pattern was demonstrated on contour patterns. It showed that the wetting process can reach depth zone 5 cm to the rooting zone. It was an important discovery on the development of minimum stripe tillage soil with subsurface irrigation. Specifically, it can be concluded that: the result of fitting by eyes to diffusivity graphic and water content obtained the required parameter values for soil physical properties. It was then simulated on horizontal water movement model on a minimum strip-tillage with strip shallow irrigation. Keywords: limited strip tillage, strip shallow irrigation, water movement model, clay soil INTRODUCTION Conventional soil tillage in its application in the field eventually results in more works than minimum tillage [1]. One of the minimum tillage concepts is strip-tillage or a form of conservation tillage in which only row zones are tilled, leaving the 9- to 12-inch inter-row zone undisturbed and the soil is not plowed [2]. One of the advantages of applying strip-tillage is it allows for a better seedbed for plant growth than conventional tilling, lower energy requirement, and undisturbed surface between rows acts as erosion repellent. Strip-tillage provides supportive environment for planting seeds in a row [3]. It also helps increasing infiltration velocity [4], as well as improving not only water availability for crops along the root zone but also water recharge [5]. Soil tillage is an alternative which can help solving the problems in marginal areas with clay loam texture (podzolic), other alternatives should be considered in the selection of land irrigation technology. By selecting several irrigation technology alternatives, it is found that subsurface irrigation is more appropriate for marginal lands or clay loam soil (podzolic). Clay soil is usually characterized by its slow permeability and shallow subsoil. It inhibits the root growth and eventually reduce production. Thus, an optimum addition of irrigation water is needed for crop planting using subsurface irrigation system installed in certain depth below surface drainage [6]. In limited soil tillage, the maintenance is simple and can be conducted easily. Moreover, soil will transport the water more effectively. Subsurface irrigation management is targeted to achieve relative soil aggregates. Soil aggregate stability can be repaired by the addition of organic matter. Hillel stated to grow successfully, a plant must achieve a water economy such that the demand made on it for 89
106 1 st TOPIC Sustainable Rural Development-Towards A Better World Purwokerto, August 25-26, 2013 water is balanced by the supply available to it [7]. The excess or lack of water will damage the plant growth. Strelkoffet et al., explained that the solving the hydraulic equation of unsteady flow in an irrigation channel is approached with available infiltration or up filtration formulation in flow resistance parameters as well as water channel design testing [8]. The analysis is only the proof of performance prediction for data input accuracy. Through the analysis on porous medium (soil), water will move if potential gradient occurs. Flow flux on saturated porous medium has been discovered by Darcy [9]. Water movement on the ground is closely related to soil hydraulic conductivity even though it has no fixed value, but diminishing as the water content decreases or equal to the declining of groundwater matrix suction [10]. Water movement phenomenon is a part of wetting and drying process which displayed the difference among hydraulic conductivity with volumetric moisture content and matrix suction [11]. Thus, moisture retention characteristic curve displayed the phenomena of capillarity pressure (matrix suction) and water content is important and basic in an analysis of water and solution transportation on vadoze zone [12]. Limited soil tillage cultivation is developed to strip-tillage with subsurface irrigation only for seasonal crop cultivation. It can be applied as the alternative of marginal land utilization. The study aimed to: obtain the combination of soil texture and the addition of organic matter to water availability, study the management of soil moisture in the root zone and analyze the experimental design compare to soil physics concepts. METHODOLOGY The modeling of water content movement in strip-tillage is conducted independently using portable computer with software of Microsoft Excel, Visual Basic Editor, and Surfer version 8 to create contour. Procedure of research shown in Figure 1. Soil diffusivity experiments (investigation of the diffusion equation) with horizontal water movement (horizontal column) as proposed by Bruce and Klute was conducted in the laboratory [13]. The development of water movement simulation in strip-tillage with subsurface irrigation uses the concept to quantify the amount of ground water. There are 2 approaches: volumetric water content, θ (water volume) and matrix suction (cm) or pressure head, h (-cm). Furthermore, the result from simulation program is converted to contour after being processed with Surfer software. This procedure will make the existed flow pattern is a lot easier to analyze. 90
, organic matter (compost), water for strip shallow irrigation, and chili seeds.")
 and A 2 (twice-a-day watering, in the morning and evening), while the addition of organic matter consists of 4")
107 1 st TOPIC Figure 1. Flow chart of research procedure The cultivation technique was tested to see its effect on plant sample growth. It was carried out in the dry land with high clay content. The materials are clay loam soil (podzolic), organic matter (compost), water for strip shallow irrigation, and chili seeds. The testing design used Completely Randomized Design, with 2 factors: water supply schedule (A) and the dosage of compost (K). Water supply factor consists of two types: A 1 (once-a-day watering, in the morning) and A 2 (twice-a-day watering, in the morning and evening), while the addition of organic matter consists of 4 levels: without organic matter K 0, K 1 (1.5 kg), K 2 (3 kg), and K 4 (4.5 kg).completely randomized design was conducted with three replications. Those aspects are made into a concept design of a cultivation technique for seasonal crop and combining the limited strip-tillage method with strip shallow irrigation as it is shown in Figure 2. Figure 2. The initial concept of cultivation development technique for seasonal crop with limited striptillage and strip shallow irrigation 91
. To improve soil productivity, the introduction of organic matter and chemical fertilizer are needed.")
108 1 st TOPIC Sustainable Rural Development-Towards A Better World Purwokerto, August 25-26, 2013 RESULTS AND DISCUSSION Dry land is one of land resources and potential for food crop cultivation, especially in the areas having light to medium technical obstacles (shown in Figure 3). To improve soil productivity, the introduction of organic matter and chemical fertilizer are needed. More over, it is important to apply proper soil tillage and the concept of soil and water conservation. The development of technology to improve soil quality in marginal lands to be productive lands is still widely open for agricultural development in Indonesia. Rooting medium quality can be improved by changing soil tillage method and applying proper irrigation technology. When the rooting medium is repaired, the soil quality of marginal region is improved. The effort to improve soil quality is focused on the reclamation of ex-mining areas to be productive farms. The cultivation technique that improves the soil tillage irrigation technology can be the alternative for land quality improvement. Figure 3. a) In general, soil tilling in Indonesia is conducted conventionally, b) Marginal lands are targeted for agricultural land expansion in the future, and c) Yellow-brick podzolic soil is one of marginal-types soil with clay loam texture The explanations mentioned above is the foundation for the improvement and correction in seasonal crop cultivation method that is specific to location. The aspects to support the improvement are: First aspect: the alternative soil tillage technology proposed in this study is strip-tillage method. In general, tillage is the agricultural preparation of soil to provide proper soil physics characteristics for crop growth. Minimum tillage (strip) has several advantages compared to other soil tillage methods. Second aspect: the irrigation for the area, which considers the land condition (marginal land with clay loam texture). It applies shallow subsurface irrigation. Third aspect: modifying the two methods mentioned above by combining both techniques and resulting in a cultivation technique for seasonal crop. It provides ET crop in the rooting zone and minimum tillage for land conversion. The surface areas between the rows enable easier crop nurturing. The research application acts as an alternative for marginal lands improvement for clay loam soil. The cultivation technique focused on irrigation which caused water movement distribution in tilled soil. Water flow movement is analyzed within the boundaries and it is a new invention. It also enables the development for further cultivation technique. The development according to adopted soil tillage from minimum strip tillage so that it has basic difference with the previous cultivation technique for seasonal crop [14]. The innovation is focused on the cultivation technique of seasonal crop from the combination of limited strip-tillage with strip shallow irrigation and water supply technique for fulfilling crop water use in a strip row and has the mean of conservation (land reclamation). The development technique is divided into three main parts: (a) crops and rooting medium; (b) strip, and (c) irrigation and drainage. The description of cultivation technique for seasonal crop is described below: the crop for this study is a seasonal crop (chili pepper) which can be harvested in less than 4 months. Rooting medium was soil from the strip (trench) and added with compost. Strip was made of rectangle block with 2-4 m long, 0.2 m wide, and 0.2 m. Its top, right, and left side was left open and made of compacted soils. Its sides could be made either permanent or semi-permanent in order to be used repeatedly by only repairing the rooting medium. The trench floor was made water proof with the slope 2-3 that can be made only from compacted soils. Irrigation system (shallow subsurface irrigation) was made from manual/traditional irrigation (intermiten), where the water container was 92

109 1 st TOPIC placed at the upstream. There were holes at the bottom side of water container that lead to irrigation channel and end up in the field. Drainage system at the down stream served to prevent excess water, especially during the rainy season. Considering the conditions previously mentioned, this study was strengthened with scientific analysis as the foundation for further research. The analysis included water movement model on a limited striptilled clay soil with subsurface irrigation. It generated information regarding soil physical properties data and a measuring instrument (interface) along with a set of testing apparatus are made to analyze the water flow in tilled soil. It followed by water flow analysis in a set of experiments in the laboratory and field validation of subsurface irrigation performance on shallow tilled soil. The final testing was the cultivation technique and its effect to plant growth. Water distribution in unsaturated state soil is capillary rise. It occurs in the ground because cohesion and adhesion are greater than gravity. It can move side ways or upward due to capillary force. Some of capillary rise is available water (absorbable) for the plants. Preliminary research was carried out to gain the soil physical properties data for no-tilled and minimum-tilled soil. It was to explain the result which showed good drainage in the firm soil and rather poor drainage in the strip-tillage soil (water absorbed by till soil aggregate is limited). The irrigation performance efficiency in the limited strip-till apparatus box with subsurface irrigation showed less efficient result caused by unstable soil texture. Primary research was conducted in field, to observe the irrigation performance and its effect to seasonal crop. The selected field should meet the criteria of marginal lands so that the land conservation using limited strip-till method with strip shallow irrigation would present improvement after the proposed method is applied (Figure 4). Irrigation performance demonstrated the effective wetting of strip-tillage only in short track irrigation channels < 5 m. It is suitable for subsystem field management or to repair traditional field. Figure 4. Selection of suitable area for traditional field approach with silty clay loam-textured soil, podzolic type Preliminary research regarding soil texture selection and organic matter addition to water availability showed that clay-textured soil has lower evaporation level than clay loam soil. The addition of organic matter (compost) on clay-textured soil could increase ground water content and water availability and reduce soil volume [15]. The research was continued on main research which applied development cultivation technique approach of tested crops in the field to manage soil moisture in the root zone. It aimed to maintain the moisture or water content to be available when needed by the crops. Design testing data recapitulation of chili pepper showed that the addition of organic matter gave significant effect to plant growth. On the contrary, water supply parameter gave no significant effect to plant growth. It indicated quantitative statistic calculation led to agronomic explanation while the qualitative observation of crop graphic growth showed watering level once a day gave better effect to plant water availability, except the addition of organic matter (K3) caused more water bounded around the root zone which eventually gave negative impact when the root growth had reached wetting zone water table. Crops acted as control (K0) without the addition of organic matter showed stagnant growths which were really different with crops with the addition of organic matter (K2 and K3). Crops with organic matter (K2 and K3) grew normally both the stem and root. It was due to fluctuated ground water 93
. Moreover, chili pepper as testing crop of strip-tillage with strip shallow irrigation was widely known sensitive to excess water [16].")

110 1 st TOPIC Sustainable Rural Development-Towards A Better World Purwokerto, August 25-26, 2013 concentration influenced by irrigation water and water concentration depends on ambient factors (including the addition of organic matter). Moreover, chili pepper as testing crop of strip-tillage with strip shallow irrigation was widely known sensitive to excess water [16]. Modeling the movement of water movement in limited strip-tillage with strip shallow irrigation was carried out using visual basic editor in Excel. From fitting by eyes test on diffusivity graph and water content, the desired parameter values were obtained for formulating soil physical properties. It was then simulated on horizontal water movement model of limited strip-tillage with strip shallow irrigation. The data were applied to the development of simulation concept in water movement. It used the concept to quantify the amount of groundwater, consists of two approaches: volumetric water content, θ (water volume) and matrix suction (cm) or pressure head, h (-cm). It was followed by converting simulation data to contour after being processed using Surfer 8 software. By converting, it made the display was easier to observe. Movement patterns displayed on the contour pattern showed wetting process could reach the depth zone up to (-5 cm) to the root zone and it became an important discovery in order to develop the concept of strip-tillage with strip shallow irrigation. The water movement occurred according to contour model can be explained as follows: the cracks encountered turbulence caused by water pressure in the vicinity of the base appropriate with water pouring pressure. It was followed by spread, storage, and depletion process of water content. The validation results of water content distribution patterns at each research stage are shown in Figure 5. In the developed model system, it demonstrated that the wetting patterns take time to achieve balanced water content distribution. It emphasized that the novelty of developed system was the strip shallow irrigation with water content movement to maintain the moisture of strip-tilled soil in order to provide water availabilty for crops as it is shown in Figure 6. In the manual system, the wetting process would be less balanced at first, where the base had more wetting process than the endpoint near the outlet because of less perfect wetting. The cracks encountered turbulence caused by water pressure in the vicinity of the base appropriate with water pouring pressure. In the water content spread, storage, and depletion process, flow in the system could be described by several phases [12], which are: 1) spread phase, occurs in irrigation total duration, water is distributed from the base to the outlet. 2) storage phase, occurs in total duration from the end of water distribution to the discontinuation of irrigation water. 3) depletion phase, occurs in total duration from the discontinuation of irrigation water to the beginning of recession in the base. It was caused by limited amount of water on limited manual system even though it was enough to maintain soil moisture of tillage medium which was estimated only last for ± 8 hours. Figure 5. Validation of water content distribution pattern (volume base) as a result of water movement study on limited strip-tillage with strip shallow irrigation system 94
 to time period on strip-tillage with strip shallow irrigation in order to maintain soil moisture and water availability")
111 1 st TOPIC Figure 6. Illustration of the changes in wetting distribution pattern (volume base) to time period on strip-tillage with strip shallow irrigation in order to maintain soil moisture and water availability CONCLUSIONS The development of simulation concept regarding water movement used the concept to quantify the amount of ground water, consists of two approaches: volumetric water content θ (water volume) and matrix suction (cm) or pressure head, h (-cm). From fitting by eyes test on diffusivity graph and water content, the desired parameter values are obtained for formulating soil physical properties. It was then simulated on horizontal water movement model of limited strip-tillage with subsurface irrigation. Movement patterns displayed on the contour pattern showed wetting process could reach the depth zone up to (-5 cm) to the root zone and it became an important discovery in order to develop the concept of strip-tillage with strip shallow irrigation. The development concept of cultivation technique which is tested in the field was the soil moisture management in rooting zone. It was due to maintain soil moisture around the root zone or to provide water needed by the crops. Irrigation performance showed the results that effective wetting of striptillage could be developed only in short track irrigation channels < 5 m. It was suitable for subsystem field management or to repair traditional field. Design testing data recapitulation showed that the addition of organic matter gave significant effect to plant growth. On the contrary, water supply parameter gave no significant effect to plant growth. More over, chili as testing crop was widely known sensitive to excess water. REFERENCES [1] T. C.Kelly, Y. Lu and J. Teasdale, Economic-environmental tradeoffs among alternative crop rotation, J. Agric. Ecosyst. Envuron. (60); 17-28, November 1996 [2] J J Morrison, Jr., Strip tillage for "no-till" row crop production. Applied engineering in agriculture, J. American Society of Agricultural Engineers, vol. 18, pp , [3] K J. Janovicek, W. Deen, and T. J. Vyn, Soybean response to zone tillage, twin-row planting, and row spacing, American Society of Agronomy. Agron. J, vol. 98; pp , May [4] S. Mukhtar, J L Baker, R Horton and D. C. Erbach, Soil water infiltration as affected by the 95
112 1 st TOPIC Sustainable Rural Development-Towards A Better World Purwokerto, August 25-26, 2013 use of the paraplow, Trans. ASAE, vol. 28, pp , Nov-Dec [5] A. C. Trouse Jr., Observations on under-the-row subsoiling after conventional tillage, J. Soil Tillage Res., vol. 3, pp , March 1983 [6] S Mostaghimi and P C Mcmahon, Surface and subsurface drainage simulations for a clay pan, Soil. J. Agricultural Water Management, vol. 15, pp , [7] D. Hillel, Introduction to Environmental Soil Physics, Academic Press, USA, 2003, ch. 19, pp.336. [8] T. S. Strelkoff, A. J. Clemmens and E. Bautista, Field-parameter estimation for surface irrigation management and design, J. Irrig. Drain. Eng., ASCE, [9] T. Miyazaki, S. Hasegawa, and T. Kasubuchi, Water Flow in Soils, Marcel Dekker, 1993, ch. 4-5 [10] R. N. Yong and B. P. Warkentin, Introduction to Soil Behavior, The Macmillian Co. New York, 1966, ch. 11, pp [11] Jansen M E, Design and Operation of Farm Irrigation System, AS, Michigan, ch. 12. Pp. 451 [12] M. Th. van Genuchten, A close from equation for predicting the hydraulic conductivity of unsaturated soils, Soil Sci. Soc. An. J., vol. 44, pp , May [13] R R Bruce and A. Klute, The measurement of soil water diffusivity, Soil Sci. Soc. Am. J, vol 20, pp , [14] Y. I. Intara, A. Sapei, Erizal, E. N Sembiring and M. B Joefrie, Teknik Budidaya Tanaman Semusim dengan Alur Olah Tanah Minimal Beririgasi Bawah Permukaan, No. permohonan paten: P August 22, [15] Y. I. Intara, A. Sapei, Erizal, E. N Sembiring and M. B Joefrie, Pengaruh pemberian bahan organik pada tanah liat dan lempung terhadap kemampuan mengikat air, JIPI, vol. 16 (2), pp , August 2011 [16] Y. I. Intara, A. Sapei, Erizal, E. N Sembiring and M. B Joefrie, Mempelajari pengaruh pengolahan tanah dan cara pemberian air terhadap pertumbuhan tanaman cabai, J. Embryo, vol. 8 (2), pp , Juni
113 1 st TOPIC CIRCULAR-SHAPED EMITTER AS ALTERNATIVE TO INCREASE IRRIGATION EFFICIENCY Satyanto K. Saptomo 1, Budi I. Setiawan 1, KMS Ferry Rahman 2, Yudi Chadirin 1, Popi R. D. Mustaningsih 3, Chusnul Arif 1 1 Department of Civil and Environmental Engineering, Bogor Agricultural University, Bogor, Indonesia 2 alumni of Department of Civil and Environmental Engineering, Bogor Agricultural University, Bogor, Indonesia 3 a researcher in Agroclimate and Hydrology Research Institut, Indonesian Agency for Agricultural Research and Development, Ministry of Agriculture, Republic of Indonesia saptomo.sk@gmail.com ABSTRACT As respond to demand on reducing water for agricultural sector as the water usage competition is increasing between various sectors, water efficient irrigation techniques were offer in order to keep the water status at the desirable level at a production land, while avoiding loss of water and within a certain amount of water available. Automation system was applied to micro irrigation system using circular shaped irrigation emitter. The irrigation system is proven to work and keep the soil moisture at the desired condition which is field capacity, between pf 2.54 and 4.2. As the soil moisture was kept within the range percolation can be suppressed to its minimum or even halt. The system can be improved and used for dry land agriculture. Keywords: micro-irrigation, automatic control, agriculture water management, porous medium INTRODUCTION At present, there is a demand for the agricultural sector can reduce water usage as the competition is increasing in water use in various sectors like power generation, domestic and industrial sectors. Uncertainties about the impacts of climate to water availability have also been a challenge to agriculture water management. One effort to adapt to this situation is by increasing water use efficiency. As respond to this situation, there are many water efficient irrigation or cultivation techniques that had been offered. The task is to keep the water status at the desirable level at a production land, while avoiding loss of water and within a certain amount of water available. At present digital electronic and information technology had been accepted widely in most aspect of living. Similarly, agricultural water management can use this modern technology. The use of electronic sensors and devices that integrated into an irrigation control system seems to have its potential to increase the efficiency of water utilization by preserving exact water status to the field. This is hopefully can contribute to improve performance of irrigation water management. Micro irrigation can increase the efficiency of irrigation water applied, although the usage of micro irrigation is limited. The method of water application is determined by the type of emitter, which can also define the efficiency. This paper aims to present the development of automated irrigation system that uses circular shaped emitter as an alternative to increase water use efficiency. METHODOLOGY Soil Moisture Soil moisture regime that should be preserved for the plant is generally between field capacity (pf 2.54) and permanent wilting point (pf 4.2). Therefore, the range of soil moisture should be determined by analyzing the field s soil sample. In our case the soil samples were tested in the laboratory to get volumetric water content values at pf 1, 2, 2.54 and 4.2. Retention curve was made using van Genuchten (1980) model to estimate the soil moisture at other pf values. Table 1 shows the physical 97

114 1 st TOPIC Sustainable Rural Development-Towards A Better World Purwokerto, August 25-26, 2013 properties of the soil and Figure 1 shows its water retention curve by van Genuchten. Here the objective of the irrigation is to provide water between field capacity and permanent wilting point, which volumetric water content values are 38.5% and 28.7%. Table 1. Soil properties Field volumetric BI water (BD) content Porosity Volumetric Water Content Drainage pf1 pf 2 pf2.54 pf 4.2 Rapid Slow Available water (% vol.) g/cc % of volume Figure 1. Water Retention Curve Micro Irrigation and Porous Medium According to Hansen, et al (1979), there are 4 different methods of irrigation, which are: surface, subsurface, sprinkle and tickle irrigation. Sprinkle and tickle irrigation are examples of micro irrigation that are used limitedly. Both irrigation required manifolds and lateral pipes network that deliver irrigation water to it outlets points. As Sprinkle irrigation nozzle spread water to a wider area, tickle irrigation provides water close to the plant and applied at the surface by droplets of water. Another innovation in irrigation is the use of porous medium as emitter. Pitcher irrigation (Setiawan, 2000) is one of the example, especially useful for arid land. Pitcher irrigation exploits the property of porous medium to control water flow from inside depends of the moisture different between porous wall of the pitcher and the soil. Similar principle can be applied to different shape of emitters. The emitter used in this research has principles, which are to applied water as close and as uniform as possible to plant, and the water flow can be naturally limited following the property of soil. The circular shape can fulfill the first principle; this can be done by using disk-shaped porous medium or simple punching holes around the bottom of a circular container. 98

115 1 st TOPIC Figure 2. Circular (disc) shaped emitter Automatic Irrigation Automatic irrigation is part of water management system that includes irrigation and drainage. An example of this technology was developed in the research for the development of controlled drainage for wetland (Setiawan, et. al. 2002) that used automatically regulated pumps to move the water from or to the agricultural land. In this research, the automation was applied for micro irrigation. The purpose is to control the flow of water to the emitter, since in this stage the circular emitter has not been properly developed yet. The automation system that was used in this study is a 2 setpoints on-off system based on opensource prototyping platform Arduino. Soil moisture sensors were used as the sensing device that supplied moisture status to the controller. The sensors were calibrated to the soil moisture data analyzed in the laboratory, and have linear conversion function as Eq. 1 where y 1 is the moisture value and x 1 in binary number equal to moisture sensed by the sensor. y 1 = x (1) Figure 3 shows the automated irrigation system schematics. The automation system was design to be powered by solar energy.. Figure 3. Solar Powered Automatic Irrigation System 99
116 1 st TOPIC Sustainable Rural Development-Towards A Better World Purwokerto, August 25-26, 2013 RESULTS AND DISCUSSION Disc irrigation system has been tried for field irrigation experiment. The irrigation was controlled automatically, irrigation valve will open as soil moisture decrease to 28.7% (0.287 cm 3 /cm 3 ) or less, and it will close as the moisture increases and reaches water content values of 38.5% (0.385 cm 3 /cm 3 ). The layout of the irrigation system is as shown in Figure 4 The trial was done in 5 m x 2,9 m field with 30 disk shaped emitters having 14 cm of outer diameter. Each emitter can seep approximately cm 3 of water per second or mm/sec, assuming the seepage is uniform beneath the emitters circle area. A short trial was conducted in a fine day without rain, for only a few hours to examine the performance of the irrigation system. Figure 5 shows the irrigation performance during this trial, the fluctuating line is the soil moisture that was moving within the range of maximum and minimum permitted soil moisture. This was made by setting the setpoints of the controller as explain in prior section. As the moisture decreased and reach minimum setpoint, the irrigation valve opened and recharge water in the disc emitters and water seeped to the soil. Soil moisture increases as the field was irrigated, until it reached maximum setpoint where the valve will automatically close. The remaining water in the disc emitters kept seeping even the valve had been closed; this would further increase the soil moisture higher than field capacity. In this case, small part of water percolated. Percolation happens as currently the disk shaped emitter s base s material has not been designed properly yet. The material design is the next step of the research. Figure 6 shows the total quantity of components of water balance (mm) recorded during the trial. The input components are rainfall and irrigation which has amount of 0 mm and 7.85 mm. Output components are evapotranspiration (ET), total changes in water storage (dh/dt) and percolation (P) which have values of 1.08 mm, mm and 9.54 mm. This water balance analysis is based on 40 mm depth of soil layer. Percolation was higher than amount of water irrigated. The additional percolated water might be originated from the moisture storage in the soil, which changes has negative value that means moisture extracted from the soil. This could also mean that there is another source of moisture to the field whiah are not clear yet. Other possibilities are the soil layer is not 40mm as assumed or irrigation rate of the emitters was not uniform. However, the results show that the irrigation system can work well in preserving soil moisture at the favorable level and minimize loss through percolation. Figure 4. Disc Irrigation System Experiment Layout 100

117 1 st TOPIC Figure 5. Irrigation performance Irrigation Rainfall Percolation ET dh/dt Figure 6. Water balance components CONCLUSIONS Disc shaped emitter was used in field trial, using automatic micro-irrigation system. Water was applied the surrounding vicinity of the plant by using the emitter. The combination of disc shaped emitter and automated irrigation system than works to preserve water between field capacity and wilting point had proven to work well. The system is still to be improved by developing better material of the emitter and the base of the emitter in the way that the circular shaped emitter can be more flexible in the installation and having better water conducting properties which can work better when implemented in dry land. REFERENCES [1]. Hansen, V.E. Israelsen, O.W. dan G.E. Stringham. (1979) Irrigation Principle and Practice. (terjemahan) John Willey and Sons. Inc. New York. [2]. Setiawan, B.I, Y. Sato, S.K. Saptomo and E. Saleh. (2002) Development of water control for tropical wetland agriculture. Advances in Geoecology No. 35, Pages , Catena Verl., Reikirchen, Germany. [3]. Setiawan, B.I. (2000) On the Dissemination of Pitcher Irrigation System for Horticulture Farming in Dry Lands. Proceedings of China International Conference on Dry land and Water-Saving Farming. Beijing, November 21~23, [4]. van Genuchten, M. (1980) A Closed-Form Equation for Predicting the Hydraulic Conductivity of Unsaturated Soils. Soil Sci. Soc. Am J. 44:
118 1 st TOPIC Sustainable Rural Development-Towards A Better World Purwokerto, August 25-26,
119 1 st TOPIC SUITABILITY ANALYSIS OF EAST BORNEO MARGINAL LANDS FOR FOOD ESTATE Sidharta Sahirman 1, Muhammad Rifan 2, and Ardiansyah 1 1 Lecturer in Agricultural Engineering Department, Jenderal Soedirman University, Purwokerto, Indonesia 2 Lecturer in Agrotechnology Department, Jenderal Soedirman University, Purwokerto, Indonesia ABSTRACT East Kalimantan Regional Government actively supports every effort to make the district a national breadbasket through a project known as the Delta Kayan Food Estate. This destination area in Tanjung Selor, Bulungan mainly consists of marginal lands. As such, in planning the reclamation of this type of land, land suitability for certain crops needs to be investigated, followed by techno economic considerations in the cultivation of the land. This paper gives an overview of the latent potential of this area based on a survey and research conducted in a 3,241 ha land in Bulungan, East Kalimantan. Analysis suggests that, with the right land preparation, the area is financially viable and promising as a national granary. Keywords: Marginal land, Food Estate, Bulungan, K INTRODUCTION In recent years, the government of East Kalimantan has established food estates to make Kaltim the national energy and food storage barn. Support of local government attracts various groups to invest in this field. One area supported by government for the development of food estate is the Delta Kayan Watershed, Bulungan. Bulungan - a district in the northern part of East Kalimantan province - has a total area of 18,010.5 km2. The Bulungan topography is hilly, mountainous with steep cliffs and steep slopes (Bulungan in Figures 2011). The object of study is a piece of land consist of 3,241 ha located in Bulungan, East Kalimantan. METHODOLOGY Survey methods determined land suitability for a food estate, particularly for rice estate. Surveyed parameters include soil and water. At some point in the location, soil samples were taken in four layers using a soil sampler (auger), then texture and soil chemical properties described based on expert judgment. Water samples were taken to be examined for its ph levels and electrical conductivity (EC). All samples were tested at the Laboratory of Soil Science, Faculty of Agriculture, Jenderal Soedirman University, Purwokerto, Indonesia. The data analyzed is a laboratory test result data on chemical parameters of soil and water samples. Water level and rainfall data were analyzed by plotting the movement of the water yearly and monthly in rain charts for the last 12 years using available data. Once the land suitability is determined based on the above analysis, economic analysis performed using R / C, and payback period methods. Survey Results Observations made at the Tanjung Selor Meteorological Station in 2010 show that Bulungan, in general, and Tanjung Selor, in particular, experience the rainy season with rainfall as much as 2,729.4 mm / year with 21 days of rain / month. Rainfall during 2010 ranged from 67.8 to 395 mm / month. The average solar radiation at the district is 49%/ month. Bulungan has a mild climate, with average temperatures ranged between 21.4 o C and 36 o C. Bulungan humidity is relatively high, ranging from 83 percent to 87 percent with the 2010 average of 86 percent. 103

120 1 st TOPIC Sustainable Rural Development-Towards A Better World Purwokerto, August 25-26, 2013 The Bulungan population, based on 2010 survey, includes 112,660 inhabitants. Bulungan population density is 8.55 inhabitants per km2. The total labor force in Bulungan is 51,784, with the number of working people as many as 47,603 people. The agricultural sector dominates employment in Bulungan, which account for percent of the available work force. Labor cost in Bulungan especially for tidal areas is approximately Rp. 75,000 per day. This wage is much higher than the national average of Rp. 40,144 per day. (Socioeconomic Data of June 2012, BPS). Landform of the survey locations is classified as Marine Landform, which is formed due by marine processes, either constructive (sedimentation) or destructive (abrasion) in areas affected by salt water or tides. Landform subgroup Marin in the survey locations is Tidal Flat, which can be more specifically categorized as Tidal Back Swamp. Tidal Back Swamp is an area that is always flooded during high tide, and then will be reduced during low tide. The high tide occurs in the morning, at noon begins to recede, and the afternoon tide occurs again. This repeating, daily cycle is the cause of poor drainage for this area. Most of the soil surveyed is Great group Endoaquepts, which can further subgroup as Sulfic Endoaquepts, Fluvaquentic Endoaquepts, Humic Endoaquepts, Typic Endoaquepts and Typic Halaquepts (USDA, 2010). The limiting factors of soil chemical properties for agriculture use include: ph (H2O), pyrite content, and nutrient content: P, Fe and SO4. The ph (H2O) is low because H2S and FeS remains in the soil due to poor drainage. The condition can be corrected by building a good drainage system and setting the right groundwater level that can be calculated from the amount of water coming into the tidal land. Appropriate drainage management will increase soil fertility and reduce the toxicity of Fe and sulfate removing danger to crops, especially rice. The pyrite content in the study site will not jeopardize rice crop. Other restriction on the chemical properties of the soil is its low nutrient content, including the very low P content. P availability can be enhanced by liming and adding P fertilizer. The content of sulfate in the soil is not directly toxic to plants, but it will interfere with the absorption of N, P and K nutrients by rice plants. Sulfate content in the soil can be controlled by regulating tidal water and building drainage canals. Land Suitability Analysis Soil chemical properties that affect the land suitability classes for rice field are: KPK, ph (H2O), the depth of sulfides materials, saturation Al, Fe toxicity, and the availability of NPK nutrient content. Chemical properties of soil that greatly determine the land suitability classification are the ph (H 2 O), sulfides depth, the P content, and toxicity of Fe. The ph (H 2 O) is mostly low, between 4.20 and The content of sulfide materials at several locations can reduce land suitability classes to class S3 (marginally suitable). The distribution of nutrient P content in is depicted in Figure 1. Figure 1. Distribution map of p nutrient- p2o5 (ppm) 104
121 1 st TOPIC The figure shows that most of the area has low P content. The low P content results in S3 land suitability. Low P content is an easily fixed condition. The one that requires special attention is the Fe toxicity, which affects plant growth. This obstacle can be minimized through the use of tidal rice varieties which are resistant to the high content of Fe. River water ph measurement showed the ph value between 6.31 and Hence, it is very suitable for rice growth. However, the EC values in some sites are very high, ranging from 15.9 and ms, which inhibit the growth of rice. Fortunately, this condition can be corrected by controlling the irrigation and drainage system with respect to the amount of rainfall and the tides, so that salinity can be reduced. The land quality and land characteristics used to study the land suitability for rice crops is given in Table 1. To determine the land suitability classes, the above criteria are used. Land classes grouped as follows: S1 (most suitable), S2 (moderately suitable) and S3 (marginally suitable). The land not suitable for food estate is classified as either N1 or N2, depending on its limiting factors. Class N2 is an area that cannot be repaired. Table 1: Land Quality And Characteristics Used to Determine Land Suitability For Food Estate No. Symbol Land Quality Land Characteristics 1 t Regime temperature 1. Average yearly temperature ( o C) 2 w Water availability 1. Dry months (<75 mm) 2. Average yearly rainfalls (mm) I. Soil drainage class 3 r Rooting medium II. Soil texture III. Effective depth 4 f Nutrient retention 5 n Nutrient content 6 x Toxicity 1. KTK (cmol(+).kg -1 ) 2. ph(h 2 O) 1. Total Nitrogen (% N) 2. P content (ppm p 2 O 5 ) 3. K content (cmol(+).kg -1 ) 1. Salinitas (ms) 2. Fe dd (ppm Fe) 3. Pyrite depth (cm) Determination of land suitability classes for tidal rice is done systematically. The first decision is assigning the order. The suitability of land is classified as either Suitable (S) or Not Suitable (N). The next step is determining the class level. At the class level, land classified as suitable (S) distinguished between lands highly suitable (S1), quite suitable (S2) and marginally suitable (S3). Class S1 means the land has no limiting factors to the sustainable use, or consists of minor limiting factor which will not significantly reduce productivity. Class S2 means the land has a limiting factor that impacts productivity. Hence, it requires additional input. Class S3 means the land has severe limiting factors that impact productivity. This class of land requires significant inputs, more than for the S2 class. Results of land suitability evaluation for rice crop in Bulungan showed that majority of the land (80.45% of the area surveyed) belongs to S3 class with the limiting factors of P content and toxicity of Fe. The actual land suitability classification can be improved to become class S2 by building drainage channels and river embankments, liming at doses <1 ton / ha, and applying NPK fertilizer. From water availability point of view, Tanjung Selor areas are suitable for rice. Its location is close to the river and the altitude of <700 m is the location of the hot climate zone based on Yunghunh climate classification, which is suitable for rice, maize, sugarcane and coconut. Rainfall data for more than
122 1 st TOPIC Sustainable Rural Development-Towards A Better World Purwokerto, August 25-26, 2013 years showed the minimum rainfall of 2427, mm / year and a maximum of mm / year. In general, water requirement for rice is 1500 mm per season. Initial estimates suggest the amount of water satisfies the crop needs, especially paddy water for 3 growing seasons each year. Tidal conditions should be used for irrigation and drainage. The study of tide patterns suggests performing irrigation during high tide hours (6-9) and drainage during low tide hours. By avoiding continually flooding the rice field each day, problems are minimized for the rice crop. As a reference, Figure 2 depicts the cross-sectional design for irrigation and drainage in general. Figure 2. Hydrology system of the paddy field Engineering Economy Analysis Following a series of comprehensive analysis, it is concluded that 80.43% of the land is suitable for tidal rice cultivation. The following should be done prior the rice cultivation to overcome the existing limiting factors: Procurement of drainage facility Provision of irrigation facility Liming (limestone (dolomite) <1 ton / ha) Fertilization with NPK fertilizer The recommended design of irrigation and drainage facilities is illustrated in Figure 3. Figure 3. Design of irrigation and drainage system Since only approximately 80.43% of the area can be developed for agricultural cultivation, the viability analysis of the food estate will be based on this figure. The Costs related to food estate in Bulungan include the following: 1. Initial Costs/Investment, which include a. Land acquisition costs, b. Clearing costs, and 106
123 1 st TOPIC c. Land preparation costs. These costs will take into account of the soil conditioning costs, development costs of drainage and irrigation facilities, as these activities are necessary to make the land ready for paddy cultivation. 2. Agricultural Management Costs, which include a. Cost of inputs: seeds, fertilizers, pesticides, b. Labor costs: for planting, crop maintenance and harvesting activities, c. Equipment depreciation costs. It includes the depreciation of tillage and harvesting equipment, and d. Maintenance of roads, drainage and irrigation The income of the food estate is calculated based on the assumption of rice yield of 5 tons for each ha of productive land with cultivation frequency twice per year. Table 2. The Techno-Economic Analysis COST No. Activity Ha Rp/Ha (x 1,000) Total (Million Rupiahs) 1 Seedling 2,709 Seeds Labor 750 2, Land Preparation 2,709 2,500 6, Fertilizing 2,709 Fertilizers 375 1, Workers 1,200 3, Cultivation 2,709 Labor 750 2, Plant Maintenance 2,709 Weeding 1,500 4, Stitching Plant protection Pesticide 650 1, Labor 450 1, Harvesting 2, , Equipment Depreciation 2, TOTAL 25,180 EXPECTED REVENUE Harvesting; yield 5 ton/ha 2,709 43,344 R/C 1.72 The economic analysis as given in Table 2 shows that paddy rice cultivation is financially viable with an R / C of The investment costs should return in approximately 3.4 years. 107
124 1 st TOPIC Sustainable Rural Development-Towards A Better World Purwokerto, August 25-26, 2013 CONCLUSIONS 1. Chemical properties of soil which greatly impact land management is the ph (H2O), sulfides content, P content, and toxicity of Fe-dd. 2. Majority of the land in the study site belongs to S3 (Marginally Suitable) class, with the limiting factors of P nutrient availability and Fe toxicity. The land will be suitable for paddy cultivation by providing lime materials at doses <1 ton / ha, and fertilizer N, P and K. 3. Procurement of drainage and the control of the groundwater level will improve the soil quality tremendously. 4. Once the limiting factors are fixed, 80.43% of land is ready for paddy cultivation. This activity is financially viable with the 1.72 R/C value. ACKNOWLEDGMENTS I would like to thank George Burns (Lake Worth, Florida) for providing suggestions to this article. Your help is greatly appreciated. REFERENCES [1] Anonym, Kabupaten Bulungan dalam Angka 2010, BPS, [2] Anonym, Perkembangan Nilai Tukar Petani, Harga Produsen Gabah, dan Upah Buruh, BPS Berita Resmi Statistik No.69/11, Biro Perlengkapan, Penetapan Standarisasi Harga dan Standarisasi Sarana dan Prasarana Kerja Pemerintah Daerah. Pemerintah Daerah Provinsi Kalimantan, Sekretaris Daerah Provinsi Kalimantan Timur, [3] BPPP (Badan Penelitian dan Pengembangan Pertanian), Pengelolaan Tanah dan Air di Lahan Pasang Surut, ISDP, [4] Departement Pekerjaan Umum, Manajemen Air dan Lahan Rawa Pasang Surut, Pemerintah Daerah Provinsi Sumatera Selatan, [5] Dent, D. L., Acid sulphate soils: A baseline for research and development, Pub. 39, Int. Inst. Land Reclamation and Improvement, Wageningen,1986 [6] Dobermann, A. and Fairhust, T, Rice. Nutrient disorders and Nutrient Management, Potash and Phosphate Institute of Canada (PPIC) and International Rice Research Institute, [7] Pons, L. J. dan Van Breemen Factors influencing the formation of potential acidity in tidal swamps. Proceeding of the Bangkok Symposium on Acid Sulphate Soil. In. H. Dost and N. Van Breemen (Ed.). International Institute for Land Reclamation and Improvement. ILRI. Wageningen. The Netherlands. [8] Prakash, N.T. Land Suitability Analysis for Agricultural Crops: A Fuzzy Multicriteria Decision Making Approach Thesis, International institute for Geo-information Science and Earth Observation Enschede, The Netherlands, [9] Rossiter, D. G.., A Theoretical Framework for Land Evaluation., Geoderma 72: , [10] Sahirman, S, M. Rifan, Ardiansyah, Laporan Studi Kelayakan untuk Budidaya Tanaman Pangan di Food Estate Bulungan Kalimantan Timur, LPPM Unsoed,
125 1 st TOPIC STUDY OF RICE GROWTH AND YIELD AS WELL AS THE AVAILABLE OF N, P, K SOIL CONTENT GIVEN BY LOCAL MICRO ORGANISMS IN SYSTEM OF RICE INTENSIFICATION RICE FIELDS IN THE CILACAP DISTRICT Windi Haryanto 1, Ardiansyah 2, and Ismangil 3 1 Agronomy Program Study of Magister Program, Jenderal Soedirman University, Indonesia 2 Lecturer in Agricultural Engineering Department, Jenderal Soedirman University, Indonesia 3 Lecturer in Agrotechnology Department, Jenderal Soedirman University, Purwokerto, Indonesia ABSTRACT Utilization of organic chemical fertilizers and MOL as a biological fertilizer is expected to increase soil fertility and increase the production and productivity of rice. Decomposition of organic matter will release macronutrients and micronutrients, so that it becomes available and can be absorbed by plants. The purpose of this study was to determine the effect of MOL on N, P, K uptake and organic matter content of soil in the SRI cultivation; determine the effect of the use of MOL and organic chemical fertilizers on the growth and yield of SRI cultivation; and knowing the relationship between the use of organic chemical fertilizers, the use of MOL and non-mol on SRI cultivation. The study was conducted in Cimanggu, Cilacap, Central Java, and Laboratory of Soil and Land Resources, Agriculture Faculty (UNSOED) in November 2011 until February Ciherang Varieties growth and yield were cultivated with the application of MOL at 300 ml MOL per plot (equivalent to 133 liters/ha), sprayed every 10 days until 60 days after planting. Best plant height growth occurred in plants by fertilizing bamboo shoots MOL, while snails MOL applications produce the best average number of tillers. Bamboo shoots MOL as fertilizer use increased grain weight of 13.26%, while snails MOL fertilizing increased grain weight by 6.77%. The highest available soil NPK average found in plots with bamboo shoots MOL applications. Soil fertilized with land snails MOL have a more crumbly texture and pore number more than the other treatments INTRODUCTION Rice is the main agricultural commodities that cannot be separated from the life of the Indonesian population, because 95% of the population requires it (Sembiring, 2010; BPS, 2010). Rice is an important element of national food security system and a strategic sector in the economic, social, and political (Mejana, 2010). Demand for rice as food and industrial raw materials continue to increase in line with population growth and social welfare (Mejana, 2010; Yunita, 2009). The difficulty of increasing production is caused by leveling off or declining quality of land (Suryana, 2008); by the lack of organic matter in the soil (Supramudho, 2008), and rice cultivation 2-3 times per year can create saturated soil (soil fatigue), or better known as soil sicknees (Suryana, 2008; Prasetyo et al., 2004.). Currently farmers began to notice the importance of natural ingredients that are used as a plant liquid organic fertilizer and pesticide known as MOL (local microorganism). MOL solvent contains micro and macro elements also bacteria that potential as a decomposer of organic matter, plant stimulant, and as agents controlling plant pests and diseases. The use of organic fertilizer can increase the availability of nutrients and soil microbial survival and improve soil structure (Andoko, 2002). Similarly, the use of organic materials, proper irrigation practices can also give a positive impact on the growth and yield of rice plants. Irrigation techniques that create more aerobic soil conditions can make the plant roots get more oxygen (Berkelaar, 2001). There is an irrigation practices that can create aerobic conditions, SRI (System of Rice Intensification). Aerobic conditions allow aerobic soil microbes get more oxygen, thereby maintaining its survival. SRI of organic rice cultivation is intensive and efficient management process based on the root system with soil, crop and water management that promotes local potential and called environmentally friendly agriculture. 109
126 1 st TOPIC Sustainable Rural Development-Towards A Better World Purwokerto, August 25-26, 2013 Several studies have been conducted and reported that the use of organic fertilizers on the SRI can increase the microbial population as Azospirilium, Azotobacter and others in the rhizosphere is doubled compared to conventional ways of doing ordinary farmers do rice cultivation (Uphoff et al. 2009). Organic fertilization on SRI cultivation contributes raised nearly four times the number of Azospirillum and nearly doubled the number of Azotobacter and Phosphate on rhizosphere microbial solvent (Anas et al. 2011). The use of MOL at SRI was conducted before planting to grain filling. Use of MOL before rice planting was done when the fertilizer was made, which was then applied into the soil tillage. MOL application as a liquid fertilizer generally performed 5 times at 10, 20, 30, 40, 60 days after planting (Kalsim, 2007). The purpose of this study was to determine the effect of MOL on N, P, K uptake and organic matter content of soil in the SRI cultivation; determine the effect of the use of MOL and organic chemical fertilizers on the growth and yield of SRI cultivation; and knowing the relationship between the use of organic chemical fertilizers, the use of MOL and non-mol on SRI cultivation. METHODOLOGY The study was conducted in Cimanggu, Cilacap, Central Java, and Laboratory of Soil and Land Resources, Agriculture Faculty (UNSOED) in November 2011 until February The main materials used were Ciherang Varieties, Organic Fertilizers, conch Mol, bamboo shoots Mol, Vegetable Pesticides (soursop and tobacco leaf) and the main tool used were Plastics Distribution, winnowing, Hoes, Ring Samples, Isolation, soil strainer, Timber, Bamboo, Leaf Color Chart (LCC), digital scales, Sacks, Tarpaulin, Stationery, digital Cameras, Computers. The experiment used Completely Block Design. The treatments were 300 ml MOL per plot (equivalent to 133 liters/ha) (R); 300ml snail MOL per plot (equivalent to 133 liters/ha) (K). Spraying was repeated every 10 days until 60 days after planting. Four replicates of each treatment were made, so there were 16 experimental units. Variables observed in this study were the growth (plant height and number of tillers), production (grain weight per hill and grain weight), soil acidity and soil NPK content. The results were analyzed by F test to determine diversity then conducted further tests Duncan (DMRT) with a 95% level of belief. RESULTS AND DISCUSSION Artificial organic fertilizer was applied at conventional rice cultivation plots with dose of 250 kg/ha, equivalent to 100 g/plot. Fertilization was done in 2 stages i.e. at 20 and 40 days after planting with each dose of 125 kg/ha or 50 g/plot. Plots without MOL fertilized with dose of 6 kg/plot which was applied after the soil tillage. While on treatment of bamboo shoots MOL and snails MOL, MOL spraying was conducted from 10 to 60 days after planting with a dose of 300 ml/plot. MOL applications sprayed shown to affect the chemical and physical properties of soil which helps in improving the ability of plants to grow, develop and produce better compared with conventional cultivation and without MOL. Soil improvement due to the application of organic matter in this case Local Micro Organisms on rice cultivation increased plant growth and yield. Observations (Table 1) from 10 to 40 days after plating obtained that conventional rice cultivation has a high growth most plants either. Fertilizer application gave a significantly different effect on the ability of plants to grow. This was supported by the results of analysis of soil nitrogen content in Table 5. Amount of soil nitrogen conventional plot CDS less time than other plots that allegedly caused more nitrogen absorbed as more quickly available to plants as compared with MOL plots and plots without MOL. 110
127 1 st TOPIC Table 1. Plant Height (cm) MOL 10 DAP 20 DAP 30 DAP 40 DAP 50 DAP 60 DAP Bamboo Shoots 12,28 b 21,32 b 40,04 b 50,98 b a 102,91 a Snails 12,42 b 21,26 b 39,22 c 49,51 c ab 102,26 b Conventional 13,37 a 22,05 a 41,98 a 52,70 a c 102,05 b Non-MOL 11,32 c 20,06 c 38,51 d 48,49 d b 101,61 c Note: Figures followed by the same letter on the same variables showed no significant difference at 5% level of DMRT. Tabel 2. MOL application time interaction with additional observations on plant height (cm) MOL 10 DAP 20 DAP 30 DAP 40 DAP 50 DAP 60 DAP Bamboo Shoots b D 9.04 a F b C a E c A c B Snails b D 8.84 a F bc C ab E a A d B Conventional a C 8.68 a E a B a D d B a A Non-MOL c D 8.73 a F b C 9.97 ab E b A b B Description: 1. The figures followed by lower case letters (a, b, c) were the same in each treatment when granting MOL in a column indicates no significant difference at 5% DMRT. 2. The figures followed by a capital letter (A, B, C) were the same on each observation in a row indicates no significant different at 5% DMRT. MOL shoots applications increase the highest tiller number addition at 60 days after planting (9.28 tillers) and plots without MOL is 9.06 tillers. While the best increase of the number occured in the earlier period of plots that snails MOL are applied (10.88 tillers) at 40 days after planting (Table 3). Table 3. Plant tillers MOL 10 DAP 20 DAP 30 DAP 40 DAP 50 DAP 60 DAP Bamboo Shoots 2,43 b 4,44 b 8,45 b 16,74 b 22,40 b b Snails 2,34 c 4,52 b 9,73 a 20,62 a 26,74 a a Conventional 3,43 a 5,58 a 7,63 d 10,33 d 16,28 d d Non-MOL 2,44 b 4,68 a 7,98 c 11,85 c 19,48 c c Note: Figures followed by the same letter on the same variables showed no significant difference at 5% level of DMRT. Soil acidity on the plot MOL successfully maintained in the neutral range of conditions, as well as on conventional cultivation and without MOL (Table 4). The level of acidity in the soil with a range of 6 to 7.5 is optimum range for nutrient availability in the soil both essential and non-essential elements (Pfeiffer, 2009). The addition of organic matter in acid soils, among others inseptisol, ultisol and Andisol able to raise the ph of the soil and can reduce soil Al swapped (Suntoro, 2001; Cahyani., 1996, and Dewi, 1996). Increase in soil ph will also occur if we add organic matter has decomposed further (mature), because organic materials that have been mineralized to release the minerals, in the form of base cations (Atmojo, 2003). 111
128 1 st TOPIC Sustainable Rural Development-Towards A Better World Purwokerto, August 25-26, 2013 Table 4. Soil acidity Depth MOL After Planting Flowering Harvesting CDS tillage period stage period 0-10 cm Bamboo Shoots 7,11 7,64 6,44 6,65 6,76 Snails 6,87 7,17 6,51 6,63 6,82 Conventional 6,61 6,88 6,38 6,62 6,55 Non-MOL 6,60 6,98 6,53 6,72 6, cm Bamboo Shoots 6,21 7,03 6,33 6,61 6,43 Snails 6,34 7,13 6,42 6,86 6,71 Conventional 6,29 6,82 5,99 6,50 6,49 Non-MOL 6,51 6,73 6,38 6,78 6,39 The amount of nitrogen in the topsoil to 10 cm depth after treatment in bamboo shoots MOL plot of land treated had the highest scores compared to snails MOL plots, conventional plots and plots without MOL. The amount of nitrogen absorbed by plants in bamboo shoots MOL plots was larger than other plots. The amount of nitrogen the soil after bamboo shoots MOL application is ppm to ppm decreased in flowering period. At that time, soil nitrogen available in snails MOL plot also decrease significantly at the ppm to ppm. It was to be expected that plants in the MOL plot absorb more nutrients than conventional plot or plots without MOL. During vegetative stage, plants require large quantities of nitrogen for growth and tissue development. Nitrogen plays a role in the formation and growth of vegetative parts, such as leaves, stems and roots. This element also plays a role in the formation of green leaves and the formation of proteins, fats and various other organic compounds (Lingga and Marsono, 2002). Table 5. Soil Nitrogen (ppm) After Planting Flowering Harvesting Depth MOL CDS tillage period stage period 0-10 cm Bamboo Shoots , ,418 91, ,815 Snails 98,93 340, ,297 76, ,666 Conventional 99,59 181, ,034 96,221 72,61 Non-MOL 92,09 388, ,905 90, , cm Bamboo Shoots 67,31 106, ,492 81, ,174 Snails 57,45 120, ,400 59,792 68,814 Conventional 62,34 107,737 89,137 68, ,015 Non-MOL 85,60 71,690 83,628 84,486 90,095 Decline of soil phosphorus occurred from flowering to harvest stage. At the top of the soil, most phosphorus uptake by plants found in the plot MOL bamboo shoots, the conventional plots and plots without MOL. At soil of 0-10 cm depth, total phosphorus decreased from ppm (flowering stage) to ppm (harvest time). Reduction in the amount of many soil phosphorus levels also occur in shoots MOL plots at depth cm, i.e ppm to ppm at harvest. This was caused by the element of P absorbed maximally in the flowering phase (Suyamto, 2010). 112
129 1 st TOPIC Table 6. Soil fosfor (ppm) After Planting Flowering Harvesting Depth MOL CDS tillage period stage period 0-10 cm Bamboo Shoots 7,701 22,385 42,638 43,437 21,357 Snails 9,359 21,797 44,940 42,213 56,846 Conventional 10,844 12,168 38,386 45,167 23,381 Non-MOL 17,255 15,909 43,931 38,682 32, cm Bamboo Shoots 17,166 6,855 33,090 40,565 17,246 Snails 20,533 17,269 35,688 26,903 40,143 Conventional 47,685 10,457 28,866 31,205 20,423 Non-MOL 7,667 8,955 30,654 35,324 17,923 Available potassium on the plot shoots (0-10 cm) after tillage was the largest compared to other plots, i.e % me. At the beginning of planting, soil potassium in each plot at a depth of 0-10 cm over 1% me and the number decreased to flowering stage. Potassium increased the number of grains per panicle, percentage of filled grains and 1000 grain weight and improve rice tolerance to adverse climatic conditions and pests and diseases (Dobermann and Fairhust, 2000). Element K works to help the activity of the enzyme in the opening and closing of stomata and K deficiency can inhibit the translocation of carbohydrate and nitrogen metabolism. Table 7. Soil kalium (me%) After Planting Flowering Harvesting Depth MOL CDS tillage period stage period 0-10 cm Bamboo Shoots 4,482 1,507 0,853 0,519 0,800 Snails 1,998 1,586 0,891 0,428 0,777 Conventional 1,274 1,093 0,976 0,826 0,732 Non-MOL 1,162 1,413 1,006 0,726 0, cm Bamboo Shoots 0,774 1,387 0,701 0,724 0,728 Snails 0,894 0,905 0,781 0,572 0,558 Conventional 0,861 1,123 0,958 0,934 0,460 Non-MOL 1,16 0,794 0,919 0,947 0,675 CONCLUSIONS 1. Best plant height growth occurred in plants by fertilizing bamboo shoots MOL, while snails MOL applications produce the best average number of tillers. Bamboo shoots MOL as fertilizer use increased grain weight of 13.26%, while snails MOL fertilizing increased grain weight by 6.77%. 2. The highest available soil NPK average found in plots with bamboo shoots MOL applications. 3. Soil fertilized with land snails MOL have a more crumbly texture and pore number more than the other treatments. REFERENCES [1] Anas, I Biologi Tanah dalam Praktek. Pusat Antar Universitas Bioteknologi, Bogor [2] Andoko, A Budidaya Padi Secara Organik. Cetakan Pertama. Penebar Swadaya, Jakarta. [3] Atmojo, S. W Peranan Bahan Organik terhadap Kesuburan Tanah dan Upaya Pengelolaannya. Sebelas Maret University Press, Surakarta. 36 Hal. [4] Badan Pusat Statistik Statistik Indonesia Badan Pusat Statistik. Jakarta. [5] Berkelaar, D Sistem Intensifikasi Padi (SRI):Sedikit Dapat Memberi Lebih Banyak. Diakses tanggal 19 Juli
130 1 st TOPIC Sustainable Rural Development-Towards A Better World Purwokerto, August 25-26, 2013 [6] Dewi, W. S Pengaruh Macam Bahan Organik dan Lama Prainkubasinya terhadap Status P Tanah Andisol. Tesis. UGM, Yogyakarta. [7] Dobermann, A. dan T. Fairhust Nutrient Disorders and Nutrient Management. Tham Sin Chee. 191 p. [8] Kalsim, D. K Rancangan Operasional Sistem Irigasi untuk Pengembangan SRI. Seminar KNI-ICID, Bandung. Diakses pada 19 Agustus 2012 [9] Lingga, P. dan Marsono Petunjuk Penggunaan Pupuk. Penebar Swadaya, Jakarta. 150 Hal. [10] Mejana, M. J., Rencana Strategis Penelitian Tanaman Padi Balai Besar Penelitian Tanaman Padi, Subang. 43 hal. [11] Pfeiffer, Michael ph and Nutrient Availability. Pesticide Training Resources, East Seneca Tucson, Arizona [12] Suntoro, Pengaruh Residu Penggunaan Bahan Organik, Dolomit dan KCl pada Tanaman Kacang Tanah (Arachis hypogeae. L.) pada Oxic Dystrudept di Jumapolo, Karanganyar. Habitat. 12(3) [13] Supramudho, G. N Efisiensi Serapan N Serta Hasil Tanaman Padi (Oryza Sativa L.) pada Berbagai Imbangan Pupuk Kandang Puyuh dan Pupuk Anorganik di Lahan Sawah Palur Sukoharjo. Skripsi. Fakultas Pertanian Universitas Sebelas Maret, Surakarta. 64 hal [14] Suryana, A Padi ( Inovasi Teknologi dan Ketahanan Pangan). Balai Besar Penelitian Tanaman Padi. Subang. 498 hal. [15] Suyamto Peranan Unsur Hara N, P, K dalam Proses Metabolisme Tanaman Padi. Balai Besar Litbang Sumberdaya Lahan Pertanian, Badan Penelitian dan Pengembangan Pertanian. Bogor. 26 hal [16] Uphoff, N The System of Rice Intensification (SRI) as a System of Agricultural Innovation. farmerfirst /files/t1c Uphoff.pdf. Diakses pada 17 0ktober
131 1 st TOPIC WIRELESS SENSOR NETWORK (WSN) APPLICATION USING ZIGBEE FOR MONITORING DISPLACEMENT OBJECT Dwi Kurniawan 1, Imron Rosyadi 2, and Azis Wisni Widhi N 2 1 Student at Electrical Engineering Department, Universitas Jenderal Soedirman 2 Electrical Engineering Department, Universitas Jenderal Soedirman mas_iyom@yahoo.com ABSTRACT A common trends of WSN application are environmental data collection, security monitoring, and sensor node tracking. Monitoring displacement object can be classified onto environmental data collection. Mobile object have parameters such us acceleration, velocity, displacement, and moving direction. Accelerometer H48C is one device that capable to measuring dynamic and static acceleration. Using double integral on acceleration data will found information about object displacement. Using ZigBee network, information can be transferred wirelessly. Keywords: Accelerometer, Wireless Sensor Networks, ZigBee network INTRODUCTION Using an wireline sistem for displacement monitoring of mobile object have obstacle while the object moving so far and object monitored in a large amount. Using a WSN is more and more efficient that using wireline system. The main components in the design of WSN consist of a sensor unit, and communication unit. Sensor unit is a device that provide data acquisition from environment. Communication unit is a part that provide data transfer facility in this case wirelessly. Creating wireless networks can be done using a variety of RF protocols. In this paper using ZigBee protocol. It is a protocol that uses the IEEE standard as a baseline and adds additional routing and networking functionality[1]. Xbee Pro Series 1 is a brand of radio that supports variety of communication protocols, including ZigBee protocol[2]. METHODOLOGY Hardware Design In this paper, the hardware consists of two nodes, namely end devices and gateways. End device is composed by: Accelerometers H48C for acceleration data acquisition Xbee Pro Series 1 for data communication DS1307 RTC for timing the delivery of data Arduino as the main controller of node Gateway composed by: Xbee Pro Series 1 for data communication Arduino as the main controller of node Software Design End Device Software 115
132 1 st TOPIC Sustainable Rural Development-Towards A Better World Purwokerto, August 25-26, 2013 End device software composed of acceleration data acquisition and data delivery process. At H48C accelerometer, reading acceleration data using ADC 12-bit. To calculate acceleration on each axis using (1) where g axis is acceleration in g (1 g equals to 9.81 m/s 2 ), ax count is a voltage level on axis, v ref is a voltage reference for ADC. g ( ax v ) (1) axis count ref The signal is not noise free so it must be digitally filtered. The filter used in this algorithm is a Bessel low pass filter. To find position, it applied double integral to (1). In digital system, integral equation from acceleration to velocity indicated by (2) and velocity to displacement indicated by (3). v v 1 a t (2) s n n n n s 1 v t (3) n n Gateway Software Software on the gateway is composed algorithm decodes the information in the API frame format. Filter Design Signal information from the accelerometer is represented in a discrete time series. So the selected filter IIR (Infinite Impulse Response) and analog prototype filter is selected Bessel low pass filter. Sample rate from accelerometer is 125 sampel per second so that the sampling frequency is 125 Hz, while the frequency of 5 Hz cut off is made. The frequency response of the digital filter is in [0,1] while 1 represents π which is the Nyquist frequency so that π = 62.5 Hz. Cut off frequency of the digital filter is ωc = fc / fs = 0.04 rad / s. Recursive equation for IIR filter indicated by (4). With a and b are recursive coefficients. n n bk x( n k) k 0 k 1 y( n) a x( n k) (4) k For Bessel low pass filter with sample frequency 125 Hz, ωc = 0.04 rad/s, and 10 th orde have recursive coefficients are: b 0 = 1 b 1 = 10 a 1 = b 2 = 45 a 2 = b 3 = 120 a 3 = b 4 = 210 a 4 = b 5 = 252 a 5 = b 6 = 210 a 6 = b 7 = 120 a 7 = b 8 = 45 a 8 = b 9 = 10 a 9 = b 10 = 1 a 10 = RESULTS AND DISCUSSION Direction of movement Direction of movement is shown by the graph acceleration sensor is formed. The movement begins with the positive direction of a hill and ends with the valley while the negative direction of movement begins and ends with a valley with a hill. Figure 1 shows the difference in graphics acceleration that is formed on the movement towards the positive and negative directions. 116
133 1 st TOPIC Figure 1. Difference in graphics acceleration that is formed on the movement towards the positive and negative directions Displacement Measurement Displacement distance obtained from dynamic acceleration that is read by the accelerometer. This dynamic acceleration represents the influence of outside force that causes the sensor to switch positions. To test the dynamic acceleration is done by shifting the position of the sensor on each axis. To get velocity using (2) and then using (3) to get the distance. Figure 2 shows the graphs obtained from the data of acceleration, velocity and displacement. Table 1. Testing Accelerometer Of Each Axis Distance X Y Z (cm) measured Error measured Error measured Error Error rata - rata Table 2. Cross axis effect on each axis movement Jarak (cm) Displacement on X Displacement on Y Displacement on Z Y Z X Z X Y Table 1 shows the results of the testing movement on each axis. Error average - average obtained is 117
134 Perpindahan (m) Kecepatan (m/s) Percepatan (g) st TOPIC Sustainable Rural Development-Towards A Better World Purwokerto, August 25-26, 2013 equal to 1.96 cm on the movement in the X axis, 1.88 cm on the movement in the Y axis and 1.76 cm on the movement in the Z axis. Table 2 shows the value of cross-axis effect that occurs due to the movement on one axis. Highest value of cross-axis effect is 6.91 cm Ax Ay Az Sampel a Sampel Vx Vy Vz b Sampel Sx Sy Sz c Figure 2. (a) graphics acceleration, (b) velocity, and (c) distance 118
135 1 st TOPIC Communication Unit In the communication unit, one of the parameters tested were RSSI (Receive Signal Strength). For the RSSI testing done by two methods: Testing the RSSI on Line Of Sight (LOS) condition and RSSI testing on the obstruction field. LOS condition testing done on the Widarapayung beach at Binangun district of Cilacap Central Java-Indonesia. As for the testing performed the obstruction field done at Widarapayung coastal area which is a coconut plantation area with shrubs and bushes at the base of the soil. LOS test results shown in Figure 3, the data collection is done every 20 m from 20 m to 500 m.tests performed on obstruction field at each 10 m from 10 m to 140 m. The test results shown in Figure 4. Figure 3. RSSI graph LOS connection Figure 4. RSSI graph on obstruction field Power Consumption On the measurement, power supply that used in the form of 2 pieces cell Lithium Polymer battery with a voltage of each - each with a 3.6 V 2600 mah capacity and in series so that the overall power supply voltage is 7.2 V. 119
136 1 st TOPIC Sustainable Rural Development-Towards A Better World Purwokerto, August 25-26, 2013 Measurements performed on modules that are running the program sending data to the gateway with the data transmission interval 5 seconds. Table 3. Current Consumption Measurement Unit Kontroler ( Arduino) RF ( Xbee Pro ) RTC ( DS1307 ) Akselerometer ( H48C ) Arus Total Current 20 Ma 62 ma 2 ma 1 ma 85 ma With a current total of 85 ma and operating voltage is 7.2 V, so the module power consumption is 612 mw. With a battery capacity of 2600 mah battery should ideally be able to supply modules for 30.5 hours but in fact may vary. If using a battery as a power supply module, the battery capacity will determine the length of time the module work. So as to make the module work longer hours can be done in several ways such as adding battery capacity, minimizing the controllers work, as well as extend the time lag data transmission. CONCLUSIONS The use of accelerometers for measuring dynamic acceleration acceleration values that are still affected by the acceleration of gravity so that the required additional sensors to provide sensor tilt correction. This can be done using gyro. REFERENCES [1] Demystifying and ZigBee White Paper, Digi International Inc, ZigBee Alliance, [2] Faludi, Robert. Buliding Wireless Sensor Network, United States: O Reilly,CA 95472, 2010 [3] J. Lester Hill, System Architecture for Wireless Sensor Network Ph.D. dissertation, Dept. Computer Science., California Univ., Barkeley, [4] Ergen,S.C.2004.ZigBee/IEEE Summary diakses tanggal 8 November [5] I.F Akyidiz and Mehmet Can Vuran, Wireless Sensor Network, U.K :Wiley,
137 1 st TOPIC PRELIMINARY EXPERIMENTAL INVESTIGATION ON USE OF LOW-COST COMPONENTS TO CONSTRUCT INSTRUMENT FOR NONDESTRUCTIVELY MEASURING OPTICAL CHARACTERISTICS OF GOLDEN BANANA (Musa acuminata) Agus Margiwiyatno 1, Siswantoro 1, and R. Ediati 1 1 Agricultural Engineering Study Program, Department of Agricultural Technology, Faculty of Agriculture, Jenderal Soedirman University, Purwokerto-Indonesia. agmargi@yahoo.co.id ABSTRACT Techniques for evaluating fruits quality based on its optical characteristics have been intensively developed since several past decades, and various instruments for this purpose have also been commercially produced. However, great advancement on the technique has not yet gave considerable benefits for most farmers in developing countries due to financial limitation for purchasing the commercial instruments or machines. To seek solution of the problem, this preliminary experimental investigation was conducted to assess possibility of available components in local market for constructing a low-cost instrument to evaluate quality of fruits based on its optical characteristic. The instrument comprised light source (a laser light source of 650 ± 10 nm wavelength), integrating sphere, light sensor (Light Dependent Resistor/LDR), and digital multimeter. Sensor response was presented in Optical Density (OD), i.e. logarithmic ratio of I s (intensity of reflected light by the fruits) and I ref (intensity of reflected light by a bright white ceramic). Experiment results indicated that results of measurement using the constructed instrument have a good agreement with quality parameter changes of Golden Banana, i.e. color parameters, total soluble solid, and firmness. This promising result opens possibilities for further investigation to develop a low-cost instrument using available components in local markets. Keywords: laser, light dependent resistor, low-cost instrument, fruit quality, nondestructive INTRODUCTION Investigation on optical characteristic of agricultural products has been being a great concerned of researchers since past decades. The optical characteristic is phenomenon of fruit response when a beam of light incidence on it. The characteristic is mostly indicated by behavior of the products in reflecting, absorbing, and transmitting the incident light. The characteristic has been reported to have strong correlation with external and internal quality of the products (Chen and Sun, 1981; Gunasekaran, 1985; Abbot 1999; Nikolai and Buellens, 2007). In relation to fruit quality, a decrease in chlorophyll content of the skin is correlated with increasing maturity; this is traditionally used as the criterion for visual assessment of fruit maturity (Crisosto et al., 2003). Some fruits have one color homogeneously distributed on the skin surface, and the averaged surface color is a good quality indicator for these fruits (Ruiz-Altisent, 2010). Olsen et al. (1967) reported that chlorophyll content was shown to be correlated inversely with the soluble solids, and is also related to the dessert quality of apple. Others have found that the chlorophyll content to vary inversely with soluble solids, sweetness, and flavor, and directly with tartness of apples. These facts suggest that color changes could be used as indicator of other quality attributes changes. Therefore, color cards have been commonly used for grading fruits quality. However, as use of color cards depending on subjective interpretation, results of classification may vary from one user to another (Kavanagh et al., 1986). To overcome this dilemma, CIELAB color system have been developed which provide tristimulus values, from which the chromatic coordinates on the CIELAB color system can be acquired (McGuire, 1992). Presently, the system has been widely adopted in commercial instruments to enable objective color measurement. 121

.")
138 1 st TOPIC Sustainable Rural Development-Towards A Better World Purwokerto, August 25-26, 2013 As quality is a complex system, more comprehensive quality measurement techniques have been developing to cover other parameters, both external and internal quality parameters, related to consumers acceptance. Measurements of parameters which based on VIS/NIRS (visible/near-infrared spectrum) are most promising with a wide range of application. In the NIRS, fruit is irradiated with light in near infrared spectral region ( nm). The spectra in this region contain abundant information reflecting structure of molecules as well as attributes of fruits such as firmness, total soluble solids, etc. The VIS/NIRS has been used as a rapid and nondestructive technique for measuring chlorophyll content, soluble solid content and firmness of several commodities, such as apple (Ying and Lin, 2004), kiwifruit (Slaughter and Crisosto, 1998), plums (Louw and Theron, 2010), peach and mango (Subedi and Walsh, 2009), nectarine (Golic and Walsh, 2006), and citrus (Zude et al., 2008). Subedi and Walsh (2009) used visible-short wave near infrared ( nm) interactance spectroscopy to measure firmness of banana. Based on nondestructive measurement techniques development, various instruments have been commercially produced. Unfortunately, the advancement has not yet gave considerable benefit to farmers in many developing countries, includes Indonesia, as they unable to purchase the instrument or machine due to financial limitation. Therefore, greater effort should be made for developing low-cost nondestructive quality sensing instrument. Such instrument will give opportunity to the farmers for purchasing it, and they will then enable to regularly evaluate their products quality during the seasons. Availability of the quality data could enable them to do better evaluation on their farming method; this evaluation is important to be carried out as many research reports strongly indicated that pre-harvest factors influence postharvest quality of agricultural crops (Wang, 1997; Crisosto and Costa, 2008; Manganaris et al., 2008; Moretti et al., 2009). This suggest that development of low-cost instrument will give considerable benefits to the farmers in providing high quality products as needed by consumers. Basically, optical measurement method needs three components, i.e. light source, light sensor, and measurement unit. The components, such as bright white LED, visible laser sources, Light Dependent Resistor (LDR), and digital multimeter, can be easily found in local markets with affordable price. Use of those components for constructing a simple instrument will only cost about Rp ,- (equal to USD 20). Considering the facts as mentioned above, this research was a preliminary investigation to find out possibility in using available components in local market for constructing nondestructive sensing instrument. METHODOLOGY In this research, laser light source, integrating sphere, LDR, and digital multimeter were used to build an instrument. The light source was a laser pointer with 650 ± 10 nm wavelength. Six LDR sensors were used and arranged in series. For measuring the sensor response, a digital multimeter was employed. To ensure greater reflected light from fruit surface can be directed to incident on sensor surface, an integrating sphere was made using plastic ball. The inner side of the plastic ball was painted with glossy white paint. Figure 1 shows the schematic diagram and the constructed instrument. Figure 1. Construction of the instrument: (1) digital multimeter, (2) laser light source, (3) sensor holder, (4) light sensor array (LDR), (5) integrating sphere, (6) sample pad 122
139 1 st TOPIC During measurement, object was tightly placed on sample pad by hand. Light beam from the laser light source was directed to fall on the sample surface. Light reflected by fruit surface propagated in the integrating sphere before reaching the sensor surface. The LDR sensor array measured intensity of the reflected light in term of resistance (ohm). Golden banana was used as sample for evaluating performance of the constructed instrument. Twenty eight Golden Bananas were taken from a farmer s orchard. The first measurement was conducted in the same day of harvesting time whereas three fruits were used for nondestructive measurements using the constructed instrument, and another three samples were used for destructive measurements of fruit quality parameters (color, total soluble solid, and firmness). In the mean time, the rest of samples were stored at room temperature (about 30 o C). In the following day, three samples were taken for destructive measurements. Nondestructive measurements were made using the same samples of the previous day measurements. In total, there were six times measurements within six days. The nondestructive measurements were conducted to measure intensity of reflected light by the sample (I s ). To provide reference to the reflected light, measurement of light reflected by surface of white ceramic (I ref ) was made prior each day measurement of the samples. I s and I ref were then be used to determine value of Optical Density (OD). The OD value is a logarithmic ratio of I s and I ref. In color measurement, color parameters (L, a, b) were nondestructively measured using Minolta colorimeter. The destructive measurement was conducted to measure total soluble solid and firmness of the sample fruits. The total soluble solid was measured using hand refractometer, while the firmness was measured using hand pneutrometer. Regression analysis method was employed for evaluating quality changes during storage whereas relationship between the OD and quality parameters was used as the base for assessing performance of the constructed instrument. RESULTS AND DISCUSSION Quality Changes Parameter of fruit color (L, a, and b) showed gradual changes during storage (Figure 2). It can be seen from the figure that color parameters L and b tended to significantly decrease with storage time, while the parameter a tended to increase. The ΔL, Δa, and Δb for entire storage time were 30.03, 6.97, and 26.9 respectively. Based on L, a, b color chart, lightness of the banana skin tended to change from light to dull and the color was turned from yellow to red during storage. 123
140 1 st TOPIC Sustainable Rural Development-Towards A Better World Purwokerto, August 25-26, 2013 Figure 2. Color parameters changes during storage Some researches indicated that main factor in the color change of fruits is the presence and concentration of pigments including carotenoids, anthocyanins and other flavonoids, betalains, and chlorophylls in the peel (Mazza and Miniati, 1993). During ripening the amount of chlorophyll decreased to zero in the ripe fruit (Von Loesecke, 1992), while the amount of carotenoid pigments had reduced slightly with the major carotenoids found in yellow-ripe banana (Gross, et al. 1976). Figure 3 shows that the total soluble solid was significantly increased with storage time. The total soluble solid (TSS) increased about 5 o Brix during storage. Similar increase was also reported by Marriot et al. (2006) and Soltani et al. (2010). Marriott et al. (1981) mentioned that increase of the TSS is caused by hydrolysis of starch into soluble sugars such as glucose, sucrose, and fructose. Firmness of banana tended to decrease during storage (figure 4). Change of banana texture during storage is strongly presumed due to alterations of cell wall structure and degradation of starch (Seymour, 1993; Tucker, 1993; Turner, 2001; Rosli et al., 2004). Movement of water from rind of banana to pulp during ripening is also presumed to give contribution on firmness changes. (Liew and Lau, 2012). Figure 3. Total soluble solid changes during storage 124
141 1 st TOPIC Figure 4. Firmness changes during storage Optical Density Changes During storage, it is clearly seen from Figure 5 that intensity of reflected light by the banana tended to decrease with time. The decrease is strongly presumed due to the change on fruits as indicated by high coefficient of determination resulted in regression analyses on the OD data and the quality parameters data (see Figure 6, Figure 7, and Figure 8). Figure 5. Optical density changes during storage Figure 6 shows that the OD has strong correlation with the color parameters. Strong correlation was also found between the OD and the total soluble solid (Figure 5) as well as the OD and the firmness (Figure 8). These experimental results suggested that interaction of the laser light with the banana comprised two optical phenomenon, i.e. specular reflectance and diffused reflectance. The specular reflectance was presumed to occur due to interaction of a part of the light with surface of the banana peel; it is strongly indicated by good agreement of the OD and the color parameters changes. The diffused reflectance was presumed to happen due to propagation of another part of the 125
142 1 st TOPIC Sustainable Rural Development-Towards A Better World Purwokerto, August 25-26, 2013 incident light into the banana which passing the peel and the pulp, then reflected out of the banana through vicinity of the incident light point. The propagation enabled the light to interact with the banana peel and pulp; this was indicated by high correlation of the OD with the total soluble solid and the firmness. Figure 6. Color parameters versus optical density Figure 7. Total soluble solid versus optical density 126
143 1 st TOPIC Figure 8. Firmness versus optical density GENERAL DISCUSSIONS The experimental results presented above suggest that laser light source and LDR sensor which available in local markets could offer a promising performance to be used in constructing a low-cost spectrophotometer for nondestructive quality evaluation of banana. Further experiments should be conducted to assess performance of those components, as part of lowcost spectrophotometer, for predicting quality of fruits both in postharvest and pre-harvest stages. For this purpose, the following issues might be useful for consideration: 1. Integrating sphere used in the preliminary investigation for guiding reflected light propagation may need to be improved for giving better performance. Improvement could be made by adding a baffle inside the integrating sphere. The baffle is to ensure that the sensor is only measuring the light reflected by the fruit and is not direct light from aperture of the light source. For this purpose, another alternative can be considered, i.e. use of bifurcated fiber optic lead. Use of the lead could also give less complicated construction of the light guide unit. However, again, use of this component should be carefully evaluated from the point of construction cost. 2. The instrument constructed in this research was operated in single wavelength mode. Improvement may need to be made to enable operation in multiple wavelengths mode as some researchers indicated that use of multiple wavelengths mode can give better results (Bith and Olsen, 1964; Yeatman and Norris, 1965; Bittner and Norris, 1968; Gunasekaran et al., 1985; Upchurch et al., 1990; Miller and Delwiche, 1991; Kawano et al., 1992; Upchurch et al., 1994; Margiwiyatno, 1999). For this purpose, use of some laser light sources with different wavelengths will be needed. Based on our survey, at least there are three types of light sources with different wavelength in local markets. 3. An alternative for multiple wavelengths application might be made by using Compact Disc (CD) and Digital Video Disc (DVD). The CD or DVD could be used as diffraction grating to produce various wavelengths from a white light. The use of CD and DVD for the same purpose has been reported by Tellinghuisen (202), Lema et al. (2002), and Wakabayashi and Hamada (2006); they used the CD and DVD in constructing a simple spectrophotometer for measuring light absorption of some liquids. This alternative has potential to lower the cost for providing light source as a bright white LED (light emitting diode) is cheaper than laser light source. 127
144 1 st TOPIC Sustainable Rural Development-Towards A Better World Purwokerto, August 25-26, 2013 CONCLUSIONS This preliminary experimental investigation indicated that available electronic components (laser light source and LDR) in local market showed a promising performance to be used in developing low-cost instrument for nondestructive evaluation of fruit. Further development should be made to assess reliability of the component for the purpose and to seek other alternatives which feasible in term of technical and financial consideration ACKNOWLEDGEMENTS Sincere thanks are given to Mr. Irfan, Mr. Angga, Mr. Zaenudin, Miss Kurnia, Miss Ruri, Miss Novita, and Miss Iis for their kindly help in conducting laboratory experiments. REFERENCES [1]. Abbot, J.A Quality measurement of fruits and vegetables. Postharvest Biology and Technology 15 (1999): pp [2]. Abdullah, M. Z., L. C. Guan, K.C. Lim, and A.A. Karim, The applications of computer vision and tomographic radar imaging for assessing physical properties of food. Journal of Food Engineering, 61: pp [3]. Ayala-Silva, T., Raymond, J. Schnell, A.W. Meerow, M. Winterstein, C. Cervantes, and J.S. Brown Determination of color and fruit traits of half-sib families of mango (Mangifera Indica L.). Proc. Fla. State Hort. Soc.118: pp [4]. Birth, G.S. and K.L. Olsen Non-destructive detection of water core in Delicious apples. Prae. Am. Sac. Horti. Sci., 85, [5]. Bittner, G.S. and K.H. Norris, Opticai properties of selected fruits vs. maturity. Trans. Am. Sac. agric. Engrs, 11, [6]. Blasco J, S. Cubero, J. Gómez-Sanchis, P. Mira, and E. Moltó Development of a machine for the automatic sorting of pomegranate (Punica granatum) arils based on computer vision. Journal of Food Engineering, 90: pp [7]. Campbell B.L., R.G. Nelson, C.E. Ebel, W.A. Dozier, J.L. Adrian, and B.R. Hockema Fruit quality characteristics that affect consumer preferences for satsuma mandarins. HortScience, 39(7): pp [8]. Chen, P. and Z. Sun A review of nondestructive methods for quality evaluation and sorting of agricultural products. J. Agric. Eng. Res. 49: pp [9]. Crisosto, C.H., G.M. Crisosto, and P. Metheney Consumer acceptance of Brooks and Bing cherries is mainly dependent on fruit SSC and visual skin color. Postharvest Biology & Technology, 28(1): pp [10]. Dadzie, B.K Postharvest Characteristics of Black Sigatoka Resistant Banana, Cooking Banana and Plantain Hybrids, p Italy: International Plant Genetic Resources Institute. [11]. Díaz R., G. Faus, M. Blasco, J. Blasco, and E. Moltó The application of a fast algorithm for the classification of olives by machine vision. Food Research International 33: pp [12]. Du, C.J. and D.W. Sun Recent developments in the applications of image processing techniques for food quality evaluation. Trends in Food Science & Technology, 15(5): pp [13]. Ji W., G. Koutsidis, R. Luo, J. Hutchings, M. Akhtar, F. Megias, and M. Butterworth A digital imaging method for measuring banana ripeness. Color Research and Application, (in press), DOI: /col [14]. Grierson W Fruit development, maturation and ripening. In M. Pessarakli (Ed.) Handbook of Plant & Crop Physiology (pp ). New York: Marcel Dekker. [15]. Gross, J., M. Carmon, A. Lifshitz, and C. Costes Carotenoids of banana pulp, peel and leaves. Food Sci. and Tech. 9: pp [16]. Gunasekaran, S., M.R. Paulsen, G.C. Shove Optical methods for nondestructive quality evaluation of agricultural and biological materials. J. Agric. Eng. Res. 32: pp
145 1 st TOPIC [17]. Hatcher D. W., S.J. Symons, and U. Manivannan Developments in the use of image analysis for the assessment of oriental noodle appearance and colour. Journal of Food Engineering, 61: pp [18]. Kays, S.J. (1999). Preharvest factors affecting appearance. Postharvest Biology & Technology, 15(3): pp [19]. Kienzle, S., Sruamsiri, P., Carle, R., Sirisakulwat, S., Spreer, W. & Neidhart, S. (2011). Harvest maturity specification for mango fruit (Mangifera indica L. Chok Anan ) in regard to long supply chains. Postharvest Biology & Technology, 61(1): pp [20]. Lema, M.A., E. M. Aljinovic, and M. E. Lozano Using a home made spectrophotometer in Teaching Biosciences. Biochemistry and Molecular Biology Education Vol. 30, No. 2, pp [21]. Liew, C.Y. and C.Y. Lau Determination of quality parameters in Cavendish banana during ripening by NIR spectroscopy. International Food Research Journal 19(2): pp [22]. Louw, E.D. and K.I. Theron Robust prediction models for quality parameters in Japanese plums (Prunus salicina L.) using NIR spectroscopy. Postharvest Biology and Technology 58: pp [23]. Margiwiyatno, A Destructive and Nondestructive Investigation on Apple Using Optical Methods. PhD Thesis. Cranfield University, The United Kingdom. [24]. Marriott J., M. Robinson, and S.K. Karikari Starch and sugar transformation during the ripening of plantains and bananas. Journal of Science, Food and Agriculture : pp [25]. Marriott, J., M. Robinson, and K. Simon Starch and sugar transformation during the ripening of plantains and bananas. Journal of the Science of Food and Agriculture 32(10): pp [26]. Nicolaï, B. M. and K. Beullens, et al. (2007). Nondestructive measurement of fruit and vegetable quality by means of NIR spectroscopy: A review. Postharvest Biology and Technology 46 (2): pp [27]. Pedreschi, F., Aguilera, J. M., & Brown, C. A. (2000). Characterization of food surfaces using scale-sensitive fractal analysis. Journal of Food Process Engineering, 23: pp [28]. Pedreschi, F., León, J., Mery, D. & Moyano, P. (2006). Development of a computer vision system to measure the color of potato chips. Food Research International, 39(10): pp [29]. Soltani, M., R. Alimardani, and M. Omid Prediction of banana quality during ripening stage using capacitance sensing system. Australian Journal of Crop Science 4(6): pp [30]. Slaughter, D.C. and C.H. Crisosto Nondestructive internal quality assessment of kiwifruit using near infrared spectroscopy. Seminars in Food Analysis 3: pp [31]. Subedi, P.P. and K.B. Walsh Non-invasive techniques for measurement of fresh fruit firmness. Postharvest Biology and Technology 51: pp [32]. Tellinghuisen, J Exploring the diffraction grating using a He Ne laser and a CD-ROM. Journal of Chemical Education Vol. 79 No [33]. Von Loesecke, H.W Quantitative changes in the chloroplast pigments in the peel of bananas during ripening. J. Amer. Chem. Soc. 15: pp [34]. Wakabayashi, F. and K. Hamada A DVD Spectroscope: A Simple, High- Resolution Classroom Spectroscope. Journal of Chemical Education Vol. 83 No. 1 January. 129
146 1 st TOPIC Sustainable Rural Development-Towards A Better World Purwokerto, August 25-26,
147 2 nd TOPIC
148
149 2 nd TOPIC MATHEMATICAL MODEL FOR ESTIMATING STAPLE FOOD STOCK IN TEMANGGUNG REGENCY Anton Timur Wastoni Agronomics Postgraduate Program, Jenderal Soedirman University, Indonesia ABSTRACT Mathematical model is an abstraction of a real problems based on certain assumptions into mathematical symbols. Dynamic system model building basically uses causal relation to build model of a complex system for identifying and understanding the system behavior. Such the estimating food stock by arranging Food Balance Sheet is a complex system. Mathematical model formulation for estimation staple food stock is simplification of calculation in Food Balance Sheet model. Keywords: mathematical model, Food Balance Sheet, food stock INTRODUCTION Food is one of human main necessity. The problems which affect food production and supply are: (1) uneven production of food, (2) disaster occured at some places especially landslide and wind storm, (3) globalization and integration of some economic area made Indonesia susceptible to fluctuation of international stock and price, (4) global climate change. Based on BPS data (2011), production of rice and corn in Temanggung Regency was always a surplus. The surplus is about tons of rice and tons of corn. This condition if not managed well, because of not constant production, could make food deficit in a certain time. Because of that, there is needed a food stock model which could be used to monitor food stock. By the dynamic model, we can estimate the food availability, consumption, and stock as time function. Mathematical model is an abstraction of a real problems based on certain assumption into mathematical symbols. Now, mathematical model is seen as a good and simple tool to analyze and solve problems for many fields, such as science, engineering, industrial, and social. Dynamic system methodology basically uses causal relation to build model of a complex system for identifying and understanding the dynamic system behavior. System dynamic methodology is more emphasize to improve understanding about system behavior from its structure. Dynamic system has been used to investigate resources dependence and product development (Repenning, Nelson P. 2001). In the food stock calculation, it usualy uses Food Balance Sheet. Food Balance Sheet is a table contain information about situation of food supply, utilization, and availability to be consumed people in an area (country/province/regency) in a certain period. Food stock system is a complex system with many factors and affected by time. Dynamic system could be used to describe the system, components of the system, and relation between the components; it also useful to estimate future condition with some assumptions. By knowing the future condition, we could simulate some scenarios of regulation to estimate the result of a regulation assumed in the scenario. In journal titled Dynamics System Analysis of Rice Stock in Merauke in the Framework to be Rice Barn for Indonesia East Area, Somantri and Tharir (2007) developed rice stock model using two approach: supply sub-system and demand sub-system which each sub-system were identified into its components and its interaction based on time and condition. The model developed could give good result with small error, and then used to estimate the condition of some scenarios made. 133

150 2 nd TOPIC Sustainable Rural Development-Towards A Better World Purwokerto, August 25-26, 2013 METHODOLOGY The model of food stock was built with Food Balance Sheet as references and nationally used. Mathematical formulations were arranged based on the harvested area, rice production, and corn production time series in Temanggung Regency during Mathematical model formulated using Excel Estimation was based on the curve trend as time function, either harvested area, production, or population. The model could be determined from the relation between variables. RESULTS AND DISCUSSION Qualitative Model for Food Production, Consumption and Stock Based on parameters in Food Balance Sheet, it is noted that factors influence food availability is the amount of harvest, seed use, feed use, shrink or lost, and industrial use. Amount of harvest are affected by productivity and planting index. Corn included into the staple food ingredients because there are 30% of population which consume corn as staple food. This will affect real rice consumption and moreover affect food stock condition. The results of food stock modeling in Temanggung Regency illustrated in Figure 1. Figure 1. Food Stock Model in Temanggung Regency Mathematical Model for Rice Stock Food availability is a function of food production, agriculture land, food import and export. In regency level, export and import is assumed not influenced. Based on the rice harvested area during in Temanggung Regency obtained graph changes in harvested area as shown in figure 2 and it equation obtained as follows the equation
151 Productivity (Ton/Ha) Harvested Area (Ha) 2 nd TOPIC 32,500 32,000 31,500 31,000 30,500 30,000 29,500 29,000 28,500 28,000 27,500 27,000 31,335 32,016 29,523 y = x R² = ,879 28, Year s Figure 2. Chart changes in rice harvested area Y = -1045X (1) Y : harvested area (ha) X : years While the change in rice productivity during shown in figure 3 and follows the equation y = x R² = Year s Figure 3. Chart of rice productivity during Y = 0,329X + 4,666 (2) Y : productivity (ton/ha) X : years Rice production is the result of time equation (1) and (2), and thus obtained the following equation: Y = -343,805X , ,1 (3) Y : milled rice production (ton) X : years 135
152 Population 2 nd TOPIC Sustainable Rural Development-Towards A Better World Purwokerto, August 25-26, 2013 Population growth during at the Temanggung Residence shown in figure 4 and follows the question , , , ,000 y = e x R² = , , , , , , , , , Year s Figure 4. Chart changes in the population Y = 69644e 0.009x (4) Y : population X : years Not all crops, either rice or corn, is consumed. But The harvest still used for the other used, namely for the seed, animal feed, raw material for non-food industry, sum of this is 7,3%. This means there is a reduction of the harvest amount that became food, so that the equation becomes: Y = (1 0,073)(-343,805X , ,1) Y = 0,927(-343,805X , ,1) Y = -318,707X ,626X (5) Y : dry unhusked processed into rice (ton) X : years Conversion of paddy rice into rice is 62.3% so that the rice production model becomes: Y = -201,423X ,04X ,8 (6) Y : rice production X : years After being rice, there are still usage for others namely for animal feed, industrial material, and lost, and the amount reached 3.33% (BPS, 2010). So the model of rice necessity is: Y = -194,716X ,85X ,9 (7) Y : rice necessity (ton) X : years Thirty percent (30%) of people in Temanggung consumes corn as staple food, so the food necessity per capita changed from 139 kg/capita/year into 97.3 kg/capita/year. Rice consumed necessity model becomes: 136
153 Productivity (Ton/Ha) Harvested Area (Ha) 2 nd TOPIC Y = 6.776,361e 0,009x (8) Y : rice consumed necessity (ton) X : years From equation (7) anda (8) it noted that rice stock estimation follows equation: Y = (-194,716X ,85X ,9) - (6.776,361e 0,009x ) (9) Y : rice stock estimation (ton) X : years Mathematical Model for Corn Stock Based on the data of harvested area and corn production during , it obtained in figure 5 and following mathematical equation ,000 35,000 30,000 25,000 20,000 15,000 10,000 5, ,313 36,850 35,764 y = x R² = ,684 30, Year s Figure 5. Chart changes in corn harvested area Y = -784,4X (10) Y : harvested area of maize (ha) X : years Chart of corn productivity during shown in figure 6 and mathematical model of corn productivity follows the equation y = x R² = Year s Figure 6. Chart of corn productivity during
154 2 nd TOPIC Sustainable Rural Development-Towards A Better World Purwokerto, August 25-26, 2013 Y = 0,366X + 2,836 (11) Y : maize productivity (ton/ha) X : years Maize production is the result of time equation (10) and (11), and thus obtained the following equation: Y = -287,09X ,46X ,92 (12) Y : maize production (ton) X : years The use of corn for feed, seed and other non-food raw materials industry is 26.92% and conversion to rice equivalent food is 52.30%. Based on equation (12) it obtained equation for amount of corn used as food: Y = -209,81X ,29X ,6 (13) Y : maize used as food (ton) X : years And conversion into rice equivalent food follows equation: Y = -109,73X ,54X ,4 (14) Y : rice equivalent food fron maize (ton) X : years Consumption of population in Temanggung is 41.7 kg/capita/year (30% of 139 kg/capita/year), so the food consumption from corn follows equation: Y = 2904,155e 0,009X (15) Y : food consumption from maize (ton) X : years From equation (14) and (15), it is noted that estimated food stock from corn follows equation: Y = (-109,73X ,54X ,4) - (2904,155e 0,009X ) (16) Y : estimated food stock from corn (ton) X : years Model for Estimating Staple Food Stock Based on the equation (9) and (16) above, the estimation of food stock in Temanggung Residence which is sourced from rice and corn follows equation: Y = {(-194,716X ,85X ,9) - (6776,361e 0,009x )} + {(-109,73X ,54X ,4) - (2904,155e 0,009X )} (17) or: Y = (-304,45X ,39X ,30) - (9.680,52e 0,009X ) (18) Y : staple food stock (ton) X : years From the equation, if depicted in a chart staple food stock position versus time shown in Figure
155 Stapple Food Food Psition (Ton) 2 nd TOPIC Years Figure 7. Chart staple food reserves in Temanggung Regency From the chart, can be predicted that 17 years later or in 2022, food production in Temanggung Regency is not able to meet the needs of the food population, with a food pattern that exists today. CONCLUSION Mathematics model for food stock estimation in Temanggung Regency is: Y = (-304,45X ,39X ,30) - (9.680,52e 0,009X ) (19) For further study, it needs to develop the model with additional factors influence food production, regional trading and consumer behavior, so the model will be more accurate. REFERENCES [1] Anonim, Cadangan Pangan, Sejarah, Pengelolaan dan Perencanaannya /05/16/cadangan-pangan-sejarahpengelolaan-dan-perencanaanya/. Accessed on May 10, 2013 [2] Anonim, System Dynamics. Accessed on May 8, 2013 [3] Badan Pusat Statistik, Neraca Bahan Makanan Studi Keterbandingan Data Ketersediaan dan Data Konsumsi. bps.go.id, Accessed on May 9, [4] Badan Pusat Statistik Temanggung Dalam Angka Badan Pusat Statistik, Temanggung [5] Departemen Pertanian, Pedoman Pengembangan Konsumsi Pangan. Deptan RI. Jakarta. [6] Departemen Pertanian, Pedoman Pengelolaan Cadangan Pangan. Deptan RI. Jakarta. [7] Forrester, Jay (1971). Counterintuitive behavior of social systems. Technology Review 73(3): [8] Repenning, Nelson P. (2001). "Understanding fire fighting in new product development". The Journal of Product Innovation Management 18 (5): [9] Somantri, A. S., Tharir, Ridwan Analisis Sistem Dinamik Ketersediaan Beras di Merauke dalam Rangka Menuju Lumbung Padi Bagi Kawasan Timur Indonesia. Bulentin Teknologi Pascapanen Pertanian. Vol [10] Suhardjo, Perencanaan Pangan dan Gizi, Jakarta; Bumi Aksara [11] Sterman, John D. (2001). "System dynamics modeling: Tools for learning in a complex world". California management review 43 (4):
156 2 nd TOPIC Sustainable Rural Development-Towards A Better World Purwokerto, August 25-26,
157 2 nd TOPIC APPLICATION OF NATURAL PRESERVATION ON COCONUT SAP AND QUALITY PROFILE EVALUATION OF SOLIDIFIED COCONUT SUGAR Karseno 1, Tri Yanto 1, Pepita Haryanti 1, Retno Setyawati 1 1 Food Science and Technology Study Program, Department of Agricultural Technology, Jenderal Soedirman University, Indonesia karseno_m71@yahoo.com ABSTRACT Coconut sap is material for production of coconut sugar that easily fermented by microbial activity. The fermentation can be prevented by addition of natural preservation. In this study, mangosteen rind, betel leaf, and clover leaf in combination with lime were used as natural preservation. The aim of the research was to evaluate the effect of addition various natural preservation on quality profile of solidified coconut sugar. Mangosteen rind, paper betel and clove powder were formulated with lime powder at the concentration of 10-30% (w/w). 1 g of each preservation were add into coconut sap tube before tapping, subsequently coconut sap was heating until it was solidified. The quality profile of coconut sugar including moisture content, ash, sucrose, reducing sugar, and total insoluble solid were evaluated. Results of the experiment was indicated that all natural preservation were possible used to produce good quality of solidified coconut sugar and no significant difference among them. Furthermore, quality profile of coconut sugar treated by natural preservation was better than control. The quality profile of sugar treated by natural preservation was almost no change after 30 day storage at room temparature, in contrast quality profile of control was significantly changed. In addition, quality profile of the treated product did not complay with Indonesian legislation standard for solidified coconut sugar. Keywords: coconut sap, solidified coconut sugar, natural preservation, quality profile INTRODUCTION Coconut (Coconut nucifera L) is already known as the most popular palm in Indonesia. Every part of the tree is useful in one way or another [1] Therefore, coconut palm is an important economic crop for the local places. One of the important product of coconut palm is sap or juice. Traditionally, coconut sap is collected by cutting the outer end at the head of the inflorescencs that collected twice a day from each inflorescence, normally in morning and evening. Solidified coconut sugar is produced by evaporating the palm sap in a large opened pan and is heated using the wood fired stove until it becomes concentrated [2]. Central Java province is the biggest producer for coconut sugar production in Java area. There are more than 5000 farmer produce coconut sugars in this province which concentrated in Banyumas regency. The unique flavour of coconut sugar has made its popularity as a flavoring reagent in confectionery and baking products. In addition, emphasis on the consumption of natural foods has resulted in the use of coconut sugar as an alternative sweetener [3]. Coconut sap is nutritious, rich of organic and inorganic materials and indigenous sweet product. Originally, the sap is sterile (free of microorganisms) while flowing in coconut juice. However, microorganisms are found in the sap which is coming from an environment during collecting process. Microbes are introduced into the sap by unsanitary tapping procedures and unsanitary collection. Consequently, the growth of microorganisms in the sap will be manipulated [2], the fermentation was occurred and sap cannot be solidified or concentrated. Low quality of coconut sap also caused the dark colour of sugar, due to more acids accumulation in the system can be induced browning reaction [2]. Coconut juice is rich in sugar (10 ~ 15%) and is at a nearly neutral ph. It contains 16 kinds of amino acids and various vitamins such as vitamin C, vitamin B complex, especially nicotinic acid. The rich nutritious components make coconut inflorescence sap highly susceptible to spontaneous fermentation even during the process of harvesting, especially in sunlight [3, 4]. 141
158 2 nd TOPIC Sustainable Rural Development-Towards A Better World Purwokerto, August 25-26, 2013 To prevent the fermentation occurred, the farmers were add natural or synthetic preservation which called laru. Sodium metabisulphite (Na 2 SO 2 O 5 ) is synthetic laru that common used by farmer. In the other hand, several plant materials such as mangosteen rind, jackfruit wood, green betel and clover leaf with combination of lime already used as natural laru. Addition of mangosteen rind into sap not only because it was able to produce good brownies color of coconut sugar, but it also functions as an antimicrobial and antioxidant. Apart from being antimicrobial, various studies indicate that mangosteen rind is rich in antioxidants, especially anthocyanins, xanthone, tannins, and phenolic compounds [5]. The research conducted by Dahlia et al., 2010 [6] states that chewing tablets made from mangosteen rind extracts showed antioxidant activity. Green betel can be used as natural preservativation because it contain essential oils especially phenolic compounds [7], and other bioactive compounds including flavonoids, alkaloids, polyphenols, tannins and volatile oil [8], that already used as a natural antioxidant to prevent rancidity of coconut oil [9]. Natural laru are more recomended than synthetic one since it was considers more safety, environmentally friendly and good quality of coconut sugar. The formulation and application of natural preservation on the production of coconut sugar is great crusial to produce good quality and safety of coconut sugar. The objective of this study was to evaluate the effect of addition various natural preservation on quality profile of solidified coconut sugar. METHODOLOGY Materials Coconut sap, green betel, mangosteen rind, jackfruit wood, clover leaf and lime powder were obtained from local farmer in Banyumas regency, Central Java province. All chemical reagents were purchase from Sigma and Merck, except it was stated in the text. Preparation and application of natural preservation Betel leaf, mangosteen rind, clover leaf and jackfruit wood were dried on cabinet dryer at 60ºC and subsequently crushed into powder (60 mesh), then each material was mixed with lime powder on the concentration of 30% (w/w). 1 g of each preservation was added into sap container before tapping. Lime powder only was used as control. The application was performed by selected farmers from two located primary producer of coconut sugar in Central Java province. Sampel collection The solidified coconut sugar was collect from selected farmers who apply the treatment and kept in the container then transported to Laboratory of Agricultural Technology, Jenderal Soedirman University, Central Java, Indonesia. Physical and chemical quality of solidified coconut sugar were analyzed in three replications. ph measurement The ph of coconut sap was measured by a ph meter. Calibration was standardized using ph 7.0 and 4.0 buffers. Each sample was measured in three replications. Total insoluble solids measurement A total insoluble solid of coconut sugar was measured by refere to Apriyantono, 1989 [10]. Reducing sugar Reducing sugars of solidified coconut sugar was quantified by Nelson Somogyi method [10]. Moisture content Moisture content of solidified coconut sugar was measured by Gravimetric method [10]. Ash content Ash content of solidified coconut sugar was measured by refer to Apriyantono, 1989 [10]. 142
159 Moisture ( % wb) 2 nd TOPIC Data analysis To test whether solidified coconut sugar qualities varied significantly among samples, statistical parameters was employed by F-test and Analysis of Variance (ANOVA). Duncan s Multiple Range Test (DMRT) was used to test significant difference between each pairs of mean. RESULTS AND DISCUSSION Moisture content Moisture content is the important factor of food products, since it play significantly role on the quality of the product especially for self life. Moisture content of solidified coconut sugar treated by various natural preservation was presented in Figure Natural preservation Figure 1. Moisture content of solidified coconut sugar in various natural preservation Figure 1 indicated that moisture content of solidified coconut sugar treated by natural preservation was range from 8.02 to 9.82%. All data were less than control (lime powder only) and do not comply with Indonesian Standard (moisture content of solidified coconut sugar should be less than 10% wb). The lower of moisture content of the product is the important factor related to shelf life of the product. According to Susanto and Saneto [11], the shelf life of foods was significantly affected by moistute content, because microbes grow well at certain moisture content. Solidified coconut sugar treated by clover leaf showed the lowest of moisture content, and eugenol of the clover leaf might play role in this phenomena. Ash content The ash content is measure of the total amount of minerals present within a food. Ash content of solidified coconut sugar treated by natural preservation was range from 1.59 to 2.23% (Figure 2). 143
160 Reducing sugar ( % wb ) Ash ( % wb ) 2 nd TOPIC Sustainable Rural Development-Towards A Better World Purwokerto, August 25-26, Natural preservation Figure 2. Ash content of solidified coconut sugar in various natural preservation Solidified coconut sugar treated by betel leaf showed the highest ash content, in contray clover leaf produce the lowest ash content. The application of lime powder (control), clover leaf, betel leaf and mangosteen rind, and jackfruit chips don not comply with Indonesian legislation standard (SNI) for solidified coconut sugar. According to SNI , ash content of solidified coconut sugar should be less than 2%. Reducing sugar content Reducing sugar of solidified coconut sugar treated by natural preservation was range from to 12.84% and all of them were lower than control (Figure 3) Type of natural preservation Figure 3. Reducing sugar content of solidified coconut sugar in various natural preservation The highest reducing sugar was found from coconut sugar treated by lime (control), whereas the lowest reducing sugar was produced from the sugar treated by clover leaf. These results might related with the moisture content of the products. Reducing sugar was proportional to moisture content. The high of moisture content was imply to high reducing sugar of the products. Reducing sugar might affect the hardness, color, and taste of coconut sugar. At the lower reducing sugar the color of the product tend to yellowish brown, in the other hand when reducing sugar was high, the color of the product tend to dark brown. This is due to the browning non enzymatic reaction namely Maillard reaction that occured during sugar production which is produces brown compounds [12]. According to SNI reducing sugar content of solidified coconut sugar should be at 10% or lower. Among the treatment, coconut sugar treated by betel leaf-mangosteen rind showed the lower reducing sugar than the other and did not complay with Indonesian legislation standard SNI
161 Sucrosa ( % wb ) 2 nd TOPIC Sucrose content Sucrose content of solidified coconut sugar treated by natural preservation was range at to % (Figure 4). Coconut sugar treated by jackfruit wood show the highest sucrose content was 88.58%, while coconut sugar treated by lime (control) show the lowest of sucrose content was 62.56%. This phenomenon was occurred since sucrose in coconut sugar could be hydrolyzed to reducing sugars, then the high reducing sugars was imply to lower sucrose content on coconut sugar and vice versa. Coconut sugar that treated by lime (control) show the highest reducing sugar content than the other Natural preservation Figure 4. Sucrose content of solidified coconut sugar in various natural preservation The quality profiles of solidified coconut sugar treated by natural preservation in comparison with control and Indonesian legislation standard were summaries in the Table 1. Based on these data, quality profiles of solidified coconut sugar treated by natural preservation was better than control and generaly did not comply with Indonesian legislation standard for solidified coconut sugar. Table 1. Quality profile of solidified coconut sugar on various treatment Parameter Control (lime) Betel leaf Betel leaf + Mangosteen rind Clover leaf Jackfruit wood Mangosteen rind Moisture ( %bb) Max 10 Ash (%bb) Max 2 Reducing sugar (%bb) Max 10 Sucrose (%bb) Min 77 Total insoluble solid (%bb) Max 1 SNI CONCLUSIONS All natural preservation including mangosteen rind, betel leaf, and clover leaf were possible used to produce good quality of solidified coconut sugar and no significant difference among them. Furthermore, quality profile of coconut sugar treated by all natural preservation was better than control. In addition, quality profile of the treated product generaly did not comply with Indonesian legislation standard for solidified coconut sugar. 145
162 2 nd TOPIC Sustainable Rural Development-Towards A Better World Purwokerto, August 25-26, 2013 ACKNOWLEDGMENTS The authors would like to thank to the Directorate General of Higher Education, Indonesia for financial support of this research. REFERENCES [1] Borse BB, Rao LJM, Ramalakshmi K, Raghavan B (2007). Chemical composition of volatiles from coconut sap (neera) and effect of processing. Food chem. 101(3): [2] Naknean P, Meenune M, Roudaut G Characterization of palm sap harvested in Songkhla province, Southern Thailand. International Food Research Journal 17: [3] Phaichamnan M, Posri W, Meenune M Quality profile of palm sugar concentrate produced in Songkhla province, Thailand International Food Research Journal 17: [4] Aalbersberg B, Rohinee S, Praveen R (1997). Nutrient analysis of coconut toddy. Trop. Sci. 37(3): [5] Permana, A. W Mangosteen rind powder as instant drink product with rich antioxidant (On-Line). Oct 17, [6] Dahlia, N. P., M. Taufan dan L. A. Salma Potency of mangosteen rind (Garcinia mangostana L) for candy product. Bogor Agriculture University, Bogor. 17 p. [7] Rohmah, D. L Application of red betel (Piper crocatum Hort) and green betel (Piper betle Linn) as natural preservation. Bachelor thesis. Faculty of Agriculture, Jenderal Soedirman University, Purwokerto. 61 p. (not published) [8] Andarwulan, N., C. H. Wijaya., dan D. T. Cahyono. (1996). Antioxidant activity of betel leaf (Piper betle L.). Technology and Food Industry bulletin. Vol. VII No p. [9] Komayaharti, A dan D. Paryanti Betel leaf extract as antioxidant in coconut oil. Diponegoro University, Semarang. 6 p. [10] Apriyantono, A., D. Fardiaz, N. L. Puspitasari, Sedarnawati, S. Budiyanto Food analysis, laboratory procedure. PT. Penerbit IPB, Bogor. [11] Susanto, T. dan B. Saneto Teknologi Pengolahan Hasil Pertanian. PT. Bina Ilmu, Surabaya. 206 hal. [12] Winarno, F.G Kimia Pangan dan Gizi. PT. Gramedia, Jakarta. 251 hal. 146
163 2 nd TOPIC GE INTERACTION ASSESMENT OF SR SWEET CORN YIELD BASED ON ADDITIVE MAIN EFFECT AND MULTIPLICATIVE INTERACTION (AMMI) AND BIPLOT IN WEST JAVA Syafi i M 1, Melati R 3, Waluyo B 2, and Ruswandi D 4 1 PhD Student of Plant Breeding, Agricultural Faculty, Padjajaran University, Bandung, Indonesia 2 PhD candidate of Plant Breeding, Agricultural Faculty, Padjajaran University, Bandung, Indonesia 3 Undergraduate Student of Plant Breeding, Agricultural Faculty, Padjajaran University, Bandung, Indonesia 4 Associate Professor, Departement Plant Breeding and Biotechnology, Padjajaran University, Bandung, Indonesia syafii_m@yahoo.com ABSTRACT In a maize plant breeding program, to obtain genotypes with high yield results and is widely adaptable to be the main goal of a breeder. Crops yield other than corn is determined by genetic factors, is also determined by environmental factors. The evaluation of the interaction of genotype and environment (GXE), is very important, because it is used to select superior genotypes, identify a suitable environment, as well as recommendations on the use of adaptive environments cultivars. Therefore, it is necessary to evaluate the genotypes in multi-location to find out who owned a yield potential of genotypes, and to determine the location of the representative to be selected. The study was conducted to assess and determine the appearance of 14 genotypes of SR sweet corn and 2 check varieties in four locations Jatinangor, Lembang, Purwakarta, and Arjasari-West Java in January-April Research using randomized block design with three replications in each of the location. The results showed the location, genotype and genotype x environment interaction effect on the results. Analysis of the main effects additive and multiplicative interactions (AMMI) shows two AMMI components (PCA1 and PCA2) the cumulative effect on the genotype x environment interaction. Biplot results showed SR33 and SR43 is the best genotyping in Arjasari, Limbangan are SR15, SR32 and the best location in Purwakarta is SR52. Genotyping SR4, SR9, SR22, SR24, SR25, SR26, SR30, SR31, SR32, SR41, SR52, SB varieties, and BS has wide adaptability. Keywords: sweetcorn, multilocation, ammi, biplot, GXE interactions INTRODUCTION In a maize plant breeding program, the main objective is to obtain a breeder genotypes with high yields and adapt wider (Balestre et al., 2009). GXE interaction is an important component of the breeding program. Crops yield other than corn is determined by genetic factors, is also determined by environmental factors. The evaluation of the interaction of genotype and environment (GXE), is very important, because it is used to select superior genotypes, identify a suitable environment, as well as recommendations on the use of adaptive cultivars that particular environment (Balestre et al., 2009). Biblo and Ray (1976) states that the success of a breeding program will be achieved if the aspect level genotyping results, adaptation and stability. All these aspects will be integrated in the measurement results. Results genotypes were measured in a particular environment, is the result of the influence of genotype (G), environment (E) and genotype x environment interaction (GE). Selection of the best genotypic need to be concerned that a representative environment, genotypes with high potential and magnitude of the influence of genotype x environment (Yan, 2002). Differences in genotypic response to the environment, will affect the ranking of genotypes in multiple environments. The evaluation of the adaptability and stability can be met with repetition plot, character evaluation and selection of genotypes that have a top ranking on several environments and seasons. Direct Selection stable genotypes can be filled with repetition test plot and character evaluation through statistical analysis, by testing GxE interactions and measure the level of stability sutau 147
164 2 nd TOPIC Sustainable Rural Development-Towards A Better World Purwokerto, August 25-26, 2013 genotype. Some statistical methods to assess the stability, adaptability and the results have been discussed by researchers (Hussein et al., 2000; Kang, 2002). According Gauh and Zobel (1997), to support the success of the best genotypic selection needs to consider a representative environment, which divided the area under cultivation and testing into a small area that supports high heritability values, and a high yield. Environmental classification can be determined using statistical methods, such as cluster analysis and AMMI. Cluster analysis to categorize the environment using principal component analysis (PCA) (Geng et al., 1990; Kearsey and Pooni, 1996) and analysis of variance models AMMI combines with principal component analysis (PCA) (Smith et al., 2002). To illustrate the relationship between genotype and the interaction effect of genotype and environment, use biplot analysis by plotting the first two AMMI components (ie PCA 1 and PCA 2 genotype score the score of the genotype x environment interaction) (Yan et al, 2000). Biplot display with stable genotype based on statistical equations allow for grouping by genotype performance in different environments and in the same sector. Through this biplot can be identified superior genotypes in each environment, a stable genotype and environment representative for superior genotypes. Genotyping ideal is to have a value of 1 PCA score averages the high and 2 PCA score close to zero (stable), and a representative environment has a value score that high PCA 1 and PCA 2 score values close to zero (the average environment). In sweet corn breeding program of SR Padjadjaran University, to select the best genotypes yield trials need to be conducted in multiple environments, in this case multilocation. Therefore, it is necessary to evaluate the genotypes at several locations to determine yield potential possessed a genotype, as well as determine the location of the representative to be selected. The purpose of this study was to assess the appearance of the SR genotype Padjadjaran in some environments, determine the genotypes that have high yield and yield stability analysis and AMMI biplot. METHODOLOGY Research to determine the appearance of the 14 genotype SR Padjadjaran and 2 check varieties held in 4 locations: Jatinangor, Lembang, Purwakarta and Arjasari. The research was conducted in January-April The design used was a randomized block design, replicated 3 times. Of each genotype were planted on the plot size of 3 x 5 m2 and comprises 100 plants per plot. Urea fertilization with 300 kg ha-1, TSP 150 kg ha-1, KCl 100 kg ha-1, given at the time of planting and age of 4 weeks. Disease control is done by spraying insecticides and fungicides. Weeding is done manually. Observations were made of the potential outcomes pipil dry weight. Estimation of genotype X environment interaction, and AMMI biplot variants were analyzed by Cropstat 7.2 for windows (IRRI, 2003) and continued stability analysis model of Eberhart-Russel (1966). RESULTS AND DISCUSSION From the results of the combined analysis showed a significant variation to the location, genotype and genotype x environment interaction (Table 1). Location has the greatest influence on the results, followed by genotype and genotype x environment interaction. Effect of genotype x environment that allows for real AMMI analysis and interaction pattern different genotypes of the site with the biplot. Sum of the squares of the location showing the location varies, with a large difference between the average environment that cause differences in the results. Sum of squares genotype x environment interaction is twice as large compared to genotype showed significant differences in genotypic response to the location. 148
165 2 nd TOPIC Table 1. Combined analysis of variance on the character of the harvest (t/ha) Sourse df Sum of squares Mean square F value F prob Location * Rep/location Genotype * Genotype x location * Residuals Error Total Remark : * significantly different at the level test F 5% AMMI analysis results in Table 2 shows the AMMI component 1 contribute 81.44% of the sum of squares genotype x environment interactions, as well as components AMMI 2 states 12.26% of the sum of genotype x environment interaction. Thus AMMI component 1 has a larger sum of the squares of the genotype and the AMMI 2 has a smaller sum of squares of the genotype, the cumulative sum of the squares have contributed to the genotype x environment. Table 2. Analysis of varians yield character based on AMMI 2 model Sourse df Sum of squares Mean square F value F prob Location * Rep/location Genotype * Genotype x location * IPCA * IPCA Residuals Error Total Accurate model for AMMI can be predicted using the first two components AMMI (Gauch and Zobel, 1996; Yan et al., 2002). PCA score value of two characters results in 16 genotypes and 4 locations can be seen in Table 3 below. 149
166 2 nd TOPIC Sustainable Rural Development-Towards A Better World Purwokerto, August 25-26, 2013 Table 3. Scoring value of two PCA yield on 16 genotype and 4 location Genotype/location IPCA1 IPCA2 A B C D E F G H I J K L M N O P Q AJSR JTN LMBG PWKT A biplot using genotypic and environmental scores of the first two AMMI components (Yan, 2002). A biplot) has 4 areas that depend on the sign owned by genotypic and environmental scores. In Figure 1, the location is in 2 sectors, locations Jatinangor (JTN), Lembang (LMBG) and Purwakarta (PWKT) lies in the sector, while the location Arjasari (AJSR) lies in other sectors apart. Genotyping SR 43, SR 32 and SR 33 is the best genotypes in the location Arjasari. While genotyping genotyping SR 15 is the best in location Jatinangor, Lembang and Purwakarta. Thus, these genotypes may be filed as a specific genotype areas in the region (Figure 2). The genotypes for high yield because it is able to optimize the ability of the environment to be high yield. Whereas genotypes SR 4, SR 9, SR 22, SR 24, SR 25, SR 26, SR 30, SR 31, SR 32, SR 41, SR 52, and SB and BS varieties including stable genotypes in locations Arjasari, Jatinangor, Lembang and Purwakarta. Genotypes are able to optimize a suboptimal environment into high yield, so these genotypes have wide adaptability (Figure 1). Genotypes are located close to the center point less responsive in comparison with the genotypes at the farthest. Genotyping of SR 33 and SR 15 have the highest average yield as indicated by the high value of PCA1 scores, but SR 15 has a value score PCA2 relatively small, so it has a more stable performance. Genotypes with a relatively small value score PCA1 PCA2 scores and relatively small value is stable genotypes in all locations. The average potential of each genotype in each location results shown in Table

167 2 nd TOPIC Figure 1. Biplot of AMMI 2 model 16 genotype in 4 location Based on consideration of the location of the test, has a value score PCA1 Arjasari large and positive, meaning the appearance of genotype at this location varies, but has a value close to zero PCA2 score meaning genotypic differences inisangat locations consistent with the average at all locations compared with other locations. In conjunction with a score PCA2 is still relatively large, such as the location Jatinangor may not accurately reflect the average genotype in all locations. Figure 2. The best genotype in locations Cluster analysis of genotypes based on yield potential, there are 2 major clusters are divided into subclusters, which are the first cluster SR32, SB, SR33, SR43, SR26, SR31, SR24, SR30 and SR22 AND 151

168 2 nd TOPIC Sustainable Rural Development-Towards A Better World Purwokerto, August 25-26, 2013 second cluster is SR4, S41, BS, SR15, SR9, SR25 and SR52. Relationships based on yield potential difference is farthest SR32 and SR 52. The relationship shown in Figure 3 Figure3. Dendrogram of genotype based on yield Table 4. Average, Phenotype index and Environment index Genotype Environment Average Phenotype index AJSR JTN LMBG PWKT A B C D E F G H I J K L M N O P Q Average Environment index Based on the results of stability analysis (Table 5), that the average performance and parameter stability genotyping results showed that genotype SR4, SR22, SR24, SR25, SR26, SR31, SR32, SR41, SR52 152
169 2 nd TOPIC and check BS and SB varieties including stable genotypes that have broad adaptation. While SR9, SR15, SR 30 and SR 33 including genotyping unstable. Genotyping of SR 33 has an average high yield in the region Arjasari, so it can be recommended in specific genotypes having the region. Table 5. Performance average and parameter stability yield (t/ha) PARAMETER Genotype range average STABILITY b = 1 SE(b) Sd2 = 0 Remark A Stable B * Not stable C * Not stable D Stable E Stable F Stable G Stable H * Not stable I Stable J Stable K * Not stable L Stable M stabil N stabil O stabil P stabil Remark : In the table ANOVA, sign (*) indicate significant differences at the level of each test 5% In table stability analysis, sign (*) indicates the test results significant at level test of 5% and 1%. For "b" significantly different from 1 and for SD2 significantly different from zero. CONCLUSIONS Genotype x environment interaction assessment can be carried out by AMMI analysis and visualization of association between genotype and genotype and environment interaction biplot analysis. In the interaction study 16 genotypes at four locations can be determined genotypes are widely adaptable, and environment representative superior genotypes for selection. SR 43, SR 32 and SR 33 is the best genotypes in the location Arjasari and SR 15 is the best genotypes in locations Jatinangor, Lembang and Purwakarta that this genotype may be filed as a specific genotype territory. SR 4, SR 9, SR 22, SR 24, SR 25, SR 26, SR 30, SR 31, SR 32, SR 41, SR 52, and SB and BS varieties including stable genotypes. Arjasari is representative locations for screening superior genotypes. REFERENCES [1] M. Balestre, R.G. Von Pinho, J.C. Souza and R.L. Oliveira Genotypic stability and adaptability in tropical maize based on AMMI and GGE biplot analysis. Genetics and Molecular Research 8 (4): [2] Eberhart, S.A. and W.A. Russel Stability parameter for comparing varieties. Crop. Sci. 6:36-40 [3] Gauch, H.G. and R.W. Zobel AMMI analysis of yield trials. In Genotype by Environment Interaction. P Edited by M.S. kang and H.G. Gauch. CRC Press Inc., Boca raton, New York, London, Tokyo. 153
170 2 nd TOPIC Sustainable Rural Development-Towards A Better World Purwokerto, August 25-26, 2013 [4] Geng, S., B.M. Hu and D.M. Basset Quantification and classification of Locational Effects on Cotton Cultivar Testing Programs. Agron. J. 82: [5] Hussein, MA., Bjornstad, and AH Aastveit SASG 3 ESTAB: A SAS program of computing genotipe 3 environment stability statistics. Agron. J. 92: [6] Kang, M.S Genotipe-Environment Interaction: Progress and Prospects. In Quantitative genetics, genomics and Plant Breeding. P Edited by MS. CAB International. [7] Kearsey, M.J. and H.S. Pooni The genetic analysis of Quantitative Traits. Chapman and Hall. London [8] Smith, A., B. Cullis, D. Luckett, G. Hollamby, and R. Thompson Exploring varietyenvironment data using random effect AMMI models with adjustment for spatial field trend: Part2: Application. In Quantitative Genetics, Genomic and Plant Breeding. P Edited by M.S. Kang@ CAB International. [9] Yan, W., L.A. hunt, Q. Sheng and Z. Szlavnics Cultivar evaluation and megaenvironment investigation based on the GGE biplot. Crop. Sci. 40: [10] Yan, W Singular-value partitioning in biplot analisis of multi-environment trial data. Agron. J 94:
171 2 nd TOPIC IMPROVING BEEF CATTLE PRODUCTION SYSTEM FOR SUSTAINABLE RURAL DEVELOPMENT IN CENTRAL JAVA * Akhmad Sodiq 1, Suwarno 1 and Arif Harnowo Sidhi 1 1 Lecturer of Animal Science Faculty Jenderal Soedirman University, Indonesia ABSTRACT This study was designed to identify beef cattle production system, feeding system and also discuss the possibility for improving their system. Data on livestock production and feeding system under 48 farmer group of beef cattle in rural areas of Central Java was recorded. Beef cattle production in rural areas area is mainly conducted in traditional system with small numbers of animals (ranged 2-8 head) with low in productivity (daily gain 0.6 kg/day, calving interval 20.6 months). Types of feeds offered to beef cattle could be classified into four major groups: legume, grasses other shrubs trees, concentrate, agricultural by-product. In middle and upland areas, grass and rice straw in fresh is still considered the best feed for cattle. In low-land, farmer provide rice straw in fresh and also practice ammoniation. Low performance for Ongole Cross, Sumba Ongole Cross, Simmentral Cross, and Brahman Cross were found. Findings of this study should be accounted in strengthen feeding and management, especially in maintaining the body weight during mating and pregnancy periods in order to improve their productivity. Proven applied technology in term of breeding, feeding, housing, health and daily practice management aspects as well as empowering farmer and group dynamic is needed for increasing the sustainability of beef cattle production in rural areas. Keywords: Beef cattle, livestock production system, feeding system, performance INTRODUCTION In Indonesia, the last ten years period, demand of beef consumption keep increasing and exceeding the domestic production [1], and it expected increase 2.7% during [2]. Therefore, the government in 2000 started a program to attain beef self-sufficiency by the year 2005 and moving around 2010 and This policy is based on consideration that Indonesia has natural resources and cattle population that relatively can be expanded to produce adequate beef for domestic consumption or even for export. To achieve that objective the government has launched a thrust policy program stipulated in animal husbandry development policy [3]. Development of beef cattle in the future should be carried out through sustainable agribusiness approach. Beef cattle farming system should be more professionally managed through application of technology innovation focusing on the aspect of business efficiency [4]. One of the visions in achieving the self-sufficiency is that based on local resources. The development of feeding system which is based on the local resources is the milestone in supporting sustainable and competitive beef cattle production systems in Indonesia. The purpose of this paper is designed to identify beef cattle production system, feeding system and also discuss the possibility for improving their system. METHODOLOGY The current study was conducted by Livestock On-Farm Trials located at 12 regencies of Central Java province. Data on livestock production and feeding system involved 48 farmer group of beef cattle was recorded. Productivity of fattening (Ongole Cross, Sumba Ongole Cross, Simental Cross) and breeding (Local and Brahman Cross) were evaluated. Quantitative and qualitative descriptive analysis was applied in this study. 155
172 2 nd TOPIC Sustainable Rural Development-Towards A Better World Purwokerto, August 25-26, 2013 RESULTS AND DISCUSSION Livestock Production Systems Animal production involves both large and small ruminants and a variety of systems integrated with crops. The systems vary as a function of agro-ecological zone and intensity of farming operations. The development of these systems has considerable potential, the benefits being associated with the complementary interactions of the subsystems in which the products are additive [5]. The prevailing animal production systems in Indonesia could be classified fall into one of three categories (i). landless, (ii). crop-based; and (iii). rangeland-based. The characteristic of system and subsystem animal production in term of beef cattle production under farmer group of beef cattle development program are summarized in Table 1. In animal production systems, the value of species increases in relation to its adaptation, capacity to make socioeconomic contributions, capacity to fill market opportunities and potential for increasing productivity. Present on-farm research has shown that small scale farmers in the location of study and in many parts of Central Java continue to work with local breeds because of their good adaptation to the prevailing conditions. Ongole Cross (Peranakan Ongole) are the predominant of the native cattle and are widely distributed over the Central Java regions. Especially in Kebumen regency found that most of the farmer raising Sumba Ongole cattle. Beef cattle are raised within the traditional system, characterized by small-scale production (mostly 2-3 animals per flock in various physiological age). They use of animal as function including ssubsistence, cash-income, security, and investment. The beef cattle houses were built with available materials and generally permanent form. Communal housing located mostly located out of the farm family house but it near the village. Cattle for fattening and breeding purposes were raised at separated flock. This study demonstrate that the appropriate use of local feed resources and local livestock breeds requires close integration between crops and livestock within the system. The excreta (dung) was used on the farm to produce fertilizer. Ruminants will continue to serve a valuable role in sustainable agricultural systems [6]. They are particularly useful in converting vast renewable resources from rangeland, pasture, and crop residues or other by-products into humanly edible food. With ruminants, land that is too poor or too erodable to cultivate becomes productive. Also, nutrients in byproducts are utilized and do not become a waste disposal problem. Table 1. Characteristics of system and subsytem animal production under farmer group of beef cattle in rural areas a. Characteristics of system Type (classification) Sub-type Mixed farming, minimum land Traditional, landless, smallholders, Availability of factors land, labour, Land (integrated), tenant (household), capital (low-input, capital LEISA). Orientation of production Business, subsistence, Calf-crop, dung Crop production, fertilizer Rice, Maize, Compost (dung). b. Subsytem animal production Animal species/breeds Adaptation Productivity Function in system Management Housing Interaction with crop Constraints nutrition, disease Ongole Cross, Sumba Ongole C, Simental Cross, Brahman Cross Local and imported breeds Low productivity in 2nd partus for imported breed Subsistence, cash-income, security, investment Feeding (cut-and-carry, integration into crop). Communal, integrated with forage Complementary (dung field) Nutrition quality and sustainability, Prolapsus uteri, bload and parasite. Beef cattle prices vary and depend on a number of factors like season of festival days, age, sex and size of the beef cattle, whether the buyer. Management of the beef cattle was based on primary experiences, and transfer technology was not fully applied resulting in low productivity especially in breeding purposes. In order to increase cattle population based on liable production cost, an approach 156
173 2 nd TOPIC of animal integrated system with food crops, estate crops, forestry and others has feseable to develop [7]. Introducing appropriate feed technologies have changed agricultural by products to be a valuable feeds for cattle. Through an approach of LEISA (low external input sustainable agriculture), for every hectare of paddy or corn field has yield feed for 2-3 adult cattle. The role of the cattle in the systems to be a compost machine with agricultural by products as feed resources and its use for organic fertilizer. Feeding System and Improvement Currently, the serious problem in livestock production in Java is limited land area for forage production. Increasing ruminant population in Java will be possible by introducing the integrated cultivation of local and introduced grass and legume cultivars in various non-pasture lands and plantations [8]. Ruminants livestock production in the study area is mainly conducted in traditional system with small numbers of animals (ranged 2-8 head). In these systems, farmers generally feed livestock with fresh forage. Under lowland with the rice base, farmer provide rice straw in fresh and also practice ammoniation technology. Native grasses and leguminous tree leaves mostly found in the upland are especially at forest margin. The animals are also fed a small amount of locally available supplements, such as rice barn, tofu ware, and cassava waste. The preference of many farmers for native grass as ruminants feeds can be justified by the generally high nutritive value of these grasses [9]. During the dry season, when fresh forage is scarce, farmers utilize peanut straw, banana leaves and trunk or coconut leaves as alternative feeds. Leguminous tree leaves, rice barn and palm pith are the most common fed supplements for ruminants in the traditional system. The present study revealed that types of feeds offered to beef cattle could be classified into four major groups: legume, grasses other shrubs trees, concentrate, agricultural by-product (Tabel 2). A number of local resources and by-products of agriculture and agro industry was make the most of feeding practice [10] andfound the estimated proportion of grasses in diets ranged from 42% to 93% while crop residues and three legumes were 2% to 30% and 1% to 14% respectively [9]. Table 2. Some common fodder species fed to beef cattle Legumes Gliricidia, Calliandra, Leucaena, Sesbania, Acacia, Albizia Grasses other shrubs Elephant grass, Guinea grass, King grass, Mixed grass, trees Sugar cane, Setaria, Cassava, Sweet potato, Blandy grass, Jackfruit Concentrtaes Kapok, Coconut meal, Soyabean, Cassava rubber, Rice bran, Cor meal, Maize bran Agricultural by-products Soyabean leaf, Sweet potato leaf, Cassava leaf, Cassava peelings, Banana leaves, Rice straw, Sugar cane top, Maize stover Most of the farmer in middle and upland areas, grass is still considered the best feed for cattle. In the low land with rice base, rice straw in fresh considered the best feed for cattle. At the dry season, when native grasses are scarce, some group of farmer from dry areas prefer to collectively hire a truck and travel long distance to obtain native grasses and rice straw from wet or irrigated areas. A native grass has high nutritive values and that native grass-fed village cattle are generally in very good condition justifies farmers preferring native grass to other feeds [9]. For grazing livestock, however, caution must be exercised during the dry season because the contents of crude protein and some essential minerals declines to bellow maintenance requirement [11]. As a results, cattle lose up to 25% of body weight during dry season. Strategic supplementation must be undertaken to improve cattle productivity. Due to most crop residues condition in poor nutritive values and digestibility, feed technology such as ammoniation and the use of feed supplements have been practiced by all of the group farmer of beef cattle development program. Result of this study show that rice bran was practiced as a supplement fed to cattle by all of the group farmer of beef cattle development program. In the area of the tofu industry, farmer used tofu waste as a supplement feed. Especially in fattening program, farmers use some proprietary concentrate supplements because they realize the advantage of these to improve live weight gain. However, these supplements are considered very expensive and farmers prefer to make their own from a mixture of 157
174 2 nd TOPIC Sustainable Rural Development-Towards A Better World Purwokerto, August 25-26, 2013 rice bran, maize bra, tofu waste, cassava waste, and molasses. Few farmers used urea molasses multi-nutrient block and vitamin supplements. Beef Catle Productivity It was difficult to quantify growth rate of the calves and fattening cattle in the villages because of a general lack of records and limited infrastructure (such as balance for measuring animal weight) kept by the farmers. However, most of the farmers interviewed, and discussions with the key persons, indicated that growth rates of Peranakan Ongole, Sumba Ongole, and Simental Cross for fattening purposes were moderate till high, and low reproductive for Brahman Cross. BCS is an important management practice used by producers as a tool to help optimize production, evaluate health, and assess nutritional status. This practice helps evaluate their herd or flock as to the amount of body reserves, particularly fat and muscle, an animal possesses [12]. BCS is a subjective measurement used to classify animals by the amount of muscle and fat in their bodies. BCS of beef cattle can be an effective management tool for evaluating the energy reserves of cows and the whole nutritional program throughout the year. Adjusting the nutritional program to obtain desired body condition at different stages of production is necessary to enhance production efficiency. Females that are too thin or too fat can be an expensive investment. Thin cows can have difficulty rebreeding, while fat cows are prone to calving problems and excessive feed costs. BCS allow producers, extension personnel, and researchers to communicate more effectively regarding the herd s nutritional status [13]. In overall, low productivity of daily gain of beef catle in this study (0,63 kg/day, and calving interval 20.6 months). Body Condition Score from the farm visit evaluation were 3-8 at the Ongole Cross, Sumba Ongole Cross, Simentral Cross (Table 3) for fattening purposes. BCS for breeding of Local breed ranged 3-7 (Table 4) better than Brahman Cross ranged 3-5 (Table 5). BCS 4 is borderline condition, and the optimum BCS ranged from 5-7 [14]. These findings on Brahman Cross tend to low in BSC. This low performance could be attributed to the poor nutrition and the sub optimal management practices observed in most visits. If this situation is improved, productivity could also be improved. It was observed that small amounts of concentrate and rice straw fermentation were introduced and accepted by the beef cattle. Table 3. BCS of Beef Cattle for Fattening Purposes BCS Number of respondent Percentage (%) Table 4. BCS of Local Beef Cattle for Breeding Purposes BCS Number of respondent Percentage (%) Table 5. BCS of Brahman Cross for Breeding Purposes BCS Number of respondent Percentage (%)
175 2 nd TOPIC Beef cattle farmers were aware of the importance of feeding concentrate and they were mixing local resources (crop and agro industry waste) such as rice bran, tofu waste and common salt in various proportions. In some location, rice bran and tofu waste was fed alone as the concentrate. The proportions of the ingredients and the quantities offered seemed to be a matter of availability and resource allocation rather than a need to supply quality feed to the animal. This research finding that mostly calving interval ranged months (Table 6). One of the main goals of beef cattle production system is to optimize annual fertility rate. To achieve this, the majority of the cows suckling calves should conceive before 90 days postpartum [15]. The results of previous study [16] revealed that breeding program of Brahman Cross under village production system was unsuccessful in terms of low reproductive rate for the second pregnancy and calving as well as a high rate of calf and dam mortality. The rate of the second calving was 2.89%. Table 6. Calving Interval for Breeding Purposes Calving Interval Number of Percentage (%) (months) respondent < > Numerous research studies have indicated that under-nutrition due to limited feed availability or poorquality feed sources during late gestation (prepartum) and/or early lactation (postpartum) has detrimental effects on subsequent reproductive efficiency [17]. Reproductive performance is closely linked to the amount of available energy reserves a cow has which is reflected by her amount of body fat. Body condition score at calving for a two-year old, first-calf heifer is BCS 6 (scale 1-9) was recomended [13]. First-calf heifers are more likely than mature cows to fail to rebreed. Additional body condition provides some insurance against reproductive failure. However, excessive fleshing beyond BCS 6 prior to calving in first-calf heifers may result in increased incidence of dystocia (calving difficulty). For optimal reproductive performance, mature cows should be a BCS of 5 to 5.5 and first calf heifers should have a BCS of 5.5 to 6 at calving and through the breeding season. Thin cows (BCS 3 and 4) have reduced pregnancy rates, increased calving intervals, wean a younger/lighter calf, and provide considerably less yearly income compared to cows that are in good condition (BCS 5 and 6) at calving [17]. Ovarian activity during the early postpartum period showed that the reestablishment of reproductive activity coincides with the recovery of body condition of cows. Results indicated that only cows comprising a BCS 3 (1 to 5 scale) around the first month postpartum can be used in an artificial insemination program with possibilities of becoming pregnant [15]. Feeding strategy to improve reproductive efficiency in cows have been studied [18]. Long calving interval is one of the major factors in reproductive wastage in Indonesia. This is mainly due to a delay of the first post-partum estrous (PPE). Low energy body reserved reduces both milk production and delays first estrous after parturition. Body condition score (BCS) is closed related to status of the energy body reserves that are affected by feeds consumed prior to both pregnancy period and parturition. Interaction between dietary nutrients and body energy reserves which is reflected in body weight (BW) and BCS, affects the first PPE. Feed supplementation at pre and post-partum is necessary to meet minimal requirement for particular live body weight with appropriate BCS. It is expected that there should be a conception within maximum 90 days after parturition. It means one cow will produce one calf annually. Currently, national calving rate is reported around 22% only. It is concluded that post-partum estrous is influenced by correct strategy of feeding supplementation. Livestock Production System Improvement Program Livestock Production System could be distinguished two main groups: those solely based on animal production and those where cropping and livestock rearing are associated [19]. Accelerating the contribution from animal production systems in Asia stems from the inability of the component industries to supply the projected human demand for animal products. The implications are the need for improved systems and also increased efficiency in Natural Resources Management [5]. 159
176 2 nd TOPIC Sustainable Rural Development-Towards A Better World Purwokerto, August 25-26, 2013 Implementation of improved system at the extension services program by introducing proven applied technology in term of breeding, feeding, housing, health and daily practice management aspects as well as empowering individual farmer potential and farmer group dynamic. The extension services program are conducted to transfer knowledge, technology and skills to rural farmers so that ultimately farmers will improve their productivity and efficiency, hence increasing their income through farming and improving their standard of living. Faculty of Animal Science Jenderal Soedirman University have design the improving livestock production system program. Most of staff members of faculty are involved and committed to support the goal of extension services. Individual farmers and farmer groups are invite to consult with the faculty, and also joint at some activities such as (i) Seminars and workshops, (ii) General stadium, (iii) exhibitions, demonstrations, forum and expo, (iv) field days and university open days. Centre of Research and Teaching Farm of faculty also providing for farmer such as study, demonstration and internship. In order to accelerate the improved livestock system and agribusiness process, faculty joint collaboration with other institution and partner, namely (i) Alumnus of university, (ii) Local Government, (iii) Directorate Livestock Services Ministry of Agriculture, (iv) Livestock and Farmer Association, and (v) Bank. CONCLUSIONS Beef cattle production under farmer group in rural areas is mainly conducted in traditional system with small numbers in flock (ranged 2-8 head) and low in productivity (daily gain 0.6 kg/day, calving interval 20.6 months). The appropriate use of local feed resources and local livestock breeds requires close integration between crops and livestock within the system. Types of feeds offered to beef cattle could be classified into four major groups: legume, grasses other shrubs trees, concentrate, agricultural byproduct. Most of the farmer provide rice straw in fresh and also practice ammoniation. Findings of this study should be accounted in strengthen feeding and management, especially in maintaining the body weight during mating and pregnancy periods in order to improve their productivity. Introducing proven applied technology in term of breeding, feeding, housing, health and daily practice management aspects as well as empowering farmer and group dynamic is needed for increasing the sustainability of beef cattle production in rural areas. ACKNOWLEDGMENTS The author would like to thank the farmer group of beef cattle in term of fattening and breeding program for their good cooperation during collection data REFERENCES [1] Ditjennak, Statistik Peternakan Direktorat Jenderal Peternakan, Departemen Pertanian, Jakarta, [2] ] Ditjennak, Blue Print Program Swasembada Daging Sapi Tahun Direktorat Jenderal Peternakan, Departemen Pertanian, Jakarta. [3] Y. Yusdja, R. Sajuti, S.H. Suhartini, I. Sadikin, B. Winarso, dan C. Muslim, Pemantapan Program dan Strategi Kebijakan Peningkatan Produksi Daging Sapi. Laporan Akhir. Puslitbang Sosial Ekonomi Pertanian, Bogor. 10 hal., [4] D.E. Wahyono, and R. Hardianto, Utilization of Local Feed Resources to Develop Beef Cattle". Lokakarya Nasional Sapi Potong, 2004 [5] C. Devendra (2007). Perspectives on animal production systems in Asia. Livestock Science, 106 (2007): 1-18 [6] J.W. Oltjenand, J.L. Beckett (1996). Role of ruminant livestock in sustainable agricultural systems. Journal of Animal Science, 74:
177 2 nd TOPIC [7] A. Priyanti, and A. Djajanegara, Development of Cattle Beef Production Towards Integrated Farming Systems. Lokakarya Nasional Sapi Potong Ciawi, Bogor, [8] L. Abdullah (2006). The development of integrated forage production system for ruminants in rainy tropical regions: the case of research and extension activity in Java, Indonesia. Bulletin Faculty of Agriculture. Niigata University, 58(2): [9] D.V. Dahlanudin, Tien, J.B. Liang and D.B. Adams (2003). An exploration of risk factors for bovine spongiform encephalopathy in ruminant production system in the tropics. Rev. Sci. Tech. Off. Int. Epiz. 22(1): [10] A. Sodiq, Munadi, and S.W. Purbojo, (2010). Livestock production system of beef cattle based on local resources at the program of Sarjana Membangun Desa. Journal of Rural Development, 10(2): [11] A. Bamualim, Nutritive value of native grasses in Nusa Tenggara, Indonesia. Proceedings Australian Society of Animal Production, 21: , [12] ] M. Neary, Body Condition Scoring in Farm Animals. Extension Animal Scientist, Department of Animal Sciences Purdue University, 2000 [13] A.M. Encinias, and G. Lardy, Body Condition Scoring I: Managing Your Cow Herd Through Body Condition Scoring. NDSU Extension Service, North Dakota State University of Agriculture and Applied Science, and U.S. Department of Agriculture, [14] J.B. Glaze, Body Condition Scoring (BCS) in Beef Cattle. Animal & Veterinary Science Department University of Idaho, [15] J.C.F. Moraes, C.M. Jaume and C.J.H. Souza (2007). Body condition score to predict the postpartum fertility of crossbred beef cows. Pesq. agropec. bras., Brasília, 42(5): [16] P. Yuwono, and A. Sodiq (2010). Brahman Cross development in village breeding centre of the Sarjana Membangun Desa: Pitfall and a lesson learned. Journal of Animal Production, 12(3): [17] A. Bridges, and R. Lemenager, Impact of Body Condition at Calving on Reproductive Productivity in Beef Cattle. Extension Specialist, Reproduction and Beef, Dept. Anim. Sci., Purdue University, 2000 [18] M. Winugroho (2002). Strategi pemberian pakan tambahan untuk memperbaiki efisiensi reproduksi induk sapi. Jurnal Litbang Pertanian, 21(1): [19] C. Seré and S Steinfeld, World livestock production systems: current status, issues and trends. FAO Animal Production and Health Paper 127. Food and Agriculture Organization, Rome,
178 2 nd TOPIC Sustainable Rural Development-Towards A Better World Purwokerto, August 25-26,
179 2 nd TOPIC BIOTIC INVESTIGATION ON ACACIA SPECIES IN KORDOFAN REGION SUDAN AGAINST CLIMATE CHANGE Maymoona A. Eisa, Zeinab M. Hammad, and Osman E. A. Abdelkareem University of Kordofan, Department of Crop protection, Faculty of Natural resources & Environmental Studies, Sudan maymoonaeisa@yahoo.com ABSTRACT Climate change posses serious challenges to Sudan s overriding development priorities in agriculture, forestry, water resource management, and health. The Acacia senegal tree, which produces gum Arabic provides an important source of cash income to the farmer population in the Northern Kordofan State in Sudan. Acacia seyal var. seyal (talh) is a gum-yielding tree found in the savannah belt of the Sudan. Thus, the study aimed at the identification and characterization of a pest insect group of worldwide importance: the longhorned beetles, among factors interfere with the health of Acacia trees; focuses on the assessment of tree characteristics that may trigger the infestation. overall aimed is managing of deteriorating biotic factors that stand against tolerating drought by Acacia species in a way to stand against climate change. This study was conducted in Kordofan region in seven study sites three for Acacia senegal (gum Arabic producing tree), namely El Himaira, El Demokeya and Acacia Agricultural project study sites and two study sites for each of Acacia mellifera and Acacia seyal. Research was held in the season. Temporary sample plots technique was conducted in all of study sites in this study to investigate on Acacia tree species. Logistic regression was used to analyses the data. Tree age was verified by the logistic regressions as a predictor variable by 89.2% for A. mellifera, 91.7% for A. seyal, and 91.1% for A. senegal. The study recommended to consider tree age as factor enhances biotic activity on management to sustain Acacia trees. Keywords: Natural Science, Long-horned Beetles, Kordofan region, Logistic regression, Climate change INTRODUCTION The area of Sudan land cover was estimated [1]. The semi-arid zone of the Sudan extends between latitudes 14 and 17 N and the low rain fall woodland savannah extends between latitudes 10 and 14 N and these two zones are the most densely populated zones and the most vulnerable to deforestation impacts, causing forest cover decline. Over cultivation, over grazing and extensive clearance of forests increase the vulnerability of the ecosystem to desertification processes causing serious threats to the woodlands, gum Arabic gardens and rangeland [2]. The implications of climate change on forest estate is an issue of immediate concern for Sudan because forests are sensitive to climate change and changes in forests may have significant socio-economic impacts (positive or negative) on Sudanese society. This fact can be implies for Acacia gum producing trees as gum Arabic is the major and most important non-wood forest product in the country, it is one of the main products of rainfed agricultural sector in Sudan, and moreover gum Arabic agriculture plays an important role as a cash crop produced in the traditional rain-fed areas of North Kordofan in western Sudan [3]. The Acacia trees, which yield the gum arabic as stated by, [4] occur in a wide belt of semi-arid land across sub-saharan Africa known as the gum arabic belt. It was reported that pest attacks and drought were major causal agents in the decline of gum production as claimed by [5]. A serious drawback to the high socioeconomic relevance of Acacia species are regular infestations with insect pests. Among the most important pests are longhorned beetles [Coleoeptera: Cerambycidae]. Due to a lack of sound information with respect to the ecological requirements of the pest species and the environmental factors, triggering pest outbreaks, effective management strategies have not yet been 163
180 2 nd TOPIC Sustainable Rural Development-Towards A Better World Purwokerto, August 25-26, 2013 developed. Thus, the purpose of the study was to collect data on species spectrum and phenology of longhorned beetles, infesting Acacia trees. METHODOLOGY This study was conducted in North and South Kordofan States in the seasons. North Kordofan State is located in central Sudan in the dry semi-arid region between latitudes 11, 15-16, 45 N and between longitudes 27, 5-32, 15 E. The capital city of the state is El Obeid, the biggest gum Arabic market in the world. South Kordofan State is located between latitudes 9 to 13 N and longitudes 27 to 32 E. Seven study sites representing different Acacia species were selected. Three sites were selected for A. senegal, while two sites were determined for each of A.seyal and A.mellifera.Temporary sample plots technique [6] was conducted to investigate the effects of longhorned beetles on Acacia tree species. A number of five circular sample plots (SPs) [each with a radius of 17.8 m and 0.1 ha in size] were taken. The SPs were located at a distance of 1 km. In each SP, observation, measurement and counting were conducted. During the field survey, variables that may trigger long-horned beetle infestations were measured tree height, stem diameter (dbh), tree crown size, tree age, crown diameter and stem surface temperature. Assessment of observed hit rates [7] was applied [8]. Measuring tree characteristics Tree height from soil surface to tree tip, using a Hypsometer instrument; Stem diameter, using a metal calliper; Tree crown size, using a measuring tape; Tree age was identified by a well-trained and experienced forester who was a member of the survey crew; Stem surface temperature at dbh during day time using an infrared thermometer. RESULTS Using SPSS v. 15, a logistic regression was drawn for A. mellifera trees incorporating all independent variables recorded (tree age, DBH, crown size, crown diameter, tree height and tree temperature) (Tab. 4.11, 4.12 [8]. From this regression, it was observed that tree age was the single variable (response variable) that significantly affected the probability of infestation, with tree age acting as predictor variable by 89.2 % (Table 1, Figure 1). All other independent variables were excluded in the model classification table. The obtained regression coefficient, (B 1 ) was positively correlated with the risk variable (tree age), indicating that as tree age increases the probability of the outcome, in this case infestation. Similar findings were found for DBH. The estimated probability of the infestation is shown in Figure 1. Table 1. Classification Table for A. mellifera logistic regression Observed Predicted IF Step 1 IF Overall Percentage 89.2 a The cut value is.500 Variables in the Equation Percentage Correct 164
181 Prdiction/Observations 2 nd TOPIC Step 1(a) B S.E. Wald df Sig. Exp(B) Tree age Constant a: Variable(s) entered on step 1: Tree age. The classified tree age for A. mellifera showed no significance (P > 0.387) for the observed hit rates. Consequently, the model has no influence on the results as shown in the classification. Table 2. Observed hit rates (Tree age classified)-a.mellifera Predicted Observed g =1, n gg =1, n g =8 N=84 Formula (1) =0.761 Formula (2) =0.286 Significance, at p > (0.387) When the logistic regression was applied for A. seyal, using the independent variables recorded (tree age, dbh, crown size, crown diameter, tree height and tree temperature Table 15 [8], only a single variable (response variable) significantly affected the probability of infestation; tree age represented the predictor variable at 91.7 % (Table 3, Figure 2). All other independent variables were excluded from the model classification table. Observations Predictions Model 0.50 Line Tree age Figure 1. Prediction of infestation of long-horned beetles for A. mellifera using tree age Table 3. Classification table for A. seyal logistic regression Observed Predicted IF Percentage Correct Step 1 IF Overall Percentage 91.7 a The cut value is.500 Variables in the Equation 165
182 Prediction/Observations 2 nd TOPIC Sustainable Rural Development-Towards A Better World Purwokerto, August 25-26, 2013 Step 1(a) B S.E. Wald df Sig. Exp(B) Tage Constant a: Variable(s) entered on step 1: Tree age. Observations Predictions Model 0.50 Line Tree age Figure 2. Prediction of infestation of long-horned beetles for A. seyal using tree age Table 4. Observed hit rates (Tree age classified)-a.seyal Predicted Observed g=1, n gg =0, n g =17 N=206 Formula (1) = Formula (2) Z= Significance, at p > The observed hit rate assessment yielded no significance, indicating that the model has no influence on the results obtained. The same can be judged from the model curve (below the 0.5 line) where it was obvious that the infestation was not predicted inspite of the high classification percentage. When the logistic regression was applied for A. senegal using the independent variables recorded (tree age, DBH, crown size, crown diameter, tree height and tree temperature, Tab.4.18 [8], only a single variable (response variable) had a significant effect on the probability of infestation with tree age as predictor variable by 91.1% (Tab. 3.5, Fig. 3.3). All other independent variables were excluded from the model classification table. Table 5. Classification table for logistic regression results for A. senegal Observed Predicted IF Percentage Correct Step 1 IF Overall Percentage 91.1 a The cut value is.500
183 Prediction/Observations 2 nd TOPIC Variables in the Equation B S.E. Wald df Sig. Exp(B) Step 1(a) Tage Constant a Variable(s) entered on step 1: Tage Observations Predictions Model 0.50 Line Tree age Figure 3. Prediction of infestation of long-horned beetles on A. senegal using tree age Table 6. Observed hit rates (Tree age classified)-a.senegal Predicted Observed g=1, n gg =13, n g =25 N=203 Formula (1) = Formula (2) Z= Significance, at P < (0.001) The classified tree age for A. senegal, showed significance (P > 0.001) for the observed hit rate, indicating a correct model classification. DISCUSSION Many studies mention the primary correlation between tree age and tree infestation. For example, [9] report that three Monochamus species attack older trees such as pines, spruces or firs in Southern and Eastern Europe. [10] indicate that Strongylurus decoratus (McKeown) (Cerambycidae) affect trees that range in age from 4 years to more than 30 years and in height from 3 to 31 m. [11] mentions that different sites vary in plant species composition, density, and age classes. Site conditions combined with weather determine the rate of growth and the general vigour of the host trees. Moreover, he states that site condition is an important consideration for sites that contain the host material (tree species in various stages of growth) that pest species utilize for food and habitat. The availability of suitable preferred and alternate hosts is a primary requisite for development of insect populations. Therefore, the opportunity for insect populations to grow in size varies within different sites. In the same context, [12] mentioned that certain factors, including site quality, species composition, stand density, tree age and size, disease incidence, and other insect activity, affect tree growth and development. 167
184 2 nd TOPIC Sustainable Rural Development-Towards A Better World Purwokerto, August 25-26, 2013 REFERENCES [1] FAO. The land cover Atlas of Sudan, [2] Elsiddig, E. A.: Jebel Marra the potentials for Resources and Rural Development in Darfur, Khartoun, Sudan, 2007 [3] El-Dukheri, I. A. Past changes and future prospects of traditional rainfed farming in North Kordofan, Sudan. Ph.D. Thesis, University of Munchen, Germany, Pp 238. [4] Vogt, K. A Fieldworker`s Guide to the Identification, Propagation and uses of Common Trees and Shrubs of Dryland Sudan, Pp 334. SOS Sahel International (UK). [5] Jamal, A., and Huntsinger, L. Deterioration of a sustainable agro-silvo-pastoral system in the Sudan: the gum gardens of Kordofan. Agroforestry Systems Volume 23, Issue 1, July Kluwer Academic Publishers Pages [6] El Tayeb, A. M., Abdelkareem, O. E. A., and Gadow, K. V. Quantitative Methods in Forest Management. Universitätdruke Göttingen, ISBN- 10: , P. 98 (in Arabic). [7] Huberty, C. J. Issues in the Use and Interpretation of Discriminant Analysis. Physiological Bulletin, Vol. 95, No. 1, American Psychological association, Inc. [8] Eisa, M. A. An Ecological Study of the Effect of the Long-homed Beetle Species (Coleoptera: Cerambycidae) on the Acacia Species in the Gum Arabic Belt of the Kordofan Region. Ph.D Thesis 2011 (Abook). [9] Evans, H. F., Moraal, L. G. and Pajares, J. A. Biology, ecology and economic importance of Buprestidae and Cerambycidae. In: Lieutier, F., Day, K. R., Battisti, A., Gregoire, J. C. and Evans, H. F Bark and Wood Boring Insects in Living Trees in Europe, a Synthesis Pp 569. Springer. Netherlands. ISBN (HB) ISBN (e-book). [10] Speight, M. R. and Wylie, F. R. Insect Pests in Tropical Forestry, Pp 307. Oxon: CABI Publishing. [11] Wainhouse, D. Ecological Methods in Forest Pest Management, Pp 248. Oxford University Press. [12] Schowalter, T. D. and Filip, G. M. Beetle-Pathogen Interactions in Conifer Forests, Pp 252. Academic Press, London. Science, Oxford, UK. 168
185 2 nd TOPIC PHYSICAL AND CHEMICAL CRACTERISTICS OF MODIFIED CORN STARCH Nur Aini 1, V. Prihananto 1, and Gunawan Wijonarko 1 1) Departmen of Agriculture Technology, Jenderal Soedirman University, Indonesia nuraini_munawar@yahoo.com ABSTRACT Physical and chemical properties of starch can be modified by structural alteration. This structural alteration may caused by chemical modification. Structural alteration affects the physical and chemical properties of starchs. This sctructural alteration can be caused by chemical modification. In this study, acetylation and oxidation methods used to modify physical characteristic and chemical properties of starch. This research aims to: 1) investigate physical and chemical characteristics of three varieties of white-corn-starches (Srikandi, Lokal Canggal and Pulut); 2) conduct single chemical modification treatment (oxidation) and a double chemical modification treatment (oxidized acetylation); and 3) evaluate the physical and chemical properties of modified white corn starch. Physical and chemical properties of modified starches are compared to native starch. The result shows that three varieties of white-corn-starch have different amylose content. The highest amylose content found in Srikandi = 22, 53%. It is also found that modified starches have more whiteness level, water absorption capacity and gel strength compared to the native starch. Furthermore, diameter of modified starches granules (range from: 10 to 20 µm) are smaller than diameter of native starch granules. Finally a double chemical modification treatment (oxidized followed by acetylating) to Srikandi variety produce starch having highest whiteness level, water absorption capacity and gel strength. Keywords: white-corn-starch, properties, oxidation, oxidized acetylation INTRODUCTION Chemical modification may lead structural changes caused a new formation of starch functional groups. This change will affect physical and chemical properties of starch. Acetylation and oxidation are examples of methods used to modify starch by means of chemical treatment. Oxidation affects depolymerisation and formation of carboxyl and carbonyl functional groups. Acetylation produces esterification on the hydroxyl functional group of starch and stabilizes the sol (Adebowale and Olayide, 2003). Amylose-amylopectin ratio affected the properties of modified starch (Jobling, 2004). Wang and Wang (2002) suggested that oxidation of the non-waxy corn starch produce high carboxyl content, but it had same carbonyl content when compared with waxy corn starch. Both amylose and amylopectin were oxidized and degraded during oxidation; however amylose was more sensitive to oxidation. The purpose of this research were performing a single (oxidation) and a double (oxidized acetylation) chemical modification on three varieties of white corn (Lokal Canggal, Srikandi, Pulut) and studying the physical and chemical properties of starch. METHODOLOGY Three varieties of white corn are used in this study, namely Pulut (Waxy corn) from Gorontalo (Sulawesi Indonesia), Lokal Canggal and Srikandi (non-waxy corn) from Temanggung (Central Java Indonesia). Corn starch isolation was performed using Yang method (Yang et al., 2005). Oxidation was carried out by adopting Parovouri method (Parovouri et al., 1995). Oxidized acetylation method was carried out by combining Chen method (Chen, 2003) and Parovouri method (Parovouri et al., 1995). 169
186 2 nd TOPIC Sustainable Rural Development-Towards A Better World Purwokerto, August 25-26, 2013 Performed analysis were including: amylose content (Aliawati 2003), water content (AOAC), ash content (AOAC), protein content (AOAC), fat content (AOAC), granules size, degree of whiteness using whiteness meter and water absorption capacity. Acetyl content of modified starch was determined by titrimetry. The degree of substitution (DS) of acylated starches were defined by the average rate of acetyl groups per anhydrous glucose unit in starch molecules (Parovouri et al., 1995). ml blanko ml sample x NHCl x x100 Content of acetyl (%) = weight of starch ( drybasis) Degree of subtitution = 162 x % ofacetyl x % ofacetyl (1) (2) The carboxyl content of modified starch was determined by the ISI 10 2e method (International Starch Institute 2002). sample blanko ml x Malkali x x100 Content of carboxyl (%) = weight of sampel g (3) Data Analysis Completely Randomized Design (CRD) was used in this study to determine the effect of treatment on observed variables. There are two factors: (1) white corn varieties and (2) chemical modification method. The first factor consist of three varieties namely: (a) Lokal Canggal, (b) Srikandi and (c) Pulut. The second factor consist of three methods: (a) single method of oxidation, (b) double method of oxidized acetylation and (c) without modification. Each treatment was replicated three times. Therefore there were: 3 x 3 x 3 = 27 experimental units of white corn starches. 170 RESULT AND DISCUSSION Acetyl Content and Degree of Substitution Oxidation and oxidized acetylation method have no significant effect to acetyl content and degree of substitution, but corn starch containt higher amylose tend to have lower DS range. Table 1 show that starch modification using oxidized acetylation method produce various acetyl levels from (2:35%) to (2:46%) and produce low level of DS starch, ranging from to Generally, DS starch was rated to 0:09 meaning there were 9 acetyl groups per 100 unit s glucose anhydrous on starch molecules. Table 1. Acetyl content and degree of substitution of acetylated oxide starch Sample Acetyl content (%) degree of substitution Acetylated Srikandi Acetylated Local Acetylated Pulut 2.35 a 2.40 ab 2.46 b a ab b Note: the numbers that followed by the same letter in a column was not significantly different at level 5% Oxidized acetylation starch has lower degree of substitution. This caused by oxidation treatment that conducted frist prior to acetylation. During the reaction, oxidation replacing the hydroxyl groups by carboxyl groups in every glucose anhydrous unit on starch molecules. According to Lawal (2004) oxidation treatment causing depolymerisation and fragility of the starch granules whereas acetylation treatment causing decreases in the intermolecular association in starch granules. The differences in amylose content affect acetyl content (%) and degree of substitution (DS). The starch from Srikandi variety containt higher amylose content than the two other varieties. Srikandi starch tend to have lower acetyl content and degree of substitution. This result is parallel to Singh et al. (2004). They condluded that the low amylose content in potato starch gives a better value for DS.
187 % of amylose 2 nd TOPIC The small granules size population and low amylose content are the best combination to bind acetyl groups having highest acetyl content and DS. According to Sandhu and Singh (2007), the differences of acetyl content of white corn starch at the same acetylation conditions is probably caused by differences of granules size and ease of rupture. According to Chen et al. (2004), due to the good accessibility of reagents, acetylation occurs in the amorphous regions and the only place on lamella, outside of the crystalline regions in starch granules. Kuakpetoon and Wang (2008) suggested that crystalline regions and regions containt higher hydrogen bonds are reacted slowly because of the low mobility of the reagents to reach the area. Regularity of polymer chain in starch granules reduce the accessibility and reactivity of amylopectin. Reactivity is higher for amylose than amylopectin. This because of amylose is contained in the amorphous regions, while amylopectin is a constituent of crystalline regions (Chen et al, 2004). According to Shogren (2005), due to the amount of glucose in amylopectin is nombreuses, most of the acetyl group on the acylated starch lies in amylopectin. Most of the acetyl groups on the amylopectin lie in the amorphous regions which are rich in α-1, 6 bond where is relatively vulnerable to acids and reagents used in modification. The exact location of the acetyl groups on the molecular structure of amylase was unclear, but according to Chi et al (2008), molecules in the amorphous regions mainly amylose was reacted first and the crystalline was attacked in a much slower rate. A physical and chemical characteristic of starch was change after modification. Changes were largely depending on the substitution that has occurred. Acetylated starch with a degree of substitution (DS) between: 0.01 to 0.2 is allowed by the FDA used as a thickener, stabilizer and texture forming. While the moderate and high starch esterification (DS = 0.5 to 3.0) is used for engineering purposes with its mechanical characteristics (Sandhu and Singh 2007). Amylose content Amylose content of three white corn varieties ranged from 8,59 to 22,53%. Srikandi containing the highest amylose (22,53%) compared to Lokal Canggal (18,8%) and Pulut (8,59%). According Aliawati (2003), based on its amylose content, starch is classified into four groups, i.e: very low amylose (<10%), low amylose (10-20%), moderate amylose (20-24%) and high amylose (> 25%). Srikandi was classified as a moderate amylose white corn, while Lokal was classified as a low amylose white corn, whereas Pulut was classified as a very low amylose white corn. Varieties of white corns, modification methods and interactions between them are affecting the whitecorn-starch amylose content. Differences of white corn starch amylose content due to the influence of varieties may be caused by lipid content in the granules. Fat that acts as amylose complex will form insoluble deposits and the existence of these fats suspect to inhibit amylose exclusion from granules, this will reduce the amount of amylose which exits from the starch granules, as stated by Kuakpetoon and Wang (2008) Native Oxydation acetylated-oxydation Pulut Lokal Canggal Srikandi starch Figure 1. Amylose content of various white corn starch 171
188 2 nd TOPIC Sustainable Rural Development-Towards A Better World Purwokerto, August 25-26, 2013 Modification methods affect amylose content of corn starch. Although it is less reactive than amylose, a reaction may appear in amylopectin when starches occur in process of modification. This reaction probably cut amylopectin chain branch and therefore produces linear chain, which detected as amylose. According to Wang and Wang (2002), compared to amylopectin in potato starch, amylopectin in corn starch will depolymerised quickly at the beginning of oxidation which catalyzed by hydrogen peroxide, while amylose will more easily degraded into small fragments, using bromine oxidant. According to Shogren (2004), due to the abundant amount of glucose in amylopectin, most of the acetyl group on the acylated starch lies in amylopectin. Most of the acetyl groups on the amylopectin lie in the amorphous regions which rich on α-1, 6 bond where are relatively vulnerable to acids and reagents used in modification. Water content The water content of native and modified dried starch ranged from 9.13% to 9.75% (dry weight). There was a noticeable difference between corn varieties and modification methods factors on water content, but there was no interaction of both factors. Srikandi has higher water content than two others varieties (Table 2). The difference in water content may caused by water content variation of raw material input. The differences in physical properties of starch, particularly its water holding capacity, will affect the water content of starch. In addition it is also due to differences in amylose content as justified by Lawal (2004), who stated that higher amylose content cause the material to absorb more water. Table 2. Effect of white corn varieties and modification methods on the water content of starch White Corn Starch Modification Method Variety Water content Method Water content Lokal Pulut Srikandi 9.13 a 9.14 a 9.75 b Oxidized acetilation Oxidation Native 9.14 a 9.29 a 9.58 b The water content of modified starch was lower than the native starch (Table 2). This is caused by starch granules damage which occurs during modification process, especially in the amorphous regions. Therefore water will evaporate more rapidly during the drying process and consequently the water content of modified starch will be lower. Oxide acetylated starch have lower water content than oxidized starch. It is possible because the damage occurs in the amorphous regions propagate more porous starch. However, the destruction of the amorphous region is not uniform, therefore there is a possibility of increasing water content of modified starch. The tight structure starch will have higher water holding capacity than the tenuous starch structure where water will be more volatile (Tester et al., 2004). Ash content Ash or mineral is not easily evaporated on the combustion of organic compounds or natural materials. The ash content in food is determined by weighing the residual minerals as a result of organic material burning. The ash content of corn starch is not significantly different. Although, the differences in varieties of maize starch and modified methods are significantly aaproved, however there is no significant difference on the interaction of both factors. The ash content of white corn starch ranged 0.57% to 0.85% (dry weight). Srikandi and Lokal starch tend to have similar ash content. However, theirs ash content is still lower than Pulut starch (Table 3). The difference is due to the difference of raw materials of mineral content. Ash contained in white corn starch is derived from the soil attached to the whole corn kernels and the compounds that used for the extraction of starch such: as Na, Cl and sulfur. In addition, those white corn varieties come from different regions, consequently it is possible to have different in : soil condition, processing method and fertilizer that may affect the ash content of produced white corn starch. 172
189 2 nd TOPIC Table 3. Effect of white corn varieties and modification methods on the ash content of starch White Corn Varieties Modification method Variety Ash Content Method Ash Content Srikandi Lokal Pulut 0.62 a 0.65 a 0.83 b Oxidized acetilation Oxidation Native 0.57 a 0.67 b 0.85 c The addition of chemical compounds during modification process both oxidation and oxidized acetylation can increase the amount of minerals (especially Na). However this mineral would be wasted together with chlorine ions during starch washing resulting ash content decreasing. Protein content White corn starchs protein content is ranged 1.77% to 7.31% (dry weight). Both varieties and modification methods have significant effect on protein content, but there are no interactions between them. Lokal starch has the highest protein content (4.72% db), while Srikandi and Pulut starchs have almost similar protein content (3.67 and 3.92% db) (Table 4). The differences in protein content are affected by the difference of white corn protein content. Lokal variety has higher protein content than two other varieties. Table 4. Effect of white corn varieties and modification methods on the protein content of starch Srikandi Pulut Lokal White Corn Varieties Modification method Variety Protein Content Variety Protein Content 3.67 a 3.92 a 4.72 b Oxidized acetilation Oxidation Native 2.1 a 3.86 b 6.35 c Modified starchs have lower protein content than the native starch, either by oxidation method (3.86% db) or the oxidation of acetylation of 2.1% (db). During the modification process there was a repeated washing process causing a leaching process of water-soluble part of the protein. On the other hand, during oxidation process, NaOCl will oxidize protein before attack hydroxyl groups on starch molecules, therefore the levels of detected protein will be decreased, although it was not fully described the reaction yet (Kuakpeton and Wang 2008). Fat content Fat content is not included in terms of quality of starch, but its existence will influence indirectly during starch modification process. The fat is presence in white corn starch is caused by the extraction process that cannot eliminate fat overall. Muhtaseb et al. (2004) stated that the purification process in the commercially manufacture of white corn starch cannot eliminate fatty substances and proteins. Table 5. Effect of white corn varieties and modification methods on the fat content of starch White Corn Varieties Modification method Variety Fat Content Variety Fat Content Pulut Lokal Srikandi 2.76 a 2.76 a 3.11 b Oxidized acetilation Oxidation Native 1.53 a 2.52 b 4.58 c The two factors (varieties and modification methods) have a significant effect on fat content, but there is no interaction between them. Modified starchs have lower fat content than native starch. It may occur because there were some fats which form complexes with proteins, lipoprotein, that would be leached during washing. Furthermore, some fat would be wasted as a residue. The numbers of washing process during the manufacture also influence fat content. Oxidized acetylating starch had lower fat content than oxidized starch. Repeatedly washing on oxidized acetylating starch manufacture was causing its lower fat content than oxidized starch that only washed several times. 173
.")
.")

190 2 nd TOPIC Sustainable Rural Development-Towards A Better World Purwokerto, August 25-26, 2013 Starch granules Originally, starch is made up from tiny beads called starch granules. Starch granules have different shapes and sizes depending on the type of starch (Sandhu et al. 2004). Microscopic observations of white corn starchs granules are conducted to determine the characteristics of chemically modificated starch granules compared to native starch as a control. Based on the observation using a microscope with a magnification of 200 times, it is found that granule size of modified starch is smaller than the native starch (Table 6). White corn starch granules size is ranged 10 to 20 μm. Furthermore, Pulut starch has larger average size of granules (17.78 μm) compared to other samples. Starch granule size varies between 1 to 150 μm, depending on the type of starch. Based on the granules size, corn starchs are divide in two class: small and large granules. Small granules size are ranged from 1 to 7 μm, while large granules size ranged from 15 to 20 μm, depending on the type of corn (Sandhu et al. 2004). Table 6. The size of white corn starch granules Starch Granules size rate (µm) Pulut Oxidized Pulut Oxidized acetylating Pulut Lokal Oxidized Lokal Oxidized acetylating Lokal Srikandi Oxidized Srikandi Oxidized acetylating Srikandi Modified starch granule size is smaller than the native starch. According to Lawal (2004), the oxidation will reduce the size of starch granules because the oxidation will damage the amorphous regions of starch so that starch granules become smaller. However, the oxidation process does not produce significant changes to the form of granules. Oxidized starches granules is different to native starch, because of the radial cracks that increase the degree of oxidation. These cracks appear on the granules where subject of oxidation attack. When they heated using water as media, they tended to separate along the cracks and fragmented, these will cause starch granules appear to be swelled as shown in native starch. Microscopic observation showed the different colour of starch granules subject to different sample test. In this case, the sample test is effectued using dye-methiylene-blue. Result shown that oxidized starch (in the form of hypochlorite solution) appeared more dark in blue-colour than original starch. The same result are shown in the oxidized acetylating starch. 174 (A) Native starch (B) Oxidized starch (C) Oxidized acetylating starch Figure 2. Blue methylene colorized granules starch According to Kuakpetoon and Wang (2008) the characteristic of granule that oxidized by hypochlorite is sensitivity to methylene-blue and other indicators. Colour will be absorbed selectively by the oxidized starch granules, although unmodified starch granules did not show it. Soaking using methylene blue and followed by granules washing to remove the colorized solution can be used to distinguish oxidized starch from native starch. Absorption intensity is varying in various oxidation
191 water absorbtion (%) 2 nd TOPIC reactions, it is measured as a number of anionic carboxyl group entering to the starch granules. Although it can be used to distinguish the native starch, this test was not specific for oxidized starch since anionic substituent derivatives can also absorb the color. Water Absorption Capacity In the solid state form, polysaccharides have amorphous regions, where the molecules are arranged irregularly. This amorphous regions have many weak of hydrogen bonds, consequently water will enter easily to form intra-granular bonds. In the ordinary circumstances, water that absorbed by the starch was only bound on amorphous regions. Starch water absorption capacity was ranged from 99.79% (0998 g per 100 g starch) to % (1.32 g per 100 g starch) as shown in Figure 3. Water can be absorbed by starch molecules becouse of two reasons. First, the water will be absorbed by physically. Second, the water will be bonded on intermolecular bond. Analysis of variance shows that water absorption of starch is influenced by type of varieties, modification methods and the interaction of both factors. Derived starch of Srikandi have greater water holding capacity than two others varieties. It is due to higher amylose content in starch derived from Srikandi variety than two others varieties. 120 Native Oxydation acetylated-oxydation Pulut Lokal Canggal Srikandi starch Figure 3. Water absorption capacity of white corn starch The amount of the hydrophilic side of the starch is increase after oxidation and acetylation; therefore it could improve the ability of starch to absorb water (Singh et al. 2004). Water absorption in Oxidized acetylating starch is increase more than in oxidized starch. Increasing water absorption caused by the presence of functional groups on modified starch molecules. These functional groups increase the binding capacity of modified starch more than in native starch. This phenomenon is an impact of the growth at the amorphous part of starch granules. CONCLUSIONS 1. Derived starchs from Srikandi, Pulut and Local Canggal varieties have different chemical compositions, particularly in levels of amylose. Derived starch from Srikandi variety has the highest amylose content (22.53%) that affect the physical properties of modified starch. 2. Modification methods, oxidation and oxidized acetylation, will alter the physical and chemical properties of white corn starchs. Modified starchs have higher degree of whiteness, water absorption capacity and gel strength than native starch. Granules sizes of modified starchs are ranged from 10 to 20 μm and these granules sizes are smaller than native starch. 3. Derived starch from Srikandi variety by means Oxidized acetylating has greatest water absorption capacity compared to derived starch from two others varieties. 175
192 2 nd TOPIC Sustainable Rural Development-Towards A Better World Purwokerto, August 25-26, 2013 ACKNOWLEDGMENTS Funding for this research provided by Riset Strategis Nasional (STRANAS) 2012 REFERENCES [1] Adebowale, K. dan Lawal, O. S Functional Properties And Retrogradation Behaviour Of Native And Chemically Modified Starch Of Mucuna Bean (Mucuna Pruriens). Journal Science Food Agriculture, 83: [2] Al-Muhtaseb AH, McMinn WAM, Magee TRA Water sorption isotherms of starch powders: Part 1: mathematical description of experimental data Journal of Food Engineering 61 : [3] Aliawati, Gusnimar Teknik Analisis Kadar Amilosa Dalam Beras. Buletin Teknik Pertanian. 8(2): [4] Chen Z Physicochemical properties of sweet potato starches and their application in noodle products. Ph.D thesis. Belanda:Wageningen University. [5] Chen Z, Schols HA, Voragen AGJ Physicochemical properties of starches obtained from three different varieties of Chinese sweet potatoes. Journal of Food Science. 68: [6] Chi H, Kun Xu K, Wu X, Chen Q, Xue D, Song C, Zhang W, Wang P Effect of acetylation on the properties of corn starch. Food Chemistry 106 : [7] Jobling S Improving starch for food and industrial applications. Current Opinion in Plant Biology 7: [8] Kuakpetoon D, Wang YJ Locations of hypochlorite oxidation in corn starches varying in amylose content. Carbohydrate Research. 343: [9] Lawal, O.S Composition, Physicochemical Properties And Retrogradation Characteristics Of Native, Oxidised, Asetilated Acid-Thinned New Cocoyam (Xanthosoma Sagittifolium) Starch. Food Chemistry, 87: [10] Parovouri P, Hamunen A, Forssel P, Autio K dan Poutanen K Oxidation of Potato Starch by Hidrogen Peroxide. Starch/Stärke (1995) 47: [11] Sandhu KS, Singh N Some properties of corn starches II: Physicochemical, gelatinization, retrogradation, pasting and gel textural properties. Food Chemistry. 101: [12] Singh N, Chawla D, Singh J Influence of acetic anhydride on physicochemical, morphological and thermal properties of corn and potato starch. Food Chemistry. 86: [13] Singh J, Kaur L, Singh N Effect of acetylation on some properties of corn and potato starches. Starch. 56: [14] Shogren MK, Ishii H, Sun JM, Pazin MJ, Davie JR, Peterson CL Histone H4-K16 Acetylation Controls Chromatin Structure and Protein Interactions Science. 311: [15] Tester RF, Karkalas J, Qi X Starch composition, fine structure and architecture. Journal of Cereal Science. Volume 39 : [16] Wang, YJ dan Wang LF Physicochemical properties of common and waxy corn starches by different levels of sodium hypochlorite. Carbohydrate Polymers 52 : [17] Yang P, Haken AE, Niu Y, Chaney S R., Hicks, K. B., Eckhoff, S. R., Tumbleson, M. E. and Singh, V Effect of steeping with sulfite salts and adjunct acids on corn wet-milling yields and starch properties. Cereal Chemistry, 82(4):
193 2 nd TOPIC AMINO ACIDS COMPOSITION AND MINERALS CONTENT OF POTATO TUBERS CULTIVAR EIGENHEIMER AND GRANOLA C. Wibowo 1 and N. Bafdal 2 1 Department of Agricultural Technology Faculty of Agriculture Jenderal Soedirman University Purwokerto Indonesia 2 Department of Agricultural Engineering Faculty of Agricultural Industrial Technology Padjadjaran University Bandung Indonesia condro.wibowo@unsoed.ac.id ABSTRACT In tropical countries, the suitable area for potato cultivation is in highland, because in which provides optimum climatic condition for tubers' growth. Since the availability of the area islimited, therefore cultivation of tubers in medium altitude area is investigated. Potato cultivars Eigenheimer and Granola were planted at a medium altitude area of 754 m above sea level. The average temperature was 23 C. The treatments were three watering intervals (watering every 2 (A1), 4 (A2) and 6 (A3) days) and three levels of potassium application (KCl dosage : 50 (P1), 100 (P2), and 150 (P3) kg ha -1 ). The result shows that potato tubers cultivars Eigenheimer and Granola could be cultivated in medium altitude land though subjected to unfavorable condition. The watering interval and level of potassium fertilization affects amino acids composition, the amount of essential amino acids and minerals content as well. Keywords: potato, heat, water shortage, amino acids, minerals INTRODUCTION In addition as a source of carbohydrate, potato is well known as a good source of minerals such as potassium, magnesium and phosphorus. The distribution and accumulation of minerals vary within the tuber. Previous studies reveal that mineral concentration is higher in the peel than in the tuber [1], [2]; in addition, within tubers, several minerals are present at a higher concentration at the stem end rather than at the bud end [2]. Nowadays, Granola is the most common potato cultivar in Indonesia and is estimated to be grown on 91 % of the total cultivated potato area. Its preference is partly explained by its early maturing, high yielding and its high proportion of large tubers [3]. However, the main reason for its popularity is the slow rate degeneration of the seed. In Indonesia, the optimum condition for the potato tubers is on the highlands area between 800 and 1800 m above sea level [3]. Because the availability of highland area is limited, therefore, medium altitude land ( m above sea level) could be an alternative. Since it is abundantly available in Indonesia. Nonetheless, the cultivation of tubers in medium altitudes are subjected to unfavourable conditions such as heat and water shortage, subsequently adverse tuber yield and quality. Thus, adequate supply of water and nutrients must be managed to fulfil tubers requirement. Irrigation management determines water availability, influences nutrient availability and may affect soil temperature. Therefore, it is highly desirable to have an uniform moisture supply in the soil at all times during the growing season. Applying an overabundance of water and then waiting too long for the next application may result in misshapen, second growth, craked potatoes and relatively low yield [4]. Thus interval irrigation plays an important role to supply water requirement of the potato during plantation. The availability of nutrients in appropriate concentration and at beneficial time will ensure the optimal growth of tubers. The uptake of macro and micro nutrients by the plant is influenced by several factors such as nutrient availability in soil, soil type and texture, uptake mechanism and interactions with other nutrients. Furthermore, environmental conditions such as water availability, 177
194 2 nd TOPIC Sustainable Rural Development-Towards A Better World Purwokerto, August 25-26, 2013 temperature and sunshine duration also influence the plant s nutrients acquisition [5]. Potatoes require the following macro and micro nutrients during cultivation: nitrogen (N), potassium (K), phosphorus (P), magnesium (Mg), calcium (Ca), sulphur (S), iron (Fe), zinc (Zn), manganese (Mn), copper (Cu) and boron (B) [6], [7]. Each nutrient contributes to metabolic processes in tubers, subsequently determining yield and tuber quality. As one of macro nutrients, K is classified as an essential nutrient for several reasons: it is present during the whole life cycle, its role can not be substituted by other nutrients, and it is significantly required for the metabolic processes [7]. The potato plant requires K during vegetative growth, tuber initiation, tuber bulking and maturation periods [6]. The plant heavily removes K from soil; a healthy plant s uptake reaches kg K 2 O ha -1 which is higher than cereals [8]. Potato tubers contain approximately 80% water [9]; thus, K is required at high concentration due to its important role in osmoregulation that promotes water absorption [5], [7]. In plant physiology, K contributes to many aspects, for example it stimulates enzyme activity, promotes protein synthesis, improves photosynthesis, supports on osmoregulation, regulates opening and closure of stomata and participate on nutrients translocation [10], [11]. An adequate K supply for an optimal growth of tubers varies, depending on cultivars, environmental conditions and soil type [8]. A shortage of K supply retards plant growth, decrease photosynthesis and reduce both starch and dry matter content in tubers [6]. Increasing the K supply improves several tuber quality parameters; nonetheless, excessive application provides no further advantages as it results in luxury consumption, which affects the uptake and availability of other nutrients such as Mg and Ca [10]. The objectives of this research were to evaluate amino acids composition and minerals content of potato tubers cultivar Eigenheimer and Granola as affected by application of potassium fertilizer and watering interval. METHODOLOGY Materials Potato cultivars Eigenheimer and Granola were planted. Both cultivars are suitable for the cultivation in the highlands. The field experiment was conducted in Jatinangor, Bandung, Indonesia, at a medium altitude of 754 m above sea level. During the cultivation, 90 days, the average temperature was 23 C, where maximum and minimum temperature were 28 and 17 C, respectively. Soil characteristic are as follows: ph 6.2; content of C 1.86%, N 0.26%, P 2 O ppm and K 2 O mg 100 g -1. The treatments were three watering intervals (watering every 2 (A1), 4 (A2) and 6 (A3) days) and three levels of potassium application (KCl dosage : 50 (P1), 100 (P2), and 150 (P3) kg ha -1 ). Application of watering was 2 weeks after plantation until 2 weeks before harvesting, 60 l per plot by furrow irrigation. The common practice by the farmers is A2 and P2. Cultivars were planted by hand with a space of 50 cm and 50 cm within a row. Each plot consisted 9 rows of 5 m length and 1 m width, and was initially irrigated uniformly during cultivation, while KCl used as potassium source. Three replications were conducted for each treatment. At harvesting, tubers were analyzed and the rest of samples were freezed dried in a vacuum freeze drier unit (Edwards High Vacuum Int., England), for four days for further analisys. Methods Amino acids Amino acids were determined with Reversed Phase-High Performance Liquid Chromatography (RP- HPLC). 0.2 mg freeze-dried sample was hydrolyzed with 6 M HCl containing 3% phenol solution in MLS-Mega Microwave (Leutkirch, Germany). The first 30 min Nitrogen was flowed, followed by 30 min vacuum and hydrolyzed with microwave for 20 min (the first 5 min the energy was 1000 watt and the rest 15 min the energy was 500 watt). Afterwards, samples were reconstituted, treated with 6-aminoquinol N- hydroxy-suscionmydil carbonate (AQC) and AQC-buffer [12]. Waters amino acid hydrolisate standard 178

195 2 nd TOPIC were used for evaluation of amino acid content in the samples. The samples were injected in a Multi Pump Gradient Waters HPLC system (Waters Corporation, Milford, Michigan, USA). The Milennium 2010 chromatography manager system was applied to evaluate the amino acids. Two repetition were made for each sample. Aspartic acid (ASP), Serine (SER), Glutamic acid (GLU), Glycine (GLY) Histidine (HIS), Threonine (THR), Arginine (ARG), Alanine (ALA), Proline (PRO), Cysteine (CYS), Tyrosine (TYR), Valine (VAL), Methionine (MET), Lysine (LYS), Isoleucine (ILE), Leucine (LEU) and Phenylalanine (PHE) were determined. Potassium, calcium, and iron Ca, K and Fe were determined. 0,2 g of freezed dried sample were treated with 4 ml 65% HNO 3 in teflon crucible, placed in oven at C for 11 hrs. Afterwards, the samples were transferred into 10 ml round graduated flask, make up to volume with deionized water. Calcium and potassium were measured with Flame Photometer (Eppendorf Elex 6361, Engelsdorf, Deutschland) and iron with the Atomic Absorption Spektralphotometrie (AAS, from Unicam M serie, Cambridge, England). Average consist of three repetitions for each sample. Nitrogen Total nitrogen content was determined on freeze-dried material, with the Nitrogen Determinator LECO R CN-2000, from LECO R Corporation, Michigan, USA. 0.4 g sample was put in sample holder, and combusted. The combustion will modify any elemental Nitrogen into N 2 and NO x, and the catalyst heater of LECO instrument will change NO x to N 2. The results are presented as total nitrogen. Three repetitions were made for each sample. RESULT AND DISCUSSION Amino acids composition In this research essential amino acids included: THR, VAL, MET, LYS, ILE, LEU and PHE. Figure 1. Essential amino acids of potato tubers cultivar Eigenheimer and Granola. 1 = watering intervals, bars indicate SEM The essential amino acids concentration in Granola ranged from 43 to 54 g AA/100 g protein, whilst in Eigenheimer this was between 44 till 48 g AA/100 g protein. A1 had the highest concentration of 179

196 2 nd TOPIC Sustainable Rural Development-Towards A Better World Purwokerto, August 25-26, 2013 essential amino acids (P<0.001). High essential amino acids concentration of Granola could be obtain by watering every two days and 100 kg ha -1 potassium fertilization. Eigenheimer had highest essential amino acids concentration by watering every four days and 50 kg ha -1 potassium fertilization. Results of total amino acids within Granola ranged from 0.70 till 1.49 g AA/100 g protein, and within Eigenheimer from 0.82 to 1.55 g AA/100 g protein. The composition of amino acids of potato tubers cultivar Eigenheimer and Granola are presented in Table 1 and Table 2. Proline acts as an stress indicator in the tuber, because it can accumulate under stress condition. Proline concentration was affected by the interaction between watering and cultivars (P<0.001) as well as between cultivars and fertilizer (P=0.046). Proline accumulated in Granola ranged from 1.34 to 1.73 g AA/100 g protein. Within A1, proline was founded in the lowest concentration, whilst the highest accumulation was obtained by A3. Probably water stressed plants accumulate proline to help to retain water by lowering the osmotic potential [13]. Table 1. Amino acids composition of potato tubers cultivar Eigenheimer 180
.")
 than A1 and A2. P2 had a higher potassium content (P<0.001) than P1.")
197 2 nd TOPIC Table 2. Amino acids composition of potato tubers cultivar Granola Potassium content The potassium content in the tubers was influenced by the interaction among watering, cultivars and fertilizer (P<0.001). Granola had a higher overall mean potassium content than Eigenheimer (P<0.001). Results within Granola ranged from 2.8 to 3.8 % DM, and within Eigenheimer from 2.3 to 3.0% DM for all treatments. The mean of A3 for Granola and Eigenheimer was higher (P<0.05) than A1 and A2. P2 had a higher potassium content (P<0.001) than P1. It agrees to the previous work that a higher potassium content in the tubers with higher potassium fertilization [14]. Application of watering every six days and 100 kg ha -1 potassium fertilization of Granola, whilst in Eigenheimer by watering every four days and 100 kg ha -1 potassium fertilization. Figure 2. Potassium content of potato tubers cultivar Eigenheimer and Granola. 1 = watering intervals, bars indicate SEM 181

198 2 nd TOPIC Sustainable Rural Development-Towards A Better World Purwokerto, August 25-26, 2013 From the soil solution, K is taken up by the plant roots in an ionic form, K +. The K + is mostly taken up by the plant through mass flow and diffusion, where water in soil and temperature play an important role in the both mechanisms [15]. Both mechanisms require sufficient water in the soil to carry K to the roots and for the plant to absorb the nutrient. Meanwhile, excessive water moving through the soil leads to leaching of K from the soil [5]. In the plant, K has a versatile function because it exists as a free or absorptive-bound cation and therefore it can be highly mobile in cells, tissues or the whole plant [10]. Calcium content Calcium content was affected (P<0.001) by the interaction among water supply, cultivar and potassium fertilization. The overall calcium mean of Granola was higher than Eigenheimer (P<0.001). Calcium content of Granola ranged from to 0.058% DM. Calcium content of Eigenheimer ranged between % DM (Figure 3). Both Granola and Eigenheimer had the highest calcium content by A2 (P<0.001). The highest calcium content in Granola and Eigenheimer was obtained at P1 and P2 respectively. Figure 3. Calcium content of potato tubers cultivar Eigenheimer and Granola. 1 = watering intervals, bars indicate SEM In addition to absorption of calcium from the fertilizer, It is possible to transport Ca into tuber across the periderm, which may occur prior to the full development of tubers periderm [2]. Calcium is an essential element for strengthening the cell wall and membrane stability, which decreases susceptibility to mechanical impact [16]. Iron content Iron content of the tubers was significantly affected by the interaction among water supply, cultivars and potassium fertilization (P<0.001). The overall mean on iron content in Granola was 40 ppm (P<0.001) and Eigenheimer of 34 ppm. A2 had the lowest iron content compared to A1 and A3 (P<0.001). Iron is found as a minor mineral and it is enzymatic constituents of potato tubers. As well as calcium, iron can be absorbed directly through the periderm from the soil solution before the the tubers periderm completly developed [2]. 182
")
 but not from A2, whilst between A2 and A3 was significantly different (P<0.05). Potassium fertilization influenced nitrogen content (P<0.001). P2 is significantly different than P1 and P3 (P<0.")
199 2 nd TOPIC Figure 4. Iron content of potato tubers cultivar Eigenheimer and Granola. 1 = watering intervals, bars indicate SEM Total nitrogen Total nitrogen was affected by the interaction between watering and fertilizer (P<0.001) and between cultivars and fertilizer (P<0.001). Eigenheimer had a higher overall mean than Granola (P=0.008). The results are presented in Figure 5. Water supply affected nitrogen content (P<0.001). Within water supply, A1 significantly different from A3 (P<0.05) but not from A2, whilst between A2 and A3 was significantly different (P<0.05). Potassium fertilization influenced nitrogen content (P<0.001). P2 is significantly different than P1 and P3 (P<0.05). High nitrogen content of Granola could be obtain by watering every four days and 100 kg ha -1 potassium fertilization, whilst Eigenheimer had highest nitrogen by watering every four days and 50 kg ha -1 potassium fertilization. Figure 5. Nitrogen content of potato tubers cultivar Eigenheimer and Granola. 1 = watering intervals, bars indicate SEM The total nitrogen content of potatoes ranges from 1 to 2% DM, and about 90% is soluble in the usual aqueous solvents, the insoluble remainder being associated with the skin and outer layer. High 183
200 2 nd TOPIC Sustainable Rural Development-Towards A Better World Purwokerto, August 25-26, 2013 nitrogen content has been found to be associated with the advanced maturity, manuring, potassium deficiency and certain virus disease [4]. CONCLUSIONS The potato tubers cultivars Eigenheimer and Granola could be cultivated in medium altitude land though subjected to unfavorable condition. Granola had a higher essential amino acids concentration than Eigenheimer. The highest essential amino acids concentration of Granola is obtained by watering every two days and 100 kg ha -1 potassium fertilization. The highest potassium content of Granola is found by application of the highest dosage of potassium fertilization. The interaction between water supply and potassium fertilization affects to calcium and iron content in tuber. Content of both minerals is higher in Granola than that in cultivar Eigenheimer. Granola accumulated more nitrogen than Eigenheimer. High nitrogen content of Granola is obtained by watering every four days and 100 kg ha -1 potassium fertilization, whilst Eigenheimer has highest nitrogen by watering every four days and 50 kg ha -1 potassium fertilization. This result obtained of one year research. Further investigation over several years is required to confirm the data. ACKNOWLEDGMENTS We would like to thank to Prof. Dr. Pawelzik from Department of Crop Sciences Georg August University Germany who allow us to use the facilities in the laboratories and also for her suggestion for improving this research. REFERENCES [1] Sulaiman, M.I., Correlation Analysis on Nutrient Composition of Potato Tubers Fertilized with Calcium in Three Years of Field Experiments and Three Locations. In: Effect of Calcium Fertilization on the Quality of Potato Tubers (Solanum tuberosum L.) cv. Saturna. Cuvillier Verlag Goettingen. Pp [2] Subramanian, N.K., P.J. White, M.R. Broadley and G. Ramsay, The Three-Dimensional Distribution of Minerals in Potato Tubers. Annals of Botany 107: [3] Fuglie, K.O., W. Adiyoga, R. Asmunanti, S. Mahalaya and R. Suherman, Farm Demand for Quality Potato Seed in Indonesia. Agricultural Economics 3: [4] Talburt,W.F., and Smith, O., Potato processing. 4 th edition, AVI Publishing, Westport, Connecticut [5] Mengel, K., and E.A. Kirkby, Principles of Plant Nutrition. 5 th edition. Kluwer Academic Publisher, Dordrecht, The Netherlands. [6] Stark, J., D. Westermann and B Hopkins, Nutrient Management Guidelines for Russet Burbank Potatoes. Buletin 840 College of Agricultural and Life Sciences University of Idaho [7] Westermann, D.T., Nutritional Requirements of Potatoes. American Journal of Potato Research 83: [8] Trehan, S.P., S.K. Pandev and S.K. Bansal, Potassium Nutrition of Potato Crop Indian Scenario. Accessed on January [9] Navarre, D.A., A. Goyer and R. Shakya, Nutritional Value of Potatoes: Phytonutrient and Mineral Content. In: Advances in Potato Chemistry and Technology, Singh, J. and L. Kaur (eds.). Academic Press New York United States of America. Pp [10] Marschner, H., Mineral Nutrition of Higher Plants. 2 nd edition, reprinted Academic Press, Amsterdam The Netherland. [11] Mengel, K., Potassium. In: Handbook of Plant Nutrition. A.V. Barker and D.J. Pilbeam (eds.). CRC Taylor and Francis Group, Florida United States of America. Pp [12] Delgado, E., and E. Pawelzik, Effect of water stress on the quality and storability of potato tubers differing in blackspot susceptibility. Dahlia Greidinger International Symposium, 184
201 2 nd TOPIC Nutrient Management under Salinity and Water Stress from 1-4 March Technion-Israel, Institute of Technology, Haifa, Israel. p [13] Walingford, W., Functions of potassium in plants. In: Potassium for agriculture a situation analysis. Potash and Phosphate Institute, Atlanta. p [14] McNabnay, M., B.B. Dean, R.W. Bajemandand and G.M. Hyde, The Effect of Potassium Deficiency on Chemical, Biochemical and Physical Factors Commonly Associated with Blackspot Development in Potato Tubers. American Journal of Potato Research 75: [15] Havlin, J.L., J. D. Beaton, S. L. Tisdale and W. L. Nelson, Soil Fertility and Fertilizers, An Introduction to Nutrient Management. 7 th edition. Pearson Prentice Hall New Jersey The United States of America. Pp [16] Lulai, E.C., Skin-Set, Wound Healing and Related Defects. In: Potato Biology and Biotechnology Advances and Perspectives, Vreugdenhil, D (ed.). Elsevier, Amsterdam The Netherland. Pp
202 2 nd TOPIC Sustainable Rural Development-Towards A Better World Purwokerto, August 25-26,
203 2 nd TOPIC DIMENSIONAL ANALYSIS FOR MEASURING COEFFICIENT OF UNIT SURFACE CONDUCTANCE OF STEELBALSS FOR NON COOKING OIL FRYING APPLICATION Siswantoro 1, Sidharta Sahirman 1, and Agus Margiwiyatno 1 Teaching Staff Study Program of Agricultural Engineering, Department of Agricultural Technology, Faculty of Agriculture, Jenderal Soedirman University, Purwokerto, Indonesia siswantoro_07@yahoo.co.id ABSTRACT Frying is one of the oldest process for cooking food. The frying process is basically exchange of thermal energy through direct contact between a transferring heat medium and the food in high temperature. Cooking oil is the most commonly used as frying medium, but there is an alternative frying process without cooking oil by using sand and steel balls. Even though frying process is a very popular, theory of the frying process was long neglected and poorly understood. In frying process, coefficient of unit surface conductance is an important thermal property for analyzing heat transfer process. A common notation used for the coefficient is h and the unit is (J/s.m 2.C). Objective of this research was to measure the coefficient of unit surface conductance (h) by using dimensional analysis for constructing mathematical model. Laboratory experiments were conducted to find the h of two types of medium, i.e. sands (river and ferric sand) and steel balls with various diameters. An aluminum plate was used to simulate food being fried. A cylindrical frying machine was employed for frying process. The h value was determined based on dimensionless temperature ratio. The h values were then used to develop an empirical mathematical model using dimensional analysis. The developed mathematical model showed a good agreement with measurement results with average of errors was less than 10%. Keywords: mathematical model, unit surface conductance, frying, dimensional analysis INTRODUCTION Hot sand frying method (frying without cooking oil) has been long applied in Indonesia, China, and India. In this method, sand is used as heating medium. Product and bulk of sand are filled into a frying chamber. Frying is conducted by heating the frying chamber and then the heat is transferred for heating the mixture of product and bulk of sand. During the frying process, the mixture is flowing in the chamber as it is continuously stirred. In this process, the flowing bulk of sand will have property like fluid. Unlike in frying using cooking oil whereas heat transfer phenomenon occurred in the process is only convection, two types of heat transfer phenomenon are occurred in the hot sand frying process, in conduction and convection. Mohsenin (1980) used a term, so called unit surface conductance, for describing the conduction and convection phenomenon. This term refers to thermal conductivity of a relative stagnant layer of fluid that is assumed to adhere to the surface of the solid during heating. It defines the rate of heat transfer per degree of temperature difference across solid-fluid interface per unit of solid s surface area. The heat transfer phenomenon in the hot sand frying method has not yet scientifically investigated. Understanding on the phenomenon will give considerable contribution to develop and promote the hot sand frying method as an alternative healthy cooking method because there is indicative evidence that cooking food with oil could risk human health, such as high blood pressure and cancer (Sartika, 2009; Rofiuddin, 2007). Other comparative advantages of the hot sand frying are: (1) no rancidity problem of product, (2) lower cost on frying process, and (3) abundance availability of medium materials. Considering the benefits of the non oil cooking method, Siswantoro (2011) has conducted experimental investigation on thermal properties of sand and applied the experimental results for frying several kinds of chip. It was found that unit surface conductance value was influenced by diameter of the sand. The h value of sand with 0.4 mm and 3.0 mm were 95.0 J/s.m 2.C and 39.9 J/s.m 2.C 187
204 2 nd TOPIC Sustainable Rural Development-Towards A Better World Purwokerto, August 25-26, 2013 respectively. This indicates that the greater the diameter of sand, the smaller the value of h. However, it was also found that the h value should not less than 0.75 mm as the sand will stick on the chip surface. This encouraging results should be further elaborated to find other possible materials for avoiding dirtyness of the product. For this purpose, use of steel balls is main concern in this paper. METHODOLOGY Materials and Apparatus For laboratory experiments, steel balls with different diameters (3,2 mm and 4,7 mm) were used as heating medium, a piece of aluminium plate was used to simulate a product being fried, and a rotating cylinder frying machine was employed to simulate frying process. Other apparatus used in the experiments were tachometer, thermocouple, and data acquisition unit. Methods Temperature of steel balls and aluminum plate measurements During frying simulation, temperature of steel balls was measured in every 5 second. The same measurement was also made to aluminium plate. Figure 1 shows schematic diagram of experimental setup. Treatments applied in the experiment were steel ball diameters (3,2 mm and 4,7 mm), rotation (rpm) of fryer cylinder, and volume of medium. The frying process was assumed to follow Newtonian Law of Heating whereas thermal conductivity (k) is high in comparison to the unit surface conductance (h), and so Biot number (Bi) is approximately less than 0.2 (Mohsenin, 1980). Figure 1. Schematic view of the experiment for measuring coefficient of unit surface conductance Energy balance on the frying process can be written as follows: q = h.a.( T ps T θ ) = V.ρ a. Cp a.(dt/dθ) (1) The following equation was used to calculate the h value based on value of T (aluminum plate temperature), T ps (temperature of steel balls at time θ), A (aluminum plate area), V (volume of medium), ρ (mass density of steel ball), and Cp (specific heat steel ball) : dt h. Ad. T ps T V.. a. Cpa 188
205 T dt T T h. A. d.. T ps V 0 a Cpa i T Tps h. A( 0) ln Ti T ps V. a. Cpa T Tps A. h ln / Ti Tps V. a. Cp a 2 nd TOPIC (2) Development of mathematical model Value of unit surface conductance coefficient (h) in frying process is depended on the following parameters : conductivity (k) of steel balls, bulk density (ρ) of steel balls, specific heat (Cp) of steel balls, diameter (d) of steel balls, rotation (n) of fryer cylinder, diameter (D) of fryer cylinder, gravitation force (g), volume (Vp) of steel balls stored in frying chamber, and volume of frying chamber (Vs). Therefore, mathematical equation for calculating the h was written in the following form: h = f(k, ρ, Cp, d, n, D, g, Vp, Vs) (3) The equation (3) can be solved by dimensional analysis with basic dimension of mass (M), length (L), time (θ), and temperature (T). Variables involved in the analysis are presented in Table 1. Table 1. Dimension variables No. Name of Variable Symbol Unit Dimension 1. Coefficient of unit surface conductance h J/s.m 2. 0 C M θ -3 T Sand thermal conductivity k J/s.m. 0 C M L θ -3 T Sand mass density ρ kg/m 3 M L Sand specific heat Cp J/kg. 0 C L 2 θ -2 T Sand diameter d m L 6. rpm n s -1 θ Cylinder Diameter D m L 8. Gravitation of Earth g m/s 2 L θ Sand volume Vp m 3 L 3 10.Fryer cylinder Volume Vs m 3 L 3 Solution of dimensional analysis was made using Buckingham π Theorem (Glenn Murphy, 1950; Siswantoro, 2011). Relation form of dimensionless number (π) function was written in the following form: Number of π = Total number of variable - Number of basic variable Hence : π = 10 4 = k ; d Cp g 3 n D Cp / 1 hd / 2 / k ; gk 4 d / D ; D 3 5 / Vp ; 6 Vp/ Vs hd/k = Nusselt number, and α = k/ρcp = thermal diffusivity Hence the basic function can be written in the following form: 1 F( 2, 3, 4, 5, 6) (4) The dimensional equation corresponding to equation (4) is ( hd / k) F ( d Cp g / k ),( n D Cp/ gk),( d / D),( D / Vp),( Vp/ Vs) (5) The dimensionless number (π) was calculated based on the laboratory experiment results. Afterwards, the value of dimensionless number (π) was then used in matrix solution (Steel and Torrie, 1981) as follow: 189
206 Temperature ( C ) 2 nd TOPIC Sustainable Rural Development-Towards A Better World Purwokerto, August 25-26, 2013 b b ) ( b ) ( b )... ( ) 1 1 ( b1 ( b2 ) 2 ( b3 ) 3 ( b4 ) 4... b s b s ( ) s average value of π A logarithmic equation that coresponding to equation (4) was solved using matrix solution, as follow: log 1 F(log 2,log 3,log 4,log 5,log 6) (6) log 1 b1 ( b2 )log 2 ( b3 )log 3 ( b4 )log 4 ( b5 )log 5 ( b6 ) log 6 (7) b b b b b b (8) s Result of matrix solution was a mathematical model that can be used as a general prediction equation of unit surface conductance (h). The equation is written in the following form: 3 0,330 0,076 0,189 2,477 2, (9) Validation of the model was made by comparing prediction results and measurement results. RESULT AND DISCUSSION Value of unit surface conductance was calculated using equation (2). An example of temperature measurement which used to calculate coefficient unit surface conductance is shown in Figure time (second) T Al plate Tsteel balls Figure 2. Temperature Aluminum plate and sand during frying process From the result of temperature measurement on figure (2) can be plotted a graph about the relation of dimensionless temperature ratio: T Tps ln as a Y axis, and A. as an X axis, hence be obtained Figure 3. Ti Tps V.. Cp From Figure 3 and corresponding to equation (2), value of coefficient unit surface conductance (h) obtained as a gradient or slope of equation line. Hence the value of h is J/s.m
207 i 2 nd TOPIC 7 ps ps T T y = 191,07x R 2 = 0,9848 T LN T ,01 0,02 0,03 0,04 A mcp Figure 3. An example graph for deciding value of unit surface conductance (h) (steel balls on diameter 4.7 mm at rpm 12) A mathematical model of unit surface conductance obtained in the research is an empirical model. The model is a power function, and constructed from 6 number of dimensionless variable of phi (π). Equation of a mathematical model can be written in the following form: hd k 10 3, d Cp 2 k 2 g 0,330 n 3 3 D Cp gk 0,076 d D 0,189 3 D Vp 2,477 Vp Vs 2,461 (10) The mathematical model of equation (10) can be used for predicting value of unit surface conductance coefficient on steel balls in a good result, due to the average error of prediction 2.8 percent. Result of measurement (observation) value of coefficient unit surface conductance and predicting value using the mathematical model can be seen in the Figure C 0 ). 300 ( J / s. m 2 h pred steel balls h obs ( J / s. m. C ) Figure 4. Prediction and observation value of unit surface conductance coefficient (h) Value of unit surface conductance was predicted from the mathematical model in the range 161,4 J/s.m 2. 0 C to 329,2 J/s.m 2. 0 C whereas the average value was 242,3 J/s.m 2. 0 C. These figures are lower than the h value of river and ferric sand; Siswantoro (2011) found that the average value of h ferric 191
208 2 nd TOPIC Sustainable Rural Development-Towards A Better World Purwokerto, August 25-26, 2013 sand and river sand are 119,9 J/s.m 2. 0 C and 56,4 J/s.m 2. 0 C respectively. The differences is caused by thermal characteristic of the medium, i.e. thermal conductivity, bulk density, and thermal diffusivity. Increasing value of unit surface conductance on frying process not only caused by increasing rotation number (rpm) of cylinder fryer, but also caused by decreasing size of medium diameter. It was predicted that increasing rotation number and decreasing size of diameter will cause intensity and contact surface area to increase. Hence quantity of heat transfer in a certain time will be greater (Siswantoro, 2011, Masoumifard et al., 2008; Grewal dan Zimmerman, 1988; Loveday dan Taki, 1996; Zabrodsky et al., 1981). CONCLUSIONS 1. The developed mathematical model could be used for predicting value of unit surface conductance with average error about 2,8 percent. 2. Value of unit surface conductance of steel balls coefficient was 242,3 J/s.m 2. 0 C. 3. Increase of frying chamber rotation number (rpm) caused increase of unit surface conductance value. While the value was decreased with decrease of the steel ball diameter. 4. Thermal conductivity, diffusivity, bulk density, and specific heat of steel balls were 43,25 J/s.m. 0 C, 2,05735E-05 m 2 /s, 4500 kg/m 3, and 473 J/kg. 0 C respectively. REFERENCES [1] Grewal, N.S., and A. T. Zimmerman Heat Transfer From a Horizontal Tube Immersed in a Liquid-Solid Fluidized Bed. J. Powder Technology, 54 : [2] Henderson, S.M. and R.L. Perry Agricultural Process Engineering. AVI Publishing Company, Inc. Westport, Connecticut. [3] Levine, L Understanding Frying Operations. Cereal Foods World, 35 : [4] Loveday,D.L. and A.H. Taki Convective Heat Transfer Coefficients at a Plane Surface on a Full Scale Building Façade. Int. J. Heat and Mass Transfer, 39 : [5] Masoumifard, N., N. Mostoufi, H.Ali-Asghar, and R. Sotudeh-Gharebagh Investigation of Heat Transfer Between a Horizontal Tube and Gas Solid Fluidized Bed. Int. J. Heat and Fluid Flow, 29 : [6] Mohsenin, N.N Thermal Properties of Foods and Agricultural Materials. Gordon and Breach Science Publishers, New York. [7] Murphy, G.C.E Similitut in Engineering. The Ronald Press Company, New York. [8] Rofiuddin Pemerintah Dinilai Tidak Seius Selesaikan Kelangkaan Minyak Goreng , id.html. diakses, 12 Juli [9] Sartika, D.R.A Pengaruh Suhu dan Lama Proses Menggoreng (deep frying) Terhadap Pembentukan Asam Lemak Trans. Makara, Sains Vol. 13(1) : [10] Steel, R.G.D. and Torrie, J.H Principles and Procedures of Statistics. McGraw-Hill International Book Company. Tokyo. [11] Siswantoro Pemodelan Matematik Pindah Panas, Pindah Massa, dan Sifat Fisik kerupuk Goreng Pasir Selama Proses Penggorengan, Penyimpanan, dan Rekondisi. Disertasi S3, Program Studi Teknik Pertanian, UGM, Yogyakarta. [12] Zabrodsky, S.S., Yu. G. Epanov, D. M. Galershtein, S. C. Saxena and, A. K. Kolar Heat Transfer in a Large-Particle Fluidized Bed With Immersed in-line and Staggered Bundles of Horizontal Smooth Tubes. Int. J. Heat and Mass Transfer, 24 :
209 3 rd TOPIC
210
211 3 rd TOPIC A GRID TIED PHOTOVOLTAIC SYSTEM USING THREE-PHASE FIVE- LEVEL CURRENT-SOURCE INVERTER WITH CONTROLLED REACTIVE POWER Suroso 1, Daru Tri Nugroho 1, Winasis 1, and Toshihiko Noguchi 2 1 Department of Electrical Engineering, Jenderal Soedirman University, Indonesia 2 Department of Electrical and Electronics Engineering, Faculty of Engineering, Shizuoka University, Japan suroso.te.unsoed@gmail.com ABSTRACT This paper proposes a new grid tied photovoltaic system using a three-phase H-bridge based five-level currentsource inverter with controlled reactive power. This system is suitable for high power photovoltaic system such as for alternative industrial power system. The merit of the proposed system is that it does not use battery system as storage energy devices, hence the system become simpler and less cost. The proposed system is tested through computer simulation. Insulation transformer is used to isolate the inverter and the power grid, and also to step-up the voltage of the photovoltaic system. It should be noted that step-up function actually does not necessary for the high power photovoltaic system because high output voltage can be achieved by connecting some photovoltaic modules in series. The test result shows the proper operation of the proposed system injecting sinusoidal current and active power into the power grid. The results also present a unity power factor operation that can be achieved by the proposed system where the reactive power is controlled to be zero. Keywords: photovoltaic, power grid, harmonics, power converter INTRODUCTION Energy is becoming a primer need in today s daily life. Many equipments and instruments use energy to do the job. However, the biggest portion energy source used by human kind is from fossil fuel. The availability of this energy source is very limited. It is mandatory to develop new energy sources such as solar power, geothermal, wind power and fuel cell, which can be used to replace the conventional energy sources. These energy sources, especially solar power is very plenty in tropical countries such as in Indonesia. Solar power can be used to generate electricity to supply the energy demand by converting it into electricity using photovoltaic system. The photovoltaic power generation is very potential to be developed in Indonesia to supply electricity for remote area or event in urban area operating as hybrid power generation connected to the power grid utility. Many technology aspects still need to be developed to support the development of photovoltaic power generation. Power converter is one of the key technologies related with the photovoltaic power generation. It is used to process the power generated by the photovoltaic system to match the demand of the electric power from the power load. 195
212 3 rd TOPIC Sustainable Rural Development-Towards A Better World Purwokerto, August 25-26, 2013 Utility Power DC-DC Converter Load 3Ø CSI Transformer PV array AC Bus 3ø Figure 1. Proposed a three-phase grid-connected photovoltaic system This paper proposes a new system of photovoltaic power generation connected to the three-phase power grid. A three-phase five-level current source inverter constructed from H-bridge topology is used to synthesize a sinusoidal current waveform from a photovoltaic system to be injected into the power grid. Some computer simulation test results are presented in this paper to explore the merits of the proposed system. METHODOLOGY Principle Operation Figure 1 shows the proposed configuration of the three-phase grid connected photovoltaic system. The PV array is composed by series and parallel connection of some PV modules to obtain higher output power. The DC-DC converter in this system is used to generate DC current-sources for the inverter circuit. The inverter works generating a three-phase sinusoidal output current to be injected into the three-phase AC bus or power grid. The transformer isolates the inverter system and the power grid. The transformer also works to step-down the power grid utility to fit the voltage level of the PV system. Figure 2 shows the configuration of the DC-DC converter, and the three-phase five-level inverter connected to a power grid through the power transformer. The PV array is represented by three DC voltage sources V PV as the power sources of the inverter. The inverter is the five-level three-phase current-source inverter (CSI) generating a sinusoidal output current to be injected into the AC bus. The DC-DC converter for one phase system is composed by two controlled power switches, two diodes and two inductors. The switches regulate the currents flowing through the inductors to generate DC currents for the inverter circuits. Each phase of the five-level inverter is constructed by five unidirectional controlled power switches, i.e. IGBTs or MOSFETs connected in series with diodes. In this figure, all of the inverter s power switches are connected in series with discrete diodes. The inverter generates a pulse width modulation (PWM) five-level current waveform before filtering. The filter capacitor C f is used to filter the high frequency components of the five-level PWM current waveform to obtain a sinusoidal output current. 196
213 3 rd TOPIC IPWM_a Q1 Q2 L2 L1 DF DF Qc2 Qc1 VPV Q5 Q4 Q3 PV Array IPWM_b Qc2 L4 DF Qc1 L3 DF Q5 VPV PV Array Q1 Q4 Q2 Q3 Cf Vr IRf Vs ISf ITf Vt Trafo 3ɸ Y-Y VR VS VT VGrid IPWM_c Q1 Q2 L2 L1 D F DF Qc2 Qc1 VPV Q5 Q4 Q3 PV Array Figure 2. Grid tied three-phase CSI Current Controller and PWM Modulation Strategy In the proposed three-phase grid tied five-level CSI, proportional integral (PI) regulators are independently applied to regulate the DC currents flowing through the smoothing inductors of the inverter circuits. The amplitude of the smoothing inductor current is controlled to be 50 % of the peak value of the five-level current waveform. The switching gate signals of the chopper switches are generated by comparing the current error signals after passing through the PI regulator with a triangular waveform. These signals are used to adjust duty cycles of the chopper (DC-DC converter) switches to achieve balanced and stable DC current sources of the inverter [11], [12]. In order to obtain a better output current waveform with low distortion, a sinusoidal pulse width modulation (PWM) technique is applied, instead of a staircase waveform operation. The staircase waveform can easily be obtained in terms of the fundamental switching frequency, so switching losses can be negligibly reduced. However, more distortion of the output waveform is generated and a larger filter is needed as a result. In this paper, a level-shifted multi-carrier based sinusoidal PWM method is employed to generate the gating signals for the CSI power switches to obtain the three-phase PWM current waveforms. All carrier waveforms are in phase with each other at an identical frequency. The frequency of the modulated signals (three-phase reference sinusoidal waveforms) determines the fundamental frequency of the output current waveform, while the frequency of triangular carrier waves gives the switching frequency of the CSI power switches [10]-[13]. Fig. 3 shows an overall control diagram of the five-level three-phase CSI including the DC-DC converter and inverter circuit controllers. 197
214 3 rd TOPIC Sustainable Rural Development-Towards A Better World Purwokerto, August 25-26, 2013 Figure 3. Current control diagram and PWM modulation strategy TEST RESULT AND ANALYSIS In order to test the proper operation of the proposed system, the three-phase five-level CSI connected with the three-phase power grid as shown in Fig. 2 is tested through computer simulations. The test parameters are listed in TABLE I. Fig. 4 shows the computer simulation result of the proposed system when the inverter is connected with a three-phase pure sinusoidal power grid voltage, where the inverter s current in the primary side of transformer (IRf, ISf, ITf), the voltage at primary side of transformer (Vr, Vs, Vt ), and the power grid voltage (VR, VS, VT ) are presented. The three-phase five-level inverter works well injected a sinusoidal current into the power grid with high power factor operation. Fig. 5 shows the harmonic spectra of the current injected by the inverter (IRf). All of harmonic components are less than 1%, proving high quality power injecting by the inverter. Fig 6 depicts the active and reactive power injected by the inverter into the power grid at lagging power factor operation. Furthermore, Fig. 7 shows the operation of the inverter at unity power factor operation. Only active power is delivered to the power grid, while the reactive power is controlled to be zero. The simulation results show the proper operation of the proposed grid connected photovoltaic system using a three-phase five-level current source inverter. Table 1. Test Parameters Smoothing inductors 2.2 mh DC input voltage 48 V Grid voltage 220 V Switching frequency 22 khz Filter capacitor 100 F Load R = 8, L =10 mh Output current frequency 50 Hz Transformer ratio 1:10 198
215 3 rd TOPIC CONCLUSIONS In this paper a new three-phase grid connected photovoltaic system using a new three-phase fivelevel current source inverter (CSI) is presented. In the proposed system, each phase of the inverter is fed by a different photovoltaic array system. The proposed system was examined through computer simulation test. The test results show that the proposed system work well injecting sinusoidal threephase current waveforms into the three-phase power grid with a controllable power factor operation. REFERENCES [1] J. Rodiguez, J. S. Lai, and F. Z. Peng, Multilevel inverter: a survey of topologies, controls, and application, IEEE Trans. on Industrial Electronics, vol. 49, no. 4, p.p , August [2] G. Barbosa, H. A. C. Braga, M. C. Barbosa, and E. C. Teixeria, Boost current multilevel inverter and its application on single phase grid connected photovoltaic system, IEEE Trans. on Power Electronic, vol. 21, no. 4, p.p , July [3] R. T. H. Li, H. S. Chung and T. K. M. Chan, An active modulation technique for single-phase grid connected CSI, IEEE Trans. on Power Electronic, vol. 22, p.p , July [4] C. Klumpner, and F. Blaajerg, Using reverse blocking IGBTs in power converters for adjustable-speed drives, IEEE Trans. on Inductry Applications, vol. 42, no. 3, p.p , May/June [5] Z H. Bai, Z. C. Zhang, Conformation of multilevel current source converter topologies using the duality principle, IEEE Trans. on Power Electronic, vol. 23, p.p , September [6] S. Kwak, and H. A. Toliyat, Multilevel converter topology using two types of current-source inverters, IEEE Trans. on Inductry Applications, vol. 42, p.p , November/December [7] D. Xu, N.R. Zargari, B. Wu, J. Wiseman, B. Yuwen and S. Rizzo, A medium voltage AC drive with parallel current source inverters for high power application, in Proc. of IEEE PESC2005, p.p [8] L. M. Antunes, A. C. Braga, and I. Barbi, Application of a generalized current Multilevel cell to current source inverters, IEEE Trans. on Power Electronic, vol. 46, no.1, p.p , February [9] J. Y. Bao, D. G. Holmes, Z. H. Bai, Z. C. Zhang and D. H. Xu, PWM control of a 5-level singlephase current-source inverter with controlled intermediate DC link current, in Proc. of IEEE PESC2006, p.p [10] B. P. McGrath, and D. G. Holmes, Natural current Balancing of Multicell Current Source Inverter, IEEE Trans. on Power Electronic, vol. 23, no. 3, p.p , May [11] Suroso and T. Noguchi, Five-Level Common-Emitter Inverter using Reverse-Blocking IGBTs, TELKOMNIKA Indonesian Journal of Electrical and Informatics, vol. 10, no. 1, [12] Suroso and T. Noguchi, Common-Emitter Topology of Multilevel current-source Pulse Width Modulation Inverter with Chopper based DC-Current Sources, IET Power Electronics, vol. 4, issue 7, p.p , [13] Suroso, H. Prasetijo, D. Trinugroho and T. Noguchi, A New Five-Level Current-Source PWM Inverter for Grid Connected Photovoltaics, in Proc. of CITEE2012, Yogyakarta, p.p

216 3 rd TOPIC Sustainable Rural Development-Towards A Better World Purwokerto, August 25-26, 2013 Figure 4. The inverter s current and power grid voltage waveforms Figure 5. Harmonic spectra of inverter s current waveform Fig. 6 Active and reactive power injected by the inverter into the power grid at lagging power factor 200
217 3 rd TOPIC Figure 7. Active and reactive power injected by the inverter into the power grid at unity power factor. 201
218 3 rd TOPIC Sustainable Rural Development-Towards A Better World Purwokerto, August 25-26,
219 3 rd TOPIC A COMPREHENSIVE EVALUATION EFFORT OF CURRENT SITUATION IN KUPANG CITY AS LOCAL GOVERNMENT TO ACHIEVE INDONESIA GOVERNMENT TARGET IN REDUCING CO 2 E EMISSION BASED ON ANALYSIS OF KUPANG INPUT-OUTPUT TABLE Adrianus AMHEKA 1, Yoshiro HIGANO 2, Takeshi MIZUNOYA 3, and Helmut YABAR 4 1 PhD Candidate from University of Tsukuba, Japan 2 Professor in Environmental Policy University of Tsukuba, Japan 3 Associate Professor in Environmental Science University of Tsukuba, Japan 4 Associate Professor in Waste Management University of Tsukuba, Japan adrianus.amheka@gmail.com ABSTRACT Indonesian government target to reduce GHG emission between 26-41% ( ) Gton CO 2 e from base year 2010 to target year There is no specific target of Kupang City to reduce GHG emission due to lack of human resource and data availability to achieve the target. This research is trying to identify what are sectors that have created pollutants in the form of NOx, SOx, CO 2, CH 4, N 2 O for whole social-economic activities at Kupang city. An approach is made by build and develops an input-output (IO) table of Kupang city which classified become 27 sectors or industries for base year By introducing pollutant sectors as identified on Kupang IO table it will be allowed to estimate pollutant emission coefficient of GHG and air pollutant emitted by each sector and total amount of GHG CO 2 e has emitted overall up to year However, in this research, we just calculate the pollutant emission coefficient of GHG and air pollutant for each sector based on Kupang IO table 2010 that we have built. This research will become the first study that counts pollutant emission coefficients emitted of Kupang city for base year 2010 and became the main reference for any research further regarding CO 2 emission in regional level. Keywords: Kupang Input Output table, coefficient of GHG emission INTRODUCTION Background Indonesian government continues to make efforts to reduce GHG emission up to 41% or amount around Gton CO 2 e in 2020 which is they need to involving stake holders from regional to national level to achieve the target. The program is being conducted organized by Indonesian government is Local Action Plan for GHG emission reduction usually call RAD-GRK. The program provides directions for local governments to carry out multi-sector GHG emission reduction efforts directly and indirectly actions through a specific effort by considering local characteristics, potential, and authority, and that must be integrated into a local development plan [1]. Some province and cities have been involved intensively at the program. However, Kupang city, East Nusa Tenggara (NTT) province never joined the RAD-GRK program. The problem occurs due to shortage of human resource as well as both, lack of data availability and local government support such as technical, institutional, financial, environmental and social economic aspects. The environment is necessary for life and work, and economic development of a region is dependent on their socio economic situation including agriculture, livestock, industry, the private sector and public sector without considering the negative impact of GHG emitted in the form of CO 2, NOx, SOx, CH 4, N 2 O by doing the process production and without proper policy to control it particularly in development cities [2]. It is necessary to consider how much pollutant emission from production activities is determined by in proportion to production amount which is known as assuming linearity [2], [8] 203
220 3 rd TOPIC Sustainable Rural Development-Towards A Better World Purwokerto, August 25-26, 2013 An assume of Kupang City ambition in maintaining a sustainable environment in the future Kupang is capital city of NTT Province hopes to be referred to as the city of environmental model for example nowadays many programs organized by the city government to deal with the environmental sustainability by conducted program Kupang Green and Clean, District race clean and Competition of offices concerned the environment. This view as a proof of the assumption that Kupang city is dedicate indirectly to promoting program to reduce GHG emission in the societies while enjoying prosperous life. On one occasion the mayor of Kupang was stated we need to change our attitude and reconsider conventional ways of living as part of innovative environment solution [4]. It is indicate that in the field of social activities, the city need for improve eco-conscious urban development through introduction and promotion of environmental efforts to the community. As part of the environment promotion, we assume that the city needs comprehensive analysis to know in detail about amount of GHG emission emitted to nature by sectors activity in Kupang during the This information will be useful for local government to set up a goal of reducing CO 2 emissions by certain amount from base year 2010 and an ambitious to act as a core facility dedicate to vitalization of local economies through commitment to carbon reduction projects in Indonesia societies and getting involvement in the RAD-GRK program organized by national government. Input output table and it useful for prediction of CO 2 emission Input output (IO) analysis is introduced by Dr. Leontief in the late 1930s has been useful for the interindustry analysis and fundamental purpose of the IO framework to analyse the independence of industries or better known as sectors in an economics. In order to grasp the economic effects of increasing of CO 2 emission from a logical stamp point, we need to examine historically the impact of industries infrastructure development in the period of high economic growth by use of an input output model [5]. In general energy IO typically determines the total amount of energy required to deliver a product to final demand, both directly as the energy consumed by an industry s production process and indirectly as the energy embodied in that industry s inputs therefore a more comprehensive examination of a wide variety of factors associated with that spending program, such as impacts on employment, pollution, or capital expenditures should be carefully considered. The further analysis which is can be done by extending IO table as necessary. In case of Kupang, we use single region IO model for city level in order to get specific input coefficient of the table or knows as input coefficient matrix to figure out full impact of an exogenous increase in final demand on all industries [5],[6] and describe the coefficient value of intermediate inputs required in the production of one unit of output of the industry. The CO 2 emission of each industry would be greatly influenced of amount coefficient of each industry which is will be done through Leontief inverse matrix. Afterward we can analysis environmental problem by extending IO table such as predict how much CO 2 emission has been emitted of social economic activities. RESULT AND ANALYSIS Creating Input Output table of Kupang City for base year 2010 Build Kupang IO table Because there is no Kupang IO table, the only available is IO table of NTT province for year It was a challenge how to produce an IO table of a capital city level based on IO table of province level. We assume that 80% of activities that identified on IO table of NTT province is conducted in Capital city (Kupang city) and 90% technology was applied on each sector or industry are in Kupang due to economic development in Kupang increase rapidly if compare other areas within NTT province. This assumption does not apply with other large cities outside the province of NTT. Following are steps to build the IO table. First, using Kupang statistic book year 2010 as raw data to get real value of each sector which will determine how many sectors will be built for the Kupang IO table which at this point we must consider carefully how many industry should be include because it will be influence scale of emission coefficient of each sector after adjusted from Province IO table to City IO table or had been as changing competitive import type become non-competitive import type (domestic type) by consider number of workers in these sectors, The land area is in use for running the sectors mentioned, technology used, clean water and electricity usage, the use of chemicals as raw materials, sector by type of ownership (public or private). 204
221 3 rd TOPIC Table 1. Adjustment from NTT Province IO table to Kupang City IO table No Kupang Sectors classification NTT Sectors (Adjust to Kupang Sectors) 01 Paddy rice Paddy rice 02 Corns Corns 03 Nuts Nuts 04 Tubers Tubers 05 Vegetables & Fruits Vegetables & Fruits 06 Other Crops Other Crops (6), Cashew(7), Tobacco(9), Coffee& Cocoa(10), Vanilli(11), Clove(12), Cotton(13), Other Plantations(14), Other Agriculture& the 07 Coconut 08 Livestock Livestock(16) 09 Slaughterhouses Slaughterhouses(17) 10 Poultry Poultry(18) 11 Fisheries Fisheries(21) 12 Foods & beverage industry 13 Textile & leather industry 14 Industrial products of wood & rattan 15 Fertilizer, chemical & refining industry 16 Industry goods from metal services(15) Coconut(8), Timber Forest products(19), Other Forest(20) Foods & beverage industry(23), Rice Milling indusrty(25), Food industry of flour(26), Other Foods industry(28), Oils & fats industry(24), Sugar industry(27) Textile & leather industry(30), Cigarette& Tobacco industry(29) Industrial products of wood & rattan(31), Paper& Printing industry(32) Fertilizer, chemical & refining industry(33), Cement(&similar) industry(34), Mining& Quarrying(22), other Industry(37) Industry goods from metal(35), Transportation, machinery& other equipment Industry(36) 17 Electricity & Water supply Electricity & Water supply(38) 18 Buildings Buildings(39), Real estate& business services(49) 19 Trades Trades(40), Hotels(41), Restaurants(42) 20 Road & Rail transportation Road & Rail transportation(43) 21 Sea & river transportation Sea & river transportation(44) 22 Air freight Air freight(45) 23 Transportation support services Transportation support services(46) Communications(47), Social services(52), Communications 24 Recreation & Entertainment services(53) 25 Banks & other financial institutions Banks & the financial institutions(48) 26 Government Government(50), Other Government services(51) 27 Goods & service not include elsewhere Individual & other Household services(54), Goods& service not include elsewhere(55) Within the sector column, there are 27 sectors identified for these sectors in the city of Kupang based on the Kupang statistic book year Whereas NTT column are contained 55 sectors into 27 sectors adjusted according to the number of Kupang sector. This approach is conducted by assume that 90% of activities of NTT sectors were conducted in Kupang city as Capital city of NTT province. In order to gets value of each sector for IO tables are shown as Table
222 3 rd TOPIC Sustainable Rural Development-Towards A Better World Purwokerto, August 25-26, 2013 Table 2. IO table model of NTT (province) and Kupang (city) on transaction valued at producers prices Buying sectors Final demand Imports Total 1 2 n Private. Public. Invest. Exports Outputs Selling Sectors 1 2 z 11 z 12 z 1n z 21 z 22 z 2n c 1 i 1 g 1 e 1 c 2 i 2 g 2 e 2 -m 1 -m 2 x 1 x 2 n z 31 z 32 z 3n c n i n g n e n -m n x n Value added l 1 l 2 l n n 1 n 2 n n L N Total inputs x 1 x 2 x n C I G E -M X The component parts of the final demand vector represent private consumption ( g i ) and exports ( e i ). There are often grouped into domestic final demand [7]-[11]: ( C I G) (1) And foreign final demand (exports, E). The final demand vectors for the two sectors: f f 1 c1 i1 g1 e1 2 c2 i2 g2 e2 (2) (3) Whereas, the components parts of the payments sectors are sectors 1 and 2 for employee compensation (labour service, l i ) and for all other value-added items (n i ) e.g. government services (taxes), capital (interest payments), land (rental payments), entrepreneurship (profit), and so on [7]. Total value-added payments are for two sectors v 1 l1 n1 And v2 l2 n (4) 2 We can estimate the total value of gross output by summing down the total output column: X x1 x2 xn L N M or (5) Summing across the total output row: X x1 x2 xn C I G E (6) We can also find value of gross domestic income and gross domestic regional product (GDRP) of Kupang city by use formula: L N C I G ( E M ) (7) Where L N is gross domestic income and C I G ( E M ) is GDRP As for getting the value of each sector to the Kupang IO table, we need to calculate the input coefficient (a ij ) of each sector in the NTT IO table by making a diagonal matrix of the table, which is the amount of the diagonal of the matrix, is the value of the total output of each sector. The formula that used by dividing each element in the intermediate transaction matrix (z ij ) by the total of each sectors are shown in the column total ( X j ). So we can get the input coefficient from each sector (production sectors) which indicates on table II as follow [7], 11]: 206
223 3 rd TOPIC zij aij (8) x a a a a a a j a a a 1n 2n 3n Finally we got input coefficient of 27 sectors of NTT IO table, after that by using the same formula to get the value of each sector of Kupang IO table by dividing each coefficient (a ij ) from NTT IO table with total output or total production of Kupang IO table in order to realize the original IO table of Kupang city. Table 3. Supply of product for Kupang IO table (Unit: million Rupiah) Total intermediate outputs (consumers) Total exports Total Final demands Total imports Total outputs (products) Total: Total: Total: Total: E+09 (9) Total:
224 3 rd TOPIC Sustainable Rural Development-Towards A Better World Purwokerto, August 25-26, 2013 Table 4. Input of specific products & the profit of Kupang IO table (Million Rupiah) Gross Value Total Wages & Business Indirect Added intermediate Salaries surplus taxes (GDRP each inputs sector) Total inputs (products) Leontief Inverse matrix and the analysis of Kupang IO table Leontief Inverse matrix Once we get the Kupang IO table, then we can calculate the coefficient of each sector by use the same method when we calculate coefficient of each sector of NTT IO table. Normally in an IO table the total supply must be higher than total demand or can be equal actually (demand supply) [7], [10]. For Kupang IO table the total output products are 5x10 15 Rupiah bigger than total final demand 3.8x10 15 Rupiah. This is very important and has proven that the table has been produced is accurate which compared with actual situation and the table has described that has occurred the market equilibrium supply in Kupang City which theory of market equilibrium stated: 208 Supply market meet demand = Market equilibrium To count the market equilibrium, an approach using a set of fixed technical coefficient, which we can simply rewritten: Ax f x (10) a a a n1 a n2 2n nn n x 21 a a 22 a a a x x 2 x n 1 + f f 2 f n 1 = x1 (11) x2 x n Where a represent input coefficient matrix, x is column vector of total output and f is column vector of final demand.
225 3 rd TOPIC Now for Leontief inverse matrix (L) which we focused on full impact of an exogenous increase in final demand on all industries or sectors and formula is being used before inversed: I A (12) Where I represent an identity matrix and A is coefficient matrix and from this formula, we can estimate a high performance equilibrium model from L and f. Breakdown of the equation into the function a matrix: Ax f x (13) I A x (14) f 1 x I A f Refer to (15), shown high performance equilibrium model which we can get detailed influence of each industry whatever final demand composition is. (See fig. 1 to 3) Table 5. Inverse matrix L of IO table Sec (15) 209
226 3 rd TOPIC Sustainable Rural Development-Towards A Better World Purwokerto, August 25-26,
227 3 rd TOPIC 2. Analysis of Kupang IO table 2010 For further analysis of IO table, a simulation was conducted and we make some scenarios based on the simulation into the Base case, Case1 and Case2. Base case is conducting by assume business as usual which we keep the original value of total final demand and total output as well as ratio total (r X ) between output sectors and final demand formulated as [7], [11]: 1 I A f X (16) r X X (17) f 1.40E E E E E E E E E+11 Total Final Demand Total Output Figure 1. Base case: Relationship between final demand and total output for business as usual (unit in thousands) For base case, the total output and final demand for sector trades are 9.8x10 14 and 1.1x10 15 Rupiah respectively are higher followed by government, building and fishery sectors. The ratio total between total output and final demand is This result indicate if we keep the every sector conducted as usual while budgeting sectors, exports, imports, household consumption expenditure as well as fixed capital formation are not change significantly and without proper environment policy applied, a possibility of contribution of CO 2 emission in Kupang city predicted from trades and government sectors. Case1, we supposed that in Kupang city 10% increase in private consumption expenditure (household) of sector electricity and water supply. the new additional output and ratio between total output and final demand are formulated as: X r X 1 I A 1 X1 1 f 1 f (18) 1 Where 10% increase of this sector the amount of additional final demand become 8.8x10 12 Rupiah and additional total output is 8.9x10 12 Rupiah, whereas value of other sectors are keep at same level or unchanged. While the ratio total output sectors and final demand is We choose this sector, because we assume that increase of air pollutant and CO 2 emission are bigger sourced by usage of electricity and water supply. And when the sector increase, the trade and government sectors would also increase based on base case. So by anticipate introducing increase 10% of this sector, can more easily consider what policies should be applied. (19) 211
228 3 rd TOPIC Sustainable Rural Development-Towards A Better World Purwokerto, August 25-26, E+10 9E+09 8E+09 7E+09 6E+09 5E+09 4E+09 3E+09 2E+09 1E+09 0 Additional Final Demand Additional Output Figure 2. Case1: Change in the value of final demand and total output for 10% increase in private consumption expenditure of sector electricity and water supply (unit in thousands) Figure 2, shows when increase 10% for electricity and water supply it will be influence significantly for building and communication sectors as well as a little value for trades sector and fertilizer, chemical and refining sector. Thereby, the proper policy should be considered for applied in the sectors building, trades, fertilizer, chemical and refining. And related with reduce CO 2 e target of Kupang government if increase of electricity and water supply by 10%, government must implementing carbon tax policy, and promote use of new renewable energy in the relevant sectors. Case2, we suppose that 10% increase in gross domestic fixed capital formation of livestock sector. Which are the new additional output and the ratio are formulated as: 1 X 2 I A f (20) 2 r X 2 X 2 (21) f 2 Now the value of additional final demand of this sector become 3.3x10 11 Rupiah then additional total output is 3.4x10 11 Rupiah, while other sectors are keep at the same value or unchanged, and the ratio is 1.45 We choose livestock sector because we suppose in the future use of renewable energy from biomass which is livestock as raw material in Kupang city is possible to implement. Nowadays, in Kupang pollutants were happening caused by wastes as well from private and public sectors such as wastes from livestock, households, agriculture, restaurants, government and wastes from other public service sector activities. Those sectors definitely will accelerate the contribution of increase of CO 2 emission in Kupang. 4.00E E E E E E E E E+00 Additional Final Demand Additional Output Figure 3. Case2: Change in the value of final demand and total output for 10% increase gross domestic fixed capital formation of livestock (unit in thousands) 212
229 3 rd TOPIC Figure 3, clearly shows when the 10% increase in livestock sector, other sectors such as foods and beverage, and paddy rice increase rapidly, as well as fisheries and trades sectors, road and rail transportation sectors are also increased. Some agriculture sectors such as corns, tubers, cashews and vegetables and fruits are increased slightly. This relationship among sectors are much related, which is when we assume the livestock sector increased, of course it's caused by the increased productivity of sectors such as agriculture including paddy rice, food and beverage industry activity, fisheries, trades activities like restaurants and other activities using transportation services (transport from the field to industries). Therefore, Kupang government should be anticipating increasing of wastes sourced by livestock and other wastes. However, increased productivity of the livestock sector still maintained by introducing a framework of pollutant sector and feasibility to develop integrated new renewable energy as a unity, but for this matter need to be conducted further research. CONCLUSIONS Emission coefficients of each sector THAT classified in the Kupang IO table 2010 An assuming linearity is necessary to applied to predict the pollutant emission amount from production activities which are determined by proportion to production amount, and the IO table which became the principal reference. However, in reality, there are non-linear relation between pollutant emission and production amount due to insignificant result if we using analysis by non-linear structure [8]. We supposed current situation in Kupang, particularly in 2010 the technology used in industries are expected same with technology used in Japan in Thereby, we can estimate using the same formulas which has been used from National Institute for Environmental Studies, Japan within calculating coefficient emission of CO 2 and air pollutant based on Japan IO table Calculation of the induced environment burden in each sectors utilized the embodied intensity using equation [12]: e d I ( I M ) A (22) 1 Where e represents embodied intensity each sector, d is direct burden per unit production, I is identity matrix, M is import in each sector, and A is input coefficient matrix. The final demand each sector f, can be divided into domestic final demand Y and export demand i i E i shown as: F Y E (23) i i i For equation the induced environmental burden T by the final demand for any i sectori : T ( 1 m ) ey e E (24) i i i i i i Where m represents the import coefficient defined by equation m i n j 1 i a M1 (25) ij X j f i Where a represents input coefficient and ij X indicate domestic production of sector j j Refer to (25) we have gained the pollutant emission of each sector (see table VI). 213
230 3 rd TOPIC Sustainable Rural Development-Towards A Better World Purwokerto, August 25-26, 2013 Table 6. Pollutant emission coefficient each sector Industries CO2 NOx SOx CH4 N2O Unit: Kg/100 Million Rupiah 01 Paddy rice Corns Nuts Tubers Vegetables & Fruits Cashew Coconut Livestock Slaughterhouses Poultry Fisheries Foods & beverage industry Textile & leather industry Industrial products of wood & rattan Fertilizer, chemical & refining industry Industry goods from metal Electricity & Water supply Buildings Trades Road & Rail transportation Sea & river transportation Air freight Transportation support services Communications Banks & other financial institutions Government Goods & service not include elsewhere Overall this paper we are able to identify the air pollutant emission coefficient and GHG emission coefficient accurately based on Kupang IO table Thereby, we recommended to Kupang government to use precious data information of this research for implemented further to get total amount of GHG of CO 2 e and government with confidence will be able to devise environmental policies properly and technical measures to cope with both national and regional target to reduce GHG emission up to
231 3 rd TOPIC REFERENCES [1] BAPPENAS, Guideline for developing local action plan for GHG s emission reduction (RAD-GRK), Official document of Ministry of National Development Planning, Republic of Indonesia, [2] Y. Higano, Construction of sustainable society and meaning of the three balances in the comprehensive evaluation of environmental policy, Unpublished paper, University of Tsukuba Japan, 2012, p [3] Indonesian independence ceremony guidebook, Regional secretary of Kupang city, 2011 [4] T. Shibata, and H. Kosaka The internal and external effect of demand on the Japanese economy with a special focus on its transportation system using an international and interregional input-output system, The Journal of Econometric Study of Northeast Asia (JESNA), vol. 8 no.1, p. 2, March [5] Batey, Peter W. J. and Melvyn J. Weeks The Effects of Household Disaggregation in Extended Input-Output Models, in Ronald E. Miller, Karen R. Polenske and Adam Z. Rose (eds.), Frontiers of Input-Output Analysis. New York: Oxford University Press,pp [6] T. Mizunoya, Simulation of Environmental Policy, unpublished paper, University of Tsukuba Japan, [7] R. E. Miller and P. D. Blair, Input Output Analysis: Foundations and Extensions, 2nd ed. The Edinburgh Building, Cambridge CB2 8RU, UK: Cambridge University Press, 2009, pp [8] S. Ulger, An integrated dynamic simulation modeling approach for water quality improvement policy, Ph.D. dissertation, Dept. Agri. Eng., p.56, Tsukuba University, Japan, [9] F. Duchin and G-M. Lange The Choice of Technology and Associated Changes in Prices in the U.S. Economy, Structural Change and Economic Dynamics, 6, [10] G. K. Lee, L. L. Blakesley and WR. Butcher, Effects of Exogenous Price Changes on a Regional Economy: An Input-Output Analysis, International Regional Science Review, p.20, [11] A. Takayama, Mathematical Economics 2 nd ed. New York: Cambridge University Press, 1985 [12] K. Nansai, Y. Moriguchi and S. Tohno, Embodied Energy Emission Intensity Data for Japan using Input-Output Tables (3EID); Tsukuba, Japan: NIES, 2002, pp
232 3 rd TOPIC Sustainable Rural Development-Towards A Better World Purwokerto, August 25-26,
233 4 th TOPIC
234
235 4 th TOPIC SUSTAINABLE DEVELOPMENT THROUGH EFFECTIVE WASTE MANAGEMENT IN INDIA: OPPORTUNITIES AT COMMUNITY LEVEL Upendra D. Patel 1, Rajiv K. Sinha 2, and Margi U. Patel 3 1 C. S. Patel Institute of Technology, Charotar University of Science & Technology (CHARUSAT), India 2 Griffith University, Brisbane, Australia. He is now associated with CHARUSAT as a visiting Professor and Academic Advisor. 3 Gujarat Pollution Control Board, Regional Office, Vadodara, India upendrapatel.cv@charusat.ac.in ABSTRACT This paper discusses MSW generation scenario in India, its disposal methods, conventional sewage treatment and its limitation, loss of nutrients (N & P) due to unsustainable methods of disposal, and proposes promotion of low-cost, earthworm based treatment systems for MSW and domestic sewage and their advantages in terms of nutrient recycling and water reuse. Average MSW generated in India contains ~0.65% nitrogen (as N) and ~0.7% phosphorus (as P 2 O 5 ), mainly contained in compostable organic matter. On a conservative basis, considering generation of Mg of MSW per day (average generation of kg/person/day), India is losing ~510 Gg of P 2 O 5 and ~470 Gg of nitrogenous fertilizer per year since most of the MSW ends up in open dumps. Thus, if a simple system such as vermicomposting can be promoted at household level, most of the nutrients wasted with MSW can be recovered giving dual advantages of: (1) reduced amount of waste to be disposed, and (2) nutrient recycling. Out of about million liter per day of sewage generated in India, centralized sewage treatment capacity exists for only about million liter per day. Discharge of untreated or partially treated sewage laden with nutrients leads to severe water pollution. Even if nutrients released by 50% of India s population are trapped for effective use, it will amount to 2700 Gg of N, 360 Gg of P, and 720 Gg of K every year considering current population of 1.2 billion. A low-cost, decentralized sanitation system such as vermifiltration, can be promoted at community level that can treat sewage to a satisfactory level with minimal energy input and preserve all the nutrients. Such treated water from decentralized system can be used for irrigation thereby greatly reducing the demand of fresh water and fertilizers. Keywords: MSW, Conventional sewage treatment, vermicomposting, vermifiltration, decentralized sewage treatment INTRODUCTION Waste may be defined as an item/material that has been considered by its intended user to be of no further use. Depending upon the use and standard of living, we generate different types of wastes. It must be noted that we derive all of our resources from the nature or environment. Some of these resources are naturally renewable; such as, solar radiation, water, trees, agricultural crops, etc. However, many resources that we derive from the nature are not renewable; such as, fossil fuels, minerals, soil, etc. The rate at which we draw both renewable and non-renewable resources from the nature, decides the rate at which we degrade the environment and make our survival more and more difficult. Even in case of renewable resources, the rate of use greater than the rate of natural regeneration damages the delicate balance of nature. Unfortunately, rapid industrialization coupled with huge population growth is exerting greater pressure on the nature for resources. Thus, natural resources which are limited are depleted at much faster rate than ever before. The use of any resource also results into generation of some wastes. The nature has capacity to assimilate these wastes and convert them into a resource again. However, here too, the rate of generation of waste is much higher than the natural assimilating capacity of the earth, leading to pollution/contamination of natural resources by wastes. 219

236 4 th TOPIC Learning From Natural Eco-Systems Unlike humans, natural eco-systems are very efficient. Resources are utilized to the fullest extent leaving behind less amount of waste. Moreover, the waste from one trophic level becomes food for the other trophic level. Maintaining such a balance, natural eco-systems have been preserving our natural resources in pristine form for thousands of years. Thus, we need to learn these aspects from natural eco-systems, viz. (1) utilizing the resources to maximum possible extent before discarding, and (2) consider the waste as a resource for reuse/recycle at some other place and/or time and/or process. THE MUNICIPAL SOLID WASTE (MSW) GENERATION SCENARIO IN INDIA Range of MSW generated per head in India, varies from 0.2 kg/d in small cities to as high as 0.6 kg/d in metropolitan cities [1, 2, 3]. With increase in per capita income, average waste generation is expected to reach 0.5 kg/d to 1.0 kg/d of MSW per person by year 2030 [3]. Considering the current population of 120 crores, our country produces about 200 Gg of waste every day. With future increase in per capita waste generation or even at the current rate, waste management in coming years will be a burning issue in India. Type and relative proportion of various waste components of MSW are dependent on many factors such as: (1) size of city, (2) average life style and income of residents, (3) cultural practices, etc. Figure 1 and table 1 show, respectively, physical composition and chemical characteristics of MSW generated in various cities of India based on population. Table 1. Chemical Characteristics Of MSW In India (Values In %) [2] Population range (in million) Moisture Organic matter Nitrogen as Total Phosphoro-us as P2O5 C/N ratio Calorific value kcal/kg Nitrogen > Figure 1 shows average composition of MSW generated in India. It may be noted from table 1 and figure 1 that many components of MSW may be recycled directly or processed to produce a valuable product. Fig. 1. Average composition of MSW in India (source of data [2]) A. Current Practices of Handling MSW In many metropolitan cities, open, uncontrolled and poorly managed dumping is commonly practiced, giving rise to serious environmental degradation. More than 90% of MSW in cities and towns are directly disposed of on land in an unsatisfactory manner. In the majority of urban centers, MSW is disposed of by depositing it in low-lying areas outside the city without following the principles of sanitary landfilling. Compaction and leveling of waste and final covering by earth are rarely observed practices at most 220
![4 th TOPIC disposal sites, and these low-lying disposal sites are devoid of a leachate collection system or landfill gas monitoring and collection equipment [3, 4].](/docs-images/73/68916181/images/237-0.jpg "Thus, we need to revisit the MSW management and deal with each component of MSW individually to recover as much value as possible.")
237 4 th TOPIC disposal sites, and these low-lying disposal sites are devoid of a leachate collection system or landfill gas monitoring and collection equipment [3, 4]. Thus, we need to revisit the MSW management and deal with each component of MSW individually to recover as much value as possible. THE PHOSPHORUS CRISIS Phosphorus (P) is an element necessary for all life. Phosphorus is one of the three major nutrients required for plant growth: nitrogen (N), phosphorus (P), and potassium (K). Phosphorus is often a limiting nutrient in natural ecosystems, in which the supply of available phosphorus limits the size of the population possible in a given ecosystem [5]. Nitrogen is obtained from the air, but phosphorus and potassium must be mined. The world has enough potassium to last several centuries. However, readily available global supplies of phosphorus may start running out by the end of this century. By then our population may have reached a peak which is believed to be more than what the earth can sustainably feed [6]. It may be noted that there is no substitute for phosphorus in agriculture. Thus, once the existing phosphorous reserves are depleted, the growing global population, the increasing demand for phosphorus, the decreasing phosphorus supply, and rising fertilizer prices will lead to a massive global food security crisis [6]. A. The Global phosphorus cycle Like nitrogen, phosphorus cannot be recycled endlessly. The phosphorus cycle is much simpler than the nitrogen cycle because phosphorus lacks an atmospheric connection and is less subject to biological transformation. Land-applied phosphorus in form of fertilizer is much less mobile than nitrogen since the mineralized form (inorganic Phosphate) is easily adsorbed to soil particles. However, soils do not have infinite phosphate adsorption capacity and with long-term over-application, inorganic phosphates can eventually enter waterways even if soil erosion is controlled [7]. Soluble and absorbed phosphorus transferred to rivers and eventually to oceans, settles in the sediments. These settled sediments can only be mined after millions of years when the ocean beds are lifted due to tectonic uplift. What is more important is that input of phosphorus to oceans due to anthropogenic activities has increased at alarming rates in last 100 years and going to increase further for next 100 years [8]. B. Geo-political phosphorus crisis for India Just four countries -- Morocco, China, South Africa and Jordan -- control 80 percent of the world's reserves of usable phosphate. India, and Europe, on the other hand, has almost no reserves of their own, and they depend on imports to satisfy 90 percent of its demand. The soils in India and Brazil have either low phosphorus content or they release plant-usable phosphorus at a much slower rate than required [9]. Thus, we need to supplement soils with phosphorus fertilizers. Situation is going to be worse for India since its fertilizer consumption (see figure 2) and hence import bill is going to increase due to burgeoning population with global increase in prices of phosphorus bearing compounds. This will substantially increase the food prices. Fig. 2. Consumption of fertilizers in India [Source: 10] 221
238 4 th TOPIC The foregoing discussion reveals that: 1. Phosphorus is an essential nutrient and non-renewable mineral which is going to be depleted by the end of this century leading to a catastrophic food crisis all over the world. 2. To provide food to increasing population and knowing that soil is deficient in available phosphorus, India is going to need increasing quantities of fertilizers as time passes. Since India does not have substantial reserves of phosphorus, it has to meet its demand of fertilizers through import. With increasing prices of phosphorus fertilizers, this import will take away huge foreign exchange reserve. CENTRALISED SEWAGE TREATMENT SYSTEM (CSTS) In a CSTS, domestic sewage is collected from each house through a huge network of sewers and eventually conveyed to a central sewage treatment plant (STP). CSTS are normally provided in cities and a very small number of villages (where 70% population of the country lives) may have sewered system for sewage collection. Moreover, CSTS are costly and difficult to operate and maintain. A. Status of Sewage Treatment in India Out of about million liter per day of sewage generated, treatment capacity exists for only about million liter per day. Thus, there is a large gap between generation and treatment of wastewater in India. Even the treatment capacity existing is also not effectively utilized due to operation and maintenance problem. Operation and maintenance of existing treatment plants and sewage pumping stations is not satisfactory, as nearly 39% plants are not conforming to the general standards prescribed by Pollution Control Boards [11]. In a number of cities, the existing treatment capacity remains underutilized due to poor sewer networking while a huge flow of sewage is discharged without treatment in the same city. Discharge of untreated sewage to a water body leads to sever water pollution rendering the water body unfit for other beneficial uses such a drinking. Moreover, nutrients contained in treated or untreated sewage (since most of the CSTS in India do not have nutrient removal system in place) lead to eutrophication of receiving water body and gradually destroy its aquatic ecosystem. OPPORTUNITIES AT COMMUNITY LEVEL Foregoing discussions reveal that with increasing population, changing lifestyle, and inadequate resources for safe disposal of waste, MSW handling in India is going to be a daunting problem. Similarly, creating CSTS in rural parts of India and operating and maintaining them to desired effluent quality levels seem extremely difficult, economically. On the other hand, for almost similar reasons, India will be very adversely affected due to global phosphorous crisis in coming decades. Government machinery alone does not seem to be capable of handling these situations and hence authors see a huge opportunity for participation by community to solve these problems. The opportunities at community level are: 1. Reduction in waste quantity by recycling and/or reusing and/or processing waste to produce a valuable product, and 2. Treating domestic sewage using low-cost, decentralized, simple treatment methods preserving nutrients in treated wastewater. The treated wastewater may be used for irrigation thereby reducing freshwater and fertilizer demands. A. Recycling Options for MSW in India Table 2 shows various handling options for various components of MSW in India. It may be noted that at community level, almost everything that can be recycled such as glass, paper, metal, etc., are sold to scrape traders who in turn sell the waste to recyclers. As shown in figure 1; however, recyclable material represents only about 5% of total waste. However, about 42% of MSW consisting of compostable material is not managed well at individual levels. Compostable material is the most important component of MSW that is collected by door-to-door collection system in India and disposed in form of an open dump. A careful observation of table 1 shows that MSW contains some concentration of nitrogen (~0.65%) and phosphorus (~0.7%) which may be presumed to be contained in compostable material of MSW. Considering generation of tonnes of MSW per day, we are losing 0.7%x200000=1.4 Gg of P 2 O 5 and 0.65%x200000=1.3 Gg of nitrogen every day. This amounts to ~500 Gg of P 2 O 5 and ~470 Gg of nitrogen per year. 222
239 4 th TOPIC Table 2. Various Handling Options For Components Of Msw MSW component All possible handling option/s Possible handling option/s at community level Paper Recycling to make paper, landfilling, selling to scrap traders incineration, sell to scrap traders Metals Recycled to prepare metals objects, utensils, selling to scrap traders etc., landfilling, incineration, sell to scrap traders Glass Recycling/reuse, landfilling, sell to scrap selling to scrap traders traders Inerts (Construction Reuse in construction of roads, preparation of -- & demolition waste) Biodegradable material low-cost building materials, landfilling Bacterial composting, vermi-composting, biomethanation, incineration, landfilling Vermi-composting B. Vermicomposting Vermi-composting is a simple system that can convert organic biodegradable solid waste into a valuable fertilizer preserving nutrients contained in the waste. It improves soil conditions such as moisture-holding and cation-exchange capacities, and improves fertility of soil. Detailed procedure for developing a household VC unit may be found at [12, 13]. A treatment system such as VC employed at community level will reduce the quantity of MSW to be disposed to about half. Moreover, it will produce a valuable product that can be used as a fertilizer and thus reduce requirement of chemical fertilizers. C. Decentralized Sewage Treatment System (DSTS) The most important contaminants in domestic wastewater are human excreta and urine which are also sources of nutrients, organic matter, and pathogens. As mentioned earlier, rural parts of India hardly have any piped systems to collect and convey sewage. Also, most of the agricultural produce comes from rural parts that requires huge amount of water for irrigation and fertilizers. Thus, if domestic sewage in rural parts can be treated by decentralized low-cost sewage treatment systems, it will serve two purposes: 1) providing treated sewage for irrigation, and 2) providing nutrients in treated water thereby reducing requirement of chemical fertilizers. Table 3 shows concentration of nutrients contained in human excreta and urine and the nutrients required to grow 250 kg of cereals [14]. It may be seen that most of the nutrients required growing 250 kg cereals can be sourced from excreta and urine excreted by a human being in a year. Vermi-filtration (VFT) system for sewage treatment [15] VFT system consists of a tank filled with layers of different sizes of pebbles (larger at bottom, smaller at top) placed at the bottom of the tank to serve as a water collection and natural aeration system. At the top of pebbles, a sand layer followed by a layer of vermin-compost and garden soil (mixed in 35:65 proportions) is provided. 1 kg/cu.m of the top layer are released. The domestic sewage without any pre-treatment is sprinkled over the bed. While the wastewater percolates down, its organic matter is sorbed onto soil particles and bacteria present in the soil. Any insoluble organic particles and excess of bacteria are ingested by earthworms. Earthworms also maintain the porosity by their burrowing effect and keep the top soil layer aerated. Earthworms double in number in about 4-6 months time. Excess earthworms can be harvested and used as a cattle/poultry feed. Except some atmospheric loss of nitrogen due to some bacterial actions, almost all the important nutrients are preserved in the treated water. Earthworms are also found to selectively thrive on pathogenic microorganisms and thus, treated effluent contains much less number of pathogens that too can be easily killed by a simple system such as chlorination. Following advantages make VFT a unique DSTS. Efficient, low-cost, and easy-to-operate treatment system as compared to conventional systems (Activated sludge, Trickling filter, Upflow anaerobic sludge blanket, etc.) No sludge formation no follow up treatment required No foul odour since putrefying organic matter is ingested by worms 223
240 4 th TOPIC Table 3. The Fertilizer Equivalent Of Human Excreta [14] Nutrient, kg In urine (500 L/year) In faeces (50 L/year) Total, kg Required for 250 kg of cereals Nitrogen (N) Phosphorus (P) Potassium (K) CONCLUSION 1. Both MSW and domestic sewage contain significant concentrations of important nutrients like N, P, & K. Their currently employed methods of treatment/disposal (such as open dumping, filling low-lying areas, disposal of untreated sewage to rivers or other water bodies) lead to severe and irrecoverable environmental pollution. 2. Simple and inexpensive methods such as vermi-composting for household biodegradable solid waste and vermifiltration of sewage treatment must be propagated to handle these wastes in a sustainable way and recover their nutrient values. Earthworms based treatment systems are best suited for decentralized applications incurring much less installation and operational costs. REFERENCES [1]. Central Pollution Control Board (CPCB), Management of Municipal Solid Waste, New Delhi. [2]. Chatterjee, A. K., Water supply, waste disposal and Environmental Engineering, Khanna Publishers, New Delhi, [3]. Kaushal, R. K., Varghese, G. K., Chabukdhara, M., Municipal Solid Waste Management in India-Current State and Future Challenges: A Review, International Journal of Engineering Science and Technology, Vol. 4, pp , [4]. Sharholy, M., Ahmad, K., Mahmood, G., Trivedi, R.C., Municipal solid waste management in Indian cities A review, Waste Management, Vol. 28, pp , [5]. Morrigan T., Peak Phosphorus: A Potential Food Security Crisis, Global & International Studies, University of California, Santa Barbara, [6]. Vacari. D. A., Phosphorus Famine: The Threat to Our Food Supply, Scientific American, pp 38, Jun [7]. website browsed in Apr [8]. website browsed in Jan [9]. Smit et al., Phosphorus in agriculture: global resources, trends and developments, Report to the steering committee Technology assessment of the Ministry of Agriculture, Nature & Food quality, The Netherlands. [10]. website browsed in Jan [11]. Central Pollution Control Board (CPCB) Status of water supply, wastewater generation and treatment in Class-I cities & Class-II towns of India, Control of Urban Pollution Series: CUPS/ 70 / , India. [12]. Krishi Vigyan Kendra, Vermi-composting, Indian Council on Agriculture Research (ICAR), New Delhi, India [13]. Munroe, G., Manual of On Farm Vermicomposting and Vermiculture, Organic Agriculture Centre of Canada. [14]. Drangert, J-O., Fighting the urine blindness to provide more sanitation options, Water SA, Vol. 24, No 2, [15]. R. K. Sinha, G. Bharambe, U. Chaudhari, Sewage treatment by vermifiltration with synchronous treatment of sludge by earthworms: a low-cost sustainable technology over conventional systems with potential for decentralization, Environmentalist Vol. 28, pp ,
241 4 th TOPIC HYDROTHERMAL SYNTHESIS OF AG 3 PO 4 PHOTOCATALYST FOR PHENOL DECOMPOSITION UNDER VISIBLE LIGHT IRRADIATION Uyi Sulaeman 1, Eva Vatonah 1, Anung Riapanitra 1, Ponco Iswanto 1, Shu Yin 2, and Tsugio Sato 2 1 Department of Chemistry, Jenderal Soedirman University, Purwokerto, Indonesia 2 Institute of Multidisciplinary Research for Advanced Materials, Tohoku University, Japan uyi_sulaeman@yahoo.com ABSTRACT The Ag 3 PO 4 was synthesized by hydrothermal method using AgNO 3 and Na 2 HPO 4.12H 2 O as starting materials. The AgNO 3 and Na 2 HPO 4.12H 2 O were dissolved in water with differences of ph condition (ph 1, ph 7 and ph 11) using the addition of HNO 3 65% or NH 3 25%. The products were characterized using XRD, SEM and DRS. The photocatalytic activities were determined using phenol decomposition under LED lamps of visible light 445 nm (blue light). The body-centered cubic structure of Ag 3 PO 4 was successfully synthesized. The highest of the ph conditions the highest crystalline could be synthesized. The band gap energies of catalyst could be found at ev. The excellent photocatalytic activities of Ag 3 PO 4 could be obtained at the samples prepared under higher ph condition. Keywords: Ag 3 PO 4, hydrothermal, phenol, photocatalyst. INTRODUCTION Today, Indonesia has been facing the water resources quality degradation. The sources of water quality degradation primarily are caused by organic pollutant, e.g. phenol and phenolic compounds, which are toxic and harmful to living organisms [1,2]. Phenol and phenolic compounds are one of the most prevalent forms of organic chemical pollutants in industrial wastewaters [3]. They are found in aqueous effluents of petrochemical, oil refineries, pharmaceutical industries, coal conversion processes and phenolic resin [2-6]. The most widely used methods for phenol removal from aqueous solutions are biological method, adsorption, electrochemical and electrocoagulation method [4-8]. However, these methods have some problems such as high cost and low efficiency. To remove the phenol compound from the aqueous, the photocatalysis system is very promising due to high effective and the catalysts can be recycled more time. Since the crises energy and environmental problem will come soon, the photocatalysis system is very importance to utilize the sun light energy into clean environments. The researchers, today, focus on design a new catalyst which has excellent photocatalytic activity in visible light in order to harvest effectively sun light energy. Therefore, we can solve the environmental problem through the effective technology and low cost. Titanium dioxide is very widely used in photocatalysis for organic pollutant degradation [9]. However, titanium dioxide has a large band gap energy (3.2 ev) which limits the ability of photocatalytic under visible light or sunlight irradiation. One of the TiO 2 modifications, N-doped TiO 2, can increase the ability of catalytic in visible light [10], however the unstability of N-doped TiO 2 was observed due to a defect crystal formation (e.g. oxygen vacancy). To solve this problem, the alternative catalyst which has a high photocatalytic activity under visible light should be created. Recently, it was reported that the Ag 3 PO 4, one of the semiconductor materials showed the excellent photocatalytic activity under visible light irradiation [11]. The material can be easily synthesized using the ion-exchange method. It exhibits extremely high photooxidative capabilities for O 2 evolution from water and organic dye decomposition under visible-light irradiation. Therefore, this research will focus on design the Ag 3 PO 4 based photocatalyst for wastewater treatment. 225
242 4 th TOPIC To apply the photocatalysis system for organic pollutant degradation, we found the difficulties of separation technique between catalyst and solution in a suspension reactor after irradiation. The smaller of catalyst, the more difficulties could be found in separation, and it needed a filtration technique which is more expensive. Another method is immobilizing the catalyst into the substrate. However, their photocatalytic activities drastically decreased. Therefore, controlling the particle size using a hydrothermal method is very useful for selecting the particle size in a suspension reactor to get the easy separation. In these experiments, we found the significant result that the ph of the reaction solution in hydrothermal synthesis will affect the crystallinity, crystal size, morphology and photocatalytic activity. EXPERIMENTAL A. Synthesis The raw material of 4.5 mmol AgNO 3 and 1.5 mmol Na 2 HPO 4.12H 2 O were dissolved separately in 8 ml of de-ionized water at different phs (ph 1, ph 7 and ph 11) using the addition of HNO 3 65% and/or NH 3 25%. The two solutions were slowly mixed and then introduced into an autoclave and heated at 180 o C for 12 h. The products were washed with de-ionized water to remove any unreacted raw material. The yellow powders obtained were dried at 105 o C in air for 7 h. B. Characterization The products were characterized using x-ray diffraction (XRD) to determine the structure of catalysts. The morphology and particle size was investigated using scanning electron microscopy (SEM), and the band gap energies were analyzed using diffuse reflectance spectroscopy (DRS). The band gap energies were calculated using the direct band gap energies method [12]. C. Photocatalytic Evaluation Photocatalytic activity was investigated using the phenol decomposition rate. The 40 ml solution containing phenol of 20 mg/l in a beaker glass was added with 0.08 gram of Ag 3 PO 4 catalyst. The solution was irradiated using the visible LED lamp (2.5 Watt) of blue light (λ=445 nm) after balance at 1 hour. The distance of solution and lamp was kept at 10 cm. The reaction was carried out at room temperature. The sample was separated from the catalysis by centrifugation. The phenol concentration was measured every 1 hour using the amino antipyrine method with an UV-visible spectrophotometer. The reaction was analyzed using the pseudo first-order reaction [9]. The photocatalytic ability (P) was calculated by the following formula: P (( C0 Ct )/ C0) x100% (1) where C 0 is the initial concentration of phenol solution, which reached balance after 1 h and C t is the concentration of the phenol at the irradiation time [13]. 226 RESULTS AND DISCUSSION A. Structure, Morphology and Band gap energy of Ag 3 PO 4 Catalyst The materials of Ag 3 PO 4 were successfully synthesized using hydrothermal reaction. The XRD profile showed that the body centered cubic of Ag 3 PO 4 (JCPDS no ) could be obtained (Fig.1). No impurities were observed in XRD profile, indicating that the crystal was a single phase. With increasing solution ph in hydrothermal synthesis, the higher crystallinity of catalyst was observed. The intensity ratio of (110) and (200) diffractions in XRD profile is very important to understand the reactivity of the catalyst [14]. The intensity ratio of (110) and (200) diffractions could be calculated as 1.48 and 1.04 for the sample prepared in ph 7 and ph 11 solutions, respectively, while the intensity ratio of (110) and (200) diffractions in the sample prepared at ph 1 could not be observed due to the low crystallinity. The higher intensity ratio of (110) and (200) diffraction (1.48) indicated that these crystals were primarily composed of (110) crystalline planes, while the lower intensity ratio (1.04) indicated that these crystals are primarily composed of (100) crystalline planes. Bi and coworkers [14] found that the intensity ratio of 2.7 was observed in rhombic dodecahedrons of Ag 3 PO 4, while the intensity ratio of 0.52 was found in
243 Intensity (a.u.) th TOPIC cubes. The photocatalytic activity can be influenced by differences of the intensity ratio. The higher photocatalytic activity was observed in the higher intensity ratio of the rhombic dodecahedron. Table I: Characterization of catalyst Synthesis Intensity ratio of Condition diffraction (I 110 /I 200 ) Band gap energy (ev) Morphology Particle size (μm) ph rhombic 3-21 dodecahedron ph rhombic 7-15 dodecahedron ph sphere 6-14 Table II: photocatalytic ability of catalyst Synthesis Photocatalytic ability Condition after 4 h irradiation The rate constant of pseudo first order reaction (h -1 ) (%) ph ph ph (c) (b) (a) θ (degree) Fig.1 The XRD profile of Ag 3 PO 4 synthesized with hydrothermal reactions at different phs: ph 1 (a), ph 7 (b) and ph 11 (c). Fig. 2 showed that the morphology of Ag 3 PO 4 was changed gradually from the rhombic dodecahedral at ph 1 to sphere form at ph 11. The average particle sizes of Ag 3 PO 4 were 3-21 μm, 7-15 μm and 6-14 μm in diameter for the samples prepared at ph 1, 7 and 11, respectively (see Table I). The best size distribution could be observed for the sample prepared at ph 11. The wider range distribution of particle size could be observed for the sample prepared at ph 1, i.e., the smaller particles were a sphere around 3 μm in diameter, whereas the larger particles were rhombic dodecahedral around 20 μm. The smallest size particles were found at ph
. The absorption edges of all samples are lower than ~530 nm (Fig.3 (a)), indicating that the Ag 3 PO 4 absorbs the visible light.")
244 4 th TOPIC Fig.2 The SEM images of Ag 3 PO 4 synthesized with hydrothermal reactions at different phs: ph 1 (a), ph 7 (b) and ph 11 (c) with different magnifications. Fig.3 The DRS of Ag 3 PO 4 synthesized with hydrothermal reaction at ph 1, 7 and 11 (a) and the plot of (αhv) 2 vs. hv of the samples synthesized at ph 1, 7 and 11 (b). The absorption edges of all samples are lower than ~530 nm (Fig.3 (a)), indicating that the Ag 3 PO 4 absorbs the visible light. The band gap energy of the samples could be calculated based on the direct band gap energy [12]. The plots of (αhv) 2 versus photon energy hv, showed the linier curves, indicating a direct transition (Fig.3(b)). The band gap energy of 2.35 ev, 2.37 ev and 2.40 ev could be observed for the samples prepared at ph 1, ph 7 and ph 11, respectively (Table I). The decrease of direct band gap energy may be due to the effect of crystal size, i.e., the smaller size, the higher band gap energy. 228
245 Phenol (mg/l) 4 th TOPIC These small crystalline particles showed a blue shift in the absorption edge of the diffuse reflectance spectrum as shown in Fig.3(b). This is consistent with other results that the Ag 3 PO 4 with small particle size (1-2) showed the higher band gap energy of 2.43 [11]. It is new phenomena, because the blue shift effects were commonly found on nanocrystalline material [15]. The band gap energies of Ag 3 PO 4 synthesized through hydrothermal reaction in this experiment was lower than those of ion-exchange synthesis. The direct band gap energy of Ag 3 PO 4 synthesized with ion-exchange was 2.43 ev [11]. B. Photocatalytic Activity of Ag 3 PO 4 Fig.4 showed the removal of phenol using the photocatalysis reaction. To examine the photocatalytic activity, the photolysis and adsorption of phenol were investigated. There is no significant phenol removal in the photolysis without catalyst and adsorption, indicating that the blue LED cannot decompose the phenol, and Ag 3 PO 4 cannot significantly adsorb the phenol. All the Ag 3 PO 4 samples showed the excellent photocatalytic activity under blue LED irradiation of 2.5 Watt (Fig.4). It is very interesting, because the low intensity of irradiation resulted in high photocatalytic activity. The highest photocatalytic activity could be found for the sample prepared at ph 11, i.e., around 95.8 % of phenol were successfully oxidized (Table II) Photolysis Adsorption ph 1 ph 7 ph 11 5 dark light on Fig. 4. The photocatalytic activities of Ag 3 PO 4 synthesized with hydrothermal reaction at different phs under blue light irradiation: ph 1(a), ph 7 (b) and ph 11 (c) compared to photolysis and adsorption (for the sample prepared at ph 11) The reaction kinetics of phenol degradation was investigated using the pseudo first-order reaction [9] using the following equation: ln( / C0 ) kt (2) C t Time (h) where C 0 is the initial phenol concentration at zero time irradiation, C t is the phenol concentration after t hour irradiation, and k is the rate constant. The pseudo-first-order degradation rate constants were determined by regression analysis. The plot of -ln(c t /C 0 ) to t showed the linearity of the kinetic model with the values of r 2 are 0.96, 0.99 and 0.98 for the catalyst prepared at ph 1, ph 7 and ph 11, respectively, indicating that the reaction followed the pseudo first-order reaction. The rate constant of 0.47 h -1, 0.42 h -1 and 0.81h -1 could be observed for the catalyst prepared at ph 1, ph 7 and ph 11, respectively (Table II). The higher photocatalytic activity could be obtained for the sample with higher crystallinity, i.e., the sample prepared at ph 11 showed the highest photocatalytic activity. Other workers [14] showed that the higher photocatalytic activities could be observed in the higher intensity ratio of (110) and (200) diffractions. However, in our experiments, the sample prepared at ph 7 showed the higher ratio diffraction peak intensity ratio (1.48), but the lower photocatalytic activity compared with the sample prepared at ph 11 (1.04). It is supposed that the higher crystallinity of materials is the main reason why the photocatalytic activity of the catalyst prepared at ph 11 was the highest. The higher crystallinity, the higher photocatalytic activities, leading the degradation reaction between the adsorbed phenol molecules and photogenerated holes could proceed more rapidly under visible light irradiation. 229
246 4 th TOPIC CONCLUSION The Ag 3 PO 4 could be successfully synthesized by hydrothermal method using AgNO 3 and Na 2 HPO 4.12H 2 O as starting materials in acidic, neutral, and basic conditions (ph 1, ph 7 and ph 11). The highest solution ph resulted in the highest crystallinity of the product. The band gap energy of material could be found at ev. All samples of Ag 3 PO 4 have high photocatalytc activity for phenol decomposition under blue light irradiation. The excellent photocatalytic activities of Ag 3 PO 4 could be obtained from the samples prepared under higher ph conditions such as ph 11. ACKNOWLEDGMENT U. Sulaeman thanks to Mrs. Dyah Sulistyanti, Inorganic chemistry laboratory Jenderal Soedirman University, for assisting the phenol concentration determination using spectrophotometer and Mr. Edo Anugrah, Afiliasi Laboratory, Department of Chemistry, University of Indonesia for the characterization of materials using DRS (Diffuse reflectance spectroscopy).. REFERENCES [1] C. E. Paisio, E. Agostini, P. S. González, and M. L. Bertuzzi, Lethal and teratogenic effects of phenol on Bufo arenarum embryos, J. Hazard. Mater., vol. 167, pp , August [2] H.B. Senturk, D. Ozdes, A. Gundogdu, C. Duran, and M. Soylak, Removal of phenol from aqueous solutions by adsorption onto organomodified Tirebolu bentonite: Equilibrium, kinetic and thermodynamic study, J. Hazard. Mater., vol.172, pp , December [3] X. Qu, M. Tian, B. Liao, and A. Chen, Enhanced electrochemical treatment of phenolic pollutants by an effective adsorption and release process, Electrochim. Acta, vol. 55, pp , July [4] M. Caetano, C. Valderrama, A. Farran, and J. L. Cortina. 2009, Phenol removal from aqueous solution by adsorption and ion exchange mechanisms onto polymeric resins, J. Colloid Interface Sci. vol. 338, pp , October [5] M. A. Zazoulia, and M. Taghavi, Phenol removal from aqueous solutions by electrocoagulation technology using iron electrodes: effect of some variables, Proceeding of International Conference on Chemical and Material Engineering 2012, pp. SPE.02.1-SPE.02.5, Indonesia: Department of Chemical Engineering Diponegoro University, [6] R. Aravindhan, J.R. Rao, and B.U. Nair, Application of a chemically modified green macro alga as a biosorbent for phenol removal, J. Environ. Manage., vol. 90, pp , April [7] L. Djokic, T. Narancic, M. Biocanin, E. Saljnikov, E. Casey, B. Vasiljevic, and J. Nikodinovic-Runic. Phenol removal from four different natural soil types by Bacillus sp. PS11, Appl. Soil. Ecol., vol. 70, pp. 1-8, August [8] O. Abdelwahab, N.K. Amin, and E-S. Z. El-Ashtoukhy, Electrochemical removal of phenol from oil refinery wastewater, J. Hazard. Mater., vol. 163, pp , April [9] D. Dong, P. Li, X. Li, Q. Zhao, Y. Zhang, C. Jia, and P. Li, Investigation on the photocatalytic degradation of pyrene on soil surfaces using nanometer anatase TiO 2 under UV irradiation, J. Hazard. Mater., vol.174, pp , February [10] G. Yang, Z. Jiang, H. Shi, T.Xiao, and Z. Yan, Preparation of highly visible-light active N-doped TiO 2 photocatalyst, J. Mater. Chem., vol.20, pp , July [11] Z. Yi, J. Ye, N. Kikugawa, T. Kako, S. Ouyang, H. Stuart-Williams, H.Yang, J. Cao, W. Luo, Z. Li, Y. Liu, and R.L. Withers, An orthophosphate semiconductor with photooxidation properties under visible-light irradiation, Nat. Mater., vol. 9, pp , July [12] Y. Gao, Y. Masuda, and K. Koumoto, Band Gap Energy of SrTiO 3 Thin Film Prepared by the Liquid Phase Deposition Method, J. Korean. Ceram. Soc., vol. 40, pp , [13] M.A. Ahmed, Synthesis and structural features of mesoporous NiO/TiO 2 nanocomposites prepared by sol gel method for photodegradation of methylene blue dye, J. Photochem. Photobiol. A: Chem., vol. 238, pp , June
247 4 th TOPIC [14] Y. Bi, S. Ouyang, N. Umezawa, J. Cao, and J. Ye, Facet effect of single-crystalline Ag 3 PO 4 sub-microcrystals on photocatalytic properties, J. Am. Chem. Soc., vol. 133, pp , April [15] K.M.Reddy, S.V. Manorama, and A.R. Reddy, Bandgap studies on anatase titanium dioxide nanoparticles, Mater. Chem. Phys., vol. 78, pp , February
248 4 th TOPIC 232
249 5 th TOPIC
250
251 5 th TOPIC ENHANCING SOCIAL CAPITAL OF LOCAL CHICKEN FARMERS IN CIANJUR, WEST JAVA FOR SUSTAINABLE RURAL DEVELOPMENT Moch.Sugiarto Faculty of Animal Science, Univ,of Jenderal Soedirman, Indonesia ABSTRACT Local chicken with a name of Pelung has been developed and popularly known in Cianjur District, West Java. This chicken has been developing rural economic due to the uniqueness of its voice. This main purpose of this study was to analyze the level of social capital and relationship between some social and economic variables to the social capital. This was a descriptive-correlation survey study. The population of Pelung chicken farmers in Cianjur District was 898 persons and by a stratified random sampling technique, 227 farmers were chosen as respondents for this study. To measure level of social capital, a self designed questionnaire was developed to gather needed data. The findings indicated that there was a moderate level of social capital of Pelung chicken farmers in Cianjur District. Age, educational attainment of farmers, and number of poultry owned by farmers could act as important factors to enhance social capital of Pelung chicken farmers in Cianjur District. Keywords: Local chicken, social capital, age, educational attainment, number of chicken INTRODUCTION Issues of sustainable development become more important in strengthening the role of rural area for national development in Indonesia. To implement the rural development, it would not discuss on economic, technical, and environmental dimensions only but also mention on social area. Development and conservation of local chicken is another important issue in poultry development. One of several local chickens in Indonesia namely Pelung has been developed and popularly known in Cianjur District, West Java. Many people interested in Pelung chicken because the uniqueness of its voice (Nataamijaya, 2005). Based on data of Regional Statistic Bureau of Cianjur (2012), number of Pelung farmers reached 898 persons and number of chicken was heads. There was a worried among the farmers that Pelung chicken would be extinct for several next years. Therefore, the group/association (HIPPAPI) has important role in organizing farmers to facilitate transfer/exchange of information and develop relationship/connection with external stakeholders. Discussing or analyzing mutual connections of economic efficiency, environmental friendliness and social acceptance are in accordance with prevailing understanding of sustainable development (Charter, 2001). The area of social dimension in sustainable development becomes a critical factor since it is related with the way how the farmers perceived the trust, communication, interaction and network among them as it called social capital. Communities with high levels of social capital are able to act together collectively for achieving diverse common objectives (Krishna, 2003). These values would be able to influence the process and output of Pelung chicken development in Cianjur District. Social capital is an important issue beside financial capital for development of local chicken in Indonesia. Sugiarto and Oentoeng (2012) mentioned that social capital was able to improve income of local chicken farmers in Banjarnegara District, Indonesia. However, in Cianjur District with another kind of local chicken as namely Pelung Chicken has no significant information. The development of local chicken (Pelung) is targeted to improve economic performance of rural community. The dynamic of community, change of social and economic background of farmers has 235
252 5 th TOPIC influenced the social dimension of community. These changes would have relation in revenue or income generated by the farmers. One problem described above is how the dynamic/level social capital of Pelung chicken farmers in Cianjur District and what is the relationship between some social and economic characteristics of farmers to the level of social capital since it has important role to improve the income of farmers. This paper attempts to analyze the level of social capital and relationship between some social and economic variables to the social capital. MATERIALS AND METHODS The study was undertaken in Cianjur District, Indonesia which has large number of local chicken (Pelung) farmers. Information was collected from respondents using questionnaire. Data analysis was with the aid of both descriptive and inferential statistic like Spearman Rank Correlation. Sample size was obtained using stratified random sampling. 227 farmers were chosen as respondents for this study and stratified in three groups based population of Pelung chicken farmers. To measure level of social capital, some variables were observed (norms, networking and trust) using designed questionnaire. Validity test using Product Moment Correlation resulted in good instrument (p<0.05) and to compute reliability of the instrument using Cronbach s Alfa resulted in coefficient of 0.79; 0.73; and 0.81 respectively for trust, norms and network (p<0.05). Spearman rank correlation test was used to analyze relationship between social capital (dependent variable) and independent variables. Independent variables for this study were (1) age, (2) education attainment, (3) number of poultry owned, (4) farming experience, and (5) business status. RESULTS AND DISCUSSION 1. Respondents Characteristics The finding showed that the respondents had an average age of 39 years old (productive age), had passed the elementary school (basic literacy), had more than enough experience in Pelung farming (15 years) with range of 1 year to 42 years. The farmers has an average number of Pelung chicken was 15 heads. Majority of respondents (91.7%) of farmers > 126 per region. It depicted that zone III is a populated area of Pelung farmers. The data showed that educational attainment of farmers, business status, and number of poultry owned by farmers were significantly different among the three zones (p<0.05). Zone I consist of younger and more educated farmers, more members manage the farm as primary business, and have more number of poultry owned. Table 1. Personal Characteristics of Farmers Variables Minimum Maximum Mean Std. Deviation Age of farmers (Years) Educational Attainment (Years) Business Status Farming Experience (Years) Number of Poultry (Heads) Level of Social Capital. Social capital is a resource that is derived from the relationship among individuals, organizations, communities, or societies, and is considered a valuable asset. Putnam (1995) stated social capitals as main variables that enable people to act manage the Pelung farming as side business only, while their primary job is state employee, rice farmers, and traders. More detail information on respondents characteristics was presented in Table 1. The respondents were distributed in three zones which zone I consist of regions/sub districts with number of Pelung farmers < 70 persons per region, zone II has number of regions which having farmers range of persons/region and zone III with number in 236
253 5 th TOPIC cooperation with one another for achieving mutual benefits. The findings of research descriptively showed that respondents averagely have moderate level of social capital (average score = 118.6). Farmers have high trust among the members, while value of network and perception on norms were categorized moderate. The level of social capital is an important source to empower farmers in developing and sustaining Pelung farming. Trust among members becomes basic philosophy to operating relationship, transferring knowledge, exchange the information. Ariani (2012) stated that social capital is an important source because individuals work together more effectively and efficiently when they know one another, understand one another, and trust and identify with one another. Level of social capital was significantly different among the zones of Pelung production (p<0.05), and zone III with smaller number of Pelung farmers has the highest level of social capital. Various research studies have suggested that social capital is an important factor to improve life status of community. Establishing an active farmers group of Pelung chicken has supported value of trust, norms and network among the farmers. Each value has significant different (p<0.05) among the three zones. Different characteristics of group in each zone have caused different level of variables of social capital. Zone III which consist of members with large number of poultry, older of age, and lower educational attainment have the lowest level of social capital variables. Otherwise the farmers in zone I which have less than 15 heads of Pelung chicken, relatively younger and more educated has higher level of social capital. Bolino, Turnley, and Bloodgood (2002) mentioned that organizational behavior build social capital and contribute to the effective functioning of organizations. These dimensions of organizational behavior also enhance the relational dimension of social capital through the development of liking, trust, and identification among employees. The moderate level of social capital of Pelung farmers was also supported by existence of farmers group (HIPPAPI). Putnam (2000) argues that organization membership contributes to effective social collaboration, since associations instill in their members habits of cooperation, solidarity, and public-spiritedness. More detail information of social capital among the three different zones was mentioned in Table 2. Table 2. Comparison Variables of Social Capital among the Zones Cluster N Mean Rank Chi Square Trust * Total 277 Norms * Total 277 Network * Total 277 *Comparison is significant different 3. Major Variables Enhancing Social Capital. Spearman Rank Correlation Test was used to identify significant factors related to enhance social capital of Pelung farmers in Cianjur District. The findings have shown that level of social capital was related with age of farmers, educational attainment and number of poultry owned by farmers (p<0.05). These variables classified as important factors to enhance level of social capital of Pelung farmers in Cianjur. The social capital of farmers would increase along with increase number of age, additional educational attainment, and increase number of Pelung chicken. It is along with the statement of Glaeser et al. (2002) that smoothly and largely. The larger number of Pelung chicken owned by farmers has intervene farmers to explore more information and force them to interact and communicate with other farmers. The situations supported statement of Pennings et al (1998) that education, experience and knowledge are relevant characteristics of human capital which allow access, in general, to more business opportunities. 237
254 5 th TOPIC The association (HIPPAPI) has an important role to disseminate more information to farmers. There is a tied bounded between members and association. Having high solidarity and emotional tied with the group or association would get more information on farming technology. These arguments show that the role of farmers in cooperation and interaction with other identify relationship between individual social capital and the social characteristics to gain benefits from personal interactions in society. Increasing age of farmers would encourage the farmers to elaborate relationship with others. More experience of farmers to manage the Pelung chicken farm results in high interaction with other people. Educational attainment of Pelung farmers causes increasing self confidence and knowledge to communicate with other people. It is able to improve cooperation with the new group of farmers. Higher educational attainment would place the farmers have more knowledge and information so that they would able to cooperate with other people becoming more important to developing Pelung farming. Social capital is the goodwill available to individuals or groups that lies in the structure and content of the actors social relations. Its efforts flow from the information, influence and solidarity it makes available to the actor (Adler & Kwon, 2002). By having moderate social capital, the Pelung farmers in Cianjur District have no conflict in their association. Trust, norms, and cooperation exists and running well among the members. Group mechanism and routine meeting is obeyed by members and it enables them to coordinate activities. In this way, development of Pelung chicken in Cianjur District would sustain and increase population of Pelung chicken. CONCLUSIONS Based on the finding of this study, the following conclusions were drawn: 1. Level of social capital of Pelung chicken farmers in Cianjur District was categorized moderate since its elements such as trust, norms, and network of farmers were moderate. The social capital was better placed in regions or group which has number of members lesser than 70 persons. 2. Age of farmers, educational attainment of farmers, and number of poultry owned by farmers are significant and important factor to enhance social capital of Pelung chicken farmers in Cianjur District REFERENCES [1]. Adler, P. and Kwon, S Social capital: Prospects for a new concept. Academy of Management Review, 27. [2]. Ariani, W.D The Relationship between Social Capital, Organizational Citizenship Behaviors, and Individual Performance: An Empirical Study from Banking Industry in Indonesia. Journal of Management Research. Vol. 4, No. 2. [3]. Bolino, M. C., Turnley, W. H., & Bloodgood, J. M Citizenship Behavior and The Creation of Social Capital. Academy of Management Review, 27 (4) [4]. Carter, N The Politics Of The Environment Ideas, Activism, Policy, Cambridge University Press, UK. [5]. Glaeser, E., Laibson, D. and Sacerdote, B An economic approach to social capital. The Economic Journal, 112. [6]. Krishna, A Understanding, Measuring And Utilizing Social Capital: Clarifying Concepts And Presenting A Field Application From India. Capri Working Paper, 28 [7]. Nataamijaya, A.G Karakteristik Penampilan Pola Warna Bulu, Kulit, Sisik Kaki Dan Paruh Ayam Pelung Di Garut Dan Ayam Sentul Di Ciamis. Balai Pengkajian Dan Pengembangan Teknologi Pertanian. Bogor. Buletin Plasma Nutfah. Vol.11 No.1 : 1-5 [8]. Pennings, J., Lee, K. and Witteloostuijn, A Human capital, social capital, and firm dissolution. Academy Management Journal, 41. [9]. Putnam, R Bowling alone: America s declining social capital. Journal of Democracy
255 5 th TOPIC [10] Putnam, R., Bowling Alone: the collapse and revival of American community. Simon and. Schuster, New York. [11] Regional Bureau Statistics of Cianjur Cianjur in Numbers. Local Government of Cianjur.. [12] Sugiarto, M dan Oentoeng E.D Penguatan Nilai Nilai Modal Sosial untuk Meningkatkan. Kinerja Usaha Ayam Kampung di Kabupaten Banjarnegara. Prosiding Seminar Nasional Pengembangan Agribisnis Peternakan. Unsoed. Purwokerto. 239
256 5 th TOPIC 240
257 5 th TOPIC IN SITU BIOREMEDIATION OF GLYPHOSATE HERBICIDE USING TRICHODERMA VIRIDE STRAIN FRP 3 Novi Arfarita 1,2,4, Budi Prasetya 1,2, Yulia Nuraini 1,2 and Tsuyoshi Imai 3 1 Department of Soil, Agricultural Faculty, Brawijaya University, Malang, Indonesia 2 International Research Centre for the Management of Degraded and Mining Lands (IRC-MEDMIND), Malang, Indonesia 3 Division of Environmental Science and Engineering, Yamaguchi University, Yamaguchi, Japan 4 Faculty of Agrotechnology, Malang Islamic University, Malang, Indonesia arfarita@yahoo.com; medmind@ub.ac.id ABSTRACT Glyphosate (GP) is a broad-spectrum herbicide widely used in the world. In order to prevent the accumulation of glyphosate in soils, it is important to develop method for its rapid elimination after the weed treatment. In this study, we observed Trichoderma viride strain FRP3 capability for in situ bioremediation of glyphosatecontaminated soils on application dose and more than 10 years of application history of glyphosate herbicide. At the end of observation, the CFU of p3 was the highest with CFU of x 10 6 gr -1 soil. The CFU of p3 was corresponding to 45% higher than p2 (8.83 x 10 6 gr -1 soil). The CFU of p1 had 0.66 x 10 6 gr -1 soil, only 0.7 % and 0.4% corresponding to p2 and p3, respectively. Direct indicator of glyphosate degradation was determined using GC analysis. Within 7 days after Trichoderma viride strain FRP3 was introduced, glyphosate content of treated soil decreased. This fungal strain provided 48% (p2) and 70% (p3) of glyphosate degradation higher than indigenous soil microbial community (p1) within 28 days of application. Keywords: Bioremediation, Glyphosate Herbicide Survival, Trichoderma viride. INTRODUCTION Glyphosate (GP) is a broad-spectrum herbicide widely used in the world. It is applied to the leaves of plants to kill both broadleaf plants and grasses. The application of GP results in the yellowing and decay of leaves within 5 10 days (sometimes 30 days) caused by the breakdown of aromatic amino acids synthesis. The studies conducted at the initial stage of Roundup production by Monsanto Chemical Co. (USA) showed a relatively high GP degradation in the contaminated soils with a half-life period of degradation about 20 days (Rueppel et al., 1977). However, the 30-year application of the herbicide under different ecological conditions showed that GP persists in the contaminated soil for a longer time depending on soil type, processing technique, climatic conditions, and other factors (Cox, 1998). The occurrence of GP in the contaminated soils 2 years after application shows its ability to accumulate in soils and cause negative effects on human health and the environment (Eberbach, 1998). In order to prevent the accumulation of glyphosate in soils and ground water contamination, it is important to develop method for its rapid elimination after the weed treatment. Glyphosate s primary route of decomposition in the environment is through microbial degradation in soil. The available reference on the microbial degradation of glyphosate is widespread among bacteria and many strains of Pseudomonas (Moore et al., 1983; Penazola-Vasquez et al., 1995), Flavobacterium (Balthazor and Hallas, 1986), Agrobacterium (Wacket et al., 1987), Arthrobacter (Pipke et al., 1987), Bacillus (Hallas et al., 1988), Rhizobium (Liu et al., 1981) and Acromobacter (Ermakova et al., 2010). However, the study on the biodegradation of glyphosate by fungal species is lacking. Most fungi are robust organisms and are generally more tolerant to high concentrations of polluting chemicals than are bacteria, which explains why fungi have been investigated extensively since the mid-1980s for their bioremediation capacities. However, the species investigated have been primarily those studied extensively under laboratory conditions, which may not necessarily represent the ideal organisms for bioremediation (Gadd, 2001). 241
258 5 th TOPIC It has been known that the member of genus Trichoderma has wide range of economically useful features that have applications for multiple biotechnological uses, mainly in agriculture (Rajendiran et al., 2010, Shovan et al., 2008), industry and environmental biotechnology (Rai and Bridge, 2009). Currently, Trichoderma viride is commonly used for seed and soil treatment for suppression of various plant diseases caused by fungal pathogens. Trichoderma spp show ecological plasticity and a high enzymatic ability to degrade substrates. They are easily isolated, rapidly cultivated and very efficient to control a broad range of plant pathogens (Quiroz-Sarmiento et al., 2008). It also has been reported that Trichoderma viride could degrade herbicide such as trifluralin (Zayed et al., 1983) and bromoxynil (Askar et al., 2007). However, the report about the degradation of Trichoderma viride to glyphosate herbicide is lacking. In previous study (Arfarita et al., 2011), we selected Trichoderma sp. strain FRP3 because they had the highest ratio of growth diameter and this species has been widely used in agriculture application. This Trichoderma strain FRP3 has been identified and named as Trichoderma viride strain FRP3, based on morphology observation and also performed by 18S rrna gene amplification (Arfarita et al., 2013). In this present study, we observed Trichoderma viride strain FRP3 capability for in situ bioremediation of glyphosate-contaminated soils on application dose and more than 10 years of application history of glyphosate-herbicide. MATERIALS AND METHODS 1. Soil The site intended for our bioremediation study was a part of agriculture land in Batu, East Jawa, Indonesia. This area has a history of more than 10 years using Round Up with twice a year of glyphosate application and is located on 800 asl. Climatology situation of Batu has minimum temperature of 18-24ºC and maximum temperature of 28-32ºC. Its air humidity is 75-98% and the rainfall average is mm/year. The glyphosate content of soil in Malang (2009) was mg Kg -1. However, this data didn t point specific areas. Glyphosate content of soil treated in this study was mg Kg days after first herbicide spraying. The initial glyphosate content after 3 days second herbicide spraying was mg Kg Strain preparation Trichoderma viride strain FRP3 obtained from previous study was purified, cultivated on Potato Dextrose Agar (PDA) and incubated for 5 days at 30ºC for further study. To be introduced to soil, Trichoderma viride strain FRP3 was then cultivated for mass production. For mass production, jam bottles (250 ml) containing 100 gr of sterile rice husk was inoculated with five mycelial plugs (5 mm in diameter) of Trichoderma viride strain FRP3 taken from five days old cultures on PDA. Bottles were inoculated in aseptic condition and placed in incubator at 30ºC for 14 days. The conidia were harvested from 14 days old of cultivation media. The number of conidia per mg of cultivation media was determined by dilution method with the aid of a haemocytometer. 3. Field application The experiments were carried out on 1 1 m plots. Seven days after spraying of glyphosate herbicide, the plots were dug and loosened thoroughly to the depth of 30 cm; roots, plant debris, and other foreign inclusions were removed. Herbicide glyphosate was applied in the amount equivalent to field application 3 days before microbial application. Two blank soil plots with indigenous microorganisms served as control (non-contaminated soil) and p1 (GP-contaminated soil). The treatment plot of p2 and p3were introduced with conidia suspension of Trichoderma viride strain FRP3. Plot p2was introduced one time and p3 was introduced two times application. Conidia was harvested from two bottles of 242
259 5 th TOPIC cultivation media (26 x 10 9 conidia g -1 media), suspended in a volume of 5 L water and applied to each plot by drip method. The experiment was carried out on May-June. Soil samples were taken weekly through 28 days from the soil horizon of 0 20 cm by using a core auger tool with an inner diameter of 2 cm. The soil samples were taken from five different points of each plot, pooled and thoroughly mixed. Each averaged sample was analyzed at least in triplicate. At the end of the experiment, soil samples also were taken from the horizon of cm to estimate the herbicide mobility through the vertical soil profile. 4. Microbial analysis Serial dilutions of soil samples were inoculated on RBAC medium with 500 mg l 1 of GP using spread method, for counting viable cells of GP-degrading microorganisms in the soil population. In every week, the total amount of GP-degrading cells was determined. CFU (Colony Forming Unit) were determined after the incubation of agar plates at 27 С for 48 h. The CFU of GP-degrading microorganisms were calculated as the difference between the total amount GP-degrading cells in treatment plots and the amount of indigenous GP-degrading cells (Control); following this formula: p 1-3 Total CFU CFU Control. 5. Glyphosate content in soil samples Thexane-isopropanol extraction was used for the evaluation of the total GP content in soil samples. The soluble fraction of GP was determined after the aqueous extraction of soil samples. Ten grams of fresh soil were transferred to a 250 ml buffer bottle and 50 ml of a 3:1 (N- Hexane : Isopropanol) solvent was added. The flasks were put on a rotary shaker at 150 rpm and incubated in room temperature (±25ºC) for 2 hours. After shaking, the flasks were allowed to stand for overnight. Ten ml of aqueous solutions were then transferred to 25 ml weighing bottle, adjusted to a volume of 25 ml with deionized water and then mix well. The upper solution (5 ml) was used for total GP content measurement. GC Shimadzu 2010, equipped with a capillary columnrtx-1 (30 m 0.25 mm ID, 0.25-μm-thick film) and a nitrogen-phosphorus detector was employed. The chromatographic conditions used for the analysis of glyphosate residues were as follows: detector temperature was 300ºC; injector temperature was 150ºC; oven temperature program was 1.0 min at 100º C, 20K/min to 130C, 1 K/min to 133ºC, hold for 10.5 min, 20 K/min to 150ºC, hold for 2.0 min. The total run time was min. The injection volume was 5 μ l. N 2 was used as the carrier gas, maintained at constant flow rate of 0.3 ml/min. The approximate retention time of the glyphosate was 14.2 min. RESULTS AND DISCUSSION 1. Soil fungal communities under field conditions Four plots were observed for the existence of soil fungal communities under field conditions. The existence was determined using Colony Forming Unit. As initiation (Fig. 3.1a), where Trichoderma was applied, a large number of colonies of fungi was found. The CFUgr -1 soilof indigenous microorganisms (p1), one time introducing of Trichoderma viride strain FRP3 (p2) and two times introducing (p3) were 0.33 x 10 4, x 10 4 and x10 4 respectively. At the end of observation (Fig. 3.1b), the CFU of p3 was the highest with CFU of x 10 6 gr -1 soil. The CFU of p3 was corresponding to 45% higher than p2 (8.83 x 10 6 gr -1 soil). The CFU of p1 had 0.66 x 10 6 gr -1 soil, only 0.7 % and 0.4% corresponding to p2 and p3, respectively. It should be noted that the number of colonies present in units p2 and p3 was related to the amount of conidia suspension applied. Fig. 3.2 shows the significant increasing of soil fungal communities in every weeks of 28 days observation. The CFU of all plots were likely constant in first week and then increasing until at the end 243
260 CFU/ gr of soil (x104) CFU/ gr of soil (x104) CFU/ gr of soil (x104) 5 th TOPIC of observation, except p1 which decreasing after 3 weeks. Perhaps, in the first of glyphosate application caused the inhibition and toxic to soil microorganisms. It also had the possibility of microbial degradation process during first week after Trichoderma application. We recorded rain fall two times during second weeks, 7.4 and 8.4 mm. The rain fall volume could increase the soil moisture to support the fungal grow. (a) (b) p1 p2 p3 p1 p2 p3 plots , p p2 p p1 p2 p3 plots Fig The CFU of soil fungal communities as initiation (a) and at 28 days of observation (b) p 1 p 2 p Weeks Fig The existence and the increasing of soil fungal communities in plots p2 ( ), plots p3 ( ) and indigenous microorganisms ( ) in every weeks of 28 days observation. 2. Glyphosate content of soil samples In situ bioremediation experiment results were expressed on GP content shown in Fig. 3.3 which demonstrates that the GP biodegradation rate was maximal during the first week after introduction of Trichoderma viride strain FRP3. In the first week, GP content was decreasing significantly in the case of p2 and p3; by 37.8 mg kg -1 (56.8%) and by 36.5 mg kg -1 (53.4%), respectively. By the end of observation (28 days), the GP content of p3 decreased by 16 mg kg -1 (23.4%) and p3 decreased by 27.7 mg kg -1 (42.6%). From the third weeks, the GP content in the case of p2 higher than p3. This fungal strain provided 48% (p2) and 70% (p3) of glyphosate degradation higher than indigenous soil microbial community (p1) within 28 days of application. The GP content in this case was related to the amount of conidia suspension applied in the second week. Two times fungal introducing in the soil (p3) resulted the higher decreasing of GP content corresponding to p2. However, in the application we need to consider the labor efficiency and cost. 244
261 GP content (mg kg-1 of soil) 5 th TOPIC p1 p2 p Weeks Fig Glyposate contents during bioremediation process in 28 days of observation. CONCLUSIONS In this study, we observed Trichoderma viride strain FRP3 capability for in situ bioremediation of glyphosate- contaminated soils. Trichoderma viride strain FRP3 demonstrated high survival on field conditions with field application dose and more than 10 years of application history of glyphosate herbicide. At the end of observation, the CFU of p3 was the highest with CFU of x 10 6 gr -1 soil. The CFU of p3 was corresponding to 45% higher than p2 (8.83 x 10 6 gr -1 soil). The CFU of p1 had 0.66 x 10 6 gr -1 soil, only 0.7 % and 0.4% corresponding to p2 and p3, respectively. It should be noted that the number of colonies present in units p2 and p3 was related to the amount of conidia suspension applied. Direct indicator of glyphosate degradation was determined using GC analysis. Within 7 days after Trichoderma viride strain FRP3 was introduced, glyphosate content of treated soil decreased. Within 7 days, GP content was decreasing significantly in the case of p2 and p3. By the end of observation (28 days), the GP content of p3 decreased by 16 mg kg -1 (23.4%) and p3 decreased by 27.7 mg kg -1 (42.6%). This fungal strain provided 48% (p2) and 70% (p3) of glyphosate degradation higher than indigenous soil microbial community (p1) within 28 days of application. Trichoderma viride strain FRP3 has been widely used as biological control agent in agricultural. The treatment of soil with this fungal strain seems also useful on the area where this herbicide is extensively used. Therefore, this strain is suitable for the efficient, ecologically safe and rapid bioremediation of glyphosate-contaminated soils. REFERENCES [1]. Arfarita N. Imai T., Kanno A., Yarimizu T., Xiaofeng S., Jie W., Higuchi T. and Akada. (2013). The potential use of Trichoderma viride strain FRP3 in biodegradation of glyphosate herbicide, Biotechnology and Biotechnological Equipment 27(1), [2]. Arfarita N., Imai T., Kanno A., Higuchi T., Yamamoto K. and Sekine M. (2011). Screening of soil-born fungi from forest soil using glyphosate herbicide as the sole source of phosphorus, Journal of Water and Environment technology, 9(4), [3]. Askar A.I., Ibrahim G.H. and Osman K.A. (2007). Biodegradation kinetics of Bromoxynil as pollution control technology, Egyptian Journal of Aquatic Research, 33(3),
262 5 th TOPIC [4]. Balthazor T.M. and Hallas L.E. (1986). Glyphosate-degrading microorganisms from industrial activated sludge, Applied and Environmental Microbiology, 51(2), [5]. Cox C. (1998). Glyphosate (Roundup). J Pest Reform, 18, 3 17 [6]. Eberbach P.L. (1998). Applying non-steady-state compartmental analysis to investigate the simultaneous degradation of soluble and sorbed glyphosate (N (phosphonomethyl) glycine) in four soils.pestic. Sci., 52, [7]. Ermakova I.T., Kiseleva N.I., Shushkova T., Zharikov M., Zharikov G.A. and Leontievsky A.A. (2010). Bioremediation of glyphosate- contaminated soils, ApplMicrobiolbiotechnol, 88, [8]. Gadd, G.M. (2001). Fungi in bioremediation. Cambridge University Press, UK, [9]. Hallas L.E., Hahn E.M. andkorndorfer C. (1988). Characterization of microbial traits associated with glyphosate biodegradation in industrial activated sludge, Journal of Industrial Microbiology, 3, [10] Liu C.M., McLean P.A., Sookdeo C.C. and Cannon F.C. (1991). Degradation of the herbicide glyphosate by members of the family Rhizobiaceae, Appl. Environ.Microbiol, 57, [11] Moore J.K., Braymer H.G.and Larson A.D. (1983). Isolation of a Pseudomonas sp. which utilizes the phosphonate herbicide glyphosate, Applied and Environmental Microbiology, 46(2), [12] Penaloza-Vazquez A., Mena G.L., Herrera-Estrella L. and Bailey A.M. (1995). Cloning and Sequencing of the genes involved in glyphosate utilization by Pseudomonas pseudomallei, Appl. Environ. Microbiol, 61(2), [13] Pipke R., Amrhein N., Jacob G.S., Kishore G.M. and Schaefer J. (1987). Metabolism of glyphosate in an Arthrobacter sp. GLP-1, Eur J Biochem, 165, [14] Quiroz-Sarmiento, F.V. and Ferrera-Cerrato, R. (2008). Antagonismo in vitro de cepas de Aspergillusy Trichoderma haciahongos filamentosos queafectan al cultivodelajo. Revista Mexicana de Micología, 26, [15] Rai M. and Bridge P.D. (2009). Biotechnological aspects of Trichoderma spp. In: Applied Mycology, CAB International, London, UK, [16] Rajendiran R., Jegadeeshkumar D., Sureshkumar B.T.andNisha T. (2010). In vitro assessment of antagonistic activity of Trichoderma viride against post harvest pathogens, Journal of Agricultural Technology, 6(1), [17] Rueppel M., Brightwell B., Schaefer J., Marcel J. (1977). Metabolism and degradation of glyphosate in soil and water. J. Agric. Food Chem., 25, [18] Shovan L.R., Bhuiyan M. K. A., Begum J. A. and Pervez Z. (2008). In Vitro control of Colletotrichum dematium causing anthracnose of soybean by fungicides, plant extract andtrichoderma harzianum, Int. J. Sustain. Crop Prod, 3(3), 10-1 [19] Wacket L.P., Shames S.L., Venditti C.P. and Walsh C.T. (1987). Bacterial carbonphosphorus lyase: products, rates and regulation of phosphonic and phosphonic acid metabolism, J Bacteriol, 169, [20] Zayed S.M., Mostafa I.Y., Farghaly M.M, Attaby H.S., Adam Y.M. and Mahdi F.M. (1983). Microbial degradation of trifluralin by Aspergillus carneus, Fusarium oxysporum and Trichoderma viride,journal of Environmental Science and Health, Part B, 18(2),
263 5 th TOPIC A SUSTAINABLE SMALLHOLDER RUBBER MODEL: A PARTNERSHIP BETWEEN PRIVATE COMPANY AND LOCAL COMMUNITIES Muhammad Ridwansyah A Chairman of Economics and Development Studies at University of Jambi, Sumatera, Indonesia ABSTRACT The general objective of this paper is to describe a sustainable smallholder rubber model through a partnership between private company and local communities in rural area. The research was done in smallholder rubber area of Jambi Province. Data was collected by fulfilling the questionnaire, in-depth interview, observation, and documentation. Results of this research are showed that the model is focused on increasing the productivity by promoting private company and local communities partnership. In economic sector, implementation of the partnership will promote escalation of people s income and increasing job opportunity for family members. The model is expected for other places where want to develop the agribusiness of rubber. Key Words: agribusiness, local communities, private company. INTRODUCTION Indonesia has a large potency to develop cluster industry based on world s leading rubber commodity because it has supported resources both in term of supply and demand. From the demand side, there is an export increasing especially from China, India, Brazil and other countries with a high economic growth in Asia-Pacific for fulfilling raw material especially to support their automotive industry. Tety, E (2002) mentioned that about % Indonesia s rubber productions are used to fulfill export demands. Zuhri, S (2012) noted that the volume of rubber commodity exports in 2012 can afford to give US $ billions as the foreign exchange for this country. Therefore, the domestic market of Indonesia is also a large capital for developing industry based on rubber commodity. Then, from the supply side, as revealed by Sinceh Plantation (2012), rubber plantation area of Indonesia in 2009 has reached 3,435,417 ha with a total production about 2,440,346 tons. The number of farmers who involved in this rubber cultivation is about farmers. Employees who worked in the plantation are relatively cheap and abundant so Indonesia has higher comparative advantage if compared to Thailand which is now listed as the biggest rubber producer in the world. The main problem is the low productivity of rubber plantation which is only 994 kg/ha/year. These levels are lower than Thailand which reached 1,690 kg/ ha/year, Malaysia (1,430 kg/ ha/ year) and India (1,800 kg/ ha/ year). This is related to the characteristic of rubber plantation which 84.5 % is smallholder plantation and only 7.2 % owned by state company, and 8.3 % is private estates (Firmansyah, H., 2010). There are large smallholder rubber areas which getting old, damaged, and unproductive, it reached about ha that require rejuvenation (Agricultural Research and Development, 2010). The general objective of this paper is to describe a sustainable smallholder rubber model through a partnership between private company and local communities in rural area. While the specific objective is to design partnership model and development physic agribusiness of societies rubber through the corporation between private company and local communities. This paper is useful to formulate the benefit expectation which is derived by societies such as increasing of employment, income distribution, and poverty reduction in rural area. 247
264 5 th TOPIC REVIEW OF LITERATURE According Eriyatno (2003) model is defined as a representation or abstraction of an actual object or situation. Model shows the relationships as well as direct and indirect reciprocity in terms of causality. The model is an abstraction of reality so that its form is less complex than the reality itself. In line with Eriyatno, Dunn (2003) defines a model is a simple representation of the selected aspects of a condition problem which formed for specific purposes. The design of models, according to Quade (1982) is usually expressed in terms of the concept/theory, diagrams, graphs or equations mathematically. Research conducted by Emban (2012) about Hutan Tanaman Rakyat (HTR) development model with multiple rotation system. The results inform that HTR development with the system on 15 acres of land owned by household as the owner of Licensed Timber Utilization (IUPHHK) was fertility, and climate stability; Improving farmer s income. a. The Key Management: farmer groups; local communities and; Private company b. Related Institution: government/local government as the facilitator IPB (2011) using Interpretative Structural Modeling (ISM) method for analyzing the relationship between the elements that makes up the structure of Management Society Forest Plantation Model. ISM method is intended to identify key variables and driver power factors each elements and structure/hierarchy of element in the model. When formed the policy model, there are 5 key elements which is analyzed. They are: 1) Influential institutions; 2) the necessity of sustainable HTR development; 3) Goals; 4) The main obstacle; 5) The necessary activities. METHODOLOGY The data used in this study were collected through interviews, observation and literature review. Semistructured interviews conducted to the village government, administrators of society s organization, and the leaders of local government organizations units (SKPD) and also private company leader of plantation department as the community partners. Observation is done by direct observation on the object of study (farmer groups). Focused Group Discussion (FGD) was conducted with the member and officials of farmer groups to get the expectation to the private company. FGD is also used as model exploration phase to obtain qualitative information on the term of partnership and understanding between local communities and private company about partnership in developing smallholder rubber and the consent of both parties to forge a partnership in the development. Data analysis were done in descriptive quantitative which describing then giving expectation with rational interpretation. These can be explained, summarizing a variety of conditions, situations, or some of variables that occur in the object of this study. Conditions of the research object then synthesized in such a way as to raise the surface of the character or description of the condition and situation of the research object. 1. Model Design THE MODEL The partnership between Private Company and Local Communities is formulated as follows: Title: A sustainable smallholder rubber model through a partnership between Private Company and Local Communities in Village Forest Area of Jambi Province The Main Objectives: Improving the productivity of degraded forest; Improving employee opportunity and Business; Improving rubber production; Improving the farmer group capacity/corporation; Ensuring the raw material supply for crumb rubber industry; Improving local revenue; Maintaining hydrological function, ecological balance, soil. 248
265 5 th TOPIC 2. Model Description Model design is presented in APENDIX. Local Communities and private company make Memorandum of Understanding facilitated by local government which in this agreement will obeyed about Agribusiness system. On Sub System Input (SSI), the main case is resources allocation which private company will provide technology and better management, while local communities will provide planted land. Then, Sub System Production (SSP), private company has functions as operator and the partner of local communities in a partnership management. Private company has supported cost from Bank which allocated for developing modern plantation and processing as well as export financing. With the partnership model, management will be better. Furthermore private company will build crumb rubber as the place that can provide certain cost and accommodate farmer s cramb rubber so the farmers will get knowledge, protection, improving cramb rubber quality, and appropriate cramb rubber price and improving farmers welfare. In other hand, raw material supply for industrial requirement is more guaranteed and can improve the product quality. If the processed rubber better and domestic price is cheaper, it will improve processed rubber. 1. Conclusion CONCLUSION AND SUGGESTION 1) This model is intended to improve productivity and quality of smallholder rubber production with the main component is indigenous society to form the corporation and support Local Communities then doing partnership with Private Company. 2) This model can be implemented in other areas which will develop rubber agribusiness; improving forest farmers activities to encourage sustainable forest management. 3) In economic field, the partnership management will increase farmers income; improving employee opportunity for family members. 2. Suggestion 1) The site for the construction and development of rubber plantations should be done carefully with respect to the distribution of land that is not occupied by the public, as well as the availability of infrastructure to reach out to industry and market; 2) There needs to be limitation and confirmation for the chosen area specified for the construction and plantation development by the society which is stated in the agreement that can be justified; 3) Develop a suitable map for plantation area, including the suitability of the rubber trade; provide the guidelines or ordinances with the community; provide various forms of training or workshop to enhance the communities ability in development (including land clearing techniques) and plantation management (including pest and disease), as well as the marketing of forest plantations; and improving the institutional capacity through continuous mentoring. 249
266 5 th TOPIC APENDIX. Figure: Smallholder Rubber Model through Partnernship between Private Company and Local 250
267 5 th TOPIC REFERENCES [1]. Badan Penelitian dan Pengembangan Pertanian Keadaan Karet Industri di Indonesia. [2]. Dephut Dephut Alokasikan Lahan Hutan 5,4 Juta Hektar Untuk Usaha HTR dengan Dukungan Dana Reboisasi, Siaran Pers Nomor: S.51/II/PIK-1/2007, Tanggal 21 Februari Dephut, Jakarta [3]. Dunn, William Analisis Kebijakan Publik. Yogyakarta: Gajah Mada University Press. [4]. Emban dkk Model Pengembangunan Hutan Tanaman Rakyat Pola Mandiri Di Desa Bacu-Bacu Kabupaten Barru. Jurnal Hutan dan Masyarakat [5]. Emilia dan Suwito, Permasalahan Tenurial dan Reforma Agraria di Kawasan Hutan dalam Perspektif Masyarakat Sipil. Proceeding Roundtable Discussion, Bogor [6]. Emila dan Suwito Hutan Tanaman Rakyat (HTR): Agenda baru untuk pengentasan kemiskinan? Working Group on Forest Land Tenure - Warta Tenure Nomor 4 - Februari 2007 [7]. Eriyatno Ilmu Sistem: Meningkatkan Mutu dan Efektivitas Manajemen Jilid I. IPB Press. Bogor [8]. Firmansyah, Hilman Maju bersama UKM. Institut Pertanian Bogor, Model Konseptual Kebijakan. 0Konseptual%20Kebijakan.pdf?sequence=13 [9]. Sinceh Plantation Teknik Budidaya Tanaman Karet. Dimuat dalam Asosiasi Perkebunan Karet Rakyat [10]. Tety, Emy Penawaran dan Permintaan Karet Alam Indonesia di Pasar Domestik dan Internasional. Institut Pertanian Bogor. [11]. Zuhri, Sapudin Ekspor karet
268 5 th TOPIC 252
269 5 th TOPIC AGRICULTURAL MANPOWER DYNAMIC AND CHANGE OF ECONOMIC STRUCTURE IN CENTRAL JAVA Timotius Setiawan a civil servant at Vocational Training Center of Agriculture under the Department of Manpower, Transmigration and Demography of Central Java Province, Indonesia ABSTRACT Agriculture has taken an important role in Central Java economy, as its contribution into Gross Domestic Products (GDP). But its performance decreased as shown from the decreasing number of agricultural labor and contribution rate for economic growth in Central Java recently. Comparison with other economic sectors indicates that there is economic structure change in Central Java and it related with agricultural manpower conditions and problems. Educational and training institutions have strategic role to contribute for solving this conditions. Keywords: agricultural manpower, agricultural economy, educational and training institutions INTRODUCTION Agriculture has a very important role in Indonesia economic development. Besides providing food, agriculture also provides many job fields, supplies material for industry, contributes to Gross Domestic Product (GDP), and is a medium to reach food security (Aviliani, 2009). At the first quarter in 2013, agriculture sector contributed 30,097.6 billion rupiahs into Central Java GDP or 20.1% of all Central Java GDP (BPS, 2013). It shows that the sector has big share in Central Java economics. Because of the crucial role, many development experts said that if we want to develop Indonesia, develop its agriculture. But besides the crucial role, agriculture has many problems and heavy burden. The wage of agriculture labor is lower than other fields relatively. Agriculture sector has to receive 4.84 million people depend their life on this sector. And government s support to agriculture seems not as aggressive as its support to other sector, such as industrial and trading sector. The other worried thing is decreasing of young people s interest to agriculture. This could affect to food security, material supply to industries, and Central Java economic structure in the future. This review describes agriculture manpower condition in Central Java and its dynamic, also connects it with change of economic structure in Central Java in current time and future. Besides it, the role of educational and training institutions, such as vocational high school for agriculture, university which provide agriculture program, and vocational training institute for agriculture, are also reviewed in the context to solve agricultural manpower problems in Central Java. 253
270 Number of Labor (million) 5 th TOPIC * Year Agriculture Industry Trading Fig.1. Development of Labor Number in Agriculture, Industry, and Trading Sector during 2008-May 2013 (Source: BPS, 2013) MATERIAL AND METHOD This review used secondary data issued from the concerned authorities of economics and agriculture manpower statistic in Central Java represented by Bank of Indonesia and National Statistical Centre (Badan Pusat Statistic/BPS). The data was described and analyzed in the perspective of agriculture manpower and economic structure. The analysis was supported with other data related RESULTS AND DISCUSSION 1. Agricultural Manpower Conditions in Central Java One of production factors in agribusiness is manpower. Manpower plays an important role in determining agriculture production and productivity. Agricultural manpower is not only seen on quantity and production unit, but as subject who manage the business and make decision. Agricultural manpower quality and quantity will determine agriculture sector s performance. Figure 1 illustrates manpower condition in Central Java in period 2008 until first quarter It shows that the number of agriculture labor tends to decrease from 5.85 million labor in 2008 to 4.84 million labor in first quarter While the industry and trading sectors, the labor number tends to increase, where in 2008 the number is 2.78 million and 3.39 million, became 3.23 million and 3.64 million in early 2013 respectively. The graph indicates the decreasing of people interest to agriculture sector, and turn into industry and trading sector. It may caused by the agriculture characteristics which are more risk, more capital, longer return, and lower wages than other work fields. Other factors may cause is decreasing the number of old generation agriculture labor, which not accompanied by increasing the number of young generation agriculture labor. This will cause gap in the agriculture labor composition and undeveloped agriculture. According Supriyati (2010), the problems related the agriculture manpower are labor education level and young generation labor participation. With low education, farmers are lack of productivity and innovations, and they are easy to be pressed, such as in bargaining position. While, labor with high 254


.")


271 5 th TOPIC education are not interested to work field in agriculture because of the worst wage, risk, and image. And many of them who have high education are young labor. 2. The Impact of Agriculture Manpower Conditions to Central Java Economics In the micro context, to produce agriculture products we need production factors like land, manpower, and capital. The factors are managed with certain productivity and produce some products. This model could be applied in the macro context, which agriculture performance in a region determined by available land, agriculture manpower, and capital as production factors in that region, and three of them will determine productivity. The utilization of machine and other agriculture tools and infrastructures are represented by capital (farmers can buy machine, fertilizer, seed, etc. by capital). While technology determined by manpower who choose way, method, and other technology applied. Productivity also includes unpredictable factors, such as climate, pest, and etc. This model is a black box model. Although manpower is not the only production factors, but it influences agriculture and economic production and need to be considered. This is reasonable, considering the agricultural activities in Central Java dominated by labor intensive business and farmers act as the subject. With the decreasing of labor number, agriculture sector only contribute 0.2% to the economic growth at fourth quarter 2012 (Figure 2), while trading sector and industry sector contribute 2.0% and 1.5% respectively to economic growth in Central Java. Production Factors Agriculture Land Manpower Productivity Agriculture Production Capital Fig. 2. Relationship Model of Production Factors, Productivity, and Production in Agriculture Agriculture; 0.2 Mining and excavation; 0.1 Finance, Rental, Corporate Services; 0.4 Services; 0.8 Transportation and Communication; 0.4 Manufacture; 1.5 Trading, Hotel, and Restaurant; 2 Power, gas, and water; 0.1 Construction; 0.4 Fig. 3. Source of Economic Sector Growth in Central Java Province at Fourth Quarter 2012 (Source: Bank of Indonesia, 2013) 255
272 5 th TOPIC Decreasing of agriculture sector growth possibly caused by decreasing of agriculture manpower, because the decreasing of manpower will decrease number of agricultural activities and productivity, and decrease the demand of production input. This indication is showed by decreasing of fertilizer demand in Central Java during (Table 1). 3. Central Java Economic Structural Change in the Future Tendency of manpower turning, contribution to economy, and economic growth in Central Java from agriculture sector to trading and industry shows that there is change of economic structure from agricultural economy to industrial and trading economy. This condition could continue considering the complex problems occur in the agriculture sector whereas agriculture plays important role to prop food security for people and input supply for industries. If interest, quantity, quality of agriculture manpower still decrease continuously, and combine with agriculture land conversion, and government regulation not support and solve problems occur, these things may be happened: Industry and trading sector still growth, and dominated foreign investor and employer, while many local labor became employee and small reseller; Agriculture land convert into industrial, district and office area; Rural society change into urban society and dominated with labor; Agriculture production decrease significantly; Food price increase because lack of food security in this province; Agricultural innovation in limited land develop; Many agriculture area are took over by small people and foreign who has capital, technology, and able to catch opportunity. 4. Role of Educational and Training Institutions Central Java Province has potential agriculture resource. Moreover, agriculture could be solution for solving biggest problems in developments: unemployment and poverty. It because this sector absorbs many labors and if it managed well it will be profitable business. Bad image of agriculture and farmers condition caused by the low quality of agriculture manpower and it causes the low productivity and the weak bargaining power of farmer. Educational and training institutions, who establish agriculture program, have a strategic role in this situation. Development of agriculture quality manpower, combined with innovations which could change agriculture image, will make significant changes in agriculture growth and improvement. Table 1. Subsidized Fertilizer Demandin Central Java During No. Period Kind of Fertilizer (tons) Urea SP-36 ZA NPK Organic , , , , , * 206,971 43,070 51, ,200 46,440 *1 st quarter Source: Bank of Indonesia, 2013 Vocational High School for Agriculture could prepare ready-to-work manpower and entrepreneur in agriculture; university which establish agriculture program could prepare experts, innovators and entrepreneurs in agriculture; vocational training center for agriculture could prepare and improve manpower with agricultural competencies. It could be reach by developing curriculum oriented to create agricultural entrepreneurs. Business projects and business incubator need to be held for making students prepared in experience, not theoretical only. Cooperation with stake holders needs to be developed to support agricultural entrepreneur success. So, educational and training institutions not only make applicants to compete into limited job fields, but prepare agricultural entrepreneurs who will run the agriculture sector and economic in Central Java, even in Indonesia. 256
273 5 th TOPIC CONCLUSION Tendency of agriculture labor decreasing in Central Java in last 5 years shows the decreasing of people interest to agriculture sector. As one of agriculture production factor, the decreasing of labor caused agriculture contributed only 0.2% to Central Java economic growth. The changes of labor amount, contribution to economy, and economic growth in Central Java from agriculture to industrial and trading sector showed the change of economic structure in Central Java from agriculture economy into industrial and trading economy. This condition could affect agriculture production, food security and sovereignty, transitional land, social structure, culture, and land ownership in future. One way to fix this is to improve the condition of agriculture manpower. Agriculture manpower determines the amount and scale of agriculture business and also the productivity. Therefore, the way to improve production in agriculture is to create entrepreneurs and encourage innovations in agriculture. Education and training institutions in agriculture need to review their output and outcome so far. Directing the learning to create entrepreneur and applied innovation in agriculture will give significant impact to agriculture sector improvement. REFERENCES [1] Aviliani, Pengangguran dan Kemiskinan: Berdayakan Sektor Pertanian, in Jurnal Sekretariat Negara RI/No. 14/November 2009 [2] BPS, Kondisi Ketenagakerjaan Jawa Tengah, in Berita Resmi Statistik No.31 /05/33/Th.VII, 06 Mei 2013 [3] BPS, Pertumbuhan Ekonomi Jawa Tengah Triwulan I Tahun 2013, in Berita Resmi Statistik No.29/05/33/Th.VII, 6 Mei 2013 [4] Supriyati, Dinamika Ekonomi Ketenagakerjaan Pertanian: Permasalahan dan Kebijakan Strategis Pengembangan, in Analisis Kebijakan Pertanian Volume 8 No. 1, Maret 2010, pp [5] Kajian Ekonomi Regional Jawa Tengah Triwulan I 2013, Bank of Indonesia,
274 5 th TOPIC 258
275 5 th TOPIC HUMAN CAPITAL AND SURVIVAL OF SMALL SCALE FOOD PROCESSING FIRMS UNDER ECONOMIC CRISIS IN CENTRAL JAVA INDONESIA Palmarudi Mappigau 1 and Agussalim M 2 1 Sosial Economics Department Animal Husbandry Faculty Hasanuddin University of Makassar, Indonesia 2 Management Economic Department Ekasakti University of Padang, Indonesia, rudipal@yahoo.com ABSTRACT The objective of this study is to investigate the determine factors of the survival of small food processing firms during the economic crisis. As much as 102 small firms with traditional beef processing and preservation which produce Jerked beef and Beef Floss located in Central Java Indonesia were choosen as samples. Primary and secondary data have been collected in 2009 when the global economic crissis hit and analyzed using path analysis. This study concluded that; (a) human capital such as motivation and industrial experience in the same field have positive effect on entreprepreneur s competencies, adaptation strategy and survival of the firms. However, effect from the motivation tend to be larger than industrial experience; (b) Entrepreneur s competencies have positive effect on the adaptation strategy and survival of the firms. However, the contribution effect of the entrepreneurial competency tend to be larger than the managerial competency; (c) adaptation strategy has positive effect on the survival of the firms; and (d) human capital have effect on the survival of the firms through entreprenerur s competencies (entreprepreneurial and managerial competencies) and adaptation strategy. A better understanding of this finding will benefit the implication of the future research about the survival of small food processing firms under economic resession aspects. Also it will help policymaker in supporting improved competitiveness of the small food processing firms and improving human capital for SMEs entrepreneurs in Indonesian. Keyword. Human capital, entrepreneur, competency, adaptation strategy, survival, small food processing firm INTRODUCTION In Indonesia SMEs, especially small scale firms or enterprises, (including micro enterprises) have historically been the main players in the domestic economic activities. They take a big part as providers of employment opportunities and generators of primary or secondary resources of income for many households. On the other side, as a group, these enterprises have also become an important engine for the development of local economy and communities (Tambunan, 2008). Unfortunately, during the period of enermous economic growth between 1980s and early 1990s that reached 7-8% per year, the small enterprises were not given priority by the government. The discriminatory policy perceived related to the opportunities enjoyed by the larger enterprises (Berry, Rodriguez, and Sandee, 2001). However, those firms have a certain high level of endurance. This was proven during the economic crisis where most of the small firms for example, small food processing firms with traditional technology did more survive (Hickling, 2009; Widianto and Choesni, 1999, Akatiga dan Asia Foundation, 2000). The small traditional food processing firms were not only had a better chance to survive in economic crisis, but they played an important role to rural development in Indonesia by generating employment opportunities, reducing rural-urban migration and associated social problems, reducing post-harvest food losses and increasing food availability (Tambunan, 2006; Aworh, 2008). Many studies have explored the causes why the small scale food processing firms in Indonesia were able to survive under economic crisis condition (e.g. Tambunan, 2006, Sato, 2000; Widianto and 259
276 5 th TOPIC Choesni, 1999 Nikitin, 2003). Those studies show how the entrepreneurs used their human capital and competencies in order to survive under this kind of conditions. Empirically, research about human capital of entrepreneurs and survival of the small firm is still scarce (Teixeira, 2012). However, several studies focus on the effect of human capital on survival of the young small firm (start up phase) both in stable externals condition or under external shock conditions, while economic crisis has received limited research attention (Sriyani, 2010). In addition, contribution of human capital on survival of the small food processing firms in Indonesia under economics crisis is still not clear because of their entrepreneurial spirit are generally comes naturally as a talent accompanied by lower level of formal education and obtained lack of formal training. Furthermore, many researchers argue that entrepreneurs of small firm need to be competent in entrepreneurial and managerial roles and the proper allocation of these two competences is crucial to small firm survival (see, Beaulier, Hall and Mounts, 2008; Wen Wu, 2009; Inyang and Enuoh, 2009). However, the majority of studies about entrepreneurs' competencies have only focused the attention on the contribution of managerial competency (see, Silineviča, 2011; Peljhan, 2012) yet the entrepreneurial competency is neglected (Smith et.al., 2002). Therefore, no one has empirically examined the extent to which both entrepreneurial and managerial competencies used and developed by entrepreneurs related to the firm s survival in the economic crisis. The development of entrepreneurial competencies can be influenced by characteristics of the entrepreneurs themselves such as motivation and intention as well as experience (e.g. work experience outside the firm) (Vesala and Pyysiäinen, 2008; Segal, Borgia, and Schoenfeld,2009). Therefore, the development of these spesific human capital may help entrepreneurs in making strategic choices which can lead to the small firm survival in any of shock environments (Bruderl, Preisendorfer, and Ziegler, 1992; Hitt, et.al., 2001). However, only a few academic studies specifically explore the causes and consequences of strategic adaptation under recession conditions. There is a need to conduct a study about an adaptation to the environmental shocks/ jolts evidence (Kitching, Blackburn, and Smallbone, 2009). Some studies have linked organizational strategies with a new firm survival so that, there is insufficient systematic evidence on the relationship between human capital, entrepreneurial competencies, adaptation strategy and small firm survival under economic crisis condition (Fuller, et al.,1996; Baptista and Karaöz, 2006). STUDY OBJECTIVE The objectives of this study are to examine and analyze: whether the survival level of the small food processing firms under economic crisis is influenced by human capital of entrepreneurs (motivation at starting business and industrial experiences), both directly and indirectly through entrepreneur s competencies (entrepreneurial and managerial competencies) and adaptation of strategy as a medium. Theoretically, the result of this research is expected to enrich and complete the repertoire knowledge about the survival of the small firms and strategic management field especially in economic crisis condition. So, it can be useful for academics, practitioners and government. 260 REVIEW OF LITERATURE Indonesian experience with two big economic crises in the past 12 years, namely the 1997/98 Asian Financial Crisis and the 2008/09 Global Economic Crisis. Schmitt, Probst and Tushman (2010) based on a review of the literature dealing with the economic crisis, generally defined a crisis as an ambiguous situation that poses a major threat to organizational survival, where causes and effects are unknown, there is a little time to respond and requires decisions or judgments that will result a change for the better or the worse. Kitching, Smallbone and Xheneti (2009) point out that recessions are characterised by falling aggregate business sales and typically by downward pressure on asset prices which is enabling for resource acquisition. Recessions, therefore, providing small businesses with a major dilemma: to cut the cost in order to maintain survival in the short-run at the risk of reducing their capacity to adapt adequately when recovery comes; or, alternatively, to maintain greater capacity, incurring higher costs in the short-run, in order to retain the capability to realize opportunities for long-
277 5 th TOPIC term value creation when the upswing comes. Study by Central Bank of Indonesia in 2008 compared effects between the 1997 Asian Financial Crisis and the Global Financial Crisis on SME performance. In general, it appears that the Global Crisis gave more effect than the 1997 Asian Financial Crisis to the negative SMEs performance at the regional and national levels. For sector, it is known that sector of small-scale industry are relatively more resistant (survive) from the negative impact of the global crisis. Entrepreneur s competency is highly a critical factor in achieving excellence in performance to ensure survival of the SME by minimizing the negative effect of the challenging business environments such as economic crisis (Nakhata, 2007; Kochadai, 2011). Chandler and Jansen (1992) point out two important roles needed by entrepeneurs in order to be successful. They are entrepreneurial and managerial competence. The entrepreneurial competence is the ability to observe the environment to select promising opportunities and formulate strategies. On the other side, managerial competence needs conceptual, interpersonal and political skills, and technical competence which demands the founder to be skilled in the use of the tools or procedures required in their specialized field. According to Xiang Li (1975), the entrepreneurial and managerial competencies share roles and tasks in the organizations, particularly in small business or SMEs, where entrepreneurs need entreperenurial competency to identify business opportunities, build relationship with both suppliers and customers. They also need managerial competency to manage various functional areas in a firm in order to keep the firm operate efficiently. Sah and Goldstein (2006) argue that an adequate managerial competence are indispensable for survival of SMEs, but they are still in doubt to ensure it. They must be supported by entrepreneurial competence. Empirical studies show that spesific human capital such motivation of business intentions (see, Arribas and Vila, 2007; Ligthelm, 2010,) and specific industry experience (see, Dahlqvist, Davidsson, and Wiklund, 2000; Baptista and Karaöz, 2006) as factors that can influence the development of entrepreneurial competencies, and determines whether or not a business survive and prosper. Entrepreneurs have different motive to initiate and operate an enterprise, show different attitude and behaviour in order to survive (Majumdar, 2006). According to Davidsson, (1995) and Autio (1997), the prior experience have significant impact on the development of perceptions of the entrepreneurship and motivation in starting a business. In radical environmental changes, such as the economic crisis, the concept of dynamic capabilities may be helpful in developing a framework for understanding small firm behaviour, including their strategic adaptation under economic crisis conditions (Tushman and O Reilly, 1996). Fuller, et.al, (1996) based on the review literature, they argue that there are two mainstream schools of strategy : the positioning school and the resource-based view (RBV). Recent analysis have extended the RBV using the concept of dynamic capabilities to refer to the firm s ability to develop and extend resources and competences to adapt an environmental change (Eisenhardt and Martin, 2000; Teece, 2007). Several studies (i.e. Venkatraman and Prescott. 1990, Schindehutte and Morris, 2001) suggest that characteristics, competency and knowledge of the entrepreneur are important for the determinants of the adaptation and the strategies for adapting are related to the organizational performance. Dean, Brown and Bamford (1998) argued that SMEs are adept at pursuing strategies built on flexibility, strengths of speed and niche-filling capabilities. THE HYPOTHESIZED MODEL Based on the above literature review, hypothesis model in this study may construct a structure diagram as given in Fig
278 5 th TOPIC Figure 1: Hypothesized input structure diagram RESEARCH HIPHOTESIS (a) Human Capital has positive effects on the entreprepreneur s competencies Hypothesis 1-1 : Industrial experiences in the same field have positive effects on entrepreneur s motivation in starting business Hypothesis 1-2 Motivation and industrial experiences have positive effects on entreprepreneurial competency Hypothesis 1-2: Motivation and industrial experiences have positive effects on managerial competency (b) Human Capital has positive effects on the adaptation strategy Hypothesis 2-1: Motivation and industrial experiences have positive effects on adaptation strategy (c) Human Capital has positive effects on the survival of small food processing firm under economic crisis Hypothesis 3-1: Motivation and industrial experiences have positive effects on the survival of small food processing firms under economic crisis (d) Entrepreneur s Competencies has positive effects on the adaptation strategy Hypothesis 4-1: Entrepreneurial and managerial competencies have positive effects on adaptation strategy (e) Entrepreneur s competencies have positive effects on the survival of small food processing firms under economic crisis Hypothesis 5-1 : Entrepreneurial and managerial competencies have positive effects on the survival of small food processing firms under economic crisis (f) Adaptation strategy has positive effects on the survival of small food processing firms under economic crisis Hypothesis 5-1: Adaptation strategy has positive effects on the survival of small food processing firms under economic crisis (g) Human capital has positive effects on the survival of small food processing firms under economic crisis through entrepreneur s competencies (entrepreneurial and managerial competencies) and adaptation strategy. METHODOLOGY This study can be classified as an explanatory research, i.e. research that explains the causal relationship and examine the effect of several variables through the testing of the research hypotheses or explanations (Singarimbun, and Effendi, 1995). Primary data is a direct observation data made by researchers and obtained directly by interviewing the entrepreneurs (owner, manager), respondent samples using questionnaires. Secondary data were obtained from local government, ministry of cooperation and small medium enterprise development, direktorat general of industrial and trade and central biro of statistics. Sources of secondary data are written evidence (documentation), journals, reports from experts or researchers and institutions involved in the research. The study focused on small scale food processing firms in traditional of beef processing and preservation i.e. Jerked beef and Beef Floss located in Semarang district, Salatiga city, Boyolali 262
279 5 th TOPIC district, Surakarta city, Magelang district, Wonosobo district, and Purbalingga district of the Central Java of Indonesia. The jerked beef and beef floss which are produced by many small firms in Central Java are most popular and have been well known for a long time (Suryani et al, 2007). The population of small food processing firm which are producing Jerked beef and Beef Floss products are obtained from the Department of Industry and Trade of the Central Java Province (2008). The sample of the population was 102 firms with the number of 5-20 workers and has succesfully survived in the two big economic crises in Indonesia, namely the 1997/98 Asian financial Crisis and the 2008/09 Global Economic Crisis. Both Likert scale questions and dichotomous questions were used to elicit responses from the respondents. Human capital is individual specific and measured in starting business motivation (i.e, economic and non-economic reasons starting business), and industry experiences was the main field of previous work experience in the small food processing firms (i.e. production, sales, and administratif fields). Entrepreneurial competency is an entrepreneurial action which applied in the business operations under economic crisis which measured in personality traits: willingness to take calculated risks, locus of control, creativity, innovation, and opportunity recognition (measured ona 5-point Likert type scale with the anchors 1 = not agree and 5 = highly agree ). Managerial competency is the four management functional areas namely planning, organizing, motivating and evaluation practices which applied in their business operation under economic crisis (measured on a 5-point Likert type scale with the anchors 1 = not used at all and 5 = highly used ). Adaptation strategy is a specific way in which the firm makes adjustments as it seeks to survive and capitalize on economic crisis situations (Schindehutte and Morris, 2001). Adaptation strategy in this research was a response of small firms samples toward crisis that identified by Central Bank of Indonesia (2008), two categories of strategic action of small firms reacted to the recession: controlling costs/ efficiency strategy and creating new market strategy and measured the strategy to survive under economic crisis on a 5-point Likert type scale with the anchors 1 = not adopted at all and 5 = highly adopted. Firm s survival was the ability of the small firm to stay in a business over a long period of time, which measured in the perceptions of entrepreneurs about the probability of their firm in achieving a long term survival under global economic crisis (measured on a 5-point Likert type scale with the anchors 1 = pessimistic and 5 = highly optimistic ). Data analysis was analyzed using a Statistical Analysis Software. Statistical analysis includes descriptive statistics and path analysis. RESULT AND DISCUSSION The test results a reliability of the variables that make up human capital (8 items), entrepreneur s competencies (9 items), adaptation strategy (5 items), and survival of small scale food processing firms under economic crisis (3 items). Cronbach value of the entire items have minimum value 0,86 and maksimun value 0,94. Hence, the entire tests performed of the items are considered valid. Descriptive statistics of the entrepreneurs characteristic showed that a majority of the entrepreneurs in our sample were aged between 39 to 50 years old (56.96%), male (88.61%), having primary and secondary education background (62.28%), reason starting business to increase income (50.63%), having previous work experience on small scale food processing firms (92.40%). Related to the firm characteristics that has been operating for over 21 years (51.90%), making the upper and middle classes as a target market, (70.62%) using its own capital to finance the operations of the firm, (85.82%), using patterns of production depends on the order, (77.26%), using manual production techniques (86,.30 %). GOODNESS OF THE FIT MODEL The coefficient of determination of the model is (Table 1) which means that the model's ability to explain variation in the variable survival of the small sclae food processing firms amounted to 67.15%, while the remaining 32.85% is explained by other variables which are not included in the model. Furthermore, the results of the F test is < 5% (Table 1), which means that the model is feasible and can be used for further analysis. The causal model in its testable form presented in Figure

280 5 th TOPIC Figure 2. The Causal Model in its Testable Form The path analysis model above, which describes the relationship between dependent variable and independent variables, are hypothesized. A standardized structural equation can be expressed as follows: a. Structural equation for the first hypothesis : X1 = 0,330 X2 + 0,944 Є1. X1 = dependent variables of motivation, X2 = dependent variable of industrial experience; 0,330 X2 = path koeficient X2 to X1; 0,944 Є1 = path coeficient of error variable 1 b. Structural equation for the second hypothesis : X3 = 0,354 X1 + 0,151 X2 + 0,857 Є3; X3 = dependent variable of entrepeneurial competency, X1 = independent variable of motivation, X2 = independent variable of industry experience; 0,354 = path coeficient X1 to X3, 0,151 = path coeficient X2 to X3; 0,857 Є2 = path coeficient of error variable 3 c. Structural equation for the third hypothesis : X4 = 0,297 X1 + 0,390 X2 + 0,380 X3+ 0,581 Є3. X4 = dependent variable of managerial competency, X1 = independent variable of motivation, X2 = independent variable of industry experience, 0,297 = path coeficient X1 to X4; 0,581 Є3 = path coeficient of error variable 4. d. Structural equation for the fourth hypothesis : X5 = 0,512 X1 + 0,282 X2 + 0,526 X3 + 0,382 X4 +0,486 Є5. X5 = dependent variable of adaptation strategy, X4 = independent variable of managerial competency, X3 = independent variable of entrepreneurial competency, X2 = independent variable of industry experience, X1 = independent variable of motivation, 0,512 X1 = path coeficient X1 to X5; 0,282 X2 = path coeficient X2 to X5; 0,526 X3 = path coeficient X3 to X5; 0,382 X4= path coeficient X4 to X5; 0,486 Є4 = path coeficient of error variable 5. e. Structural equation for the fifth, sixth, seventh, and eighth hypothesis : X6 = 0,165X1 + 0,096 X2 + 0,407 X3 + 0,128 X4 + 0,585 X5 + 0,688 Є6. X6 = exogenous variable of survival firms under economic crisis, X5 = dependent variable of adaptation strategy, X4 = independent variable of managerial competency, X3 = independent variable of entrepreneurial competency, X2 = independent variable of industry experience, X1 = independent variable of 12 motivation, 0,165X1= path coeficient X1 to X6, 0,096 X2 = path coeficient X2 to X6; 0,407 X3= path coeficient X3 to X6;,128 X4 = path coeficient X4 to X6; 0,585 X5 = path coeficient X5 to X6; 0,688 Є4 = path coeficient of error variable
281 5 th TOPIC EFFECTS OF HUMAN CAPITAL ON ENTREPRENEURS COMPETENCIES Table 1 presents the result of path analysis of the industry experience effect in the same field on the start ups business motivation (Hypotheses 1.1). The result indicates that there is a positive significant effect of the industry experience in the same field (X2) on the entrepreneur.s motivation in starting business (X) (p = 2,437 < 0.05). This result describes that the work experiences of the entrepreneur in the small sclae food processing firm have motivated them for setting up a business in the same field. This finding supported by Huber (1991) and Wagner (2004) who state that individuals who have worked in small firms and in the same industry are more likely to engage in an entrepreneurship. Prior experience for starting a business may also be important in determining whether an individual feasible or capable to start a new enterprise. Dahl and Reichstein (2007) also argue that knowledge and experience in the same industry will motivate entrepreneurs to start-up a firm, because the knowledge and experience will help them to discover certain opportunities. Table 1 also presents the result of path analysis of the effect of human capital on the entrepreneurs. competency (Hypotheses 1.2 and 1.3). The result indicates that there is a positive significant effect of motivation (X1) on the entrepreneurial competency (X3) (p =2,834 <0.05) and managerial competency (X4) (p =2,562<0.05). Also, there is a positive significant effect of the industry experience (X2) on entrepreneurial competency (X3) (p = 1,741 <0.05) and managerial competency (X4) (p = 2,869 <0.05). This result describes that human capital such as motivation to start a new business and industry experience in the same field drives both entrepreneurial and managerial competency. This finding supported by Rose, Kumar and LiYen (2006) who state that entrepreneurs with a high motivation to start a business will further enhance and improve their management skills and embark in a continuous learning and development of their entreprepreneurial competency. Industrial working experience in the same field can help them with information and understanding about the managerial skill and also assist them improving their entrepreneurial competency. However, after calculating the total effect of each variable, it was found that the effect of motivation to the entrepreneurial and managerial competencies tend to be larger than effect of the industry experiences (0,348 vs 0,273, Table 2). It indicates that the competencies of entrepreneurs are apparently formed by motivation and less reliant on their previous industry knowlegde and skills experience. One potential reason for this result is that entrepreneurs from our sample are the people who started a firm naturally, their entrepreneurial mindset and attitude created by their cultural context such as hard working, dependency, social network, and strong commitment to achieve and maintain business success. It could be potentially drive them to seek and develop their competencies in order to make their firm able to survive and prospect. While, the previous skills and knowledge gained from industry experience such as working experience at small food processing firm only impact on the technical production side in running a business and less on management and entrepreneurship matters. This finding supported by Storey (1994) who argues that there is relatively a little empirical evidence that demonstrates that prior experience at start-up associated with future entrepreneurial activity and in a subsequent enterprise. Politis and Gabrielsson (2009) conducted study from Swedish entrepreneurs and found that motivation seem to have developed cognitive skills that facilitate the development of entrepreneurial mindsets, while prior management experience provides the opportunity to cultivate functional management skills. Table 1 also presents the result of path analysis of the effect of human capital on the entrepreneurs. competency (Hypotheses 1.2 and 1.3). The result indicates that there is a positive significant effect of motivation (X1) on the entrepreneurial competency (X3) (p =2,834 <0.05) and managerial competency (X4) (p =2,562<0.05). Also, there is a positive significant effect of the industry experience (X2) on entrepreneurial competency (X3) (p = 1,741 <0.05) and managerial competency (X4) (p = 2,869 <0.05). This result describes that human capital such as motivation to start a new business and industry experience in the same field drives both entrepreneurial and managerial competency. This finding supported by Rose, Kumar and LiYen (2006) who state that entrepreneurs with a high motivation to start a business will further enhance and improve their management skills and embark in a continuous learning and development of their entrepreneurial competency. Industrial working experience in the same field can help them with information and understanding about the managerial skill and also assist them improving their entrepreneurial competency. However, after calculating the 265
282 5 th TOPIC total effect of each variable, it was found that the effect of motivation to the entrepreneurial and managerial competencies tend to be larger than effect of the industry experiences (0,348 vs 0,273, Table 2). It indicates that the competencies of entrepreneurs are apparently formed by motivation and less reliant on their previous industry knowledge and skills experience. One potential reason for this result is that entrepreneurs from our sample are the people who started a firm with a talent, their entrepreneurial mindset and attitude created by their cultural context such as hard working, dependency, social network, and strong commitment to achieve and maintain business success. It could be potentially drive them to seek and develop their competencies in order to make their firm able to survive and prospect. While, the previous skills and knowledge gained from industry experience such as working experience at small food processing firm only impact on the technical production side in running a business and less on management and entrepreneurship matters. This finding supported by Storey (1994) who argues that there is relatively a little empirical evidence that demonstrates that prior experience at start-up associated with future entrepreneurial activity and in a subsequent enterprise. Politis and Gabrielsson (2009) conducted study from Swedish entrepreneurs and found that motivation seem to have developed cognitive skills that facilitate the development of entrepreneurial mindsets, while prior management experience provides the opportunity to cultivate functional management skills. THE EFFECT OF HUMAN CAPITAL ON ADAPTATION STRATEGY Table 1 presents the results of path analysis of the effect of human capital on apatation strategy (Hypotheses 2). The result indicates that there is significant positive effect of motivation (X1) on the adapatation strategy (X5) (p =4,493 <0.05). Also, there is positive significant effect of the industry working experience (X2) (p =2.271 < 0.05). This result describes that entrepreneur with a high starting business motivation and industry experience in the same field will enhance their knowledge, skill and vision to develop formulation strategy to survive under economic crisis. Majumdar (2011) conducted a study on strategic activity in small organisations and found that the formulation strategy to survive and growth is driven by the vision and motivation of the entrepreneurs themselves. Silineviča (2011) conducted study on strategic management in small business enterprises under economic crisis in Latvia found that the existence of the development strategy adaptation depends on personel motivation and work experience of managers. However, after calculating the total effect of each variable, it was found that the effect of motivation to adaptation strategy tend to be larger than effect of the industry experence (0,613 vs 0,576, Table 2). It indicates that the decision to adopt the adaptation strategy is apparently built by motivation and less reliant on their previous industrial knowledge and experience. The possible reason for this result is that the entrepreneurs from our sample had an industrial experience as profesional in production field. Thus, their knowledge and skill gained from experience may not benefit for decision makin and implementing adaptation strategy to adapt in an economic crisis situation. However, because they have never got the attention and support from the government at that time, they become motivated to work hard, full dedication and commitment, initiative and creative in finding the right strategy to keep his business and operation despite the difficult economic conditions. In connection with this finding, Verreynne (2005) conducted a study on small firms in New Zealand and concluded that an adaptation strategy of the small firm driven by the firm s responsiveness to its stakeholders, i.e. suggestions from, for example customers and suppliers. 266
283 5 th TOPIC THE EFFECT OF HUMAN CAPITAL ON THE SURVIVAL FIRM Table 1 presents the results of path analysis of the effect human capital on the survival firms (Hypotheses 3). The result indicates that there is a significant positive effect of motivation (X1) on the survival of small scale food processing firms under economic crisis (X6) (p =2.143<0.05), and also there is a positive significant effect on industry experience (X2) (p =1.800<0.05). This result describes that the background of the start-ups will enhance the probability of the firms to survive under economic crisis, because of the background of the start ups will support entrepreneurs to discover better solution to survive under economic crissis condition. This finding supported by Baron (2004) who argues that various individual experiences support the development abilities in using analogies, adeptness of signal detection and recognizing and framing current problematic situations to solve problems and find the solutions. Dahl and Reichstein (2007) empirically found that motivation and specific industrial experience in the same field positively affect the survival of a new firm. Silineviča (2011) explores the survival opportunities of the small firms in Latgale region and found that the existence of the development strategy depends on work experiences of managers and motivation should be main promotive factors. Lussiers an Pfeifer (2001) empirically found that human capital of individual entrepreneurs plays an important role to their successful. His study found that entrepreneur with industrial experience and start up business motivation has a greater chance to success than others with minimal industrial experience and less motivation. Study of entrepreneurial human capital determinants of small firm survival in Portugues, Baptista and Karaöz (2006) found that motivation factors significantly influence the chances of survival in the short term; for the business owners who started the firms out of its necessity, or as a refuge from unemployment, industry-specific experience that merely contributes significantly to enhance survival probabilities. However, after calculating the total effect of each variable, it was found that the effects of motivation to a survival firm tend to be larger than effects of the industry experience (0,731 vs 0,611, Table 2). It can be said that if the entrepreneur s reasons for starting the business originated from economic driven motives such as the desire to increase income rather than non economic driven motives such as unemployment then, the enterprise is more likely to survive. The economic motivation from the entrepreneurs seems to be better motive for effectively handling obstacles and uncertainties associated with the economic crisis, such as finding financial, building and having access to customer and supplier. Liedham (2010) empirically found that human factor, particularly start up motivation is a part from the inside of the owner/ manager to achieve the desired survival and growth potential. The other reason for the positive effect of human capital on the survival small food processing firm may also related with the length of time that the sample firms have been operating, which majority of the firms in this research have been operating for more than 21 years. THE EFFECT OF ENTREPRENEUR S COMPETENCIES ON ADAPTATION STRATEGY Table 1 presents the results of path analysis of the effect Entrepreneur s Competencies on adaptation strategy (Hypotheses 4). The result indicates that there is a significant positive effect of the entrepreneurial competency (X3) and managerial competency (X4) on the adaptation strategy (X5) (p =4,636 <0.05 and p =3,90<0.05). This result has described that under turbulent and uncertain environment such economic crisis, the entrepreneurs used both their entrepreneurial competency and managerial competency in choosing and implementing a strategy to adapt through controlling costs or efficiency and creating new market. This finding supported by Neneh and Vanzyl (2012) who conducted a study on SMEs in south Africa. They found that for the entrepreneurs who have an entrepreneurial competency and managerial competency have a high strategic decision making abilities. However, after calculating the total effect of each variable, it was found that the effect of entrepreneurial competency to adaptation strategy tend to be larger than ffect of the managerial competency (0,422 vs, 0,146, Table 2). The possible reason is that the entrepreneurs of our sample lack of management skills because they have lower levels of education and never got management training. So that, they often develop and implement astrategy based solely on experience and intuition. Majumdar (2011) conducted study on growth planning in small organization as entrepreneurial as well as strategic activity and concluded that the strategic formulation to survive and growth is driven by the vision and motivation of the entrepreneurs. Also the motivation of the entrepreneur governs the attitude and decision on survive and growth. According to Wiklund (1999) that entrepreneurial competence plays an influential role in organizational capability (strategy) because the entrepreneurial 267
284 5 th TOPIC competency related with perception or beliefs about the environment which are likely to affect the firm.s formation of strategy. Woods and Joyce (2003) argue that small entrepreneurial firms often used intuition in developing strategy. Thus, their success lay on the reality that confirming the intuitions about the opportunities (and that it seeks to exploit by virtue of flexibility). Gibbons and O.Connor (2005) conducted a study on Irish SMEs concluded that the entrepreneurs did not have adequate understanding of strategic management terms and were less equipped by strategic management tools. The possible reasons were centralised decision making by the entrepreneur or difficulty in prioritizing the development of their managerial skills. Morris, Altman and Pitt (1999) identified entrepreneurial competency (personality trait) to adapt in an environment, and concluded that personality traits as risk taking, innovative, internal locus of control, innovate, recognize opportunity are associated with the tolerance for ambiguity and self-esteem that affect ability or willingness to adapt in an environment. Moreover, Schindehutte and Morris (2001) who examined the concept of adaptation as it relates to the start-up and survival of small businesses over time, found that entrepreneurial competency and levels of environmental change are especially important determinants of the three components of adaptation: the firm.s capacity to adapt, how much it actually adapts, and the strategies it relies upon to adapt. Those levels and strategies for adapting are related to the organizational performance. THE EFFECT OF ENTREPENEURS COMPETENCY ON FIRM SURVIVAL Table 1 presents the results of path analysis of the effect entrepreneur s competencies on the survival of small food processing firms under economic crisis (Hypotheses 5). The result indicates that there is a significant positive effect of entrepreneurial competency (X3) and managerial competency (X4) on the survival of small scale food processing firm under economic crisis (X6) (p =3,266<0.05 and p = 1,977<0.05). This result has illustrated that under turbulent and uncertain environment such economic crisis, the entrepreneurs use both their entrepreneurial competency and managerial competency to survive. This finding supported by Neneh and Vanzyl (2012) who conducted a study on SMEs in South Africa and found that combination of factors of entrepreneurial competency (entrepreneurial mindset and characteristics) and managerial competency (business practices) have a strong positive relationship with the business survival. Ligthelm (2010) conducted study on small scale firms in South Africa also found that entrepreneurial acumen and business management skills classified as the strongest predictors of small business survival. However, after calculating the total effect of each variable, it was found that the effect of entrepreneurial competency to the survival of small scale firm tend to be larger than effect of the managerial competency (0,606 vs 0,240, Table 2). Sánchez (2012) empirically also indicate that entrepreneurial competency plays an influential role in organizational capability and competitive scope and also has a direct effect on the firm performance. Then, Smith et.al., (2003) who studied small firm in the United Kingdom, expolored the relationship between managerial competencies and entrepreneurial competency, and sales growth performance. The result of this study is the entrepeneurial competency was associated positively with the probability that a firm would be a high growth type. THE EFFECT OF ADAPTATION STRATEGY ON FIRM SURVIVAL Table 1 presents the results of path analysis of the effect adaptation strategy on the survival of the small firm (Hypotheses 6). The result indicates that there is significant positive effect of adaptation strategi (X5) on the survival of small scale food processing firms under economic crisis (X6) (p =5,188<0.05). This result has illustrate that under turbulent and uncertain environment such economic crisis, adaptation strategy with controlling costs/ efficiency and creating new market were essential for small scalefood processing firm to survive. Olusola (2012) conducted study on strategic entrepreneurial skills that needed a better performance of SMEs operating in Nigeria and found that strategic skill has impacts on the firm performance: improved sales, better management efficiency, service delivery and increased profit, customer satisfaction and sustainability in manufacturing industry. Neneh and Vanzyl (2012) conducted a study on SMEs in South Africa, and found that for entrepreneurs who have high strategic decision making abilities demonstrate a high probability in achieving a long term survival. Sánchez (2012) found that organizational capabilities affects the firm 268
285 5 th TOPIC performance positively and it partially mediates the relationship between the entrepreneurial competence and the firm performance. DIRECT AND INDIRECT EFFECTS OF HUMAN CAPITAL ON SURVIVAL OF SMALL SCALE FIRMS Tabel 2 clearly depicts that the three variables related with human capital have significant indirect effect on the survival of small scale food processing firms, i.e entrepreneurial competency, managerial competency and adaptation strategy. Especially, entrepreneurial competency variable give its significant indirect effect through four paths and the total effect is Among the different paths, the greatest indirect effect comes through path X3 via X5 to X6 The effect of these variable is 0.308, implying the increase of entrepreneurial competency and having skill and understanding in implementing adaptation strategy tools lead to enhance a high probability of the small scale food processing firms in achieving a long term survival under economic crisis condition. Entrialgo, Fernandez, and Vazquez (2000), empirically found that entrepreneurial competency (personality traits) such as locus of control, risk taking, and recognizing opportunity 21 influenced the business success directly and the business process indirectly. The second highest significant indirect effect coming from path X3 via X4 and X5 to X6. Its effect is 0.085, implying that the increase of both entrepreneurial competency and managerial competency lead to an enhancing skill and understanding of the strategic management terms and will more equipped with strategic adaptation tools. Finally, the small scale food processing firms could achieve the long term survival under economic crisis condition. CONCLUSION This study has attempted to examine the determinants of the survival of small scale food processing firms under global economic crisis, focusing particularly on the effect of spesific human capital, entrepreneur s competencies and adaptation strategy on the survival of firms both directly and indirectly. Using path analysis, therefore, it can be concluded that ; (a) human capital (spesific human capital) namely motivation start ups and industry experience in the same field have positive effects on the entrepreneurial competency, managerial competency and adaptation strategy toward the survival of the firms. However, the contribution effect of motivation tend to be larger than industry experience; (b) Entrepreneur s competencies have positive effects on the adaptation strategy and the survival of the firms. However, contribution effect of the entrepreneurial competency tend to be larger than managerial experience; (c) adaptation strategy has positive effect on the survival of firms; and (d) human capital have effects on the survival of the firms through entreprenerur s competencies (entreprepreneurial and managerial competencies) and adaptation strategy. LIMITATIONS OF THE STUDY AND IMPLICATION Empirical study presented here were small scale food processing firms with sample firms which producing tradional Jerked beef and Beef Floss located in central Java and the ability to generate the issues of the survival of small food processing firms undder economic crisis is still limited. Next stages of the study will further investigate across different traditional processing food products and other region and coutries in Indonesia. In addition, this study is a cross sectional quantitatif study involving entrepreneur s competencies and adapting strategy as moderating or intervening variables. In improving this study, it is important to conduct a longitudinal quantitative and qualitative studies including more moderating variable such as social capital and competitiveness. Furthermore, this study is important to enrich theory about the entrepreneurial human capital, management strategic and survival firms. Also, it will help entrepreneurs to enhance their ability in operating the small scale firms successfully. To increase the entrepreneur s human capital and competencies, the government need to provide supporting policy to develop competitiveness of the small scale food processing firms and improving human resources development through intensive training on entrepreneurship and management strategic. 269
286 5 th TOPIC REFERENCES [1] Abdul, S.M.M. and Yuzliani Yusop, Y., Impact of Personal Qualities and Management Skills of Entrepreneurs on Venture Performance in Malaysia: Opportunity Recognition skills as a Mediating Factor, Technovation, Vol.29 (11) : Asian Foundation and AKATIGA. (1999). The impact of economic crisis on Indonesian small medium enterprises. Jakarta: Japan International Cooperation Agency. [2] Aliouat, B Managerial Practises and Core Competences of Entrepreneurs : A Contingency Framwork of performance : fusionmx.babson.edu/.../fer/.../xxvii_c.html [3] Arribas, I., and Vila, J.E., Human Capital Determinants of the Survival of Entrepreneurial Service Firms in Spain. International Entrepreneurship and Management Journal, Vol. 3 (3) : [4] Aworh, O.C., The Role of Traditional Food Processing Technologies In National Development: the West African Experience : Using Food Science and Technology to Improve Nutrition and Promote National Development, Robertson,G.L. and Lupien,J.R. (Eds), International Union of Food Science and Technology [5] Baptista, R and Karaoz, M, Entrepreneurial Human Capital and the Early Survival Chances of New Start-ups: Opportunitybased vs. Necessity-based Entrepreneurship, Small Business Economics, 36 : [6] Baron, R. A The Cognitive Perspective: a Valuable Tool for Answering Entrepreneurship's Basic "why" Questions. Journal of Business Venturing 19(2) : [7] Becker, G. S. (1993). Human Capital: A Theoretical and Empirical Analysis with Special Reference to Education (3rd Ed.). Chicago: University of Chicago Press. [8] Berry, A., Rodriguez, E. & Sandee, H. 2001, Small and Medium Enterprises Dynamics in Indonesia., Bulletin of Indonesian Economic Studies, vol. 37 (3) : [9] Central Bank of Indonesia (BI), Quick Survey on The Impact of The Global Financial Crisis and Economic Sector Selected in Central Java, [10] Davidsson, P. and Honig, B. (2003).The Role of Social and Human Capital Among Nascent Entrepreneurs, Journal of Business Venturing,Vol. 18(3), [11] Department of Industry and Trade of The Central Java Province, The Data of Formal Small Industrial Enterprises in Central Java Province, Industrial and Trade Offices of Central java, Indonesia [12] Eisenhardt, K,M. and Martin, J.A Dybanic Capabilkities : What Are They? Strategic Management Journal Strat. Mgmt. J., 21: [13] Entrialgo, M. Fernandez, E and Vazquez, C. J Psychological Characteristics and Process: the Role of Entrepreneurship in Spanish SMEs. European Journal of Innovation Management, Vol. 3(3) : [14] Huber, G Organizational Learning: the Contributing Processes and the Literatures,.Organization Science, Vol. 2 (1): [15] Hicling, Poverty Reduction through Developing Micro, Small and Medium Enterprises THE Pro-Poor Planning and Budgeting Project, Working Paper No. 1, Bappenas, Jakarta June 2008 [16] Ibrahim, A.B., McGuire, J. And Soufani, K An Empirical Investigation of Factors Contributing to Longevity of Small Family Firms Global Economy & Finance Journal Vol. 2 (2) : 1-21 [17] Kitching, J., Smallbone, D. and Xheneti, M., Have Small Businesses Beaten the Recession?, paper presented at the 32nd ISBE 2009 Annual Conference, Liverpool, 4-6 November [18] Ligthelm, A.A Entrepreneurship and small business Sustainability, Southern African Business Review Vol. 14 (3) : [19] Mengistae, T., Competition and Entrepreneurs. Human Capital in Small Business Longevity and Growth, Journal of Development Studies, Vol. 42 (5) : [20] Nakhata, C The Effects of Human Capital and Entrepreneurial Competencies on the Career Success of SME Entrepreneurs in Thailand, The Business Review, Cambridge Vol
287 5 th TOPIC (1) : Table 1. Path Analysis Effect Human Capital on the Survival of Small Food Processinf Firm Under Economic Crisis in Indonesia Struktur Path Direct Effect Counted t. t.table Parameter Koeficient (%) X2 terhadap X1 0,350 12,25 2,437* X1 terhadap X3 0,354 12,53 2,834* X1 terhadap X4 0,297 8,82 2,562* X2 terhadap X3 0,151 2,28 1,741* X2 terhadap X4 0,390 15,21 2,869 * X1 terhadap X5 0,512 26,01 4,493* X2 terhadap X5 0,282 7, * X1 terhadap X6 0,165 2, * X2 terhadap X6 0,096 0, * X3 terhadap X5 0,526 27,67 4,636* X4 terhadap X5 0,382 14,59 3,90* X3 terhadap X6 0,407 16,56 3,266* X4 terhadap X6 0,128 1,64 1, X5 terhadap X6 0,585 34,22 5, Counted F F.Table R2 X6 (X5..X1) 0,819 67,15 28,91 * 2.31 Residu path ,85 Notes : *Significant P < 0,05 271
288 5 th TOPIC Table. 2. The Decomposition of Effects of the Human Capital on Survival Small Food Processing Firms Under Economic Crisis in to Direct and Indirect Effects 272
289 5 th TOPIC 273
290 5 th TOPIC 274
291 5 th TOPIC IMPACT OF CLIMATE CHANGE ON HYDROLOGY OF GUNUNGSEWU KARST AREA AND LOCAL COMMUNITY ADAPTATION Sudarmadji Department of Environmental Geography, Faculty of Geography, Gadjah Mada University, Indonesia ABSTRACK The research was conducted in the karst area of Gunungkidul, Indonesia. As most of the area consist of limestone, Gunungsewu karst area is often suffering from drought even though it is located in the tropical area. Most of the people living in the area using water from spring and karst lake as water supply for their daily needs. However, in the last few decades, water availability from the karst lakes and springs tended to decrease due to the impact of the climate change. This study aims to: 1) observe the changes of climatologic condition and its effect to the hydrological condition of the area, 2) analyze the human activities and adaptation due to the climatic changes. Data were collected by field observations and interviewing local residents. Climatic data, especially those on air temperature, were collected from climatologic stations within the area. Hydrological data, such as data on lakes and springs, were collected from the local authority. Climate change in the research area was characterized with increasing air temperature, while monthly rainfall tended to reduce. Spring discharge tends to decrease. Karst lake used for water supply sources have also depleted much faster than usual. The use of springs was prioritized for domestic and agricultural water. Springs conservation has been done, both at the location where the spring water come out and the catchment area of the springs. Management of the springs has been done both in groups or individually. Maintenance of the area around the lake was also done by conserving trees around the karst lake, and managing the use of lake water. It was also found that the level of education and understanding the environment affect the community participation to the environmental management. Keywords: climatic change, hydrology, local community adaptation, karst lake, karst springs INTRODUCTION Climate change has been widely known to affect water resources and availability throughout the world (Burroughs 2007). It can cause change in hydrological condition in an area (Kementrian Negara Lingkungan Hidup 2007; Kabat and Bates 2009). Flood hazard is predicted to occur more frequent due to increase of rainfall and resulting high runoff (Desonie 2008). In the other hand, climate change is predicted to cause the increase of temperature, therefore evapotranspiration can also increase markedly (Burroughs 2007). The hydrological process and hydrologic cycle therefore become the prior objects to be effected by climate change. It has been understood that climate change have been occuring over the world and has so many impacts on the environment. This situation also have been observed in the Gunungkidul area, where the water resources is relatively limited (Adji and Nurjani 1999). Due to the limited water resources in the area, people in the area tends to use water resource as efficiently as possible. The area that often suffering from drought may experience higher impact due to climate change. This paper presents the hydrological situation and hydrological change of the water resource in the area, mainly lake and spring on the area, and explore the local community adaption to the situation. In the Gunungsewu karst area, water is extremely valuable resource (Sudarmadji et al and 2009). Water for daily used can be obtained from rain, spring, and lake. In contrast, water from river is almost unavailable. The rivers in the area are found as underground rivers. The underground rivers are basically difficult to access because of high cost in hard to lift water from such location. To obtain water from the rain, water collector or water tank are needed; they have 275
292 5 th TOPIC various shapes and sizes, and are placed on the next or in front of the house. The water obtained from springs can be gathered by foot toward the source, and then taken to the house if not used directly in there. Lake water is used for various purposes, it is usually used for bathing, washing and bathing cattle. Some peoples also take the water home for their daily usage. Either rain springs or lake water is limited in quantity, especially during the dry season. In terms of quality, there are also various limitations. Water from the springs may contains some coli form bacteria and a relatively high level of hardness, making it unsafe for health, especially when the water treatment is not done properly (Adji 1995). Lake water has a poorer quality because of high coli form bacteria and relatively high turbidity. Nevertheless, in the unfavorable circumstances, the community in the region was able to adapt to this condition. The local people have felt that there have been increasing summer temperatures and uncertainty. Water scarcity will increase, and therefore the local people require adaptation to the changing conditions as driven by climate change. Adaptation will be associated with the local culture, particularly to the way of community implementing the water resource management (Kuntowidjoyo 1987; Soetrisno 1995; Adelila 1998; Ritohardoyo 2003). STUDY AREA The study covered two districts as sample of the Gunungkidul Karst Area. Those two districts were namely Panggang and Saptosari (Figure 1). More specifically, the study was conducted in the area where people using water for daily usage in the form of springs, groundwater, rivers and lakes (Sudarmadji et al. 2010). 1. Climate Annual rainfall in the Panggang district is 1982 mm, whereas annual rainfall in the Saptosari district is 1827 mm. Analysis of temperature data obtained from the Year monthly temperature is shown in Table 1. The average monthly temperature was 25.2 C. with a monthly average maximum temperature of 26.1 C in October and the lowest monthly mean temperature of 24.5 C in August. The average air temperature was 25.8 o C at Saptosari District; with the highest monthly average temperature of 26.5 o in May and the lowest monthly mean temperature of 25.2 C in August. Table 1. Monthly Air Temperature of Panggang and Saptosari Districts Temp ( o C) N o District Jan Feb Mar Apr Ma y Jun Jul Aug t Panggan g Saptosari Oct No v Averag Dec e

293 5 th TOPIC Fig.1. The Study Area 2. Hydrology, and Land use In the study area, the karst topography is dominated by hill karst landforms and karst alluvial plains. Hill karst landforms have major processes such as soil erosion, which causes the soil layer to have a thinner one. This is in contrast to alluvial karst. The region has the dominant form of precipitation that has a relatively thick soil. This causes potential cultivation only occurring in alluvial karst landforms. Hydrology of the study area is controlled by the properties of soluble rocks, thus it forming passageways with small size (diffuse), moderate (fissure) and large (Conduit) (White 1988). This leads to dry conditions at the surface and a lot of water in the subsurface (underground river). Therefore, it is in areas with karst topography not found the flow of surface (river), or usually classified in multi-basinal flow patterns (Haryono and Adji 2004). Water sources used in both of the district consist of rainwater, ponds, springs and underground streams. Rainwater is collected using rainwater tank. Lake is a small lake formed by the negative formation from clay sediment (MacDonalds and Partner 1984). A lot of lakes are found in Panggang and Saptosari District. In addition, the springs also have an important role in the water supply system in karst area. However, in Saptosari District, spring was not found, exept those of underground river in Ngobaran. Some springs were found in Panggang District, in which people use for domestic and agricultural water supply. Land use in Panggang and Saptosari is dominated by dry land cultivation. This condition is caused by the absence of surface water. Rain-fed cultivation is still possible with only one time in a year, and then switched to crops and fallow. However, the vast rain fed in both districts is only found at small portion of the area. 277

294 5 th TOPIC METHODOLOGY The Karst Gunungsewu, Gunungkidul district was selected as the study area, however only two districts, they are Saptosari District and Panggang District were selected as sample area. Site selection has been considered to represent Karst Area of Gunungsewu. The study mainly concerned on field observation, besides collecting and analyses data from interviewing local community. Climate data including precipitation, air temperature, and humidity has been collected from stations located in the district of Gunungkidul. Hydrological data, such as data on lake and springs were documented during field work, besides gathering secondary data from local authority. Observation in the field was done to inventory water resources characteristics as well as to observe people activities in using and maintaining water resources sustainability. Interview, the interview method used is a structured interview with the respondent by using the questionnaire as a guide. Besides interview was conducted to obtain information more clearly and deeply about the existence and participation of the community effort to preserve water resources that are directly useful for their daily lives. In-depth interviews were also committed against community leaders and local officials to determine the policies and activities that have been initiated by the local government in the conservation of water resources in order to support domestic activity and public for the community. RESULT AND DISCUSSION Karst area of Gunungkidul District of Yogyakarta, is characterized by an area having critically water resources. This area is suffering from drought, especially during dry season. However, people may have some water from springs for domestic water supply, in which evenly distributed over the area. 1. Evidence of Climate Change a.trends of Air Temperature Observation of climatological data in the area covers the air temperature and rainfall in the adjacent stations. The air temperature was estimated using Mock method. Figure 3 shows the air temperature in the whole Gunungkidul Regency. Air temperature trend in the study area is presented in Fig.2 to Fig. 5. Based on those Figures one can state that the annual minimum air temperature in the study experienced a rising trend, if viewed from baseline temperature rise remains visible. At baseline the minimum temperature was recorded at 21.8 C and at the end of the study was recorded at 22.5 o C. Fig. 2. Montly Air Temperature of Gunungsewu Karst Area

295 5 th TOPIC Fig. 3. Annual Minimum Air Temperature of Gunungsewu Karst Area Fig.4. Averaga Annual Air Temperature of Gunungsewu Karst Area Fig.5. Annual Maximum Air Temperature of Gunungkidul Karst Area 279

296 5 th TOPIC Based on Fig. 5, the trend of average air temperature of the study area for 30 years has shown. There is an increasing trend of air temperature by 1.4 C or C / year. It is quite large, because the world atmospheric temperature has increased by 0.15 C over the last 10 years or C / year. The increase in air temperature in the study area is greater than the world atmospheric temperature increases, so it can be concluded that in the study area can be said to have been an increase in air temperature as part of climate change. Since 1976 until 2005, the maximum temperature showed an increasing condition. When compared to the early years to the end of the study, air temperature difference of 1.2 C over 30 years (34.1 C to 35.3 C) or an increase of 0.04 C/yr has been identified. The analysis conducted on the average temperature, minimum temperature and maximum temperature, the average air temperature and maximum air temperature showed an increasing trend of air temperature, even a bit greater than the increase in the average temperature of the atmosphere the world (average temperature of C/yr), while the increase in air temperature in the study area of 0.04 C/year up to C/yr. It can be said that the study area has experienced global warming as part of climate change. b. Rainfall Rainfall data used in the study is the monthly average of ± 30 years of observations from 1978 to Rainfall stations used were located within and around the study area. Calculation of rainfall from Wonosari station shows that the average annual rainfall was to 1940 mm/year. The highest rain in January was about 340 mm, and the lowest rainfall occurs in August was 17.5 mm (Figure 6). Rainfall from the stations representing the study area is presented in Fig 7 to Fig 9. Fig. 6. Average Monthly Rainfall in the Study Area Paliyan station shows that rainfall trend line almost flat even at the end of the study showed a declining trend. The last four years ( ), the of rainfall at the station showed increasing trend in Paliyan is significant when compared to the data in the early years of the study (Fig. 7). 280
297 Rainfall Rainfall (mm) Rainfall (mm) 5 th TOPIC Year Fig 7. Rainfall Trend Observed at Paliyan Rainfall recorded at Patuk Station in the early years of the study showed declining trend, as well as in the later years of the study. The increase in rainfall occurred in the second half year of research, from the year In general, rainfall in Patuk stations showed the declining trend, although in the last two years it appears there was an increasing trend of the rainfall (Fig.8) Year Fig.8. Rainfall Trends Observed at Patuk In the meanwhile, variation in rainfall is very high at Wanagama station, from 0 mm / month until the 1320 mm/month. In general, rainfall in Wanagama station showed a tendency to increase, although in early 2000 downturn experienced substantial rainfall (Figure 9). Based on the observation of three stations, one can see that no significant trend of rainfall in the study area. Unlike the air temperature, in the study area the climate change cannot be observed clearly from this rainfall trend Year Fig. 9. Rainfall Trends Observed at Wanagama 281


298 5 th TOPIC c.hydrology and Water Resources Water used by population is obtained from rain, springs and lakes. Lots of households are collecting rainwater from the roof using water tank. Rainwater tank is generally placed on the side of the house, varying in shape and size (Fig. 10) Fig. 10. Rain water tank in Gunungsewu In this study, twelve springs of varying discharge were identified. Those springs were only found in Panggang District, while in Saptosari District no springs were found. Six springs were selected to be studied in the terms of water and environment management. Example of spring in the study area is shown in Fig. 11. Data on springs and estimated discharge is presented in Table 2. Fig. 11. Spring in Beji (left) and Kaligede (right) 282


299 5 th TOPIC Table 2. Springs in Panggang District No. Name of the Spring Village District Est. Discharge (m 3 /yr) Characteristics 1. Lekumet Girisuko permanent 2. Ngrenggong Girisuko Intermittent 3. Donoyo Girisuko Permanent 4. Bibal Girisuko Permanent 5. Watu bengkah Giriwungu Permanent 6. Beji Giriwungu Panggang Permanent 7. Grigak Girikarto Permanent 8. Sanglor 1 Girisuko Permanent 9. Sanglor 2 Girisuko Permanent 10. Pacar 2 Girisuko Permanent 11. Njumbleng Giriharjo intermittent 12. Karangkulon Banyusoco Permanent Lakes, as water resources, are found in the two districts, varying in size, having an area of about one hectare up to the extent of more than 5 hectare (see Fig. 12). In this study 43 lakes have been identified; six lakes were selected for more in-depth studied. Some Lakes had started to dry up when the research was conducted. Small amount of rainfall in the area lead to the drought occurrence. Data from interviewing local people informed that most of lakes started to dry up faster and earlier compared to previous year. Even though the rainfall trends did not show any significant changes, it can be observed that air temperature showed increasing trends, which leads to increase evaporation of water in the lake. Fig. 12. Winong lake, Gunungkidul (left) and Bathing of Catle in the lake (right) d. Water Usage Gunungkidul has been known as areas that have high water vulnerability, therefore, utilization and management of water resources in this area is very important. Rainwater, as a water source,has some limitation that it only present during the rainy season. In general, rainwater tank is made of cement blocks in the form of cylinder, which is placed next to the house. They vary in size from 5 to 10 m 3. The tank is only filled when it rains. The rain water obtained is used when the dry season arrives; however, the volume of water obtained is not sufficient for water supply during dry season. Therefore, another source of water is needed to meet the demand during this season. The source of water is obtained by dropping water from other areas using tanks (transported by trucks). While some lakes have been dry up, water discharge from springs has decreased. Springs in the study area is specific because of the karst regions charecteristics. Some springs was identified, but in this study only fairly large springs used for water supply were reported. The spring water is used for household water supply. In taking the water from the springs, it is done by using 283
300 5 th TOPIC directly in place when washing clothes, but for other household usage, people get it by taking a container such as jerry cans and take it home. The water was especially consumed for cooking and drinking.during the rainy season, lakes ussually filled with rain up to full or nearly full. Lake water is mainly used for irrigation and for livestock. In the dry season, where the plant needs to get irrigation water, the source of irrigation water is obtained from the lake. Lake water used for irrigation is taken by using simple tools, either buckets or jerry cans and then used to irrigate the plants around the lake with a sprinkle directly. There are even some people who use lake water for watering plants at a distance by means pick it up using water container and bring them to the site where plants need for watering by using a motorbike. For the purposes of bathing catle, it was done in situ. There have been significant changes of water supply sistem since the operation of pipe water from Ngobaran. Some people is now having water from this tap water. e. Quantity and quality of water Data on the area coverage and the depth of the lake were used to estimate the quantity of water available in the lake. In general, it can be seen that the lakes in the study area did not show a continuous quantity. Changes in the water depth from rainy season to dry season cause a significant change to the quantity of water in the lake. Depreciation of water in the lake occurs rapidly, as indicated by the drying lake in the dry season. It means that the supply of water to the lake just depends on rainfall. No groundwater supply goes into the lake. Springs discharge showed changes between rainy season and dry season, but not so significant compared to the changes in lake water. Springs discharge decrease in the dry season, but few springs are still flowing. This springs are vital water source for public water supply in the area. Results of laboratory tests provide data about springs and lakes water quality in the Saptosari District. Generally, Calcium (Ca), magnesium (Mg), hardness (CaCO 3 ), total iron (Fe), sodium (Na), Potassium (K), Sulfate (SO 4 ), chloride (Cl) and alkalinity (HCO 3 ), has been shown that almost all of the chemical composition are still under water quality standards. Sample of total iron (Fe) at Winong Lake (1.55 mg / L) and Thowet Lake (4.92 mg / L) indicate that the number should be less than 1.0 mg / L. It is appeared that lake water turbidity is high, meaning that the water looks murky, even in some of the lake indicate the specific colors, some yellow and some greenish. Overall, lake water quality both in terms of physical and chemical properties can still be fairly good. f. Water Management as adaptation to climate change Management aimed at in this study is how people use water and to maintain the sustainability of water resources, both to maintain the quantity and quality of water. Water in Karst areas Gunungkidul indeed is a very limited resource due to geographical condition of the area (Widyastuti 1991; Adji 2006). Karst regions indeed consist of areas with low annual rainfall (less than 1500 mm per year). Karst area has such geological and lithological properties to infiltrate water through naturally occurring fractures. Surface water is not available in this area; there is only underground river which is difficult to be use because it is so far located below the ground surface. Water obtained in the lake is obtained from the water that fills karst Doline form. Its depth was not like the lake in general, but relatively shallow which commonly less than 5 meters. Springs found in karst areas generally appear as the result of water solution process (White 1988; Widyastuti 1991). These springs usually emerges from fracture forms. By looking at the water scarcity in the area, the local people use water wisely and full of prudence. Karst lakes are used for various purposes, such as for bathing, washing, irrigation and bathing cattle. Bathing and washing are performed onsite, by setting a special place for washing and bathing.washing livestock is being carried out separately. It is not allowed to dispose of waste and scrap wrap soaps, detergents and shampoos in place in order to keep the quality remains good. But in fact, some wastes is often not placed at a distance from the lake, so that the waste is sometimes found still scattered around the lake, although not meant to be in the body of the lake waters. Similarly, the lakes and springs are also used for bathing (by placing a separate between men and women). Compared to lake water, the difference of the spring is that the water at the springs is used for other purposes, such as cooking and drinking. Water used for cooking and drinking is taken from 284
301 5 th TOPIC the springs by taking and transporting by using a bucket and a water tank container. The area around the spring still kept clean. In the location around lakes and springs, vegetation is kept to grow. But in some lakes it was observed that the trees in the vicinity have been reduced. There were some efforts of local government and communities to replant trees around the fringe of the lake. Local wisdoms that have been made by local residents in keeping the environment around the lake has been identified. The local wisdom found, such as; should not cut down trees around the lake, should not kill wild animals that are around the lake in order to keep the environment, is maintained. Therefore the presence of water in the lake was awake. Some lakes are supposedly haunted (Java) so that people are not allowed to do that against the rules. Some lakes are also given for safety and some have still given the "offerings" means that the lake is to be maintained to avoid damage. Almost the same thing were done to the springs, at which point the appearance of springs also maintained clean, well maintained trees around them. Rural communities around the springs and lakes are still doing traditional ceremonies at certain times, which is known in some places with clean village, done in groups or done independently. Mutual cooperation of community in the village is still strong. People's knowledge related to the effects of environmental conditions on water resources is very good. All respondents (100%) understood that the environmental conditions around the springs and lakes can cause impact on the sustainability of water resources. This is evident from the activities of the community in the form of community service cleaning the area springs, lakes and rivers are conducted regularly. In addition, there are some rules related to the management of water resources such as a ban on cutting trees around springs and lakes (in all areas of study). The results of the interview showed that 100% of respondents stated that the springs are used for this, no damage or significant decreasing of spring discharge. The results of the interview showed that water resource management has been done, however, the conditions has gradually changed. Traditions associated with taboos and other customs or rules are violated and have become loose, especially in the community that live around the lakes (Sukar 2005). In the lake Thowet, Girisekar District for example, is now no longer having a lake watcher. However, some restrictions still exist, such as washing rice is prohibited in the lake. The community also determine the exact location of cattle bathing, and so on. Another example is the condition in the lake Winong Lake, Saptosari District where cattle were not allowed to bath in this lake, but now bathing the animals are allowed. Tradition of the community represents the way of the community to conserve water resources. It also represents the adaptation of the people to overcome water scarcity problem in the study area. CONCLUSION 1. Water resources in karst area mainly consist of rain water, lake water, and springs. As daily water supply, springs dominated this needs, then followed by lake water. 2. Lake water is very vulnerable to changes in the season; during dry season most of the lakes had dried up. This situation is mainly derived due to the impact of climate changes, which cause high evaporation of the area. 3. Springs generally are well preserved, because the springs are relatively more sustainable to provide water supply. Local wisdom in conserving the springs as water source of water supply still exists, but it was realized that local knowledge began to decline with the changing times. Local wisdom, as a part of community adaptation to climate changes, is required to prevent the impact of climate change, in which cause the quantity of water to decrease. 4. It is recognized that by the occurrence of climate change, the local people are not so concerned about the lack of water because the local community was used to adapt to the environment. REFERENCES [1]. Adelila. S.S Pengetahuan, Sikap dan Partisipasi Masyarakat dalam Pembuatan Sumur Resapan air Hujan. Tesis. Ilmu Lingkungan. Pascasarjana. UGM 285
302 5 th TOPIC [2]. Adji, T. N., Studi Kualitas Air Gua Karst di DAS Bawah Tanah Bribin. Skripsi Sarjana. Yogyakarta : Fakultas Geografi UGM. [3]. Adji, T. N., dan Nurjani, E Optimasi Airtanah Karst sebagai Pemasok Kebutuhan Domestik. Laporan Penelitian. Yogyakarta : Fakultas Geografi UGM. [4]. Adji, T. N., Perhitungan Konstanta Resesi Akuifer Karst, Gunung Sewu-Indonesian Cave and Karst Journal, Vol. 2 No. 2, HIKESPI, Indonesia [5]. Burroughs, WJ., 2007, Climate Change : A Multidisciplinary Approach, Cambridge University, New York. [6]. Haryono, Eko dan Adjie N. Tjahyo Pengantar Geomorfologi dan Hidrologi Karst. Kelompok Studi Karst. Fakultas Geografi. Universitas Gadjah Mada. Yogyakarta [7] Kabat, P. and Bates, B., 2009, The Evidence dalam Climate Change the Water Rules. Editor Appleton, B., Dialogue on Water and Climate, Liverpool. [8]. Kementrian Negara Lingkungan Hidup Rencana Aksi Nasional dalam Menghadapi Perubahan Iklim. KNLH, Jakarta. [9]. Kuntowijoyo Budaya dan Masyarakat. Yogyakarta : PT. Tiara Wacana Yogya [10]. MacDonalds and Partners Greater Yogyakarta Groundwater Resources Study. Vol 3C: Cave Survey. Yogyakarta, Directorate General of Water Resources Development Project (P2AT) [11]. Soetrisno, Partisipasi dan Pemberdayaan Masyarakat: Sebuah Tinjauan. Laporan Penelitain. Unpublised. Yogyakarta. [12]. Sudarmadji, Widyastuti, M., Haryono, E Pengembangan Metode Konservasi Air Bawah Tanah di Kawasan Karst Sistem Bribin-Baron Kabupaten Gunungkidul. Laporan Penelitian Hibah Bersaing XIII/2. Lembaga Penelitian, UGM, Yogyakarta [13]. Sudarmadji, Widyastuti, M., Harini, R., Ritohardoyo, S., Farda, N.M., Adji, T.N Konservasi Sumberdaya Air Berbasis Masyarakat pada Daerah Tangkapan Hujan Sungai Bawah Tanah di Gua Seropan Kabupaten Gunungkidul Propinsi DIY. Penelitian WCRU, Fakultas Geografi UGM, Yogyakarta. [14]. Sudarmadji, Slamet Suprayogi dan Setiadi., Konservasi Spring Berbasis Masyarakat di Kabupaten Gunungkidul untuk Mengantisipasi Perubahan Iklim. Laporan Penelitian. Sekolah Pascasarjana UGM, Yogyakarta. [15]. Sukar Masih Adakah Kearifan Lokal di Karst Gunungkidul, Dalam : Makalah dari Diskusi Lingkungan Hidup Mapala KAPALASASTRA. Yogyakarta : Fakultas Ilmu Budaya UGM. [16]. White, 1988, Geomorphology and Hydrology of Karst Terrain, Oxford Univ. Press, Oxford. [17]. Widyastuti, M Pengaruh Struktur Kekar terhadap Karakteristik Spring di Cekungan Wonosari Kabupaten Gunungkidul. Skripsi. Fakultas Geografi UGM, Yogyakarta. 286
303 5 th TOPIC IMPACK OF DEVELOPMENT IN BOGOR MUNICIPALITY ON THE LOCAL GREENHOUSE GAS EMISSION Arief Sabdo Yuwono Dept. of Civil and Environmental Engineering, Bogor Agricultural University (IPB), Indonesia ABSTRACT A decade development in Bogor Municipality of West Java Province and its impact on the local greenhouse gas emission covering carbon dioxide (CO 2 ), methane (CH 4 ) as well as nitrous oxide (N 2 O) were assessed quantitatively by using their relevant emission factors. A ten years period of development was indicated by growth of population, increasing energy consumption and change of AFOLU (agriculture, forestry and land use) sector as well as by increase of solid waste generation. Assessment on the generated local greenhouse gas emission was based on IPCC (Inter-Governmental Panel on Climate Change) Guideline There was a strong correlation between population growth and the emitted greenhouse gas emission. A similar correlation was also found between solid waste generation and total greenhouse gas emission. Result of the analysis showed that yearly local greenhouse gas emission increased from 6.0E+07 to 7.3E+07 ton CO 2 -e within ten years period ( ). It indicated that development of Bogor Municipality affects directly on the local greenhouse gas emission. Keywords: Bogor Municipality, development, emission, greenhouse gas, impact INTRODUCTION Impact of the increasing atmospheric greenhouse gases [1]-[2] concentration has been studied worldwide intensively since the last decades. A number of researchers have indicated generally that global climate change maybe the most serious environmental challenge ever faced by mankind [3]-[4]. This is as a result of devastating impact both on the climate and the environment [5]. Mitigation and adaptation actions to cope such global phenomenon are therefore important to be concerned by national and local authorities. Consequently, study on trend of greenhouse gas emission could be a basis to plan strategic measures to deal with the global warming locally. Some municipalities have tried to respond the global warming phenomenon locally by simply greening the open area such as urban forest [6]. Other municipalities started to mitigate the global warming without any strategic calculation on the budget and effectiveness of the implemented action [7]. Consequently, some mitigation measures were not effective and the greenhouse gases concentration remains high. On the other side, mitigation measures should be focused on the main contributors of the greenhouse gas emission. Here, impact of development on environment was viewed more specifically on the negative aspects, i.e. greenhouse gas emission, rather than on its positive effects such as growth of economy, better infrastructures and so forth. An estimation of local scale greenhouse gas emission [4] carried out in a Portuguese municipality, called Oeiras, showed clearly that electricity sector accounts for about 75% of the municipal emissions. It indicated that local greenhouse gas estimation highly depends on the electricity consumption. The objectives of the research were firstly to estimate the amount of sector and total greenhouse gas emissions generated by Bogor Municipality. Secondly is to assess the impact of development in Bogor Municipality during ten years period ( ) on the local greenhouse gas emission. 287
304 5 th TOPIC METHODOLOGY Estimation on amount of the sector and total greenhouse gas (GHG) emission was based on IPCC (Inter-Governmental Panel on Climate Change) Guideline It is classified into three sectors, namely sector of energy, AFOLU (agricultural, forest land and other land use) sector and solid waste sector. Each of sector emission was calculated by using its corresponding emission factor which was adopted from IPCC Guideline 2006 and its database. Greenhouse gas emitted by each sector was firstly expressed in their responding unit, i.e. [ton CO 2 /year], [ton CH 4 /year] and [ton N 2 O/year] and subsequently converted into a single common unit namely [ton CO 2 -equivalent/year] or simply expressed in [ton CO 2 -e/year] by using conversion factor, i.e. Global Warming Potential (GWP). The development indicators were population growth, energy consumption (electricity, kerosene, gasoline, pertamax, LPG and diesel oil) as well as solid waste generation as a consequence of the population growth. The GWP for CO 2 is 1, CH 4 is 25 and N 2 O is 298 according to IPCC Guideline A flowchart of the research steps is depicted in Fig. 1. Fig. 1. Flowchart of the research steps. The amount of emitted greenhouse gas was estimated by using basic equations according to their sector and the necessary data as indicated in Table I. Hence, for instance, energy sector covers GHG emission resulted from small, medium as well as large scale industries that consume various fuels such as diesel oil, natural gas (LPG) and others. The electricity consumed by each industry was also taken into account in the calculation. In AFOLU (agricultural, forest land, and other land use) sector the emitted GHG was mainly generated by paddy field and animal husbandry activity. Therefore, the calculation was based on these components. Table 1. The Basic Equation And Necessary Data Sector Basic equation Data Energy GHG emission = (fuel Number of small, medium and large scale consumption)*(net calorific industry; Diesel oil, gas and electricity value)*(emission factor). consumption; Emission factor (e). AFOLU Paddy field GHG emission = (area)*(planting day)*(emission factor). GHG emission = (number of livestock)*(emission factor) Solid waste GHG emission = (population)*(emission factor). Area of paddy field; Days of planting per year; Number of livestock (ruminants and poultry); Emission factor (e). Municipal population; Daily solid waste generation; Organic fraction; Emission factor (e). 288
![5 th TOPIC Paddy field is concerned as a source of GHG (i.e. methane) [8] due to anaerobic condition of the inundated paddy field normally practiced by the farmers in Indonesia.](/docs-images/73/68916181/images/305-0.jpg "The anaerobic condition is a precursor for the methanogenic bacteria producing methane (CH 4 ).")
305 5 th TOPIC Paddy field is concerned as a source of GHG (i.e. methane) [8] due to anaerobic condition of the inundated paddy field normally practiced by the farmers in Indonesia. The anaerobic condition is a precursor for the methanogenic bacteria producing methane (CH 4 ). Animal husbandry which is also regarded as a source of GHG in AFOLU sector is based on the fact that feces emitted a lot of methane during the first days of their dispatch. RESULTS AND DISCUSSION Analysis of data showed that total greenhouse gas emission has been growing about 17% from 6.0E+7 [ton CO 2 -e] in 2002 to be 7.3E+7 [ton CO 2 -e] during ten years period (Fig.2). Population growth, however, has changed much faster, i.e. 68% within the same period as shown in Table 2. Table 2. Population Growth And Emission Per Capita Year Population [million] Growth [%] Total emission [ton CO- 2 e] Emission per capita [ton CO- 2 e/capita] E E It indicated that a fast growth of population does not always imply on fast growth emission per capita directly as well. Contrary, emission per capita has decreased significantly from 20.7 to be merely 15.2 [ton CO 2 -e/capita]. However, total emission growth was in line with the population growth. Total greenhouse gas emission in Bogor Municipality consisted of mostly nitrous oxide (N 2 O) and then followed by methane (CH 4 ) and carbon dioxide (CO 2 ) as indicated in Fig. 2. This is in line with the result of the data analysis where source of the emitted greenhouse gas was from AFOLU sector (Fig. 3). There is a strong relationship between AFOLU sector and the relevant emitted greenhouse gas, i.e. nitrous oxide (N 2 O). A factor that might contribute to the increase of greenhouse gas emission from AFOLU sector is the decrease of the forest land area where during the forest land has decrease more than nine thousands hectares. It is clearly known that forest land roles as an important agent to offset atmospheric CO 2 emission [9]. Moreover, biomass resources such as forests, is known as an attractive strategy to reduce GHG emissions [10]. (a) 289
. It is recognized that methane can be generated during solid waste decomposition.")
![During the decomposition process organic fraction of solid waste would be converted to be a number of gaseous compounds including methane [11]. Fig. 3. Greenhouse gas emission per sector.](/docs-images/73/68916181/images/306-1.jpg "Population growth as an indicator of development shows a positive correlation with the total emission as indicated in Fig. 4. The coefficient correlation is 0.985 (Fig.")
306 5 th TOPIC (b) Fig. 2. Yearly (a) and proportion (b) of total greenhouse gas emission. A strong relationship was also indicated between methane (CH 4 ) emission (Fig. 2) and solid waste sector (Fig. 3). It is recognized that methane can be generated during solid waste decomposition. During the decomposition process organic fraction of solid waste would be converted to be a number of gaseous compounds including methane [11]. Fig. 3. Greenhouse gas emission per sector. Population growth as an indicator of development shows a positive correlation with the total emission as indicated in Fig. 4. The coefficient correlation is (Fig. 5) which means that those parameters are strongly correlated. The more population the higher solid waste generated in the society which in turn will increase the amount of the emitted greenhouse gas. A research conducted by Indonesian State Ministry for Environment in 1996 indicated that average solid waste generation in Indonesia was ±0.8 [kg/capita/day]. It is predicted that the solid waste generation could reach 2.1 [kg/capita/day] by

307 5 th TOPIC Fig. 4. Population growth and the total greenhouse gas emission Fig. 5. Relationship between population and total GHG emission. Data analysis on the AFOLU sector in terms of paddy field area, settlement area and forest land area demonstrated that forest land area has decreased about 8.5% within ten years (Fig. 6) whereas settlement area has increased 32% during the same period. Paddy field area, in contrary, has increased almost 3%. The latest roles as double agent in the atmospheric greenhouse gas turnover, i.e. firstly as methane source [12] in the environment and secondly as carbon sink where during photosynthesis paddy absorbs CO 2 as one of main substances beside water to form carbohydrates. Fig. 6. Area change of forest land, settlement and paddy field. 291
308 5 th TOPIC Relationship between AFOLU sector and total greenhouse gas emission change is depicted in Fig. 7 where it is obvious that the growing total GHG emission was in line with the increase of settlement area, decrease of forest land and a slight increase in paddy field area. Settlement area is a kind of GHG source as it emits CO 2 from its various activities. The diminishing forest land area is also concerned as a source of GHG emission due to its decrease in carbon stock or carbon sequestration capacity. There are a number of estimations by independent researchers pertaining on carbon stocks, carbon sequestration capacity or primary production of Indonesian forest land such as follows: Net sequestration is to 0.84 ton CO 2 ha -1.year -1 [13] Above- and below-ground net primary production was 6.7 Mg C ha -1.year -1 [14] Carbon stocks in the A-horizon were ton C ha -1 [15]. Fig. 7. Relationship between AFOLU sector and total emission change. In energy sector a remarkable change on consumption of gasoline, kerosene and diesel oil has occurred in 2009 in Indonesia as a consequence of the governmental decree to convert kerosene fuel mainly consumed by households to natural gas (LPG). Since then the consumption of kerosene has significantly decreased by almost 87 million liter during the last three years. The change of consumption amount of these fossil fuel types is described in Fig. 8. Fig. 8. Change of fossil fuel consumption in energy sector. The significant decrease of kerosene supply in the market was simultaneously followed by increase of LPG, diesel oil and gasoline consumption during period of The environmental impact, i.e. air quality change, of such condition itself was unclear due to the complexity of the atmosphere 292
309 5 th TOPIC system. In fact, the total greenhouse gas emission showed a stabile growing tendency along the study period. Relationship between solid waste generation and total greenhouse gas emission is almost linear since one of the estimation bases of the total GHG emission was the quantity of the generated solid waste. Hence, as indicated in Fig. 9, the increasing amount of the generated solid waste in Bogor Municipality was always followed by increase of total GHG emission. Between the amount of generated solid waste and total GHG emission there is a strong correlation as indicated by its correlation coefficient accounts for (Fig. 10). Fig. 9. Trend of solid waste generation and total GHG emission. Fig. 10. Correlation between solid waste generation and total GHG emission. The above description indicated that it is important to take into account the management of municipal solid waste in order to minimize the production of greenhouse gas from the solid waste bulk into ambient air and then to the atmosphere. Once it is released into the ambient air, a global and local mitigation measures should be planned and taken in action. REFERENCES [1] K. J. van Groenigen, C. W. Osenberg, B. A. Hungate. Increased soil emissions of potent greenhouse gases under increased atmospheric CO 2. Letter Research, vol. 475, pp July [2] O. Ashrafi, L. Yerushalmi, F. Haghighat. Greenhouse gas emission by wastewater treatment plants of the pulp and paper industry Modeling and simulation. International Journal of 293
310 5 th TOPIC Greenhouse Gas Control, vol. 17, pp June 2013 [3] K. R. Mackie and C. D. Cooper. Landfill gas emission prediction using Voronoi diagrams and importance sampling. Environ. Modeling and Software, vol. 24, pp [4] J. Gomes, J. Nascimento, H. Rodrigues. Estimating local greenhouse gas emissions - A case study on a Portuguese municipality. International Journal of Greenhouse Gas Control, vol. 2, pp [5] O. Anomohanran. Determination of greenhouse gas emission resulting from gas flaring activities in Nigeria. Energy Policy, vol. 45, pp March 2012 [6] A.S. Yuwono, A. Kurniawan, R. Fatimah. A quantitative approach on the role of urban forest in a local carbon cycle Proceeding of International Conference of Indonesian Forestry Researchers (INAFOR), pp December 2011 [7] A.S. Yuwono. Assessment on tree planting effectiveness to reduce greenhouse gas emission presented in International Conference on Sustainable Agriculture and Environment (ICSAE). Solo, June [8] E.T. Epule, C. Peng, N. M. Mafany. Methane emissions from paddy rice fields: Strategies towards Achieving a Win-Win Sustainability Scenario between Rice Production and Methane Emission Reduction. Journal of Sustainable Development, vol. 4, No. 6, pp December 2011 [9] T. L. Daniels. Integrating Forest Carbon Sequestration into a Cap-and-Trade Program to Reduce Net CO 2 Emissions. Journal of the American Planning Association, vol. 76, No. 4, pp Autumn 2010 [10] C. Kayo, T. Aramaki, K. Hanaki. Effect of Change of Forest Carbon Storage on Net Carbon Dioxide Balance of Wood Use for Energy in Japan. Journal of Industrial Ecology, vol. 15, No. 1, pp [11] Anonymous. Assessment of greenhouse gas emissions from waste disposal as a result of implementation of the proposed New Zealand Waste Strategy. Ministry for the Environment. April 2002 [12] S. S. Yang, C. M. Lai, H. L. Chang, E. H. Chang, C. B. Wei. Estimation of methane and nitrous oxide emissions from paddy fields in Taiwan. Renewable Energy, vol. 34, pp Jan [13] M. van Noordwijk, D. A. Suyamto, B. Lusiana, A. Ekadinata., K. Hairiah. Facilitating agroforestation of landscapes for sustainable benefits: Tradeoffs between carbon stocks and local development benefits in Indonesia according to the FALLOW model. Agriculture, Ecosystems and Environment, vol. 126, pp March 2008 [14] D. Hertel, G. Moser, H. Culmsee, S. Erasmi, V. Horna, B. Schuldt, Ch. Leuschner. Below- and above-ground biomass and net primary production in a paleotropical natural forest (Sulawesi, Indonesia) as compared to neotropical forests. Forest Ecology and Management, vol. 258, pp July 2009 [15] J. van der Kamp, I. Yassir, P. Buurman. Soil carbon changes upon secondary succession in Imperata grasslands (East Kalimantan, Indonesia). Geoderma, vol. 149, pp January
311 5 th TOPIC COMPARATIVE STUDY AGRICULTURE DEVELOPMENT PROGRAMS FOR POVERTY REDUCTION EVIDENCES FROM INDONESIA AND CHINA Muhamad Rusliyadi PhD Student in Policy Studies, Faculty of Business, Economics and Policy Studies, Universiti Brunei Darussalam ABSTRACT China s and Indonesia Agricultures have gone undergone since the early 1980 s rapid economic growth, urbanization and market development are major factor in the changes, Rising income and urban expansion have increased the demand almost all agricultural product food staple especially non-staple food. Non-stapled food almost all is from Horticulture product that changes has stimulated sudden shifts in the structure of agriculture to industrialization horticultural product to increasing GDP and agricultural sector especially in rural areas. The purpose of this paper is to provide an overview description of important differences in agriculture development China and Indonesia in poverty reduction efforts in rural areas and some strategy. Obviously with the view of some of the existing literature by presenting data and facts or opinions with the collaboration of several institutions associated with the topic. This paper will provide an objective picture of the development from agricultural sector level of evidence both Indonesia and China. China and Indonesia is agriculture based country with a program of integrated rural development as a whole to be a target of poverty reduction programs. Several agriculture programs related to poverty reduction has been launched and have a good impact or significance, especially in China that is able to reduce extreme poverty from 30% in 1978 to less than 3% in Certainly many lessons can be obtained from this success, especially the concept and strategy development in rural China to be a reference of other States in its development model, especially for poverty alleviation programs. Key words: Agriculture development program, Indonesia, China, Poverty Reduction INTRODUCTION China and Indonesia are generally regarded as the two large countries in the developing world that are the success stories of developing countries from agricultural sector. The agricultural sector became the leading sector capable of contributing to the development, especially in rural areas. This success has been defined by the high and sustained rates of growth of aggregate and per capita national income; and the substantial reduction in income poverty. Agricultural development has a strategic role for the country to exist a country that is viewed by other Countries as a country that successfully eliminating poverty with an average growth rate of high development. Thirty year ago, China and Indonesia were considered two of the world s poorest countries with very poor people located high within the rural areas mainly in agricultural sector as a spine with an annual per capita income of only US $ 50. Since then, it has made great strides, achieving an average GDP growth of almost 7% per year, a growth performance that ranks among the ten fastest in the world, and is on a part with that of the dynamic Asian economies. During this period, Indonesia has moved from being a low-income country to being a middle income one but China s growth much faster and is becoming a rich country. The Government of Indonesia and China have launched several agricultural development programs based on poverty alleviation in rural areas. Programs for poverty reduction at the provincial level that have the similar patterns of development involving local government agencies at the provincial government to the village level occur in both China and Indonesia. Already there have been many policies or programs developed for poverty reduction in China and Indonesia, at the level of implementation, especially the contribution to poverty, where the contribution of the agricultural sector has an important role in both countries. MATERIAL AND METHOD This study uses quantitative data collection techniques/methods at the national level by reviewing existing literature related to supporting research and also in combination with a descriptive qualitative, 295
312 5 th TOPIC graph analysis and cross tabulation method in which data collection techniques include: (1) Desk Study with depth Literature review sources data from national Journals, international journals, Bulletins, Proceedings, Monographs, International reports, newspapers, Internet and academic books.(2) Observation methods is calculated data showed by Chart, Graph and table in detailed of relationship, Phenomenon, inquisitive, compare, generalize, Ideas for agriculture development between China and Indonesia in order to effect poverty reduction n. (3) Secondary data or documents review from several resources and various institutions such as: Central Bureau of Statistics (BPS); National Bureau of Statistics of China; Agriculture Ministry of Indonesia and China ; Agricultural census book : Chinese statistical yearbook ; International Organization Data sheet like FAO, World Bank, UNDP, etc RESULT AND DISCUSSION Comparative Strategy and Policy Agriculture development fro poverty reduction As we know policies that have been particularly important for Poverty Alleviation are agricultural policy, educational policy, and family planning policy. In this chapter, we will discuss about agriculture policy, especially in China and Indonesia, which certainly contributes to economic development and poverty alleviation in both countries. The fundamental difference as a critical point of the table below illustrates how the policies that contribute directly to the wheels of government in China and Indonesia, which applies to the rule contributed directly in agriculture and rural development. In the table below is a simple analysis of the condition of agriculture development policies that would provide a direct contribution to development in rural areas and provide a direct impact on poor communities in these rural with the every program run by the government either China or Indonesia. Agricultural development in Indonesia is arguably a significant determinant of growth in other sectors of the economy. During three decades of palpable economic progress, the agriculture sector, which is expanded mostly by smallholder activity, propelled the Indonesian economy through forward and backward linkages and through demand creation (Uphoff, 1999). Daryanto and Morison (1992) found that the consumption linkage effect of the induced growth in the agricultural sector represents a more potent intersectoral influence than the production linkages of agricultural growth. The Indonesian case study (Timmer, 2005) argues that conscious policy stimulus to agriculture was the key to the country s 30-year record of rapid, pro-poor growth (from 1967 to 1997), and that the model of smallholder agricultural development used by Indonesia is quite general. The Indonesian model is explicitly set in the broader historical literature on the role of agriculture and economic development that has been generated by successful countries not burdened with highly skewed land distributions as a starting point for their development. Table 1 Comparison some Critical Point of Policies and Development of Agriculture in China and Indonesia by period. Period Critical Point Indonesia China Physic Program vs. Land social reform Base on agriculture Vs Land Tenure and Commune Decrease Vs Increase Economic crisis Vs Stable economy Infrastructure program and intensification Expansion intensification, technology, Irrigation, extension reform Decrease financial support agriculture, liberalization policy for industry Removal pesticide and fertilizer subsidy, high banking interest rate Land Reform Policy People s commune system reform and Agricultural land tenure change Agricultural market policy (rural market policy), circulation system of agricultural products, protection price rural industrial structure, macroregulation on agriculture 2000-present Decentralization Vs Centralization Decentralizations including agriculture policy San Nong Policy, rural taxes and fees, Four Subsidies and One Premium, Source: Resume by author in E. Pasandaran, M. Rantetana, Iqbal.(2003) and Liu Jinbao, et al (2008). 296
313 5 th TOPIC Development of the country, especially the development is inseparable from how to carry out this orders to share strategies and policies relating to rural policies an usually touching the grass root that can certainly provide impact also on the alleviation of poverty. In connection with this study of course this chapter is really important to know how the growth of agricultural development in China and Indonesia in relation to policies and strategies for each country can apply at the national level as well as to the level below with reference to the data s and existing literature. Various aspects in comparing the two countries both China and Indonesia would be measured in this study how the data is showing good growth characteristics, policy strategies in the agricultural sector directly related to rural poverty alleviation is the evidence from China and Indonesia. Keith Fuglie et al (2010) have been conducted a study about the special issue on agricultural productivity growth: a Closer look at large, developing countries that the Country compares China and Indonesia with the various indicators and important issues in the productivity and agricultural policy. From the data we can see how it compares with the value percentage average annual growth rate from year , the indicator shows the total output of China's growth rate is higher with the Indonesian compared different the difference of that about 0.57% per year and correlated positively with the total average input growth is also higher than China and Indonesia with 0.47 % difference in calculation of course this is not distinct far as the total input and total input addressing relative figures do not differ much. The next indicator according to Keith Fuglie et al (2010) they decomposing the sources of output growth in Two Ways: first, they divide this growth into the part due to resources (inputs) expansion and the part due to Total Factor Productivity (TFP); and Second, They decomposing output growth into growth in the agricultural labor force and output per worker. Growth in farm output per worker is decomposed into further growth in cropland per worker, non-land growth in other inputs per worker, improvement in average schooling of farm workers, and growth in TFP. Table 2 showed that variable China Total factor productivity (TFP) figures show China 1.80% and Indonesia 1.70% was statistically not different from average annual growth. As for the number of workers in the agricultural sector shows the relative numbers are no different from China in fact smaller than that of Indonesia this is because the number of workers in the balance with the production machinery is very high relative growth compared with the opposite number of workers in Indonesia are not balanced with the machine and also on indicators of output / worker precisely in Indonesia is also greater because Indonesia is able to add cropland in various islands such as Kalimantan and Sulawesi islands and other islands into the agricultural land but instead will tend to stagnate in china there is no growth at all. At the output capital / worker China shows the number is much higher than Indonesia, where a significant annual average rate is reached 2.30 % Growth, while Indonesia is only 0.8% this is due in rural economic in china able to grow and develop much better with effective policies implemented by the Chinese government through economic reform, rural markets form many enterprise in rural or agricultural sector to turn the wheels highly in the rural economy. Output per worker grew rapidly in China and Indonesia, the which a sharp decline Also Experienced in national poverty rates about 30 percent in the period from This was shows how the importance of growth in the national the agricultural sector capable of providing significant contributions to the alleviation of poverty because in both countries the poor population mostly located in rural areas. Table 2 Sources of growth in agriculture in China and Indonesia, Indicator Average annual growth rate (%), China Indonesia Total output Total inputs Total factor productivity (TFP) Workers* Output/worker Cropland/worker Capital/worker Education (schooling) Percent reduction in poverty, mid 1980s to ** Agricultural research spending as percentage of agricultural GDP
314 5 th TOPIC Periods of major agricultural policy or institutional reforms Periods of major macroeconomic reforms Source: Various sources in Keith Fuglie et al (2010) Note: * The number of agricultural workers is measured in constant-quality units after adjusting for changes in the average years of schooling of the national labor force. Capital inputs include animals, machinery, seed, feed, and fertilizer ** Poverty is measured as the percentage of the national population subsisting on less than PPP$2/day (World Bank 2007) The agricultural development policy cannot be separated from government policy in allocating funds to the areas of research and development primarily because of agricultural science with research we can produce the technology or resources that can improve productivity, efficiency and product, which become tools and benchmarks in each of the programs in held by government. Here the fundamental difference between China and Indonesia on this below Chinese data have average annual growth rate figure of 0.36% and Indonesia had a rate of 0.24% in the period 1971 to 1975 and other periods in the period 2001 to 2003 china rose to 0.49 %. While Indonesia dropped to 0.21%, just a situation that was actually less favorable for agriculture sector in Indonesia due to the declining percentage of the funded for agriculture research and development that could become weapons could contribute to the technology, programs, and policies in the agricultural sector. Status and Achievement of Agricultural and Rural Development in China and Indonesia Agricultural development in China and Indonesia during the last three decades has been a success story. The impressive growth performance of the sector contributed substantially to the achievement of China and Indonesia s development objectives: food security, low and stable prices, generation of employment and foreign earnings/savings. China and Indonesia is an excellent example regarding the role of agriculture in economic development. Agricultural production from two countries is quite encouraging achievements show this contribution to the agricultural GDP world where China could provide a significant contribution to the average above 15% while Indonesia is able to contribute to the range - average 2.40 %. The Agricultural growth in China each year shows was a significantly increasing since almost 30 years ago with economic growth at a relatively stable and a drastic increase while the rate of growth in Indonesia has a relatively less stable. Whereas Indonesia has experienced the economic crisis in 1998 which resulted in economic growth which of course affects the sloping agricultural sector but also will tend to rise after a period of year 2000's. China experienced significant improvement in the agricultural sector of which the period of the 1990s, agricultural policy among the rural market program, the government introduced a set of adjustment policies, the third regime, starting in 1990 (OECD, 1995). Apart from constraints on the development of rural industry, the government implemented further reform in the grain sector, aimed at phasing out the old centrally planned purchase and supply system in favor of more market-oriented solutions. For example, purchase and selling grain prices were equated, i.e., grain and oilseed price subsidies to urban dwellers were eliminated. Further, interregional grain transfers that had been previously arranged by the central government were now replaced by a contract system between provincial governments. The government reformed the input supply system by removing subsidies and allowing private firms to supply inputs to producers. In addition, the system of in kind supplies of fertilizers and fuel for deliveries of grain and oil crops to the country agencies was converted to monetary payments. These policy measures aim at partially substituting governmental interference in markets by functioning market forces, thus to avoid government failure due to information problems. However, market reform in agriculture remained incomplete, reflected by the different degrees of price and quantity controls in different sub-sectors (grain, cotton and oil crops vs. livestock and vegetables), by the segmentation of regional agricultural markets, and by the isolation of domestic markets from international markets. Despite the fact that Indonesia has an agricultural policy with the result according to the data show characteristics of sloping Slowly increase production from year to year but capable of self-sufficiency in rice in 1985 with programs and policies of the government on agricultural intensification and extension that developed at that time but returned to fade in period of 1998 due to global economic crisis that hit Indonesia effect on the agricultural sector this is also supported by the opinion of Siregar, et.al (2006) Economic Transformation in Indonesia had been relatively slow even before the country was hit by the monetary crisis in 1997.Prior to the crisis, the contribution of agriculture to GDP 298
315 5 th TOPIC decreased from 17.9 per cent in 1993 to 14.9 per cent in 1997, but it Increased During the crisis to 17.1 per cent in In line with the economic recovery process, the contribution of agriculture to GDP declined to 15.9 per cent in On the other hand, the contribution of the manufacturing sector has been gradually Increasing; from 22.3 per cent in 1993 to 26.6 per cent in Indonesia has implemented extensive general economic reform since the 1980s, relaxation of foreign investment including Regulations, reduction in many qualitative tariffs and import restrictions, a more flexible exchange rate policy, and phasing out of price subsidies for many goods. Nevertheless, the agriculture sector and agricultural trade had been slow and limited. China and Indonesia is a country that has a large population of mainly rural population of China in global unity, while Indonesia is the fourth after India and the United state, the data above we can see the condition of rural populations in China and Indonesia in the years the most represents the farmers or working in the agricultural sector. Rural population in China is very high and is the world's largest rural population reached 815 million people in 1987, while Indonesia is only around 121 million, of course, a resource that should be a boon for a country, but even when people in villages own many of the polemics in the face various problems, especially poverty. From a large population of China and Indonesia is largely a rural population which, according to data on China in 1987 amounted to 75.24% and with a very dominant development started in rural areas could reduce the number of people in rural areas amounted to 56% in 2009 while Indonesia also decreased significantly the number of people from the beginning of 1987 from 72.1% of the total population dropped 24, 68% to 47.42% at the same time over 22 years. This shows the performance of government programs that address the reduction of population and development in rural areas, especially agricultural work well with the decreasing population in rural areas as indicators of success and poverty alleviation in both countries. Contribution of agriculture to economic development in China and Indonesia Economic growth in Indonesia and China cannot be separated from the contribution of agriculture sector in the economic structure of both countries. The agricultural sector into other sectors pedestal base or both industry and services to grow and this is also true in China and Indonesia The data below shows the economic growth of both countries could be a pretty picture of how the importance of the agricultural sector as a power for development. In figure 7, we can see how the contribution of agricultural GDP per capita of the agricultural population of countries between China and Indonesia as a national show differences mainly due to the population encountered in the agricultural sector. National Agricultural GDP or GDP of China was actually much bigger than Indonesia, because GDP per capita of course inversely proportional to the population especially in rural areas. There is a stable tendency of increase of both countries by the year in which China could increase the per capita GDP of the agricultural population of 181 dollars to 285 dollars, while Indonesia is able to show the performance increase is quite stable in the year 1994 to 1996 is 264 dollars and rose to 365 in In point of GDP per capita in China and Indonesia in the period in showed that numbers do not differ much between the two countries where China actually smaller than Indonesia, there is little difference of $ 53 constant 2000 prices. But china driving very fast with per capita GDP exceeded Indonesia in the period this is because China is very rapid development in other sectors like industry and services but Indonesia still depend on agricultural sector of at least the industrial sector is Slowly grow and Also That reason in period Indonesian economic crisis have financial problems make suffer and grow stagnant. This is supported by the opinion of Huang, j and Rozelle, s. (2009) share of GDP of industrial sector in national GDP fluctuated Between 1970 and 1985, Increasing gradually after the late 1980s and rose from 41% in 1990 to 49% in In contrast to agriculture, the sector expanded rapidly. The share of service sector in national GDP increased from 13% in 1970 to 21% in 1980 and 40% in This trend is expected to persist in the coming years as China continues to promote its structural adjustment policies and economic Reforms in response to domestic demand and external trade patterns changes. In the case in china there is a shift from agricultural to industrial and service sectors as well as Indonesia experienced it but fluctuated very varied and tend to speed very slowly in accordance with the opinion of The growth rate of the agricultural sector has fluctuated around an average growth rate of 2.4 percent per year before the crisis ( ) and 1.4 per cent per year post-crisis ( ). The growth rate of the manufacturing sector fluctuated also before the crisis but it was much higher than that of the agricultural sector. The growth rate of the manufacturing sector which has declined since the crisis, Indonesia's indicates its relatively slow economic recovery. Also this is indicated by the average growth rate of GDP, 7.6 per cent per year before the crisis, and 2.6 per cent peryear post-crisis. Consequently, the growth rate of GDP per capita in local currency decreased 299
316 5 th TOPIC from 5.9 per cent per year before the crisis to 3.3 percent per year after the crisis. GDP per capita, in U.S. $ terms, fell dramatically from U.S. $ 862 per capita on average in to an average of U.S. $ 211 per capita in (Siregar, et.al 2006). Economic growth in China and Indonesia from the agricultural sector shows a relatively has stable rate over the same period except in when the economic crisis hit Indonesia. The data above shows the indicator Agriculture value added per worker (constant 2000 US $) Chinese figures show a relatively lower compared with Indonesia because the number of workers in the agricultural sector in China far more appeal in Indonesia so that the value added automatic per worker go low. Average value of value added per worker in both countries tend to rise from year to year and has a positive impact to the economy and rural development, especially reducing poverty becomes a very difficult disease to be cured in rural areas. Comparison of Agriculture Production China and Indonesia Agricultural production of in the country is an important indicator of development will surely become a benchmark of success of development for the agricultural sector. China and Indonesia has increased agricultural production from year to year becomes the priority in development, especially staple food. Increasing agricultural productivity, including yields for staple crops, will from be critical in Countering pressures for agricultural protection. Staple crops are still the largest agricultural subsector. China s and Indonesia Agriculture has gone undergone since the early 1980 s. Rapid economic growth, urbanization and market development are major factor in the changes, rising income and urban expansion have increased the demand almost all agricultural product food staple although nonstaple food. That change has stimulated sudden shifts in the structure of agriculture to industrialization agricultural sector especially in China. Total production for some commodities important in China and Indonesia are relatively quite high enough where China dominates the numbers, especially on food crops, fruit vegetables, tea, cotton and tobacco this is possible with a total land area is much larger production and development of production fruit and vegetable centers, especially growth in china both small and large scale. For the tea plantations, tobacco and cotton china showed significant differences compared with Indonesia this is because the resource potential for all three commodities were much better, especially the seeds are available and land is much greater than with Indonesia. Productivity commodities in Indonesia should be entitled a higher amount than the china is there on the commodity coffee, cloves, cocoa, coconut and oil crops. Some of these commodities are commodities from Indonesia who would be a contributor to country revenues, especially in the agricultural sector. For Indonesian coconut significantly different from China because Indonesia is an archipelagic nation every beach and coconut-producing regions almost become country land, while China is a very small area is a coastal region. Interesting phenomenon in oil commodity crops where the china in the period showed a much higher production compared with Indonesia, there is a declining trend after 2005 which is still in the domination of its oil production from bean plants and seeds - seeds which remained a food crop, in the year 2005 production figures could be surpassed by Indonesia this is because Indonesia is an exporter of the world's first vegetable oil and commodities which have spread in almost all provinces, especially in Sumatra and Kalimantan, namely palm oil which was developed by the government and multinational companies for both domestic demand and abroad. Productivity is a centrally important issue in economics because it is one of the principal determinants of economic welfare. Analysis of agricultural productivity has a special place in agricultural economics because of the large dependency on natural resources in this sector and periodic concerns that we may be reaching limits in natural resource capital available for food production. The sharp rise in agricultural commodity prices over elevated concerns of global supply and demand imbalances that the rising demand for grain from the increasingly larger and wealthier world population and from the newly emerging biofuel industry was outstripping the ability of farmers to raise production, thus leading to a permanent era of higher real agricultural prices (Keith Fuglie et al 2010) Agriculture Development and its impact to Poverty Alleviation in China and Indonesia Indonesia and China have significant economic growth from the agricultural sector before the era of 90 'but the growth of agriculture will be the backbone of the economy towards industry, the GDP of agriculture in total GDP which from agriculture GDP showed no significant differences in which China and Indonesia showed 16.1% and 15.1% on declining share of agriculture in total GDP, especially towards China due to changes in this industry in line with the opinions of Huang, Rozelle, Pray, & Wang, (2002) While China's past record of economic growth and poverty reduction is 300
317 5 th TOPIC impressive, there are still great challenges ahead. The agricultural growth rate has declined since the late 1980s. Rising input levels in many areas of China and diminishing marginal returns mean that increasing inputs will not provide large increases in output. Water shortages and increasing competition from industry and domestic use for the remaining scarce supplies do not provide much hope for large gains in area or yields from new irrigation expansion. In the future, many have predicted that almost all gains will be productivity driven and these will have to come from second- and third- generation Green Revolution technologies. The poverty impact of growth in the agricultural sector will thus depend increasingly on the poor connecting to these new growth processes, either as smallholders or as laborers. Vertically integrated supply Growth and poverty reduction in agriculture s three world s chains may pose particular challenges for them although recent evidence from China suggests that small and poor farmers take an active part in China s rapidly expanding horticulture economy. According to Alan Piazza and Julia Li (2010) overall economic growth explains much of China s record of success in poverty reduction since Both over time and across provinces, growth in per capita GDP has been closely associated with the pace of poverty reduction. Available evidence also confirms that the impact of aggregate growth on poverty in China has been substantially influenced by the regional and sectoral composition of that growth. Slower-than-average growth in poor regions explains in part the increasing regional concentration of poverty. In addition, uneven growth in agriculture, the main source of income for the rural poor, has contributed to differences in the rate of poverty reduction. Poverty reduction has been slower where agricultural growth has lagged, and faster where agricultural growth has more or less kept pace with that in other sectors. For these reasons, macroeconomic policies that promote growth, especially those that promote efficient agricultural growth and that target regions with high concentrations of poor such as the recent infrastructure investment program, should be seen as highly complementary to microeconomic poverty interventions. However, for Indonesia is little different where agriculture became a central role in development and economic development and certainly also for the alleviation of rural poverty in this case can be seen in the image below in the different periods from scale development of agriculture GDP is still above 10% even greater than this percentage is china also were dictated by Harris D. (2003) The agricultural sector plays an important role in the Indonesian economy. In 2000, agriculture accounted for around 17% of GDP. Most agricultural industries are labor intensive and the sector accounts for about 40% of total employment. Indonesian agriculture is primarily composed of small-scale subsistence farms which account for around 87% of cultivated land. The data above shows how the relationship between poverty reduction performance and agricultural development growth which presented by indicator Agriculture annual growth (%) and Agricultural GDP with the main indicator of poverty level of a Country with indicators Number of Poor People and Percentage of Poor People in China and Indonesia. There are differences in the number of poor people in China and Indonesia are significant enough where the latest data in China in 2007 may have a relatively poor population is much less than with Indonesia only million people as a poor with 1.6% Indonesia has a total population while the number is still much with the number of poor people reached million 16.58% of the population. With annual agricultural growth is a relatively equal greater china Agricultural GDP is small but has a relatively much larger with a significant difference almost 7 times more than Indonesia. There is an interesting phenomenon from the above data on poverty in China in relation to agricultural development can be seen in the period was a reduction of poverty is significantly close to half of the previous amount of 250 million people to 125 million people a very prestigious achievement for a Country in alleviating poverty. If the premises is associated with indicators of agricultural development where agricultural growth in the same period in 1984 still reached 12% even if there is a minus figure in the previous period i.e. in 1980, but it indicates how the role of the agricultural sector can also contribute positively to poverty in China. Between the year of 1997 and 1998 Indonesia's population increased from a total of million people to million people due to the economic and financial crisis that made many people lose their jobs and be poor, while in china the opposite occurs in a drastic reduction of poor population year to year with the percentage decreasing to 4.6% in the same period. This is directly proportional to the growth of agricultural development during this period decreased drastically for Indonesia with agriculture marked a minus annual growth of -1.3 in 1998 could certainly interrelated relationship between agricultural development in Indonesia with a population of rural poor. While in China also shows the same thing because of poor agricultural growth diminishing course toward a better show. 301
318 5 th TOPIC Table 3 Relationship from Agriculture development and poverty indicator such as Number of Poor People (million), Percentage of Poor People (%), Agriculture annual growth (%), Agricultural GDP (Million $ constant 2000 prices) * = not yet obtain the data Number of Poor Percentage of Poor Agriculture annual Agricultural GDP (Million Year People (million) People (%) growth (%) $ constant 2000 prices) China Indonesia China Indonesia China Indonesia China Indonesia ,00 47,20 30,70 33, * * 1980 * 42,30 * 28, * * 1981 * 40,60 * 26, * * , , * * ,00 30,00 14,8 17, * * ,00 27,20 9,40 15, * * ,00 25,90 7,70 13, * * ,00 39,30 7,10 17, ,494 23, ,62 34,01 5,40 17, * * ,10 49,50 4,60 24, * * ,12 47,97 3,70 23, ,881 25, ,09 38,70 3,50 19, * * ,27 37,90 3,20 18, * * ,20 38,40 3,00 18, ,680 29, ,00 37,30 3,10 17, * * ,10 36,10 2,80 16, * * ,65 35,10 2,50 15, ,004 30, ,48 39,30 2,30 17, ,942 31, ,79 37,17 1,60 16, ,439 32, * 34,96 * 15, ,292 33, * 32,53 * 14, ,757 34,775 Sources: BPS (2010), NSBC, World bank, FAO Statistical Yearbook CONCLUSION AND RECOMMENDATIONS CONCLUSION China and Indonesia have significant economic growth from the agricultural sector before the era of 90 'but the growth of agriculture sector is quite different between China and Indonesia. which in China after 90 s period is moved away not depend on the agricultural sector we can saw from variable Agriculture GDP share in Total GDP after 2000 less than 10 %, but in Indonesia in the same period still in 14 %. and also we can saw also in the other indicator that is Agricultural GDP countries of Agricultural population showed Indonesia still more higher than China that s way the of agriculture growth and rural development in Indonesia have a good strategic rule for poverty reduction and China agriculture sector for support the other sector for growth. Policy of agricultural development strategy in China and Indonesia has implications and implementation for agricultural development economically active especially in rural areas are Contribute to poverty reduction have fundamental differences on several critical points, but especially in the period in which Indonesia is experiencing financial and economic crisis that changes the direction of policy drastically and causes of poverty. Many different policies in both countries that became fundamental differences policy in China and Indonesia are centralization in china and decentralization in Indonesia that makes crucial decisions in agricultural development has a direct impact on the welfare and poverty. Various policies centralization in china brings significant changes despite the risk of development inequities between the regions but a drastic impact on agricultural development and national poverty. However, in
319 5 th TOPIC Indonesia it is different with how the transition process decentralization policy that takes time gradually to make good implementation to the target but have some important points especially in empowering the community in a participatory and optimizing use of existing resources in each region into a force in creating jobs and reducing poverty. China and Indonesia is a large country in Asia is an example of success in agricultural development and poverty reduction. There is little equality policies in both countries in agricultural policy, especially in primary commodity production base at the beginning of its development, where rice is a top priority in both countries as a food staple. This policy indicates that the role of staple foods in agricultural policy into a national policy which contributes to rural poverty in both countries. In addition, there are policies to provide incentives to existing agricultural inputs either for subsidy fertilizer or for other agricultural production facilities with a significant contribution in rural development. Poverty alleviation in China and Indonesia, many depend on agriculture in rural development that was actively able to provide a significant contribution to development in both countries. From the data on agricultural policy in China have a determinant factor for a successful policy of agricultural development policy in rural China with base on a target of poverty reduction is also the Rural Agricultural Market - oriented policies which can create the smallest unit in an area into a private sector enterprise that is able to contribute substantial economic impact in rural China with the creation of more business opportunities and create jobs that many farms in each activity. This policy can be adopted in Indonesia into one single national policy in the contribution of poverty alleviation at the national level. RECOMMENDATION Recommendation for further research is : Need to do a thorough research and observation integration between the agricultural sector and other sectors in relation to poverty reduction and also in the overall Development of the various aspects in China and in Indonesia and Critical review focus and deeply on the comparative strengths and weaknesses significantly between poverty alleviation program in the agricultural sector both in two country with implementation and real impact to the welfare of society and implication for other sector if there are real effect for development process. Some recommendations on policies related to agricultural development that is directly related to poverty alleviation, are: Remain a priority in the policy of agricultural production that could increase farmers' income from the start and spread of agricultural technology improvements to create clear market certainty in terms of social, economic, and governmental interference in the market tackle failures. Policies based on agricultural production is certainly of major commodities in each region have their advantages which can each contribute to an area to be able to create added value and great business opportunities in rural communities. Expanding investment policies in agriculture by seeking diversification of products and their derivatives through the private sector for the support from the government that will create more employment opportunities and expanded access of farmers to the banking system also can provide capital for farming, especially in rural areas. This policy is certainly a pro with the empowerment of people through effective and efficient so that it can be implemented well with the capital that is owned mainly from the banking sector. Develop agribusiness in agricultural primary actors also became one alternative in creating the economic conditions in rural areas which would affect poverty. The policy for protects a major agricultural commodity prices in the country by restricting the import policy must still be a central role for farmers and rural communities can enjoy a stable price that will create a better situation in rural and agribusiness community welfare could significantly reduce rural poverty. Need integration between agricultural policy with the policy of poverty reduction with the combination between the roles of central and local governments that provide access, contributing to shape the programs implemented with clear stages of directed and measurable to create a sustainable development policy development and creating equality in every area. Need to increase cooperation between the two countries in the exchange of information and technology in the agricultural sector not only trades in general, the existing container with CAFTA (China ASEAN Free Trade Agreement) so that the product and technology particularly in the agricultural sector capable of contributing to the development of both countries and regional. 303
320 5 th TOPIC ACKNOWLEDGMENT Thanks to Prof. Wang Libin PhD Professor on College of Humanities and Development (COHD) China Agricultural University and also Dr. Edi Basuno Senior Researcher at Indonesia Center for Agricultural Socio economics and Policy Studies as my supervisor and co supervisor who has been guiding and providing direction in this paper as a part of the master thesis. REFERENCES [1]. Daryanto and Morison, J.B. (1992), Structural interdependence in the Indonesian economy, with emphasis on the agricultural sector, : an input-output analysis, Mimbar Sosek: Journal of Agricultural and Resource Socio-Economics, 6, [2]. Harris.David Agricultural trade reform and industry adjustment in Indonesia. Paper prepared for Workshop on Policy Reform and Adjustment Imperial College London, Wye Campus October 2003 [3]. Keith Fuglie & David Schimmelpfennig Introduction to the special issue on agricultural productivity growth: a closer look at large, developing countries. J Prod Anal (2010) 33: DOI /s ) [4]. Liu Jinbao, Chen Jiancheng, Fang Shaoyong and Li Qiang Chinese Agricultural Policies in Thirty Years and Analysis on the Effects. Chn Popu Res Envi, 2008, 18(5): [5]. OECD, The Chinese grain and oilseed sectors. OECD, Paris. [6]. Pasandaran, E. M. Rantetana, Iqbal Economic and Agricultural Policy Development in Indonesia: Summary. Roles of Agriculture Project International Conference October, 2003 Rome, Italy [7]. Piazza A. and Julia Li China Overcoming Rural Poverty. Joint Report of the Leading Group for Poverty Reduction, UNDP, World Bank and The Rural Development and Natural Resources Unit East Asia and Pacific Region. [8]. Siregar, M and Suryadi, M Enhancing Sustainable Development of Diverse Agriculture in Indonesia. CAPSA working paper. 97 [9]. Timmer C. Peter. A (2005) Agriculture and Pro-Poor Growth: An Asian Perspective. Working Paper Number 63 July 2005 Center for Global Development Washington, DC [10]. Uphoff, N. (1999), Rural development strategy for Indonesian recovery: reconciling contradictions and tensions, Paper presented at the International Seminar on Agricultural Sector During the Turbulence of Economic Crisis: Lessons and Future Directions, Center for Agro-Socioeconomic Research, 17-8 February 1999, Bogor. 304
321 5 th TOPIC SUSTAINABLE LIVELIHOOD STRATEGIES AFTER MERAPI VOLCANIC ERUPTION (ASPECTS OF SUSTAINABLE RURAL DEVELOPMENT) Nugroho Hari Purnomo 1 and Widodo Hariyono 2 1 Department of Geography Education, Faculty of Social Sciences, Universitas Negeri Surabaya (UNESA). Ketintang Campus, Surabaya, Indonesia. 2 Department of Public Health Science, Faculty of Public Health, Universitas Ahmad Dahlan (UAD). Research Center for Occupational Safety and Health (OSH), UAD, Indonesia. Master Program of Occupational Health Science, Faculty of Medicine, Universitas Gadjah Mada (UGM) Yogyakarta, Indonesia nugrix@gmail.com, widodohariyono@yahoo.com ABSTRACT In 2010, the government of Indonesia stated the emergency response condition for the area affected by Merapi volcano eruption disaster. In this phase, the government is fully responsible for the livelihood of refugees. It will be different when the emergency phase is over. People who return from refugee camp to their home where danger zone status is being reviewed will have a period of obscurity for longer life. The problem is survival strategy applied by people inhabiting in Disaster Prone Areas (KRB) II and III, after Merapi volcano eruption disaster, especially when the emergency phase is over. This study aims to investigate the characteristics of people survival strategy after the emergency response status ends. The study uses grounded method to which the writer involves deeply in the object being studied or makes them as a part of the research object. The research was conducted in a half year after the eruption of Merapi volcano or when the emergency response phase expired. Analytical approach is based upon the concept of sustainable livelihood strategies and its instrument is victims of Merapi eruption who live in KRB II and III in Umbulharjo and Kepuharjo village, and whose house is appropriate to live in with minor or serious damage. The study results that the assets platform for sustainable livelihood of people living in KRB II and III in a half year after Merapi eruption for pursuing life can be grouped into three basic strategies. The first is based on the bond to homeland, the second is based on the belief in the Merapi volcano and the third is based on economic constraints. These assets have been influenced by custom modifications, land ownership, government, and donors. The resource-based activity towards sustainable livelihoods is the collection of the remaining eruption materials, and non resource-based business is in services sector. Keywords sustainable, rural, livelihood, natural disaster. INTRODUCTION In 2010, the government of Indonesia stated the emergency response to the area affected by Merapi volcano eruption disaster. In this phase, it is fully responsible for the livelihood of refugees and will treat differently when the emergency phase is over people will return from refugee camp to their homeland. The people could expect government interferences to relocate them when their houses or areas were no longer save for being inhabited. However, those whose houses and neighborhood or danger zone status are being reviewed will have a period of obscurity for longer life. They, indeed, have bigger problem for their living based on many decreasing quality aspects of life including houses, occupations, etc. Instead of moving, these persistent people will always maintain their exsistence with various strategies and whatever capitals or asset they have. The description above confirms the problems of post-disaster livelihoods or after a phase of the emergency response. For the case of Merapi volcano eruption, in 2010, the problem was the way of people survival strategy in Disaster Prone Areas (DPA) II and III after the disaster. This study aims to investigate the characteristics of the post-disaster survival strategy ahead of the emergency response 305
322 5 th TOPIC phase of volcano Merapi eruption ended. The benefit of this study is that it obtains a picture of how people select strategies for maintaining the existence of their life. The description is hopefully become a priority program on mitigation stages and phases of emergency responses which strengthens the strategy used by the community after the disaster. METHODOLOGY The method used in this study is grounded into which the researcher involves deeply the object under study or becomes a part of the researched object. The main data sources include the words, actions, and photographs with humans as the research instrument. The main instrument data sources are residents of Merapi eruption victims who live in KRB II and III in the village and Kepuharjo Umbulharjo, Cangkringan, Sleman regency, Yogyakarta and whose houses are still livable by mild to moderate improvement. The informants are specifically people who live in Pelemsari, Pangukrejo, and Kopeng, whose settlement is adjacent to the forefront of phyroclastict field of 2010 eruption. The study selected seven families who made major source of information, and adult family members as informant supporters. The experiment was conducted a half year after Merapi volcano erruption at the end of the emergency response phase, around May June This was to observe the existence of life after disaster and the government-run emergency response. The analytical approach is based on the concept of sustainable livelihood strategies in the context of disaster. There are five sources of life or properties owned by any individual or higher social unit, in the effort to develop life such as (1) human capital, (2) social capital, (3) natural capital, (4) physical capital, (5) financial capital 1. Access to these capitals is often modified by the role of social relations, especially (1) the economic and age, (2) the influence of traditional institutions, especially the customs, (3) the influence of the organization, especially the government and religious faith in the broad sense. Meanwhile, activity towards livelihood strategy relies on natural and non-natural resource base. The analysis in qualitative research is an attempt to work with, organize and sort the data into manageable units; synthesize, search and find patterns, find important and learned thing in it, and decide what can be written in the report 2. Hermeneutic mode is applied to associate with an analog understood by meaning of spoken and textual data. At constructive level, the analysis is discussed based on the theory of sustainable community adaptation and livelihoods. The analysis compares the data with one another, and permanently compares the categories to the others. In general, the process includes the reduction, categorization, and synthesizing data. Examination of data validation uses triangulation techniques, which utilizes a variety of data sources for checking or comparing data from primary sources. RESEARCH RESULT Options of strategies held by a household are flexible efforts to use capital in physical, financial, natural, social and human which administered by considering which one is possible to do. The strategies implemented by informants are described below. 1. Human Capital Human capital is the inherent capacity of an individual in the form of intellectual, emotional, moral, skill, health, beliefs, and many other things owned by the individuals. Related to this human capital, all key informants and their families have good physical or mental health condition. Their average age is productive for physical activity in rural communities. While for education, the informants are of elementary school graduates to Senior High School. Some of them are good at carpentry, both carpenters and stone, and some others do not have special skills. The most prominent knowledge they have is about animal rearing, including the planting its food and caring for livestock. In addition, they are good at dryland agricultural farming crops and tree planting. 306
323 5 th TOPIC The most important capital for human in life is faith as the guide and way of life. The faith can come from religion or from customs or tradition. All informants and the majority of the population in the study area are Moslems. Their appreciation of the existence of religion is belief in God and becomes the foundation of life submission. The informants also hold beliefs in addition to and associated with the eruption, the beliefs, customs, and traditions inherited by their ancestors. 2. Financial Capital Financial capital is the possession of individuals and families in the form of cash or money saved in an account or money they are entitled to but cannot be used in current condition. Related to this financial capital, all key informants and their families did not have financial savings during disasters. In the emergency phase, they depended on the donors through the government official in refugee camps, such as living allowance and other donors. The government gave them daily life cost around Rp4,500 or they received it at once in uncertain time. The informants try hard to get more cash by relying on the tourism sector (lava tourism; environmental disaster) or carpentry. 3. Physical Capital Physical capital is a means supported as well as the underlying infrastructure and needed by the community in the daily life activities. After the eruption, public facilities and infrastructure of water, electricity, and transportation, especially roads, were damaged and could not function at all. The road as main infrastructure needed immediate cleansing by government and volunteers, by removing dust and moving the trunks of fallen trees. Meanwhile, clean water infrastructure could not work at all until six months afer eruption. To overcome current situation, Indonesian Red Cross supplied clean water for free and Department of Public Work provided water reservoirs for collective use. While, electricity could be used five months after eruption because State Electricity Company (Perusahaan Listrik Negara/PLN) assumes that as long as there are houses inhabited by a population, the network power will be reconnected. The entire reconnecting cost will be covered by PLN, because the electric pole is still available. For the extended electrical connections to different houses, the charge is taken by the people whose houses were reconnected. Another important physical capital and used by all informants is motorcycles. At the time of the eruption, the motorcycle used for transportation to shelters and this means of transportation is a mainstay in doing all activities and meeting the various needs of life. 4. Natural Capital Natural capital is the stock of resources that can be used by the informants. Some times after returning home from refugee camp, the informants took and collected items that could be reused or sold. One source of income that could immediately make money was wood from fallen trees in the joint operation garden and the yard at their disposal, as well as in the surrounding streets where they live. Wood became the only asset for getting the money since existing crops and everything had been destroyed. Livestock industry which became the mainstay of the southern slope of Merapi volcano suffered destruction because of the toll death of livestock and decreased milk production. The government promised that the dead cattle would be paid off and they would get money five months after eruption. It would not delivered at once but simultaneously or in stages to all citizens whose cow died. For the time being, it had not been used to buy cattle because of difficulties in the provision of feed, in addition to damaged stable conditions. 5. Social Capital Social capital is a wealth of social relations owned by the community such as norms, networks, membership of groups, relationships based on beliefs, exchange rights which may reduce transaction costs, and many more. In general, Javanese society has enough strong bond of social capital in the villages. The residents were evacuated together in different areas of Merapi volcano slopes and it proved the strong bond among them. It can also be seen in the refugee camp where they share the place together in one area based on the origin of the residence. 307
324 5 th TOPIC Although chaos happened at the time of refugee mobilization, when conditions started to be conducive, they tried to contact their relatives or neighbors. However, some time after disaster, informal social capital, such as the villagers meeting network, neighborhood network, pillars of citizens, the ten-house community, Islamic study groups, youth groups, sports groups, and others seemed to stagnate. Not long afterward or about two to four months after the refugees living in the shelter, some of these activities, especially the activities of villagers faith lecturing and meetings as well as neighborhood network became reactivated. All informants stated that the social bond they have are close relatives, neighbors, distant relatives, and their social systems. At the time of the disaster, relatives and neighbors had been at the same panic. Social functions applied were similarities fate as refugees. Some of them who did not have distant relatives would stay with relatives and neighbors in collective camps provided by the government. While those who had distant relatives, would stay at their relatives. The main social function is a mutual assistance during the evacuation and mutual help in home repairment after returning home from the camp. The discussion above indicates the activity of the community in selecting an asset management strategy platfom to sustainable livelihoods a half years after disaster and can be grouped into three basic strategies in pursuing life. The first strategy is based on the bond with the homeland. The next is based on a belief in the Merapi volcano and the third strategy is based on the economic problems. The first strategy or the bond of native land correlates with a belief system adopted by the community because it has a pretty close relationship for their daily life. The close relationship between Javanese people and their homeland forms a strong emotional bond to the Javanese community 3. A common proverb in Javanese community is "A family must be together whether they have meal or not", showing how high they have bond with the land of their origin. The people of southern slope of Merapi volcano apply this beliefs for homeland because the way they get the land and the inheritance of social and cultural life in the long term from their ancestors. They prefer persisting in the region where they belog to because of origin, even they live in area of danger, to having spatial mobility to areas without relatives or obscurity of life. The second strategy is based on the specific belief of people in southern slope of Merapi volcano, which is related to the myth of Merapi. This picture of faith is a part of life in the world interacting with the supernatural and the physical environment. The faith of territory origin and the precursor of Merapi eruption are not only ideas of two belief systems but also realized by most people in the form of ceremonial rites 4, 5. Suran and Nyadran are preserved ceremonial people do until now. Suran pertains to the Javanese new year having linkages with the activity of Merapi Volcano eruption, while Nyadran is a part for remembering ancestors. The third strategy is based on the economic issues in the study area. The economic problem occurs when people have to perform spatial mobility, while at the same time, the area they inhabit has high economic potential. This is also a factor of their reluctance to perform spatial mobility. For a long time, people here have realized that the area where they live is a disaster-prone area of Merapi volcano. However, because they have no choice of housing options as a result of the limitations of the resources for livelihood in other places or get the land as inheritance, they still persist in the region. Limitations of livelihood elsewhere and abundance resources at the site make them prefer to stay in the disaster area although disaster is always haunted them anytime and indeed, they want to move to another location, if there is a better guarantee of a better economy growth 6. Management of assets that are divided into three basic sustainable livelihood strategies pursued by the society after Merapi Volcano eruption is influenced by custom modifications, land ownership, government, and donors. Bond to the homeland and the specific beliefs of the Merapi Volcano is a modification of traditional heritage, acquired hereditary. Meanwhile, the modification of land ownership to the management of assets is the reluctance of people to be relocated permanently in shelters provided by the government. The government modifies 308
325 5 th TOPIC management assets by providing regulation to overcome disaster and providing assisstance in various forms including living allowance. On the other hand, donors provide assistance in many forms, both material and non-material. The activities to maintain sustainable livelihoods are based on resource or by collecting post-eruption material and non-resource-based especially in tourism services after disaster. This suggests that the survival strategy is a strategy adopted by the informants. They try to survive relying on what is left over or whatever they have and what they can do with the condition of existing capabilities. They do this because they have no other alternatives for a better life. Their activities in new jobs do not require special skills, such as maintaining admission tickets for tourism site, parking services, being a motorcycle tour rider, as well as selling a variety of things needed by the travelers. To get a chance as well as capital in such activities cannot be separated from the network, especially through youth organizations or community where they live along with direct or indirect help from government or private donor. However, the new job has a fairly strict level of competition with other neighbors who are also trying to earn a living. CONCLUSION The results show that the assets platfom for sustainable livelihood strategies of people living in disaster prone area II and III a half year after Merapi volcano eruption can be grouped into three basic strategies. The first is based on the bond of the homeland, the second is based on the belief in the Merapi volcano, and the third is based on economic issues. These assets have been influenced by custom modifications, land ownership, government, and the donors. The activity of resource-based sustainable livelihoods is collecting post-eruption material, while for non-resource-based they mainly run tourism services business. REFERENCE [1]. Saragih, S., Lassa, J., dan Ramli, A., Kerangka Penghidupan Berkelanjutan. Jakarta, Hivos South-East Asia Office, [2]. Moleong, L.J., Metodologi Penelitian Kualitatif. Bandung, Remaja Rosdakarya, [3]. Suseno, F.M., Etika Jawa. Jakarta, Gramedia Pustaka Utama, [4]. Koentjaraningrat., Kebudayaan, Mentalitas, dan Pembangunan. Jakarta, Gramedia Pustaka Utama, [5]. Triyoga, L.S., Merapi dan Orang Jawa. Persepsi dan Kepercayaannya. Jakarta, Kompas Gramedia, [6]. Mulyati, R., Agustina, I., dan Akbar, F.B., Minat dan Efikasi Diri Warga Korban Erupsi Merapi untuk Bekerja di Bidang Pekerjaan yang Baru. Makalah Seminar Nasional Pengembangan Kawasan Merapi. Aspek Kebencanaan dan Pengembangan Masyarakat Pascabencana. Yogyakarta, Direktorat Penelitian dan Pengabdian Kepada Masyarakat, dan Magister Teknik Sipil, Universitas Islam Indonesia,
326 5 th TOPIC 310
327 5 th TOPIC APPLICATION OF SMALL SCALE PROGRAM OF FARMER PARTICIPATION ON LAND AND WATER CONSERVATION MEASURES TO SIMULATE REALISTICS WATERHED MANAGEMENT Sahid Susanto 1, Chandra Setyawan 1, Sukirno 1 1 Staff member at The Department of Agricultural Engineering, Faculty of Agricultural Technology Gadjah Mada University, Indonesia chandra.tep@ugm.ac.id ABSTRACT A small scale program of farmer participation on the fertile land and water conservation measures of mountainous area has been applied to simulate the realistics watershed management. The upper watershed area of Mrica dam, located at mountainous area of Dieng Wonosobo Central Java was used as the simulation. The area is intensively cultivated by the farmer for potatoes plant. Intensive cultivation gives the implication on land degradation in this area. The small scale program was directed on cultivation land and river system. On the cultivation land, the program was focused on erosion control through application of plastic mulch and land contour cultivation. On the river system the program was directed to built, namely sediment control structures which has functioning for sedimentation storage and water harvesting on the river. The result shows that the small scale program is significantly affect the decreasing of erosion and at the same time it can increase productivity of potatoes cultivation. The small scale program then was used to simulate with six realistic scenarios of watershed management in this area. The scheme of scenarios are directed to: 1) three realistic scenarios of land use pattern and 2) three realistic scenario of sediment control structures in term of number and position in the river system. By using instrument of quantitative watershed management assessment the performance reflecting the scenario can be described the position of watershed condition. The range score of quantitative value is 1-4. Score in the existing condition is 1.9 (poor). Comparing with the existing condition, all the scenarios proved that score of watershed management increase for each scenario, ranging from Application the scenarios in real condition have to be selected one of the scenario which reflects optimal watershed management. The selected scenario must consider social and economic aspect in related to land cultivation occupied. Keyword: farmer participation, land and water conservation measures, watershed management INTRODUCTION A small scale program of farmer participation on fertile land and water conservation measures of mountainous area was applied to simulate the realistics watershed management. The small scale program was focused on the mountinous land cultivation and river system. On the land, farmers participation were involved on the program to control erosion by application of plastic mulch and land contour cultivation. On the river system, the farmers were invited in the program to build small sediment control structures and gully plug. The upper watershed area of Mrica dam ( km 2 ), located at mountainous area of Dieng, Wonosobo Central Java was used as the simulation (Fig.1). The location is tipycally mountainous area with fertile soil. The farmers cultivate land intensively for pototoes without good land and water conservation principles. This intensive cultivation gives affect on land degradation in the form of increasing erosion on the land and sedimentation in the river. The aim of this study was directed to 311
 Permanent land covering Production land covering Others Fig.1.")
 and RRA (Rapid Rural Appraisal) were used to indentify social and economic aspect of the farmers.")
 were placed as financial and material support.")
328 5 th TOPIC find realistics watershed management simplified by modified land use pattern on the land and constructing small sediment control on the river. Mrica Dam ( km 2 ) Permanent land covering Production land covering Others Fig.1. Upper Watershed of Mrica Dam METHOD The small scale program which contain soil and water conservation measures was inisiated through dissemination of the program to the farmers and the selected villages. PRA (Participatory Rural Appraisal) and RRA (Rapid Rural Appraisal) were used to indentify social and economic aspect of the farmers. In one side, the farmers were placed as the implementator of the program and beneficiaries as well. The other side, the government sq. the Serayu Opak River Basin Office (BBWS-SO) were placed as financial and material support. The role of Gadjah Mada University team involved in planning, designing, coaching and supervision of the program. The small scale program then was extended to simulate watershed management simplified by optimal land use pattern on the cultivated land and sedimentation control on the river system. Six scenarios was developed to execute the watershed management. The six design of scenarios were: 1) three realistic scenarios of land use pattern and 2) three realistic scenario of sediment control structures in term of number and position in the river system. On the land, three scenarios of land use pattern were directed to change cultivated land to forest area on high slope land as permanent land cover. On the river system, three scenarios were carried out by constructing small-scale sediment control on tributaries and gully plug in term of number and position in the river system. To asses watershed management scenarios were used a quantitative model. The model contains three indicators: (i) basic performance indicators as the output reflecting the integrated effects, (ii) proxy indicator as the input reflecting the intervention of watershed through water resource conservation measures, and (iii) impact indicators reflecting the social and environment effects. As the watershed outlet can reflect the integrated effect of watershed management, the basic parameter can be used as indication of effectiveness of watershed management scenario. Parameter of the basic 312


. Fig. 2.")
329 5 th TOPIC indicator contains hydrology, erosi and sedimentation and water availability. Calculation of hydrologic parameters are used simple hydrologic model of Mock, erosion and sedimentation calculated by USLE and meyer peters muller equation and water balance approach is applied to predict water availability Total indicators are performed by scoring with applying weighting factors in each indicator. Range of the total score is 1-4. As the outlet of watershed. Small scale program RESULT AND DISCUSSION RESULTS The small scale program was implemented at Patak Banteng village where most of people there work as farmer. About 3 km2 cultivated area in this village was used in the program. Farmer participation was applied in the program which was directed in two places, ie. on land and on river. Program that focused on the cultivated land were regreening, applying mulch and terracing (Fig.2). Fig. 2. Soil and Water Conservation Measures on Land a). farmer participation meeting b). hand over of forest plant to the farmer c.) plastic land mulch d.) land terracing The program on the river includes reforestation along the river, making gully plug, and build sediment control structures (Fig.3.) 313


330 5 th TOPIC - Fig. 3. Soil and water conservation measures on the river: a) gully plug, b). Regreening on river bank, c). and d). Sediment control structures The result shows that the program can improve degraded cultivated land in this area. Land use pattern simulation Application of the program then was extended to a watershed scale. Using instrument of quantitative assessment of watershed management, total score of the existing condition of the watershed is 1.9 (poor condition). The basic parameters of the instrument show that erosion is ton/ha/year) and reservoir sedimentation is 6.2 mm/year, or about 4 million m3/year. Assessment results of watershed in the existing condition is presented in Table 1. Table 1. Assessment Results of Watershed Condition No Indicators Unit Value Category 1 Erosion ton/ha/year bad 2 Sedimentation mm/year 6.2 bad 3 Specific maximum discharge m 3 /sec/ km good 4 Specific minimum discharge m 3 /sec/ km moderate 5 Coefficient of river regime good 6 Water storage million m 3 /year 0.76 moderate 314
 and production land cover index (LcDi) Permanent land cover consists of forest,")
331 5 th TOPIC In order to reduce erosion and sedimentation in this watershed, modification of land use pattern was used three scenarios (Fig.4.). In this scenarios, land use pattern was simplified in two types of index, namely and permanent land cover index (LcPi) and production land cover index (LcDi) Permanent land cover consists of forest, scrub/shrub, and grass, meanwhile the production land cover consists of upland crop and rice field (Table 2 and Figure 4). Table 2. Scenarios of modification of land use pattern Land Use pattern Modification of land use pattern Existing condition Scenario I Scenario II Scenario III 6% of LcDi & 80% of LcPi 70% LcDi & 20% LcPi 60% LcDi & 30% LcPi 50% LcDi & 40% LcPi Notes: LcDi= Land Cover Production Index LcPi= Land Cover Permanent Index The result shows that three scenarios of modification of land use pattern are able to reduce sedimentation significantly. The value of basic indicators is presents in Table 3. existing condition scenario 1 scenario 2 scenario 3 Fig.4. Scenario of Land Use Management 315
332 5 th TOPIC Tabel 3. Basic indicator of watershed management Land Use Simulation Hydrology, (runn off coef.) Erosion (mm/thn) Existing condition (high) Scenario I % LcDi & 20% LcPi (moderate) Scenario II 60% LcDi & 30% LcPi Scenario III 50% LcDi & 40% LcPi Notes: Lcdi= Land Covering Production Index Lcpi= Land Covering Permanent Index (moderate) (mild) Sedimentation (mm/thn) Water Storage 5.46 Surplus 2.85 Surplus 1.86 Surplus 0.94 Surplus Sediment control structures simulation Applying watershed management in the form of sediment control structures, simulation was directed to find how many total structures needed to control sedimentation on the river. The simulation was use with applying the sediment control structures which was built in several points on river network of order 2. The location and distribution of the structures can be seen in Fig. 5. The control structures capacity determined based on the analysis of sediment yield in the catchment area. There scenarios was use to simulate constructing number of the sediment control structures of 10, 20 and 30. The results shows that the simulation with three scenarios proved that sedimentation can be reduced 47.85% for scenario 1, 65.84% for scenario 2 and 82.69% for scenario 3, respectively. DISCUSSION The real condition of degraded watershed is significantly due to socio-economic pressures. Open land for cultivation for potatoes plant covers until 80% of total watershed area is closely related with densely populated area in this watershed with average people per square kilometer is Natural carrying capacity of this area to support food for the people who live here is already exceeded. The potatoes land cultivation is the main livelihood for the farmers. Therefore, the selection of the scenarios to be applied in the field depends on the socio-economic condition of the farmers. In the real condition, selected choosing one of the scenarios should be considered in order to get optimal watershed management. 316

333 5 th TOPIC Fig.5. The Location and Distribution of The Sediment Control Structures CONCLUSION Implementation of small scale program in the form of soil and water conservation measures with involving farmer participation can be placed as an intervention of degraded watershed management. The program which is directed in two areas, on the land and on the river proved that erosion on the land and sedimentation on the river can be reduced. Scaling up the program to watershed area using some scenarios oriented on the cultivated land through modifying land use pattern and on the river through constructing sedimentation control structures show that erosion and sedimentation can be reduced significantly. Using instrument of quantitative assessment of watershed management can increase score of the existing condition of watershed from 1.9 (poor) to (good). Simulation results of land use or sediment control structures only can't improve the condition of watersheds in both categories. Watershed conditions in good category can be achieved using a combination of sediment control structures and land use arrangement. Application the scenarios in real condition must be selected one of the scenario which reflects optimal watershed management. The selected scenario must consider social and economic aspect in related to land cultivation occupied. 317
334 5 th TOPIC REFERENCE [1]. Brooks, K.N Hydrology and The Management of Watershed. Iowa State University Press. [2]. Soemarto, C.D Engineering Hydrology. Erlangga. Jakarta, Indonesia [3]. Debarry, Paul A Watershed Processes, Assesment and Management. John Wiley and Sons, New Jersey,USA. [4]. Fangmeier, Delmar D. Etc Soil and Water Conservation Engineering. Thomson Delmar Learning.New York.USA. [5]. Frederick R. Troeth Soil and Water Conservation for Productivity and Enviromental Protection. Pearson. New Jersey. USA. ACKNOWLEDMENT This paper could not be realized without financial support from the Office of Serayu-Opak River Basin Development, Yogyakarta. For that reason, sincerely thank is addressed. 318
335 6 th TOPIC
336
337 6 th TOPIC CRITERIAS IDENTIFICATION OF EYE DISEASES IN ORDER TO DEVELOP AN EXPERT SYSTEM FOR EARLY DIAGNOSIS OF GLAUCOMA Retno Supriyanti 1, Guruh Syahroni 1, Sri Wisnu Respati 1, Yogi Ramadhani 1, and Tutik Ida Rosanti 2 1 Electrical Engineering Department, Jenderal Soedirman University, Indonesia 2 Medical and Health Sciences Faculty, Jenderal Soedirman University, Indonesia retno_supriyanti@unsoed.ac.id ABSTRACT Glaucoma is one of eye disesases that affect to the vision. Currently, there are a lot of equipment for supporting diagnosis of glaucoma by an ophthalmologist. Considering the number of ophthalmologist is limited especially in developing countries, in this reseaech we developed an expert system for helping an opthalmologist to make early detection of glaucoma. Therefore, an ophtalmologist will not spend his time for detecting normal patients but he could focus to the patient who already has symptops of glaucoma. We developed an expert system based on Analytical Hierarcy Process (AHP) method. In our system, diagnosis refer to the priority weight of patient symptoms. The result shows that our system success to detect normal glaucoma patients about 75%. Keywords: glaucoma, expert system, blindness, AHP, limitation of opthalmologist. INTRODUCTION In normal condition, a human always have five sensibilities. One of them is eye as a vision sensibility. Almost all human activity requires a vision in order to get a good achievement. Therefore as a human we have to keep care of our eyes from diseases especially eye diseases that affect to our vision. However because of limitation of our knowledge, sometimes it is difficult to understand symptoms of eye diseases, therefore when an eye disease attacks us, suddenly it was diagnosed as a serious condition by an ophthalmologist. One of eye diseases that have a fatal affect is glaucoma. This eye disease can cause a blindness in which glaucoma has second rank in the world as an eye disease that causes blindness after cataract. In our previous research [1] [2] [3] [4] [5] [6] [7] [8] [9] [10] [11] [12] [13] we success to develop a simple system for detecting cataract. We used digital image processing techniques for detecting cataract. We extracted all informastion appearance inside pupil. However when we implement this method to detect glaucoma, it will be failed. This is caused by the symptoms of glaucoma is different with cataract. Cataract is a clouding in the lens that affect to the vision [1] therefore we able to detect a whitish color inside the pupil. Also we success to develop a method in which we use a specular reflection appears inside pupil to judge a people with cataract or no. However, the symptoms of glaucoma require further discussion with an ophtalmologist to get a correct diagnosis. Sometimes it is also requires some equipment for supporting diagnosis such kind of equipment to measure eye pressure, slit lamp, etc. In this paper we will emphasize to develop an expert system for detecting glaucoma symptoms. The goal of this research is helping an opthlamologist to skip discussion phase with a patients in early diagnosis step therefore he could focus his time to handle patient with symptoms of glaucoma only. This system is dedicated to the area in which there are limitation of opthalmologist. 321
338 6 th TOPIC METHODOLOGY Expert system is a computer system that emulates the decision making ability of a human expert [14]. Expert system are designed to solve complex problems by reasoning about knowledge like an expert and not by following the procedure of a developer as is the case in conventional programming. Figure 1 shows the steps we did in this experiment. Start Developing database Developing simulation of expert system Comparing result of simulation and result of ophthalmologist Stop Figure 1. Flowchart of experiment In order to diagnose eye disease, an ophthalmologist has to know the symptoms of eye disease itself. However, some times they still further analysis of the symptoms that should be done in laboratory. In this research, we made a modification of eye diseases tracking that emphasize into how to determine question plot by determine database priority both of horizontal and vertical in order to get accurate tracking of eye diseases. In this research we implemet Analytical Hierarcy Process (AHP), because AHP is a good method for making a decision. Priority will be calculated when the user enters the symptoms suffered only. When there is active symptomps then user inteface will send a command to the conclusion machine to enable priority table accornace to the input from user. Table 1 describes the code of eye disesases. 322


339 6 th TOPIC Table 1. Code of diseases in our system According to the Table 1, in this paper we classify eye diseases into glaucoma and other eye disease, therefore we made a modification of eye diseases classification as described into Table 2 and identify symptomps of eye diseases as described in Table 3. Table 2. New Code For Eye Disesases 323


340 6 th TOPIC Table 3. Code of Symptoms According to Table 2 and Table 3, the we combine both table to make a relationship as described in Table 4. Table 4. New Modification of Knowledge Database 324


341 6 th TOPIC However, in order to make a convergence disease, we modify new code for eye diseases as shown in Table 5. Table 5. Final Code For Eye Diseases In our system, the symbol of of eye diseases is G1 for Closed angle-glaucoma, G2 for open angle glaucoma, K for Cataract, P1 for other eye diseases, and N for normal eye. Therefore we could make priority for determining weight of AHP in the range 1 to 9. In order to find priority of eye disease due to user entry, it is need 3 priority tables, first is table between one symptom to others, second is table between eye disease to symptom and third is table of total priority. Table 6. Priority Table Between Symptoms When There Is No Sysmptom Activated According to Table 3, in each column A Z and each line A-Z, there is a zero. This cell is a priority multiplier of symptoms to other symptoms. Behind every column of symptoms from A to Z and over the line every symptom from A to Z are zero, this cell is a priority multiplier of symptoms to other symptoms that are stored in Table

 for each disease to other diseases is the sum of all left after being divided by the number of cells below it, and then divided by 5, since there are 5 criteria.")
342 6 th TOPIC Table 7. Priority table when all symptoms are activated When the column behind the symptoms column activated by giving the value of the pixel, then the priority of the symptoms of the symptoms on the symptom that has been activated will change its value according to the table 7. In order to determine priority of a symptom to eye diseases, an example is described in Table 8. Priority Vector (PV) for each disease to other diseases is the sum of all left after being divided by the number of cells below it, and then divided by 5, since there are 5 criteria. Eigen Value is the sum of each P, multiplied by the number of cells of each column down in each G1-N1. CI is the index consistency to find consistency throughout the statement priority. CI obtained from Equation 1. While CR which is the normalization of the CI, obtained from the Equation (1) Table 8. Priority table of symptom A 326

343 6 th TOPIC While CR which is the normalization of the CI, obtained from the Equation (2) Where RI is an index ratio for normalization of CI, whose value depends on a number of criteria. RI obtained from the table 9. Table 9. Table of Index Ratio CR is a value of priority consistency in percentage. In AHP, the percentage value of inconsistencies in the priority table should not be more than 10%. Therefore all priority tables are within tolerable limits. In order to obtain the total priority, then it is created a table of total comparison as shown in Table 10. Table 10. Total Priority Evidence column is a representation of the user response as described from the previous example in Table 4. with active symptoms are A. G1 row column value A obtained from Pv symptoms of disease symptoms of G on A. Total weight, derived from summing all P for each disease is first multiplied by P, the symptoms of each disease. Priority obtained from the comparison between the total amounts of the total weight of each disease. From the examples given, the disease is recommended engine another eye disease or P1. EXPERIMENTS AND RESULTS In order to determine whether our system working properly, we tested our system to the patient who visited Eye Clinic directly. Performance of our sytem is calculated according to the percentage of correct answers entered into system by patients. The result of our experiment is described in Table 7. During diagnosis the system analyzes the disease based on symptoms that exist in patients regardless of laboratory tests. Therefore, it is sometimes quite difficult for the system to determine the type of disease suffered by the patient if the patient does not give information about the symptoms he/she suffered completely or has not received complete symptoms according the disease actually suffered. 327
344 6 th TOPIC For open-angle glaucoma, symptoms that occur include eye pain even to the pulsating, red eye, excess water out of the eye, eyelid swelling, decreased vision function, look around the circle of light, pain in the head even to the throbbing, pupil not shrink when given light, experiencing nausea to vomiting. For closed-angle glaucoma, symptoms that are often experienced by patients is decreased visual function by narrowing the field of vision, looking around the circle of light, it was difficult to adapt in the dark. By adding eye pressure test results, it can be more accurately determined that a patient suffering from glaucoma. Table 7. Performance of system Refer to the Table 7, From 12 patient glaucoma, our system success to diagnose 9 patient glaucoma. Failure of diagnosis due to some some factors such as incomplete evidence entered by patient. In addition, as we discussed above that our system require to consider about laboratory test in order to get diagnosis accurately. CONCLUSIONS Our system is promising for early screening of glaucoma and other eye diagnosis, although there are some limitations. This system depends on evidence given by patient that will affect to the accuracy of diagnosis. In order to improve performance of our system, future research will consider entering laboratory test into system, therefore we will get accurate diagnosis. ACKNOWLEDGMENT This work is supported by Directorate General of Higher Education through Decentralization Research HIBAH BERSAING Fiscal Year 2013 under contract number 2740/UN23.10/PN/2013. REFERENCES [1]. Retno Supriyanti, Hitoshi Habe, Masatsugu Kidode, Satoru Nagata, A Simple and Robust Method to Screen Cataract using Specular Reflection Appearance, SPIE Medical Imaging Conference, San Diego, California, February, [2]. Retno Supriyanti, Hitoshi Habe, Masatsugu Kidode and Satoru Nagata, Cataract Screening using Reflection on Eye Lens, Symposium of Sensing via Image Information (SSII), Yokohama, Japan, June, 2008 [3]. Retno Supriyanti, Hitoshi Habe, Masatsugu Kidode and Satoru Nagata, Cataract Screening by Specular Reflection and Texture Analysis, The 2nd International Conference on Bioinformatics and Sytem Biology, Leipzig, Germany, March, [4]. Retno Supriyanti, Hitoshi Habe, Masatsugu Kidode and Satoru Nagata: Cataract Screening by Specular Reflection and Texture Analysis, Communications of SIWN, Vol. 6, pp , [5]. Retno Supriyanti, Hitoshi Habe, Masatsugu Kidode and Satoru Nagata, Extracting Appearance Information inside the Pupil for Cataract Screening, IAPR Conference on Machine Vision Application, Tokyo, Japan, May, [6]. Retno Supriyanti, Hitoshi Habe, Masatsugu Kidode and Satoru Nagata, Compact Cataract Screening System: Design and Practical Data Acquisition, International Conference on 328
345 6 th TOPIC Instrumentation, Communication, Information Technology and Biomedical Engineering (ICICI- BME), Bandung, Indonesia, November, [7]. Retno Supriyanti, Yogi Ramadhani, Hitoshi Habe, Masatsugu Kidode, Performance of Various Digital Cameras for Cataract Screening Techniques based on Digital Images, International Seminar of Electrical Power, Electronics, Communications, Control and Informatics (EECCIS), Malang, East Java, Indonesia, December, [8]. Retno Supriyanti, Yogi Ramadhani, The Achievement of Various Shapes of Specular Reflections for Cataract Screening System Based on Digital Images, International Conference on Biomedical Engineering and Technology (ICBET), Kualalumpur, Malaysia, June 17-19, 2011 [9]. Retno Supriyanti, Hitoshi Habe, Masatsugu Kidode, Low-Cost and Easy-to-Use Equipment for Cataract Screening based on Digital Images, The 12th International Conference on Quality in Research (QIR), Bali, Indonesia, July 4 7, 2011 [10]. Retno Supriyanti, Atsuo Inomata, Kazutoshi Fujikawa, Tele-Opthalmology for Rural Areas in Indonesia: Preliminary Study of Image Acquisition Rate using Various Bandwidth, International Conference on Bioinformatics and Biomedical Science (ICBBS), Bangkok, Thailand, April 7-8, 2012 [11]. Retno Supriyanti, Yogi Ramadhani, Consideration of Iris Characteristics for Improving Cataract Screening Techniques Based on Digital Image, International Conference on Biomedical Engineering and Technology (ICBET), Hongkong, June 2-3, 2012 [12]. Retno Supriyanti, Budi Setiawan, Eko Murdyantoro, Haris Budi Widodo, Detecting Pupil and Iris under Uncontrolled Illumination using Fixed-Hough Circle Transform, International Journal of Signal Processing, Image Processing and Pattern Recognition, Volume 5 No 4, December 2012 [13]. Jackson, Peter, Introduction to Expert System 3ed, Addison Wesley,
346 6 th TOPIC 330
347 6 th TOPIC THE HEPATOPROTECTIVE EFFECT OF ETHANOL EXTRACT OF PLANTAIN (PLANTAGO MAJOR L.) ON DRUG INDUCED HEPATOTOXIC RAT (RATTUS NORVEGICUS) MODEL E Sutrisna 1, A A Fitriani 1, I A Salim 2, A M Maskoen 3, M Sujatno 4, and H S. Sastramihardja 4 1 Department of Pharmacology and Therapy Faculty of Medicine and Health Sciences Jenderal Soedirman University, Purwokerto, Indonesia 2 Department of Patology Faculty of Medicine and Health Sciences Jenderal Soedirman University, Purwokerto, Indonesia 3 Molecular Genetic Laboratory, Health Research Unit, Faculty of Medicine, Padjadjaran University, Bandung, Indonesia 4 Department of Pharmacology and Therapy Faculty of Medicine. Padjadjaran University, Bandung, Indonesia ABSTRACT Liver is the organ which risk to damage by various drugs or chemical substance in the body. Plantago major L. is a weed that grows in many tropical regions, include in Indonesia. Plantago major L has a lot of active subtances, such as Terpenoids, Iridoid Glicosid and Flavonoids that show anti-inflammatory, anti apoptosis, anti proliferative and antioxidant effect. These effects are potential to protect the liver from drugs induced hepatotoxic reaction such as inflammation, oxidative stress, cell injury, degeneration, necrosis ect. This study was to evaluate the effect of ethanol extract of Plantago major L.on reduction of hepatic transaminases and improvement of histopathologic appearances on Omeprazole and Ciprofibrate induced hepatotoxic rat (Rattus norvegicus) model. By experimental study and post test only with control group design, 20 of rats was divided in to 4 groups. Group I as a negative control was given Omeprazole 10mg/200gBW rat and Ciprofibrat dose 16 mg/200gbbrat/day per oral. Group II was given Omeprazole 10mg/200gBW rat and Ciprofibrat dose 16 mg/200gbb rat/day and Plantago major L.50mg/200gBW rat/day per oral. Group III was given Omeprazole 10mg/200gBW rat and Ciprofibrat dose 16 mg/200gbb rat/day and Plantago major L. 100mg/200gBW rat/day per oral. Group IV was given Omeprazole 10mg/200gBW rat and Ciprofibrat dose 16 mg/200gbb rat/day and Plantago major L.200mg/200gBW rat/day per oral. There were significantly difference of AST (p=0,003; α<0,05), ALT (p=0,004; α<0,05) and histopathological appearance between groups (p= 0,001; α<0,05) Dose 50mg and 100mg/200gBW rat/day per oral of ethanol extract of plaintain are more effective as a hepatoprotective than dose 200mg/200gBW rat/day per oral. This research can be concluded that administration of ethanol extract of Plantago major L. can protect the liver damage on drug induced hepatotoxic rat (Rattus norvegicus) model Keyword: Drug-Induced Hepatotoxic, Extract of Plantain., Hepatoprotective, Rat model INTRODUCTION Drug induced hepatotoxic (drug induced liver injury) is common consequence of the liver as a metabolizing organ for various drugs and also other chemical substances in the body. Liver is one of the main organ that has highly risk to damage cause by drug administration, especially hepatotoxic drugs [1]. Liver is the important organ which responsible to metabolism process and a lot of biochemical reaction in cellular level. Liver damage tend to metabolic disorder and to rice dangerous sstemic disease [2]. Drug induced hepatoxicity has been one of the main risk factor of hepatic failure and liver transplantation in the some country such as United State and other west country [3]. About 50% of all hepatic failure cases occured by drug induced mechanism [3]-[5]. Drug induce hepatotoxicity has been one of the frequent reason for removing approed drug from the population (market) [6]. In spite of, every drug has been developed under preclinical and clinical trial for detection the hepatotoxic effect, this toxic effect may occur in some individuals who are more susceptible to drug effects that 331
348 6 th TOPIC related to genetic factor [7]. In many clinical trials of new drugs, up to 15% of study patients may demonstrate mild elevations of alanine aminotransferase (ALT) or aspartate aminotransferase (AST) activities [8]. Elevation of ALT and AST associated with hepatic cellulare injury (inflammation, degeneration or necrosis) [2]. The mechanism of drug-induced hepaotoxicity commonly involves the toxic drug or metabolite that either elicits an immune response or directly affects the biochemistry of the cell. The drug metabolites can be free radicals (reactive metabolite) that promote a variety of chemical reactions, such as the depletion of reduced glutathione, covalently binding to proteins, lipids, nucleic acids or inducing lipid peroxidation. [9] These process can cause direct effects on organelles such as mitochondria, the endoplasmic reticulum, the cytoskeleton, microtubules, or the nucleus and also indirectly influence cellular through the activation and inhibition of signaling kinases, transcription factors, and geneexpression profiles. These process can also stimulate to liver-specific cytokines cause cytokineinduced hepatotoxicity Intracellular stress leads to cell death caused by either cell shrinkage and nuclear disassembly (apoptosis) or swelling and necrosis [9],[10]. Omeprazole and Ciprofibrate are agents which have potency to cause drug induced hepatotoxicity by different mechanism. Some research reported tha t omeprazole increase the level of liver transaminasse (ALT and AST, while Ciprofibrate stimulate oxydative stress on hepatic cellulare, followed by decreasing of antioxydant level, leads to liver injury. [11],[12]. Plantain (Plantago major L) is a weed that grows in many tropical regions, include in Indonesia. Plantago major L have used as a traditional medicine for various conditions of health disorder. However, the scientific data for pharmacological effect is still poor. In previously research about pharmacological effect of Plantago major L., showed that this weed has a lot of potential effect as a hepatoprotector agent [13]. Plantago Major L has many active substances include flavonoid, that showed antioxydant effect or against to free radical such as lipid peroksidase [14]-[17]. These flavonoids are baicalein, hispidulin, scutallarein and plantaginin which can inhibit production of lipid peroksidase from metabolic process. The other substances, Ursolic Acid, Apigenine, Oleanic Acid and Lutheolin also have antioxydant effect that prevent oxydative stress in hepatic cellulare, while Aucubin showed anti inflammatory effect [18]. Previously research reported that extract of Plantago major L protected hepatocellulare injury of animal model induced by CCl 4. and also has antiproliferative effect lead to inhibit process of hepatocellulare fibrosis. This study was to evaluate the effect of ethanol extract of Plantago major L.on reduction of hepatic transaminases and improvement of histopathologic appearances on Omepprazole and Ciprofibrate induced hepatotoxic rat (Rattus norvegicus) model. 332 MATERIAL AND METHOD This study was conducted by experimental study and post test only with control group design. Drugs:Ciprofibrate (2-[4(-2, 2 dichlorocyclopropyl) phenoloxyl] 2-methyl propanoic acid; Modalim, Sanofi Synthelabo Ltd, Newcastle, UK, Omeprazole; SOCID, PT SOHO, Jakarta were used for making drug induced hepatotoxic animal model Preparation of Plant Extract: Plantago major L seeds were obtained from Slamet mountain, Purwokerto, Central Java, Indonesia and authenticated by Dr. Pudji Widodo MSc, Laboratory of Taxonomy Faculty of Biology, Jenderal Soedirman University. The leaves were collected and dried at room temperature, protected from dust and sunlight. Leaves and seeds were pulverized manually. Fifty grams of each plant powder was extracted in 500 ml of ethanol by maceration (48 h). The solvent was removed under vacuum at temperature below 50 C, and then the extracts were freeze-dried. Dose of the plaintain extract were devided into four groups, that are 50mg/200gBW rat/day, 100mg/200gBW rat/day, 200mg/200gBW rat/day per oral. Animal and Experiment Protocol. The rats were housed in wire-bottom cages at 20 C and adaptation for a week at Laboratorium of Pharmacology and Therapy. 20 of rats 2-3 month age, weighing between
349 6 th TOPIC about g was divided in to 4 groups. Group I as a negative control was given Omeprazole 10mg/200gBW rat and Ciprofibrat dose 16 mg/200gbbrat/day per oral. Group II was given Omeprazole 10mg/200gBW rat and Ciprofibrat dose 16 mg/200gbb rat/day and Plantago major L. 50mg/200gBW rat/day per oral. Group III was given Omeprazole 10mg/200gBW rat and Ciprofibrat dose 16 mg/200gbb rat/day and Plantago major L. 100mg/200gBW rat/day per oral. Group IV was given Omeprazole 10mg/200gBW rat and Ciprofibrat dose 16 mg/200gbb rat/day and Plantago major L.200mg/200gBW rat/day per oral. They were killed after 2 month intervention under anesthetic. Samples from each liver were collected for histopathology assessment and blood for laboratory examination of AST and ALT. Degree of liver destruction was determined by using Manja Roenigk Score. Histopathological techniques. Liver specimens were taken from the distal portion of the left lateral lobe and fixed for at least 48 hours by immersion in 10% buffered formalin. Following dehydration of the specimens in ascending grades of ethanol and cleared in xylene and embedding in paraffin wax. 5 mm thick sections were cut and then stained with hematoxylin and eosin (H&E). The histological slides are examined under the light microscope by a pathologist for assesing of hepatocellulare injury. Liver Enzym Transaminase Examination. Measurements of serum aspartate transaminase (AST) and L-alanine aminotransferase (ALT) were determined using commercially laboratory diagnostic service, Diagnostica located in Bandung, West Java, Indonesia. RESULT The effects of Plantain Extract on omeprazole and ciprofibrate induced hepatotoxicity in rats were evaluated by recording changes in serum AST and ALT levels as well as histopathological changes The effect of Plantain Extract on alteration of serum AST and ALT levels The normal serum consentration of AST on biochemistry examination is 55,8U/L, while ALT consentration is 50,4U/L. In negative control (Group I) was given Omeprazole 10mg/200gBW rat and Ciprofibrat dose 16 mg/200gbbrat/day per oral, there are eight times increasing of AST level and four times increasing of ALT compare to normal level. Administration of Plantain extract can reduce the escalating of this enzymes. Decreasing of liver transaminase in this study depend on dosage of the plantain exract. There are not evidence that dosage increasing of the plantain extract always equivalent with increasing effect to reduce liver transaminase level. The data in Table 1 demonstrate a trend of decreased levels of serum AST and ALT among the group of the study. The lower level of AST and ALT were found in Group II followed by Group III but there is inclination to increase AST and ALT consentration in Group IV compare to Group II and III. Tabel 1. The means of serum AST and ALT levels among the groups of this study. Means of Group of Study AST levels (U/L) ALT levels (U/L) I ; Negative Control II; 50mg of extract 473,4±138,9 262,6±72,4 198,6±148,9 83,4±11,67 III; 100mg of extract IV; 200mg of extract 296,6±28,4 433,2±86,9 93,0±4,3 180,6±110,55 According to statistical analysis, there were significantly difference of AST levels (p=0,003; α<0,05) and ALT level (p= 0,004; α<0,05) between groups. Dosage 50mg and 100mg/200gBW rat/day per oral of ethanol extract of plaintain are more effective to inhibit the increasing of AST and ALT levels than dose 200mg/200gBW rat/day per oral. There were significantly difference of AST and ALT levels between Group I and Group II (p=0,009 and p=0,009; α<0,05), Group I and Group III (p=0,009 and p=0,009; α<0,05), Group II and Group IV (p=0,009 and p=0,016; α<0,05) and also between Group III and Group IV (p=0,016 and p=0,028; α<0,05) but There were not significantly difference of AST and ALT levels between Group I and Group IV (p=0,602 and p=0,602; α<0,05) and Group II and Group III (p=0,602 and p=0,248; α<0,05). The lowest level of AST and ALT were found Group II (262,6±72,4 U/L and 83,4±11,67U/L). It is means that the most effective dosage of plantain extract for inhibit escalating liver transaminase in this study is 50mg/200gBW rat/day per oral. However, dose 333

 showed remarkable hepatocellulare change.")
, hydropic (vacuolization of the hepatocytes cytoplasm) and parenchymatous degeneration (ballooned hepatocyte with wispy cleared cytoplasm on H&E staining, nucleus")

350 6 th TOPIC 100mg/200gBW rat/day of plantain extract can also inhibit escalating liver transaminase that showed significantly difference with control groups, so the range of effective dosage of plantain extract for inhibit hepatocellulare injury by serum AST and ALT levels indicator are mg/200gBW rat/day. The effect of Plantain Extract on histophatological feature of hepatocellulare changing There were difference of liver histophatological features of rat medel between groups of this study as demonstrated in figure 1. Histophatological feature in Group I (negative control) showed remarkable hepatocellulare change. There are a lot of inflammatory infiltrate, necrosis hepatocytes (highly eosinophilic amorphus cytoplasm, organelles swelling specially mitochondria, endoplasmic reticulum and rupture of lysosomes, shrinking and dissolution of nulei), hydropic (vacuolization of the hepatocytes cytoplasm) and parenchymatous degeneration (ballooned hepatocyte with wispy cleared cytoplasm on H&E staining, nucleus in the centre and pyknotic cause undergoing karyorrhexis I II III IV Fig 1. Comparison of Liver Histophatological Alteration Among Groups of the Study on Rat. H&E staining.x100. I=Liver section from negatif control, showing hepatocytes with remarkable fatty changes, inflammatory infiltrate, degeneration and necrosis; II= Liver section from rat treated with 50 mg/200gbw rat of Plantain Extract. This section demonstrate reduction of centrilobular fatty changes, inflammatory infiltrate, degeneration and necrosis; III = Liver section from rat treated with 100 mg/200gbw rat of Plantain Extract. This section demonstrate more reduction of centrilobular fatty changes, inflammatory infiltrate, degeneration and necrosis, compare to group I and II; IV= Liver section from rat treated with 200 mg/200gbw rat of Plantain Extract. This section show that there are more reduction of centrilobular fatty changes, inflammatory infiltrate, degeneration and necrosis compare to group I and II but less than group III Difference histophatological features found in Groups II, III and IV that treated by plantain extract. Group II treated with 50mg/200gBW rat of plantain extract while Group II treated with 100mg/200gBW rat of plantain extract and group IV with 200mg/200gBW rat of plantain extract. However, all of the groups showed diminishing of hepatocellulare change. There are reduction of inflammatory infiltrate, degeneration and necrosis compare to negative control that treated by aquadest. In Group IV found histophatological feature similar with negative control. There are a lot of inflammatory infiltrate, hydropic degeneration, parenchymatous degeneration and necrosis. Manja Roenigk Score method used to evaluate degree of hepatocellulare injury between groups of treated rat by plantain extract compare to negative control. As it were showed on histophatological feature, the remarkable hepatocellulare change found in group I (negative control). According to Manja Roenigk score, the highest score found in group I (358,4±24,16) indicated the most severe injury occured in this group compare to the others that treated by plantain extract. While the lowest score 334
351 6 th TOPIC found in group III (213,8±5,43) followed by score on group IV (228,5±9,64) and group II (275,6±10,06). See in Table 2. Table 2. Mean, Standard Deviation and Normality Test of Manja Roenigk Score Among The groups of Study Groups of study I ; Negative Control II; 50mg of extract III; 100mg of extract IV; 200mg of extract Mean ± SD 358,4±24,16 275,6±10,06 213,8±5,43 228,5±9,64 Shapiro-Wilk (p) 0,032 0,024 0,943 0,265 Kruskal Wallis Test used to statistical analysis and the result showed that there were significantly difference of Manja Roenigk Score between groups (p-value=0,01; α=0,05). It mean that there were significantly difference of hepatocellulare change at least two groups of the study. Mann-Whitney test used to determinate significance of hepatocellulare change difference between two groups of this study. The result showed that there were significantly difference of hepatocellulare change between group I and II (p-value=0,009; α=0,05), group I and III (p-value=0,009; α=0,05), group I and IV (pvalue=0,009; α=0,05), group II and III (p-value=0,009; α=0,05), group II and IV (p-value=0,009; α=0,05) and also between group III and IV (p-value=0,009; α=0,05). All of the dosage of plantain extract can reduce remarkable hepatocellular alteration such as inflammatory reaction, degeneration and necrosis of hepatocytes. According to this result, dosage of 100 mg/200gbw rat of plantain extract is the most effective dosage to reduce hepatocellulare alteration on animal model followed by dosage 200mg/200gBW rat. However, there is not an inclination that incresing of the dosage of plantain extract can cause increasing of effectivity to resduce hepatocellulare alteration. Dosage 100mg of plantain extract is more effective than 200mg. DISCUSSION Liver has higly risk to undergo toxic reaction caused by various medicinal agents when taken in overdoses and sometimes even when introduced within therapeutic process. More than 900 drugs have been showed able to cause liver injury [5]. The pathogenesis of drug-induced liver injury usually involves the participation of a toxic drug or metabolite that either elicits an immune response or directly affects the biochemistry of the cell. The drug metabolites can be free radicals that promote a variety of chemical reactions, such as the depletion of reduced glutathione; covalently binding to proteins, lipids, or nucleic acids; or inducing lipid peroxidation. This process influent hepatocellulare homeostasis that leads to clinical manisfestation of liver injure such as elevated liver enzymes (AST/ALT) and histophatological alteration [5],[10] Drug induced hepatotoxicity also related to liver enzyme activity, especially cytochrome P-450. This enzyme is the most important oxydator to metabolism of various biochemistry and drugs. This metabolism produce inactive metabolite but in some cases can produce a metabolites which more active or toxic than the parent drug. The liver damage also related to glutathione activity on hepatic metabolism [1]. Administration Omeprazole and Ciprofibrate can cause drug induced hepatotoxicity by different mechanism whether in single drug or combination. Some research reported that omeprazole increase the level of liver transaminasse (ALT and AST, while Ciprofibrate stimulate oxydative stress on hepatic cellulare, followed by decreasing of antioxydant level, leads to liver injury [11],[12]. in this study, administration Omeprazole 10mg/200gBW rat and Ciprofibrat dose 16 mg/200gbbrat/day per oral, able to cause eight times increasing of AST level (473,4±138,9) and four times increasing of ALT (198,6±148,9) compare to normal level. The mechanism of Omeprazole induced hepatotoxicity occur through immune mediated reaction. Omeprazole metabolized by cytochrome P-450 produce an reactive metabolite (sulphonamide tetracyclic) that more reactive and able to act as a hapten. This metabolite would covalently bind to a 335
352 6 th TOPIC liver protein and subsequently, alter that protein. The altered protein would be perceived as a foreign substance that would stimulate immune system to against it in an autoimmune reaction on hepatocytes. Immunologic mechanism of liver injury marked by activation of kuffer cells and other immune cells lead to infammatory reaction and cell lesion impact from cytokine release. In this pathway also occur induction of TNF-α, apoptotic stimulation, inhibition of mitochondrial function and neoantigenic synthesis [3]. It is possible that reactive metabolite may also cause oxidative stress on liver cells to make hepatocellulare injury by reducing anti oxydant activity of GSH and cause directly necrosis on mitochondria1 [5]. Ciprofibrate can induce oxydative stress, decreasing of liver antioxydant and induce to hepatocellular injury. Ciprofibrate is one of peroxisome proliferator induce to alteration of liver morphology and even some of previously research report that this drug can induce hepatocellular carcinoma. The mechanism of Ciprofibrate-induced hepatomegaly related to peroxisome proliferation, stimulation of endoplasmic reticulum and cytosolic enzyme.[19]. As a peroxisome proliferator, ciprofibrate also inhibit glutathione peroxydase, decrease liver antioxydant and induce peroxisome proliferation. Persistently peroxisome proliferation related to increase in H 2 O 2 production and decreasing of free radical scavenger lead to oxydative stress on hepatocytes cells. This process cause occur lipid peroxydation and DNA oxydation lead to DNA destruction. H 2 O 2 is inductor of NF-kappa B as an antiapoptotic agent and tumor promoter [19], [20], [21]. Plantain (Plantago major L) is one of Indonesian weed that have used as a traditional medicine for various conditions of health disorder in Indonesian society. Plantain has a lot of active substances which have various pharmacological effects, include as hepatoprotector. Hepatoprotective effect of plantain supported by antioxydant, anti inflammatory, antiproliferation and antiapoptotic effect of active substances inside [13],[22],[23]. In this study, the plantain extract can reduce AST and ALT levels of rat model omeprazole and Ciprofibrat e induced hepatotoxicity. Increasing of AST and ALT levels in group I rat showed that there are hepatocellulare injury caused by omeprazole and ciprofibrate administration. Administration of plantain extract can stimulate hepatocellulare improvement and inhibit continous injury on hepatocyte cells. In the other variabel, plantain extract can reduce remarkable hepatocellulare change as showed on liver histopatological feature of rats treated by plantain extract (Group II, III and IV) compared to negative control treated by aquadest (Group I). Reducing of hepatocellulare alteration on rats treated by plantain extract indicated that there improved in hepatocytes of these rats. Antioxydant within plaintain extract inhibit oxydative sress lead to liver injury caused by Ciprofibrate and increasing antioxydant levels that was restrained by omeprazole. So, there will stimulate hepatocellulare regeneration to improve hepatocyte cells damage. By inflammatory effect, the plantain extract inhibit inflammatory reaction induced by ciprofibrate while antiproliferative effect against proliferative effect of ciprofibrate lead to occur hyperproliferation of hepatocyte cells. This antiproliferative effect indicated to inhibit hepatomegaly and hepatocellulare alteration caused by ciprofibrate and omeprazole. According to Manja Roenigk score, among rats in the group treated by plantain extract have lower score than negative control group which administrated by aquadest and there were significantly difference of Manja Roenigk score among the groups of study (p-value=0,000). The result of this study similar and can strength of previously study by Turel at al about hepatoprotective effect of plantain on CCL 4 induced hepatotoxicity. The result showed that plantain can improve hepatic damage on rats which have been induced by CCL 4 [13]. The pharmacological effect of plantain especially carried out by Ursolic Acid, Apigenine, Lutheoline, Baicalein, Scutellarin and Aucubine. Ursolic acid inhibit Cyclooxygenase-2 (COX-2) and prostaglandine (PG) synthesis. Both of substances play role in inflammatory reaction and inhibition of transduction pathway of proteinkinase C to mediate immune response [24],[25].Apigenine inhibit biosynthesis of COX-2, to regulate prostaglandine and Nitrit oxyde release through regulation of NFkappa B, blockade of IL-1β, TNF and IL-8 synthesis on Lipopolysaccharide [26]. Apigenine also induce synyhesis of pro-inflammatory cytokines on monocytes and macrophage cells through NFkappa B inactivation with suppress to phosphorilation sub unit p65 [27]. 336
353 6 th TOPIC Lutheoline within plantain extract can suppress NF-kappaB pathway and inhibition of pro inflammatory mediators. Lutheoline demonstrated to inhibit production of serum TNF-α and also arachidonic acid synthesis [28]. Baicalein showed inhibition effect in mast cells to produce IL-1β and TNF-α through activation of NF-kappa B pathway, phosphorilation and degradation [29]. Baicaleine is a substance that demonstrated antiproliferative effect through inhibit collagen accumulation and PDGF-β receptor synthesis. Baicaleine also inhibit stellate cells activation, down regulation of PDGF-β receptor and suppress activation cells to produce fibrotic tissue lead to inhibit hepatomegaly [30]-[32]. in the other mechanism, baicalein can reduce Reactive Oxygene Species (ROS) lead to antioxydant activity [33]. However, antioxydant effect of plantain extract is very important to inhibit hepatocellulare damage cause oxydative stress process. This antioxydant effect especially carried out by Hispiduline, Baicaleine, Oleanic Acid and Lutheoline. Lutheoline play role in increasing antioxydant level, include vitamine A, C and ß-Carotene [28]. As baicaleine and hispiduline decrease glutathione, inhibit inos gene expression and protect hepatocytes from various toxic agents [34],[35]. CONCLUSION Administration of ethanol extract of Plantago major L. reduce hepatic transaminases (AST and ALT) and improvement of histopathologic appearances indicated that this plant extract can protect the liver damage on drug induced hepatotoxic rat (Rattus norvegicus) model. ACKNOWLEDGMENT The authors are sincerely thankful to Mumuh muhidin, Dadang, Nurul and Tri for technical laboratory assistance. Special thank to dr Bethy Surjawathy, SpPA-K, PhD for discussion REFFERENCES [1]. Lu FL. Toksikologi Dasar; Asas, Organ Sasaran, dan Penilaian Resiko. Edisi 2. Jakarta: UI- Press;2006. [2]. Price SA, Wilson LM. Patofisiologi; Konsep Klinis Proses-proses Penyakit. Jakarta: EGC;2006 [3]. Lee WM. Acute liver failure in the United States. Semin Liver Dis. 2003; 23: [4]. Grattagliano IS, Russmann, Kullak-Ublick GA. Current Concepts of Mechanisms in Drug- Induced Hepatotoxicity. Curr Med Chem. 2009; 16: [5]. Ostapowicz G, Fontana RJ, Schiodt FV, Larson A, Davern TJ, Han SH, et al. Results of a prospective study of acute liver failure at 17 tertiary care centers in the United States. Ann. Intern. Med. 2002;137: [6]. Temple RJ, Himmel MH. Safety of newly approved drugs:implications for prescribing. [editorial] JAMA.2002; 287: [7]. Goodman ZD. Drug hepatotoxicity. Clin Liver Dis.2002;6: [8]. Lee WM, Senior JR. Recognizing Drug-Induced Liver Injury: Current Problems, Possible Solutions. Toxicologic Pathology. 2005; 33: [9]. Zimmerman H. Hepatotoxicity: the adverse effects of drugs and other chemicals on the liver. 2nd ed. Philadelphia: Lippincott, Williams & Wilkins, 1999 [10]. Kaplowitz N. Mechanisms of cell death and relevance to drug hepa totoxicity. In: Drug-induced liver disease. Kaplowitz N, DeLeve LD, eds. New York: Marcel Dekker. 2002:85 95 [11]. Navarro JF, Gallego E, Aviles J..Recurrent Severe Acute Hepatitis and Omeprazole. Ann Intern Med. 1997;127 (12): [12]. El-Matary W, Dalzell M. Omeprazole-induced hepatitis. Pediatr Emerg Care. 2005; 21: [13]. Turel I, Ozbec H, Erten R, Oner AH, Cengiz N, Yilmaz O. Hepatoprotective and antiinflammatory activities of Plantago major L. Indian Journal of Pharmacology. 2009;41(3):
354 6 th TOPIC [14]. Kandaswami C, Middleton E. Free radical scavenging and antioxidant activity of plant flavonoids. Advanses in Experimental Medicine and Biology. 1994;366: [15]. Gao ZH, Huang KX, Yang XL, Xu HB. Free radical scavenging and antoxidant activites of flavonoids extracted from the radix of Scutellaria baicalensis Georgi. Biochimica et Biophysica Acta General Subjects. 1999;1472: [16]. Sanz MJ, Ferrandiz ML, Cejudo M. Terencio MC, Gil B, Bustos G, et al. Influence of a series of natural flavonoids on free-radical generating systems and oxidative stress. Xenobiotica. 1994;24: [17]. Yoshino M, Ito M, Okajima H, Haneda M, Murakam K.. Role of baicalein compounds as antioxidant in the traditional herbal medicine. Biomedical Research Tokyo. 1997;18:349 5 [18]. Kawashty SA, Gamal-el-din E, Abdalla MF, Saleh NAM. Flavonoids of Plantago species in Egypt. Biochemical Systematics and Ecology. 1994;22: [19]. Rao MS, Janardan KR. An Overview of Peroxisome Proliferator-Induced Hepatocarcinogenesis. Environmental Health Perspectives. 1991;93: [20]. Perkins N D. NF-kB: tumor promoter or suppressor? Trends Cell Biol. 2004;14(2): 64-9 [21]. Cressman DE, Greenbaum LE, Hapber BA, Taub R. Rapid activation of post-hepatectomy factor nuclear factor kappa B in hepatocytes, a primary response in regenerating liver. J. Biol. Chem. 1994;269: [22]. Mao-ye W, An Li-guo. Effects of Plantago major L. seeds extract on endurance exercise capacity in mice. J Medicinal Plants Res. 2011;5(9): [23]. Samuelsen AB. The traditional uses, chemical constituents and biological activities of Plantago major L.A review J Ethnopharmacol. 2000;71: 1 21 [24]. Neto CC. Ursolic Acid and Other Pentacyclic Triterpenoids: Anticancer Activities and Occurrence in Berries. Berries Cancer Prev. 2011;2:41-9 [25]. Subbaramaiah KP, Michaluart MB. Sporn, Dannenberg AJ. Ursolic Acid Inhibits Cyclooxygenase-2 Transcription in Human Mammary Epithelial Cells.Cancer Res. 2000;60: [26]. Ringbom T, Huss U, Stenholm A, Flock S, Skattebol L, Perera P, et al. COX-2 Inhibitory Effects of Naturally Occurring and Modified Fatty Acids. J Nat Prod. 2001;64(6): [27]. Nicholas C S, Batra MA, Vargo OH, Voss MA, Gavrilin, Mark D. Apigenin Blocks Lipopolysaccharide-Induced Lethality In Vivo and Proinflammatory Cytokines Expression by Inactivating NF-κB through the Suppression of p65 Phosphorylation. J Immunol. 2007;179: [28]. Seelinger G, Merfort I, Christoph M. Schempp Anti-Oxidant, Anti-Inflammatory and Anti-Allergic Activities of Luteolin. Planta Med. 2008;74 (14): [29]. Jung HCK, Hall T, Ha C, Li G, Krishnaswamy DS, Chi, et al..baicalein inhibits IL-1β- and TNF-αinducedinflammatory cytokineproduction from human mast cells via regulation of the NFκBpathway. CMA., 2007;5(5): 1-10 [30]. Jun-Qin M,. Hui M, Dan Z, Run W, Yue Z..Scutellarin inhibits LPS-induced pro-inflammatory cytokine expression in BV2 cells Academic Journal of Second Military Medical University. 2011;11: [31]. Sun H, Che QM, Zhao X, Pu XP. Antifibrotic effects of chronic baicalein administration in a CCl 4 liver fibrosis model in rats. Eur J Pharmacol.2010 [32]. Inoue T, Jackson EK. Strong antiproliferative effects of baicalein in cultured rat hepatic stellate cells. Eur J Pharmacol.1999 [33]. Tilak JC, Devasagayam TPA, Adhikari S, Lele RD, Kon T, Handa O, et al. Cellular Membrane Protection Against Reactive Oxygen Species by Terminalia Arjuna and Its Active Component Baicalein. J Clin Biochem Nutr [34]. Chang WH, Cheng CH, Lu FJ. Different Effects of Baicalein, Baicalin and Wogonin on Mitochondrial Function, Glutathione Content and Cell Cycle Progression in Human Hepatoma Cell Lines. Planta Med. 2002;68(2): [35]. Liu J, Liu Y, Parkinson A, Klaassen CD. Effect of oleanolic acid on hepatic toxicant-activating and detoxifying systems in mice.j Pharmacol Exp Ther. 1995;275(2):
355 6 th TOPIC POTENTIAL ANALYSIS OF COTTONWOOD PARASITE (DENDROPTHOE PENTANDRA) STEM EXTRACT IN DECREASING OF MUTANT P53 PROTEIN EXPRESSION ON CERVICAL CANCER CELL (HELA CELLS) IN VITRO Gamal 1 and Efriko Septananda 1 1 Department of biomedical, Faculty of Medicine, University of Brawijaya, Indonesia gamal_scientist@yahoo.co.id ABSTRACT Cervical cancer is the second most common type of cancer in women and the most common cause of mortality related cancer in developing countries. In 2005, cervical cancer leads to over 250,000 deaths in the world. Treatment in cancer are including surgery, chemotherapy and radiotherapy. Surgery can not be done for the metastasized cancer, while chemotherapy and radiotherapy treatment can cause various side effects. Cottonwood Parasite (Dendrophthoe pentandra) stem contains quercetin 39.8 mg/g. Quercetin acts as an anticancer on cell cycle regulation, interacts with estrogen receptor type II, inhibits tyrosine kinase enzymes, and suppresses the expression of mutant p53 protein. This research aims to know the effect of Cottonwood Parasite stem extract against mutant p53 expression on HeLa cell (cervical cancer). Cottonwood parasite stem is obtained from extraction and followed by evaporation with ethanol 70%. HeLa cells were divided into 4 groups: HeLa cells without treatment(a), HeLa cells treated with 25µg/ml extract concentration(b), 50µg/ml(C), 100µg/ml(D). Immunocytochemistry method was performed using monoclonal antibody to mutant p53 to measure the expression of mutant p53 level as an indicator of apoptosis on HeLa cells, by examining the appearance of brown colour under light microscope on 1000x magnification. This results showed that cottonwoods Parasite stem extract was decrease mutant p53 protein expression in HeLa cells culture. Based on these facts, quersetin which are found mainly in the cottonwood parasite is likely to be developed as an anticancer drug that is promising in the future, either as agent chemoprevention or co-chemotherapy (companion agent of chemotherapy). Keywords: Cottonwood Parasite, cervical cancer, p53 mutant INTRODUCTION Cervical cancer is the second most common type of cancer in women and the most common cause of mortality related cancer in developing countries. It attacks 16 of 100,000 women per year and kills about 9 out of 100,000 women per year [1]. In 2005, cervical cancer leads to over 250,000 deaths in the world, and without adequate managements, it is expected that the death rate will increase as much as 25% in the next 10 years [2]. Conventional treatment in cancer are including surgery, chemotherapy and radiotherapy. Therapeutic cancer surgery can not be done for the metastasized cancer, while chemotherapy and radiation treatment can cause various side effects [3]. Cottonwood s Parasite (Dendrophthoe pentandra) stem contains quercetin 39.8 mg/g. Quercetin acts as an anticancer on cell cycle regulation, interacts with estrogen receptor (ER) type II, inhibits tyrosine kinase enzymes, and suppresses the expression of mutant p53 protein [4]. 339


356 6 th TOPIC METHOD AND EXPERIMENT PROCEDURE This study uses cervical cancer cell line (HeLa cells) which are cultured in the laboratory of biomedical, Faculty of medicine, University of Brawijaya. The extract from stem of Cottonwood parasite is obtained from extraction and followed by evaporation with ethanol 70%. HeLa cells were divided into 4 groups : Negative control group or HeLa cells without treatment, HeLa cells treated with 25 mg/ml extract concentration, HeLa cells treated with 50 mg/ml extract concentration, HeLa cells treated with 100 mg/ml extract concentration. Once given the treatment, cell cultures were incubated for 24 hours. Furthermore, cell cultures were fixed and then performed staining. Immunocytochemistry method was performed using monoclonal antibody to mutant p53 to measure the expression of p53 level as an indicator of apoptosis on HeLa cells, by examining the appearance of brown colour under light microscope on 1000 x magnification. Immunocytochemistry staining is observed as brown spots in nuclear cell. A B C D Figure 1. Immunocytochemistry Staining was Performed on Mutant p53 Protein. This figure shows that mutant p53 protein expressions were decrease after incubated with parasite cottonwoods. Mutant p53 protein expression on normal HeLa cell or control (A); 25mg/ml parasite cottonwoods (B); 50mg/ml parasite cottonwoods (C); 100mg/ml parasite cottonwoods (D). RESULTS AND DISCUSSION The calculation was done by counting the number of HeLa cells that express mutant p53 protein in each field of view. Each treatment was calculated as many as 20 field of view with 1000x magnification. The appearance of HeLa cells with mutant p53 protein will be brown colour on the nucleus. Whereas the normal HeLa cell will be blue-purple colour on the nucleus. The results of the calculation can be seen in the following table: 340
357 6 th TOPIC Table 1. Results of Immunocytochemistry Treatment Average (per 20 field of view) Negative Control mg/ml mg/ml mg/ml 47 From the above table, it can be seen the effect of cottonwood parasite stem extract on the number of HeLa cells showing the expression of mutant p53 protein. The effect can be seen in an difference of mutant p53 protein expression between the control group and the treatment group. The Decrease expression of mutant p53 protein in the treated group increasing for every increase of doses concentration from the extract. Data Analysis In calculating the results of this study used 95% confidence interval (α = 0.05). Statistical data analysis using One-Way ANOVA because in this study the data used is ratio, which has one dependent variable and one independent variable with some groups with a single differentiating factor (concentration of cottonwood parasite stem extract). Subsequent analysis was done by Pearson correlation test to analyze a relationship between the extract of parasite cottonwood on the expression of mutant p53 protein in HeLa cell. After that, linear regression analysis was done to analyze percentage of the effect of parasite cottonwoods extracts on the decline of mutant p53 protein expression. Analysis of One-Way Anova Data analysis was performed with One-way Anova test using SPSS16.0 program for Windows. The analysis aims to determine the significance of difference in parasite cottonwood stem extract between groups and to know concentration of parasite cottonwood stem extract which provide a significant difference to the decreased expression of mutant p53 protein. Before One-way Anova test, data requirements test consists of normality test and homogeneity tests was carried out. Both of the tests must have a probability value (p)> 0.05 to be able to proceed in One-way Anova test. Shapiro-Wilk was used in normality test result significant probability value ((p)> 0.05). This results indicate that the distribution of data is normal. Homogeneity test result probability value (p)> 0.05 which means that the variance of the data is normal. Because all of test results are significant value, it can proceed to one way Anova test. In this test, the p value = (p <0.05), so it can be concluded that "at least there are significantly differences in the expression of mutant p53 protein in HeLa cell between the two groups." Furthermore, Post Hoc Multiple Comparison (Tukey HSD) analysis was performed to determine the comparative differences between the treatment group and which groups have significant differences. Table 1. Post Hoc Multiple Comparison Analysis control Comparison between treatment doses 25 doses 50 doses 100 Doses 25 doses 50 doses 100 Control doses 50 doses 100 Control doses 25 doses 100 Control Significance value 0,084 0,017 0,003 0,084 0,337 0,051 0,017 0,337 0,240 0,003 Conclusion - Signifance Signifance - - Signifance Signifance - - Signifance 341
358 6 th TOPIC doses 25 doses 50 0,051 0,240 Signifance - In the table above, a differences value is significant if the value of p <0.05. From the analysis, it can be concluded that : between control and treatment doses of 25 mg/ml, there was no significant difference. The new difference value is significant at doses 50 and 100 mg/ml. well worth the insignificant difference between the doses of 25 mg/ml compared with a doses of 50 mg/ml. But there is a difference that approached significance (p=0.051) when compared with the doses of 100 mg/ml. Between doses of 50 mg/ml with a doses of 100 mg/ml, the difference was not significant. Pearson Correlation Test To assess relationship between the extract of parasite cottonwood with mutant p53 protein expression in HeLa cell was performed Pearson correlation test. From these test, it is known that the Pearson correlation test have significance value (p <0.01), which means there is a significant relationship between parasite cottonwoods stem extract and the expression of mutant p53 protein. Value of Pearson correlation is The correlation is negative, which means increasing dose of parasite cottonwood stem extract will cause further decline in the expression of mutant p53 protein (negative correlation). Linear Regression Test Linear regression analysis was performed to find out the magnitude effect of parasite cottonwood stem extract on the decrease of mutant p53 protein expression,. The results of the analysis was read in R square. These results are multiplied by 100% to turn it into a percentage. final results of the analysis is 69.4% which means parasite cottonwood stem extracts can give effect to the decrease of mutant p53 protein expression as much as 69.4%. 342 DISCUSSION One of the causes of the malignancy is the failure or inactivation of tumor supressor gene p53. Tumor supressor gene p53 is a recessive gene on short arm of chromosome 17 acting on the p53 wild-type allele and function to inhibits growth and differentiation of cells thus preventing the onset of cell transformation that leads to malignancy. If there is damage or mutation of the tumor supressor gene p53 caused by genetic factors and environmental, mutant p53 protein is formed which is unstable and does not inhibit growth from the G1 phase to S phase so that damages of the cells can not be repaired. This result the damage cells continue to differentiate and cause the process of malignancy in epithelial cells. These mutations tend to occur in the gene at codon 132 to 281. Mutations in the p53 protein belongs to the most frequent genetic abnormalities occur in cancer in humans. In a study of the correlation between mutant p53 protein expression with prognosis of cervical cancer was found the percentage of 47.8% on the total 399 cases [4]. Parasite cottonwoods stem extract has a major content of flavonoid, that is quercetin. Parasite cottonwood has the highets composition pf quercetin than other plant, ie 39.8 mg/g. The content was believed to have an important role in lowering the expression of mutant p53 protein. P53 protein was initially a pro-apoptotic proteins. However, more than 50% of cancers have mutations of this protein. These mutations result in proteins is not working properly and result in cell proliferation continuously. According to Lamson, et al [4], quercetin in certain concentrations can suppress the expression of mutant p53 proteins are formed by breast cancer cells until undetectable in these cells. The mechanism is through inhibition at the gene that encodes a mutant p53 protein. If this gene is inhibited, the production of mutant p53 protein will decline. Inhibition of the p53 protein expression caused the cells suspended in the G2-M phase of the cell cycle. In this phase. there is examination of DNA damage (G2-M DNA damage checkpoint). This checkpoint to make sure the cells do not initiate mitosis before
359 6 th TOPIC DNA damage repair. Cells that are damaged after entering the G2-M phase checkpoint will undergo apoptosis [5]. Previous studies was determine the effects of quercetin in downregulate mutant p53 protein in breast cancer cell line. We repeated this study, but using a different Cell-line cancers, namely HeLa cells (cervical cancer). The results of calculations contained in Table 1. from this table, it can be seen that the average cell generally indicates there is a significant reduction of cells that express mutant p53 protein in the extract of parasite cottonwoos stem. Any increase in doses of parasite cottonwood stem extract will decrease the expression of mutant p53 protein in HeLa cell [6]. However, there are some results that showed no change between the control and treatment. As between the control repetition 1 with a treatment of 25 mg/ml repetition 1. Post Hoc Statistical Tests Multiple Comparison (Tukey HSD) results were not significant in the comparison control group with a treatment of 25 mg/ml. This not significant results also repeated in the comparison between the doses of 25 mg/ml to 50mg/ml doses, a doses of 50 mg/ml with a doses of 100 mg/ml. In average there are cells decreased, but the statistical tests provide results that are less significant. The new doses was significant in comparison with the control doses of 50 mg/ml and 100 mg/ml. In the comparison between the doses of 25 mg/ml with a doses of 100 mg/ml, statistical tests showed the value approached significance (p=0.051, significant if p <0.05). From these results, it can be concluded that the parasite cottonwood stem extract was needed with a certain increase doses to be able to give the effect of meaningful decreased expression of mutant p53 proteins. Comparison of doses approached significance was between the doses of 25 mg/ml with a doses of 100 mg/ml, with increasing doses of 75 mg/ml. Significant analyzed results on a comparison of control with a doses of 100 mg/ml, with increasing doses of 100 mg/ml. So it can be concluded that the doses of parasite cottonwoods stem extract will give the effect of decreased expression of mutant p53 proteins are significantly at dosess> 75 mg / ml. The results of this study is almost similar to previous studies on breast cancer cells (MDA-MB 468). In this study, the effects of decreased mutant p53 protein was reach at a doses of 30 mg/ml. Increased concentrations of quercetin provides a dramatic effect, and cause the expression of mutant p53 protein to almost undetectable levels at doses of 75 mg / ml. In the linear regression test, the analysis value is 0, 694 or 69.4% in a percentage. That s mean, the effect of parasite cottonwood stem extract to the decrease of mutant p53 protein expression in HeLa cells amounted to 69.4%. 20.6% are caused by other factors, such as temperature, humidity, durability of the cell, etc.. However, 69.4% can be quite significant since parasite cottonwood stem extracts give effect more than 50%. However, further research is needed to see the effectiveness of parasite cottonwood stem extracts and to determine an effective doses in humans. CONCLUSION This results showed that Parasite cottonwoods stem extract was decrease mutant p53 protein expression in HeLa cells culture. Based on these facts, quersetin which are found mainly in the cottonwood parasite is likely to be developed as an anticancer drug, either as agent chemoprevention or co-chemotherapy (companion agent of chemotherapy). those it s can increase the sensitivity of cancer cells to chemotherapy as well as reduce resistance and side effects. The development and cultivation of cottonwood parasites as well as further processing into a product has properties necessary to optimal chemotherapeutic agents and also promising in the future. REFERENCE [1]. Xavier. Worldwide Human Papillomavirus Etiology of Cervical Adenocarcinoma and Its Cofactors: Implications for Screening and Prevention. EMBO J (13): PMID [2]. Rasjidi, Imam. Guideline of Gynecology Cancer Treatment. Jakarta : EGC [3]. Apantaku, L.M. Breast-conseving surgery for breast cancer. Am. Fam. Physician (12):
360 6 th TOPIC [4]. Lamson, Davis W, MS, ND, and Brignall, Matthew S. ND. Antioxidants and cancer III: Quercetin, Alternative Medicine Review Volume 5 Number [5]. Kiu Hua-shing. Loranthoideae. In: Kiu Hua-shing & Ling Yeou-ruenn, eds., Fl. Reipubl. Popularis Sin : [6]. Hawariah, A.L.P. Kanker payudara. Serdang: Universiti Putra Malaysia
361 6 th TOPIC WARENESS AND WILLINGNES TO HEALTH POLICY : AN EMPIRICAL STUDY WITH REFERENCE TO MALANG INDONESIA Gamal Medical Major, Faculty of Medicine, University of Brawijaya, Indonesia gamal_scientist@yahoo.co.id ABSTRACT In Indonesia there is a lot of health porblem, such as deficiencies in health resourches and health financing, morbidity and mortality in communicable diseases, and others. This problem is correlate with poor of political commitment in health policy. In other hand, poor awareness about the magnitude of the problem, lack of orientation, competence and capacity of health manpower, poor advocacy efforts and lack of active community participation have added to poor political commitment for health prevention of the Indonesia. The present study is an effort in the area of Public health policy awareness to examine the level of awareness about health policy and identifies the determinants of health awareness and the different factors affecting them. The study was conducted in Malang, Indonesia, and 866 questionnaires were got filled from randomly proportionate sub-district. The results shown low level of awareness and willingness to health policy, even people prefer traffic jam policy rather than health policy. Overall, there is no correlation respondents characteristic(gender; age; ethnic group; religion; education; occupation; income of respondents) and awareness and willingnes to health policy in Malang city. In contrast, age (p < 0,001) and education (p < 0,01) has correlation to the awareness and willingness to health policy in area arround resident of respondents. Radio access has relation to the awareness and willingness to health policy in Malang and in their subdistrict with p=0,012, p=0,097, respectively. In other hand, television access has relation with awareness and willingness to health policy only in their subdistrict with p=0,001. Enhancing health awareness among citizen in Malang ia a challenging task. We conclude that a greater understanding of which aspects of every character and background are important in a health policy awareness and willingnes in Indonesia to inherent sociotechnical for enhancing health policy awareness and willingnes in Indonesia. Keywords: Awareness, willingness, health, policy. INTRODUCTION Human resources in health have deficiencies in numbers, distribution and quality of the health workforce, and reportedly low productivity. Communicable diseases are a major cause of morbidity and mortality in Indonesia. Nearly 250 people die of tuberculosis (TB) every day, with over half a million new cases estimated to occur every year 1. Malaria remains a major vector-borne disease in large parts of Indonesia. Large scale outbreaks of dengue haemorrhagic fever are reported every year. At the end of 2006, an estimated Indonesians were living with HIV-AIDS 1. Chronic conditions such as cancer, cardiovascular diseases, metabolic disorders and tobacco dependence represent a real burden to the country in terms of cost, suffering and human lives 2. Non Communicable disease remain become the most cause of life lost 45%, secondly Communicable disease which 41% and followed by injuries which 13% 1. Health financing in Indonesia is not enough, total expenditure on health per capita (Int $, 2010) is 112, and total expenditure on health as % of GDP (2010) is 2,6. Compared with neighboring Malaysia and Thailand, Indonesia spends relatively littleon health services. The estimated total expenditure on health per capita in 2003 was US$ 33 in Indonesia compared with US$ 149 in Malaysia and US$ 90 in Thailand 3. All estimates confirm that the maternal mortality ratio (307/ live births) in Indonesia is among the highest in the South-East Asia Region (Indonesia Demographic and Health Survey ). The lifetime risk of a mother dying of causes related to childbirth is estimated to be 1 in 65 compared with 1 in 1100 in Thailand. In Indonesia, 58% of deliveries are estimated to take place at 345
362 6 th TOPIC home; of those, 33% are in urban and 67% in rural areas 4. In addition, Indonesia has a backlog of about two million cataract cases, leading to blindness, which needs to be addressed to reduce the social burden 2. Mental health has long been neglected, despite an estimated 12.3% loss of productive days due to mental and neurological disorders 1. Hunger and malnutrition remain the most devastating problems facing the majority of the Indonesian, especially for the poor. At present, about half the population is iron-deficient and one-third is at risk of iodine deficiency disorders. Vitamin A deficiency disorders still affect around 10 million children. The prevalence of LBW infants in Indonesia is in a range of 7-14%, even reach 16% in some districts. The high prevalence of LBW is commonly a result of maternal malnutrition. It is at a range of 12 to 22% women aged suffering from chronic energy deficiency (BMI <18.5), and 40% of pregnant women was anemic. In 2003, 27.5 percent of children under five in Indonesia suffered from moderate and severe underweight 5. This problem is correlate with poor of political commitment in health policy. In other hand, poor awareness about the magnitude of the problem, lack of orientation, competence and capacity of health manpower, poor advocacy efforts and lack of active community participation have added to poor political commitment for health prevention of the Indonesia. Health are heading towards becoming a major public problem, requiring sustained prevention and control of the risk factors involved. However, the major challenge ahead will be to implement the strategy and to develop multisectoral public policies in support of the strategy. While further support is required to achieve a majority in Indonesia s legislative assembly, a considerable number of parliamentarians are already lobbying for the country to join the Framework Convention. To achieve it, awareness and willingness of public health policy will be important. In this research, We view public awareness of health policy to analys among malang citizen as a reflection of whether there can be enough political will to address health problem in Indonesia and other determinant in solve these problem. First of all, we examine awareness and willingness of health policy. After that, we broaden the scope of our understanding to examine how the responden characteristic affecting awareness and willingness to health policy. More over, we hope a foster a greater understanding of the interaction among media access to health awareness and willingness. LITERRATURE REVIEW Democracies system in Indonesia cause public opinion become an important driver of political will on public policy. In recent years, policy making in Indonesia from (i.e after reformation in Indonesia) prove that public opinion influence public policy making. We view public health awareness as one important determinant of public policy making. Some researchers have conducted public opinion and awareness as determinant of public support for government intervention 6-8. Health inequity problem is more a challenge in developing countries due to; presence of magnitude of the inequalities problem; relationship between inequality and inequity; and less systemic and organized program to address inequity due to resource constraints and lack of awareness for this problem 9. Inhibition and lack of awareness and willingness among stakeholders on the relationship between health and social development restricted the inter-sectoral convergence on solving health inequities problem. For example, most of the physicians interviewed considered health as more of a matter of medical science than a collective outcome of socio-medical determinants, though they are crucial for a healthy living 10,11. The health policy stakeholders had fundamental understanding on the role of sociomedical determinants. Some of the stakeholders considered healthcare as generosity than individual or collective rights of society 11,12. The stakeholder limited the equity approach in the policy developing processes; information asymmetry between stakeholders involved, non-willingness and less awareness on collective approach on social policies health of populations, less capacity of stakeholders, limited practice of 346
363 6 th TOPIC decentralization and involvement of civil society organizations, and multi-dimensional relationship between donor agencies and those of the federal and state governments 13. The health policy was an outcome of multiple determinants such as; the nature of health equity issues and their perceived importance; existing nature of healthcare delivery system; and global, national, state and district level socio-political, economic and cultural movements 13. The algorithm of health policy determinants is described in figure 1. The fisure 1 describes directly and inderictly outcome to health policy, that is level 1 is indirect outcome and the level 2 is direct outcome. Figure 1 Health Policy determinants 13 METHODOLOGY This study is conducted from Oktober until November 2012 in Malang city. Malang, city of Indonesia is divided into 5 districts, Blimbing, Kedungkandang, Klojen, Lowokwaru, and Sukun. Malang has a population of (2010) and data was collected with proportionate stratified random sampling. With this method, sampel was collected after determining Population and Characteristics based on the Group determines level (Sub district). Selecting all level in the sample group and determine which samples were randomly selected from each sub-district, Malang is consisted of 57 subdistrict. The questionnaire used in this study consisted 40 items. Total sampel was collected in this study is 866 distributed in proporsionated with 57 subdistrict. 866 questionnaires were got filled from randomly proportionate sub-district, out of which 809 (valid response rate 93,4%) found to be suitable for analysis. Among there, 57 were excluded because of insufficient data due to lack information regarding respondents characteristic, such as age, employment, education, and 809 ended up in the final analysis. 347
364 6 th TOPIC Content of study Interview Questionnaire We followed a multi-stage process to determine policy health awareness. The survey included questions pertaining to three broad themes: (1) awareness of health policy; (2) determinant of awareness of health policy; and (3) role of media access to influence of health policy awareness. First, we analyzed responses to two question that asked participants to choose the policy they want, specifically in Malang city and in their subdistrict area. For the purpose of analysis, we examined the proportion of participants agreeing that there are health policy is needed in Malang city or their subdistrict area. The items concerning health policy awareness and willingness were mainly taken from comparison of other policy, such as poverty, education, traffic, floods, infrastructure, etc. A second grup of questions asked participants about their personal characteristic. In our analysis, we examined the correlation between their characteristic. In order to investigate participant characteristics that may influence the likelihood of awareness of health policy awareness, information was also collected on participant demographics, political affiliation. Demographic characteristics included sex, age grup, education, ocupation, income, ethnic, and religion. There four categories for media access were Every Day / Almost Every Day, 3-4 Days a week, 1-2 Days a week, and rarely. Political affiliation was gauded in response to several question, such as If the election were being held today, what party do you will vote?, What is party do you vote in last election, and others political question. To minimizing any deviation from having as representative a sample as possible, our survey data was statistically weighted to be representative of Malang city in terms od composition by subdistrict. We also making question concretely and linguistically simle to minimize missconception of respondents to know and understood completely. Analytical Methods Both frequencies and chi-square tests od independence were conductued using Social Sciences (SPSS) for Window software (SPSS Inc, version 16.) was used for all statistical analyses. Frequencies were computes to summarize respondent awareness to health policy compared with others policy. Chi squre tests of independence were performed to examine the relationship between respondent characterisctic and health awareness. In other hand, Chi square test were performed to examine relationship between media access and health awareness. A p value less than 0,05 was considered significant. RESULTS The present study is an effort in the area of Public health policy and the peculiar feature of it lies in multidimensions. As firstly, examine the level of awareness about health policy compared with others policy in Malang city, Indonesia. Secondly, identifies the determinants of awareness and the different factors affecting awareness, such as media access and respondents characteristic. Level awareness and willingness to policy in Malang city and the subdistrict area of respondents In this study we examine the level of awareness and willingness to health policy than other policies (poverty, education, traffic, floods, infrastructure, etc.) for general in the Malang city and the subdistrict area of respondents. The results shown low level of awareness and willingness to health policy, even people prefer traffic jam(15.60%) policy rather than health policy(12.70%). We found that 27.60% of the respondends prefer poverty policy, 19% education policy, 15.60% traffic jam policy, 12.70% health Policy, 11.40% infrastructure policy, 8.60% others policy, and 5.20% flood policy. 348
365 6 th TOPIC Table 1. Main City Problem Awareness in Malang city Frequency Percent Valid Percent Cumulative Percent Valid Poverty Education Health Traffic Jam Flood Infrastructure Other Total Main City Problem Awareness in Malang city Poverty Education Health Traffic Jam Flood Infrastructure Other Picture 1. Graphic of Main City Problem Awareness in Malang city We found that main problem the subdistrict area of respondents 23.9% of the respondendts prefer poverty policy, 16.1% education policy, 14.5% traffic jam policy, 11.7% health Policy, 15.6% infrastructure policy, 11,9% others policy, and 6,4% flood policy. Table 2. Main problem the subdistrict area of respondents Frequency Percent Valid Percent Cumulative Percent Valid Poverty Education Health Traffic jam Flood Infrastructure Others Total
366 6 th TOPIC Main Problem in Subdistrict Area of Respondents Poverty Education Health Traffic Jam Flood Infrastructure Other Picture 2. Graphic of Main problem the subdistrict area of respondents By comparison, awareness and willingness to policy between their opinion in malang city and in the subdistrict area of respondents, poverty and education become main issue in both of this question. In Malang city, third is placed by traffic jam (15,6%), but in the subdistrict area of respondents infrastructure (15,6%) become third place. Similar to geographic in the sample, overall, health policy in forth place both in malang city (12,7%) and in the area resident of respondents(11,7%) Respondent characteristics with awareness and willingness to health policy Identify the influence and relationship of respondent characteristics (gender, age, religion, ethnicity, education level, the average gross income per month, employment) for awareness and willingness to health policy in the city of Malang and the surrounding area of respondents. Overall, there is no correlation respondents characteristic and awareness and willingnes to health policy in Malang city. In contrast, age (p < 0,001) and education (p < 0,01) has correlation to the awareness and willingness to health policy in area arround resident of respondents Table 3. Significance respondent characteristics with awareness and willingness to health policy Respondents characteristic significance significance Relation to the awareness and willingness to health policy in Malang Relation to the awareness and willingness to health policy in their subdistrict Ages P = 0,140 Not Significant P = 0,000 Significant Ethnc group P = 1,000* Not Significant P = 1,000* Not Significant Religion P = 1,000* Not Significant P = 1,000* Not Significant Education P = 0,482 Not Significant P = 0,039 Significant Income P = 0,653 Not Significant P = 0,323 Not Significant Occupation P = 0,102 Not Significant P = 0,266 Not Significant Sex P = 0,139 Not Significant P = 0,825 Not Significant * : used the Kolmogorov-Smirnov test results because it isn t qualify Chi Square test Relation of Information access factor to the awareness and willingness to health policy in Malang Identifying factors influence access to information (intensity following the news in the print media in the last 3 months, the intensity following the news on the radio in the last 3 months, the intensity following the news on TV in the last 3 months) to the awareness and willingness to health policy. 350
367 6 th TOPIC Table 4. Significance of Information access factor to the awareness and willingness to health policy in Malang Information access factor significance significance Following the news in the print media in the last 3 months Following the news in the radio in the last 3 months Following the news in the television in the last 3 months Relation to the awareness and willingness to health policy in Malang Relation to the awareness and willingness to health policy in their subdistrict P = 0,427 Not Significant P = 0,359 Not Significant P = 0,012 Significant P = 0,097 Significant P = 0,152 Not Significant P = 0,001 Signifikan Following the news in the radio in the last 3 months has relation to the awareness and willingness to health policy in Malang dan Relation to the awareness and willingness to health policy in their subdistrict with p=0,012, p=0,097, respectively. In other hand, following the news in the television in the last 3 months has relation with awareness and willingness to health policy in their subdistrict with p=0,001. DISCUSSIONS There are challenges in doing health policy analysis because of the complexity involved in the differrent difinitions associated with it 14. Health policy is not just about legislation which is broadly defined for become part made by both, national and local governments as well as decision, activity, rules le by organizational which is legally working in this field 15. We derivate a social framework to focus on the social awareness and willingness that operate as social forces 16. This framework allows us to see correlation between social awareness and willingnes that often influence which programs of policy will be conducted. From this viewpoint, health policy are result of health policy awareness and willingness and derivate with characteristic societies as determinant factor of health policy awareness and willingness 17. Results of this research contribute to the limited amount of research examining health awareness and willingness to health policy. This research also exlpore correlation between respondents characteristic and health awarenss, another topic area with limited information avaliable. Moreover, this research also identify role of media in build and develop health awareness and willingness to health policy. The results shown low level of awareness and willingness to health policy, even people prefer traffic jam policy rather than health policy. Further research is required to complete systematic and organized understanding in describe lower awareness of health inequilities from some groups and startegies to ameliorating health awareness 18. This result is similarly with research which is conducted by Shankardass et al, which view public awarenss about income related with health inequalities. Health inequilities is one important determinant of public opinion as driving of political will. Almost 73% of Ontarians s sample agreed with that not all people are equally healthy in Ontario. Awareness of income-related inequalities in health was lower, ranging from 18% for accidents to 35% for obesity. Other study in Canada explore public awareness on health inequalities. 351
368 6 th TOPIC As we described above, political will is drived by public awareness and willingness. Shankardass et al suggest that greater awareness may be needed to solve the health equity agenda forward in Ontario, such as there is a need for health equity advocates, physicians and researchers to increase the effectiveness of health awareness exploration and information in health inequalities 19. Overall, there is no correlation respondents characteristic (gender; age; ethnic group; religion; education; occupation; income of respondents) and awareness and willingnes to health policy in Malang city. In contrast, age (p < 0,001) and education (p < 0,01) has correlation to the awareness and willingness to health policy in area arround resident of respondents. Radio access has relation to the awareness and willingness to health policy in Malang and in their subdistrict with p=0,012, p=0,097, respectively. In other hand, television access has relation with awareness and willingness to health policy only in their subdistrict with p=0,001. The results of this study suggest that media access have pivot role in develop health awareness and willingness to health policy, especially radio and television. One specific approach might be to use is health importance with social marketing tool to develop an awareness and willingnes to health policy and future effort should encourage media campaign. Health importance campaign with the appropriate segment is a key to solve this poor health policy awareness and willingness. Much more consideration needs to be given to the packaging of multiple health awareness messages. Results from this survey also provide some direction for kind of media for health awareness promotion. Survey results point to radio and television as possible venues for health awareness consideration. Our results suggest that there is a need for health activist to increase the role of media to ameliorating public health awareness. In this field, our research try to find and conclude effectiveness strategy to imporve public health awareness, such as group demographic characteristic analysis and medica access. Social marketing strategies is useful to inform and bring over specific subpopulation to improve their health policy awareness. In pur research we found significant correlation of age groups to public health awareness. In Canada, several stidy was identified correlation and role of media in health policy awareness, such as Morrison conclude that canadian media should prioritize local and regional public health role to increase awareness in the general population 20. In other hand, several authors have reports a lack of interest to inform social determinants in the canadian media 20,21. Raphel reported that neglected of this topic in the mainstream of media infulenced by politic and economic societal structure 22. Because of that media have a responsibility to increase their role in campaign of health inequlities to less aware populations 19. Similar to Morrison study, Rigby et al. Reported that awareness of health maybe depend to media source that rarely discuess this probem and by perception which is developed in affected populations 23. Our survey included question characteristic of respondents, in order to identify factors related to health awareness and willingness, both in Malang city and in subdistrict area of respondent. The only significant association was age and education in health policy awareness residsents respondenst. Ages and education have a role in build health policy awarenss and willingness. We decide to not inform our findings in political affiliation to omit conflict of interest which is possible to influence scientific filed of this research. This is the first city-wide study in Indonesia to explore public health awareness. Thee findings indicate a need for public health awareness to ameliorate knowledege translation about important of public health policy by targeting less aware group and using television and radio as media access. This public opinion will be determinant in driving political will in Indonesia. Policy options influenced by social awareness and willingness is requires activism, collective action, and social movements to significantly empower the social willingness to become policy 24. The data indicate poor awareness, among malang city awareness and area arround resident of respondents, of health policy. Awareness and willingness is part of political social determinants of health policy. Another example of political social determinants role in health can be adopted in Wilkinson and Pickett s the spirit level, which conclude income inequlity as the fundamental cause that effects social 352
369 6 th TOPIC capital, population health, and health inequalities. Wilkinson and Pickett s thesis prove and strengthen theory of the importance of social determinants of health 24. In practical approach, we should build and develope health awareness and willingness to health policy and develop cost effectiveness analysis, decision analysis, and other analytic method are used to help make health policy decisions or to guide clinical practice 25. This is will become part of the role of the policy process. We must adopting and implementing the policy process in the shiffman and smith frameowork 26. This framework is helpfull when it comes to anticipating difficulties in implementing the recommendations and the resourcehs neede to overcome those difficulties: the cohesion of the politidal community, the ideas portraying the problem, the political context, and the issue importance 27. This is important step would be bottom up policy pressures aimed at improving adherence to good clinical practice guidelines in the role of health awareness and willingness. It should be noted that additional research into health awareness and willingness is needed, as the results here indicate poor health awarenss and didn t explain enough factor contiburing to health awareness and willingness. Such research will help support health awareness and willingness promotion activities. Additional effort is needed to understand social framework influence to health policy and which models and segemtns of health awareness and willingness are working. Marketing of health awareness and willingness is also an area for future research. CONCLUSION Enhancing health awareness among citizen ini Malang ia a challenging task. A number of opportunities remain for this evolving field of research. We found relatively few groups with such a poor awareness and willingnes in Health Policy. We conclude that a greater understanding of which aspects of every character and background are important in a health policy awareness and willingnes in Indonesia, then inherent sociotechnical for enhancing health policy awareness and willingnes in Indonesia. REFERENCES [1]. WHO, Country Strategy Strategy: Indonesia. at a glance.available from :WHO cooperation Strategy [Accessed:Januari 7, 2013 ] [2]. WHO. Indonesia Health Profile. [Accessed : Januari 7, 2013] [3]. Aparnaa Somanathan, Ravindra Rannan-Eliya, Tharanga Fernando: Indonesia Public Health Expenditure Review. Institute of Policy Studies Health Policy Programme. Colombo. Sri Lanka [4]. World Health Organization. World Health Report: reducing risks, promoting healthy life. Geneva, 2002 [5]. Atmarita. Nutrition Problems In Indoneisa. Directorate of Community Nutrition, The Ministry of Health. Indonesia 2005 [6]. Rigby E, Soss J, Booske BC, Rohan AMK, Robert SA: Public Responses to Health Disparities: How Group Cues Influence Support for Government Intervention. Social Science Quarterly 2009, 90: [7]. Levin B: These may be good times: An argument that things are getting better. In The Future of Educational Change: International Perspectives. Edited by Sugrue C. London: RoutledgeFalmer; 2008: [8]. Viggiano T: Who are the Uninsured?: The Public's Perception and its Effect on Health Policy Initiatives. In 99th Annual Meeting of the American Sociological Association. San Francisco, CA; [9]. Grundy J, Khut QY, Oum S, Annear P, Ky V: Health system strengthening in Cambodia-a case study of health policy response to social transition. Health Policy 2009, 92(2-3):
370 6 th TOPIC [10]. Sundewall J, Forsberg BC, Tomson G: Theory and practice - a case study of coordination and ownership in the Bangladesh health SWAp. Health Research Policy and Systems 2006, 4:5. [11]. Ratcliffe J, Bekker HL, Dolan P, Edlin R: Examining the attitudes and preferences of health care decision-makers in relation to access, equity and cost-effectiveness: a discrete choice experiment. Health Policy 2009, 90(1): [12]. Ottersen T, Mbilinyi D, Maestad O, Norheim OF: Distribution matters: equity considerations among health planners in Tanzania. Health Policy 2008, 85(2): [13]. Gopalan et al. Challenges and opportunities for policy decisions to address health equity in developing health systems: case study of the policy processes in the Indian state of Orissa. International Journal for Equity in Health 2011, 10:55 [14]. Buse K, Mays N, Walt G: Making health Policy. Milton Keynes, K: Open University Press; [15]. Journal of Urban Health: Bulletin of the New York Academy of Medicine, Vol. 89, No. 6 doi: /s [16]. Navarro V, Muntaner C. Political and economic determinants of population health and wellbeing: controversies and developments. Amiytyville, NY: Baywood Publishing Company; [17]. Muntaner C. Commentary: social capital, social class, and the slow progress of psychosocial epidemiology. Int J Epidemiol. 2004; 33(4): 1 7. [18]. Davidson R, Kitzinger J, Hunt K: The wealthy get healthy, the poor get poorly? Lay perceptions of health inequalities. Soc Sci Med 2006, 62: [19]. Shankardass et al. Public awareness of income-related health inequalities in Ontario, Canada International Journal for Equity in Health 2012, 11:26 [20]. Chaire de relations publiques et communication marketing de l Université du Québec à Montréal: Content Analysis Of Media Coverage Of Health Inequalities In Canada, Montreal, QC: National Collaborating Centre for Healthy Public Policy; [21]. Raphael D: Addressing the social determinants of heath in Canada: Bridging the gap between research findings and public policy. In Policy Options; [22]. Raphael D: Mainstream media and the social determinants of health in Canada: is it time to call it a day? Health Promot Int 2011, 26: [23]. Rigby E, Soss J, Booske BC, Rohan AMK, Robert SA: Public Responses to Health Disparities: How Group Cues Influence Support for Government Intervention. Social Science Quarterly 2009, 90: [24]. Coburn D. Beyond the income inequality hypothesis: class, neo-liberalism, and health inequalities. Soc Sci Med. 2004; 58: [25]. Doubilet P, Weinstein MC, McNeil BJ. Use and misuse of the term cost effective in medicine. N Engl J Med. 1986;314: [26]. Council of Europe: Recommendation CM/Rec (2011)13 of the Committee of Ministers to member states on mobility, migration and access to health care. Rec(2011) Brussels: Council of Europe; [27]. Dauvrin, M., et al. Towards fair health policies for migrants and ethnic minorities: the case-study of ETHEALTH in Belgium. BMC Public Health 2012, 12:
371 6 th TOPIC Nigella sativa GEL IMPROVES GRANULATION AND RE- EPITHELIALIZATION TISSUE OF DIABETIC RATS Yunita Sari 1, Dhadhang Wahyu K 2, Saryono 1, Arington IG 3, and Nakatani Toshio 4 1 Nursing Study Program, Jenderal Soedirman University, Indonesia 2 Pharmacological Study Program, Jenderal Soedirman University, Indonesia 3 Medical Department, Jenderal Soedirman University, Indonesia 4 Clinical Nursing Program, Kanazawa University, Japan. sasa.yunita@gmail.com ABSTRACT Diabetic ulcer causes significant reduction of patient s quality of life, huge health care expenses, and mortality. However, there is no optimal topical therapy effective in accelerating wound healing of diabetic ulcer. Nigella sativa oil (nso) has been proved to have antibacterial, anti inflammatory, and anti-oxidant effect. Therefore, we hypothesized nso could be used for accelerating of diabetic wound healing. The purpose of this study was to investigate the effect of nso in accelerating of diabetic wound healing. The design of this research was experimental study using rat. Full-thickness wound were created in flank region of rats by using 8-mm biopsy punch. The nso was made into gel. The rats were sacrificed on day 7. Rats were divided into 4 groups, 0%, 10%, 30% nso gel-treated group, and gauze-treated group. Macroscopical findings were observed from day 0 to day 7. Histological analysis were assessed with he staining. On day 7, wound size in the 10 % nso gel-treated group was the smallest compared with other groups. Inflammation in the 10% and 30% nso gel-treated groups was less pronounced compared with 0% nso gel and gauzetreated group. In addition, reepithelialization was more advanced in the nso-gel treated groups compared with others. The result of this research will give a big contribution for treatment of diabetic ulcer, leading to reduction of amputation. Keywords: diabetic ulcer, wound healing, nigella sativa gel. INTRODUCTION Diabetes Mellitus (DM) affects patient s quality of life, huge health care expenses, and high mortality. The number of patients with DM has increased significanly worldwide (1), including in Indonesia. World Health Organization (1994) revealed that Indonesia is the fourth highest prevalence rate of DM in the world. One of the complication which are most common to occur in patients with DM is diabetic ulcer. Diabetic ulcer is the main cause for amputation for people with DM. The most important reason for the amputation of the diabetic ulcer is the failure of wound healing (1). Comparing with normal wound healing, diabetic ulcer has a prolonged inflammatory phase, leading to the delay in the formation of granulation tissue and reduction in tensile strength of wound (2). The main cause of this prolonged inflammation is the increase of oxidative stres due to hyperglicemia condition (2). In additon to the effect of oxidative stress, the delayed wound healing in diabetic ulcer is also caused by ischemia and bacterial infection (2). Many topical therapy have been applied to accelerate the healing of diabetic ulcer, such as FGF, PDGF, and EGF (3). These therapy give benefit to improve the granulation tissue, however, it could not overcome the wound infection. Moreover, it is also very expensive and not available in Indonesia. 355
 has been proved to have antibacterial, antiparasitic and anti inflammatory, and anti-oxidant effect (4).")

372 6 th TOPIC Therefore, it is needed to make topical therapy that could accelerate healing by reducing the oxidative stress, ischemia, and has anti-bacterial agent but relatively cheap for indonesian diabetic patients. Nigella sativa oil (NSO) has been proved to have antibacterial, antiparasitic and anti inflammatory, and anti-oxidant effect (4). Nigella sativa oil have been attracted many researcher since it has many beneficial effect in the body (5). Previous in vitro and an in vivo study revealed that NSO has effect on reduction of oxidative stress, has a capacity as an anti-tumour agent, anti-diabetic agent, antiinflammatory agent, hepatoprotective agent, gastroprotective agen, nephroprotective agent, immunomodulatory agent, anti-plasmolytic agent, anti-convulsant agent, anti-bacterial agent, and antifungal agent (6, 7, 8, 9, 10, 11, 12, 13, 14,15,16,17,18,19,20,21, 22). In addition, it also has a beneficial on the activity of cardiovascular, pulmonary, and central nervous system (23, 24,25). In relation to the wound healing, previous study revealed that the use of NSO has a beneficial effect on acceleration of burn wound healing using rabbit model (26). The result showed that that wound treated with NSO showed faster wound closure compared with control (without NSO treatment). Similar study by Yaman et.al (2010) also found that NSO could accelerate burn wound healing in rat model (27). In their model, rat has been treated with NSO for 14 days. The result of hematoxylin and eosin staining showed that rats that received NSO have a better epithelialization tissue compared without NSO. Another recent study which was conducted by Al-Douri & Al-Kazaz (2010) investigated the effect of NSO in the healing on chemically induced oral ulcer in rabbit (7). Their study showed that the inflammation was reduced in the NSO-treated group. In addition, the epithelialization and healing time were shorther in NSO-treated groups compared with control group. However, up to the present, there is no study that investigate the effect of NSO on diabetic wound healing. Therefore, the objective of this pilot study was to investigate the effect of NSO on diabetic wound healing. If NSO gel could accelerate diabetic wound healing, it could give a big contribution to the treatment of diabetic ulcer in Indonesia, thus reducing amputation rate METHODOLOGY Animal Male Wistar rats, weighing of mg (8-week old) were used in this study. Animal were obtained from animal experiment laboratorium, pharmacological study, Purwokerto Muhammadiyah University. The induction of diabetes mellitus in rat was done by injection of Alloxan Monohydrate (Sigma Aldrich, USA) 120 mg/kg body weight. One day before wounding, the hair of each rat was shaved. Rats are anesthetized by intraperitoneal injection of ketamile (25 30 mg/kg body weight). Fig 1. Macroscopical findings (bar = 1 cm) Two full-thickness wounds were created at the flank region of rats by using 8-mm biopsy punch (19). Rats were divided into 4 groups, 0%, 10%, 30% NSO gel-treated group, and gauze-treated group. The first three group received gel application every day for 7 days. After application of gel, the wounds 356

373 6 th TOPIC were covered with transparent film dressings. Then rolled the trunk of the rat loosely in nonwoven fabric gauze, covering these transparent film dressings, and taped the gauze in place. In the fourth group, the wounds were covered with gauze dressing which was soaked in normal saline. Dressings were changed daily. During dressing changes, wounds were cleansed with normal saline, observed and photographed by digital camera. Gel preparation Materials for making NSO gel contained carbopol 940 as a base of gel, black cumin oil, triethanolamine (TEA), propylene glycol, propyl paraben and methyl paraben, and distilled water. Ten percents and 30 % NSO-gel means the gel contained 10 % and 30 % NSO, respectively. While 0 % gel means the gel not contain NSO. Histological analysis, H and E staining After the animals were sacrificed with an overdose of Ketamile, tissue samples of wounded area were harvested from rats in each group on days 7. The samples were fixed with 4% paraformaldehyde, dehydrated through a graded series of alcohol and xylene, and embedded in paraffin. The tissue samples were cut into 5-μm thick sections. Sections were deparaffinized in xylene, rehydrated in ethanol, and washed in distilled water. The sections were stained with Hematoxylin and Eosin to determine inflammation and tissue damage. The sections were observed under a light microscope at 50 times magnification. RESULTS Figure 1 showed the difference of the macroscopical findings between 0%, 10, and 30 % NSO-gel group, and gauze-treated groups. On day 1, the wound size in 10 % and 30% groups were smaller compared with other groups. In addition, granulation tissue which covered the wound base could also be detected in these two groups. From day 3 to 7, wound size in the 10 % NSO gel was the smallest among groups, and almost all part of the wound base was filled with granulation tissue. On day 5, the re-epithelialization was most clearly seen in 10 % NSO-gel group. On day 7, all part of the wound base in the 10 % group was covered with granulation tissue and new epithel. Compared with other groups, the granulation tissue and re-epithelialization was very slow in the gauze-treated group. The wound was covered with scab on day 3 to day 7 in this group. Fig 2. Hematoxylin & Eosyn staining of wound treated with 0% NSO gel, 10 % NSO gel, 30 % NSO gel, and gauze-treated wounds at 50 times magnification (A, B,C, D, respectively) Figure 2 is the result of hemtaoxylin and Eosyn staining of the skin tissue which were sacrificed on day 7. The inflammation was more pronounced in 0% and gauze-treated groups compared with 10 % and 30 % groups. The least inflammation occured in the 10 % group. Advanced re-epithelialization could 357
374 6 th TOPIC be observed in 10 % and 30 % groups. However, there was necrotic tissue above the border between granulation tissue and healthy tissue in 30% group which was not observed in the 10% group. The figure showed that wound treated by 10 % NSO gel showed better reepithelialization compared with other groups. DISCUSSION This is the first study to show that NSO can accelerate wound healing in diabetic wound. In this study, we used full-thickness wound model. In the previous study, we use NSO, however the oil is easily leakage, therefore in this study we made NSO into gel (28). The study indicated that NSO gel can accelerate re-epithelialization and improve granulation tissue. The result of this study is in accordance with previous study on burn wound healing, which found that NSO could accelerate burn wound healing in rat model (27). In the previous study, the changes of the macroscopical findings is unclear since the researcher did not observe the wound consecutively, however in this study, researcher follow the wound every day, therefore the change in the macroscopical findings could be observed. The result showed that the re-epithelialization was more advanced in the NSO gel treated groups compared with control group. Up to the present, the mechanisms by which NSO improve the reepithelialization is still unclear. However, in the wound healing process, the re-epithelialization process is usually impeded by the abundant presence of Matrix Metallo Proteinases (MMP) -2 and MMP-9 (29). The MMP-2 and MMP-9 could cause damage in the collagen at the border of epidermis and dermis. Previous study showed that NSO could reduce MMPs including MMP-2 and MMP-9, resulted in the reduction of MMP-2 and MMP-9, leading to faster re-epithelialization process (19). In this study, 10 % NSO gel is more likely to have better wound healing compared with 30 % NSO gel. The mechanism under this findings need further study. The result of this study can give to the new knowledge that NSO gel could accelerate the healing process of full-thickness wound by improving the granulation tissue and accelerate the reepithelialization process. CONCLUSION This is the first study to investigate the effect of NSO gel on the diabetic wound healing. The result showed that NSO gel could improve the granulation tissue and accelerate the re-epithelialization process. The result of this study indicated that. ACKNOWLEDGMENT This work is supported by DIPA grant, Jenderal Soedirman University for International Research Collaboration between Nursing Study Program and Department of Clinical Nursing, Kanazawa University. REFERENCES [1]. International Diabetic Foot Retrieved from [2]. Armstrong, D.G & Lawrence L.A Diabetic Foot Ulcers: Prevention, Diagnosis and Classification. Am Fam Physician.15;57(6): [3]. Loot MA et.al Fibroblasts derived from chronic diabetic ulcers differ in their response to stimulation with EGF, IGF-I, bfgf and PDGF-AB compared to controls Eur J Cell Biol.81(3):
375 6 th TOPIC [4]. Al Ghamdi MS The anti-inflammatory, analgesic, and antipyretic activity of Nigella sativa. J. Ethnopharmaco. 76 (1):45-48 [5]. Al-hariri, and Yar T Effect of two-months Nigella sativa supplementation on cardiac hemodynamic and andrenergic responsiveness. J pak Med Assoc. 59: [6]. Ait ML, Ait MH, & Elabbadi, N et.al Anti-tumor properties of blackseed Nigella sativa extract. Brax J med Bio Res. 40 (6): [7]. Al-Douri AS, Al-Kazaz SGhA The Effect of Nigella Sativa Oil (Black Seed) on the Healing of Chemically Induced Oral Ulcer in Rabbit (Experimental Study). Al Rafidain Dent J. 10(1): [8]. Badari OA. Thymoquinone attenuates ifosfamide-induced fancony syndome in rats and enhances its anti-tumor activity in mice J Ethnopharmacol. 67: [9]. Boskabady, MH et.al Relaxant effect ofdifferent fraction from Nigella sativa on guinea pig tracheal chains and its possible mechanism. Indian J exp Biol, 46: [10]. Burits, M and Bucar F Antioxidant activity of Nigella sativa essential oil. Phytother Res. 14(5): [11]. Breyer et.al Effect of thymoquinone and selenium on the proliferation of MG 63 cells in tissue culture. Biomed Sci Instrum 44: [12]. Burits M Antioxidant activity of Nigella Sativa essential oil. Phytother Res 14 (5): [13]. Chandra et.al HIV-1 protease inhibitor induced oxidative stress supress glucose stimulated insulin release: protection with thymoquinone. Exp. Biol. Med. 234 (4): [14]. Charles S, Bryan, MD., Kenneth l. et.al Bacteremia in Diabetic Patients: Comparison of Incidence and Mortality with Nondiabetic Patients. Diabetes care; 8: [15]. Deveci M, Gilmont RR, Dunham WR, et.al Glutathione enhances fibroblast collagen contraction and protects keratinocytes from apoptosis in hyperglycemic culture. Br J Dermatol.152: [16]. Ebru U, Burak U, Yusuf S, et.al Cardioprotective effect of Nigella sativa on cyclosporine A- induced cardiotoxicity in rats. Basic Clin Pharmacol Toxicol. 103: [17]. El-Kamali, Ahmed AH, Mohammad AS, et.al Antibacterial properties of essential oils from Nigella sativa seeds. Fitoterapia. 69: [18]. Hamdi NM, & Tara RA. Effect of Nigella sativa oil and thymoquinone on oxidative stress and neuropathy in streptozocin-induced diabetic rats Pharmacology. 84 (3): [19]. Hosseinzadeh, H et.al Anti-ischemic Effect of Nigella sativa L. Seed in Male Rats. Vol 5 (1). Iranian Journal of Pharmaceutical Research.1: [20]. Ismail et.al Nigella Sativa thymoquinone-rich fraction greatly improve plasma anti-oxidant capacity and expression of antioxidant genes hypercholesterolemic rats. Free radic Biol Mes. 48: [21]. Kanter M, Coskun O, Kalayci, et.al Neuroprotective effect of Nigella sativa on experimental spinal cord injuryin rats. Expt Toxicol 25: [22]. Kokoska et.al Comparioson of chemical composition and antibacterial activity of Nigella sativa seed essential oils obtained by different extraction method. J Food prot, 71 (12): [23]. McLennan S et al Molecular aspects of wound healing, Primary intention.14(1):8-13 [2] [24]. Meddah et.al Nigella sativa inhibits intestinal glucose absorpsion and improve glucose tolerance in rats. J ethnopharmacol. 21 (3): [25]. Paarakh, PM Nigella Sativa Linn.- A comprehensive review. Indians Journal of Natural product and resources. Vol 1 (4) : [26]. Osama A, & Abu-Zinadah Using Nigella sativa Oil to Treat and Heal Chemical Induced Wound of Rabbit Skin. JKAU: Sci. 21: [27]. Yaman I, Durmus A.S., Ceribasi S., Yaman M Effects of Nigella sativa and silver sulfadiazine on burn wound healing in rats. Veterinarni Medicina, 55 (12): [28]. Sari Y, Dhadang WK, Saryono, Arington IG, Nakatani T. The effect of Nigella Sativa Oil on reepithelialization of full thickness wound : a Pilot study. 1st Borneo International Nursing Conference. Pontianak, Juni [29]. Schultz G., Ladwig L, Wysocki A Extracellular matrix: review of its roles in acute and chronic wounds. Retrievedfrom Matric-Acute-Chronic-Wounds.html 359
376 6 th TOPIC 360
377 POSTERS
378
379 POSTER GREEN HOUSE EFFECT SOLAR DRYERS: AN APPROPRIATE TECHNOLOGY PRO-THE POOR Yuwana Agricultural Engineering Department, Faculty of Agriculture University of Bengkulu, Indonesia ABSTRACT Drying is determinant process in post-harvest handling and processing for agricultural products. Open air sun drying has been widely used to dry so many varieties of agricultural products by small scale farmer and fishery in developing countries. Although the technique is simple, this drying faces some problems, such as space intensive, risk of product damage, contamination and losses, and time consuming, especially when practiced during rainy season. To overcome these problems six models of green house effect solar dryers have been developed and explored to dry several agricultural products, such as fish (Model I and VI), banana (Model II and V) and rice cracker (Model II), banana (Model III), fish cracker and salted mustard green (Model IV). This paper presents the designs and performances of these six models of solar dryers which might be adopted by the farmers and fisheries wishing to contribute in eradicating poverty. Keywords : solar dryer, design, performance, agricultural products. INTRODUCTION Drying is one way of adding value to agricultural products. With good knowledge and sufficient equipment it can be done properly so that dried products can be locally marketed or even for export with good price. Knowledge plays important role in finding out the best method of drying in order to effectively conserve nutritive values of the products. Equipments with any level of technological contents are available in market to speed up drying performance. But lack of knowledge and investment drags small scale farmers and fisheries who in fact are the poor to find out the simplest way of drying which is open air sun drying. This drying is intensively practiced for wide variety of agricultural products such as grain, fruit, vegetables, fish, herbs and spices, recycled foods. After harvest grain is sun dried in common by spreading it on floor which may be in the forms of compacted ground, cement, asphalt country road or plaited bamboo. Nut and beans are sun dried on compacted ground. Placing picked fresh coffee fruit on the ground for sun drying is often practiced by some farmers in Bengkulu as part of obtaining coffee grain. Small scale farmers in Java Island usually spread paddy grain for drying on the plaited bamboo. In accordance to the development of infra structure in the country sides, asphalt country road is benefited as sun drying facility for almost all grains. Groups of small scale farmers provide cemented floor for paddy drying in some central paddy areas. Fruit and vegetables are usually sliced and placed on rounded woven bamboo, plastic tray or plastic canvas tent before sun dried on the ground, asphalt country road or even on the roof of country houses. The same manner is also done for herbs and spices. Fish is widely sun dried on the plastic net laid on bamboo or wooden platform placed in open areas. In Indonesia only less commercial for fresh market or having small size fishes which are usually processed by drying. Fish is cut at the abdomen to take out its feces. The fishes are dried with or without salting. To speed up drying process, fishes are split, especially for fishes with quite bigger sizes. Recycled foods are usually resulted from unfinished consuming for the products such as boiled rice, cassava etc. These stuffs are needed to be preserved by drying in order to be re-utilized for human or animal. Because their quantities are usually small, they can be dried by placing on the round woven bamboo container or plastic tray exposing to the sun. Although sun drying is simple and cheap but it faces some problems. It should be conducted with limited thickness or layer to assure that produce to be dried can receive as much as possible direct 363
380 POSTER light from the sun. Since agricultural products are naturally bulky, sun drying is spacious. Due to products are exposed to open space, they may be risk of produce contamination, damage and losses. Sun drying is labor intensive since the products needed to be removed, turned over and covered when drying is interrupted by rain or has to be done overnight. For the products which are attractive to the insects, such as fish and processed food, sun drying provokes the products in risk of contamination which endangers human health. Insects like flies may lay their eggs, bacteria or virus on the fish or food which may cause some diseases. Overcoming these problems various models of solar dryer have been proposed [6]. By manipulating energy coming from solar radiation and then applying for agricultural products, solar dryers may be categorized into hot-box type in which product is dried by the energy taking directly from the sun, indirect type conventional dryers that heat product with solar energy heater, and mixed type dryers in which product is dried by solar energy directly received from the sun and heat collected by solar collectors [3][7]. In indirect mode type dryers, drying rate depends on design, size of collector and thickness of the product being dried. The design and size of collector will determine rate and number of energy supply on the other hand the thickness will influenced by rate of drying air [1], properties, shape and porosity of product [5], size of individual product [4] and product moisture content [2]. Since 1999 Agricultural Technology Department, University Bengkulu has developed several models of green house effect solar dryer for agricultural products. This article presents the performance of some of them, hoping that they may be adopted by the poor to solve the problems usually encountered when they dry agricultural products and food by sun drying. METHODOLOGY Activities of experiment consisted of constructing dryers, installing them in the field, testing their performances and evaluating the results. The dryers were constructed in Laboratory of Agricultural Technology, Department of Agricultural Technology, Faculty of Agriculture, University of Bengkulu. To adapt different products and condition of space for installation in the field six models were introduced and among them were distinguished by with and without heat collectors, and with and without chimney. Main materials for construction were wood for structure and frame of trays, UV plastic for cover (roof, wall, collector, chimney) except for Model I (roof and cover of collectors made of glass), and aluminum sheets for heat collectors. Model I (Figure 1) consisted of drying room with trays inside, collectors made of aluminum sheet painted in black and equipped with air inlets at the lower ends, and chimney situated in the center of the roof and equipped with air outlet at the side of its the upper end. This dryer operated as soon as the structure received heat from the sun. The fresh ambient air entered into the inlets, and was heated by solar energy captured by the collectors. This air passed through trays in the drying chamber and was then further heated by solar energy collected directly fron the sun by the structure. The passing dry air removed the moisture content of the product to be dried which was placed in the trays. The humid air entered to and then escaped from the chimney through the outlet. Model II (Figure 2) was made of drying chamber equipped with perforated floor functioned as air inlets connected to outside air. This chamber was covered with inclined roofs met at difference heights one and other at their upper ends. Air ventilation was constructed along the clearance of the two roofs. Drying trays were placed inside the drying chamber. When the structure received solar energy from the sun, this energy heated air inside the drying chamber. Heated air experienced its density decrease and tried to escape from the chamber through the ventilation. Flowing dry air removed water from the product to be dried placing in the trays and humid air escaped from the drying chamber through the ventilation. Model III (Figure 3) was similar to Model II except its chimney was constructed along the center of roof. The chimney had two air outlets along its side of upper end. This model operated in the same manner as Model II and humid air came out from the dryer through the outlets of the chimney. Model IV (Figure 4) had a similar design as Model III but was equipped with collectors. The collectors were embedded to the floor of drying chamber. Mode of operation of this model was similar to model I. Model V (Figure 5) was very similar to Model IV except the trays were inclined and separated in two parties by a space s clearance. This model operated in the same manner as Model IV. Model VI (Figure 6) had design similar to Model I but its chimney was fixed at the 364
381 POSTER one of the wide sides of the dryer and was equipped with exhausted fan inside. This model worked in the same manner as Model I but air circulation within the drying chamber and collectors was accelerated by the fan. For all models, frames of the trays were made of wood while for their platforms three different materials were utilized i.e. non-corrosive wire, nylon and perforated woven bamboo. Inlets and outlets of the dryers were covered by nylon screens to protect the products being dried from insects invasion. All dryers were equipped with one or two doors to load and unload the products being dried. During experiments, samples of products were prepared and placed in the trays. For each product experiment was repeated three times. During operation of drying, temperature and relative humidity of ambient and drying chamber air together with product moisture content were observed. Thermohygrometer and high sensitivity balance were used for measurement. At the end of drying process final product moisture content was determined. Data of moisture content of the products being tested were presented in function of time. Mathematical model was employed to characterize drying rate of each commodity and each model of dryer. Figure 1. Solar dryer Model I 365
382 POSTER Figure 2. Solar dryer Model II Figure 3. Solar dryer Model III 366
383 POSTER Figure 4. Solar dryer Model IV Figure 5. Solar dryer Model V 367
384 POSTER Figure 6. Solar dryer Model VI RESULT AND DISCUSSION Due to limited space results of the experiment would not be presented in detail here. Changes in temperature and relative humidity were illustrated together with drying rate. Relationships between moisture content and drying time in the form of figure were presented only for three products. Figure 7 and 8 illustrated the relationships between moisture content and drying time for fish. Figure 7. Relationship between moisture content of fish and drying time for Model I [8] 368
385 POSTER Figure 8. Relationship between moisture content of fish and drying time for Model VI [14] Using threshold of 20% moisture content to define dry fish, Model I was able to finish drying process in hours while Model VI completed drying process in 17 hours on the other hand sun drying needed 44 hours to produce dry fish. Although Model I had faster drying rate, it was not favorable to be recommended because the dryer used glass as roof and cover of collector which was material front to damage. Figure 9 showed the relationship between moisture content of fish cracker and drying time for Model III while Figure 10 indicated the same relationship resulted by the same model of dryer when utilized for mustard green. If dry product for fish cracker was characterized utilizing the same threshold of moisture content as fish and then the dryer only needed about 5 hours to result dry fish cracker. Based on Figure 10 and adopting moisture content threshold of 10% for mustard green, Model III was also able to complete drying process in about 33 hours. Figure 9. Relationship between moisture content of fish cracker and drying time for Model III [11] Result of experiments also indicated that employing Model II drying of banana and rice cracker could be completed in 2-3 days [9]. In term of drying banana, Model V performed twice faster comparing to 369
386 POSTER drying time utilized by sun drying [13]. Performance testing of Model IV demonstrated that banana cracker drying needed only 1-3 days depending on weather condition [10]. Figure 10. Relationship between moisture content of salted mustard green and drying time for Model III [12] Seeing advantages from exploration of utilization green house effect model solar dryers presented above in term of drying performance, drying time and labor efficiencies, minimization of product damage and losses, availability material for construction, simple in design and affordable in budget for user, it comes to suggest that this appropriate technology may be adopted for the poor, especially farmers and fisheries to solve the problems rising from sun drying which is usually practiced. Since these advantages promises an economic added value this appropriate technology will hopefully contribute in eradicating poverty. CONCLUSION Green house effect model solar dryers presented above were promising good performances in which Model I, II, III, IV, V and VI were able to respectively finish fish drying in hours, banana and rice cracker drying in 2-3 days, fish cracker and mustard green drying in 5 hours and 33 hours, banana cracker drying in 1-3 days, and fish drying in 17 hours. These models might be adopted by the poor in the effort of contributing to the poverty eradication. REFERENCES [1] Brooker, D.B., Fred, W.B.A. & Hall, C.W., Drying cereal grains. The Avi Publsh. Co. Inc. Connecticut. [2] Haque, E., Ahmed, Y.W. & De Yoe, C.W., Static pressure drop in a fixed bad of grain as affected by grain moisture content. Transactions of the ASAE, 25(4) : [3] Lawand, T.A., Agricultural and other low temperature applications of solar energy. In «Solar energy handbook by Kreider, J.F. & Keith, F. McGraw Hill, New York. [4] McLean, K.A., Drying and storing combinable crops. Farming Press Ltd., Suffolk. 370
387 POSTER [5] Patterson, R.J., Arkema, B. & Bichert, W.G., Static pressure air flow relationships in packed beds of granolar biological materials such as grain II. Transactions of the ASAE, 14(1) : , 178. [6] Shoda, M.S., Bansl, N.K., Kumar, A., Bansal, P.K. & Malik, M.A.S., Solar crop drying. CRC Press. [7] Szulmayer, W., Thermodynamics of sun drying. Paper No. V24, in Sun in the service of mankind. UNESCO Conf. Paris. [8] Yuwana, Solar dryer for fish drying. National seminar entitled Potential of agriculture in increasing regional income. Medan, Indonesia Jun [9] Yuwana & S. Mujiharjo, Design of solar dryer for banana and rice cracker drying. Research report. [10] Yuwana & S. Mujiharjo, Drying of banana cracker with solar dryer. Research report. [11] Yuwana, Solar dryer for fish cracker. Research report. [12] Yuwana, Hidayat, L. dan Taupandri Designing solar dryer for salted mustard green production. Research report. [13] Yuwana, Sungkup bersayap solar dryer for banana drying. Research report. [14] Yuwana, Sidebang, B. Dan E. Silvia, Development of Teko bersayap type for agricultural products drying. Research report. 371
388 POSTER 372
389 POSTER INITIAL SCREENING OF GREEN SUPER RICE (GSR) LINES AND SUB1 GENE CONTAINING VARIETIES FOR SEEDLING STAGE DROUGHT TOLERANCE Untung Susanto 1, Rina Hapsari Wening 1, Made Jana Mejaya 1, and Jauhar Ali 2 1 Indonesian Center for Rice Research, Street 9th Sukamandi, Subang, West Java, Indonesia 2 International Rice Research Institute, Los Banos, Laguna, Philippines Contact untungsus2011@gmail.com ABSTRACT Global warming had caused un-certain rain fall pattern, so that drought occurence in rice plant was spreading not only in upland and rainfed lowland areas, but also in water limited irrigated areas. On the other hand, flooding and sub mergence risk is also increasing. Therefore, development of drought and sub mergence rice variety would be very useful to overcome the global warming effects. Sub1 gene had been identified it s fuction to control tolerance to 14 days sub mergence during vegetative stage. Nevertheless, drought screening into the sub mergence tolerant materials would be useful for further breeding strategy to pyramide drought and sub mergence tolerant simulaneously. On the other hand, Green Super Rice (GSR) was designed to have high yield in eithor optimum or un-favorable condition, such as drought and salinity stress condition. Some of the GSR lines had pyramided the genes already. This research was aimed to screen 66 GSR lines along with five Sub1 containing released varieties in Indonesia. The results showed that ZH1, IR81340-B-36-B, IR81341-B-17-B, CiherangSub1, andinpara 4 (SwarnaSub1) were tolerantto drought during seeding stage based on leaf rolling, drying, and plant recovery (score 3). On the other hand, there were 13 genotypeshaving score of 5 for the three traits, such as Inpara3, Inpara5 (IR64 Sub1), danpsbrc 82 Sub1, also some GSR such as FFZ1 (aromatik) and HHZ5-SAL10- DT1-DT1 (pyramiding of saline and drought tolerant genes). This research had initially identified GSR materials tolerant to drought. This research was also initially indicating that Sub1 gene beside controlling sub mergence tolerance it might be correlated also with drought tolerant. Selected genotypes in this testing were elite lines or released variety in Indonesia, China, or Philippines, so that they had high yield potential and good agronomic performance. This information would be very much useful for deciding the further breeding strategy and variety dissemination. Keywords : drought prone, seedling age, Green Super Rice, Sub1 INTRODUCTION One of the effect of global warming is the global climate change phenomenon. Las (2011) reported that rainfall pattern during had changed in average of 17% compared to Uncertain rainfall pattern caused drought stress occured not only in upland and rainfed areas, but also in limited irrigation areas. On the other hand, flood and sub mergence risk was also increased. Either drought or sub mergence is two of the major limiting factor in rice production. Therefore, development of drought and sub mergence tolerant rice variety is one of importanat strategy to overcome global climate change [6]. Water is very important for rice plant during all of it s growth phases, eventhough it is not the same level among the growth phase. Water is directly related to physiological, morphological, and combination of the both factors with the environment [1].. Drought is refered to the condition that the plant dehidrate due to limited water availability from the environment as growing media [2]. Plant response to drought hapened at cellular and molecular level such as plant growth, smaller cell size, smaller leaves size, increasing shoot root ratio, stomatal 373
390 POSTER sensitivity, reduction in photosinthetic rate, changes in Carbon and Nitrogen methabolism, and alteration of genes expressions [8]. Beside the drought, sub mergence is a mojor constrains for rice growing in some areas. Sub mergence damage the plant by limiting air circulation (CO2 and O2) that limited plant photosynthesis and respiration [4]. IRRI and China had developed Green Super Rice (GSR) lines, those designed to have high yield stable accross condition and also tolerance to major biotic stresses, there fore it required less chemical inputs and make the agriculture greener [11]. On the other hand, IRRI had developed good agronomic performance sub mergence tolerant variety by Sub1 gene [7]. Fukao et al (2011) reported that Sub1 could also increase plant survive suffering from immediated drought stress. This experiment ferify the tolerance of GSR and Sub1 containing materials during seedling stage, that is very useful for further breeding strategy to develop the certain varieties [3]. METHODOLOGY The screened materials were 65GSR lines,five Sub1gene containing varieties, and one ICRR tungro resistant line.the experiment was conducted in concrete box in the screen house of ICRR in Sukamandi during the first half of The seeds we sowed in pethi dished and transfered to the concrete box once it was germinated. IR20 as susceptibel check and Salumpikitas tolerant check were planted in every 20 tested entries. IR20 was also planted surrounding the tested genotypes. Water was given for seven days after planting and the stop until IR20 died od severely dried. Soil moistutre content/soil osmotic was monitored using Irrometer moisture meter in 15 cm depth. Scoring was done into leaf rolling and drying, and seedling phenotypic performance. Then, warer was given again to the plants for three days to see the plant recovery after one week. The best plant from the selected lines were transfered to pots and maintained to get the seeds for further testing. 374 RESULTS AND DISCUSSION Testing of drought tolerance during seedling stage in concrete box showed that the tested genotypes had variation on leaf rolling and drying, as well as plant recovery (Tabel 1).Fukao et al (2011) reported that Sub1gene not only control toleance to sub mergence, but also drought. Three GSR lines and two Sub1 containing variety, i.e. ZH1, IR81340-B-36-B, IR81341-B-17-B, Ciherang Sub1, and Inpara 4 were the most showing tolerance to drought. It was indicated by less leaf rolling and drying and better plant recovery (all with score of 3). Additionally, there were 13 genotypeshaving score of 5 for the three traits, such as Inpara3, Inpara5 (IR64 Sub1), andpsbrc 82 Sub1, also some GSR such as FFZ1 (aromatic) and HHZ5-SAL10-DT1- DT1 (pyramiding of saline and drought tolerant genes). This research had initially identified GSR materials tolerant to drought. Table 1. Score of leaf rolloing and drying and plant recovery of 66 GSR lines and 5 Sub1gene containing varieties under seedling stage drought tolerant screening in concrete box,sukamandi, 2012 Plant Remark No Genotype Leaf Rolling Leaf Drying Recovery 1 ZH Tolerant 2 HUANGHUAZHAN FFZ IR B-11-B Zhongzu IR B-57-B
391 POSTER No Genotype Leaf Rolling Leaf Drying Plant Recovery 8 Wanxian Sagc Sagc sagc Fan Sagc Sagc Hua ZX Sagc Fan Fan Salumpikit IR D LH Sagc Fan Fan ZX IR B-20-B Wanxian ZX IR B-28-B Sacg Zhonghua IR B-21-B LUYIN IR B-49-B IR (DT) IR B-79-B Remark 40 HHZ 9-DT7-SAL2-DT IR B-36-B Tolerant 42 IR B-17-B Tolerant 43 Salumpikit IR IR B-60-B KCD IR B-61-B RC
392 POSTER No Genotype Leaf Rolling Leaf Drying Plant Recovery 49 BD Hua Weed tolerant rice PD CAU Wuyujing Yundao IR B-8-B-B IR B-32-B HHZ17-DT6-SAL3-DT P TME IR B-7-B-B IR B-19-B HHZ 5-SAL 9 -Y3-Y Salumpikit IR IR B IR B-B HHZ12-Y9-Y3-Y RUTTST85B J* HHZ5-SAL10-DT1-DT Remark 72 HHZ5-SAL10-DT2-DT Inpari 30 Ciherang Sub Tolerant 74 Inpara 4 (Swarna Sub 1) Tolerant 75 Inpara Inpara PSBRC Sub First symptomp of plant under drought stress is rolling the leeaves. Leaf rolling is one of plant mechanism to face drought condition. Yoshida (1981) reported that water loss could be reduced by rolling the leaves, reduced leaf area surface, and reduced tiller number. Next symptomp of drought is leaf drying. It was due to the palnt could not be able anymore to maintain the cell osmotic [10]. Kirkham (1990) and Toruan-Mathiuset al.(2001) reported that drought caused un-balance of inner and outer plant cell osmotic so that the cell membrane was leaked as the cell finally collapsed. One plant mechanism to drought is recovering ability if the stress was not prolong. During the drought stress, plant was stagnant. Nevertheless, tolerant plant could maintain the meristem to be alive and start metabolims for further plant growth and development once the water is available [5][9]. Selected genotypes in this testing were elite lines or released variety in Indonesia, China, or Philippines, so that they had high yield potential and good agronomic performance. Therfore, the selected materials had been further tested in the related breeding programs, as well as utilized as donors to develop varieties having tolerance to drought and submergence, and furthermore pyramided with other useful traits such as salinity and pests and diseases resistance. Informationfrom this 376
393 POSTER research would be very much useful for deciding the further breeding strategy and variety dissemination. CONCLUSIONS 1. Three GSR lines and two Sub1 containing varieties, i.e. ZH1, IR81340-B-36-B, IR81341-B-17-B, Ciherang Sub1, and Inpara 4 were the most showing tolerance to seedling stage drought among the tested genotypes. 2. Sub1gene that controlling to sub mergence tolerance might also be related with drough tolerant. 3. The tolerant genotypes had been utilized for further testing and as donor to develop pyramided lines for the appropriate ecosystems. REFERENCE [1] Ai, N. S., S. M. Tondais, dan R. Butarbutar Evaluasi indicator toleransi cekaman kekeringan pada fase perkecambahan padi (Oriza sativa L). Jurnal Biologi XIV (1) : [2] Effendi, Seleksi Dini Toleransi Genotipe Jagung Terhadap Kekeringan. Penelitian Pertanian Tanaman Pangan Vol. 28 (2): [3] Fukao, T, E. Yeung, and J. B. Serres The Submergence Tolerance Regulator SUB1A Mediates Crosstalk between Submergence and Drought Tolerance in Rice. The Plant Cell January 2011 vol. 23 no [4] Hairmansis, A, Supartopo, B. Kustianto, Suwarno, H. Pane Perakitan dan Pengembangan Varietas Unggul Baru Padi Toleran Rendaman Air Inpara 4 dan Inpara 5 untuk Daerah Rawan Banjir. Jurnal Litbang Pertanian 31(1): 1-7. [5] Kirkham, M.B. (1990). Plant responses to water deficits. p [6] Las Adaptasi dan Mitigasi Perubahan Iklim dalam Upaya Penyediaan Pangan, Khususnya Swasembada Beras Berkelanjutan. Disampaikan dalam Semiloka Jabar Badan Litbang Pertanian. Kementrian Pertanian. [7] Xu K, Xu X, Fukao T, Canlas P, Maghirang-Rodriguez R, Heuer S, Ismail AM, Bailey-Serres J, Ronald PC and Mackill DJ Sub1 A is an ethylene-response-factor-like gene that confers submergence tolerance to rice. [8] Pugnaire, F. I., L. Serrano and J. Pardos Constrains by water stress on plant growth. p In M. Pessarakli (Ed.).Handbook of plant and cropstress. 2nd. Marcell Dekker. New York. [9] Toruan-Mathius, N., GedeWijana, Edi Guharja, HajrialAswidinnoor, SudirmanYahyadanSubronto Responstanamankelapasawit (ElaeisguineensisJacq) terhadapcekamankekeringan. MenaraPerkebunan : 69 (2), [10] Yoshida, S Fundamentals of Rice Crop Science.IRRI 269 p. [11] Zhang, Q, 2007b. Strategies for developing green super rice, PNAS, 104:43, pp ,Akita, S, 1989, Improving yield potential in tropical rice, Pp, 41-73, In: Progress in irrigated rice research, International Rice Research Institute, PO Box 933, Manila, Philippines. 377
394 POSTER 378
395 POSTER CLIMATE VARIABILITY: NEED FOR COLLECTIVE ACTION IN CONSERVING AGRO-BIODIVERSITY K.C. Siva balan 1, B. Swaminathan 1, and S. Nithila 2 1 PhD scholars CARDS, TNAU, Coimbatore, India 2 Assistant Professor, TNAU, India ABSTRACT Being an agrarian country with 56% of the workforce engaged in agriculture and allied agricultural sectors; Indian agriculture is vulnerable to climate change and natural disasters such as drought, flood and severe storms. Average temperature increases, changes in rainfall patterns and intensity, increasing levels of GHGs (greenhouse gases), and ozone depletion have a direct and primary impact on agriculture. Visible effects of climate change such as reduction of crop yield, rainfall, and new or resurgent pests are already occurring in tropical and subtropical regions, including countries like India. The 0.48 degree Celsius temperature rise in India in the last century is a direct consequence of climate change. Though global summits insist on global initiatives on climate change and mitigation, communities are the real time respondents to any agro-climate variations. Therefore, communities should be mobilized and trained to assess their own threats through a participation assessment process. People should be aware of factors responsible for climate change. A technology dissemination system can be effective in preparation of their contingency plans. Along with the bureaucratic efforts, a participatory approach involving local communities, local governments and non-governmental organizations (NGOs) should be identified to address the problem. Though policy makers enacted the policies and regulations, effective implementation is possible only when self-realization through a group approach is initiated. Hence, a vision is required to link the individuals, to delink the complex factors indulging in climate change. Thus, NGOs play a pivotal role in facilitating group efforts. The global challenges of climate change can be met only by strengthening community capacity, training, public information systems, campaigns, sustainable livelihood activities, committee formation, NGOs, etc. Keywords: natural disasters, agriculture, tropical and sub tropical regions, participatory approach, community capacity, Non government Organizations INTRODUCTION Agriculture plays a critical role in food and livelihood security of the world population for centuries. Recently the agricultural production is drastically affected due to climate extremes in various parts of the world. Intergovernmental Panel on Climate Change (IPCC), in which climate change refers to any change in climate over time, whether due to natural variability or as a result of human activity. This usage differs from that in the United Nations Framework Convention on Climate Change (UNFCCC), which defines climate change as a change of climate which is attributed directly or indirectly to human activity that alters the composition of the global atmosphere and which is in addition to natural climate variability observed over comparable time periods.the visible changes of climate change viz., sudden flood, drought, erosion and fertility, glacier disappearance are now become daily news features all round the world. Apart from direct impacts there are indirect impacts also such as impact on grain and forage quality, environmental effects, in particular in relation of frequency and intensity of soil drainage (leading to nitrogen leaching),soil erosion, reduction of crop diversity, resurgence of insects and pests, change in rural space, through the loss and gain of cultivated lands, land speculation, land renunciation etc., As a final outcome, climate change would likely increase the number of people at risk of hunger. Projected climate change impacts depended strongly on future social and economic development. Additionally, the magnitude of climate change impacts was projected to be smaller compared to the impact of social and economic development. Climate change can affect human livelihood through a range of mechanisms. These include relatively direct effects of hazards such as heat waves, floods and storms, and more complex pathways of altered infectious disease patterns, disruptions of agricultural and other supportive ecosystems, and potentially population displacement and conflict over depleted resources, such as water, fertile land 379
396 POSTER and fisheries (Pachauri & Reisinger, 2007).There is no clear dividing line between these divisions, and each pathway is also modulated by non-climatic determinants and human actions. Climate models predict that the impacts of climate change on agriculture will vary by region, adding to global inequality. Those living in high and mid-latitudes may find that a degree or two of warming actually improves crop yields. Latin America s crop and livestock productivity will decrease, Asia s food security will be threatened by alternating floods and droughts, and sub-saharan Africa could experience cereal production losses of 33% by Moreover, the IPCC states that climate change is likely to further shift the regional focus of food insecurity to sub-saharan Africa. IPCC has projected that the mean annual surface air temperature by the end of the century is likely to be 1.8 to 4.0 C and projected sea level rise by the end of the century is likely to be 0.18 to 0.59 mts. A study published in Science suggests that, due to climate change, "southern Africa could lose more than 30% of its main crop, maize, by In South Asia losses of many regional staples, such as rice, millet and maize could top 10%". The adverse climate change viz., the average temperature increase, change in rainfall pattern and intensity, increasing levels of GHGs (Green House Gases), ozone depletion have direct and primary impact on agriculture. The visible changes of climate change such as reduction of crop yield, rainfall, new or resurgence pests incidence are already occurring in tropical and sub tropical regions including countries like India. The rise in temperature of about 0.48 o Celsius India in last century gives a direct consequence of climate change issue.climate change can affect migration in three distinct ways. First, the effects of warming and drying in some regions will reduce agricultural potential and undermine ecosystem services such as clean water and fertile soil. Second, the increase in extreme weather events in particular, heavy precipitation and resulting flash or river floods in tropical regions will affect ever more people and may generate mass displacement. Finally, sea-level rises are expected to destroy extensive and highly productive low-lying coastal areas that are home to millions of people, who will have to relocate permanently. In this context, health challenges can involve, among other things, the spread of communicable diseases and an increase in the prevalence of psychosocial problems due to stress associated with migration. As for as India is concerned, India has been traditionally vulnerable to natural disasters on account of its unique geo-climatic conditions. 60 per cent of the land mass is prone to earth quake of various intensities: over 40 percent hectares are prone to flood: about 8 per cent of the total area is prone to cyclones and 68 percent of the area is susceptible to drought. Several recent studies indicate a probability of per cent loss in crop production by In India due to increase in temperature, rainfall variability and decrease in irrigation sources. The snow melting in the Himalayan slopes, heat waves in Northern states of India, drought of July 2002 affecting 310 millions, annual flood damages in north eastern states of India are the snap shots of climate change in Indian subcontinent. Figure 1: Effects of climate change on human health and current responses: Impact pathways Current responses Meteorological conditions exposure Extreme events Injury /death from hunger Epidemics Mental health issues Human/social consequence of climate change Examples: Displacement Shift in farming and land use Migration malnutrition Water-related Increased violence infections Adapted from McMichael & Bertillon (2009). Mitigation actions Examples: Alternative energy Accessible clean water People participation in rural re construction Adaptation actions Examples: Community education on early warning systems and hazard management Addressing water shortage and Crop substitution, 380
397 POSTER For farmers, insecurity due to erratic rainfall and unseasonal temperatures can be compounded by a comparative lack of assets and arable land, and in some cases lack of rights to own the land they till. This means that credit available for suitable agriculture technology (e.g. watering implements, climate appropriate seed varieties, non-petroleum fertilizers, energy-efficient building design) is limited, as is their capacity to rebuild post-natural hazards in this context. Loss of biodiversity can compound insecurity because many rural women in different parts of world depend on non-timber forest products for income, traditional medicinal use, nutritional supplements in times of food shortages, and a seed bank for plant varieties needed to source alternative crops under changing growing conditions. Thus, loss of biodiversity challenges the nutrition, health and livelihood of women and their communities (Boffa, 1999; Pisupati & Warner, 2003, Roe et al., 2006; Arnold, 2008). Food and Agriculture Organization (FAO) reported that, through participatory programmes and activities it is possible to mobilize local knowledge and resource for self reliant development and in the process, reduce the cost to governments of providing development assistance. People's participation is also recognized as an essential element in strategies for sustainable agriculture, since the rural environment can only be protected with the active collaboration of the local population. Nutritional status partly determines the ability to cope with the effect of natural disasters (Cannon, 2002).Women are more prone to nutritional deficiencies because of their unique nutritional needs, especially when they are pregnant or breastfeeding, and some cultures have household food hierarchies. For example, in South Asia and South-East Asia, 45 60% of women of reproductive age are underweight and 80% of pregnant women have iron deficiencies. In sub-saharan Africa, women carry greater loads than men but have a lower intake of calories because the cultural norm is for men to receive more food (FAO, 2001).For girls and women, poor nutritional status is associated with an increased prevalence of anaemia, pregnancy and delivery problems, and increased rates of intrauterine growth retardation, low birth weight and pre natal mortality. According to the Food and Agriculture Organization (FAO), in places where iron deficiency is prevalent, the risk of women dying during childbirth can be increased by as much as 20% (FAO, 2002).Pregnant and lactating women face additional challenges, as they have an increased need for food and water, and their mobility is limited. Globally, at any given time, an average of 18 20% of the reproductive age population is either pregnant or lactating (Rohr, 2007).These biological factors create a highly vulnerable population within a group that is already at risk (Shrade & Delaney, 2000). Social Participation and Climate change Mitigation Addressing the social and gender dimensions of climate change poses many challenges that are not insurmountable. It requires gender mainstreaming in climate change response activities, sustainable and equitable development, a clear focus on adaptation and mitigation, a strong commitment of resources, and empowerment of individuals to build their own resilience. Equity and social justice cannot be achieved without recognizing social participation, strengths of the community, and the various factors that contribute to participation. There is an urgent need to collect, analyse and report relevant data disaggregated in the context of non-governmental organisations in climate change and mitigation. There is a need for the development of gender-responsive and accessible health services that reach the poorest populations, thereby addressing particular health needs of women and men throughout their entire life-cycle. There are many missing links in the long chain of climate change and mitigation, the role of non - governmental organization and communities will provide these missing links. In the past, there were many instances, where the voluntary organizations undertook relief work whenever there were natural calamities like earthquakes and floods, threatening diseases and subsequent outbreaks of life. Voluntary action has become global phenomenon today. The Non-governmental organization strengthens the government rural reconstruction activities thereby contributing welfarism of the state. These institutions encourage people participation and involvement of people in programme planning, creation of awareness among the people. 381
398 POSTER Already many bureaucratic steps such as allotting INR 200 Cr for research to develop climate resistant plants and seeds in Feb 2012 Union Budget are taken by the Union Government. But to face the challenge, new strategies that enhance adaption, mitigation, sustainable production and regional cooperation should be drafted. The capacity building of the farmers to aware and face the natural disasters are need of the hour. The awareness about calamities and participatory preparedness planning through the community groups, Local Panchayats, non Governmental Organizations are needed not only for sharing the information and also for strengthening farmers resilience to natural and climate change induced disasters. Key elements to ensure "Direct" involvement of Community Disaster management programmes must be need specific The preparedness well in advance the disaster occurrence is more valuable than recovery works after fell as a prey to natural disasters.all the awareness programmes should be well received by the community. The programme must be in line with the felt needs of the people. It must be designed in such a way that the economic benefits or the immediate benefits are given due consideration. The technologies under the programme must possess "appropriateness" and they must be low-cost/no cost (non-monetary) technologies suited to the agroeconomic conditions of different areas. Community Approach With the technical guidance from the local level officials, and by involving local people, community approach may be implemented. Community should be educated with regard to their duties and responsibilities and rights and privileges. Whenever a development scheme is introduced, they must get 'prepared' so as to reap the benefits from that Scheme. If the beneficiaries of a development programme are organised into a viable institutional form, they can contribute for the successful implementation of a development programme. The self-help groups and Watershed approaches are already creating positive changes in the rural development and natural resource conservation projects. More number of Eco-clubs and Green clubs should be started to create awareness and action about climate change and manmade causes for the natural resource degradation. Redesigning Panchayati Raj system The Panchayats or the local self governments are a novel phenomenon to India perhaps they have an ancient origin in India.Panchayati Raj institutions are the grass root political bodies in India have a three tier set up of Village level Panchayats, Block level Panchayat union and District Panchayats. These institutions reach the people directly with rural development programmes. Hence the role of the Panchayati Raj institutions must be redesigned in the following manner so as to ensure the most effective participation of people. (a) Panchayats should coordinate with voluntary organisations - particularly the Youth and Women's organisations in creating natural conservation and resource management. (b) In order to ensure better participation of the members from the lower economic group, the number of reserved seats for Scheduled castes and women needs to be increased. Such co-opted persons must be assigned with specific roles and their opinions need to be recorded and recognised. (c) The proposals for developing projects should be kept before the Gram Sabha (village public meeting) and the majority win proposals should be started with strict vigilance for environment degradation. For this, suitable amendments and related laws may be enacted in these lines. Participatory monitoring While working with Self-help groups and Non-Governmental Organisations (NGO), identification of potential local leaders who influence certain groups is essential and their support need to be elicited. The people's representatives must be included in 'monitoring cells' constituted for effectively implementing any development scheme. While doing so, one must be doubly cautious about politicization of various issues. The implementing agency should realise that they are expected to answer the quarries posed by the people. They must convincingly reply to the doubts of lay men. 382
399 POSTER Micro-level planning With the people's representatives, mini-planning cells may be constituted at Taluks and district levels in order to encourage micro-level planning. For this, the District level planning units may be strengthened by positioning suitable personnel with flair for field-level planning. In this context, it was found that Panchayat Presidents were oriented towards Panchayat revenue and accounts only and hence necessary orientation had to be given to them in planning and execution of development programmes. Motivation of beneficiaries and executives towards disaster management programme objectives Since many extension scientists found the lack of awareness among beneficiaries of development schemes, it would be more appropriate if educational and motivational techniques are adopted for the beneficiaries before launching a programme. As suggested by National Commission of Agriculture (1976) the intrinsic and extrinsic motivation techniques need to be adopted to achieve this. Equally, the executives of a development programme need orientation towards die programme so that they can have a right perception about their role to be played. The process can be accelerated only when the poor become conscious of their rights and privileges. The people should not have improper conviction that a particular scheme is meant for others such as Very Important Persons or urban dwellers. To alleviate such improper conviction, the executives of the scheme should make the people aware of all the scheme objectives and the long range effects. NANDANGARAI CHECK DAM: CASE STUDY FROM INDIA About the check dam The Nandangarai is a perennial stream originating in the Western Ghats of South India. It flows down for about 3 kms through the densely covered forest and 2 kms along the eastern forest boundary to join River Chinnar at Sadivayal check post( Coimbatore district of Tamil nadu state.. There are 12 small streams (small and medium) that contribute water to the Nandangarai stream. Towards restoring River Noyyal, Siruthuli constructed a check dam across the stream to impound about 100 million liters of water with an average depth of 9 meters. Work activities The total programme was implemented following a participatory approach with active community participation at planning, execution and management levels. Participatory Rural Appraisal (PRA) and Rapid Rural Appraisal exercises were conducted in the villages to identify the issues, needs and priorities as well as to get convergence of efforts of User Groups (UGs), Siruthuli NGO and Government machineries. This project was being initiated under the "Namakku Naamae Thittam" of DRDA [District Rural Development Agency], Coimbatore. Of the total construction cost of 1.28 crores, 51% was given by Siruthuli as public contribution and the balance 49% was given by DRDA. Employment generation details Towards administering this project, 4 technical persons dedicated almost 7680 hours. Almost 70,736 person hours of labour employed. Impact of check dam construction Availability of water perennially in a 12 kms radius, facilitating the cultivation of crops throughout the year.2.provides employment opportunities for about 2500 agricultural labourers and their families.3.provides drinking water requirements of the tribal hamlets surrounding the project area and of about 3000 cattle that go for grazing to the forest.4.serves as water hole for wild animals like elephant, wild boar, deer and bear in the Western Ghats. Thus Non government Organizations and Community approach plays a pivotal role in facilitating group efforts. The global challenges of climate change can be meet out only by the way of strengthening community capacity, training, public information system, campaigns, sustainable livelihood activities, committee formation and non government organization etc. 383
400 POSTER REFERENCES [1]. Arnold JEM. Managing ecosystems to enhance the food security of the rural poor. Gland, International Union for Conservation of Nature, [2]. Boffa JM. Agro forestry parklands in sub-saharan Africa. Rome, Food and Agriculture Organization, [3]. Cannon T.Gender and climate hazards in Bangladesh.Gender and Development, 2002, 10: [4]. "Climate 'could devastate crops BBC News. 31 January [5]. FAO. Gender and nutrition. Rome, Food and Agriculture Organization, ( [6]. Lobell DB, Burke MB, Tebaldi C, Mastrandrea MD, Falcon WP, Naylor RL (2008). "Prioritizing climate change adaptation needs for food security in 2030". Science 319 (5863): [7]. McMichael A, Bertollini R. Effects of climate change on human health. In: Synthesis report from climate change: Global risks, challenges and decisions. Copenhagen, University of Copenhagen, [8]. Pachauri RK, Reisinger A.Climate change 2007: Synthesis report. Contribution of Working Groups I, II and III to the Fourth Assessment Report of the Intergovernmental Panel on Climate Change.Geneva, Intergovernmental Panel on Climate Change, [9]. Pisupati B, Warner E.Biodiversity and the Millennium Development Goals. Gland, International Union for Conservation of Nature, [10]. Röhr U.Gender, climate change and adaptation: Introduction to the gender dimensions.background paper prepared for Both Ends briefing paper Adapting to climate change: How local experiences can shape the debate.berlin, Genanet, August [11]. Shrade E, Delane P.Gender and post disaster reconstruction: The case of Hurricane Mitch in Honduras and Nicaragua.Washington, World Bank, [12]. World Hunger Increasing. Food and Agriculture Organisation (FAO) Newsroom. 30 October Retrieved
401 POSTER APPLICATION OF IRRADIATION MUTATION TECHNIQUE INTO EARLY MATURING RICE VARIETY ( DAY) FOR THE DEVELOPMENT OF IMPROVED AGRONOMIC PERFORMANCE-ULTRA EARLY MATURING (< 90 DAYS) RICE VARIETY Mohamad Yamin Samaullah 1 and Untung Susanto 1 1 Indonesian Center for Rice Research (ICRR), Indonesian Agency for Agricultural Research and Development (IAARD); street 9th Sukamandi, Subang, West Java, Indonesia, untungsus2011@gmail.com ABSTRACT Application of irradiation mutation breeding technique had been widely used for earliness maturity. Some of early maturing genotypes ( day after sowing, DAS) had been irradiated with gamma ray from Co 60 at 0,1-0,3 kgy. The irradiation was conducted in National Nuclear Energy Agency (BATAN) in Jakarta at Irradiated seed (M1) then was being established in Sukamandi experimental station of ICRR during DS 2010 on 1 m x 5 m plot. The M2 was then selected during WS 2010 in Sukamandi along with double haploid materials derived from the M1 plant. It was planted at 1 m x 5 m plot with the planting space of 20 cm x 20 cm, one seedling per hill. Pedigree selection was conducted to the ultra early maturing with good agronomic performance (erret strature). Twelve mutant lines was obtained from this selection. Eigh out of the twelve mutants had ultra early maturing growth duration (< 90 days). The selected materials would be further selected and purified during M3 and M4 generation in the consecutive seasons. Keywords: rice, mutant, selection, ultra early maturing. INTRODUCTION Gamma radiation had not been widely used for various purposes. Earlier studies showed that ϒ radiation could be applied to improve some plant traits such as: quality, productivity, and growth duration. Mira, Diah Suci and Atomita were varieties released by BATAN (Badan Tenaga Atom Nasional; National Nuclear Energy Agency) through irradiation mutation (Mugiono, et al., 2008). Mutation technique could be applied in breeding for improvement of one or two plant traits. Therefore, selection of parental is very important for the success of the breeding purpose. Improvement of popular variety with one or two weaknesses is suggested for faster breeding process (BB Padi, 2006; Mugiono et. al., 2010). Mutation is any change of heredity materials that caused inherited phenotipic change. Gene that had changed called as mutant. Artificial mutation is mutation that trigerred by mutagent(s). Breeders used mutagents to create or increase the variability to get new genotypes as targeted. Plant height and growth duration of rice plant is probable to be changed by mutation technique. It indicated that induction mutation could improve plant traits without any change in the non targeted plant traits (Amano, 2004). Based on this experience, some very early maturing ( days) genotypes had been irradiated and this paper reported the progress. 385
402 POSTER METHODOLOGY Four early matured ( days) genotypes (Yuan 66, 128, 135 and 155) were irradiated using ϒ rays from Co 60 at 0,1; 0,2 dan 0,3 kgy in Center of Application of Isotop and Irradiation Technology (Pusat Aplikasi Teknologi Isotop dan Radiasi, PATIR) of BATAN in Jakarta at Each of 100 g seeds with % moisture content were irradiated for each dosage. Irradiated seeds were then immediately planted in Sukamandi Experimental Station of ICRR on 1 m x 5 m plots od 20 cm x 20 cm planting space (during DS 2010). As many as panicles from each plots were harvested. On the other hand, during flowering stage some plants flowered earlier; those plants were anther cultured. Anther culture had been conducted into eight populations, i.e. M1 C2-28; M1 B1-30; M1 B2-27; M1 A1-83, M1 A2-31, M1C2-43, M1B2-34 and M1 A1-10. One panicle was harvested from each green plant resulted from the anther culture. The M2 and anther culture derived lines were planted in farmer field in Sukamandi during WS 2010/2011. One thousand plants were planted for each radiation level. Pedigree selection was conducted for ultra early maturing M2 mutants with erect plant strature. The selected materials would be planted as M3 and M4 during DS 2011 and WS 2011/2012 in Sukamandi experimental station, subsequently. Data of plant height, heading date, plant strature, growth duration, productive tiller number, panicle length, grain per panicle, and yield were collected. RESULTS AND DISCUSSION The effect of ϒ irradiation to the plant growth of M1 was various From the six genotypes being irradiated, not all the plants grew. Radiation dosage affected the plant growth in which the higher the dosage of radiation, the more cell plants were damaged, so that the more un-viable plants. From the M1 materials, it was selected 160 plant from 0,1 kgy, 125 plant from 0,2 kgy and 40 plants from 0,3 kgy radiation dosage. The plants from the three dosage levels grew well comparable with control. Nevertheless, during grain filling and maturing period, mostly the plant showed high sterility and grain emptiness. It might be due to physiological damages by ϒ irradiation (IAEA, 1977). Mugiono et al. (2008) was also reported that ϒ irradiation increased genetic variability. Genetic variability that had been obtained in M1 generation then heridited to M2 generation. In this generation, selection was conducted by getting one panicle from each selected mutant (Dewi and Rahayu, 2010). Selection of mutant plant on field was targeted for visually observed traits, such as agro-morphological traits, i.e. growth duration, plant heightm poanicle shape, and filled grain/panicle. Among the 325 mutant lines, the heading date was widely varied with the average of days. Out of them, 12 lines, i.e. M1A1-10, M1A1-83, M1A2-31, M1A2-39, M1B1-30, M1B1-13, M1B2-27, M1B2-34, M1C1-8, M1C1-30, M1C2-28 dan M1C2-43 (Table 1) had earlier maturity than the check variety. Out of the 12 lines, six lines i.e.: M1 C2-27; M1 B1-28; M1 B2-27; M1 B1-30; M2 A1-10; dan M1C2-43 (Table 2) were categorized as ultra early maturing. 386
403 POSTER Table 1. Heading date of anther culture derived lines, Sukamandi and Indramayu, WS 2010/2011. No. Mutan line Heading date (days after sowing) 1. M1 A M1 A M1 A M1 A M1 B M1 B M1 B M1 B2-34 M1 C1-8 M1 C1-30 M1 C2-28 M1 C2-43 Yuan Anther culture derived lines (42 56 days after sowing) tended to have earlier heading compared to non anther cultured materials (49-57 days after sowing). Agronomic observation of M2 populations showed that the twelve selected mutant had days growth duration. It was divided into two groups, i.e. ultra early maturing (< 90 days) and very early maturing ( days), with plant height of cm, productive tiller of The twelve selected mutant had panicle length of cm, grain/panicle of , 1000 grain weight of g, and grain weight/plant of g with errect plant strature. All the twelve selected mutants were further selected and purified in the subsequent M3 and M4 generation with focused on plant performance selection. Radiation mutation technique application into yuan variety suing some dosage levels of ϒ irradidation resulted twelve very early and ultra early maturing lines (Table 2). Eventhough it was still in M2 generation, it indicated that radiation mutation technique is aplicable to shorten the growth duration. From the selection and purification suring M3 and M4 generations should be conducted to obtain prospective ultra early maturing mutant lines. Table 2. Agronomic trats data of mutant lines at M2 generation, Indramyu and Sukamandi, DS 2010/2011 No. Line Plant height (cm) Growth duration (days) Productive tiller number Plant strature Panicle lengtrh (cm) Grain number/ panicle 1000 grain weight (g) Yield/ plant (g) 1. M1 A Errect 21, M1 A Errect 20, M1 A Errect 22, M1 A Errect 21, M1 B Errect 21, M1 B Errect 22, M1 B Errect 21, M1 B Errect 22, M1 C1-8 M1 C1-30 M1 C2-28 M1 C2-43 Yuan (check) Errect Errect Errect Errect Semi droopy 23, ,

 categorized as ultra early maturing (< 90 HSS). 4.")
404 POSTER Figure 1. Performance of rice mutant, Sukamandi, WS 2010/2011. CONCLUSIONS 1. Gamma radiation from Co 60 into early maturing genotypes, Yuan, affecting plant growth, in which increasing of the dosage caused more died and abnormal plants. 2. Gamma radiation of 0,1 kgy is more effective compared to 0,2 dan 0,3 kgy to obtain ultra early maturing mutant lines. 3. Out of the 12 mutant lines, M1 A1-10, M1A1-83, M1A2-31, M1B1-27; M1B1-13, M1 C1-8; M1 C2-28; and M1 C2-43) categorized as ultra early maturing (< 90 HSS). 4. Gamma radiation could shorten the growth duration from days to < 90 days. ACKNOWLEDGEMENT This research was suppoted by IARRD through 2010 ICRR National Budget. BATAN contribution to facilitate the ϒ irradiation activity is greatly acknowledged. REFERENCES [1]. Amano, E., Practical Sugestion for Mutation Breeding Forum for Nuclear Cooperation in Asia (FNCA). Mutation Breeding Project. [2]. Balai Penelitian Tanaman Padi, Deptan Program Penelitian Padi. [3]. IAEA, Manual on Mutation Breeding, Vienna Austria. [4]. Mugiono, Hambali, Sutrisno, Azriko dan Yulidar, Pelepasan Varietas Padi Sawah. Departemen Pertanian. [5]. Mugiono, Ita Dwimahyani dan Haryanto, Pemanfaatan Teknik Nuklir Pada Tanaman Padi. Buku padi 1. Balai Besar Penelitian Tanaman Padi. [6]. Mugiono. Sherly, R., dan J.P. Mandang, Penggunaan Teknik Mutasi Radiasi untuk Perbaikan Bentuk dan Umur Padi Varietas Super Win. Proseiding Seminar Hasil Penelitian Padi Balai Besar Penelitian Tanaman Padi. [7]. Dewi, A. K. dan Rahayu S., Sifat Genjah dan Batang Pendek Mutan Padi Lokal Varietas Sinar Datu, Prosiding Seminar Hasil Penelitian Padi Balai Besar Penelitian Tanaman Padi. 388
405 POSTER ON FARM TRIAL OF GREEN SUPER RICE (GSR) PRE-RELEASED VARIETY IN RAIFED LOWLAND AREAS OF INDRAMAYU Mohamad Yamin Samaullah 1, Untung Susanto 1, and Made Jana Mejaya 1 1 Indonesian Center for Rice Research, Street 9th Sukamandi, Subang, West Java, Indonesia untungsus2011@gmail.com ABSTRACT The introduction of Superior Green Super Rice (GSR) Pre-released Variety was conducted to pre captured the adaptability and farmer s preference in the targeted areas. GSR is rice genotypes designed to have high yield that is stable in optimum and un-favorable condition, tolerant to abiotic stresses, and resistant to pests and diseases, so that it required less chemical inputs. GSR was firstly developed in IRRI and China and first to be introduced and tested in Indonesia at Some promising lines has been being tested in multi location trials prior to release, once all the requirement is accimplished. The trial was conducted on farm scale in Sekarjati Village of Kecamatan Haur geulis, Kabupaten Indramayuduring DS Four lines, i.e. Zhongzu 14, Huanghuazhan, FFZ1, IR B and B-19-B IR83140B along withciherangas check. The activity was initiated by meeting with farmers group familiarizing the GSR lines. Upon the agreement with the farmer groups, then the on farm trial was conducted. Each variety was planted at acres, following legowa planting system 4:1 (12.5 x 25 x 50 cm) with fertilizer 25% lesser than the local recommendation. The results show that the five GSR lines giving 15-39% higher yield compared to Ciherang. There were two varieties, i.e.: Zhongzu 14 and IR B-19-B flowered 6-7 days later compared to other varieties. IR83140B-11-B had the highest yield (8.7 t/ha). It indicated that the GSR lines had high yield and stable at low input conditions, thus it is prospective to be further disseminated in the areas once it is released. Keywords: Green Super Rice, On Farm. INTRODUCTION Superior released varieties had changed from susbsisten into agro-bussines agriculture system due to it s high yielding ability compared to local varieties. The modern variety had increase national polished rice production from 7 8 million tons/year in to become million ton/year in (SuprihatnoandDarajat, 2009; Fagi, et al. 2009). Modern variety had the characteristics of short stem, errect leaves, more tiller, giving high chance for solar radiation to penetration canopy with better photosynthesis capability. It caused modern variety could grow very well and resulted more grains (Sembiring, 2010). In the future, the vavriety should need less inputs, but still high yielding, and environmental friendly. New released variety is needed to accommodate the problems above (Fagi, et al., 2002). Green Super Rice (GSR) id one of the alternatives to answer the problems above. GSR was designed for multiple superiority, such as high yield potential that is stable in low input conditions, resistant to major pests and diseases, tolerant to abiotic stresses (Zhang, 2007). GSR was firstly developed in International Rice Research Institute (IRRI) and China consisted of hybrid as well as inbreds materials. It was firstly tested in Indonesia at Some promising lines had been included in the multi location trials, and hopefully would be ready for releasing bu the end of This trials was aimed to intially see the adaptability of some pre-released GSR lines in the targeted areas, such as rainfel lowland areas in Indramayu. 389
406 POSTER METHODOLOGY The trial was conducted in MekarJati Village, KecamatanHaurgeulis, KabupatenIndramayuduring DS Four lines, i.e. Zhongzu 14, Huanghuazhan, FFZ1, IR B and B-19-B IR83140B along withciherangas check. The activity was initiated by meeting with farmers group familiarizing the GSR lines. Upon the agreement with the farmer groups, then the on farm trial was conducted. Each variety was planted at acres, following legowa planting system 4:1 (12.5 x 25 x 50 cm) with fertilizer 25% lesser than the local recommendation of Integrated Crop Managemen/PTT (Pengelolan Tanaman Terpadu). Heading data, growth duration, plant heigh, yield, and yield components were measured. Descriptive analysis was conducted into the collected data (Saefudin, 1988). RESULTS AND DISCUSSION In geneals, the genotypes grew very well. The genotypes showed no difference on plant heigh, i.e cm. The same case was for productive tiller number.zhongzu 14 and IR83140-B-19-B reach flowering stage 6-7 days earlier compared to other genotypes (Table 1). GSR lines showed greener plant until maturing stage compared to Ciherang (Figure 1 and 2). Table 1. Agronomic performance of Green Super Rice (GSR) pre-released varieties, Indramayu, DS No. Variety Heading date (days after Productive tiller Plant height(cm) sowing) number 1. Zhongzu Huanghuazhan FFZ IR83140-B-11-B IR83140-B-19-B Ciherang GSR lines showed 15 39% higher yield compared to Ciherang. Giving the fertilizers of 200 kg/haphoska(15n: 15P:15K) and 100 kg/haureahas enough support for the fice GSR lines to have higher yield compared to Ciherangthat received higher fertilizers according to the local recommendation, i.e. 300 kg/ha Phonskaand 200 kg/haurea. It showed that under less input condition, the yield of selected GSR lines could compete Ciherang that was under optimum condition. Among the genotypes, IR83140 B-11-B showed highest yield 8.76 t/ha. It has the best yield components, i.e. highest 1000 gain weight, highest filled grain/panicle, and the lowest un-filled grain/panicle (Tabel 2). The plant performance was also acceptable by the local farmer preference (Figure 1). Some farmers willing to plant again the GSR lines. 390
 Grain/Panicle Grain/Panicle weight (g) 1. Zhongzu 14 129 18 24.2 7.11 2. Huanghuazhan 138 21 22.9 7.28 3. FFZ 142 20 22.6 7.86 4.")
 (Table 3).")


407 POSTER Figure 1. Agronomic performace of GSR Pre-released varieties, Indramayu, DS Table 2.Yield and yield components of GSR Pre-released varieties along with Ciherang, Indramayu, DS No. Variety Filled Un-filled 1000 grain Yield (t/ha) Grain/Panicle Grain/Panicle weight (g) 1. Zhongzu Huanghuazhan FFZ IR83140-B-11-B IR83140-B-19-B Ciherang This results was relatively similar with the result of the yield trial in Purwakarta (Susanto, 2012). GSR lines showed higher yield compared to check under either under fertilizers application of 100% or 75% of SSNM (Specific Site Nutrient Management) (Table 3). Under 75% SSNM recommendation of fertilizers application, IR83140B-11-B had the highest yielf (6,83 t/ha) compared to other varieties, similarly with the trial in Indramayu (8.76 t/ha). Based on the results of trials in Indramayu and Purwakarta, it was indicated that the selected GSR lines had consistently showed better performance compared to the popular existed variety, Ciherang. Zhang, et al., (2007) reported that the GSR was designed to have higher yield and adaptable to lower availability of major planat nutritions. The lines should also tolerant to some abiotic stresses such as drought, salinity, and sub mergence, with acceptable quality. Table 3. Agronomic performance of GSR lines under 75% and 100% fertilizer application of SSNM, Purwakarta, DS 2011 (Susanto, et al., 2012). No. Variety Fertilizer Gap Gap 75% 100% (ton) (%) 1. IR83140-B-11-B Zhongzu Huanghuazhan FFZ Inpari Ciherang Rata-rata
408 POSTER CONCLUSIONS 1) The GSR lines had no variation on plant height with Ciherang, while Zhongzu 14 and IR83140-B- 19-B mature 6-7 days earlier compared to other lines and Ciherang. 2) GSR lines showed 15 39% higher yield compared to Ciherang while IR831040B-11-B giving the hihgest yield (8,7 ton/ha). 3) GSR lines showing later senescene and look green until prior to harvesting. 4) GSR lines are prospective since it has high yield potential and stable under low input condition. REFERENCES [1]. Bambang, S. dan A.A. Daradjat, 2009.Kemajuan dan Ketersediaan Varietas Unggul Padi, Buku 1 Padi, Inovasi Teknologi dan Ketahanan Pangan, Balai Besar Penelitian Tanaman Padi, Badan Litbang Pertanian. [2]. Fagi, A. M., I. Las, dan M. Syam, Penelitian Padi: Menjawab Tantangan Ketahanan Pangan Nasional. Balai Penelitian Tanaman Padi, Badan Litbang Pertanian. [3]. Fagi A. M., C. P. Mamaril dan M. Syam Revolusi Hijau, Peran dan Dinamika Lembaga Riset, Balai Besar Penelitian Tanaman Padi dan International Rice Research Institute. [4]. Saiffudin, A Metode Penelitian, Pustaka Pelajar Offset, Yogyakarta. [5]. Sembiring, H Ketersediaan Inovasi Teknologi Unggulan dalam Meningkatkan Produksi Padi Menunjang Swasembada dan Ekspor. Prosiding Seminar Nasional Hasil Penelitian Padi Balai Besar Penelitian Tanaman Padi, Badan Litbang Pertanian. [6]. Susanto, U., Umi Barkah, Irmantoro, Trias Sitaresmi, M. Y. Samaullah, M. J. Mejaya Keragaan Galur-Galur Green Super Rice Pada Kondisi Pemupukan Berbeda. Prosiding Seminar Nasional, Fak. Pertanian, Universitas Muhammadiyah, Purwokerto. [7]. Zhang, Q Strategies for Developing Green Super Rice. PNAS. 104:43, PP
409 POSTER LIFE CYCLE GHG EMISSION AND ENERGY CONSUMPTION FOR PRODUCTION OF BIODIESEL USING CATALYST FROM CRUDE PALM OIL AND CURDE JATROPHA CURCAS OIL IN INDONESIA Kiman Siregar 1, Armansyah H. Tambunan* 2, Abdul K.Irwanto 3, Soni S.Wirawan 4, and Tetsuya Araki 5 1 Graduate School of Agricultural Engineering, Bogor Agricultural University and Agricultural Engineering Department of Syiah Kuala University, Banda Aceh * 2 Graduate School of Agricultural Engineering, Bogor Agricultural University, Bogor 3 Graduate School of Management, Bogor Agricultural of University, Bogor 4 Energy Technology Centre-BPPT, Puspitek Serpong Tangerang 5 Graduate School of Agriculture and Life Science, The University of Tokyo, Japan ahtambun@ipb.ac.id ABSTRACT Energy sector plays an important role for Indonesia in achieving its economic development goal. Indonesia is still heavily dependent on fossil based energy, which is accounted for more than 90% of its energy mix (including oil, gas and coal). The most reliable alternative for substitution of the fossil fuel is biodiesel. Currently, environmental consideration becomes the most important issue in biodiesel production. Even though the source of the energy is considered as carbon neutral, the production path can emit various environmentally hazardous gasses. European countries claim that production of biodiesel from palm oil contributes carbon emission to atmosphere along its production path. Furthermore, US EPA-NODA states that palm oil based biodiesel can only reduce GWP emission by 17% compared to fossil-fuel based. The minimum requirement to enter global market is 20% for US and 35% for EU. This condition could make barrier to Indonesia. Scientific approach through Life Cycle Assessment (LCA) can be used as a tool to assess this issue. As one of the world s largest CPO producer in the world, Indonesia uses CPO to produce biodiesel. Moreover, Indonesian government also identifies that Jathropa curcas is another potential resource for biodiesel production. The results of this study show that biodiesel production from oil palm give higher value of green house gas (GHG) than jatropha. The use of agro-chemicals, such as fertilizers, herbicides, insecticides and pesticides, give significant contribution to the total GHG value, which was 68.14% and 37.56% for the respective oil palm and jatropha. Emission characteristics of both crops during unstable productivity period were found to be different from that during the stable productivity. Annual GHG value and energy consumption for producing biodiesel from oil palm was found to be higher than that from jatropha. For oil palm, the emission and energy consumption due to pre-harvest activity was higher compared to post harvest activity, while for jatropha, the post-harvest activity was higher than the pre-harvest one. The characteristics of GHG emission and energy consumption by biodiesel production from oil palm was higher than that from jatropha, both during unstable and stable productivity period, which GHG emission value before stable productivity is kg-co 2 eq./ton-bdf for oil palm and kg- CO 2 eq./ton-bdf for Jatropha curcas. When the productivity has reached stability, the GHG value is kg- CO 2 eq./ton-bdf for oil palm and kg-co 2 eq./ton-bdf for Jatropha curcas. With if we compared to diesel fuel, CO 2 eq. emission is reduced up to 49.27% and 76.03% for BDF-CPO and BDF-CJCO, respectively. Keywords : Biodiesel, crude palm oil, crude Jatropha curcas oil, GHG emission, life cycle assessment INTRODUCTION A continuing development of renewable energy is particularly necessary for Indonesia, which is known as an agrarian country with abundance of natural resources. Energy sector plays an important role for Indonesia in achieving its economic development goal. Short (2002) in Ndong (2009) stated that sustainability of modern economy partly depends on the capacity of the countries to guarantee their energy supply (IEA, 2008). Indonesia is still heavily dependent on fossil based energy, which is 393
410 POSTER accounted for more than 90% of its energy mix (including oil, gas and coal). The most reliable alternative for substitution of the fossil fuel is biofuel. Biodiesel can be produced from various oil borne plants, such as palm oil, Jatropha curcas, rapeseed, soybean, etc. Availability of the feedstock is one important consideration for effective production of biodiesel. Thereby, USA produced their biodiesel from soybean, Euoropean countries from rapeseed, while Indonesia mainly from palm oil. Currently, environmental consideration becomes the most important issue in biodiesel production. Even though the source of the energy is considered as carbon neutral, the production path can emit various environmentally hazardous gasses. European countries claim that production of biodiesel from palm oil contributes carbon emission to atmosphere along its production path. Furthermore, US EPA- NODA states that palm oil based biodiesel can only reduce GWP emission by 17% compared to fossilfuel based. The minimum requirement to enter global market is 20% for US and 35% for EU. This condition could make barrier to Indonesia as one of the world s largest CPO producer. Sheehan et al. (1998) reported that biodiesel B100 from soybean will reduce CO 2 emission by 78.45% compared to oil produced from fossil (fossil-fuel based). In regard to this result, Indonesia should analyze the equilibrium balance between carbon emission produced from biodiesel utilization and its biodiesel production path. This analysis should be conducted for two kinds of oil borne plants i.e. palm oil and Jatropha curcas. Scientific approach through Life Cycle Assessment (LCA) can be used as a tool to assess this issue. LCA has been widely used by America and Europe for other organic materials. Besides for emission analysis, LCA is also designed to analyse all aspects related with energy. LCA is a systematic process which comprises identification, measurement, and assessment of environmental impact caused by a product during its life cycle process or activity. LCA can be used to ensure that all environmental impacts has been considered for deciding action, calculating environmental impact that might occur, comparing process performance and developing data base for further research. In this regard, LCA can be used as a tool to support decision making on environmental improvement conducted by enterprise or government (Cowell, 1999). Other advantage taken from LCA is that it can be used for in comparing and evaluating products which have similar functions or uses. By using particular criteria, LCA can be a method on deciding whether one certain product has better qualification than others based on particular perspective (Searcy, 2000). The target of LCA is to compare the whole environmental damage caused by product or particular activity and then select one option which have the least damage risk. This step is incorporated in Life Cycle Impact Assessment (LCIA). LCI is one of four stages of LCA which have important role to conduct the assessment. The result generated from LCA is highly influenced by the validity and sufficiency of data inventory of the object being assessed. In Indonesian case, the data access that can be used in this LCA study is very limited. Collecting data process is the main focus in analyzing the stock and the most time consuming among other process involved in LCA (Searcy, 2000). Number of LCA study on Indonesian biodiesel production come up with different result. This difference could be due to data inconsistency and did not present the actual condition found in the field. Crude palm oil (CPO) is one kind of biologic resource that has been widely produced for biodiesel fuel, including Indonesia as the world main producer of palm oil. However, CPO is a food resource. This drives Indonesia to find another alternative source for biodiesel production. One promising source is Jatropha curcas L. which is considered as non-edible industrial plant used for biodiesel fuel (Silitonga et al., 2011; Tambunan et al., 2012). Jathropa curcas could be planted in marginal soil, semi dry climate, and suitable in tropical and subtropic climate. According to Kaushik et al (2007) in Ndong, R. (2009), Jatropha curcas contains 28 and 38% oil that can be changed into jathropa methyl ester (JME). According to those aforementioned situations, an effort to address this issue should be conducted by identifying and presenting actual condition of Indonesian palm oil and jathropa curcas estate. In this research, LCA is used to analyze the prospect of palm oil and Jatropha curcas development. 394
411 POSTER OBJECTIVE AND PROBLEM FORMULATION The objective of the research is to analyze and compare Life Cycle Assessment (LCA) of oil palm and Jathropa curcas as feedstock for biodiesel in Indonesia from cradle to gate using data based found in Indonesia. According to those aforementioned situations, scientific approach needs to be taken in order to answer the problem related with global warming emission and others environmental effect along its biodiesel production path from palm oil and Jatropha curcas. Reducing emission value generated from oil palm and jathropa curcas for biodiesel production is important to be determined in order to meet the standard of global market. The following questions have been formulated from the previous problem in systematic and structured study to provide good result: 1. What is the emission distribution for planting, harvesting and post-harvesting of palm oil and Jathropa curcas-based biodiesel? Which stage has significant effect? What kind of material input is the most siqnificant increasing the global warming potential emission value? 2. How are the energy consumption, net energy balance, net energy ratio, and renewable index of biodiesel production from palm oil and jathropa curcas? 3. How much is the potentialing in reducing green house gas (GHG) emission generated from palm oil and jathropa curcas-based biodiesel compared to diesel-fuel one? It is expected that the research could give solution and describe the net energy balance and net energy ratio for further development of biodiesel processing. METHODOLOGY The system boundary for LCA study is shown in Fig.1., which is a cradle to gate assessment. The production cycle to be assessed consists of eight sub-processes. The functional unit (FU) of this study is 1 ton of biodiesel fuel (BDF) production from jatropha and oil palm. Data to be used in this study was from oil palm plantation in PTPN VIII Unit Kebun Kertajaya Lebak Banten and from Jatropha curcas centre Pakuwon Sukabumi West Java, and secondary data. Both locations are in Jawa island of Indonesia. Each stage of analysis and calculations was carried out before and after the plants yield the usable fruits. Based on the field survey, oil palm and jatropha will have stable productivity after 5 th years from seed plantation. The first production of palm oil occurs at 30 months old, while Jatropha curcas at 4 months after plantation. Silip et al. (2010) said that jatropha starts to bear flowers within 93 to 124 days after seeding. Transportation from seed from nursery to plantation area was assumed to be as the distance from the centre point of the plantation, which was 30 km, using 5 tons capacity truck with 1 liter diesel oil consumption per each 5 km. Transportation of fruits from harvesting area to palm oil mills was 150 km, using 10 tons capacity truck, with 1 liter diesel oil consumption per 7 km travel. Transportation from palm oil mills to biodiesel plant was 200 km, using 10 tons capacity truck. 395
412 POSTER mass, energy land preparation mass, energy seedling (E) emision (E) (E) (E) (E) (E) plant ready to be planted to harvest T seed transportation (T) mass, energy planting fertilizing mass, energy mass, energy (E) protection T fertilizer (E) T pesticides & herbicides mass, energy harvesting T palm oil mills/ FFB/ fruit extraction of jatropha cradle to gate Fig.1. The system boundary of this study mass, energy CPO/ CJCO kernel shell mass, energy biodiesel plant 1 ton BDF empty fruit bunches/ empaty branch fibers/skin fruit RESULT AND DISCUSSION A. Life Cycle Inventory (LCI) The LCI was conducted based on input-output analysis of mass and energy to each of the production line, as shown in Fig.1. Comparison of material and energy used for 1 ton production of palm oil and jatropha based biodiesel is shown in Table 1 (Alamsyah 2006; Pranowo 2009; Ferry 2009; Wirawan 2006; Wirawan 2009; Nasir 2010; Wicke 2011; Pardamean 2011; Siregar 2012). Stable productivity of palm oil at PTPN VIII is approximately at 21.5 tons per ha (Pahan 2011; Lubis et al. 2011; Pramudita 2011), while jatropha has stable productivity at about 8 tons per ha for IP3-P (Pranowo 2009; Ferry 2009). At the stable productivity of each crops will be obtained at the 5 th years, and after the production of stable, palm oil can produce biodiesel 4.31 tonnes per ha and Jatropha curcas 1.09 tonnes per ha. Pleanjai ( 2007 ) said to produce 1 ton of biodiesel takes about 1.14 tons of CPO or rendemen about 87.7 %, and takes about about 6-7 tons of fresh fruit bunch or rendemen about 15.38%. Weeds population in oil palm estate is higher than in jatropha plantation, which needs more effort to control. This fact is the reason for higher herbicide requirement for oil palm plantation than for jatropha, as shown in Table 1. The height of seeds lived surrounding palm seedlings is approximately 1.5 m while Jatropha curcas tree is approx. 0.5 m. Oil palm also needs more diesel fuel than jatropha due to the requirement of mechanical tillage for oil palm plantation. On the other hand, jatropha plantation needs less tillage for the plant more resistant to critical environmental conditions. At nursery stage, oil palm plantation uses higher amount of pesticides and fertilizer due to longer seedling process (12 months) compared to jatropha plantation (3 months). Palm oil seedling consists of growth stage of seedlings and seedling nursery which need intensive amount of fertilizers and pesticides. However, jatropha needs more application of fertilizer during planting stage, since the number of trees per hectare of jatropha plantation is larger (2500 trees) than oil palm (136 trees) (Ferry 2009; Tjahjana et al. 2010; Lubis at al. 2011). The table also shows that during the first five years growth, oil palm plantation needs more fertilizer, as well as other agro-chemicals for protection, than the jatropha plantation. Oil palm is more susceptible to plant pests than jatropha. Dose application will change continuously based on plant s requirement, which is analyzed and determined by soil and leaves nutrient needs. This analysis will give the appropriate amount of fertilizer and protection agro-chemicals. From Table 1 can also be seen that the Jatropha curcas more use of organic fertilizer and pospate fertilizer than oil palm in its growth. The use of fertilizer for higher oil palm from Jatropha curcas, especially in the use of urea, rock phosphate, muriate of potash, and ammonia. This happens because the fundamental nature of plant oil palm highneeds fertilizers, especially fertilizer N, P, and K. Omotto et al. ( 2009 ) in his research mentioned that the use of fertilizers intensively would affect the environment and the acidification impact potential is mostly due to the NO x 396
413 POSTER Table 1. Mass and energy for 1 ton BDF per ha per year from CPO and CJCO during the first fifth year (average value of secondary and primary data) emitted by the combustion of ethanol during use, on account of the sulfuric acid use in the industrial process and because of the NOx emitted by the burning in harvesting. Jatropha curcas grown in Indonesia is known as poisonous plant so it has high resistance to pest and disease attack. It is probably caused by the planting system that is generally mixed with other plants such as gamal (glyrecidiamaculata) and waru. If planting is conducted in monoculture system with wide space to others plants it might result the occurrence of pests and diseases. At the stage of harvesting sub-process, the transport energy uses for oil palm is higher than Jatropha curcas due to the differences of harvesting yield. The yield of oil palm is higher than Jatropha curcas. In the case of crude oil production, Jatropha curcas oil needs only electricity and diesel fuel for its process. On the other hand, palm oil mills need more materials and energy. At the stage of biodesel production sub-process, due to high average value of free fatty acids (FFA) in Jatropha curcas oils, it needs esterification stage before trans-esterification. Consequently, Jatropha curcas oils needs more materials and energy. Silitonga at al. (2011) also said that the main problem of jatropha as a biodiesel is its high FFA. Moreover, it still needs filtration and transesterification process required to upgrade oil characteristics before admix to biodiesel. Silip et al. (2010) in his research has conducted various studies in the process of harvesting Jatropha curcas to produce low value of FFA. Silip et al. (2010) in 397
414 kg-co 2 eq./ton BDF POSTER his research has made a variety of efforts ranging from seedling, cultivation and harvest of Jatropha curcas as one of its objectives to produce low value of FFA. B. Life Cycle Impact Assessment (LCIA) Impact assessment was carried out using data provided in inventory analysis and in MiLCA-JEMAI (Multiple interface life cycle assessment-japan environmental management association for industry) database version Two categories of environmental impacts were interest i.e. GHG emission and energy consumption. GHG emission is the most significant environmental impact caused by biodiesel production either from palm oil or Jatropha curcas oil. Most of the GHG emission emerges from utilization of agrochemical in form of fertilizer and plant protection, i.e % and 37.56% of total emission of biodiesel produced from palm oil and Jatropha curcas oil, respectively. Other works conducted by Pramudita (2011) and Sekiguchi (2012) showed that the value of GHG emission in crude Jatropha curcas oil (CJCO) extraction process is estimated to be 1.34 kg-co 2 /kg-cjco and 0.08 kg-co 2 /kg-bdf. In this research, the GHG value is kg-co 2 eq./ton-bdf with assumption which assume that drying is carried out naturally (sun drying). Life cycle of oil palm is about 25 years (Pahan 2011; Lubis et al. 2011), while Jatropha curcas can reach up to 50 years (Pranowo 2009; Ferry 2009; Tjahjana et al. 2010) even the productivity of Jatropha curcas is stable until the 25 th year. From Fig.2 and Fig.3, it can be seen that the GHG value for oil palm is higher than Jatropha curcas in every stages except for planting and biodiesel production stages. The most significant environmental impact based on GHG value is caused by fertilizing and biodiesel production stages both at oil palm and Jatropha curcas. The total value of GHG emission before stable productivity is and kg-co 2 eq./ton-bdf for oil palm and Jatropha curcas, respectively. Fig. 2 shows that oil palm s GHG value of eight sub-processes which consist of land preparation, seedling, planting, fertilizing, protection, harvesting, palm oil mills, and biodiesel production is 0.44 %, 0.61 %, 0.91 %, %, %, 1.23 %, %, and %, respectively. While for Jatropha curcas as shown in Fig. 3 is 0.63 %, 0.74 %, %, %, 4.02 %, 0.48 %, 1.08 %, and %, respectively. GHG Emission of Oil Palm , Land preparation Seedling Planting Fertilizing Protection GHG Emission Fig.2. The total value of GHG emission on BDF-CPO before- stable productivity (1-5 year) Harvesting Palm oil mills Biodiesel production 398
415 MJ/ton-BDF kg-co 2 eq./ton BDF POSTER GHG Emission of Jatropha curcas Land preparation Seedling Planting Fertilizing Protection Harvesting GHG Emission Palm oil mills Biodiesel production Fig.3. The total value of GHG emission on BDF-CJCO before- stable productivity (1-5 year) Lord et al. (2009) stated that environmental impact towards aquatic, land, air and others of palm oil processing from operation to processing stage was 47 %, 24 %, 8 %, and 21 %, respectively. Prueksakorn et al. (2006) said that the major contribution of greenhouse gas (GHG) effect during biodiesel production from jatropha comes from the production and use of fertilizers, diesel oil consumption for irrigation, and transesterification process which is accounted for 31 %, 26 %, and 24 %, respectively. Prueksakorn et al. (2006) also explained that CO 2 emissions for producing biodiesel from crude jatropha oil with transesterification method is generated from land preparation, cultivation, irrigation, fertilizing, cracking, extraction oil, filtering, and transesterification process which is accounted for 4.7%, 0.2%, 26.1%, 30.3%, 3%, 10.9%, 0.5% and 24.3%, respectively. Ndong et al. (2009) gives the details of GHG emissions in the various processes as follows: the cultivation of jatropha is accounted for 52% of total emissions, while transesterification and combustion phase are 17% and 16%, respectively. Large emissions occur in fertilizer application, were estimated to be 93%. Fig.4 and Fig.5, show that energy consumption for oil palm is higher than Jatropha curcas in every stages except for planting and biodiesel production. The largest energy consumption for Jathropa curcas occurs in biodiesel production sub-process i.e MJ/ton-BDF. While the largest energy consumption for oil palm is fertilizing sub-process i.e MJ/ton-BDF. However, energy consumption in biodiesel production sub-process of Jatropha curcas oil is higher than that of palm oil due to higher free fatty acid (FFA) content which needs esterification process prior to the transesterification process. The total value of energy consumption before stable productivity for oil palm and Jatropha curcas is and MJ/ton-BDF, respectively Energy consumption, HHV(fossil fuel) for Palm oil Energy consumption Land preparation Seedling Planting Fertilizing Protection Harvesting Palm oil mills Biodiesel production Fig.4. The total value of energy consumption in oil palm before stable productivity (1-5 year) 399
416 kg-co2e/ton BDF MJ/ton-BDF POSTER Energy consumption, HHV(fossil fuel) for Jatropha curcas Energy consumption Land preparation Seedling Planting Fertilizing Protection Harvesting Extraction oil Biodiesel production Fig.5. The total value of energy consumption for Jatropha curcas before stable productivity Fig.4 shows that oil palm energy consumption during land preparation, seedling, planting, fertilizing, protection, harvesting, palm oil mills, and biodiesel production is 0.33%, 0.49%, 0.78%, 36.60%, 12.47%, 0.85%, 16.04%, and 32.45%, respectively. While for Jatropha curcas, the value of each sub process is 0.39%, 0.45%, 8.13%, 25.98%, 2.82%, 0.26%, 0.56%, and 61.4%, respectively (Fig.5). Prueksakorn et al. (2006) also explained that energy consumption needed for transesterification is higher than fertilization. On the contrary, fertilization is higher in greenhouse gas emissions. It occurs because of the N compound and because the use of N 2 O has strong effects on GHG. James et al. ( 2006 ) explained that the amount of energy required to produce biodiesel, relative to the energy content, because besides renewable energy attached to feedstocks, such Jatropha curcas and oil palm where the dregs still can be used as a source of energy in the process of processing, also because most analysts energy agriculture see solar energy was arrested by biomass freely. Fig.6 shows decreasing GHG emission value from year-1 to year-5, and stable from year-6 to year-25. At first, the value is incredibly high because production value per ton BDF is still very small. When divided by biodiesel, the material and energy value are relatively high (first year) which resulted in high impact assessment. Besides, in first year for Jatropha curcas and third year for palm oil, 8 stages of sub-process are still included in examination, while in remaining years only 5 stages are left for consideration, since land preparation, seedling, and planting are no longer included. The average of GHG value in before- stable productivity (1-5 years) is kg-co 2 eq./ton-bdf for oil palm and kg-co 2 eq./ton-bdf for Jatropha curcas, repectively. While GHG value in stable productivity is kg-co 2 eq./ton-bdf for palm oil and kg-co 2 eq./ton-bdf for Jatropha curcas GHG Emission Year of Palm oil Jatropha curcas Fig.6 GHG emission value of oil palm and Jatropha curcas throughout its life cycle (1-25 years)
417 MJ/ton BDF MJ/ton BDF MJ/ton BDF POSTER Energy consumption of fossil fuel at stable production is MJ/ton-BDF-CPO for palm oil and MJ/ton-BDF-CJCO for Jathropa curcas. Fig.7 shows the fossil energy consumption value for palm oil and Jatropha during its life cycle (1-25 years). Fig.8 shows the value of non-renewable energy consumption and Fig.9 shows the value of renewable energy consumption Energy consumption,hhv(fossil fuel) Year of Palm oil Jatropha curcas Fig.7 Fossil energy consumption value before and after stable production for oil palm and Jathropa curcas Energy consumption,hhv(non-renewable fuel) Year of Palm oil Jatropha curcas Fig.8 Value of non-renewable energy consumption before and after stable production for oil palm and Jathropa curcas Energy consumption,hhv(renewable fuel) Year of Palm oil Jatropha curcas Fig.9 Total renewable energy consumption value before and after stable production for oil palm and Jatrophacurcas 401

418 MJ/ton BDF POSTER Fig.10. shows NEB BDF-CPO and BDF-CJCO value throughout its life cycle. NEB value is the result of subtracting output energy values with energy processes. The output energy consists of energy BDF-CPO added with glycerol energy, while the energy process consists of fossil energy added with renewable energy which is calculated from the beginning of the process until the biodiesel is produced in accordance with the limits in this experiment. From the NEB, it can be seen that the value during initial production is still negative, because the production is not as high as the energy process used. The NEB value will become positive as the production increases due to the production energy in the form of produced biodiesel has become higher than the energy process during biodiesel production. The positive value of NEB means that there is energy surplus occurs during the production process which means that it has good sustainability. In this case, based on NEB value, the sustainability of CPO based biodiesel is better than CJCO based biodiesel. Fig.10 NEB of BDF-CPO and BDF-CJCO value throughout its life cycle (1-25 years) The NER value for palm oil and Jatropha i.e and 1.042, respectively. NER value is derived from the value of energy output that consists of energy- BDF-CPO added with glycerol energy and divided with energy input that consists of CPO energy. It turns that NER value appears to have constant value due to increased output value will increase the input value, although the NER value can reach higher value. Fig.11 shows RI value for palm oil and Jathropa curcas. RI is an indicator of renewable energy amount used in the biodiesel production. If RI increases or closes to one mean that more of renewable energy used in this process. In other words, if more fossil energy used in the process means that RI value should be increased to perform environmental friendly of biodiesel production. Fig.11 shows that RI value of Jathropa curcas is higher than the palm oil. This could be caused by lower fossil energy used by Jathropa curcas during its life cycle than the palm oil Renewable Index (RI) Year of Oil palm Jatropha curcas Fig.11 RI values of BDF-CPO and BDF-CJCO throughout its life cycle (1-25 years) 402
419 kg-co2/kg kg-co2/kg kg-co2/kg POSTER Fig.12 and Fig.13 show display greater reduction of CO 2 emission in stable productivity state due to decreasing of energy input and mass which only used in maintenance, fertilizing, and harvesting. The sub-process of land preparation, seedling, and planting are not carried out in this phase. Fig.14 displays combination values of CO 2 emission before and after stable production for crude palm oil (BDF-CPO) and biodiesel fuel from crude Jatropha curcas oil (BDF-CJCO) is 49.27% and 73.06%, respectively CO 2 emissions reduction value of the fossil fuel Before stable productivity % reduction Fuel source % reduction Diesel oil BDF-Palm oil BDF-Jatropha curcas Fig.12 The reduction percentage of CO 2, before-stable productivity (1-5 years) CO 2 emissions reduction value of the fossil fuel After stable productivity % menurun % menurun Fuel source Diesel oil BDF-Palm oil BDF-Jatropha curcas Fig.13 The reduction percentage of CO 2 emission, after-stable productivity CO 2 emissions reduction value of the fossil fuel total productivity % reduction Fuel source % reduction Diesel oil BDF-Palm oil BDF-Jatropha curcas Fig.14 Total reduction percentage of CO 2 emission (before and after stable production) (1-25 years) 403
420 POSTER CONCLUSION Utilization of agrochemical in form of fertilizer and plant protection generate significant contribution to environmental impact of biodiesel production i.e % and 37.56% for oil palm and Jatropha curcas oil, respectively. The GHG emission value before stable productivity is kg-co 2 eq./ton-bdf for palm oil and kg-co 2 eq./ton-bdf for Jatropha curcas. When the productivity has reached stability, the GHG emission value is kg-co 2 eq./ton-bdf for palm oil and kg-co 2 eq./ton-bdf for Jatropha curcas. The calculation on stable productivity is lower than before- stable productivity. The energy input in palm oil is higher than Jathropa curcas as show by higher the NEB which is and for oil palm and jatropha curcas, respectively and by lower the RI value which is and for oil palm and jatropha curcas, respectively. Compared to diesel fuel, CO 2 eq. emission is reduced up to 49.27% and 73.06% for BDF-CPO and BDF-CJCO, respectively. ACKNOWLEDGMENT This research was supported by Directorate General of Higher Education, Ministry of Education and Culture of Indonesia under competitive grant and JSPS-DGHE Bilateral Join Research Project. REFERENCES [1]. Alamsyah AH (2006) Biodiesel from Jatropha curcas oil as an alternative fuel is environmentally friendly. Agromedia Pustaka, Jakarta, Indonesia [2]. Curran MA (1996) Environmental life cycle assessment. McGraw-Hill, New York Ciambrone DF (1997) Environmental life cycle analysis. CRC Press LLC, Florida [3]. Cowell SJ (1999) Use of environmental life cycle assessment to evaluate alternative agricultural production systems. Proceeding 52 nd Plant Protection Conference: New Zealand. Accessed 30 July 2011 [4]. Ferry Y (2009) The cultivation of Jatropha curcas L. Publication unit of Estate Crops Research and Development Centre, Bogor, Indonesia [5]. Gmunder SM, Zah R, Bhatacharjee S, Classen M, Mukherjee P, Widmer R (2009) Life cycle assessment of village electrification based on straight jatropha oil in Chhattisgarh, India. Biomass Bioenerg, 3:1-9. Doi: /j.biombioe [6]. Gomaa M, Alimin AJ, Kamarudin KA (2011) The effect of EGR rates on NO x and smoke emissions of an IDI diesel engine fuelled with jatropha biodiesel blends, Int. J. of Energy and Environ, 2(3): [7]. James AD, Shapouri H, Wang M (2006) Assessment of biofuels. Renewable-based technology : Sustainability assessment. John Wiley & Sons, Ltd. ISBN: [8]. Janaun J, Ellis N (2010) Perspectives on biodiesel as a sustainable fuel. Renewable and Sustainable Energy Reviews, 14 : [9]. Lord S, Clay J (2009) Environmental impacts of oil palm Practical considerations in defining sustainability for impacts on the air, land and water. Island Press, Washington,DC, USA [10]. Lubis RE, Widanarko A (2011) Smart palm oil. Agromedia, Jakarta, Indonesia [11]. Ndong R, Vignoles MM, Girons OS, Gabrielles B, Pirot R, Domergue M, Sablayrolles C (2009) Life cycle assessment of biofuels from Jatropha curcas in West Africa: a field study. GCB Bioenergy. 1: Doi: /j x [12]. Nasir N, Setyaningsih D (2010) Life cycle assessment of biodiesel production from palm oil and jatropha oil in Indonesia. 7th Biomass Asia Workshop, Jakarta, Indonesia, 29 November 01 December 2010 [13]. Omotto AR, Hauschild MZ, Roma WNL (2009) Lifecycle assessment of fuel ethanol from sugarcane in Brazil. Int J Life Cycle Assess, 14: Doi: /s
421 POSTER [14]. Prueksakorn K, Gheewala SH (2006) Energy and greenhouse gas implications of biodiesel production from Jatropha curcas L. The 2nd Joint Intern. Confer. on Sustainable Energy and Environment (SEE 2006), Bangkok, Thailand, November 2006 [15]. Pranowo D (2009) Jatropha cultivation technology. Publication unit of Estate Crops Research and Development Centre, Bogor, Indonesia [16]. Pleanjai S, Gheewala SH, Garivait S (2007) Environmental evaluation of biodiesel production from palm oil in a life cycle perspective. Asian J. Energy Environ, 8 :15-32 [17]. Pahan IA (2011) Complete guide palm-agribusiness management from upstream to downstream. Penebar Swadaya, Jakarta, Indonesia [18]. Pamudita D (2011) Life cycle inventory analysis of postharvest handling and extraction of Jatropha curcas oil, Graduation Thesis, Bogor Agricultural University (in Indonesia) [19]. Pardamean M (2011) Successful open garden of palm oil and palm oil mills. Penebar Swadaya, Jakarta, Indonesia [20]. Pehnelt G, Vietze C (2013) Recalculating GHG emissions saving of palm oil biodiesel. Environ Dev Sustain, 15: Doi: /s z [21]. Searcy C (2000) An Introduction to life cycle assessment. Accessed 30 July 2011 [22]. Suhartanta, Arifin Z (2008) Utilization of Jatropha curcas oil as fuel altermatif diesel engine. Jurnal Penelitian Saintek, 13(1) : (Indonesian journal) [23]. Silip JJ, Tambunan AH, Hambali H, Sutrisno, Surahman M (2010) Lifecycle duration and maturity heterogeneity of Jatropha curcas Linn. Sustainable Development, 3(2) : [24]. Siangjaeo S, Gheewala SH, Unnanon K, Chidthaisong A (2011) Implications of land use change on the life cycle greenhouse gas emissions from palm biodiesel production in Thailand. Energy for Sustainable Develop,15 : 1-7 [25]. Silitonga AS, Atabania AE, Mahliaa TMI, Masjukia HH, Badruddina IA, Mekhilefe S (2011) A review on prospect of Jatropha curcas for biodiesel in Indonesia. Renewable and Sustainable Energy Reviews, 15 : [26]. Sekiguchi T (2012) Possibilities and limitations in disseminating outcomes of technological development to utilize biomass for liquid fuel, Master Thesis, The University of Tokyo (in Japanese) [27]. Siregar K, Tambunan AH, Irwanto AK, Wirawan SS, Araki T (2012) A Comparison of life cycle inventory of pre-harvest, production of crude oil, and biodiesel production on Jatropha curcas and palm oil as a feedstock for biodiesel in Indonesia. Proceeding of Ecobalance 2012 conference,yokohama, Japan November 2012 [28]. Tjahjana BE, Pranowo D (2010) Cultivation and processing of primary Jatropha curcas. Publication unit of Estate Crops Research and Development Centre, Bogor, Indonesia [30]. Tambunan AH, Situmorang JP, Silip JJ, Joelianingsih A, Araki T (2012) Yield and physico chemical properties of mechanically extracted crude Jatropha curcas L oil. Biomass Bioenerg, 43:12-17 [31]. Wirawan SS, Tambunan AH (2006) The current status and prospects of biodiesel development in Indonesia : a review. Presented on the Third Asia Biomass Workshop, Tsukuba, Japan, 16 November 2006 [31]. Wirawan, SS (2009) Potential of Jatropha curcas L. Joint Task 40/ERIA Workshop, Tsukuba, Japan, 28 October 2009 [32]. Wicke B, Sikkema R, Dornburg V, Faaij A (2011) Exploring Land Use Changes and The Role of Palm Oil Production in Indonesia and Malaysia. J Land Use Policy, 28 :
422 POSTER 406
423 POSTER PROTOTYPE REACTOR DESIGN FOR BIODIESEL PRODUCTION BASED COCONUT OIL Nurul Rizki Ramadhan 1, Arief RM Akbar 1, and Susi 1 1 Agroindustrial Technology Department, Agriculture Faculty Lambung Mangkurat University Banjarbaru South Kalimantan ABSTRACT The use of impeller in a biodiesel reactor can accelerate the reaction process and can obtain a high yield, but the exact design of the impeller to produce biodiesel with coconut oil feedstock not yet. This study was examined the design prototype scale biodiesel reactor 10 L with 6 blade impeller to produce a high yield of biodiesel. Prototype design 10 L scale biodiesel reactor using 6 blade turbine impeller can produce coconut oil based biodiesel yield 89.16% on level 3 of the blade where there generating turbulent flow at a speed of 400 rpm with NRe of , NPos at 1.11 and power impeller of 9.17 Watt Keywords : prototype reactor, impeller 6 blade biodiesel, coconut oil, INTRODUCTION Development of biodiesel is currently intensively conducted by various parties, given the high price of oil today. A fundamental problem in the development of biodiesel is how to determine the optimum process in a reactor. The reactor is a vessel that is used in the process of mixing (mixing) using a mixer, which has applied and is required in an industry (Mc Cabe et al., 1993). Mixing in industrial applications generally take place in a stirred tank reactor (STR). STR is a vessel equipped with a stirrer rotating (rotating-shaftmixer), the choice of mixing equipment and vessel geometry must be done properly in order to give good results (Mc Cabe et al., 1993). The use of impeller in a biodiesel reactor can accelerate the reaction process and can obtain a high yield, but the exact design of the impeller to produce biodiesel with coconut oil feedstock has not been obtained to date. It is necessary for the development of a prototype using certain type impeller with a certain speed to increase the reaction rate. Stirrer working largely determined by the type of impeller. In general, the impeller is intended to enhance mixing of the reactor by stirring the liquid in the reactor vessel and causes the resulting gas into the air that fine grains or grain merge even air (Charles, 1978). Impeller has a characteristic shape and power work differently from one another, but in principle have the same function is to generate fluid flow, spreading the gas in the liquid, separating the gas and liquid, and mix all the components of the liquid during the reaction process. The fourth order function can be achieved in the reaction process needs to be designed on the shape, speed and size of the impeller in the reactor through an experiment (Wiseman, 1983). This study was examined the design prototype scale biodiesel reactor 10 L with 6 blade impeller to produce a high yield of biodiesel. 407
424 POSTER METHODOLOGY 1. Materials and Equipment Materials used in this study is coconut oil, methanol technical, technical KOH (Brataco), H 2 SO 4. The tools used in this study were stainless steel, electric motor modification (Thors / code EL7 / Model 7245/350 rpm / 220 volts), bench drilling machine (West Lake / ZHX-13 / REG No ), chakra, nuts 12 mm, 12 mm bolts, V-belt 2. Methods Coconut oil samples taken from domestic industry in Pingaran Ulu subdistrict Astambul, Banjar District. Esterification and transesterification process of oil is done with a variety of impeller speeds of 200, 300 and 400 rpm on a scale prototype reactor 10 L. In the esterification reaction, coconut oil has been known to value his FFA reacted with a mixture of methanol and H 2 SO 4 as catalyst (225% methanol and 5% H 2 SO 4 of% FFA). Esterification reaction carried out for 1 hour at a temperature of C with a stirrer speed variation of rpm. Then performed the settling (sedimentation) for 24 hours to separate mixtures of fatty acid esters and triglycerides of residual methanol. The second stage is the process by heating ester transesterification of fatty acids and triglycerides to a temperature of 60 ⁰ C and then added to a solution of methoxide (methanol 15% v / v, KOH 1% w / v) with stirring for 1 h. After 1 hour, transferred to and deposited in a settling tank for 24 hours to separate the glycerol, washing, and drying. 3. Design of experiments This study was conducted using a completely randomized design (CRD) factorial with 1 factor is the speed of the turbine impeller 6 blade 3 high levels with a variety of speeds of 200, 300 and 400 rpm. The experiments were performed 3 repetitions. Data were analyzed using ANOVA, to determine the differences between treatments performed according to Duncan's Multiple Range Test at the 5%. Prototype Reactor Design Table 1. Dimension scale of prototype reactor. No. Dimension Unit Value 1. Reactor volume ml Reactor high cm Diameter of impeller cm 12,6 4. High of impeller blade cm 2,52 5. Width of impeller blade cm 3,15 6. The distance between the mid-blade impeller cm 2,52 Table 2. Disc of reactor No. Engine speed Diameter Diameter disc of Impeller speed of disc impeller rpm 8 cm 200 rpm 14 cm rpm 8 cm 300 rpm 9.33 cm rpm 8 cm 400 rpm 7 cm 408

425 POSTER Design of the reactor used in this study are presented in Figure 1. Figure 1. 2-dimensional prototype reactor design (a) and 3 dimensional (b). 1. The First Phase research RESULT AND DISCUSSION The first phase of this research was conducted using three variations of the impeller with the impeller blade level 1, level 2 and level 3 blade blade with an average speed of 300 rpm. Yield of the results of this study are presented in Table 3 Table 3. Yield results of the phase I No. Level Impeller Variety Yield (%)* rpm 83,06 a rpm 84,20 a rpm 86,46 b * The same letter indicates no different Based on the results of analysis of variance (α = 5%) showed that the treatment number of impeller significantly affected the biodiesel yield. difference test DMRT,treatment of impeller level showed biodiesel yield with 1 degree of impeller blades (83.06%) did not differ of impeller blades with 2 levels (84.20%), while different for the impeller with 3 blade level (86.46%). According to Mc Cabe et al. (1993) use of impeller type of turbine 6 blade produces a radial flow pattern perpendicular (perpendicular) to the tank wall. The flow pattern evokes the flow is parallel to the axis of the stirrer shaft. This pattern gives a very active flow required for mixing. The radial flow will be split to form a separate pattern. One part flows down along the wall and back to the bottom center of the mixer, while another part flows upward toward the surface and back to the mixer from the top. This suggests that differences in the type of impeller will result in different flow patterns that affect the homogeneity of the mixture, temperature homogeneity and mass transfer in the reactor. Thus, the results of the first phase of research at a speed of 300 rpm with the highest yield produced by type impeller with blades 3 level that is equal to 86.46%. 2. The Second phase research The second phase of this research was conducted with the type of impeller blades with 3 levels with a variety of average speed of 200, 300 and 400 rpm. Yield resulting from the difference in the speed of the results of this study are presented in Table 4. Table 4. Yield Results second phase 409
426 POSTER No. Impeller Speed Yield (%)* rpm 85,46 a rpm 86,46 b rpm 89,16 c * The same letter indicates no different Based on the results of analysis of variance (α = 5%) shows that the variation of the speed of treatment significant effect on the yield of biodiesel. The difference test of DMRT showed that the yield rate variation resulting from a speed of 200 rpm (85.46%) in contrast to a speed of 300 rpm (86.46%), and a speed of 400 rpm (89.16%). Variations of this speed can also lead to different flow patterns and affect the homogeneity of the mixture, so that also affect the homogeneity of temperature and mass transfer in the reactor. Will accelerate the speed of the reaction between coconut oil to produce methyl esters assisted by methanol and KOH catalyst. Stirring speed will affect the speed of the particle by accelerating the deployment of turbulence flow, so that the particles move quickly dispersing into other particles so as to create a homogeneous state (Mc Cabe et al., 1993). Given the faster speed, the higher the yield that will be generated in this study. The research of the type of impeller 3 levels with a variety of speeds of 200, 300 and 400 rpm can be calculated power (P), current (I), Power Number (NPo) and Reynold's Number (NRe) in the process of esterification and transesterification. Esterification reactor calculation process is presented in Table 5 and the transesterification process in Table 6. Table 5. Calculation results reactor in esterification process No. Calculation Impeller speed 200 rpm 300 rpm 400 rpm 1. NRe 11564, , ,51 2. NPo 1,44 1,26 1,16 3. P (Watt) 1,64 4,68 10,55 Table 6. Calculation results reactor in transesterification process No. Calculation Impeller speed 200 rpm 300 rpm 400 rpm 1. NRe 18476, , ,01 2. NPo 1,30 1,22 1,11 3. P (Watt) 1,34 4,27 9,17 3. Reynold s Number (NRe) Reynold s Number (NRe) indicates the type of flow in a fluid caused by the impeller rotation. NRe obtained from the formulation of the impeller diameter calculation, stirring speed, density and viscosity. Relationship Reynold's Number and speed (rpm) are presented in Figure
427 Power Number (NPo) Reynold's Number (NRe) POSTER esterifikasi esterification transesterifikasi transesterification Impeller speed (rpm) Figure 2. Relationship Reynold s Number (NRe) and impeller speed. It can be seen that the process of esterification and transesterification NRe values increased along with greater speed provided. The greater the stirrer speed the greater the resulting turbulence indicated by values greater NRe. This prompted the particles dispersed in all directions in the reactor to immediately mixed, with the maximum yield of the mixture produced will be maximal. NRe value of the results to see what kind of flow is formed. Judging from the speed of the flow can be considered laminar if the flow of NRe has a value less than For the transition flow is the value of NRe or often referred to as the critical value of NRe. Whereas turbulent flow over NRe has a value of Seen from the calculations that have been done, it can be seen that the second type of flow in this process is turbulent, due to the esterification process NRe values on each of the various speed ranges from 8, to 17,000.22, and the transesterification process ranged from 13, to 22, Power Number (NPo) Power Number (NPo) is used to calculate the required power or force. NPo formulations obtained from the calculation of NRe and Froud Number (NFr). Power relations Number and speed (rpm) are presented in Figure impeller speed (rpm) esterifikasi transesterifikasi Figure 3. Relationship Power Number (NPo) and impeller speed 411
428 Power (Watt) POSTER In the esterification process to Number Power generated at a speed of 200 rpm at 1.44, at a speed of 300 rpm at a speed of 1.26 and 1.16 at 400 rpm. While in the process of transesterification Power generated at a speed of 200 rpm Number of 1.30, at a speed of 300 rpm at 1.22, and at a speed of 400 rpm at From these results it can be seen that the higher the speed the lower the given Number Power is also generated from the process. 5. Power (P) Impeller Power (P) is the rate of energy delivered or work done per unit time. Power is obtained from the calculation formulation NPo, stirring speed, impeller diameter and density. Relations of power and speed (rpm) are presented in Figure esterifikasi transesterifikasi impeller speed (rpm) Figure 4. Relationship Power (P) and impeller speed In the esterification process for the power required at a speed of 200 rpm by 1.64 Watt, at a speed of 300 rpm at 4.68 Watt and at a speed of 400 rpm at Watt. While in the process of transesterification takes power at a speed of 200 rpm by 1.34 Watt, at a speed of 300 rpm at 4.27 Watt, and at a speed of 400 rpm at 9.17 Watt. From these results indicate that the stirring speed proportional to the power generated, where the faster mixing, the greater the value of the power generated. Affect the rotation speed of the stirrer stirring, this happens because the speed of the stirrer which requires large power consumption as well. Power on the transesterification process tends to be lower than the esterification process due to the influence of density, when the density is lower then the required power will also be low. The power requirement calculations have a common geometric boundary conditions which determine the equipment, tools and means to form geometrical sizes of all its components must be equal. And also the dynamical similarity and kinematic similarity, ie there is a similarity value between the forces acting on a position (viscosity force against the force of gravity, inertial force to the viscosity force, etc). Two geometrically similar systems can be said to be dynamically similar if the ratio of the forces acting on the same system. Whereas the kinematic similarity occurs if the velocity at the corresponding point has the same ratio (Coulson, et al., 1989). 412
429 POSTER CONCLUSION Prototype design 10 L scale biodiesel reactor using 6 blade turbine impeller can produce coconut oil based biodiesel yield 89.16% on level 3 of the blade where there generating turbulent flow at a speed of 400 rpm with NRe of , NPos at 1.11 and power impeller of 9.17 Watt REFERENCE [1]. Charles, M Development and Efficiency of a New Generation of Bioreactors. Bioprocess Engineering 2. [2]. Coulson, J.M dan Richardson, J.F Chemical Engineering Volume 6, An Introduction to Chemical Engineering Design. Pergamon Press. New York. [3]. Mc Cabe, W.L., Smith, J.C., dan Harriot, P Unit Operations of Chemical Engineering, 5 th Edition. Mc Graw-Hill, Inc. New York [4]. Wiseman, A Principles of Biotechnology. Surrey University Press. New York. 413
430 POSTER 414
431 POSTER RESPONSE SURFACE METHODOLOGY FOR REGENERATION OF LITHIUM BROMIDA IN ABSORPTION REFRIGERATION SYSTEM USING VACUUM MEMBRANE DISTILLATIONS Bayu Rudiyanto 1, Tsair-Wang Chung 2, and Armansyah H. Tambunan* 3 1 Graduate School in Agricultural Engineering, Bogor Agricultural University (IPB), Indonesia. 2 Chemical Engineering/R&D Center of Membrane Technology, Chung Yuan Christian University, Chungli, Taoyuan 320, Taiwan. * 3 Departement of Mechanical and Biosystem Engineering, Faculty of Agricultural Engineering and Technology, Bogor Agricultural University (IPB), Indonesia. ahtambun@yahoo.co.id ABSTRACT Response surface methodology (RSM) has been applied for modeling and optimization in utilization of vacuum membrane distillation on Lithium Bromide-water absorption refrigeration system (ARS). The effect of the operational parameter is initial feed concentration, feed inlet temperature, feed flow rate and interaction on the permeate flux. The developed model has been statistically validated by analysis of variance (ANOVA) and further used to predict the permeate flux. The results for the given factors is a saddle point one, which meant for the range given, there is no optimal value. This saddle point parameter is outside the data range which is concentration of %, feed temperature at C and flow rate L.min -1 while its predicted flux value is g.m -2.s -1. ` Keywords: Response surface methodology; lithium bromide-water; vacuum membrane distillation, optimization. INTRODUCTION Absorption cooling system was developed in 1850s by Ferdinand Care and became the primary cooling system at that time before the invention of vapor compression refrigeration machine in As a power resource, absorption refrigeration system uses thermal energy to produce cooling cycle mechanism not compressor which used in vapor compression refrigeration system. The effect is Coefficient of Performance (COP) product is lower but the system has several advantages i.e. provide more secure environmental effects. It also requires lower energy consumption compared with the other [1], [2].There are several heat energy resources such as energy exhaust from machinery or plant, solar energy, geothermal energy and energy produced from agricultural waste [3]. But not all temperature generated is able for regeneration process in cooling mechanism. Regeneration is one of the main processes in the mechanism where generator absorbs heat to separate water from the solution of LiBr-H 2 O in high temperature. This requirement of high temperature is the constraint on separation process. [1] stated that generator on absorption system using LiBr-H 2 O which operates at below 80 C will produce low COP. Meanwhile, according to [4], the use of generator in lithium bromide absorption refrigeration system which operates at C will produce average COP at Increasing COP number was also conducted by [4] by adding steam compressor which placed between generator and condensor. Steam compressor reduced vapor pressure when temperature getting lower and resulted COP at Based on several studies above, it is necessary to develop alternative processes to improve high temperature requirement in generator to separate LiBr-H 2 O solution. Moreover, the large contact area was needed to separate water vapor from aqueous lithium bromide solution which makes traditional generator bulky and heavy to be fitted into small scale device [6]. The membrane distillation (MD) is a process for vapor extraction from aqueous solution at temperature which may be much lower than the boiling point of the solution [7-12]. Vacuum membrane distillation (VMD) is another variant of MD. In this configuration low pressure or vacuum is applied on the 415
![POSTER permeate side of the membrane module by means of vacuum pumps [13-16].](/docs-images/73/68916181/images/432-0.jpg "The applied permeate pressure is lower than the saturation pressure of volatile molecules to be separated from the feed solution and condensation takes place outside the membrane module at")
432 POSTER permeate side of the membrane module by means of vacuum pumps [13-16]. The applied permeate pressure is lower than the saturation pressure of volatile molecules to be separated from the feed solution and condensation takes place outside the membrane module at temperatures much lower than the ambient temperature. The development of membranes used in the absorption cooling system still focuses on the selection of membrane types. [3] performed separation of LiBr-H 2 O solution using vacuum membrane distillation with polyvinylidene fluoride (PVDF) to overcome the requirement of high regeneration temperature which resulted in lower temperature up to 67 C. Using VMD in absorption refrigeration system ARS will cause several problems, including the achievement of optimal conditions to operate. The influential parameter in this process which were temperature, pressure, flow rate and concentration of the solution. Thus, to identify the optimal parameter VMD application on absorption refrigeration system, it is necessary to use statistical study. The purpose of this study was to determine the important parameters in the process of separationaqueous LiBr. METHODOLOGY The experimental device was showed in Fig 1. The central part is a commercial shell-and-lumen membrane module UMP-0047R, supplied by Mycroza is trademark of Asahi Kasei Corporation. Basically, it consists of a set of equal polyvinylidene fluoride (PVDF) porous hydrophobic capillaries, assembled and made into a shell-and-lumen module. Hot feed of aqueous lithium bromide solution flows into the lumen side while the shell chamber is keeping in a vacuum state by cooling water or by vacuum pump. Fig 2 (a and b), shows the hollow fiber membrane module, in which twenty one of PVDF capillaries are assembled in plastic body and sealed securely to both ends. The principal characteristics of the hollow fiber membrane, as specified by the manufacturer, are showed in Table 1 and Table2. 416

433 POSTER The temperature and pressure of the liquid feed were measured at the inlet and outlet of the membrane module. The temperature and pressure were measured continuously, in steady state. The temperature of the hot feed was measured at the inlet and outlet of the membrane module, while the temperature of water vapor was measured at the outlet of the permeation side. The temperatures was measured with thermocouple which connected to a digital multi-meter, with an accuracy ± 0.1 C and the pressure was measured with pressure control type GP-D-0040GAPX, with an accuracy of
434 POSTER bar. The feed inlet temperature was controlled by a thermostat Water Bath G-20 DENG YNG, with a temperature fluctuation of less than ±0.1 C. The liquid feed was circulated with a circulation pump FLOJET MOD: and the feed flow was measured with a flowmeter HJ D-S, with precision ±2%. The volume of solution in water bath was determined in the beginning of experiment. A water circulating vacuum pump GAST Model DAA-V503-EB) with a pressure adjuster was connected to the permeation side of the membrane module to produce the vacuum condition before the test began, and then the vacuum pressure would maintain constant at the condensing temperature of cooling water during the test. A glass cold trap by cooling water was connected to the permeation side to recover the water vapor. The flux of distilled water was calculated, in every case, by measuring of the permeate flux every ten minutes, during two hours, and by measuring the concentration before and after the process of using refractometer index (RI). Permeation flux means the quality of permeation water per unit area in an hour. The permeation flux is described as followed : (1) Where J is the permeation flux, (kg.m -2 h -1 ); W is the quantity of water, kg; S is the membrane area, m 2 ; and t is the time, h. The operating parameter region of solution concentration, temperature and flow rate was showed in Table 3. Volume of the aqueous lithium bromide solution used in the experiment was 5 liter, but effective internal membrane area of hollow fiber module was only 0.02 m 2. Table 3 shows the operating region and the levels of the variables in actual and coded values. The measured VMD distillate fluxes, the responses and the standard deviations are also presented in table 4. The experimental design and analysis of data were done by using a commercial statistical package, JMP software version 7. By using the software, a Box Behnken design with 3 center points was employed with three factors and three levels. This design is not randomized. The Box Behnken design contains of 15 experiments with three center points. RESULT AND DISCUSSION The response surface model (RS-model) with interaction terms was developed for the VMD distillate flux using eq 2 and the experimental data was summarized in the table 4. Where y is the predicted response, x i is the coded variables, and b 0, b i, b ii, b ij are the regression coefficient. The values of the regression coefficients were determined using the ordinary least square method written as follows [17] : (2) 418
435 POSTER Where b is a column vector of the regression coefficients, x is the design matrix of the coded levelsof the input variables and y is column vector of the response. (3) The obtained RS-model is written in eq 4, as a function of the coded variables and permits to predict the distillate flux,j w ( in kg/m 2.s), as follows : It should be pointed out that the RS-model includes only the significant term. The significance of the regression coefficients was given in eq 4. Fig 3, gives the plot of experimental and predicted value. Moreover, the statistical validation of the RS-model was performed by means of analysis of variance (ANOVA). The results were presented in Table 5. (4) 419


436 POSTER The mathematical equation used to calculate the ANOVA estimators (i.e. SS, MS, F-value, R 2, R 2 adj) are detailed elsewhere. As can be seen in Table 5, the F-value is high, P- value smaller than and R 2 value is about in agreement with the adjusted coefficient of determination R 2 adj. These indicate that the RS-model eq 4, is statically valid and can be used for prediction of the VMD distillate flux. The significance of the regression coefficient of the models written as function of the coded variables could be tested with statistical Student t test. Table 6 shows the t test result for the experiment. From the test results, it shows that the feed initial temperature (x 2 ), concentration (x 1 ) and flow rate (x 3 ) are significance. Furthermore, its interaction effect with the feed initial concentration and temperature, concentration and feed flow, temperature and feed flow are still significant. The response surface for the given factors and response is a saddle point one, which meant for the range given, there is no optimal value. This saddle point parameter is outside the data range which set is concentration of %, feed temperature at C and flow rate L.min -1 while its predicted value is g.m -2 s -1. To have a more understanding on the effect of each parameter and their interaction, a prediction profiler of the experiment is show at Fig 4. As can be seen, the feed inlet temperature shows an obvious increasing curvature since its significance. The initial feed concentration show a slight decreasing curvature which shows its effect on the response. The feed flow shows a slight increasing curvature which shows its effect on the response. 420
 and initial feed concentration (x 1 ) on the permeate flux.")


437 POSTER The effect of the VMD operating parameters on the distillate flux are plotted in Fig 5-7 in 3-D and 2-D contour plots. For example, Fig 5, shows the effect of the feed inlet temperature (x 2 ) and initial feed concentration (x 1 ) on the permeate flux. As can be seen, the increase of initial feed concentration will leads to a decrease of the permeate flux while the increment of feed inlet temperature will leads to an increase of the response. At high concentration, the effect of temperature is stronger than at low concentration. For example, at concentration between 45%-50%, at temperature of 60 C and feed flow 1.5 L.min -1 will produce permeate flux from g.m -2.s -1 to g.m -2.s -1. In contrast, at concentration 45 % and temperature between 60 C-80 C will produce permeate flux from g.m -2.s -1 to g.m -2.s -1.The graph also confirms the strong effect of the feed inlet temperature over the initial feed concentration. 421
 is greater than the main effect of concentration (x 1 ) %. The increase of both variable leads to the enhancement of Y.")
438 POSTER Fig 6, shows the effect of flow rate (x 3 ) (L.min -1 ) and concentration (x 3 ) (%) on the response Y. The main effect of flow rate (x 3 ) (L.min -1 ) is greater than the main effect of concentration (x 1 ) %. The increase of both variable leads to the enhancement of Y. As it is mentioned before, due to the quadratic effect of x 1, the response Y increases up to a maximum and then decreases for high x 1 values. Interaction effect x 3 and x 1 on the response Y is significant, although these interactions give negative values. Fig 7, shows a strong main effect of temperature (x 2 ) ( C) on the response Y. The increment of this variable conducts to an increase of Y and the main effect of flow rate (x 3 ) (L.min -1 ) is smaller compared to the main effect of temperature. However, the quadratic effect of x 2 is greater than the quadratic effect of x 3, and the interaction effect between temperature and flow rate is significant and gives a positive value. CONCLUSIONS Design of experiments and response surface methodology (RSM) were applied for desalination by VMD. According to the predictions of the performance index the highest positive effect was attributed to the feed inlet temperature. The feed flow rate had small positive and the concentration had negative effect, i.e. the increase of this factor led to a gradual reduction of the permeate flux. All factors have quadratic effects and a small interaction effect on the specific performance index was detected between concentration versus flow rate, and concentration versus temperature. ACKNOWLEDGMENTS This project is support by Departement of Chemical Engineering, Chung Yuan Christian University, Taiwan and Heat and Mass Transfer Laboratory, Department of Mechanical and Biosystem Engineering, Bogor Agricultural University, Indonesia NOMENCLATURE DF degree of freedom F -value ratio of variances (ANOVA test) i and j subscripts (integer variables) J w permeate flux MS mean square (ANOVA test) P -value probability in statistical significance testing (ANOVA test) R 2 coefficient of multiple determination R 2 adj adjusted statistic coefficient SS sum of squares (ANOVA test) x1, x2, x3 coded levels of variables (factors) 422
439 POSTER Y performance index * superscript indicating optimal values of variables REFERENCES [1]. Vargas, J.V.C., Ordonez, J.C., Dilay, E. and Parise, J.A.R.; Modeling, simulation and optimization of a solar collector driven water heating and absorption cooling plant, Sol. Energy, 83 (8), (2009) [2]. Satha, A. and Thanarath, S.; Experimental studies of single effect absorption refrigerator using aqueous lithium-bromide: Effect of operating condition to system performance, Exp. Therm. Fluid Sc.i, 32, (2007) [3]. Wang, Z.S., Ghu, Z., Feng, S. and Yun, L.; Application of vacuum membrane distillation to lithium bromide absorption refrigeration system, Int. J. Refrig., 32, (2009) [4]. Gu, Y.X., Wu, Y.Y. and Ke, X.; Experimental research on second generator in pump-free lithium bromide absorption chiller system. Journal of Xi an Jiaotong University, 01,67-73 (2006) [5]. Wu, J.F.,Chen, Y.P., and Shi, M.H.; Promotion of compressor assisted LiBr absorption chilling cycle driven by solar energy, J. Eng. Thermophys., 01, (2007) [6]. Kim, Y.J., Joshi, Y.K. and Fedorov, A.G.; An absorption based miniatur heat pump system electronic cooling, Int. J. Refrig., 31, (2008) [7]. El-Amali, A., Bouguecha S. and Maalej M.; Experimental study of air gap and direct contact membrane distillation configurations: application to geothermal and seawater desalination, Desalination, 168, (2004) [8]. Khayet, M. and Cojocaru, C.; Air gap membrane distillation: Desalination, modeling and optimization, Desalination, 287, (2012) [9]. Khayet, M., Cojocaru, C. and Baroudi, A.; "Modeling and optimization of sweeping gas, Desalination, 287, (2012) [10]. Khayet, M. and Mengual, J.I.; Effect of salt concentration during the treatment of humid acid solutions by membrane distillation, Desalination, 168, (2004) [11]. Sudoh, M., Takuwa, K. and Iizuka H.; Nagamatsuya K. Effect of thermal and concentration boundary layers on vapor permeation in membrane distillation of aqueous-lithium bromide solution, J. Membrane Sci., 131, 1-7 (1997) [12]. Abdullah, A., Naif D. and Nidal H.; Membrane distillation: A comprehensive review, Desalination, 287, 2 18 (2012) [13]. El-Bourawi, M.S., Khayet, M., Maa R., Ding, Z., Li Z. and Zhang X.; Application of vacuum membrane distillation for ammonia removal, J. Membrane Sci., 301, (2007) [14]. Toraj, M. and Mohammad, A.S.; Application of taguchi method in optimization of desalination by vacuum membrane distillation Desalination 249, (2009) [15]. Fawzi, B., Fahmi A.A. and Khalid B.M.; Desalination by vacuum membrane distillation: sensitivity analysis Sep. Purif. Technol., (2003) [16]. Mengual, J.I., Khayet M. and Godino M.P.; Heat and mass transfer in vacuum membrane distillation, Int. Jur. Heat and Mass Transfer, 47, (2004) [17]. Myers, R.H. and Montgomery, D.C.; Response Surface Methodology: Process and Product Optimization Using Designed Experiments. JohnWiley & Sons
440 POSTER 424
441 POSTER BIODIESEL PRODUCTION BASED COCONUT OIL BY ESTERIFICATION AND TRANSESTERIFICATION PROCESS Nurul Rizki Ramadhan 1, Arief RM Akbar 2, and Susi 3 Agroindustrial Technology Department, Agriculture Faculty Lambung Mangkurat University Banjarbaru South Kalimantan ABSTRACT Biodiesel is made from vegetable oils derived from renewable resources. Of some raw materials are located in Indonesia, which has the prospects to biodiesel is coconut oil. Cocodiesel is one of the downstream industry that has considerable potential for development in the oil producing region. In addition to increasing the income of coconut farmers, cocodiesel development is also very useful to overcome fossil fuel reserves are depleting and can lower the retail price of fuel in remote areas. The reactor used in the prototype 10 Litre scale using turbine impeller 6 blade with some speed variations. This study aimed to assess the effect of turbine impeller 6 blade speed against quality biodiesel that includes yield, viscosity, density and free fatty acids. Biodiesel production using prototype reactor with 10 L scale and turbin impeller 6 blade with 3 level blades produces the maximum yield at a speed of 400 rpm is equal to 89.16% with the quality of biodiesel include density of 0.89 g / cm 3, viscosity of N s / m 2, and free fatty acid of 3.87%. Keywords : biodiesel, coconut oil, esterification, transesterification, impeller 6 blade INTRODUCTION Indonesia is one of the petroleum producing countries in the world but is still importing fuel to fulfill the need of fuel oil in the transport and energy sectors. In the long term fuel imports will increasingly dominate the national energy supply if there is no government policy to implement the diversification of energy by utilizing renewable energy and others (Hardiwijiardjo, 1997). As one of the alternative fuels that are environmentally friendly, biodiesel can be used as fuel in motor vehicles can reduce emissions when compared to petroleum diesel. Biodiesel is made from vegetable oils derived from renewable resources. Some raw materials for biodiesel production such as oil palm, coconut, soybean, sunflower, jatropha, and some other plant species. Of some raw materials are located in Indonesia, which has the prospects to biodiesel is coconut oil (Prihandana et al., 2006). One effort to improve productivity resulted in increased revenue coconut farmers are developing biodiesel from palm oil. Biodiesel from coconut oil called cocodiesel. Cocodiesel is one of the downstream industry that has considerable potential for development in the oil producing region. In addition to increasing the income of coconut farmers, cocodiesel development is also very useful to overcome fossil fuel reserves are depleting and can lower the retail price of fuel in remote areas (BBKK, 2006). In South Kalimantan, coconut oil is a by product from the manufacture of complementary seasonings consume jengkol called "tai lala" or blondo. One side of course the quality of the oil is not too concerned in the production process and the use of coconut oil as cooking oil is still limited. It is therefore important to assess the utilization of palm oil as biodiesel to increase value-added products Coconut oil is obtained from the extraction process is generally wet, where coconut milk cooked at high temperatures to get the "tai lala" and oil. This affects the value of free fatty acids of coconut oil is quite high (> 2%) so that the review process is done in 2 stages namely esterification and transesterification to convert free fatty acids and triglycerides into methyl esters. 425
442 POSTER A fundamental problem in the development of biodiesel is how to determine the optimal production process, one of which is the impeller speed. The reactor used in the prototype 10 Litre scale using turbine impeller 6 blade with some speed variations. This study aimed to assess the effect of turbine impeller 6 blade speed against quality biodiesel that includes yield, viscosity, density and free fatty acids. Material and Equipments METHODOLOGY Materials used in this study is coconut oil, methanol technical, KOH technical (Brataco), H 2 SO 4, phenolphtalein indicator (pp), 0.5 N HCl, glacial acetic acid, chloroform, sodium thiosulfate standard solution of 0.02 N. The Equipments used in this study were stainless steel, electric motor modification (Thors / code EL7 / Model 7245/350 rpm / 220 volts), bench drilling machine (West Lake / ZHX-13 / REG No ), chakra, nuts 12 mm, 12 mm bolts, V-belt, erlenmeyer, oven, desiccator, Pycnometer, and viscometer Otswald Methods Coconut oil samples taken from domestic industry in Pingaran Ulu subdistrict Astambul, Banjar District. Samples taken later performed chemical analysis includes the analysis of the value of FFA, moisture content, iodine number, saponification number, peroxide, ester content, density and viscosity. Esterification and transesterification process of oil is done with a variety of impeller speeds of 200, 300 and 400 rpm on a scale prototype reactor 10 L. In the esterification reaction, coconut oil has been known to value his FFA reacted with a mixture of methanol and H 2 SO 4 as catalyst (225% methanol and 5% H 2 SO 4 of% FFA). Esterification reaction carried out for 1 hour at a temperature of C with a stirrer speed variation of rpm. Then performed the settling (sedimentation) for 24 hours to separate mixtures of fatty acid esters and triglycerides of residual methanol. The second stage is the process by heating ester transesterification of fatty acids and triglycerides to a temperature of 60 ⁰ C and then added to a solution of methoxide (methanol 15% v / v, KOH 1% w / v) with stirring for 1 h. After 1 hour, transferred to and deposited in a settling tank for 24 hours to separate the glycerol, washing, and drying. Design of experiments This study was conducted using a completely randomized design (CRD) factorial with 1 factor is the speed of the turbine impeller 6 blade 3 high levels with a variety of speeds of 200, 300 and 400 rpm. The experiments were performed 3 repetitions. Data were analyzed using ANOVA, to determine the differences between treatments performed according to Duncan's Multiple Range Test at the 5%. Characteristics of Coconut Oil RESULTS AND DISCUSSION Coconut oil is used in this study analyzed the physicochemical properties of coconut oil to determine the initial data are the raw materials used. This data is used as reference for the process to be carried out. Parameters analyzed include free fatty acids (FFA), moisture content, iodine number, saponification number, peroxide, ester content, density and viscosity. Results of analysis of coconut oil and palm oil standard comparison is presented in Table
443 POSTER Table 1 The Results of analysis and coconut oil quality standards No. Parameter uji Unit Results of analysis Standards * 1. Free Fatty Acid (FFA) % 13, Moisture content % 3,21 0,5 3. Iodine number g iod/ 100 g 2, Saponification number mg KOH/ g 223, Peroxide number mg/ g 42, Ester % 99,24-7. Density g/m 3 0,89-8. Viskosity (40 o C) N s/ m 2 12,69 - * Standardization of the Dewan Standarisasi Nasional (1992). From Table 1 it can be seen that the value of FFA feedstock oil used by 13.40%. FFA values of coconut oil is too high caused by extraction process is still done traditionally, by changing into coconut milk. In the absence of the standard for the amount of water supplied, the water content of the resulting oil was high. High moisture content will cause accelerated hydrolysis by hot upon heating to produce oil. According Gerpen et al. (2004) and Sanford et al. (2009) the influence of free fatty acid in methyl ester production process which leads to deactivation of the catalyst, free fatty acids react with sodium methoxide to form soap. Reduced activity of alkaline catalyst that would interfere with the conversion of oil to methyl ester. Catalysts that have become soap unable to accelerate the transesterification reaction (Gerpen 2004). Based on the test results of water content in coconut oil is 3.21%, this value is greater than the 0.5%. The condition of the water content in the oil is very high will result in fat hydrolysis, where hydrolysis of this oil will increase the levels of free fatty acids (Buckle et al., 1997). Heating process is carried out is not enough to evaporate the water content in oil up to the standard 0.5% According Gerpen et al. (2004) the water content in the raw material is still tolerated up to 1%. Water is able to hydrolyze triglycerides into diglycerides and free fatty acids are formed finally. Free fatty acid will react with a base catalyst to form soap. Similarly, water can react with the catalyst during the transesterification process to form soap and emulsion, thereby decreasing perfection transesterification reaction and cause the formation of excess soap. Soaps of saturated fatty acids tend to form gels at room temperature so that the separation is hard. Based on the test results on oil iodine number obtained yield was 2.54 g iodine / 100 g, this value is far below the standards ranged from 8-10 g iodine / 100 g. Iodine number indicates the level of unsaturation or number of double bonds in a material. A change in the value of iodine number indicates the change of the double bond. Number of double bonds decreases due to oil oxidation by oxygen and enlarged during the heating process. The large amount of iodine absorbed indicates the number of double bonds or unsaturated (Buckle et al., 1997). Based on the test results on oil saponification number obtained yield was mg KOH / g, this value is far below the standard that exceeds the range mg KOH / g. Saponification number is the number of milligrams of KOH needed to saponification one gram of fat or oil. Saponification number indicates the molecular weight of fat and oil. Oil are composed by a short carbon chain means having a relatively small molecular weight, will have a great saponification numbers and if the oil has a large molecular weight, the saponification number is relatively small (Buckle et al., 1997). Based on the test results on oil peroxide obtained yield was 42 mg / g, this value is far beyond the standard 5 mg / g. Peroxide is an index of the amount of fat or oil that has undergone oxidation. Peroxide value is very important to identify the level of oxidation of the oil. Exposure to oxygen, light, and high temperatures are some of the factors that affect the oxidation. The use of high temperature during the extraction process caused of oil oxidation. 427
444 POSTER Based on the results of assays on the ester oil obtained yield was 99.24%, ester levels also indicate the number of pure ester in oil. For the density of the oil obtained results of 0.89 g / cm 3, the density showed a weight ratio of coconut oil at a certain temperature to water at the same volume and temperature. Whereas the viscosity of the oil N s / m 2, the viscosity is held prisoner fluid flow within the capillary to gravitational forces. Characteristics of Coconut Oil-Based Biodiesel Esterification and transesterification process carried out against palm oil is expected to meet the established standards. The characteristics of biodiesel parameters measured include yiel, density, viscosity and FFA. Yield This research was conducted with the type of impeller blades with 3 levels with a variety of average speed of 200, 300 and 400 rpm. Based on the results of analysis of variance (α = 5%) shows that the variation of the speed of treatment significant effect on the yield of biodiesel. The difference test of DMRT showed that the yield rate variation resulting from a speed of 200 rpm (85.46%) in contrast to a speed of 300 rpm (86.46%), and a speed of 400 rpm (89.16%). Variations of this speed can also lead to different flow patterns and affect the homogeneity of the mixture, so that also affect the homogeneity of temperature and mass transfer in the reactor. Will accelerate the speed of the reaction between coconut oil to produce methyl esters assisted by methanol and KOH catalyst. Stirring speed will affect the speed of the particle by accelerating the deployment of turbulence flow, so that the particles move quickly dispersing into other particles so as to create a homogeneous state (McCabe, 2003) Density Density is a number that states the weight ratio of fuel oil at a certain temperature of the water at the same volume and temperature. Biodiesel density analysis results with speed variation and 400 rpm are presented in Table 2. Table 2. Density analysis of coconut oil-based biodiesel No. Impeller speed (rpm) Density (g/ cm 3 )* Esterification Transesterification ,967 a 0,877 a ,969 b 0,878 b ,970 c 0,879 c * The same letter indicates no different Based on the results of tests performed on the density of each of speed variation in the process of esterification decreased towards the transesterification process. Based on the results of analysis of variance (α = 5%) showed speed variation significant effect on the density in the esterification and transesterification process. The real difference test of DMRT indicate that the yield biodiesel in different speed of 200 rpm, 300 rpm, and 400 rpm are different either esterification and transesterfication process. Variations of this speed can also lead to different flow patterns and affect the homogeneity of the mixture, so that also affect the homogeneity of temperature and mass transfer in the reactor, will accelerate the speed of the reaction between coconut oil to produce methyl esters assisted by methanol and H 2 SO 4 or KOH catalyst. Viscosity Viscosity is the resistance of a fluid held within the capillary flow against the force of gravity. Fuel atomization is highly dependent on the viscosity, injection pressure, and the size of the hole injector. Higher viscosity would make atomized fuel into larger droplets with high momentum and has a tendency to collide with the cylinder wall relatively cool. This causes the flame outages and increased deposits, penetration of fuel spray, and engine emissions (Prihandana et al., 2006). Instead viscosity 428
445 POSTER that is too low will produce a very fine spray and can not go further into the combustion cylinder, forming a fuel rich zone area which led to the formation of soot. Viscosity also showed lubrication or lubrication properties of the fuel (Prihandana et al., 2006). Value of kinematic viscosity is the main parameter that indicates the success of the transesterification reaction. Viscosity grades of vegetable oils that are too high is the reason why the vegetable oil can not be used directly in diesel engines. Results of analysis of biodiesel viscosity with velocity variations and 400 rpm are presented in Table 3. Table 3 Viscocity analysis of coconut oil-based biodiesel No. Impeller speed Viscosity (N s/ m 2 ) (rpm) Esterification Transesterification ,0059 0, ,0057 0, ,0063 0,0051 Based on the results of analysis of variance on viscosity, impeller speed variation treatment had no significant effect but the viscosity of methyl ester decrease from the esterification process to transesterification. Free Fatty Acid Free Fatty Acid (FFA) is a fatty acid which is separated from triglycerides, diglycerides, monoglycerides, and free glycerin. It can be caused by heating and the presence of water causing hydrolysis process. Oxidation can also increase the levels of free fatty acids in vegetable oils. This process is done in two stages, namely esterification and transesterification. Esterification reaction between an alcohol-generating fatty acid ester, whereas ester transesterification reaction is to produce new esters of fatty acids being exchanged positions. Esterification is done to reduce the free fatty acid content of the oil followed by the transesterification of triglycerides into methyl esters change. FFA biodiesel analysis results with the variation rate of 200, 300 and 400 rpm are presented in Table 4. Table 4. Free fatty acid analysis of coconut oil-based biodiesel No. Impeller speed FFA (%) (rpm) Esterification Transesterification ,07 4, ,14 6, ,88 3,87 Based on the results of analysis of variance, impeller speed did not significantly affect the content of free fatty acids, reduction of free fatty acids esterified to the transesterification process occurs only at a speed of 400 rpm. The FFA value is greater than the 0.8%, this is because coconut oil is the raw material used is to high, FFA feedstock used by 13.40%. Process in the reactor was reduced the FFA oil 13.40% to 3.87% in FFA biodiesel or approximately 71.12% decrease. It could be argued that the free fatty acids into methyl esters have not been good enough, it is correlated with the yield of methyl esters formed only 89.16%. This is likely due to the condition of the reactor temperature fluctuating so not quite optimal, heat reaction not enough to enhance the rate of reaction between coconut oil with methanol and acid or base catalyst. Esterification reaction between an alcohol-and fatty acid, whereas transesterification reaction is to produce new esters of fatty acids being exchanged positions (Sontag, 1982). Esterification performed using sulfuric acid catalyst to catalyze the free fatty acids. (Freedman et al., 1984). Esterification reaction affected by several factors such as the amount of reagent methanol and free fatty acids, reaction time, temperature, catalyst concentration, and water content in oil (Ozgul et al., 2002). The higher the amount of methanol used cause the higher the yield of methyl ester as well as the smaller the free fatty acid content at the end of the reaction. Transesterification reaction is influenced by internal and external factors. The internal factor is the condition of the oil itself as moisture content, free fatty acid content, and the content of dissolved and undissolved substances that can affect the 429
446 POSTER reaction. External factors are conditions that are not derived from oil such as temperature, time, stirring speed, catalyst type and concentration and the amount of methanol to oil molar ratio (Sontag, 1982). Impeller speed factor is one that affects FFA decreased. The existence of the stirring of the reactor will give effect to the reaction process, the stirring will increase the frequency of collisions between the molecules of reagent that reacts with a substance that accelerates the reaction and the reaction occurs resulting in perfect FFA decreased. High content of FFA in biodiesel greatly affect the performance of a diesel engine, because it is corrosive and can cause soot or crust in diesel engine injectors. In addition, the low number of FFA will reduce the risk of oxidation during storage (AC Pinto et al., 2005). CONCLUSION Biodiesel production using prototype reactor with 10 L scale and turbin impeller 6 blade with 3 level blades produces the maximum yield at a speed of 400 rpm is equal to 89.16% with the quality of biodiesel include density of 0.89 g / cm 3, viscosity of N s / m 2, and free fatty acid of 3.87%. REFERENCE [1]. Balai Besar Kimia dan Kemasan Biodiesel Bahan Bakar Alternatif Pengganti Solar. Jakarta: Balai Besar Kimia dan Kemasan [2]. Buckle, K. A, Edward R. A, Fled G. H, Watton M Alih Bahasa Hari Purnomo. Ilmu Pangan. Jakarta : Universitas Indonesia. [3]. Freedman, B., E. H. Pryde, dan T.L. Mounts Variables Affecting the Rendemens of Fatty Esters from Transesterified Vegetable Oils. J. Am. Oil Chem. Soc. 61, [4]. Gerpen JV, Shanks B, Pruszko R, Clements D, and Knothe G Biodiesel Production Technology. National Renewable Energy Laboratory. Colorado. 106 p. [5]. Hardiwijiardjo, B.H. ISO Panduan Penerapan Sistem Manajemen Lingkungan. PT. Gramedia Pustaka Utama, Jakarta. [6]. Ozgul S, Turkay S., Vegetables Affecting the Yields of Methyl ester Derived from in situ Esterification of Rice Bran oil. J Am Oil Chem. 79: [7]. Pinto A. C., L. L. N. Guarieiroa, M. J. C. Rezendea, N. M. Ribeiroa, E. A. Torresb, W. A. Lopesc, P. A. P. Pereirac, dan J. B. de Andrade Biodiesel: An Overview. J. Braz. Chem. Soc., Vol. 16, No. 6B, [8]. Prihandana, R., R. Hendroko, dan M. Nuramin Menghasilkan Biodiesel Murah, Mengatasi Polusi dan Kelangkaan BBM. Agromedia Pustaka, Jakarta. [9]. Sanford SD, White JM, Shah PS, Wee C, Valverde MA dan Meier GR Feedstock and Biodiesel Characteristics Report. Renewable Energy Group [10]. Sontag NOV., Fat Splitting, Esterification, and Interesterification di dalam Bailey,s Industrial Oil and Fat Products. Ed ke-4. Volume ke-2. New York : John Wiley & Sons. 430
447 POSTER ASSESSSMENT OF SOCIO ECONOMIC AND ENVIRONMENTAL IMPACT OF COMMUNITY WATER SUPPLY SCHEMES IN KANDY DISTRICT D.M.C.S. Mimrose 1, E.R.N. Gunawardena, and H.B. Nayakakorala 1 a lecturer at the Department of Agricultural and Plantation Engineering, The Open University of Sri Lanka ABSTRACT Introduction of community water supply projects, implemented and managed by the community with an initial support from governments or international organizations has been considered as a useful strategy to provide access to safe drinking water to rural communities in the world. Sri Lanka has also adopted this strategy through the Community Water Supply & Sanitation Project (CWSSP). A research was conducted to evaluate the sustainability of 20 selected community water supply schemes in Kandy district and to identify the impact on society and the environment. Consumers have been benefited by the CWSSP with ensured supply of drinking water at an acceptable quality and quantity in almost all the schemes. It was also found that a proper assessment on existing and projected water demand would ensure the sustainability of the scheme by improving community's willingness to sustain the system. INTRODUCTION Access to water resource is an uninhibited right of the community. With this in mind, The United Nations Millennium Development Goals (MDG) aims to reduce the proportion of people without sustainable access to safe drinking water and basic sanitation by 50% by year 2015 [1]. The Sri Lankan government has set ambitious targets to provide access to safe drinking water and basic sanitation facilities to 85% of the population by 2015 and 100% by 2025 in line with MDGs [2]. However, by the year 2009, 84.8% of the population of the country had access to safe drinking water and 35% had the access to pipe borne water [3]. Even though water supply and sanitation coverage has increased in many developing countries including Sri Lanka, there is an uneven progress between urban and rural areas [4], [5]. Access to safe drinking water is the proportion of people using improved drinking water sources such as household connection, public standpipe, bore hole, protected dug well, protected spring and rainwater [1]. About 94% of the urban population of developing regions uses improved sources while only 76% of rural populations have access to improved sources. Poor or absence of safe water may lead to many unfavorable consequences, such as more time and energy consumption for collecting and carrying water and insufficient water to maintain good hygiene practices [6]. According to World Health Organization (WHO) 1.6 million deaths per year are attributed to the use of unsafe water. The high costs and administrative complexities of delivering water in rural and semi urban areas through line ministries have led many governments to consider community participation as a strategy for providing sustainable water supply systems [7], [8]. Community water supply can be explained as a public water system that serves at least 25 residents throughout the year and may consist of one or multiple wells or reservoirs. Importance of community participation in decision making has been widely recognized by different international bodies. Principle two of Dublin statement emphasizes that water development and management should be based on a participatory approach, involving users, planners and policymakers at all levels. The decisions should be taken at the lowest appropriate level, with complete public consultation and involvement of users in the planning and implementation of water projects. The concept of community has also come to play a greater role in the debate on alternatives to private sector participation in water supply, particularly with respect to urban areas [9]. The Community Water Supply & Sanitation Project (CWSSP), funded by the World Bank, Japanese Bank for International Corporation (JBIC) and the Government of Sri Lanka (GOSL) was commenced 431
448 POSTER in thirteen (13) districts in 1993/94. The project was designed to achieve the set objectives by integrating safe drinking water, basic sanitation, hygiene education, environmental programs and diversifying community activities to socio economic and cultural fields [10]. Project adopts participatory development approach for water supply scheme planning, construction and scheme management. Under this approach, community has been represented by Community Based Organizations (CBOs), which actively participate in decision making at all stages of project implementation and fully responsible for construction, operation and maintenance of water supply and sanitation facilities. Water supply schemes are developed in a demand driven approach, where community understand it s demand, available water resources, etc to ensure the long term sustainability of the scheme. Though conceptually very sound, a significant number of community based projects in water and sanitation sector fail to deliver benefits to society over the long term in developing countries [11]. Part of the cause for this failure lies in poor understanding of the issues of sustainability. The sustainability of a water supply system is the maintenance of an acceptable level of services throughout the design life of the water supply system. Therefore, identification of underlying causes for the performance differences of community water supply projects would be important not only for sustainable management of existing projects, but also in establishing new development projects. This study was conducted to assess the factors which are important in ensuring sustainability of a representative sample of community water supply schemes in the Kandy District implemented by the CWSSP. METHODOLOGY The second CWSSP project funded by the World Bank and implemented through the local government in Kandy district was selected for the study. A total of twenty CBOs, were selected randomly from eight Divisional Secretariat divisions. Existing methodologies for measuring sustainability of community water supply projects by the UNDP and World Bank [12] were used for this study. The index used for sustainability assessment includes five sub-indicators, such as, a) financial management, b) operation & maintenance practices, c) consumer satisfaction, d) physical condition of system and, e) willingness to sustain the system. Each sub-indicator is comprised of 8 to 15 questions with a total of 55. The scores of each sub-indicator as well as overall sustainability of selected community project were adjusted to a ten-point scale. A multiple-choice questionnaire was prepared to gather data required to assess the sub-indicator scores and the socio economic and environmental impacts. Data obtained through the household questionnaire survey of three Well Performing Schemes (WPSs) and three Poorly Performing Schemes (PPSs) were pooled separately to make the comparisons. 432 RESULTS Socio economic features such as education and family income were fairly similar in the two categories. In this study two third of the respondents were females in both categories. Around 60 percent of the respondents had studied at least up to GCE (Ordinary level). According to the survey results household income of 80 percent of the sample have earned above LKR per month; 40 percent of them have earned above LKR. Groundwater (domestic wells, common wells and tube wells) was the major water source used before the introduction of CWSSP in Kandy district. Usage of extended pipelines from natural streams or springs was common in this study area, which is considered to be an illegal activity. Travelling cost was not incurred in fetching drinking water in most of the cases in the study sample since water was available at a walking distance from their houses in most of the villagers. Consumers have been benefited by the CWSSP with ensured supply of drinking water at an acceptable quality and quantity in almost all the schemes. Increase of domestic water consumption after implementation of the project was higher in WPSs than in PPSs. However 22 percent from WPSs and 40 percent from PPSs stated that the water consumption remained the same before and after the
449 POSTER project implementation. The major reason for this consumption pattern was the continued use of alternative water sources for non-drinking water uses. About 42 percent of the WPSs respondents and 66 percent of PPSs respondents admitted that they use alternative water sources. Commonly used alternative source in WPSs found to be a natural stream which is used as a source for washing and bathing purposes. Drinkable water is scare in those villages since sources were not common. In PPSs natural streams, springs and domestic wells were used alternatively by many beneficiaries. Water sources for all drinking, cooking, washing and bathing purposes had been easily available in those villages showing a low water scarcity. It was reported that 72 percent of the respondents from WPSs received better quality water after the introduction of CWSSP compared to the traditional water sources whilst only 24 percent of people in PPSs receive better water after CWSSP. Perception of water quality was identified as one of the reasons for using higher percentages of alternative water sources by the PPSs. Consumer s perception on previously consumed drinking water is illustrated in Table I. Most common water quality parameters used in WPSs were appearance (color, turbidity) and the taste while PPSs used the unavailability of treatment facilities as another parameter. Impact of CWSSP in reducing the distance travelled (Table II) and time spent for water collection (Table III) was considerable among all the communities since water is available at the house after CWSSP. Before the introduction of CWSSP, 62 percent of the consumers from WPSs and 42 percent from PPSs had to walk more than 50 m to fetch water. Bringing water was a very difficult task considering the hilly terrain in the study area. Overall, the villagers in WPSs had to face many difficulties compared to PPS in fetching water before CWSSP. Table I: Quality Of Water Used Before Cwssp Water quality WPSs (%) PPSs (%) Good Fair Poor 42 6 Bad 5 4 Table II: Distance Travelled By Beneficiaries In Wpss And Ppss Before Cwssp Distance WPSs (%) PPSs (%) <50 m m m >1000 m 4 2 Table III: Time Spent To Fetch Water By Beneficiaries In Wpss And Ppss Before Cwssp Time duration WPSs (%) PPSs (%) <15 min min min >60 min 3 2 Expenditure on drinking water before CWSSP introduction was studied to identify the economic benefit of the project on the community. As shown in Table IV, the water bill of majority (86%) of the consumers in PPSs was below LKR 200 whereas the majority (52%) of consumers in WPSs spent between LKR Among the reasons for this variation in cost of water are the increased consumption and the level of tariff set by the WPSs compared to PPSs. The water consumption has increased at households of 77 percent of the respondents of WPSs whereas only 60 percent of the 433
450 POSTER respondents in PPSs have increased water consumption after CWSSP. Consumers believed that benefits were higher after the CWSSP compared to the difficulties faced by them before project, primarily due to the availability of secured clean water at the house. Table IV: Percentage Of Consumers Receiving Average Water Bill Of Given Value Ranges Average monthly water bill WPSs (%) PPSs (%) < 200 LKR LKR LKR 8 0 >600 LKR 5 0 Continuous assessment of environmental impact is required for any development project. However the communities could not identify many impacts on the environment and authorities had no records on continuous assessment on the environment. An increased waste water generation was reported by 67 percent and 40 percent of the beneficiaries from WPSs and PPSs respectively. However increased wastewater generation has not become an environmental problem in these villages as individual home gardens have adequate space for sanitary disposal of domestic waste. Majority of the respondents were using ground soaking and drains as the disposal methods. According to Table V, none of the beneficiaries from WPSs and 8 percent from PPSs have perceived environmental damages, such as reduced water discharge for irrigation and reduction in ground water level. Also a lower proportion (23% from WPSs and 10% from PPSs) of the respondents perceived to have environmental benefits Table V: Community Response On Environmental And Social Impact Of The Project Impact WPSs (%) PPSs (%) Yes No Yes No Environmental Positive Negative Social Positive Negative Availability of water for home gardening, flow for environment and wastewater infiltration causing groundwater recharge were the major environmental benefits of the CWSSP identified by the respondents. As shown in Table V all the respondents from WPSs believed on improved social cohesion after the initiation of water supply scheme and few have complained on social conflicts. Social cohesion increased with improvement of attitudes of villagers. Villagers worked together for a common goal and moved with the fellow villagers and had a great opportunity to be friendly with each other. Convenience on daily routine and saved time after introducing CWSSP has helped to improve the lifestyle of beneficiaries. Availability of ensured continuous water supply system has uplifted the confidence in villagers. The committee members of the CBOs have admitted that they personally benefited through the training and social work on the water supply schemes. Most of them appreciated the training conducted on book keeping, documentation and especially on operation and management activities of water supply scheme. Improved leadership qualities and good reputation gained in their own society were also identified as advantages. Root-causes which led to conflicts in the society included problems of land ownership, disappointment due to the mishandling of funds by officers, low water pressure due to high demand and favoritisms in providing water connections by CBO officials. 434
451 POSTER ACKNOWLEDGMENT Authors would like to acknowledge Crossing Boundaries Project of the Postgraduate Institute of Agriculture, University of Peradeniya, Sri Lanka for providing financial assistance to conduct the research and the officials of the CWSSP in Kandy and village communities for their excellent support and cooperation during the field survey. REFERENCES [1]. WHO, (September, 2010) Millennium Development Goals [online] Available: [2]. I.V.W. Ediriweera, Strategies adopted for sustained water supply and sanitation through community participation in Sri Lanka. 31 st WEDC International Conference, Kampala, Uganda, [3]. Central Bank Annual Report [4]. G. Hutton, and J. Batram, Regional and Global Costs of Attaining the Water Supply and Sanitation Target (Target 10) of the Millennium Development Goals. World Health Organization, Geneva, Switzerland, [5]. World Bank. Sri Lanka Impact Evaluation Report. Community Water Supply and Sanitation Project, [6]. P.R. Hunter, A.M. MacDonald, and R.C. Carter, Water supply and health. PloS Med. 7(11) [7]. I. A. Ademiluyi, and J. A. Odugbesan, Sustainability and impact of community water supply and sanitation programmes in Nigeria: An overview African Journal of Agricultural Research Vol. 3 (12), pp , [8]. D.A. Rondinelli, Decentralising Urban Development Programme: A Framework for Analysing Policy. United States Agency for International Development. USA, [9]. K. Bakker, The ambiguity of Community: Debating alternatives to private sector provision of urban water supply. Water Alternatives 1(2): , [10]. Anonymous (September, 2010) Rural Water Supply and Sanitation Divivsion [online]. Availabale: [11]. G. F. Antonio, The European response to the challenges of water and sanitation in developing countries. Tribune. pp 86-89, [12]. J. Sara, and T. Katz, (August, 2010) Making Rural Water Supply Sustainable: Report on the Impact of Project Rules [online]. Availabale: 435
452 POSTER 436
453 POSTER GLOBAL RICE TRADE AND SOME ISSUES OF RESTRICTION Evi Nurifah Julitasari Widyagama University ABSTRACT Only few rice production traded in global market so called thin market. Some intervention make the supply and demand not sufficient for suistanable agriculture.the aims of study are (1) identification some intervention (trade restriction) (2) how the effect of trade restriction to influence the supply and demand (2) how the effect of trade restriction the Indonesian rice performance. Models construct by econometric simulation analysis from the time series data The results shows: (1) the effect of export trade restriction will increase an export price in all export rice country except United State and extend the word rice supply more than 10 percent, and the effect of import trade restriction will increase an import price in all importer country, (2) and the effect of import trade restriction to Indonesian rice performance are decrease at domestic production, paddy productivity and demand fertilizer. We suggest that Indonesian rice performance still intervention through input price instrument, output price instrument, stock instrument. Key words: restriction, rice traded, global market INTRODUCTION Rice traded in the world market was few about 4 to 7 percent from total world production. Therefore, it s called thin market because some producers more oriented to sufficient domestic demand. This is phenomenon make vulnerable to increases of price.proved in 2008, world rice price increase hit 300% from $ 325/MT to $ 1,080 $/MT (Business Monitor Online, 21/01/2009). Almost all food prices increase, so it happen commodity price boom of 2007/08. Food price indexes was hit until in 2007/09, manly the indexes only under 130. The corn prices hit $280/MT, soybean prices hit almost $600/MT, maize prices hit almost $200/MT, wheat prices hit almost $500/MT and the highest price was rice prices hit almost $1,000/MT. Ideal prices normally in range the $ /MT. Reed (2012), says explanations for the 2008 price spikes are (1) Speculation, (2) drought or supply problems, (3) demand increases in emerging countries, (4) trade restrictions, (5) energy policy in the US and (6) value of the US dollar.speculation it means the food price very volatile so for feature traders buy and hold commodity on their overall strategy to get hedge funds. Higher trading volumes due to new traders, so increase demand side. No evidence that more speculators have caused price increases, but this is a short-term phenomenon. How about the supply problem? The center production of paddy was located on Asia, America and Africa. Asia contribute about 92,25%, America contribute 3,6% and Africa contribute 2,1%. The biggest production was Asia, which is speare in East Asia i.e China contribute 30.12% and Japan (1.75%). South Asia i.e India contribute 23.24%, Bangladesh (6.92%), Pakistan (1.34%), Nepal (0.59%) and Srilangka (0.50%). South East Asia i.e Indonesia contribute 9.19, Vietnam 5.78 Thailand, 2.61, Myanmar 5.16 and Philipina 5.05 from total production. Indonesia was the third largest rice 437
454 POSTER producing country in Asia after China and India. Indonesia rice production had average 48,019 million tonnes/year, while China reached 183,756 millionstonnes/year. But only few of production of rice traded in the international. Thailand was the largest rice exporter contribute percent and than India contribute 13%, Vietnam contribute 15.32%, Pakistan contribute 9.53% and United States contribute 9.52% from the total world export volume. Average export volume Thailand was 5,245 milliontonnes/year (FAO, ). Indonesia's rice production increased only1.97 percent but the increase of import volume is very high (1,095,tons). Share ofimport volume reach 32 percent of total import ASEAN countries. Indonesian import volume expected increase on tariff reductions. Asia Free Trade Area committed to eliminate the nominal tariff until 0-5 percent in 2015 and ASEAN-China (ACFTA) will full liberalized in 2018.The concept of open market allows any other economic players to enter the market without restriction trade. Sawit (2009), the major rice exporting countries still use export subsidies, such as India to implementrebate (discount price), so it can be sold cheaply on the world marketin order to reduce the burden of stock. Thailand, China, Vietnam and the developed countries of the European Union and the United States also apply export subsidies. This study want answer the extent of the impact of the trade restrictions in the State of exporter and importer in the country trade restrictions on the performance of rice in Indonesia, especially the variable block production and the domestic market. LITERATURE REVIEW Trade restrictions are essentially government intervention at the border price (Tweeten, 1992). Thetrade restrictions implemented in import/export country include tariff/tax subsidy and quota. Export trade restrictions such as of export taxes, export subsidies, export quotas, minimum export price and non-tariff barriers such as export promotion, credit and subsidies made storage. The export taxes will decrease export volume but the export subsidies will increase the export volume. Decreasing in export volume cause the world supply of rice, consequently the price of rice will rise. Therefore the elimination of export subsidies would harm rice importer country. Export subsidies will lower the export price so increasing the export volume and the supply of rice increase in the world so when global rice demand remains the world rice price will go down. The import tariffs will increase the import price so the import price will increase and the volume of rice imports will decrease in the world still offers. Instead deletion trade restrictions in the form of import tariffs will lower the price of imports and the impact on the increase in the volume of imports..trade restrictions on countries that import tariffs can be either specific or ad valorem rate tariff, TRQ (tariff quota) and other non-tariff barriers. Ranjitsinh (2007), the tariff reduction causes trading volume of rice in the global market increases. Anderson, Huang and Lanchovina (2004), opening of trade barriers China cause the domestic price of rice fell (0.9%) compared to pre-join WTO impact on the production, farmers' income and the negative effect on food security. RESEARCH METHODS The study use time series data in , collect from and Nominal data deflated by the consumer price index (CPI) with base year 2000 = 100, and for export and import price deflated by the export/import price index. 438
455 POSTER The model construct by simultaneously equations, analysis with SAS/ETS (Statistical Anaysis Simulation/Econometric Time Series). The model include two block i.e supply side and demand side. The total supply is the sum of export volume of rice exporter i.e. Thailand, India, Vietnam, Pakistan, United State, China, and other countries, in equation(1). TEXD t = EX it TEXD t = EXTHA t + EXINDI t + EXVIE t + EXPAK t + EXAS t + EXCHI t +EXLN t...(1) The total demand s is the sum of import volume of rice importer countries i.e. China, Indonesia, Philippines, Iran, Malaysia and other countries expressed in equation (2) TIMD t = IM it TIMD t =IMCHI+ IMINA + IMPHI t + IMRAN t + IMMAL t + IMLN t.. (2) The volume of export/import depend on price export/importwe can derivative price of export/import function through the value equation. Nyhodo, PuntCandNVink(2009), the domestic value of production is the sum of export value plus domestic market value, expressedan equation : PEX it *EX it = PPX it *QSX it PDX it *QDX it....(3) The domestic price was include the subsidy/taxof exportin equation: PDX it =NER it *PEX it (1-Tx it )... (4) So we can derived the export price with the trade restrictionin equation: PEX it *EX it = PPX it *QSX it PDX it *QDX it...(5) PEX it *EX it = PPX it *QSX it - [NER*(PEX it - PEX it * tax)*qdx it...(6) PEX it *EX it = PPX it *QSX it -NER*PEX it *QDX it +PEX it * tax*qdx it.....(7) Assuming (PEX it -PEX it * tax) is the trade restriction, can be expressed: PEX it =f(ex it, PPX it, QSX it,, PWEX it,qdx it )...(8) In the same way, we can derived in import demand function is expressed here : PIM it =f (IM it, PPIM it, QIM it, PWIM it, QDIM it )....(9) Where : TEXD t EXTHA t EXINDI t EXVIE t EXPAK t EXAS t EXCHI t EXLN t PDX it NER it PEX it Tx it = Total export volume inworldmarket year-t (tons) = export volume Thailand year-t (tons) = export volume India year-t (tons) = export volume Vietnam in year-t (tons) = export volume Pakistan in year-t (tons) = export volume United Statein year-t (tons) = export volume China year-t (tons) = export volume another country year-t (tons) = price producer in exporter country-iyear-t (US$/ton) = exchange rates in the exporter country iyeart (US$) = export price in exporter country yeart (US$/ton) = export tax on exporters of the country yeart (US$/ton) RESULTS DISCUSSION AND ANALYSIS 1. IDENTIFICATION OFTRADE RESTRICTIONS Rice is very high sensitive product in the trade of agricultural products. It is proven that the number of exporter/importer intervention. Mulyana (1998), Haryati (2003) and Sudjilah (2009), has been identified that variable trade restrictions as a factor affecting the export/imports volume. Some oftrade restrictions expressed in the table below: 439
456 POSTER Table 1. Identification of Internal and External Policy and Importer of Rice Exporting Countries World Countries Internal Policy External Policy India Pricing policies(prices upport)** minimum producer price** export subsidies** advaloremrates** Thailand 440 Supply and Input Subsidy Policy* *Production Management Policy Seed Provision and Credit Offers* Fertilizer Procurement* Regions Production Centers* Program R&D technology Transfer* Price Stabilization Policy: Pawn Rice*, Intervention Market, Stock Rice* Agricultural Bank credit scheme** United State Loansin the form ofldp** tariff ** China Subsidies, irrigation and improved seedsminimum support price policy ** procurement price program ** export tax*** Formilled rice export tax** Promotion of Exports** Storage and Credit Subsidies * ImportControl tariff rate quota ** tarif maximum 10%** Philipines There in data tarif 35 %*** quota*** 1) Pakistan There in data minimum export price*** Excerptedfrom:: *Simatupang (2002),**Ratjitsinh (2000), *** Market-Prices/10746.html Mulyana (1998), analyzing the state government's intervention in the major rice exporter/importer. Thailand export price always higher than domestic prices because of export taxes. The goal is to protect domestic consumers but the volume of rice exports are elastic means an increase in world prices responded with an increase in export volumes. Sudjilah (2009), China rice export restriction are significant influence theexport volume and the export pricewas compared to other countries because China impose export tax. Effect of rice export restrictions in Vietnam was also significant increase in the volume of exports, due to export subsidies. But in the United States influence of grain export restrictions were not significant, it is often associated with aid programs by selling cheap rice through the Farm Bill Hariyati (2003), trade restrictionis significant positive effect on domestic prices but negative effect on import price. Export/Import Price Export restriction of rice significantly influence the export price (R2=0.67 to 0.91) in Thailand, India, Pakistan, United States and China. The sign was positive except United States because for Food Aid. The effect of export price to volume export was significantly its means the increase export price respond with the export volume. Lag endogenouse export price is significant to determine export price so trend of export prices always grow up. The impact of export restrictions to export price Thailand (4.31%), India (1.00%), Vietnam (3:26%), Pakistan (3.62%), China and US (-0.77%). Effect of import restriction is significantly to increase import price for all countries, with the positive sign but not effect toimport volume except China. In China, Philippines and Malaysia, the increase of import price following decrease of import volume. In Indonesia and Iran not effect to volume import because trend of import volume is very high, variable lag previous year influence this year. Haryati (2003), Malaysia price import is negative effect on volume import. Malaysia import prices are affected by world rice prices and import prices in the previous two is positive. Import volumes are influenced by the price of imports and exchange rate marked negative. Export Restriction Simulation shows export restriction intervention will increase the world supply to 9.92% and export volume to 10.00% from Thailand, India, Vietnam, Pakistan, U.S. and China. Export restrictional so
457 POSTER increase the export price in Thailand (0.03%), India (9.26%), Vietnam (7.70%), Pakistan (3.55%), China (10.98%), but the response negative in U.S. (-42.83%). The effect of no intervention is not increase the total world to supply and the export volume of exporter country. It is proved that the increase the world supply is due to export restriction. Import Restriction Simulation of import restriction intervention will respond positive increase price import in China (10.11%), Indonesia (3.84%), Iran (2.60%) Malaysia (0.07%) and negative response in Philiphina (- 0.30). The impact of no-import restriction will affect the production blocks of lower domestic grain production (-0.02%), decreased productivity (-0.03%) and demand urea fertilizers (-0.02%). In world market, the absence of import restrictions responded with an increase in the import price of China (10.12%), Indonesia's import prices (9.10%) and import prices are Malaysia (3.04%). While the impact of the absence of import restrictions by the negative response Philippine import prices (-0.24%) and import prices Iran (-0.20%). The Impact of Increased Quantity Imported Simulation of the impact of an increase in the quantity of imports of major importers in the country will lead to an increase in total world export supply 10.86% and an increase in the volume of imports of country importers are Indonesia (21.40%), Philipina (32.19%), Iran (11:02%), and a decrease in the quantity Malaysia imports (-8.93%). The impact of an increase in the quantity of imports in country importers responded with import prices penigkatan China (18.87%), Indonesia's import prices (8.00%), import prices Philippines (5.89%), Iran import prices (2.50%) and Malaysia import prices (4.67%). The Impact of Increasing Import Price Simulation of the impact of an increase in import prices respond to block the production of the domestic grain production decline (-0.02%), decreased productivity (-0.03%) and a decrease in the realization of the distribution of urea (-0.02%). In the blocks world market responded with an increase in import prices increased import prices Indonesia (0, 51%), import prices Philippines (3.32%), import prices Malaysia (0.24%) and Iran import prices (1.47%). The increase in import prices actually responded with a decrease in import prices in China (0, 04%). The Impact of Increased Domestic Producer Price The impact of an increase in domestic producer prices responded with an increase in the price of Chinese imports (0.38%) and a decline in imports of Indonesia (-5.13%), import prices Philiphina (-33, 18%), the import price of Iran (-2.45%), and price Malaysia imports (-14.72%). CONCLUSION AND ADVICE 1. Impact of Export Restrictions Intervention responded positively to the increase in total world export supply and export volume increased in all the countries major exporters. It is proved that the increase in world rice export supply followed by an increase in export volumes due to state intervention exporter over export restrictions. There is also an increase in export prices in all the countries except the United States exporters. 2. The opposite effects of the no-intervention export restriction will respond with an increase in world export supply and an increase in the volume of exports of the major exporters, although there was also an increase in export prices in some countries exporters. 3. Impact of Import Restrictions intervention in major importing countries have no effect on domestic production or block, but if no-intervention import restrictions applied country importers will affect production blocks responded with a decrease of domestic grain production, productivity and the realization of urea distribution. 4. The impact of an increase in the quantity of imports by major importers State would respond with 10% increase in total world export supply 10.86% and an increase in the volume of imports of the larger Indonesia is 21, 40%. The impact of an increase in the quantity of imports in country importers also responded with increased import prices Indonesia (8.00%). 441
458 POSTER 5. Impact of Increased import price response that blocks the production of domestic grain production decline (-0.02%), decreased productivity (-0.03%) and a decrease in the realization of the distribution of urea (-0.02%). ADVICE Intervention export restrictions would indeed increase the total world export supply, if removed would cause no increase offer but the effect on the increase in export prices. Intervention export restrictions by major exporters State is still required to improve the total world export supply, if the no-intervention retrksi exports will affect negatively on the performance of Indonesia's rice. Rising import prices contributed to the decline of domestic grain production, productivity and the realization of urea distribution. Intervention by the State of import restriction major importers are still required because if no-intervention import restriction will affect negatively on the performance of rice in Indonesia. Without applying import restrictions will impact on the domestic grain production, productivity and the realization of urea distribution. REFERENCES [1]. Aninditya dan Micheal Reed, Bisnis Dan Perdagangan Internasional (Terjemahan). Penerbit ANDI, Yogyakarta. [2]. Bettie, B and Taylor, R, The Economics Of Production, penyunting Gunawan Sumodiningrat (1996) Ekonomi Produksi, Gadjah Mada University Press, Yogyakarta, Indonesia. [3]. Gujarati, D.N. (1995). Basic Econometric. McGraw-Hill Book Co, Singapura. [4]. Hansen, Bent, 1966.General Equilibrium System. University of California, Berkeley [5]. Jatileksono, T. (1987). Equity Achievement In The Indonesian Rice Economy, Gadjah Mada University Press, Jogjakarta. [6]. Koutsoyiannis, A. (1982). Theory of Econometrics. The MacMillan Press Ltd, New York. Printed In Hongkong, Second Edition. [7]. Minot, Nicholas, Using GAMS for Agricultural Policy Analysis, IFPRI [8]. Mulyana Andi, 1998; Keragaan Penawaran dan Permintaan Beras Indonesia dan Prospek Swasembada Menuju Era Perdagangan Bebas: Suatu Analisis Simulasi. Disertasi, Tidak Dipublikasikan. Program Pasca Sarjana Institut Pertanian Bogor. [9]. Nyhodo, C Punt dan N Vink, The Potensial Impact of The DDA (Doha Development Agenda) on South African Economy: Liberalising OECD agriculture and food trade Jurnal Agrikon, Vol 48 no 1 Maret 2009 [10]. Sawit M.Husein dan Erna Maria Lokollo Rice Import Surge In Indonesia ICASEPS&AAI,2007 [11]. Tolley George S.Vinod Thomsn Chung Ming Wong,1982. Agricultural Price Policy and The developing countries. The Johns Hopkins University Press. [12]. Tsakok, Isabelle (1999), Agricultural Price Policy. A Practitioner s Guide To Partia-Equlibrium Analysis, Cornell University Press, Ithaca London. [13]. Tweeten, L Agricultural Trade, Principles and Policies, Westview Press, London. [14]. Varian Hal.R Microeconomic Analysis 3 rd Ed. W.W. Norton & Company, New York, London. 442
459 POSTER BARE SOIL SURFACE TEMPERATURE DETERMINATION FROM ENERGY BALANCE EQUATION Ardiansyah 1, Sho Shiozawa 2, and Budi Indra Setiawan 3 1) Lecturer of Agriculture Engineering Department, Jenderal Soedirman University, Purwokerto, Indonesia. 2) Lecturer of Department of Biological and Environmental Engineering, University of Tokyo, JAPAN. 3) Lecturer of Department of Civil and Environmental Engineering, Bogor Agricultural University, INDONESIA. ard@unsoed.ac.id ABSTRACT Soil surface temperature is an expression of solar energy conversion in soil surface that is known in the mathematical form as energy balance equation. The aim of this research is to obtain method to determine surface temperature of bare soil from the complex energy balance equation. Calculation of energy balance components ( R n, G, E, H ) require surface temperature as input so that it creates equation with one-variable unknown. Newton-Rhapson algorithm for root findings, therefore, can be applied. Simulation result showed that the change in soil surface condition, mainly water content, influences the energy conversion process (energy balance components) in surface. The dryer soil surface, the higher surface temperature can be measured and the lower evaporation. This nature opens possibility to estimate actual evaporation by only measuring surface temperature. Key words: bio-ethanol. microbe, indigenous, fermentation, Nypa fruticans INTRODUCTION Soil surface temperature is an expression of solar energy conversion in soil surface. It influences many physical- biological-chemical process within the soil such as evaporation[4], soil mineral decomposition[8], or greenhouse gas emission[3]. Simplifying energy balance equation to estimate bare soil evaporation from surface temperature has been done by other researcher[4] [7] [11], however, surface temperature and energy balance components are interdependent so that it is needed to observe how they interact. Modeling and simulation of soil surface temperature from energy balance equation and coupled with water flow and heat flow in soil is a way to understand the interdependency. It is a starting point to obtain method for using soil surface temperature as indicator for several physical- biological-chemical process, mainly evaporation. The aim of this research is to obtain a method for estimating surface temperature from energy balance equation by using model. 443
![POSTER THEORY Earth s surface is a plane separating two different media. Surface itself is the site of very important energy and mass exchange and conversion[10].](/docs-images/73/68916181/images/460-0.jpg "The energy which is available for surface process such as evaporating water, warm the environment, and plant photosynthesis comes from the sun. This energy is called radiation energy.")

460 POSTER THEORY Earth s surface is a plane separating two different media. Surface itself is the site of very important energy and mass exchange and conversion[10]. The energy which is available for surface process such as evaporating water, warm the environment, and plant photosynthesis comes from the sun. This energy is called radiation energy. Some process in the atmosphere may scatter or absorb radiation before reach surface (Figure 1). Finally radiation energy available in the surface is in the terms of net radiation. Figure 1. Various component of radiation [10] Net radiation is the difference between the incoming and outgoing radiation. Net radiation is a positive value when there is more incoming radiation than outgoing radiation. This is occurs during the day time when the sun is out and the air temperature is the warmest. At night, net radiation is usually a negative value as there is no incoming solar radiation and net longwave is dominated by the outgoing terrestrial longwave flux. As net radiation is the input energy for all process in the surface, the total output energy should be equal to this input energy. This term is well known as energy balance. Energy Balance equation for surface can be written as: Rn G E H (1) R n : Net radiation (W/m 2 ) G : Ground heat flux density (W/m 2 ) E : Evaporation in latent heat energy term (W/m 2 ) H : Sensible Heat flux (W/m 2 ) Figure 2. Process in the surface 444
461 POSTER All the process in the energy balance equation involve surface temperature but it is generally not known. It is usual to manipulate the equation to minimize the use of surface temperature. Net radiation equation and Penman-Monteith equation are the example of minimizing the use of surface temperature. Surface Temperature Estimation METHOD In order to find surface temperature from energy balance, root finding method of Newton-Rhapson can be applied. It is done by arranging all the components of the equation to one side and left zero in the other side. One initial guess value of surface temperature is given. Iteration will find correct value of surface temperature. This method is simply describe as below : Step 1. Arranging all the equation (1) to one side F G E H Rn 0 (2) Step 2. Giving initial guess value of T s (surface temperature). T a (air temperature) acquired by measuring or modeling, R n is measured and modeled for hourly value. Step 3. Deriving the equation with respect to T s. F G E H R n (3) T s T s T s T s T s F Step 4. Calculating F and T s Step 5. Correcting the value of T s k k 1 k F T T s s T s, (4) k df T s dt s k is number of iteration. k 1 k This step is iterated until T s T s 0 Analytically deriving each component of energy balance equation is not easy, therefore numerically derivation is found simple. Numerical derivative of a function can be describe in equation (5) [9] : ' f f f f f x ( 2 o ) (5) 12h New value of T s will be used to calculate R n, G, E, H. E is used to calculate evaporation and soil water content profile. G is used to calculate soil heat flux and soil temperature profile. Water Flow and Heat Flow in Soil Water content profile can be calculated in accordance with energy balance calculation. Energy balance equation should be linked to water flow eqution. Latent heat of evaporation. The linked model 445
462 POSTER between the 1-dimensional water balance equation in the combined liquid and gaseous phase is given by : t q q v z z S w (6) Water content and soil hydraulic conductivity is given by the function of water pressure by using model proposed by Campbell[5] : 1 b e s, b 5 (7) n m k k e s, k k s (8) s n 2 3, m 2b 3 b Modeling soil temperature is aimed to evaluate heat flow within soil and heat exchange at the soil surface and to determine soil temperature. T T C h f k t z T (9) z Figure 3.Overall Process Overall process of energy balance, soil water flow and soil heat flow in bare soil can be described as in Figure 3. RESULT AND DISCUSSION Parameters Simulation of energy balance equation had been doing with parameters as follows : Radiation Parameters Parameter Units Value Albedo Soil Surface Emisivity Latitude deg-min-sec 10 o Hemisphere (North or South) - South Total Daily Radiation MJ/m 2 32 Day of the year
463 POSTER Boundary Layer Parameters Parameter Units Value Max Air Temperature C 30 Min Air Temperature C 10 Max Surface Temperature (for calculating guess value) C 40 Min Surface Temperature (for calculating guess value) C 20 Atmospheric Humidity 0.5 Wind Speed m/s 2 Height of Measurement m 2 Height of Roughness Elements m 0.05 Soil Parameter Parameter Units Value Number of elements - 15 Depth m 0.5 Soil Bulk Density Mg/m3 1.3 Initial Water Potential J/kg -33 Air Entry Potential J/kg -2 Saturated Conductivity kg s/m Soil b Value - 5 Time Step s 3600 Length of Simulation hours 500 Clay fraction Bottom soil temperature C days (4800 hours) simulation shows that maximum surface temperature increase daily. Figure 4 shows only 200 hours (8 days) of simulation. Figure 5 shows the whole 4800 hours of simulation time (hours) Figure hours (8 days) surface temperature simulation. Ta Ts 447
464 Energy Flux (W/m2) POSTER time (hours) Figure hours (200 days) surface temperature simulation. By finding T s, all components of energy balance can be calculated. Figure 6 and 7 are energy flux components calculated in day-1 (initially wet soil) and day-200 (without re-wetting the soil during the time) respectively. Note that R n, G, E, H change from day-1 to day-200. Water in the soil receives energy and thus energy is used to increase water temperature and vaporize it to the atmosphere. Evaporation ( E ) decreases and as soil gets dry, energy use to heat water is now heating the soil surface, and T s increases. In drying soil, thermal conductivity reduces so that G is smaller in day-200 compare to day-1. Thermal conductivity, however, has different nature in clay soil as in paddy field. Clay soil has shrinkage-swelling characteristic. During the shrinkage, the decrease in water content cause the pore size smaller, thus it make soil particle stick to one-another and increases thermal conductivity. On the other hand, in the shrinkage limit, decrease in water content will decrease thermal conductivity. It occurs because more volume of air replacing water in the pore. G will decrease after this point[2] Ta Ts time (hours) Rn(W/m2) G(W/m2) LE(W/m2) Hs(W/m2) Figure 6. Energy balance components calculated on day 1 448
465 Cum.Evap(mm) Evap.Rate(mm/s) Energy Flux (W/m2) POSTER time (hours) Rn(W/m2) G(W/m2) LE(W/m2) Hs(W/m2) Figure 7. Energy balance components calculated on day 200 Potential evaporation at initially wet soil become actual evaporation after several days. Actual evaporation rate at soil surface can be seen from Figure 8. Diurnal variation of evaporation rate shows that evaporation occurs in respond to the change of vapor concentration difference between surface and air. Saturated vapor concentration itself depend on the temperature which is diurnally[6] time (hours) Evap.Rate(mm/s) Figure 8. Actual evaporation rate at soil surface time (hours) Cum.Evap(mm) Figure 9. Cumulative evaporation 449
466 Depth(m) Depth(m) POSTER Figure 10 shows profile of water content within soil in the time of simulation 1 hour, 2400 hours (100 days), and 4801 hours (200 days). In the end of day 200, top part of soil relatively dryer than bottom part. From surface to 10 cm under surface can be called as dry layer. Figure 11 shows soil temperature profile in the 14 hours (day time), 2400 hours (night time) and 4801 hours (night time). There is big difference of profile between day time and night time. In the daytime surface and sub surface temperature is hotter than bottom part of soil. In the night time, surface and sub surface temperature cooler than bottom part of soil. Water Content(m3/m3) hour 2400 hour 4801 hour Figure 10. Water content profile Temperature(C) hours (day) 2400 hour (night) 4801 hour(night) Figure 11. Soil temperature profile 450
467 POSTER CONCLUSION Surface temperature, energy balance components, and flow process of water and heat below surface can be estimated by using models. Simulation shows strong interdependency that can be used to map evaporation from soil temperature when parameters involved in the process is known. APPENDIX CALCULATION OF ENERGY BALANCE EQUATION Energy Balance equation for crop surface can be written as : Rn G E H (A.1) R n : Net radiation (W/m 2 ) G : Ground heat flux density (W/m 2 ) E : Evaporation in latent heat energy term (W/m 2 ) H : Sensible Heat flux (W/m 2 ) Net radiation can be calculated as follows : Rn a s S t L a L s (A.2) where : 4 La a T a (A.3) 4 Ls s T s (A.4) 1/7 a 0.58 a (clear skies) (A.5) c 0. c ac a 84 (cloudy skies) (A.6) c T t W/m 2 K 4 (Stefan-Boltzmann) St 1360 T t sin( e) (A.7) global short wave on horizontal surface (W/m 2 ). T t Ratio of potential to measured daily global solar radiation (MJ) sin( ) sin sin cos cos cos0.2618( o) (A.8) e : solar elevation angle t : hour of the day t o : time of solar noon (= 12) : latitude a s for crops (Monteith, 1975), 0.7 for dry bare surface, and 0.88 for bare surface in field capacity (Idso et al.,1975) solar declination sin sin J sin J (A.9) J Day of the year 451
468 POSTER Ground Heat Flux calculation is as follows : T G k T, z 0 (A.10) z Latent Heat Flux calculation is as follows : * E K h ( T s ) h r a (A.11) Sensible Heat Flux calculation is as follows : H K hr ( T s T a ) (A.12) K hr K h K r (A.13) K r Radiative conductance (J/m 2.s.K) 4 Ta 3 Kr s K h : Boundary layer conductance (J/m 2.s.K) * K h ln k C h u z d z h z h h (A.14) C h : 1200 J/m 3.K (volumetric specific heat of air) k : Von Karman constant ( assumed = 0.4) z : Height of the surface at which temperature and wind speed measured (m) z h : Surface roughness parameter for heat h : Stability correction factor for heat T a : Air Temperature (K) T s : Surface Temperature (K) * u : friction velocity (m/s) * k u u (A.15) z d z ln m m z m z m : surface roughness parameter for momentum m : stability correction factor for momentum For typical crop surfaces : d h (A.16) zm h (A.17) z h 0. 2 z m (A.18) where h (m)is height of the roughness element (height of the crop). to calculate m and h which is formulated as : k z gr K h ( T s T a ) (A.19) * 3 C h ( T a 273) u 452 Stability parameter is needed
469 POSTER For stable condition ( T s < T a ), H (-), (+) m h 4. 7 (A.20) For unstable condition ( T s > T a ), H (+), (-) h 2 ln (A.21) 2 m 0. 6 h (A.22) REFERENCES [1] R.G. Allen, L.S. Pereira, D. Raes, and M. Smith, Crop Evapotranspiration: Guidelines for Computing Crop Water Requirements, Rome: Food and Agriculture Organization of the United Nations, [2] Ardiansyah, S. Shiozawa, and K. Nishida, Thermal Properties and Shrinkage-Swelling Charateristic of Clay Soil in a Tropical Paddy Field, Journal of the Japanese Society of Soil Physics, vol. 110, Nov. 2008, pp [3] Ardiansyah, Ismangil, Masrukhi, and K. Wijaya, Sensitivitas Parameter Lingkungan pada Prediksi Emisi Gas Metana (CH4) dan Dinitrogen Oksida (N2O) menggunakan Jaringan Syaraf Tiruan, Prosiding Seminar Nasional HITI 2013, Purwokerto: Himpunan Ilmu Tanah Indonesia, [4] J. Ben-Asher, A.D. Matthias, and A.W. Warrick, Assessment of Evaporation from Bare Soil by Infrared Thermometry, Soil Sci Soc Am J, vol. 47, Mar. 1983, pp [5] G.S. Campbell and J.M. Norman, An Introduction to Environmental Biophysics, Springer, [6] G. Campbell, Soil Physics with Basic: Transport Models for Soil-Plant Systems, Amsterdam ;;New York: Elsevier, [7] S.R. Evett, A.D. Matthias, and A.W. Warrick, Energy Balance Model of Spatially Variable Evaporation from Bare Soil, Soil Sci Soc Am J, vol. 58, Nov. 1994, pp [8] R.J. Haynes, Mineral Nitrogen in the Plant-Soil System, Academic Pr, [9] J.H. Mathews and K.D. Fink, Numerical Methods Using Matlab, Pearson Prentice Hall, [10] T.R. Oke, Boundary Layer Climates, Methuen, [11] G.Y. Qiu, J. Ben-Asher, T. Yano, and K. Momii, Estimation of Soil Evaporation Using the Differential Temperature Method, Soil Sci Soc Am J, vol. 63, Nov. 1999, pp
470 POSTER 454
471 POSTER HYDRAM PUMP FOR WATER SUPPLY AT BANTERAN VILLAGE, SUMBANG SUB-DISTRICT, PURWOKERTO Putri Rieski Imanda 1, Reza Kusuma N 1, Ardiansyah 1, and Afik Hardanto 1 1) Agriculture Engineering Department, Jenderal Soedirman University, Purwokerto, Indonesia. ard@unsoed.ac.id. ABSTRACT Banteran Village is an area that topographically higher elevation than surrounding areas. The elevation made it has difficulties in obtaining water. Available water in surrounding areas consists of two sources. They are surface water from river and spring water, which recognized for it s good quality. Meetings were held with the villagers to listen their needs and find solutions for clean water provision. Chances are all open to any pumping technology. However, Hydraulic Ram Pump is the most appropriate in the point of view of green energy, simplicity, and cost saving. The project is planned by both parties i.e, university team and villagers to develop hydraulic ram pumping system that move water from spring across the river into the village of Banteran. Positive respond were shown from villagers in their participation to the project (labor etc.). During the activity, villagers create their own organization for maintenance and manage the clean water infrastructure after the project being realized. Key words: Clean Water Project, Hydram Pump, Participatory Rural Appraisal INTRODUCTION Banteran Village lies in the Latitude of 7 22' 13.28" S, ' 18.95" E (Fig. 1). About 9 km from Jenderal Soedirman University. This village has 154 person and the elevation of residential area is about 241 asl. Due to the topographical nature of Banteran Village, this area has difficulty to get water for household activity and for consumption, especially in dry season. Villagers utilize irrigation water for washing their clothes, dishes, and vehicles and other domestic use. For human consumption (cooking and drinking), they buy water in the bottle package of 19 liter. The river that lies in the border of the village is one of the water source that available. Another source is spring water in the village across with the elevation about 233 a.s.l. According to villager, the spring water could give water as much as 1 liter/second, even in dry season. The quality has not been tested yet in the laboratory, however, visual appearance and the taste indicate that it is clean water for human consumption. As the spring water in the earth is plenty (about 30% from total fresh water available in the earth) (Shiklomanov and Sokolov, 1983), the usage of the source for Banteran Village is potential. 455
 was chosen because of several considerations. Firstly, hydram doesn t require electricity to work, it only require water (green energy).")
472 POSTER Fig. 1. Location of Banteran Village Appropriate technology should be applied to pump the water to the village. For this purpose, Hydraulic Ram Pump (subsequently : hydram) was chosen because of several considerations. Firstly, hydram doesn t require electricity to work, it only require water (green energy). Secondly, it is simple, yet proven technology that can be learned by villager easily. The maintenance of the technology can be done by villager itself. Thirdly, the topographic of the village is suitable for application of hydram. The aim of this writing is to provide information on hydram from socio-engineering point of view and to describe the running of the project of clean water provision in Banteran Village. HYDRAM THEORY Hydram make use of the sudden stoppage of flow in a pipe to create an high pressure surge, that is commonly known as water hammer. The high pressure is a head to pump water to different location or event location in higher elevation from the pump. Theoretically, the pressure rise cause by sudden stop of the flow can be describe by the equation of : V.C ΔH = (1) g where ΔH is pressure head rise, (m), V is velocity in the drive pipe (m/s), C is speed of acoustic wave in in the fluid (m/s), and g is gravitational acceleration ( 9.8 m/s 2 ). Speed of acoustic wave in fluid is formulated as (David and Edward, 1985) : 0.5 Ev C = (2) ρ where E is elasticity module of water that is v value of C, thus, is 1440 m/ s x10 2 N / m, ρ is water density ( kg / m ). The 456
473 POSTER Fig. 2. A Typical Hydram Installation Pumping cycle of hydram starts since the waste valve open. Supply tank provide water to hydram through drive pipe in a velocity that accelerates according to equation : 2 V H M 2g L dv g dt where L is length of the drive pipe (m), V is velocity of flow in pipe (m/s) and t is time (s), while total head loss by friction. (3) 2 V M is 2 g This water, then leaves the pump through waste valve. The acceleration creates force to close waste valve. By regulating the weight of waste valve, the cycle of opening and closing could occur, thus it could deliver water to header tank. The principal of opening and closing waste valve weight is it equal to water pressure in the pump. The equation describing this process is : where V Fd = Cd.Av.ρw. (4) 2g d density ( F is the force to move waste valve (N), 3 kg / m ), and C d is coefficient of waste valve. A is the area of waste valve ( m ), v 2 ρ w is water METHOD Method used for development of the hydram pump installation is Participatory Rural Appraisal (PRA), that involved knowledge and opinion of rural people for planning and development (Chambers, 1983). By using this method, it is hoped that villagers feel their communal ownership on the facility being build. Moreover, it is hoped that the villager can maintain the facility by themselves after the project finish. 1. Meeting with Villagers Conversation to the villagers were done in the meeting of neighborhood association (rapat RT). During the meeting, university team (consists of students and supervisor) ask the villagers about what the villager s expectations on the clean water project. Understandings were made on what the project s targets are, how the project will be carried out, and how the villager can maintain sustainability of clean water provision after university team finish their work share. 457
474 POSTER 2. Field Observation and Measurement University team, with some villagers and head of neighborhood association conducted some measurements for placing hydram installation, i.e. : elevation of spring water source, elevation of village, possible Drive Head (H, height of beginning of drive pipe) and possible Delivery Head (H d, height of end of delivery pipe). Observation of spring water source were also done to estimate discharge for supply water tank. 3. Build Supply Tank Tower Supply tank tower require concrete material for it will hold 500 liter of water. The height of the tower should be lower than water source to let the water flow from water source to supply tank. 4. Hydram Pump Installation Hydram pump installation begins from installation of pipe from water source to supply tank. Subsequently, the installation of drive pipe which flows water from supply tank to hydram. Finally the installation continues to assembly delivery pipe from hydram pump to header tank. Adjustment should be made to waste valve weight to make hydram starts it s cycle. Adjustment should also made to stroke length of the waste valve. DISCUSSION Field observation and measurement resulting coordinate data for placing hydram pump infrastructure. The infrastructure consist of : Water Source, Supply Tank, Hydram Pump, and Header Tank. Geographic coordinate for each infrastructure are : a. Water Source = 233 a.s.l N , E , Zone : 49S (7 22' " S, ' " E) b. Supply Tank = 238 a.s.l N , E , Zone : 49S (7 22' " S, ' " E c. Hydram Pump = 224 a.s.l N , E , Zone : 49S (7 22' " S, ' " E) d. Header Tank = 241 a.s.l N , E , Zone : 49S (7 22' " S, ' " E) Technical Analysis Several calculations were made for hydram installation. For the purpose of the calculation, we made Hydram Calculator. It requires parameter input and resulting prediction on output parameter like, discharge in the header tank. The calculator were made from Microsoft Excel and Visual Basic editor. Some fluid mechanics equations were adopted in Visual Basic function. The calculation shows that the input in drive pipe of 1 liter/sec resulting delivery discharge of 0.8 liter/sec. 458

475 POSTER Fig. 3. Hydram Calculator Economic Analysis If capacity of hydram is 1 liter/sec, therefore within a single day, it can pump water up to 86,400 liters water. Demand of water for daily needs in the village is 10 liter/person. For the whole village, demand for daily consumption is : = 154 person x 10 liter/person = 1,540 liter of water Even if the capacity of hydram reduces by half (0.5 liter/sec), it still can meet the demand of the village. In dry season, villagers usually buy water for consumption at a price of Rp. 4000/package. Indonesian recognizes this package as gallon (Indonesian drinking water gallon) which contain 19 liter of water. One person require ±1.5 liter/day, thus the water needed for daily consumption is : = 1.5 liter/day/person x 154 person = 231 liter/day Amount of gallon needed a day for the whole village is : = 231 liter/day / 19 liter/gallon = ± 12 gallon We can calculate saving of the village each day after using water from hydram is : = 12 gallon x Rp. 4000/gallon = Rp. 48,000 CONCLUSIONS The aim of this writing is to provide information on hydram from socio-engineering point of view and to describe the running of the project of clean water provision in Banteran Village To conclude, hydram was already been build in Banteran Village in cooperation with the villager as the end user of the facility. At the end of the project, villager creates their own organization to manage and maintain the facility. The organization ensures that the project was highly beneficial and also ensures sustainability of the clean water provision. ACKNOWLEDGMENT Authors would like to thank to Directorate General of Higher Education (DGHE) for the financial support of this project. Authors would also express gratitude to Jenderal Soedirman University for technical and financial assistance during the project. 459
476 POSTER REFERENCES [1] David, J.P. and Edward, H.W., 1985, Schaum's Outline of Theory and Problems of Fluid Mechanics and Hydraulics, SI (Metric) Edition, McGraw-Hill Book Company, Singapore. [2] Chambers, R Rural Development: Putting the Last First. Longmans [3] Shiklomanov, I. A., & Sokolov, A. A Methodological basis of world water balance investigation and computation. Paper presented at the New Approaches in Water Balance Computations. International Association for Hydrological Sciences Publ. No. 148, Humburg. 460
477 POSTER ISOLATION AND IDENTIFICATION OF INDIGENOUS MICROBE FOR PRODUCTION OF BIOETHANOL FROM NYPA FRUTICANS Wiludjeng Trisasiwi 1, Gunawan Wijonarko 2, and Melisa Riska Putri 3 2) Lecturer of Agriculture Engineering Department, Jenderal Soedirman University, Purwokerto, Indonesia. 3) Lecturer of Food Technology and Science Department, Jenderal Soedirman University, Purwokerto, Indonesia. 4) Graduated student from Food Technology and Science Department, Jenderal Soedirman University, Purwokerto, Indonesia. wiludjengsiwi@yahoo.com ABSTRACT Bioethanol is ethanol made by fermentation processes from materials containing sugar with the help of microbes. One of the plants that produce sap, the fluid is extracted from plants that contain sugar, and the potential for bioethanol feedstock is Nypa fruticans. This plant is a species of palm, live in coastal areas or tidal area and is a mangrove plant, containing 10-20% total sugar. In the bioethanol fermentation process takes microbes, either bacteria or yeast, which can be obtained on the market, such as Saccharomyces Cereviciae or Zymmomonas mobilis. In addition to the two kinds of microbes, there are also indigenous microbes derived from the plant, or from areas where the growth of plants producing ethanol. Performance of indigenous microbes is expected to better than the common microbes that exist in the market. Therefore this study aimed to isolate and identify the indigenous microbes derived from Nypha fruticans sap to ferment process in producing bioethanol from Nypa fruticans sap. The result of this study found 6 types of bacterial isolates and isolates 5 different molds and yeast, which potentially to ferment ethanol from Nypa fruticans sap. Based on the identification of colony morphology and Gram staining, isolates belonging to the genus Leuconostoc (A1), the genus Acetomicrobium (A2), the genus Ilyobacter (A3), the genus Halobacteroides (A4), the genus Bacillus (A5), and the genus Zymomonas (A6). A6 isolates were Zymomonas, capable of producing the highest ethanol %, potentially to be used in the production of bioethanol. Key words: bio-ethanol. microbe, indigenous, fermentation, Nypa fruticans INTRODUCTION Currently commonly fuel used for motor vehicles is gasoline and diesel fuel that come from fossil energy that takes long time to produce, so that categorized non-renewable fuels. The existence of this fossil energy is depleted, therefore it s necessary effort to find a replacement. Research to find alternative fuel sources that can replace or substitute petroleum energy has been done. One type of material which potential to be developed as an alternative and renewable energy is bio-ethanol which is ethanol produced from sugar fermentation by microbial (Aristidou and Penttila, 2000). 461
.")

478 POSTER Indonesia has a biodiversity that can be utilized as a source of bioethanol as a renewable energy, one of which is fluid sap tapped from palmae trees (Tarwiyah, 2011). One type of palm tree that can be used as a source of bio-ethanol is a plant Nypa fruticans (Trisasiwi and Wijonarko, 2012). Nypa fruticans is a kind of palm which grows in the mangroves or tidal areas near the coast. Nypa fruticans containing 10-20% total sugars thus potentially be used as raw material for producing ethanol. Indonesia has a Nypa fruticans forest around 0.75 to 1.35 million hectares, and has the potential to produce bioethanol by 4000 l / ha x 0.75 million ha or at 3 million kilo liter (Agushoe, 2009). Figure 1. Nypa fruticans. 462 Figure 2. Nypa fruticans fruit ready to be tapped. Ethanol can be produced by fermentation of several materials with the help of microbes, as a producer zimosa and invertase enzyme catalyzing biochemical reactions to changes in organic substrates. State zimase anaerobic enzymes can function as a solver of sucrose into monosaccharides (glucose and fructose) and invertase enzyme serves to convert glucose into ethanol by releasing energy and (Iryani and Utami, 2009). Microbes required in the production of ethanol. One type of yeast microbes that may contribute to the alcoholic fermentation, the main product of metabolism is ethanol (Kasimbar, 2010). Yeast species that can grow on coconut sap and is a major yeast in the fermentation process of sap are: Saccharomyces Cereviciae, and Saccharomyces carlbergensis alcoholophila var. Microbes are required for ethanol fermentation, can be purchased in the market. In addition microbe types sold in the market there are microbes that produced from raw materials or the environment
479 POSTER where the growth of Nypa fruticans plants. Indigenous microbes are expected to have better performance in producing ethanol than the common microbes in the market. Therefore it is necessary for the isolation and identification of indigenous microbes. in palm sap that can potentially produce ethanol. Microbes are required for ethanol fermentation, can be purchased in the market. In addition miroba types sold in the market there are microbes that produced from raw materials or the environment where the growth of palm plants. Indigenous microbes are expected to have better performance in producing ethanol than the common microbes in the market. Therefore it is necessary for the isolation and identification of indigenous microbes in Nypa fruticans sap that can potentially produce ethanol. The purpose of this study was to: 1) isolate and identify indigenous microbes contained in palm sap; 2) ethanol fermentation of palm using indigenous microbes resulting from the isolation and identification of microbes. PROCEDURE OF RESEARCH This research conducted at Agricultural Technology Universitas Jenderal Soedirman, Purwokerto. Samples Nypa fruticans sap derived from Nusadadi Village, District Sumpiuh, Banyumas. Samples were taken using sterile bottles then taken to the laboratory and performed the isolation and identification of bacterial isolates. Observed variables in the study include: identification of microbial morphology, Gram staining and measurement of the concentration of ethanol. Gram staining test to determine the positive or negative Gram performed by standard procedures viewed under a microscope. Gram staining procedure can be carried out in accordance with the time that is (Prescott, 2002). 30 seconds-1 minute to staining with crystal violet solution and then rinsed with running water for 2 seconds. Staining for 1 minute intended that this paint can stick perfectly to the bacterial wall (2) 1 minute for the addition of iodine solution and then rinsed well with running water, carried out for 1 minute so that the binding of color by the bacteria become stronger. (3) 1 minute done rinsing with alcohol and then rinsed with running water, carried out for 1 minute so that the dye can fade completely and there was nothing left. (4) seconds, the addition of safranin solution, then rinsed with running water (5) after it was observed under the microscope. RESULTS AND DISCUSSION Bacterial colonies growing on media contained in a variety of shapes, colors, edge and surface of the colony, as well as different elevation. From the results of morphological observation, 6 isolates of bacteria found in Nypa fruticans sap namely A1, A2, A3, A4, A5, and A6. Each isolate has a different morphology, for more detail can be seen in Table 1. Table 1. Morphological observations of bacteria Bacterial Isolate Observations A1 A2 A3 A4 A5 A6 Shape Above Edge Elevation REW L Fl R S Fl WS W A REW S ETM F Rf Y IS W Fl Colony color WM WM WM Y WM WM 463
480 etanol (%) POSTER REW: rounded edges wavy, F: Filamen, WS: wrinkled surface, R: rhizoid, IS: irregular spread, Rf: ramified, W: wavy, S: smooth, L: lobat, Fl:flat, K: krateriform, A: arise, ETM: emerge into the media, WM: white milk, Y: yellow. Isolate potential as a producer of ethanol, can be determined by fermenting Nypa fruticans sap using these isolates. Fermentation time needed is 4 days because according to Mukti (2012), the optimal incubation time is 4.6 days. Bacterial isolates obtained all able to produce ethanol, although with different levels. Levels of ethanol produced each isolate bacteria after fermentation for 4 days can be seen in Figure A1 A2 A3 A4 A5 A6 Bacterial isolate Figure 3. Ethanol produced by bacteria Based on Figure 3. A6 bacterial isolates capable of producing the highest levels of ethanol than the other isolates in the amount of %. A6 isolates the genus Zymomonas. This microbe is a bacteria which is relied upon to produce ethanol after the yeast Saccharomyces cerevisiae. Zymomonas bacteria believed to be the most ideal microorganisms producing ethanol because ethanol produces the highest, tolerant to high ethanol concentration and resistant to low ph (Herfiani, 2012). Prediction of species of bacteria isolated was based on Bergey's Manual of Determinative Bacteriology (Holt et al., 1994). A1 isolates of bacterial colonies that are white, form colonies that spread irregularly, lobat and flat with Gram positive nature, close to the genus Leuconostoc. At Bergey's Manual of Determinative Bacteriology (Holt et al., 1994). The genus Leuconostoc bacteria including Gram-positive, motile and sporulating not. These bacteria are facultative anaerobes, kemoorganotrof, provided that the medium can ferment carbohydrates rich in nutrients. Glucose is fermented and acid gases; primary results are of ethanol fermentation and D (-) - lactate. Most of the fermentation is limited to mono and disaccharide. This bacterium is able to grow optimally at temperatures of C. Catalase negative, does not hydrolyze arginine, did not reduce nitrate. Following pictures are Gram stain results on microbial. 464


, the genus Ilyobacter (A3),")
, and the genus Zymomonas (A6).")

481 POSTER A1 A2 A3 A4 A5 A6 CONCLUSSION The result of this study found 6 types of bacterial isolates and isolates 5 different molds and yeast, which potentially to ferment ethanol from Nypa fruticans sap. Based on the identification of colony morphology and Gram staining, isolates belonging to the genus Leuconostoc (A1), the genus Acetomicrobium (A2), the genus Ilyobacter (A3), the genus Halobacteroides (A4), the genus Bacillus (A5), and the genus Zymomonas (A6). A6 isolates were Zymomonas, capable of producing the highest ethanol %, potentially to be used in the production of bioethanol. 465
![POSTER Figure 5. Bacteria isolated from Nypa fruticans sap REFERENCES [1]. AGUSHOE. 2009. INDONESIA: 3 JUTA KILOLITER BIOETANOL POTENSIAL DARI TANAMAN NIPAH. (ONLINE). HTTP://AGUSHOE.WORDPRESS.COM.](/docs-images/73/68916181/images/482-0.jpg "ACCESSED 1 JUNE 2013. [2]. Aristidou, A. and M. Penttila. 2000. Metabolic engineering applications to renewable resource utilization. Current opinion in biotechnology. Vol. 1 1 (2): 1 87-198 [3].")
![Bandini, Y. 1996. Nipah Pemanis Alami Baru. PT. Penebar Swadaya, Jakarta. [4]. Herfiani, M. I. 2012. Produk Ramah Lingkungan (online). http://intanmayaherfiani.blogspot.com/2012_11_01_archive.html.](/docs-images/73/68916181/images/482-1.jpg "Accessed 13 June 2013. [5]. Hidayat, N., M. C. Padaga, and S. Suhartini. 2006. Mikrobiologi Industri. Penerbit ANDI, Yogyakarta. [6]. Holt. G., Kreig, N. R., Sneath, P. H. A., Stanley, J. T.")
482 POSTER Figure 5. Bacteria isolated from Nypa fruticans sap REFERENCES [1]. AGUSHOE INDONESIA: 3 JUTA KILOLITER BIOETANOL POTENSIAL DARI TANAMAN NIPAH. (ONLINE). ACCESSED 1 JUNE [2]. Aristidou, A. and M. Penttila Metabolic engineering applications to renewable resource utilization. Current opinion in biotechnology. Vol. 1 1 (2): [3]. Bandini, Y Nipah Pemanis Alami Baru. PT. Penebar Swadaya, Jakarta. [4]. Herfiani, M. I Produk Ramah Lingkungan (online). Accessed 13 June [5]. Hidayat, N., M. C. Padaga, and S. Suhartini Mikrobiologi Industri. Penerbit ANDI, Yogyakarta. [6]. Holt. G., Kreig, N. R., Sneath, P. H. A., Stanley, J. T. & Williams, S. T BergeysManual Determinative Bacteriology. Baltimore: Williamn and Wilkins Baltimore. Rengpipat, S. S., Rukpratatabporn, S., Piyatiratitiv. [7]. Iryani, D. A.and H. Utami Hidrolisis Residu Rumput Laut Limbah Industri Karagenan (Eucheuma spinosum) Untuk Menghasilkan Glukosa Sebagai Bahan Baku Bioetanol. Universitas Negeri Lampung, Lampung.sari/2012/04/26/biokimia-piruvat/. Diakses tanggal 25 Desember [8]. Mukti, A. A Pengaruh Konsentrasi Starter Dan Lama Inkubasi Terhadap Produksi Bioetanol Dari Nira Nipah Menggunakan Saccharomyces cerevisiae (Tesis). Fakultas Pertanian Universitas Jenderal Soedirman, Purwokerto. [9]. Tarwiyah Teknologi Tepat Guna Agroindustri Kecil Sumatera Barat. Dewan Ilmu Pengetahuan, Teknologi dan Industri, Sumatera Barat. [10]. Trisasiwi, W and G. Wijonarko Isolasi dan Karakterisasi Mikroba Pada Nira Nipah Sebagai Bahan Baku Bioetanol. Prosiding Seminar Nasional Pengembangan Sumber Daya Pedesaan dan Kearifan Lokal Berkelanjutan II, November 2012, Purwokerto P
ICSRD 2013 PROCEEDINGS "Sustainable Rural Development - Towards a Better World"
 ISBN: 978-979-99046-5-2 ICSRD 2013 PROCEEDINGS "Sustainable Rural Development - Towards a Better World" Editorial Boards: 1. Prof. Robert C. Creese, Ph.D. PE. CCE./ West Virginia University, USA 2. Prof.
CSRD 2013 PROCEEDI GS "Sustainable Rural Development - Towards a Better World"
 ISBN: 978-979-99046-5-2 CSRD 2013 PROCEEDI GS "Sustainable Rural Development - Towards a Better World" Editorial Boards: 1. Prof. Robert C. Creese, Ph.D. PE. CCE.I West Virginia University, USA 2. Prof.
Volume -1, Issue-4 (October-December), 2013 Available online at popularkheti.info
, 2013 Available online at popularkheti.info") Popular Kheti Volume -1, Issue-4 (October-December), 2013 Available online at www.popularkheti.info 2013 popularkheti.info Intercropping: An Alternative Pathway for Sustainable Agriculture Priyanka Gautam
Popular Kheti Volume -1, Issue-4 (October-December), 2013 Available online at www.popularkheti.info 2013 popularkheti.info Intercropping: An Alternative Pathway for Sustainable Agriculture Priyanka Gautam
HOW OUR FOOD IS GROWN
 OPEN TO YOUR QUESTIONS ABOUT HOW OUR FOOD IS GROWN Genetically modified organisms (GMOs) are a major topic of discussion today. Across our society, media and the Internet, a growing number of people have
Cassava Climate-Smart Agriculture Practices at Yen Binh District, Yen Bai Province, Vietnam
 International Journal of Political Science (IJPS) Volume 2, Issue 4, 2016, PP 28-33 ISSN 2454-9452 http://dx.doi.org/10.20431/2454-9452.0204003 www.arcjournals.org Cassava Climate-Smart Agriculture Practices
The Green Revolution
 The Green Revolution Since the 1950s, most increases in global food production have come from increased yields per unit area of cropland. This green revolution has been brought about through the development
Liquid Biofuels for Transport
 page 1/11 Scientific Facts on Liquid Biofuels for Transport Prospects, risks and opportunities Source document: FAO (2008) Summary & Details: GreenFacts Context - Serious questions are being raised about
Advanced Biology: Bahe & Deken. Agriculture & Nutrition. Chapter 9. Text Page
 Agriculture & Nutrition Chapter 9 Text Page - 107 - 9.1 Strategy of Agriculture What does it take to put food on the table at your house? Think about this question in terms of economics, energy, and ecology.
CHAPTER 49 ECOSYSTEMS
 CHAPTER 49 ECOSYSTEMS I. INTRODUCTION A. An ecosystem 1. Whereas a community consists of all the organisms in a certain boundary that are close enough for some sort of interaction, an ecosystem: -is defined
Advisor. Government of India Ministry of Environment and Forests New Delhi
 Biofuels Sustainable Production and Use Dr G.V. Subrahmanyam Advisor Government of India Ministry of Environment and Forests New Delhi Need for Bioenergy Economic growth Increasing population - 1.6 % p.a.
Structural Bioinformatics (C3210) Conformational Analysis Protein Folding Protein Structure Prediction
 Conformational Analysis Protein Folding Protein Structure Prediction") Structural Bioinformatics (C3210) Conformational Analysis Protein Folding Protein Structure Prediction Conformational Analysis 2 Conformational Analysis Properties of molecules depend on their three-dimensional
Structural Bioinformatics (C3210) Conformational Analysis Protein Folding Protein Structure Prediction Conformational Analysis 2 Conformational Analysis Properties of molecules depend on their three-dimensional
6. What are the two main components of our environment? Answer. 7. Why are green plants called producers? Answer.
 Question Bank Our Environment 1. (a) What is environmental pollution? (b) Distinguish between biodegradable and non-biodegradable pollutants. (c) Choose the biodegradable pollutants from the list given
Green Chemistry Five ways in which the Chemical industry can become Greener Changing to renewable sources Use of alternatives to hazardous chemicals
 Green Chemistry Green Chemistry refers to the processes in the chemical industry that are being reinvented to make them more sustainable. The term sustain means to keep going. If we use resources faster
Soil Fertility Management. Mirza Hasanuzzaman Assistant Professor Department of Agronomy Sher-e-Bangla Agricultural University
 1 Soil Fertility Management Soil Fertility Management Mirza Hasanuzzaman Assistant Professor Department of Agronomy Sher-e-Bangla Agricultural University Introduction Can agriculture provide for the food
Lao PDR Country Paper Current Status of Agriculture Mechanization and Marketing
 Lao PDR Country Paper Current Status of Agriculture Mechanization and Marketing The 2nd Regional Forum on Sustainable Agricultural Mechanization - Enabling Environment for Custom Hiring of Agricultural
Application of biochar from coconut shells to different soils in Thua Thien Hue province, Vietnam
 Application of biochar from coconut shells to different soils in Thua Thien Hue province, Vietnam Tran Thi Tu 1), Morihiro Maeda 2), Le Van Thang 1), Nguyen Dang Hai 1), Tran Dang Bao Thuyen 1) 1) Institute
RESOURCES, OPPORTUNITIES AND IMPACTS FOR BIOENERGY DEVELOPMENT
 RESOURCES, OPPORTUNITIES AND IMPACTS FOR BIOENERGY DEVELOPMENT COMPETE Conference and Policy Debate on Biofuels Sustainability Schemes, 16th to 18th June 2008 Arusha, Tanzania Faith Odongo Senior Renewable
Master 5.1, Newspaper Articles. Special Edition December 14. Special Edition March 17
 Master 5.1, Newspaper Articles THE DAILY HERALD Special Edition December 14 Study Forecasts Future Food Shortage A new study published in the Journal of World Agriculture raises concerns that in the future
CLIMATE SMART AGRICULTURE
 2017 CLIMATE SMART AGRICULTURE in the 2017 SAN Sustainable Agriculture Standard SAN Sustainable Agriculture Network Introduction Climate change fundamentally and increasingly affects agriculture. Warming,
Duncanrig Secondary School S3 Biology Course Commercial Use of Plants Homework Booklet
 Duncanrig Secondary School S3 Biology Course Commercial Use of Plants 0 Homework Booklet 1 Introduction As we have learned, fossil fuels contribute to global warming, supplies are dwindling and more eco-friendly
Ecosystems. Trophic relationships determine the routes of energy flow and chemical cycling in ecosystems.
 AP BIOLOGY ECOLOGY ACTIVITY #5 Ecosystems NAME DATE HOUR An ecosystem consists of all the organisms living in a community as well as all the abiotic factors with which they interact. The dynamics of an
SUSTAINABLE AGRICULTURE. Professor PhD GABRIELA TEODORESCU, Romania
 SUSTAINABLE AGRICULTURE Professor PhD GABRIELA TEODORESCU, Romania INTRODUCTION The main objective of this project is to promote the sustainable agriculture has become key words to horticultural and agricultural
background info: organic agriculture
 natural/organic food background info: organic agriculture organic farming in Africa There are two levels of organic farming in Africa, certified organic production and non-certified or agro-ecological
CHAPTER 4 : AGRICULTURE
 I. ECONOMIC ACTIVITIES:- ITL Public School Social Science Hand Out (2017-18) Class VIII Subject: Geography Instructions For each questions value points are given from the content. Frame the sentences of
Biobased Product Testing
 Biobased Product Testing Analytical Background: The Carbon Cycle The carbon cycle is a biogeochemical system or cycle through which carbon is exchanged among the biosphere, pedosphere, geosphere, hydrosphere
Sustainable land management and soil productivity improvement in support of food security in sub- Saharan Africa
 Sustainable land management and soil productivity improvement in support of food security in sub- Saharan Africa Introduction Need for action for sustainable land management and soil productivity improvement
Plant Growth and Soil. Soil Science for Crop Production 1
 Plant Growth and Soil Soil Science for Crop Production 1 Territory of Soil Scinece for Crop Production Production Techniques Production Environment Basis Food Crop Forage Crop Industrial Crop Horticulture
THE SOCIAL AND ENVIRONMENTAL BENEFITS FROM CROP
 THE SOCIAL AND ENVIRONMENTAL BENEFITS FROM CROP BIOTECHNOLOGY IN BRAZIL: 1996/97 2010/11 The case of GM cotton The case of GM corn The case of herbicide- tolerant soybeans Preface This document aims at
World Economic and Social Survey (WESS) 2011: The Great Green Technological Transformation
 2011: The Great Green Technological Transformation") World Economic and Social Survey (WESS) 2011: The Great Green Technological Transformation Chapter I: Why a green technological transformation is needed Chapter II: The clean energy technological transformation
World Economic and Social Survey (WESS) 2011: The Great Green Technological Transformation Chapter I: Why a green technological transformation is needed Chapter II: The clean energy technological transformation
Plant Growth and Soil
 Plant Growth and Soil Kiyoshi Tsutsuki http://timetraveler.html.xdomain.jp Techniques Environment Basis Territory of Soil Scinece for Crop Plant Protection Plant Breeding Food Crop Forage Crop Industrial
Compare body symmetry, movement, and organ systems in various animals. Consider some causes and effects of variation in the animal kingdom.
 Animals In Animals, students learn classification systems and the place of animals (including humans) within them. They explore physical and lifestyle characteristics of invertebrates and vertebrates through
3rd International Conference on Mechanical Engineering and Intelligent Systems (ICMEIS 2015)
") 3rd International Conference on Mechanical Engineering and Intelligent Systems (ICMEIS 2015) The Key Technology Research on Automatic Monitoring and Remote Controlling of Water and Fertilizer on Banana
3rd International Conference on Mechanical Engineering and Intelligent Systems (ICMEIS 2015) The Key Technology Research on Automatic Monitoring and Remote Controlling of Water and Fertilizer on Banana
Let s make our Planet Clean & Green for the Next Generation!!!
 Let s make our Planet Clean & Green for the Next Generation!!! 100% BIODEGRADABLE & COMPOSTABLE PLASTIC PRODUCTS FOR A SAFER AND CLEANER ENVIRONMENT FOR A SAFER AND CLEANER ENVIRONMENT CEO. B. Subramanian.
Technical Cooperation Project
 Biomass Town Workshop 27 Feb. 2010 Partnership Program (JPP) Technical Cooperation Project for Improving Rural Living and Nature Conservation by Multipurpose Use of Charcoal and Wood Vinegar in Bach Ma
Thematic Brief 2 Water Productivity
 Thematic Brief 2 Water Productivity Brief prepared for the Entry phase of the project: Strengthening Agricultural Water Efficiency and Productivity on the African and Global Level The Project The GCP/INT/166/SWI
Prospects of Nature Farming for Rice Production in Indonesia M. S. Wigenasantana and T. Waluyo National University, Jakarta, Indonesia
 Prospects of Nature Farming for Rice Production in Indonesia M. S. Wigenasantana and T. Waluyo National University, Jakarta, Indonesia Abstract Increased rice production is urgently needed in Indonesia
Legumes are the 3 rd largest family of flowering plants
 What s a Pulse? Legumes are the 3 rd largest family of flowering plants Second only to grasses in agricultural importance Keystone family for nutrition Pulses are legumes of which we eat the seed Why legumes?
The Asia-Pacific Natural Agriculture Network (APNAN): A Case Study for Regional Research Kyusei Nature Farming Development of EM Technology
: A Case Study for Regional Research Kyusei Nature Farming Development of EM Technology") The Asia-Pacific Natural Agriculture Network (APNAN): A Case Study for Regional Research T. Hussain, G. Jilani, M. Yaseen and M. A. Abbas Department of Sod Science University of Agriculture, Faisalabad
The Asia-Pacific Natural Agriculture Network (APNAN): A Case Study for Regional Research T. Hussain, G. Jilani, M. Yaseen and M. A. Abbas Department of Sod Science University of Agriculture, Faisalabad
Municipal Solid Waste Used As Bioethanol Sources And Its Related Environmental Impacts
 Proceedings of the Annual International Conference on Soils, Sediments, Water and Energy Volume 13 Article 12 January 2010 Municipal Solid Waste Used As Bioethanol Sources And Its Related Environmental
Product Category Rules (PCR) (Approved PCR ID: PA-AA-01)
 (Approved PCR ID: PA-AA-01)") (Provisional Translation) Product Category Rules (PCR) (Approved PCR ID: PA-AA-01) PCR Name: Nonglutinous Rice (Japonica) Release Date: September 4, 2009 CFP Calculation and Labeling Pilot Program *The
(Provisional Translation) Product Category Rules (PCR) (Approved PCR ID: PA-AA-01) PCR Name: Nonglutinous Rice (Japonica) Release Date: September 4, 2009 CFP Calculation and Labeling Pilot Program *The
Development of SRI (System of Rice Intensification) KSP 1 Tirtabumi, Cikoneng, Ciamis District, West Java By Enceng Asikin 2 and Koeswara 3
 KSP 1 Tirtabumi, Cikoneng, Ciamis District, West Java By Enceng Asikin 2 and Koeswara 3") Development of SRI (System of Rice Intensification) KSP 1 Tirtabumi, Cikoneng, Ciamis District, West Java By Enceng Asikin 2 and Koeswara 3 Background: The Farmers got idea of the developing of SRI in
Development of SRI (System of Rice Intensification) KSP 1 Tirtabumi, Cikoneng, Ciamis District, West Java By Enceng Asikin 2 and Koeswara 3 Background: The Farmers got idea of the developing of SRI in
Strategic Rice Cultivation for Sustainable Low Carbon Society Development in South East Asia
 Strategic Rice Cultivation for Sustainable Low Carbon Society Development in South East Asia Dr Sebastien Bonnet The Joint Graduate School of Energy and Environment Capacity Building Workshop on: Strategic
Biofuels and Food Security A consultation by the HLPE to set the track of its study.
 Biofuels and Food Security A consultation by the HLPE to set the track of its study. Discussion No. 80 from 8 to 28 May 2012 In October 2011, the CFS has recommended that appropriate parties and stakeholders
Your Excellency Yingluck Shinawatra, Prime Minister of the Kingdom of Thailand. Excellencies, Heads of Delegations, Ladies and Gentlemen,
 Statement by H.E. Mr. Susil Premajayantha Minister of Environment and Renewable Energy of the Democratic Socialist Republic of Sri Lanka delivering on the occasion of the 2 nd Asia-Pacific Water Summit
Biotechnology and Genetically Modified Crops
 Biotechnology and Genetically Modified Crops Suggestions for Your Presentation Use a Video to start your presentation. A couple of videos were provided with this slide deck that could be used or use another
Sustainable Bioenergy Feedstock
 Sustainable Bioenergy Feedstock The major political and social issues surrounding bioenergy or biofuels relate to three key areas: The impacts of Feedstock Production Calculation of Greenhouse Gas (GHG)
Conservation Agriculture. Carbon Sequestration
 Conservation Agriculture & Carbon Sequestration Conservation Agriculture Conservation Agriculture is a concept for resource-saving agricultural crop production that strives to achieve acceptable profits
Sustainable Biofuel Development Policies, Programs, and Practices in APEC Economies
 Sustainable Biofuel Development Policies,, and Practices in APEC Economies Asia Pacific Economic Cooperation Project No: EWG 19//2009 November 2010 Report prepared by Winrock International Objectives Survey
From the Ground Up- Field Soil Considerations
 From the Ground Up- Field Soil Considerations Ted Bilderback Nursery Extension Specialist Department of Horticulture Science North Carolina State University Ted_Bilderback@ncsu.edu http://www.ces.ncsu.edu/depts/hort/nursery/
Bio-Based Eco Industrial Clustering in Dambulla Sri Lanka
 Bio-Based Eco Industrial Clustering in Dambulla Sri Lanka Gemunu Herath and Uditha Ratnayake Department of Civil Engineering University of Peradeniya Sri Lanka Gemunu 1 Country Profile Sri Lanka Population
1 Environmental Problems
 CHAPTER 21 1 Environmental Problems SECTION Environmental Problems and Solutions BEFORE YOU READ After you read this section, you should be able to answer these questions: What is pollution? What are some
ACTIVE HUMIC TECHNOLOGY
 www.organocat.com ACTIVE HUMIC TECHNOLOGY ACTIVE HUMIC TECHNOLOGY What are Humic Substances? Humic Substances are very stable, organic compounds found in brown and oxidized black coal, peat, manure, compost,
Our Environment. Biodegradable and Non-biodegradable Wastes. Ecosystem BIOLOGY OUR ENVIRONMENT. Types of Ecosystem NON-BIODEGRADABLE WASTES
 Our Environment Biodegradable and Non-biodegradable Wastes BIODEGRADABLE WASTES They can be broken down into nonpoisonous substances by the action of microorganisms. They change their form and structure
SECTOR ASSESSMENT (SUMMARY): AGRICULTURE, NATURAL RESOURCES, AND RURAL DEVELOPMENT 1
: AGRICULTURE, NATURAL RESOURCES, AND RURAL DEVELOPMENT 1") Country Partnership Strategy: Timor-Leste, 2016 2020 SECTOR ASSESSMENT (SUMMARY): AGRICULTURE, NATURAL RESOURCES, AND RURAL DEVELOPMENT 1 A. Sector Performance, Problems, and Opportunities 1. Agriculture
Country Partnership Strategy: Timor-Leste, 2016 2020 SECTOR ASSESSMENT (SUMMARY): AGRICULTURE, NATURAL RESOURCES, AND RURAL DEVELOPMENT 1 A. Sector Performance, Problems, and Opportunities 1. Agriculture
Chapter 5. Genetically Modified Foods are Not Fearful
 Chapter 5 Genetically Modified Foods are Not Fearful The discussion of the subject of genetically modified foods has been avoided, because it has delicate problems politically, economically and from various
Crop Science Society of America
 Crop Science Society of America Grand Challenge Statements Crop science is a highly integrative science employing the disciplines of conventional plant breeding, transgenic crop improvement, plant physiology,
Anticipated Responses of Agroecosystems
 Anticipated Responses of Agroecosystems Effects of enhanced CO 2 on crop growth Plants grow through the well-known process of photosynthesis, utilizing the energy of sunlight to convert water from the
Experience of Agricultural Engineering development in China
 Experience of Agricultural Engineering development in China Zhu Ming President & Research Professor 1 Introduction At the beginning of this century, the Chinese Government placed top priority on the issue
Living organisms are composed of mainly four elements: Oxygen, Carbon, Hydrogen, Nitrogen In smaller amounts: Sulfur & Phosphorus Organisms cannot
 Living organisms are composed of mainly four elements: Oxygen, Carbon, Hydrogen, Nitrogen In smaller amounts: Sulfur & Phosphorus Organisms cannot make any of these elements and do not use them up Question:
Cover Crops (Section 6.3)
") Cover Crops (Section 6.3) Conceptually they are meant to provide cover to prevent erosion during fallow periods between cash crops. They can provide a variety of benefits to the crop rotation. The intended
Cover Crops (Section 6.3) Conceptually they are meant to provide cover to prevent erosion during fallow periods between cash crops. They can provide a variety of benefits to the crop rotation. The intended
Sustainable Biofuels Development Practices
 2011/SOM1/EWG/EGNRET/012 Sustainable Biofuels Development Practices Submitted by: EGNRET Secretariat Energy Working Group New and Renewable Energy Technologies Expert Group Meeting Washington, D.C., United
Sustainable Eating. With Chef Jessica VanRoo October 26, 2011
 Sustainable Eating With Chef Jessica VanRoo October 26, 2011 What is sustainable eating? Make decisions based on the path your food took Impacts include global warming, loss of biodiversity, air and water
Energy Food Nexus: Case of Rice production in Mekong Region
 Energy Food Nexus: Case of Rice production in Mekong Region Dr. Abdul Salam Associate Professor Energy Field of Study Asian Institute of Technology (AIT) Thailand 1 Presentation Outline Rationale Objective
Promises and Problems Associated with Agricultural Biotechnology
 Workshop A Promises and Problems Associated with Agricultural Biotechnology DONALD P. WEEKS University of Nebraska Lincoln Lincoln, NE Participants in Workshop A addressed the following questions: What
Who cares? You do! In India, one child dies every minute from severe acute malnutrition.
 Soil & Agriculture Who cares? You do! In India, one child dies every minute from severe acute malnutrition. Case Study: The Dust Bowl In the dirty thirties a large area of cropland was abandoned due to
Prepared by Mark Bell, Amanda Crump, Nick Madden and Maria Paz Santibanez 2012 For more information visit: International Programs ip.ucdavis.
 Cropping 101 Prepared by Mark Bell, Amanda Crump, Nick Madden and Maria Paz Santibanez 2012 For more information visit: International Programs ip.ucdavis.edu This overview provides summaries of 1. Key
Acid Rain. National Science Education Standards
 Acid Rain Grades 6-7-8-9-10 National Science Education Standards SCIENCE AS INQUIRY STANDARDS LEVELS 5-8 LEVELS 9-12 Abilities necessary to do scientific inquiry Abilities necessary to do scientific inquiry
MAIN REPORT of SOCIO ECONOMIC BASELINE SURVEY (SEBS) AND PARTICIPATORY RURAL APPRAISAL (PRA)
 AND PARTICIPATORY RURAL APPRAISAL (PRA)") FOOD AND AGRICULTURE ORGANIZATION OF THE UNITED NATIONS - ROME Special Programme for Food Security (SPFS Project GCSP/INS/073/JPN) MAIN REPORT of SOCIO ECONOMIC BASELINE SURVEY (SEBS) AND PARTICIPATORY
FOOD AND AGRICULTURE ORGANIZATION OF THE UNITED NATIONS - ROME Special Programme for Food Security (SPFS Project GCSP/INS/073/JPN) MAIN REPORT of SOCIO ECONOMIC BASELINE SURVEY (SEBS) AND PARTICIPATORY
UTILISATION OF INDUSTRIAL ENZYMES TO PRODUCE BIOETHANOL FROM AUTOCHTHONOUS ENERGY CROPS. Abstract
 I. Stroia, et all. Journal of Agroalimentary Processes and Technologies, Volume XIII, No.2 (2007), 263-270 Full Paper Food Technology and Processing UTILISATION OF INDUSTRIAL ENZYMES TO PRODUCE BIOETHANOL
Municipal Solid Waste Used as Bioethanol Sources and its Related Environmental Impacts
 International Journal of Soil, Sediment and Water Volume 1 Issue 1 Article 5 July 2008 Municipal Solid Waste Used as Bioethanol Sources and its Related Environmental Impacts Aiduan Li University College
The Roles of Biotechnology in Indonesia s Agricultural Development
 The Roles of Biotechnology in Indonesia s Agricultural Development Prof. Dr. Bustanul Arifin barifin@uwalumni.com Professor of Agricultural Economics at UNILA Professorial Fellow at InterCAFE and MB-IPB
THE INTRODUCTION THE GREENHOUSE EFFECT
 THE INTRODUCTION The earth is surrounded by atmosphere composed of many gases. The sun s rays penetrate through the atmosphere to the earth s surface. Gases in the atmosphere trap heat that would otherwise
Enhancing sustainable production adaptations for recovery in a degraded environment
 Enhancing sustainable production adaptations for recovery in a degraded environment SYNOPSIS Since the 1970s, Burkina Faso has experienced drought, which has intensified vegetation loss and erosion from
Performance of F1 Generation Compared with the Parents on Yield and Yield Component Characters in Green Super Rice Genotypes
 Scholarly Journal of Agricultural Science Vol. 3(12), pp. 541-545 December, 2013 Available online at http:// www.scholarly-journals.com/sjas ISSN 2276-7118 2013 Scholarly-Journals Full Length Research
CONCEPT OF SUSTAINABLE AGRICULTURE
 CONCEPT OF SUSTAINABLE AGRICULTURE Agriculture is the process of producing food, feed, fibre and other desired products by cultivation of certain plants and raising of domesticated animals. Agriculture
The Sugarcane: An Agriculture Aspect
 Chapter 2 The Sugarcane: An Agriculture Aspect 2.1 Introduction Sugarcane growing countries of the world are lying between the latitude 36.70 0 north and 31.00 0 south of the equator extending from tropical
Introduction to Bioenergy
 1 Introduction to Bioenergy 1. Global Warming and Carbon Cycle Carbon Cycle Carbon cycle Carbon cycle is the biogeochemical cycle by which carbon is exchanged among the biosphere, pedosphere, geosphere,
Development of Online Reference of Indonesian Rice Variety
 Development of Online Reference of Indonesian Rice Variety Setyo Pertiwi 1, A. Karim Makarim 2, Salman Widodo 1 and Bubun M. Hasbulloh 1 1 Bogor Agricultural University, Indonesia, pertiwi@bima.ipb.ac.id
Frequency of Keyword Totals - (All LE Regents Exams)
") Frequency of Keyword Totals - (All LE Regents Exams) KEYWORD COUNT KEYWORD COUNT ecosystem 58 DNA 48 energy pyramid 19 graph 19 scientific method 19 photosynthesis 43 decomposer 18 human impact 42 clone
Frequency of Keyword Totals - (All LE Regents Exams) KEYWORD COUNT KEYWORD COUNT ecosystem 58 DNA 48 energy pyramid 19 graph 19 scientific method 19 photosynthesis 43 decomposer 18 human impact 42 clone
Chemical Engineering COURSE OUTCOME
 II nd Year Chemical Engineering COURSE OUTCOME Course Name: Applied Mathematics Students expertise in solving numerical methods, Laplace transforms, Fourier Transform & Z-transform. Probability & probability
A Pocket Guide to. nutrient. stewardship
 A Pocket Guide to 4R nutrient stewardship a pocket guide to 4R nutrient stewardship Right Source Matches fertilizer type to crop needs. Right Rate Matches amount of fertilizer to crop needs. Right Time
Growth Strategy for Indian Agriculture
 Growth Strategy for Indian Agriculture Surabhi Mittal Senior Agricultural Economist CIMMYT s.mittal@cgiar.org Presentation at CPR- JCER Joint seminar, 25 November, 2013 Agriculture and India Positive and
Adaptation of life cycle assessment (LCA) to agricultural production on a regional scale in Japan
 to agricultural production on a regional scale in Japan") Ecosystems and Sustainable Development V 671 Adaptation of life cycle assessment (LCA) to agricultural production on a regional scale in Japan S. Mishima, S. Taniguchi & M. Komada National Institute for
Ecosystems and Sustainable Development V 671 Adaptation of life cycle assessment (LCA) to agricultural production on a regional scale in Japan S. Mishima, S. Taniguchi & M. Komada National Institute for
ORGANIC PGS EVALUATION
 0 POINTS 1. RECORDS 1.1 No activity records 1.2 No financial records 1.3 No farm map 2. ORGANIC INPUTS 2.1 2.2 2.3 Evidence of synthetic fertilizer application in designated organic Evidence of prohibited
Sustainable continuous crop production in a tropical environment
 Sustainable continuous crop production in a tropical environment One of the major means of increasing agricultural productivity in the tropics is through continuous cultivation. Year-round cropping is
Executive Stakeholder Summary
 Soil as a Resource National Research Programme NRP 68 www.nrp68.ch Wildhainweg 3, P.O. Box 8232, CH-3001 Berne Executive Stakeholder Summary Project number 40FA40_154247 Project title COMET-Global: Whole-farm
Norton City Schools Standards-Based Science Course of Study 2003
 HIGH SCHOOL ELECTIVE AP ENVIRONMENTAL SCIENCE (USED AS A YEAR-LONG OR BLOCK-SCHEDULED COURSE) Life Sciences Standard (LS) Earth and Space Sciences Standard (ES) 11-12 Benchmarks By the end of the 11-12
Unit 3: Matter & Energy Flow on Earth
 Unit 3: Matter & Energy Flow on Earth Objectives: E2.3c - Explain how the nitrogen cycle is part of the Earth system. E2.3d - Explain how carbon moves through the Earth system and how it may benefit or
Agricultural Development and Reduced Glasshouse Gas Emmission
 Agricultural Development and Reduced Glasshouse Gas Emmission Paper for Workshop on 22 April 2013 Hymawari, Hotel, Phnom Penh, Cambodia By Mak Soeun, PhD in Agronomy/Farming System Specialist Director
Estimating soil organic carbon sequestration change with applying modified Rothamsted Carbon model to paddy and upland fields in Japan
 1 Estimating soil organic carbon sequestration change with applying modified Rothamsted Carbon model to paddy and upland fields in Japan Haruo Tanaka a *, Miho Yoshikawa b and Masako Takeuchi c a Institute
ENERGETIC AND WATER COST RELATED TO THE CULTIVATION OF ENERGY CROPS: GENERAL PERSPECTIVES AND A CASE STUDY IN TUSCANY REGION (CENTRAL ITALY)
") ENERGETIC AND WATER COST RELATED TO THE CULTIVATION OF ENERGY CROPS: GENERAL PERSPECTIVES AND A CASE STUDY IN TUSCANY REGION (CENTRAL ITALY) Dalla Marta A., Mancini M., Orlando F., Natali F., Maracchi
ENERGETIC AND WATER COST RELATED TO THE CULTIVATION OF ENERGY CROPS: GENERAL PERSPECTIVES AND A CASE STUDY IN TUSCANY REGION (CENTRAL ITALY) Dalla Marta A., Mancini M., Orlando F., Natali F., Maracchi
Grand Challenges. C r o p S c i e n c e S o c i e t y o f A m e r i c a. Plant Sciences for a Better World
 Grand Challenges C r o p S c i e n c e S o c i e t y o f A m e r i c a Plant Sciences for a Better World Written by the Crop Science Society of America (CSSA) Grand Challenge Committee Crop Science Society
Concept of Organic Farming S S R A N A S R S C I E N T I S T
 S S R A N A S R S C I E N T I S T Concept 2 Organic farming endorses the concept that the soil, plant, animals and human beings are linked. In philosophical terms organic farming means farming in sprits
RENEWABLE ENERGY SOURCES
 RENEWABLE ENERGY SOURCES State of Renewable Energy Only 6% of energy used in U.S.; 18% of world s energy use Why so low, if most renewable energies are environmentally friendly and potentially limitless?
BC Science Nutrient Cycles in Ecosystems
 BC Science 10 2.2 Nutrient Cycles in Ecosystems Notes Nutrients are chemicals required for growth and other life processes. Nutrients move through the biosphere in nutrient cycles (n.c), or exchanges.
Soil health has three main components Sustained biological productivity Environmental quality Plant and animal health
 Soil health has three main components Sustained biological productivity Environmental quality Plant and animal health Soil health is the integration of biological with chemical and physical measures of
Background Paper. Sustainable Bioenergy cropping systems for the Mediterranean. Expert Consultation
 Background Paper Sustainable Bioenergy cropping systems for the Mediterranean Expert Consultation Introduction Bioenergy is a key issue in the context of policies to mitigate global warming, to reduce
CONFERENCE/WORKSHOP ORGANISER S REPORT
 CONFERENCE/WORKSHOP ORGANISER S REPORT 12 th International Wheat Genetic Symposium; OECD-CRP Sponsored Sessions on Wheat Research for Sustainable Food Chain, adaptation and mitigation to the Climate change
AGRICULTURE IN BANGLADESH A NOTE ON FOOD SECURITY BY ENHANCING PRODUCTIVITY
 AGRICULTURE IN BANGLADESH A NOTE ON FOOD SECURITY BY ENHANCING PRODUCTIVITY Summary Awami League s Election Manifesto 2008 appropriately recognizes the importance of ensuring food security for all in Bangladesh.
complex systems many different variables many alternative theories 1
 M.(a) any one from: complex systems many different variables many alternative theories (b) carbon dioxide allows short wavelength radiation to pass through allow greenhouse gas(es) for carbon dioxide the