SECARB Phase III Citronelle Project (Anthropogenic Test) in Alabama
|
|
|
- Brianne Andrews
- 6 years ago
- Views:
Transcription


1 SECARB Phase III Citronelle Project (Anthropogenic Test) in Alabama Dave Riestenberg, PM, ARI Rob Trautz, SR. TECH MGR., EPRI George Koperna, VP, ARI Steve Carpenter, VP, ARI 10th Annual SSEB Stakeholders Meeting 12 March 2015


2 Acknowledgement This presentation is based upon work supported by the Department of Energy National Energy Technology Laboratory under DE-FC26-05NT42590 and was prepared as an account of work sponsored by an agency of the United States Government. Neither the United States Government nor any agency thereof, nor any of their employees, makes any warranty, express or implied, or assumes any legal liability or responsibility for the accuracy, completeness, or usefulness of any information, apparatus, product, or process disclosed, or represents that its use would not infringe privately owned rights. Reference herein to any specific commercial product, process, or service by trade name, trademark, manufacturer, or otherwise does not necessarily constitute or imply its endorsement, recommendation, or favoring by the United States Government or any agency thereof. The views and opinions of authors expressed herein do not necessarily state or reflect those of the United States Government or any agency thereof.
3 Topics of Discussion 1. BRIEF Introduction 2. Monitoring & Modeling Lines of Evidence 3. AoR & Modeling Update 4. Lessons Learned 5. Questions, Answers, Discussion 3


4 Project Objectives 4 1. Support the United States largest prototype coal-fired CO 2 capture and transportation demonstration with injection, monitoring and storage activities; 2. Test the CO 2 flow, trapping and storage mechanisms of the Paluxy; 3. Demonstrate how a saline reservoir s architecture can be used to maximize CO 2 storage and minimize the areal extent of the CO 2 plume; 4. Test the adaptation of commercially available oil field tools and techniques for monitoring CO 2 storage 5. Test experimental CO 2 monitoring activities, where such technologies hold promise for future commercialization; 6. Begin to understand the coordination required to successfully integrate all four components (capture, transport, injection and monitoring) of the project; and 7. Document the permitting process for all aspects of a CCS project.

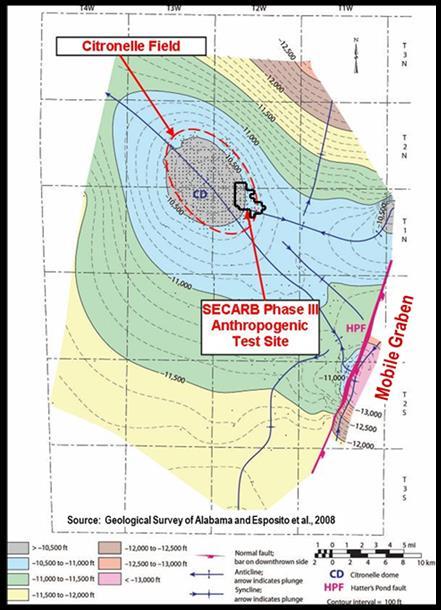
5 Storage Site: The Citronelle Oilfield 5
6 UIC Class V Permit Class V Experimental Injection Well permit Short duration of injection (3 years) and modest volumes of CO 2 Characterization and modeling of stacked CO 2 storage CO 2 injection under real world operating conditions Demonstration of experimental monitoring tools and methods Many Class VI (CO 2 sequestration well) standards were applied Injection Area of Review (AOR) determined by modeling and monitoring results (updated annually) Deep, shallow and surface CO 2 monitoring Injection stream monitoring Site closure based on USDW non-endangerment demonstration and CO 2 containment (5-yr renewal) Based on monitoring and modeling results 6
7 Storage Project Status ADEM granted permission to inject on August 8, 2012 Injection commenced on August 20, 2012 Through September 1, 2014, approximately 114 thousand metric tons of CO 2 were injected A crosswell seismic survey acquired in June, 2014 captured a time-lapse image of the CO 2 plume Other testing and monitoring activities indicate containment The project entered the Post-Injection Site Care Period in September, 2014 Site closure based on CO 2 containment and USDW nonendangerment 7

8 CO 2 Injection History 8
9 1. Monitoring & Modeling Lines of Evidence 9
10 Anthro Test MVA Program Drivers Multiple lines of evidence to confirm CO 2 containment Soil CO 2 flux and tracer monitoring Crosswell seismic and VSP Pulsed neutron capture logging (in- and above-zone saturation) USDW monitoring Assure non-endangerment of USDWs Monitoring geochemistry of shallow aquifers Test experimental methodologies Inform the reservoir simulation Above tools plus downhole pressure 10

 MBM VSP & OVSP Seismic Frequency Continuous Monthly Quarterly Annual Milestone (Baseline,")
11 MVA Elements and Frequency 11 MVA Method Shallow Soil flux Groundwater sampling (USDW) PFT survey Deep CO2 volume, pressure & composition Reservoir fluid sampling Injection, temperature & spinner logs Pulse neutron logs Crosswell seismic Vertical seismic profile (VSP) Experimental Distributed Temperature Sensing (DTS) Comparative fluid sampling methods MBM VSP Distributed Acoustic Sensing (DAS) MBM VSP & OVSP Seismic Frequency Continuous Monthly Quarterly Annual Milestone (Baseline, Injection, Post)
 One PNC logging well (D-9-11) 12 soil flux monitoring locations PFT monitoring on nine well pads Crosswell and VSP between D-97#2 and")
12 Anthro Test MVA Program One new injector (D-9-7 #2) Two new deep observation wells (D-9-8 #2 & D-9-9 #2) Two in-zone & above zone monitoring wells (Citronelle wells D-4-13 & D-4-14) One PNC logging well (D-9-11) 12 soil flux monitoring locations PFT monitoring on nine well pads Crosswell and VSP between D-97#2 and D-9-8#2 12

13 CO 2 Containment- Soil CO 2 Flux and Tracer Monitoring Soil CO 2 Flux Tracer Results Inoculation Testing Well/Sample AUG 2012 JUN 2013 NOV 2013 D-9-1 ND ND ND D-9-2 ND ND ND D-9-3 ND ND ND D-9-6 ND ND ND D ND ND ND D-9-8 Invalid Data ND ND D-9-9 ND ND ND D-9-10 Invalid Data ND ND D-9-11 ND ND ND Air Blank 1 ND NST NST System Blank ND ND Soil CO 2 results appear to vary as a function of mean temperature and PFT have been non-detect 13

14 Deep Monitoring Time-Lapse Crosswell Seismic Crosswell seismic surveys allow for high-resolution mapping of the acoustic travel time (velocity) and seismic reflectors between a pair of wells When CO 2 displaces water in the formation, it changes the acoustic impedance of the rock Acoustic wave decreases and its direct travel time increases Results from repeat surveys performed during or after CO 2 injection can be compared to a pre-injection baseline survey to image the extent of the CO 2 plume (referred to as time-lapse imaging ) Baseline and repeat 2-D crosswell seismic surveys were performed between the injection well and the observation well 14
15 Crosswell Survey Configuration and Parameters Pre-injection baseline survey acquired on January 19-26, 2012 Repeat survey was acquired on June 14-23, 2014 Source Type: Piezoelectric deployed in D-9-7#2 well Receiver type: Hydrophone 10 levels deployed in D-9-8#2 well 840 between D-9-7#2 and D-9-8#2 at reservoir depth Schematic showing the open well completion in observation well D-9-8 during the baseline survey (left) and packer/tubing completion during the repeat (right) Receivers were deployed in the open well during the baseline survey and inside the MBM tubing/packer assembly during the repeat survey, thus changing the baseline conditions 15

16 Injection Zone Baseline Survey Results Velocity tomography and reflection imaging (right) provided a good representation of the reservoir and confining unit ~10 feet vertical resolution No reservoir or confining unit discontinuities or small-scale faults were observed in the reflection data Layering observed in the Upper Paluxy will help disperse the CO 2 plume, thus minimizing its footprint Baseline velocity tomogram should be of sufficient quality for timelapse CO 2 plume imaging Confining Zone Composite image mapping the seismic reflections (squiggles) superimposed on top of the velocity tomogram (colored background) 16

17 Comparison of Baseline and Repeat Data Quality First arrivals and reflection data from the baseline survey have strong amplitudes and little noise, representing good quality data The first arrivals for the repeat survey are fairly weak probably due to signal attenuation caused by deploying the hydrophones inside the stiff production tubing and packer First Arrivals or Picks Poor quality reflection data The reflection data that follow the first arrivals are noisy and of poor quality for the repeat survey Side-by-side comparison of a baseline (left) and repeat (right) shot gather There is a noticeable decrease in the signal-to-noise ratio (SNR) between the baseline and repeat surveys, which limits data interpretation 17


18 Injection Zone Comparison of Crosswell Reflectors Baseline Tomogram Strong, continuous reflectors Repeat Tomogram Weak and/or discontinuous reflectors Confining Zone No reflector was detected at or near the top of the CO 2 where one should be present Reflection data from the repeat survey are of poor quality and limited use. Likely cause is interference by tube waves moving up and down the well 18


19 Time-Lapse Differencing Using the Baseline and Repeat Velocity Tomograms Injection Zone First arrivals from repeat survey were of sufficient quality to produce a velocity difference image (right) showing regions where seismic velocity has changed over time Time-lapse difference image indicates a decrease in seismic velocity in the upper injection zone of up to 3%, suggesting an increase in CO 2 saturation No significant negative velocity anomalies Decrease in velocity (negative anomaly) Confining Zone More importantly, no negative velocity anomalies are observed in or above the confining unit implying no detectable leakage out of inj. zone Pixelized difference tomography results without seismic reflection overlay showing positive velocity differences in warm colors and negative differences in cool colors 19
 Nov 2012 Aug 2013 Oct 2013 Unit Bottom Top Thickness Flow %")

20 Plume Image Comparison with Spinner Surveys J I H G F E D C B A Time-lapse image shows CO2 plume located primarily in Paluxy sands F-H October 2013 spinner survey show these sands taking only 10% of the flow Sand Sand Unit Properties (ft) Nov 2012 Aug 2013 Oct 2013 Unit Bottom Top Thickness Flow % Flow % Flow % J 9,454 9, I 9,474 9, H 9,524 9, G 9,546 9, F 9,580 9, E 9,622 9, D 9,629 9, C 9,718 9, B 9,744 9, A 9,800 9,
21 Deep MVA Pressure Response D9-8#2 D4-14 In Zone D4-13 Above Confinement CO 2 Injected Downhole pressure data is a primary input to the history match and plume model 21
22 RPI CO 2 Injection Production Analysis In the plot below, the slope of each line is related to the transmissibility (kh) of the reservoir and the y-intercept is related to the wellbore-reservoir connectivity 10 RPI P WeightRate 5 0 Slope is a function of kh Elevation on Y axis is a function of connectivity to wellbore (i.e. x f or skin) Slope is unchanged kh has not changed Increased elevation on Y axis indicates damage to wellbore connectivity Slope is has increased kh has dropped No change in elevation on Y axis indicates wellbore connectivity unchanged 0 10 Log of Time 22
23 Tubing Pressure Daily CO 2 Rate, Metric Tons D-9-7#2 Injection Pressure History 3,000 2,500 Transient # Transient # , , , June, Repeat Crosswell Injection well killed, tubing pulled Jun-12 Sep-12 Dec-12 Mar-13 Jun-13 Oct-13 Jan-14 Apr-14 Jul-14 Nov-14 spinner survey Notable Increase in injection tubing pressure after crosswell seismic workover 23
 after D-9-7#2 workover")
24 CO 2 Injection Production Analysis Post-Workover Transient #1 Pre-Workover Decrease in connectivity and transmissibility (kh) after D-9-7#2 workover 24
25 Deep MVA Pressure Response Time The system, as expected, is getting more compressible with continued injection. As a result, the pressure transient travel time between the injection and observation wells continues to grow. D-4-14 (in zone) D-9-8#2 25

26 Citronelle Groundwater Sampling Program Three dedicated groundwater sampling wells and one water well Well Depth (ft) Elev. (ft) D9-9 MW D9-7 MW-2S D9-7 MW-2D D9-8 WW Three background sampling events prior to CO 2 injection Nine quarterly sampling events since injection started 17 metals, alkalinity, TDS, TIC, ph etc. Groundwater sampling locations (circled) 26
27 Metals, ph, inorganic carbon, etc Occur Naturally in Groundwater Complicating Regulatory Interpretation UIC Permit Backgrd Backgrd Backgrd Backgrd Analyte Unit Level MW-1 MW-2S MW-2D WW Metals, Total Aluminum ug/l 200 < <100 < < Antimony ug/l 6 <5 <5 <5 <5 Arsenic ug/l 10 <5 <5 <5 <5 Barium ug/l < Berylium ug/l 4 <3 <3 <3 <3 Cadmium ug/l 5 <5 <5 <5 <5 Chromium ug/l 100 <5 <5 <5 13 <5 Copper ug/l 1,300 <10 <10 <10 < Iron ug/l < Lead ug/l 15 <5 <5 <5 5.5 <5 35 Manganese ug/l < Mercury ug/l 2 <0.2 <0.2 <0.2 <0.2 Nickel ug/l 100 <5 <5 <5 5.1 <5 Selenium ug/l 50 <10 <10 <10 <10 Silver ug/l 100 <5 <5 <5 <5 Thallium ug/l 2 <1 <10 <1 <1 <1 Zinc ug/l 5000 <20 25 <20 <20 69 <20 21 General Chemistry Alkalinity, Bicarbonate as CaCO3 mg/l Monitor Alkalinity, Total mg/l Total Dissolved Solids mg/l Total Inorganic Carbon mg/l Monitor Field Parameters ph Std units
28 Citronelle Compliance Monitoring Program is Based on U.S. Environmental Protection Agency RCRA Guidelines Compliance data exceed UIC permit levels? Yes Compliance data exceed natural background range? Yes Compliance data exceed Upper or Lower Confidence Limit (C.L.)? No - Check for outliers - Check for normality - Compute 95% C.L. - Value to value comparison with C.L. Continue Yes Monitoring Wilcoxon-Mann-Whitney Trend Analysis. Trend Observed? Yes Take action 28
29 Summary of Intra-Well Statistics Intra-well statistical analyses indicates several significant trends for the N=3 through 12 sampling events ph decrease at D-9-7 MW-2D Ba, Fe, Mn and sulfate increase at D-9-7 MW-2S Ba, Fe and Mn increase at D-9-9 MW-1 The statistical analysis would imply that the groundwater quality is changing at Citronelle, but is CO 2 the cause? 29
30 Time Series Trends (N=1 through 12 Sampling Events) 30


31 Multiple Lines of Evidence are Needed to Prevent False- Negatives and Positives 1. Multiple lines of evidence for the potential influence of carbon dioxide at individual monitoring wells have not been identified to date at Citronelle 2. Groundwater systems are inherently complex requiring thoughtful design of the background sampling and compliance monitoring programs 31
32 2. AoR & Modeling Update 32
33 Introduction CMG s GEM software was used to model the injection into the upper Paluxy Sandstone and forecast the subsurface movement and pressure profile of the CO 2 in order to meet our Class V UIC AoR guidelines. Modeling was done in a three-step process. These steps were: History matching the injection through 31 AUG Forecasting continued injection through the end of the proposed injection period to account for anticipated interruptions (reserve shut-down from 01 NOV APR 2014). Then, the plume was allowed to relax to understand pressure equilibration and plume stabilization. 33

. Simulation 26.1 3.4 4.3 0.9 25.8 11.1 4.")
34 Injection Profile Match Field gathered injection profile surveys were used to understand how the CO 2 entered the Paluxy reservoir sand bodies (8 sands, 10 sets of perforations). Simulation
35 Pressure, psia Offset Pressure Profile Match Pressure data was used to calibrate modeled upper Paluxy sand layer (perf sets 1 and 2) pressure responses at 870 ft (265m) at D 9-8 #2 and more than 3,000 ft (914m) at the D Note: the late time erratic pressure data in the D 9-8 #2. Upper Paluxy Pressure Match at the D 9-8 #2 Upper Paluxy Pressure Match at the D 4-14 SECU D4-14 Pressure Aug-12 Sep-12 Nov-12 Dec-12 Feb-13 Apr-13 May-13 Jul-13 Sep-13 Oct-13 Date D4-14 Bottom D4-14 Top D4-14 Simulation 35
 As")

36 Predicted Radial CO 2 Plume Extent on August 31, 2013 of 440 ft (134 m) As expected, the two most porous and permeable sands accepted the bulk of the CO 2. 36
 Continuing the")

37 Predicted Radial CO 2 Plume Extent on October 31, 2014 of 720 ft (219 m) Continuing the injection (135,000 tonnes more), the plume continues to spread across the 9460 and 9620 sands. 37

38 Predicted Radial CO 2 Plume Extent on October 31, 2017 of 720 ft (219 m) Despite the high permeability of the formation and a gentle dip, there is not a substantial change in the plume extent in the three years following the cessation of injection. In fact, the plume extent has equilibrated. 38
39 3. Lessons Learned 39
40 Lessons Learned Time and cost reductions realized, but not yet commercial Data, data, & more data MVA systems can impact injection and vice versa We have good reservoir capacity and injectivity apparent injection damage after workover 40
41 Lessons Learned Data resolution may be challenging in deep settings Every potential storage project is different & MVA should be site specific in design When deploying non-commercial MVA protocols, redundancy with more commercial tools is necessary to ensure the data quality Build from the lessons learned at existing projects 41
42 4. Questions, Answers, Discussion 42

43 Together Shaping the Future of Electricity 43
44 EXTRAS 44
 Backgr")
45 USDW Protection - Groundwater Geochemistry 3 - Background Monitoring Events: January 2012 (N=1) through July 2012 (N=3) 10 - Injection Period Monitoring Events: November 2012 (N=4) through February 2015 (N=13) Background anomalies of Mn, Fe, and Cl above UIC permit discharge limits. To evaluate the potential exceedance of regulatory standard (e.g., UIC permit discharge limit), the EPA GW Unified Guidance recommends statistical comparisons ( value to value comparison to standard and evaluation of changes between baseline and monitoring) Quarterly testing to continue throughout the PISC 45

46 USDW Monitoring Well Network Monitoring Well D-9-7 MW-2S D-9-7 MW-2D D-9-9 MW-1 Well Depth Well TOC Elevation Screened USDW (ft. BTOC) (ft. AMSL) Miocene-Pliocene Aquifer Miocene-Pliocene Aquifer Miocene-Pliocene Aquifer Water Supply Well Near D-9-8 Miocene-Pliocene Aquifer/Watercourse Aquifer ~143 Not Surveyed 46
47 Comparison of Baseline Values to Permit Analyte D-9-7 MW2D UIC Permit Discharge Limits (µg/l) Range of Valid Background Concentrations (µg/l) Aluminum 200 < Antimony 6 <5 Arsenic 10 <5 Barium 2,000 <10-29 Beryllium 4 <3 Cadmium 5 <5 Chromium 100 <5-13 Copper 1,300 <10 Iron 300 < Lead 15 <5-5.5 Manganese 50 <10-18 Mercury 2 <0.2 Nickel 100 <5-5.1 Selenium 50 <10 Silver 100 <5 Thallium 2 <1 Zinc 5,000 <20-69 Range of values because of the small background data set (N=3). Selected naturally occurring background concentrations which exceed UIC Permit discharge. 47
 48")
48 Statistically Determined Potential Lines of Evidence for CO 2 Influence* Multiple lines of evidence for the potential influence of CO 2 at individual monitoring wells have NOT been identified *e.g. Wilkin and Digiulio (2010) 48
2 SECARB Anthropogenic Test SP030414
 This presentation is based upon work supported by the Department of Energy National Energy Technology Laboratory under DE-FC26-05NT42590 and was prepared as an account of work sponsored by an agency of
This presentation is based upon work supported by the Department of Energy National Energy Technology Laboratory under DE FC26 05NT42590 and was
 Experimental Monitoring at SECARB s Citronelle Field Site (Coming soon to a CO 2 EOR project near you!) Prepared For: Surveillance and Monitoring of CO 2 Injection Projects Short Course Prepared By: George
Summary of Field Test Site and Operations
 Southeast Regional Carbon Sequestration Partnership (SECARB) secarbon.org Field Test Location and Amount/Sources of CO 2 Anthropogenic Test Alabama Power s Plant Barry - 100,000 to 150,000 tonnes of CO2
BELL CREEK TEST SITE BASELINE MVA INITIATED
 BELL CREEK TEST SITE BASELINE MVA INITIATED Plains CO 2 Reduction (PCOR) Partnership Phase III Task 5 Milestone M30 Prepared for: Ms. Andrea T. McNemar National Energy Technology Laboratory U.S. Department
The SECARB Anthropogenic Test: CO 2 Capture/Transportation/Storage
 The SECARB Anthropogenic Test: CO 2 Capture/Transportation/Storage Richard A. Esposito, Southern Company Dave Riestenberg, Advanced Resources International IEA International CCS Regulatory Network Web
DROGHEDA LANDFILL SITE COLLON ROAD, MELL, DROGHEDA
 GROUNDWATER MONITORING INFORMATION QUARTERLY REPORT FOR PERIOD APRIL TO JUNE 216 BY LOUTH COUNTY COUNCIL TO ENVIRONMENTAL PROTECTION AGENCY FOR WASTE LICENCE REFERENCE: W33-1 DROGHEDA LANDFILL SITE COLLON
Groundwater Monitoring Under a UIC Class VI Permit for a Carbon Storage Project
 Groundwater Monitoring Under a UIC Class VI Permit for a Carbon Storage Project Groundwater Protection Council Annual Forum, Orlando, FL Sai Gollakota (NETL/DOE) Scott McDonald (ADM) September 11-14, 2016
Lessons Learned from Enhanced Oil Recovery Operations: The Plains CO 2 Reduction Partnership
 Lessons Learned from Enhanced Oil Recovery Operations: The Plains CO 2 Reduction Partnership 2015 CSLF Technology Workshop June 17, 2015 Ed Steadman Deputy Associate Director for Research 2015 University
Pilot Scale CO 2 EOR in Mississippian Carbonate Reservoir at Wellington Field in South-Central Kansas
 Pilot Scale CO 2 EOR in Mississippian Carbonate Reservoir at Wellington Field in South-Central Kansas Yevhen Holubnyak, Willard Watney, Jason Rush, Mina Fazelalavi, and Dana Wreath 13 th International
World Class CO 2 Sequestration Potential in Saline Formations, Oil and Gas Fields, Coal and Shale:
 World Class CO 2 Sequestration Potential in Saline Formations, Oil and Gas Fields, Coal and Shale: The U.S. Southeast Regional Sequestration Partnership has it All! SPE 126619 Authors: Robin Petrusak,
BELL CREEK TEST SITE INITIATION OF PRODUCTION AND INJECTION SIMULATION
 BELL CREEK TEST SITE INITIATION OF PRODUCTION AND INJECTION SIMULATION Plains CO 2 Reduction (PCOR) Partnership Phase III Task 4 Milestone M16 Prepared for: Andrea T. McNemar National Energy Technology
U.S. DEPARTMENT OF ENERGY BRINE EXTRACTION AND STORAGE TEST (BEST) PROJECT UPDATE
 PROJECT UPDATE") U.S. DEPARTMENT OF ENERGY BRINE EXTRACTION AND STORAGE TEST (BEST) PROJECT UPDATE Carbon Sequestration Leadership Forum Mid-Year Meeting Abu Dhabi, United Arab Emirates May 1, 2017 Presented by John A.
U.S. DEPARTMENT OF ENERGY BRINE EXTRACTION AND STORAGE TEST (BEST) PROJECT UPDATE Carbon Sequestration Leadership Forum Mid-Year Meeting Abu Dhabi, United Arab Emirates May 1, 2017 Presented by John A.
ILLINOIS INDUSTRIAL CARBON CAPTURE AND STORAGE PROJECT
 1 ILLINOIS INDUSTRIAL CARBON CAPTURE AND STORAGE PROJECT Project Overview, Lessons, & Future Plans Carbon Sequestration Leadership Forum June 11-14, 2012 Scott McDonald Biofuels Development Director scott.mcdonald@adm.com
NEUTRON. Prepared. Neil W. Dotzenrod John A. Hamling. Edward N. Steadman John A. Harju. University. Grand Forks,
 BELLL CREEK TEST SITE FIRST FULL REPEAT OF PULSED NEUTRON LOGGING CAMPAIGN COMPLETED Plains CO 2 Reduction (PCOR) Partnership Phase III Task 9 Milestone M45 Prepared for: Andrea M. Dunn National Energy
UIC Class VI Permitting Experience
 ADM CCS Projects UIC Class VI Permitting Experience IEAGHG 10 th Monitoring Network Meeting June 10, 2015 Scott McDonald Biofuels Development Director scott.mcdonald@adm.com Acknowledgements The Industrial
Using Multi Scale Seismic Measurements for CO 2 Monitoring in CCUS/EOR Project - Farnsworth
 Using Multi Scale Seismic Measurements for CO 2 Monitoring in CCUS/EOR Project - Farnsworth George El-Kaseeh, Robert Will, Robert Balch 5 October 2017 www.slb.com/carbonservices CS1611-118-GEK Any interpretation,
Southeast Regional Carbon Sequestration Partnership A Southern States Energy Board Carbon Management Program
 Southeast Regional Carbon Sequestration Partnership A Southern States Energy Board Carbon Management Program secarbon.org July 2011 This material is based upon work supported by the United States Department
Carbon extracted from coal or other fossil fuel. where it came from. An elegant solution - will it work?
 Testing Geologic Sequestration of fc Carbon Put it back Carbon extracted from coal or other fossil fuel Returned ed into the earth where it came from An elegant solution - will it work? susan.hovorka@beg.utexas.edu
Monitoring Carbon Dioxide Sequestration in Deep Geological Formations for Inventory Verification and Carbon Credits
 Monitoring Carbon Dioxide Sequestration in Deep Geological Formations for Inventory Verification and Carbon Credits Sally M. Benson Earth Sciences Division Lawrence Berkeley National Laboratory Berkeley,
SPECIFICATION NO.1197S Addendum No.4 Attachment D. Appendix L- Ground Water Quality Data and Revised Construction Groundwater Discharge Plan
 SPECIFICATION NO.1197S Addendum No.4 Attachment D Appendix L- Ground Water Quality Data and Revised Construction Groundwater Discharge Plan Page 1 of 2 Specification No. 1197S Addendum No. 4 ATTACHMENT
JUNE 14-16, 2016 SHERATON TYSONS CORNER TYSONS, VA. #CCUS
 JUNE 14-16, 2016 SHERATON TYSONS CORNER TYSONS, VA www.ccusconference.com #CCUS DEVELOPING AND VALIDATING RESERVOIR PRESSURE MANAGEMENT AND PLUME CONTROL STRATEGIES IN THE WILLISTON BASIN THROUGH A BRINE
Combined Sewer Overflows July 2012-December 2013
 CSO Facilities Summary Report 213 Combined Sewer Overflows July 212-December 213 Overview MWRA monitored four CSO facilities in the North System during the period covered in this report (July 212 December
PRODUCTION WELL WATER SHUT-OFF TREATMENT IN A HIGHLY FRACTURED SANDSTONE RESERVOIR
 WRI-01-R010 PRODUCTION WELL WATER SHUT-OFF TREATMENT IN A HIGHLY FRACTURED SANDSTONE RESERVOIR Final Report By Lyle A. Johnson Jr. July 2001 Work Performed Under Cooperative Agreement DE-FC26-98FT40323
WOLVERINE MINE MONITORING AND SURVEILLANCE PLAN 2011 ANNUAL REPORT
 WOLVERINE MINE MONITORING AND SURVEILLANCE PLAN 211 ANNUAL REPORT Prepared for: Yukon Energy, Mines and Resources Prepared by: Yukon Zinc Corporation Vancouver, British Columbia March 31, 212 Wolverine
Water Monitoring - Teralba Quarry EPA Point No.4 - Adit Overflow
 No. Dates Water Monitoring - Teralba Quarry - 2018 - EPA Point No.4 - Adit Overflow EPA No 4-148 ABCDE EPA No 4-149 ABCDE EPA No 4-150 ABCDE January 2018. Febrary 2018. March 2018. EPA No 4-151 AB April
Pilot experiments in Australia. Jonathan Ennis-King CSIRO
 Pilot experiments in Australia Jonathan Ennis-King CSIRO Webinar on Geologic Capture and Sequestration of Carbon Nov 15, 2017 Location of CO2CRC Otway Project Otway Site Operations Current Site Layout
Citronelle Groundwater Services
 12 th Aual SECARB Stakeholders Briefig - March 2017 Citroelle Groudwater Services Michael Smilley, PG Jeffrey Frazier, PG Regulatory Cotext MONITORING THE USDW AQUIFER Two Documets Guide the Moitorig Program:
New Developments: Solved and Unsolved Questions Regarding Geologic Sequestration of CO 2 as a Greenhouse Gas Reduction Method
 New Developments: Solved and Unsolved Questions Regarding Geologic Sequestration of CO 2 as a Greenhouse Gas Reduction Method GCCC Digital Publication Series #08-13 Susan D. Hovorka Keywords: Capacity,
2010 POST-CLOSURE LANDFILL MONITORING TOWN OF BRIGHTON
 2010 POST-CLOSURE LANDFILL MONITORING TOWN OF BRIGHTON Submitted To: New York State Department of Environmental Conservation Region 5 Office Submitted By: Town of Brighton Prepared By: F. X. Browne, Inc.
NETL Regional Partnerships - Overview
 Driing Innoation Deliering Results NETL Regional Partnerships - Oeriew Erik Albenze Project Manager May 17, 2016 Presentation Outline 1. Storage Program Introduction Technical challenges Program Structure
INORGANIC CHEMICALS IN GROUND WATER AND SOIL: BACKGROUND CONCENTRATIONS AT CALIFORNIA AIR FORCE BASES.
 INORGANIC CHEMICALS IN GROUND WATER AND SOIL: BACKGROUND CONCENTRATIONS AT CALIFORNIA AIR FORCE BASES. Philip M. Hunter 1, Brian K. Davis 2, and Frank Roach 3. 1 Air Force Center for Environmental Excellence,
Geologic Sequestration Rules: A Multi-Stakeholder Perspective
 Geologic Sequestration Rules: A Multi-Stakeholder Perspective Ground Water Protection Council Annual Forum Pittsburgh, PA September 26-29, 2010 Bob Van Voorhees Carbon Sequestration Council Scott Anderson
Gold King Mine Release: Utah s Response and Implications for Our Waters
 Gold King Mine Release: Utah s Response and Implications for Our Waters Water Resources Research Institute May 17, 2016 Erica Gaddis, Ph.D. Utah Utah s Inter-agency Response Aug 5: Gold King Mine Release
secarbon.org Southeast Regional Carbon Sequestration Partnership (SECARB) Phase III Early CO2 Injection Field Test at Cranfield
 Phase III Early CO2 Injection Field Test at Cranfield") secarbon.org Southeast Regional Carbon Sequestration Partnership (SECARB) at Cranfield Field Test Location and Am ount/sources of CO 2 Early Test Cranfield Oilfield, Mississippi - 1.5 million tonnes of
secarbon.org Southeast Regional Carbon Sequestration Partnership (SECARB) at Cranfield Field Test Location and Am ount/sources of CO 2 Early Test Cranfield Oilfield, Mississippi - 1.5 million tonnes of
Managing guncertainty in Geologic Storage. Dwight Peters Schlumberger Carbon Services
 Managing guncertainty in Geologic Storage Dwight Peters Schlumberger Carbon Services Schlumberger 2 Oilfield Services Drilling & Completion Seismic Evaluation Services Modeling & Interpretation Project
Class V Experimental Well Permit Process Items & Potential Issues for Western Kentucky CO 2 Storage Project
 Class V Experimental Well Permit Process Items & Potential Issues for Western Kentucky CO 2 Storage Project Presentation to Kentucky Consortium for Carbon Storage (KYCCS) July 23, 2008 Presented by: Phil
JUNE 14-16, 2016 SHERATON TYSONS CORNER TYSONS, VA. #CCUS
 JUNE 14-16, 2016 SHERATON TYSONS CORNER TYSONS, VA Pilot Scale CO 2 EOR at Wellington Field in South-Central Kansas Yevhen Holubnyak, Lynn Watney, Jason Rush, Mina Fazelalavi, and Dana Wreath Participants
Paul Kirby, P.G. Daniel B. Stephens & Associates, Inc. with. Fayette County GCD Pecan Valley GCD. August 29, 2018
 Paul Kirby, P.G. Daniel B. Stephens & Associates, Inc. with Fayette County GCD Pecan Valley GCD August 29, 2018 Typical GCD Mission To provide for the conservation, preservation, protection, recharging,
Technical Memorandum
 Technical Memorandum To: Kathy Arnold From: David Levy Tucson Office 3031 West Ina Road Tucson, AZ 85741 Tel 520.297.7723 Fax 520.297.7724 www.tetratech.com Company: Rosemont Copper Company Date: January
A Southern States Energy Board Carbon Management Program
 Southeast Regional Carbon Sequestration Partnership A Southern States Energy Board Carbon Management Program the secarbon.org August 2014 Get Connected Find us on Facebook and follow us on Twitter to get
IEAGHG MONITORING AND MODELLING RESEARCH NETWORK MEETING. Kyle Worth, P.Eng, PMP Senior Project Manager Petroleum Technology Research Centre
 IEAGHG MONITORING AND MODELLING RESEARCH NETWORK MEETING Kyle Worth, P.Eng, PMP Senior Project Manager Petroleum Technology Research Centre 1 AQUISTORE: DEEP SALINE CO 2 STORAGE PROJECT ONE YEAR OF INJECTION
Statewide Characterization of Oklahoma s Major Aquifers
 Statewide Characterization of Oklahoma s Major Aquifers Mark Belden, Brittany McCall, Sarah Yepez Water Quality Programs Division, OWRB Oklahoma Clean Lakes & Watersheds Conference April 5-6, 2017 Groundwater
Modeling and Monitoring Associated CO 2 Storage at the Bell Creek Field
 Modeling and Monitoring Associated CO 2 Storage at the Bell Creek Field Joint IEAGHG Modelling and Monitoring Network Meeting August 6, 2014 Charles D. Gorecki, John A. Hamling, Hui Pu, Jason R. Braunberger,
SECARB Phase II Cranfield, MS
 SECARB Phase II Cranfield, MS GCCC Digital Publication Series #09-03 Susan D. Hovorka Timothy A. Meckel Ramón H. Treviño J. P. Nicot Jong-Won Choi Jiemin Lu Hongliu Zeng Katherine Romanak Changbing Yang
GROUNDWATER ASSESSMENT MONITORING REPORT APRIL 2014
 Tennessee Valley Authority John Sevier Fossil Plant GROUNDWATER ASSESSMENT MONITORING REPORT APRIL 2014 Prepared by Amos L. Smith, PG Chattanooga, Tennessee June 4, 2014 DOCUMENT CERTIFICATION I certify
ACTIVE COAL COMBUSTION RESIDUALS LANDFILL GROUNDWATER STATISTICAL METHOD CERTIFICATION. Escalante Generating Station
 ACTIVE COAL COMBUSTION RESIDUALS LANDFILL GROUNDWATER STATISTICAL METHOD CERTIFICATION Escalante Generating Station Prewitt, New Mexico REPORT Submitted To: Tri-State Generation and Transmission Association,
New Acid Stimulation Treatment to Sustain Production Los Angeles Downtown Oil Field U.S. Department of Energy Grant No.
 New Acid Stimulation Treatment to Sustain Production Los Angeles Downtown Oil Field U.S. Department of Energy Grant No. DE-FG26-99BC15247 Richard C. Russell St. James Oil Corporation Abstract New Acid
Southwest Regional Partnership on Carbon Sequestration
 Quarterly Progress Report Reporting Period: July1 September 30, 2016 Brian McPherson, PI, and Robert Balch, PI/Project Director DE- FC26-05NT42591 Recipient: New Mexico Institute of Mining and Technology
Outline of Presentation
 4 th Wellbore Integrity Network Meeting Monitoring i of Wellbore Performance at Penn West CO 2 -EOR Rick Chalaturnyk Geological Storage Research Group Department of Civil and Environmental Engineering
APPENDIX E STATISTICAL COMPARISON OF SITE AND BACKGROUND DATA
 APPENDIX E STATISTICAL COMPARISON OF SITE AND BACKGROUND DATA Table of Contents 1. Introduction... 3 2. Comparison Methodology... 3 2.1 Statistical Procedures... 3 2.1.1 Tier 1... 4 2.1.2 Tier 2... 4 2.1.2.1
INITIAL ANNUAL GROUNDWATER MONITORING AND CORRECTIVE ACTION REPORT
 Prepared For: Fort Armistead Road Lot 15 Landfill, LLC 1005 Brandon Shores Road, Suite 100 Baltimore, Maryland 21226 INITIAL ANNUAL GROUNDWATER MONITORING AND CORRECTIVE ACTION REPORT FEDERAL CCR RULE
WESTCARB Annual Business Meeting
 WESTCARB Annual Business Meeting Arizona Utilities CO 2 Storage Pilot John Henry Beyer, Ph.D. WESTCARB Program Manager, Geophysicist 510-486-7954, jhbeyer@lbl.gov Lawrence Berkeley National Laboratory
Southwest Regional Partnership on Carbon Sequestration
 Southwest Regional Partnership on Carbon Sequestration Quarterly Progress Report Reporting Period: January 1 March 31, 2017 Brian McPherson, PI, and Robert Balch, PI/Project Director DE- FC26-05NT42591
Large-Scale Implementation of Recirculation Systems for In-Situ Treatment of Hexavalent Chromium in Groundwater in Hinkley CA 17338
 WM217 Conference, March 5 9, 217, Phoenix, Arizona, USA Large-Scale Implementation of Recirculation Systems for In-Situ Treatment of Hexavalent Chromium in Groundwater in Hinkley CA 17338 Margy Gentile
OXYGEN ENHANCED COMBUSTION FOR NOx CONTROL
 OXYGEN ENHANCED COMBUSTION FOR NOx CONTROL QUARTERLY TECHNICAL PROGRESS REPORT For Reporting Period Starting October 1, 2002 and Ending Dec. 31, 2002 Principal Authors: Program Manager and Business Officer:
DRINKING WATER ANALYSIS SUMMARY
 End : Iron 1,000 ug/l 621 3/4/2013 15:10 Lead 0.11 ug/l J Iron 2,400 ug/l Nickel 0.50 ug/l J Zinc 7.9 ug/l J Nickel 0.54 ug/l J 621 3/4/2013 15:10 Manganese 34 ug/l Manganese 26 ug/l 621 3/4/2013 15:10
2.0 Scope of Work. 3.0 Stream Discharge Measurements. Technical Memorandum City of Farmers Branch Page 2
 Technical Memorandum City of Farmers Branch Page 2 over the No. 1 dam. Discharge of commingled water from the reservoirs must be of sufficient quality to meet the Surface Water Quality Standards of Segment
Newmont Mining Corporation Water Management Standard
 Page No: Page 1 of 5 1 PURPOSE AND OBJECTIVES This Global Standard sets the minimum Newmont requirements to proactively plan and manage water from exploration to post-closure in accordance with Newmont
RESULTS FROM CSLF-RECOGNIZED PROJECTS: FORT NELSON PROJECT AND ZAMA PROJECT
 Energy & Environmental Research Center (EERC) RESULTS FROM CSLF-RECOGNIZED PROJECTS: FORT NELSON PROJECT AND ZAMA PROJECT James Sorensen, Steve Smith, John Harju, Ed Steadman, and Charles Gorecki Energy
Technical Memorandum Groundwater Quality Sampling, November 2010 Event
 Kennedy/Jenks Consultants Technical Memorandum Groundwater Quality Sampling, November 2010 Event Date: 10 March 2011 To: From: Subject: Amy Blain City of Longview Steve Misner Kennedy/Jenks Consultants
CO2CRC Otway Stage 2: CO 2 Storage in Saline Formation
 CO2CRC Otway Stage 2: CO 2 Storage in Saline Formation Dr Maxwell Watson Program Manager Storage CSLF Technical Group Meeting 02 November 2015, Riyadh, Saudi Arabia The CO2CRC Otway CCS Research Facility
Aquistore. Saskatchewan s Deep Saline CO 2 Storage Research Project. April 19, Presented by Kyle Worth, P.Eng., PMP to INRS, Quebec City
 Aquistore Saskatchewan s Deep Saline CO 2 Storage Research Project Presented by Kyle Worth, P.Eng., PMP to INRS, Quebec City April 19, 2012 Petroleum Technology Research Centre Mission: To develop world-leading
EPA Primary. (mg/l as CaCO3) (mg/l as CaCO3)
 (mg/l as CaCO3)") NORTH TEXAS MUNICIPAL WATER DISTRICT - Wylie Water Analysis Jan-2018 Mineral Analysis Raw Treated Standards Residue on Evaporation 412 456 500 1000 Silica (SiO2) 3.63 3.41 Iron (Fe) 0.378 0.259 0.3 0.3
NORTH TEXAS MUNICIPAL WATER DISTRICT - Wylie Water Analysis Jan-2018 Mineral Analysis Raw Treated Standards Residue on Evaporation 412 456 500 1000 Silica (SiO2) 3.63 3.41 Iron (Fe) 0.378 0.259 0.3 0.3
IEA-GHG Summer School Svalbard Aug 2010
 Efficient CGS Risk Management Claude Roulet Claude Roulet IEA-GHG Summer School Svalbard Aug 2010 Efficient CGS Risk Management CGS in CCS value chain CGS workflow Site characterization Risk Management
Final Report DMR-QA 36. NPDES Permit: IL DMR-QA Study. Open Date: 03/18/16. Close Date: 07/01/16. Report Issued Date: 07/29/16
 Keith Richard Decatur Sanitary District Decatur, IL 62522-1842 USA DMR-QA 36 Final Report NPDES Permit: IL0028321 DMR-QA Study Open Date: 03/18/16 Close Date: 07/01/16 Report Issued Date: 07/29/16 Study
ENHANCED COAL BED METHANE PRODUCTION AND SEQUESTRATION OF CO 2 IN UNMINEABLE COAL SEAMS
 ENHANCED COAL BED METHANE PRODUCTION AND SEQUESTRATION OF CO 2 IN UNMINEABLE COAL SEAMS Semi-Annual Technical Progress Report April 1, 2004 through September 30, 2004 William A. Williams October 2004 DOE
FIRST ANNUAL COAL COMBUSTION RESIDUALS (CCR) GROUNDWATER MONITORING AND CORRECTIVE ACTION REPORT LANDFILL AND SURFACE IMPOUNDMENTS
 GROUNDWATER MONITORING AND CORRECTIVE ACTION REPORT LANDFILL AND SURFACE IMPOUNDMENTS") FIRST ANNUAL COAL COMBUSTION RESIDUALS (CCR) GROUNDWATER MONITORING AND CORRECTIVE ACTION REPORT LANDFILL AND SURFACE IMPOUNDMENTS R.D. MORROW, SR. GENERATING STATION 304 OLD OKAHOLA SCHOOL ROAD PURVIS,
FIRST ANNUAL COAL COMBUSTION RESIDUALS (CCR) GROUNDWATER MONITORING AND CORRECTIVE ACTION REPORT LANDFILL AND SURFACE IMPOUNDMENTS R.D. MORROW, SR. GENERATING STATION 304 OLD OKAHOLA SCHOOL ROAD PURVIS,
CO2CRC Otway Stage 3 Project
 CO2CRC Otway Stage 3 Project Project Summary Dr Maxwell Watson Program Manager - Storage CO2CRC Ltd CSLF Projects Interaction and Review Team 3 rd December 2017, Abu Dhabi, UAE Presentation Outline CO2CRC
French Creek Well # 2 Water Analysis Behind 1221 Ormonde Road
 French Creek Well # 2 Water Analysis Behind 1221 Ormonde Road October 27 2010 Inorganics Fluoride 1.5 MAC 0.17 0.13
Quarterly Technical Progress Report. Reporting Period Start Date: Oct 1, Reporting Period End Date: Dec. 31, 2002
 An Advanced Fracture Characterization and Well Path Navigation System for Effective Re-Development and Enhancement of Ultimate Recovery from the Complex Monterey Reservoir of South Ellwood Field, Offshore
The SECARB Anthropogenic Test: A US Integrated CO 2 Capture, Transportation and Storage Test *
 International Journal of Clean Coal and Energy, 2012, 1, 13-26 http://dx.doi.org/10.4236/ijcce.2012.12002 Published Online May 2012 (http://www.scirp.org/journal/ijcce) The SECARB Anthropogenic Test: A
CO 2 Storage. Dr AK (Tony) Booer, Schlumberger Carbon Services, Abingdon, UK. 11 Jan, UKCCSC Winter Cambridge, UK
 Booer, Schlumberger Carbon Services, Abingdon, UK. 11 Jan, UKCCSC Winter Cambridge, UK") CO 2 Storage Dr AK (Tony) Booer, Schlumberger Carbon Services, Abingdon, UK 11 Jan, 2012 UKCCSC Winter School @ Cambridge, UK www.slb.com/carbonservices 2012 Schlumberger. All rights reserved. An asterisk
CO 2 Storage Dr AK (Tony) Booer, Schlumberger Carbon Services, Abingdon, UK 11 Jan, 2012 UKCCSC Winter School @ Cambridge, UK www.slb.com/carbonservices 2012 Schlumberger. All rights reserved. An asterisk
Monitoring CO2 at an enhanced oil recovery and carbon capture and storage project, Farnsworth unit, Texas
 Engineering Conferences International ECI Digital Archives CO2 Summit II: Technologies and Opportunities Proceedings Spring 4-12-2016 Monitoring CO2 at an enhanced oil recovery and carbon capture and storage
Annual Groundwater Monitoring Report
 Annual Groundwater Monitoring Report Southwestern Electric Power Company John W. Turk Power Plant Landfill CCR Management Unit Fulton, Arkansas January 218 Prepared by: American Electric Power Service
WESTCARB Regional Partnership
 WESTCARB Regional Partnership Providing Underpinnings for Sequestration Deployment in West Coast Region Larry Myer WESTCARB Technical Director California Energy Commission (916) 551-1873; larry.myer@ucop.edu
OVERVIEW OF MITIGATION AND REMEDIATION OPTIONS FOR GEOLOGICAL STORAGE OF CO2
 OVERVIEW OF MITIGATION AND REMEDIATION OPTIONS FOR GEOLOGICAL STORAGE OF CO2 Prepared for: AB1925 Staff Workshop California Institute for Energy and Environment University of California Prepared by: Vello
Technical Memorandum Groundwater Quality Sampling, First 2010 Semiannual Event
 Kennedy/Jenks Consultants Technical Memorandum Groundwater Quality Sampling, First 2010 Semiannual Event Date: 30 July 2010 To: From: Subject: Amy Blain City of Longview Steve Misner Kennedy/Jenks Consultants
State of Nevada Department of Conservation and Natural Resources Division of Environmental Protection Laboratory Scope of Accreditation
 Matrix: CWA (Non Potable Water) Discipline EPA 120.1 Chemistry Conductivity 8/1/2015 Aluminum 8/1/2015 Antimony 8/1/2015 Arsenic 8/1/2015 Barium 8/1/2015 Beryllium 8/1/2015 Boron 8/1/2015 Cadmium 8/1/2015
Central Appalachian Basin (SECARB)
") Central Appalachian Basin (SECARB) Presented to: Coal-Seq VI April 10, 2008 Nino Ripepi and Michael Karmis Virginia Tech Michael J. Miller and J. Matthew Conrad Marshall Miller and Associates Acknowledgement
Central Appalachian Basin (SECARB) Presented to: Coal-Seq VI April 10, 2008 Nino Ripepi and Michael Karmis Virginia Tech Michael J. Miller and J. Matthew Conrad Marshall Miller and Associates Acknowledgement
CERTIFICATE OF ANALYSIS
 BAY 3, 4500 5TH STREET NE CALGARY, AB CANADA T2L 7C3 MAXXAM JOB #: A814851 Received: 2008/04/02, 13:15 Matrix: Water # s Received: 1 This report supersedes all previous reports with the same Maxxam job
Kawishiwi Watershed Metals Data Summary 2012
 Kawishiwi Watershed Metals Data Summary 212 Prepared for the Kawishiwi Watershed Protection Project Nolan Baratono, Watershed Ecologist Jesse Anderson, Research Scientist Background The Kawishiwi Watershed
Governor s Energy Summit Roanoke, West Virginia December 4, Presented by: Gerald R. Hill, Ph.D. SECARB Technical Coordinator
 Southeast Regional Carbon Sequestration Partnership (SECARB) Governor s Energy Summit Roanoke, West Virginia December 4, 2007 Presented by: Gerald R. Hill, Ph.D. SECARB Technical Coordinator SECARB Partnership
Presented to: CSLF Projects Interaction & Review Team Washington, D.C., USA 04 November 2013
 Southeast Regional Carbon Sequestration Partnership (SECARB) Phase III Anthropogenic Test and Plant Barry Carbon Dioxide Capture and Storage Demonstration Presented to: CSLF Projects Interaction & Review
Hydraulic Fracturing Test Site (HFTS)
") Hydraulic Fracturing Test Site (HFTS) Update > USTDA Workshop Beijing, China > December 3, 2015 > Presented by: Eddie Johnston, VP Research, GTI Program Objective > The mission of HFTS is to increase shale
Hydraulic Fracturing Test Site (HFTS) Update > USTDA Workshop Beijing, China > December 3, 2015 > Presented by: Eddie Johnston, VP Research, GTI Program Objective > The mission of HFTS is to increase shale
Flow Testing Results from Habanero EGS Project
 Proceedings Australian Geothermal Energy Conferences 2013 Brisbane, Australia, 14-15 November 2013 Flow Testing Results from Habanero EGS Project Robert Hogarth, Heinz Holl and Andrew McMahon Geodynamics
Results of HRC Injection at Dixie Cleaners, Jacksonville Florida
 Results of HRC Injection at Dixie Cleaners, Jacksonville Florida Hydrogen Release Compound (HRC TM ) Used to enhance in situ biodegradation by supporting anaerobic reductive dechlorination process. HRC
Table 1. VOCs Detections (all data in µg/l)
") AMBIENT WATER QUALITY IN THE UPPER GLACIAL AQUIFER NEAR THE TOWN OF BROOKHAVEN LANDFILL, SUFFOLK COUNTY, NEW YORK David J. Tonjes Waste Reduction and Management Institute Marine Sciences Research Center
AMBIENT WATER QUALITY IN THE UPPER GLACIAL AQUIFER NEAR THE TOWN OF BROOKHAVEN LANDFILL, SUFFOLK COUNTY, NEW YORK David J. Tonjes Waste Reduction and Management Institute Marine Sciences Research Center
Reservoir Modeling and Simulation of the Devonian Gas Shale of Eastern Kentucky for Enhanced Gas Recovery and CO 2 Storage
 Reservoir Modeling and Simulation of the Devonian Gas Shale of Eastern Kentucky for Enhanced Gas Recovery and CO 2 Storage 2009 SPE International Conference on CO 2 Capture, Storage, and Utilization Prepared
RE: Water Quality Split Samples April 2017 Charah Brickhaven Facility
 June 13, 2017 Mr. Brian Burkhart, P.E. Environmental Quality Director Chatham County 720 Renaissance Drive Pittsboro, North Carolina 27312 RE: Water Quality Split Samples April 2017 Charah Brickhaven Facility
CO2 Storage Experience in Japan including Impacts of Earthquakes. Ziqiu Xue Research Institute of Innovative Tech.
 CO2 Storage Experience in Japan including Impacts of Earthquakes Ziqiu Xue (xue@rite.or.jp) Research Institute of Innovative Tech. for the Earth Purpose of Nagaoka Pilot Project World CCS Projects(@2000)
SQUEEZING THE BAKKEN: SUCCESSFUL SQUEEZE PROGRAMS LEAD TO SHIFT CHANGE IN BAKKEN SCALE CONTROL
 SQUEEZING THE BAKKEN: SUCCESSFUL SQUEEZE PROGRAMS LEAD TO SHIFT CHANGE IN BAKKEN SCALE CONTROL WILLISTON BASIN PETROLEUM CONFERENCE KEVIN SPICKA, PHD May 3, 2017 1 Outline Background Product Qualification
CANADA BRITISH COLUMBIA WATER QUALITY MONITORING AGREEMENT
 CANADA BRITISH COLUMBIA WATER QUALITY MONITORING AGREEMENT WATER QUALITY ASSESSMENT OF KETTLE RIVER AT MIDWAY (1972 2) Prepared by: BWP Consulting Kamloops, B.C. January, 23 Environment Canada Environnement
Appendix C: Water Quality Data
 Appendix C: Water Quality Data Your Project #: 111257005 Site: TIM HORTONS SYLVIA LAKE NSD # 16300R Attention: DAVID WHETTER STANTEC CONSULTING LTD 603-386 BROADWAY AVENUE WINNIPEG, MB CANADA R3C
DATA QUALITY OBJECTIVES QUALITY ASSURANCE PROJECT PLAN. Christopher Garduño1
 11 QUALITY ASSURANCE CHAPTER 11: QUALITY ASSURANCE 1 Christopher Garduño1 1 Quality Assurance Specialist, U.S. Bureau of Reclamation, Mid Pacific Region, Sacramento, California 95825. Email: cgarduno@usbr.gov
Summary of Observations and Analysis of Field Techniques for Assessing Hydrology and Water Quality of Ground Water
 Summary of Observations and Analysis of Field Techniques for Assessing Hydrology and Water Quality of Ground Water Field Test Kits 1 Chloride 2 Sulfate 3 Nitrate 3 Alkalinity 4 Iron and Manganese 4 Dissolved
GAS WELL/WATER WELL SUBSURFACE CONTAMINATION
 GAS WELL/WATER WELL SUBSURFACE CONTAMINATION Rick Railsback Professional Geoscientist CURA Environmental & Emergency Services rick@curaes.com And ye shall know the truth and the truth shall make you free.
Characterization and Modeling to Examine the Potential for CO 2 Storage and Enhanced Oil Recovery in the Bakken Petroleum System
 Characterization and Modeling to Examine the Potential for CO 2 Storage and Enhanced Oil Recovery in the Bakken Petroleum System Williston Basin Petroleum Conference Regina, Saskatchewan April 29, 2015
Golden Sunlight Mine Bio-Treatment of Acid Producing Waste. By Rory Tibbals Operations Superintendent
 Golden Sunlight Mine Bio-Treatment of Acid Producing Waste By Rory Tibbals Operations Superintendent Golden Sunlight Mine Gold Producing Mine 2.5 Million Ounces Produced 20 Year Operation Ore and All
Monitoring and Verification of CO 2 Geological Storage sites
 Monitoring and Verification of CO 2 Geological Storage sites Gabriel Marquette Algiers, 31 st May 2010 IEF- GCCSI Symposium on CCS Session 1: Latest Developments in Technology, Regulatory and Financial