Tyson Broiler Ammonia Emission Monitoring Project: Final Report. Iowa State University and University of Kentucky
|
|
|
- Jeremy Fleming
- 6 years ago
- Views:
Transcription
1 : Final Report Prepared by Iowa State University and University of Kentucky Key Project Personnel: Robert Burns Iowa State University Hongwei Xin Iowa State University Rich Gates University of Kentucky Hong Li Iowa State University Steve Hoff Iowa State University Lara Moody Iowa State University Doug Overhults University of Kentucky John Earnest University of Kentucky Other Project Personnel: Ross Muhlbauer Tim Shepherd Carl Pederson Zhi Ping Zhu Jeremiah Davis Heidi Anderson Brian Zelle Shafi Rahman Nurun Nahar Lana Meyer Adam Cook Jay Duncan Beth Ramey Guillerma Maia Maria Amaral Anshu Singh Linda Stanton Marcello Brauer Filipe Nascimineto Ricardo Vigodeiras Jamie Pursewell Steve Trabue Ken Casey Date of Report: May 1, 27
2 Executive Summary This report describes the measurement methodologies and results of ammonia (NH 3 ) emissions from two typical Tyson broiler production houses located in western Kentucky over more than 13 months involving six flocks per house, 12 flocks total of emissions data. Continuous measurement over a one-year period allowed for delineation of variations in emissions due to seasonal effects, animal growth cycles, and litter conditions. The study was led by Iowa State University (ISU), in collaboration with the University of Kentucky (UK). Data from this study adds to and improves the national inventory on ammonia emissions from animal feeding operations (AFOs), especially broiler houses in the southeastern United States. The two broiler houses monitored in this study are designated as Tyson 1-5 or T1-5 and Tyson 3-3 or T3-3 in this report. The monitoring periods reported are 1/7/5 11/27/6 for T3-3 and 12/9/5 1/9/7 for T1-5. Note that ammonia monitoring began on 1/1/5 in both houses, but no birds were placed in T1-5 until 12/9/5, explaining the different emissions reporting periods. The ammonia emissions reported in this study are based on continuous measurements of ammonia concentration in the inlet and exhaust air and the corresponding mechanical ventilation rate at each broiler house. Two Mobile Air Emissions Monitoring Units (MAEMUs), housing state-of-the-art measurement equipment, calibration accessories, and data acquisition systems, were developed at Iowa State University and used for this monitoring project. Prior to the initiation of monitoring, a series of performance tests were conducted to confirm that the monitoring systems were working as designed and to determine representative locations for air sampling points. An EPA Category 1 Quality Assurance Project Plan (QAPP) a substantial, 4-page document that outlines the methodologies for the project was developed by the monitoring team at ISU and UK. This Category 1 QAPP was reviewed and approved by EPA. In addition, the project underwent and passed a technical audit by Battelle personnel (contractors hired by EPA) confirming conformance of the project implementation with our QAPP. The magnitude of ammonia emissions in this study is expressed as daily mean, daily maximum, flock total, during downtime (i.e., between flocks), and annual total on the basis of per bird, per animal unit (AU, = 5 kg or 11 lb live body weight) or per 1, bird-places, with a 1% or less uncertainty. These respective values are: a) 12-flock daily mean (± standard deviation) emission of 3.8 ± 2. lb/d-house or.91 ± 1.29 lb/au-d; b) maximum grow-out daily emission of 67.4 lb/d-house for T1-5 and 78.2 lb/d-house for T3-3; c) mean (± SD) flock total emission of 1545 ± 298 lb/flock; d) mean (± SD) downtime emission of 19.3 ± 18.2 lb/d-house; and e) annual (365-d) emission (including downtime emissions) of 5.1 US tons per house or 78 lb/1, bird-places (or 35 g/yr-bird-place). Flocks on new litter had a lower emission rate of 27.2 ± 2.6 lb/d-house, as compared to 32 ± 19.6 lb/d-house for flocks on built-up litter. Ammonia emission tended to be higher during the warmer weather. Bird age is the predominant influencing factor on ammonia emissions. As such, an empirical equation has been established that relates ammonia emission to bird age for the monitored broiler houses. Compared with the ammonia emission factor of 1 g/yr-bird used by the US EPA, the magnitude of emission revealed from this study is 35% of the EPA cited value. Final Report-Page 1
3 Introduction Ammonia emissions from animal feeding operations (AFOs) have been estimated to represent the largest portion of the national ammonia emissions inventory in the United States (Battye et al. 1994). According to the most recent estimates by EPA (25), broilers constitute 54% of poultry contributions to the U.S. ammonia inventory, and 14.8% of animal agriculture emissions. A comprehensive review by the National Academy of Science (NAS, 23) regarding air emissions data pertaining to the U.S. AFOs concluded that such data are lacking for U.S. animal production conditions. The review called for collection of baseline emission data and development of process-based models to predict such air emissions. The objective of this study was to determine and report NH 3 emissions based on continuous measurement of NH 3 concentrations and fan flow data over a one-year period from two broiler houses representative of commercial broiler production in the southeastern United States. The emissions data presented in this report were collected using continuous ammonia emissions monitoring over a 13+ month period at two Tyson broiler production houses in western Kentucky. Monitoring System Description Study Sites and Monitoring System Overview Two broiler houses associated with Tyson Foods broiler operations in western Kentucky were monitored for NH 3 emissions. The locations of the monitored facilities in Kentucky are shown in Figure 1, and the location of the specific house at each site is shown in aerial photos in Figure 2. The monitored broiler production houses use tunnel ventilation and static pressure controlled box air inlets along the sidewalls (Figure 3), which is representative of the typical production practices in terms of housing style (e.g., tunnel ventilation) and environmental control strategy (e.g., pancake brooder along with space heaters), bird management (e.g., half-house brooding), and typical litter management and handling schemes (e.g., de-caking houses between flocks). To continuously quantify dynamic NH 3 emissions from broiler production systems, an accurate and responsive measurement system was needed. The mass of NH 3 emitted from a facility is the product of the NH 3 concentration and volume of air exchanged through the facility. The use of intermittent ventilation by cycling of the ventilation fans off and on, especially when the birds were young, made it necessary to coincide in-house pollutant concentrations to periods of fan operation in order to calculate representative emissions. The NH 3 emission measurement system for this project used a photoacoustic NH 3 analyzer (- 2 ±.2 ppm; INNOVA 1412, INNOVA AirTech Instruments A/S, Denmark) in conjunction with a multi-point sample acquisition system and calculation of exhausted air volumes based on curves developed using the Fan Assessment Numeration System (FANS) developed in the US. Each broiler house had its own Mobile Air Emissions Monitoring Unit (MAEMU) that housed air pollutant and fan flow monitoring systems, and provided an environment-controlled instrument space as shown in Figure 4. Air samples from the broiler house sampling points (representing the exhaust air streams) to the instrument trailer/analyzers were protected against in-line Final Report-Page 2

4 moisture condensation with insulation and temperature-controlled resistive heating cable. Fan operational status and building static pressure were both continuously monitored (1-second intervals). These data were used in conjunction with individual fan operation curves to calculate the flow rate exhausted by each fan during operation. A real-time data acquisition system (DAQ) program was developed using LabView 7 software (National Instruments, Corporation, Austin, TX) and used to acquire data, automate sampling location control, display real-time data, and deliver data and system operation status as shown in Figures 5 and 6. Each MAEMU housed a gas sampling system, gas analyzers, environmental instrumentation, a computer, data acquisition system, and other peripheral devices or equipment needed for the study. The sampling periods were 13 and 13.6 months for Tyson 1-5 and Tyson 3-3, respectively. Gaseous samples were continuously collected and analyzed every 3 seconds, with every fourth concentration value used in the emission calculation. Using this approach gaseous emissions were sampled continuously on a 12-second interval. Emissions were calculated using the concentrations measured when the house ventilation system was in operation. The 13-plus months duration assured that the project characterized long-term emissions, hence the impacts of climatic conditions of different seasons and grow-out cycles (litter age and condition). Tyson #1 House 5 Tyson #3 House 3 Figure 1. Broiler house air emission measurement sites in Kentucky. Final Report-Page 3


5 Figure 2. Aerial photos indicating the locations of each monitored broiler house. Figure 3. Tunnel ventilation fans and static pressure-controlled box air inlets representative of typical southeastern broiler facilities. Final Report-Page 4

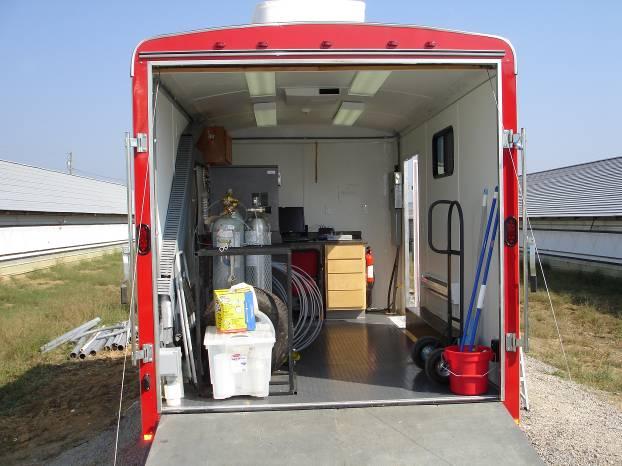


6 Figure 4. Environmentally-controlled Mobile Air Emissions Monitoring Units (MAEMU). Figure 5. Screen display of the broiler emissions monitoring program developed in LabView 7. Final Report-Page 5
, were built in the early 9s, and were located at two farm sites 4 miles apart in western Kentucky.")
7 Figure 6. Photographical view of the positive-pressure sampling system used in the study. Site Characteristics The two broiler houses, each measured 13.1 m x m (43 x 51 ft), were built in the early 9s, and were located at two farm sites 4 miles apart in western Kentucky. The houses had insulated drop ceilings (about R19), box air inlets (15 x 66 cm or 6 x 26 inch) along the sidewalls (26 per sidewall), 26 pancake brooders (8.8 kw or 3, Btu/hr each), three space furnaces (65.9 kw or 225, Btu/hr each), four 91-cm (36-in) diameter sidewall exhaust fans spaced about 36.6 m (12 ft) apart, and ten 123-cm (48-in) diameter tunnel fans. The 91-cm (36-in) fan (SW1) for minimum ventilation was located in the brood end of the houses away from the tunnel end. Two 24-m (8-ft) sections of evaporative cooling pads were located in the opposite end of the tunnel fans. The houses were also equipped with foggers for additional cooling, if needed. Rice hulls were used as litter bedding in both Tyson 1-5 and Tyson 3-3. Flock Characteristics The starting times of the ammonia emission monitoring were Oct 7, 25 and Dec 9, 25 for Tyson 3-3 and Tyson 1-5, respectively. By the 365 day mark of the monitoring at each site, five flocks had been completed for each house and the sixth flocks were ongoing in the two houses (Table 1). The study was continued through the sixth flock at both houses. At the end of the monitoring, six flocks were monitored from each house and ending dates were Nov 27, 27 and Jan 9, 27 for Tyson 3-3 and Tyson 1-5, respectively. Each house had an initial placement of 25,8 Cobb-Cobb straight-run (mixed sex) broilers in winter and 24,4 in summer, generally grown to 53 days of market age. The actual average grow-out periods were 51 d and 52 d for Tyson 1-5 and Tyson 3-3 respectively. A bird scale was placed in each house to continuously monitor the bird weight. Bird mortality was also recorded, allowing for expression of emission on the basis of per bird or per 5 kg animal unit (AU). Both houses had new litter at the beginning of the monitoring. During the one-year period, one cleanout of the litter was performed for Tyson 1-5 on Aug 26, 26 (after 4 flocks) and new bedding was placed on Aug 29, 26; Tyson 3-3 did not have a litter cleanout during the monitoring period. Final Report-Page 6
8 Table 1. Description of in-flock and between-flock information during the ammonia emission monitoring period Tyson 1-5 Tyson 3-3 Start Date End Date Flock name House Condition Litter condition # of birds placed Total # of days Monitored # of days 12/9/5 1/28/6 Flock 1 Occupied New 25, /29/6 2/13/6 Empty built-up /14/6 4/4/6 Flock 2 Occupied built-up 25, /5/6 4/2/6 Empty built-up /21/6 6/9/6 Flock 3 Occupied built-up 22, /1/6 6/21/6 Empty built-up /22/6 8/1/6 Flock 4 Occupied built-up 24, /11/6 9/4/6 Empty New/builtup /5/6 1/25/6 Flock 5 Occupied new 25, /26/6 11/16/6 Empty built-up /17/6 1/9/7 Flock 6 Occupied built-up 25,8 * /7/5 11/29/5 Flock 1 Occupied New 25, /3/5 12/14/5 Empty built-up /15/5 2/3/6 Flock 2 Occupied built-up 25, /4/6 2/19/6 Empty built-up /2/6 4/1/6 Flock 3 Occupied built-up 25, /11/6 5/21/6 Empty built-up /22/6 7/11/6 Flock 4 Occupied built-up 24, /12/6 7/27/6 Empty built-up /28/6 9/19/6 Flock 5 Occupied built-up 24, /2/6 1/4/6 Empty built-up /5/6 11/27/6 Flock 6 Occupied built-up 25, * This flock had unexpected high mortality due to the improper vaccine procedure in the hatchery. Monitoring System Specifics Ammonia concentrations of the background and exhaust air are measured with an advanced photoacoustic NH 3 analyzer (INNOVA 1412, INNOVA AirTech Instruments A/S, Denmark), an EPA-accepted measurement equipment for AFO NH 3 emission monitoring. This type of analyzer has been widely used by European scientists and recently used by U.S. scientists in AFO air emission studies (Fenyvesi, et al., 21, Nicks et al., 23, Guarino et al., 23). These units proved to be accurate, responsive and stable over a one-year period of use. The INNOVA 1412 multi-gas analyzer was setup with a 1-second (s) sampling integration time and fixed flushing time: 2 s for the chamber and 3 s for the tubing; and the required time to complete one sampling cycle for NH 3, carbon dioxide and dew-point temperature measurements was approximately 22 s. The response time of the analyzer to step changes in gas concentrations was tested. The Final Report-Page 7
9 response time for the measured concentration to reach 98% of the calibration gas value (T-98) for the given NH 3 calibration gas was 88 seconds using NH 3 calibration gas of both 22.8 and 6.8 ppm (±2% accuracy) (Matheson Gas Products, Inc., Montgomeryville, PA). Thus, four measurement cycles (88 seconds) were required to reach the 98% response level for NH 3. Using this approach, the first three readings were discarded and only the fourth reading was used for emission calculations. In April, 26 hydrocarbon and nitrous oxide filters were added to the INNOVA 1412s. The time to complete a single measurement cycle increased from 22 seconds to 3 seconds. In turn this increased the time to complete four cycles from 88 seconds to 12 seconds. As before, only the fourth cycle measurements were used for emissions calculations. Air samples were drawn from three locations in each house as well as from an outside location to provide ambient background data (Figure 7). One sampling location was near the primary minimum ventilation (36-in) sidewall fan (SW1) used for cold weather ventilation (in the brooding half of the house). The second sampling location was near the fourth sidewall (36-in) fan (SW3, non-brooding end). The third location was at the tunnel end (TE). The ambient sample location (A) was between the inlet boxes opposite of the sidewall with the exhaust fans. The quantity of gas in the background (inlet) air was subtracted from that in the exhaust air when calculating aerial emissions from the house. Placement of the air sampling ports were as follows: for the two sidewall sampling locations, the sampling ports and temperature sensors were located 1.2 m (4. ft) away from the fan in the axial direction, 2.3 m (7.5 ft) in the radial direction, and 1 m (3 ft) above the floor; for the tunnelend sampling location, the sampling port and temperature sensor were located at the center across the house (for example, 6.6 m or 21.5 ft from each sidewall) and 7.3 m (24. ft) from the end wall. Sampling locations and placement of the sampling ports were chosen to maximize representation of the air leaving the houses. Each sample inlet point was equipped with a dust filter to keep large particulate matter from plugging the sample tubing, servo valves and ultimately the measurement instrument. A positive pressure gas sampling system (PP-GSS) was used in the MAEMU for measurement of broiler house air emissions (Figure 8). The PP-GSS features continuous drawing of sample air from all locations with individual pumps. The sample air is bypassed when not analyzed. The schedules of sampling events and sequences are as follows. If the ventilation fans at the three in-house sampling locations (SW1-location 1, SW3-location 2 and TE-location 3) were all running, air samples from each location were collected sequentially via the controlled operation of the servo values of the PP-GSS. In this case, sampling/analysis sequence was SW1, SW3, and TE, and the cycle repeated. The time of analysis per sampling episode for each location was 12 s, involving four consecutive 3-s readings by the INNOVA 1412 multi-gas analyzer. The fourth reading was considered to be the equilibrium value of the location and used in the subsequent calculation of emission rate. The selection of 12-s sample analysis time was based on extensive laboratory tests and field verification with calibration gases and concurrent measurement of the sampling location by INNOVA 1412 analyzers located inside the house and inside the MAEMU. If fans at SW3 or TE were not running (for example, during half-house Final Report-Page 8
10 brood), sample analysis was repeated for the SW1 location only, and the same was true for TE sampling when fans at SW1 and SW3 were not running (for example, during tunnel ventilation mode). Every two hours, air samples from the ambient (background) location were drawn and analyzed for 8 minutes. The longer sample analysis time for the ambient point was to account for the longer response time of the instrument when measuring a large step change in gas concentration. Selection of the 2-hour interval for the analysis of the ambient concentrations was due to the fact that the ambient conditions remained relatively constant, as compared to the in-house conditions. Such an arrangement helped maximize the number of data points collected for the exhaust air and thus, house emissions. Tyson 1-5 Drawing not to scale = Ambient air sampling point = 36 sidewall fan = Pressure Differential Sampling Point T = Temperature sample point = 48 fan = Air sampling point RH = Relative Humidity sample point = TEOM sampling point B = Barometric pressure sample point 51 (outside) SW1 SW 52 SW3 SW 5 43 Evaporative Coolers T, T, Brood Curtain Note: Curtain aligns with end of Feed Bin Pad T Fan Numbers T, RH, B Control Room Feed Bin 22 Trailer Gravel Pad 277 Ditch Tyson 3-3 Drawing not to scale = 36 sidewall fan = 48 = Ambient air sampling point = Pressure Differential Sampling = Air sampling point = TEOM sampling point T RH B = Temperature sample = Relative Humidity sample = Barometric pressure sample (outside) SW1 SW SW3 SW Evaporative Coolers T, Brood T, Note: Curtain aligns with end of Feed Bin Pad T Fan Numbers Control Room Conc Pad Feed Bin 24 T, RH and B Trailer Extended gravel Figure 7. Schematic layout of Tyson 1-5 and Tyson 3-3 broiler hosues. Final Report-Page 9
11 Exhaust Ambient air P 1 Red line: heated line S8 S4 INNOVA 1412 API 11E Location 1 P 2 S7 S3 VIG 2 Location 2 P 3 S6 S2 M1 M2 Exhaust Flow meter Location 3 P 4 S5 S1 Compact Fieldpoint DAQ Filter Filter P: Pump M: Manifold S: Solenoid S1-4: Normal Closed S5-8:Normally Open Figure 8. Schematic representation of the positive pressure gas sampling system (PP-GSS) used in the MAEMU for measurement of broiler house air emissions. The PP-GSS continuously collected air from all locations with location-specific pumps. Teflon tubing (Fluorotherm FEP tubing) of.95-cm (3/8-inch) o.d. and.64-cm (1/4-inch) i.d. was used to deliver the sample air. The sample air is bypassed when not analyzed. Use of individual pumps to continuously draw air from the respective sampling locations reduces line-purging time and eliminates possible cross-location residual effect, especially between ambient/background air and exhaust air samples. The choice of sequential sampling was based on the assumption that any concentration changes at the given location during the two adjacent measurements (generally 36 seconds) followed a linear pattern. Hence, linear interpolation from the two adjacent measured values was used to determine intermediate values for the location, as needed. Use of one sampling location at the tunnel fan end also assumed good mixing of air and thus uniform distribution of the aerial concentrations. Examination of ammonia concentrations across the house in this section, through concurrent measurements using four INNOVA 1412 analyzers, confirmed the validity of this assumption. Moreover, it was assumed and validated that the vertical stratifications in aerial concentrations were negligible when the exhaust fans were in operation. Incidentally, appreciable vertical stratifications existed when the fans were off. Only samples collected when fans were operating were used for the calculation of ammonia emissions from the broiler houses. Final Report-Page 1
12 Ventilation rates of the houses were measured using the following procedure. First, all the exhaust fans were calibrated in situ, individually and in combined operational stages, with a state-of-the-art fan assessment numeration system (FANS) to obtain the actual ventilation curves (airflow rate vs. static pressure) (Gates et al., 24). This calibration was essential to the accurate measurement of the house ventilation rate because actual fan airflow rates can vary in excess of 25% from one another and from the nominal values supplied by the fan manufacturer (Figure 9). The deviation arises from the field operational conditions that differ drastically from those under which the default values were established, e.g., loose motor belt, and dirty shutter or fan blades. After the actual airflow curves were established for all of the exhaust fans and their combinations, runtime of each fan was monitored and recorded continuously using an inductive current switch (with analog output) attached to the power supply cord of each fan motor (Figure 1). Analog output of the current switches was connected to the compact Fieldpoint modules. Concurrent measurement of the house static pressure was made with two static pressure sensors (Model 264, Setra, Boxborough, MA), each for half of the house. While the pressure differential was not expected to differ at the two locations, two sensors were used to provide redundancy in this critical measurement. Summation of airflows from the individual fans during each monitoring cycle or sampling interval produced the overall house ventilation rate. This method of determining dynamic ventilation rates of mechanically ventilated animal confinement has been successfully used in recent AFO air emission studies in the United States. 18 Variation in airflow rates among.9-m (36 inch) and 1.2-m (48 inch) fans, as measured with the FANS " fans Fan airflow rate, cfm " fans cfm = 1.7 m 3 /hr 1 inch WC = pa Static Pressure, inch WC Figure 9. Variation in fan airflow rates among the 36-in and 48-in fans in Tyson 1-5 broiler house. Final Report-Page 11
 were measured with robust and stable temperature (Type T thermocouple, Cole-Parmer, Vernon Hills, IL) and RH probes (HMW6, Vaisala, Woburn,")

13 Fan runtime sensor Fan calibration by FANS unit Figure 1. Photographical views of the fan operational sensor and the FANS unit. Indoor and outdoor temperature and relative humidity (RH) were measured with robust and stable temperature (Type T thermocouple, Cole-Parmer, Vernon Hills, IL) and RH probes (HMW6, Vaisala, Woburn, MA) that were connected to the PC-based data acquisition system (DAQ). In addition, portable temperature/rh loggers were used as back-ups. Analog output of the static pressure sensors was also connected to the DAQ. All the variables of NH 3 concentration, fan runtime, static pressure, air temperature and RH were continuously measured and recorded at one-minute intervals throughout the one-year study period. The collected raw data were archived and backed up each day. Emission Rate Determination Ammonia emission rate (ER) from a broiler house to the atmosphere is the difference between the quantity of ammonia leaving the house and the quantity of ammonia entering the house. The relationship of ER to NH 3 concentration of inlet and exhaust air and building ventilation rate may be expressed as following: [ NH ] ρ e 6 m std ER = Qe 3 [ NH e 3] i 1 ρi Vm Ta w T P P a std [1] where ER = NH 3 emission rate for the house (g hr -1 house -1 ) Q e = ventilation rate of the house at field temperature and barometric pressure (m 3 hr -1 house -1 ) [NH 3 ] i = NH 3 concentration of incoming house ventilation air, parts per million by volume (ppm v ) [NH 3 ] e = NH 3 concentration of exhaust house ventilation air of the house (ppm v ) w m = molar weight of NH 3, g mole -1 V m = molar volume of NH 3 gas at standard temperature ( C) and pressure (1 atmosphere) (STP), m 3 mole -1 Final Report-Page 12

![seen from equation [1] and description of the variables shown above, multiple measurements were required to determine the ammonia emission rate.](/docs-images/76/74316229/images/14-1.jpg "System Checks Accuracy is defined as the degree of agreement between an observed value and an accepted reference value and includes a combination of random error (precision) and systematic error")
14 T std = standard temperature, K T a P std P a ρ e ρ i = absolute house temperature, ( C ) K = standard barometric pressure, kpa = atmospheric barometric pressure for the site elevation, kpa = air density at exhaust fan, kg dry air m -3 moist air = air density at outside conditions, kg dry air m -3 moist air As can be seen from equation [1] and description of the variables shown above, multiple measurements were required to determine the ammonia emission rate. System Checks Accuracy is defined as the degree of agreement between an observed value and an accepted reference value and includes a combination of random error (precision) and systematic error (bias). In this study, the following accuracy checks were implemented: Gas analyzers Exhaust fans flow rate Static pressure sensors Relative humidity sensors Barometric pressure sensor GSS leakage and pump delivering flow rate The response times of the analyzers were tested in the lab prior to installation in the field. The actual on-site performance of the sampling system was further tested. Tests were performed by injecting ammonia span gas into the in-house sampling port of the longest sampling line (tunnel end, see Figure 11). The results of INNOVA 1412 analyzers from both houses are shown in Figures 12 and 13. For both sampling systems, the fourth ammonia concentration readings (3 s X 4=12 s) reached 96% and 97% of the span concentration. Final Report-Page 13
15 Figure 11. Picture of span gas injection at the in-house sampling point INNOVA 1412 Tyson 1-5_Tunnel Percentage,% NH3 Concentration, ppm : :3 1: 1:3 2: 2:3 3: 3:3 4: 4:3 5: 5:3 6: 6:3 7: Time,min:sec Figure 12. Response time check of the sampling system and INNOVA analyzer at Tyson 1-5. INNOVA 1412 Tyson 3-3_Tunnel Percentage,% NH3 Concentration, ppm 2 5 : :3 1: 1:3 2: 2:3 3: 3:3 4: 4:3 5: 5:3 Time, min:sec Figure 13. Response time check of the sampling system and INNOVA analyzer at Tyson 3-3. In addition to span gas challenge of the entire system at the farthest in-house sampling location, tests were conducted to compare the readings of a calibrated INNOVA 1412 analyzer located Final Report-Page 14
.")
16 inside the monitoring trailer with three other calibrated INNOVA 1412 analyzers located at three sampling locations in the broiler house (SW1, SW3 and TE). The three in-house INNOVA 1412 analyzers continuously took samples during the entire testing period (Figure 14). All INNOVA 1412 analyzers were synchronized and calibrated with the same NH 3 calibration gases before the test. Figure 14. One of the three in-house INNOVA analyzers used to compare readings by its counterpart inside the MAEMU. At Tyson 1-5, the number of sampling cycles for the INNOVA in the MAEMU per location was set to 4, 6 or 8 cycles per location to test the response time effect. The NH 3 readings by the INNOVA 1412 in the MAEMU were compared with the respective readings by the three inhouse INNOVA 1412s (Figure 15). Only the last readings from the MAEMU in each sampling cycle for each location were compared with the most recent readings from the INNOVAs in the house. Five pairs of readings for each sampling cycle setting at each location were taken. A two-way ANOVA test was used for the statistic analysis. There was neither a sampling number effect nor location effect (P =.37). Table 2 provides a comparison of continuous in-house NH 3 readings with those obtained from location cycling by the MAEMU INNOVA at 4, 6, and 8 sampling iterations for Tyson 1-5 (unit: ppm). The results indicate that the NH 3 reading in the MAEMU matched the reading in the house at all three locations and there was no difference in using 4, 6 and 8 sampling iterations at each location. Hence, four sampling iterations were chosen to maximize the sampling frequency for each location. Because the fan operation period could be as short as 3 seconds while the birds were young and during cold weather, it was essential to quickly move between the sample locations to capture the temporal variability in ammonia concentration arising from the intermittent (on/off) operation of the fans. Since the NH 3 reading in the MAEMU matched the reading in the house at each location, it indicated that there was no leakage in the entire sampling system. The same test was conducted for Tyson 3-3 and yielded the same results. Final Report-Page 15
17 During weekly field visits, each sampling line was checked by connecting a flow meter at the pump-end and blocking the in-house sampling port (Figure 16). If the flow meter read zero, it indicated no leakage in the sampling line under the negative pressure (from the in-house sampling port to the corresponding sampling pump inside the MAEMU). This (no leakage) was the case throughout the monitoring period. Table 2. Comparison of in-house NH 3 readings by respective INNOVA analyzers with those obtained from location cycling by the INNOVA analyzer inside the MAEMU. NH 3(in-house) NH 3(MAEMU) No. of sampling For sampling locations of (ppm) P=.37 Iterations SW1 SW3 Tunnel Mean SD a a a.39 Mean.39 b.9 b.19 b Total mean.22 SD Total SD.5 *Column or row means with the same superscript letter are not significantly different (P>.1) Location Mean (ppm) SD SW1.45 a.46 SW3.3 a.83 Tunnel -.27 a.98 Total.3.82 *Column means with the same superscript letter are not significantly different (P>.1) Comparison and Sample Frequency Test at Tyson 15, Feb 8 26 Ammonia Concentration, ppm samples per location 8 samples per location NH3_sw1_Trailer NH3_sw3_Trailer NH3_T_Trailer NH3-sw1 NH3-sw3 NH3-Tunnel 6 samples per location 5 13:12 13:4 14:9 14:38 15:7 15:36 16:4 Time, hr:min Figure 15. Comparison of ammonia readings from the MAEMU and in-house INNOVAs. Final Report-Page 16
18 Flow meter 2 Flow meter 1 Pump Sampling tubing GSS Board Figure 16. Schematic representation of the gas sampling system integrity (leakage) check. Quality Assurance/Quality Control of Data Collection and Analysis Strict Quality Assurance/Quality Control (QA/QC) procedures were followed throughout the data collection and data analysis processes. All the measurement instruments underwent initial checks and calibrations, followed by regular operational checks or calibration. The frequency of such check/calibration depended on the instrument. For instance, the NH 3 gas analyzer was checked with calibration gases weekly or semi-weekly, even though our past experience had indicated that this type of photo-acoustic NH 3 analyzer demonstrated an excellent stability. Calibration gases were certified with concentration of 22.6, 22.8, or 25 ppm ammonia (Balanced in air, certified grade with 2% accuracy, Matheson Tri-gas, PA). The INNOVA 1412 analyzers were checked once a week before February 26 and then were checked twice a week after February 26 to meet our data quality goal. The QC standard of instrument calibration is 5%. Based on the regular check results, the INNOVA 1412 analyzers were calibrated twice at Tyson 1-5 and three times at Tyson 3-3 during the grow-out periods. Internal technical system performance evaluations were performed between flocks. The broiler houses had approximately two weeks of downtime (i.e., empty between flocks). However, the downtime at Tyson 3-3 was 41 days after the first flock due to change of the managerial personnel at the site. During each downtime, ISU and UK project personnel conducted a thorough internal technical systems audit at each site. This audit included a visual inspection of all system components, and a flow check at each of the four sample points. During the system performance evaluation, the INNOVA 1412 analyzers were recalibrated. All temperature sensors were checked against a certified thermometer for every flock. The RH sensors and pressure sensors were checked or calibrated against a calibrated sensor or a RH sensor calibration kit (HMK 15, Vaisala, Woburn, MA) every six months. If the check result fell outside of 5% QC standard, recalibration would be performed and the corresponding data would be corrected, following a linear relationship between values from the previous check and current check. Final Report-Page 17
19 The performance curves of the fans were checked after each flock. All the exhaust fans were cleaned before the start of a new flock. An uninterrupted power supply (UPS) was used for the DAQ system to avoid loss of data due to power outage. An external technical systems audit was conducted at both sites on September 25-26, 26 by independent personnel from Battelle, commissioned by EPA. As described in the QAPP, a data processing program was run daily to process the data collected on the previous day. This program calculated data completeness and automatically flaged out-of-range data. ISU project personnel reviewed the flagged data within two working days to confirm that the data were either invalid and should be excluded or valid and should be kept. To avoid errors introduced into determination of average values due to partial data days, which would result in biased time weights, only complete-data days (CDD) that included over 75% valid data were used in calculating average daily means (ADM). Based on the on-site surveillance and daily data flagging/review, daily data completeness for each variable was calculated. Uncertainty Analysis of Emission Rate Component error analysis is used to quantify uncertainty when a quantity such as daily emission rate is calculated from multiple measurements, each with its own degree of accuracy or uncertainty. A component error analysis (Doeblin, 199) provides statistical meaning to a statement on the magnitude of error in the calculation of daily emission rate. This analysis had been performed for an earlier project that measured broiler house ammonia emissions and documented in a copyrighted Ph.D. dissertation (Casey, 25) and a manuscript in preparation (Casey et al., 27). The uncertainty analysis of ER for this study is described in detail in the project QAPP. The resultant ER uncertainty was 1% or less based on the accuracies of the associated measurement components. Consequently, data quality objectives (DQOs) and measurement quality objectives (MQOs) were developed in the QAPP to guide the achievement of 1% or less ER uncertainty. Data Completeness Results and Discussion Data completeness is a measure of the amount of valid data obtained from a measurement system, expressed as a percentage of the number of valid measurements that should have been collected (USEPA, 22. EPA Guidance for Quality Assurance Project Plans. EPA QA/G- 5). In this study, a data completeness goal of 75% of the scheduled sampling was established. The data completeness is primarily affected by unpredictable field events, including instrument malfunction, power outage (e.g., from adverse weather), and broiler house maintenance. When any of these events occurred, the corresponding emission data were flagged. The starting times of ammonia emission monitoring were Oct. 7, 25 and Dec. 9, 25 for Tyson 3-3 and Tyson 1-5, respectively. By the one-year mark (Oct. 6, 26 for Tyson 3-3 and Dec. 8, 26 for Tyson 1-5), five full flocks had been monitored at each site; the 6th flock had been monitored for 22 days for Tyson 1-5 and two days for Tyson 3-3. For the 365-d annual emission calculation, the Final Report-Page 18
20 CDDs to date are 355 out of 365 days (97.2% data completeness) and 346 out of 365 days (94.8% data completeness), respectively, for Tyson 1-5 and Tyson 3-3. Therefore, a total of 71 house-day emission data were used for the analysis of the annual emission. The monitoring was continued through the sixth flock at both houses for a full set of the sixth flock data; the ending dates of the monitoring were Nov 27, 26 and Jan 9, 27 for Tyson 3-3 and Tyson 1-5, respectively. By the end of the six flocks, the CDDs were 387 out of 397 days (97.5% data completeness) for Tyson 1-5 and 398 out of 417 days (95.4% data completeness) for Tyson 3-3. The 785 house-day (12 flocks) emission data were used for the emission rate of daily mean, daily maximum, flock total, and during downtime. The complete data days (CDDs) for each flock and in-between are summarized in Table 1. Diurnal Variation of Ammonia Emission Rate The ammonia ER is a combination of the difference in ammonia concentration between the exhaust air and the inlet air and building ventilation rate (VR). The diurnal variation of ammonia ER, concentration and VR, expressed as hourly averages for two growth periods on cold and warm days are shown in Figure 17. The hourly ammonia ER on the warm days had a clear diurnal pattern following the VR. During cold weather, the hourly ammonia ER had less variation. The coefficient of variation (CV) of hourly ER on Day 38 of Flock 4 for Tyson 1-5 on July 29, 26 was 16%. In contrast, the CV on Day 39 of Flock 6 for Tyson 1-5 was 6.2% on December 25, 26. The CV of hourly ER on Day 5 for flock 5 and flock 6 for Tyson 1-5 was 79.6% and 8.1%, respectively. The considerable diurnal variation in flock 5 coincided with a warm day and the lower CV in flock 6 corresponded to a cold day with only minimum ventilation. Liang et al. (25) reported similar daily ammonia ER variation trends for laying hen houses. Final Report-Page 19
21 NH3 Concentration, ppm NH3 Concentration, ppm NH3 Concentration, ppm NH3 Concentration, ppm Tyson1-5_Flock6_Day 5 (11/21/26) NH3 concentration (sw1),pppm NH3 concentration (sw3),ppm VR, cfm : 4: 8: 12: 16: 2: : Time, hr:min Tyson1-5_Flock5_Day 5 (9/9/26). : 4: 8: 12: 16: 2: : Time, hr:min NH3 concentration (sw1),pppm NH3 concentration (sw3),ppm VR, cfm Tyson1-5_Flock4_Day 38 (7/29/26) : 4: 8: 12: 16: 2: : Time, hr:min NH3 concentration (Tunnel),ppm VR, cfm Tyson1-5_Flock6_Day 39 (12/25/26) NH3 concentration (sw1),pppm NH3 concentration (sw3),ppm VR, cfm : 4: 8: 12: 16: 2: : Time, hr:min VR, CFM/house VR, CFM/house VR, CFM/house VR, CFM/house NH3 ER, lb/hr-house NH3 ER, lb/hr-house NH3 ER, lb/hr-house NH3 ER, lb/hr-house Tyson1-5_Flock6_Day 5 (11/21/26) Bird body weight=.168 lb Bird age=5-d CV=8.1%. : 4: 8: 12: 16: 2: : Time, hr:min Tyson1-5_Flock5_Day 5 (9/9/26) Bird body weight=.221 lb Bird age=5-d CV=79.6%. : 4: 8: 12: 16: 2: : Time, hr:min Tyson1-5_Flock4_Day 38 (7/29/26) Bird body weight=4.156 lb Bird age=38-d CV = 16%. : 4: 8: 12: 16: 2: : Time, hr:min Tyson1-5_Flock6_Day 39 (12/25/26) Bird body weight=4.4 lb Bird age=39-d CV=6.2%. : 4: 8: 12: 16: 2: : Time, hr:min Figure 17. Diurnal patterns of exhaust ammonia concentration, ventilation rate (VR), and ammonia emission from the two broiler houses. Final Report-Page 2
22 Emission Rate Figures 18 and 19 provide the daily ammonia ER for the two houses for the entire monitoring period with six full flocks and downtime between flocks. The daily ER (lb/d-house) varied from to 98.6 lb/d-house. When the houses were occupied by birds, the highest ER was 67.4 and 78.2 lb/d-house for Tyson 1-5 and Tyson 3-3, respectively. The highest daily emission of 98.6 lb/dhouse occurred at Tyson 1-5 between flock 2 and flock 3. The highest emission happened on April 6, 26 when the litter was disturbed during litter-decaking operation (see Figure 18 c). Note that the emissions between the vertical dash lines in Figures 18 and 19 represent periods between flocks when no birds were in the houses (i.e., downtime). The ammonia ERs (.55 ±.42 lb/d-house) from the flocks with new litter were significantly less than those (13.36 ± 5.88 lb/d-house) with built-up litter during the first 6 days of grow-out (P<.1). After that, ERs with new litter began to increase rapidly with bird age. For the flocks with built-up litter, the ammonia ERs were relatively stable during the first 2-3 weeks and then increased. The flocks with new litter did not show significantly higher ER than those with built-up litters (P=.86) when the bird age was 7-d or older. There was a trend that the ERs reached the peak after 5-6 weeks and tended to be stable till the end of the flocks. During grow-out period, the ERs for the three flocks on new litter was 27.2 ± 2.6 lb/d-house, which is significantly lower than 32. ± 19.6 lb/d-house for the nine flocks raised on built-up litter. The ERs of all flocks varied from 25.7 lb/d-house to 37.7 lb/d-house, except flock 6 in Tyson 1-5 (Table 3). Flock 6 in Tyson 1-5 had over 4% of cumulative mortality by the end of the flock due to a vaccination complication, leading to a much lower ER of 18.6 lb/d-house. The average ER for Tyson 1-5 over the six flocks was 27.6 ± 17.2 lb/d-house which is significantly lower (from statistical standpoint) than 34 ± 21.9 lb/d-house for Tyson 3-3 (P=.1). The average NH 3 ER for Tyson 3-3 downtime between flocks was 13.9 ± 15. lb/d-house. In contrast, the average ER at Tyson 1-5 for downtime between flocks was 26.2 ± 19.5 lb/d-house. Tyson 1-5 had two flocks with new litter while Tyson 3-3 only had one flock with new litter. Flock 4 in both houses and flock 5 in Tyson 3-3 had higher ERs than the other flocks under the warm weather conditions when the house ventilation system was in the tunnel mode to keep the birds cool. The overall ER of all 12 flocks was 3.8± 2. lb/d-house. Final Report-Page 21
23 Daily Average VR, CFM/house Tyson1-5 Flock1 Flock2 Flock3 Flock4 Flock5 Flock6 (a) 12/9/5 1/8/6 2/7/6 3/9/6 4/8/6 5/8/6 6/7/6 7/7/6 8/6/6 9/5/6 1/5/6 11/4/6 12/4/6 1/3/7 Daily Average Toutside, o F (b) /9/5 1/8/6 2/7/6 3/9/6 4/8/6 5/8/6 6/7/6 7/7/6 8/6/6 9/5/6 1/5/6 11/4/6 12/4/6 1/3/7 Ammonia ER, lb/d-house Flock1 Flock2 Flock3 Flock4 Flock5 Flock6 Newbedding Newbedding Newbedding Newbedding (c) 12/9/5 1/8/6 2/7/6 3/9/6 4/8/6 5/8/6 6/7/6 7/7/6 8/6/6 9/5/6 1/5/6 11/4/6 12/4/6 1/3/7 Figure 18. Daily ammonia emission, ventilation rate and outside temperature over the six flocks for Tyson 1-5. Final Report-Page 22
24 Daily Average VR, CFM/house Tyson3-3 Flock1 Flock2 Flock3 Flock4 Flock5 Flock6 Newbedding Newbedding (a) 1/7/5 11/6/5 12/6/5 1/5/6 2/4/6 3/6/6 4/5/6 5/5/6 6/4/6 7/4/6 8/3/6 9/2/6 1/2/6 11/1/6 Daily Average Toutside, o F (b) /7/5 11/6/5 12/6/5 1/5/6 2/4/6 3/6/6 4/5/6 5/5/6 6/4/6 7/4/6 8/3/6 9/2/6 1/2/6 11/1/6 Ammonia ER, lb/d-house Flock1 Flock2 Flock3 Flock4 Flock5 Flock6 (c) 1/7/5 11/6/5 12/6/5 1/5/6 2/4/6 3/6/6 4/5/6 5/5/6 6/4/6 7/4/6 8/3/6 9/2/6 1/2/6 11/1/6 Figure 19. Daily ammonia emission,ventilation rate and outside temperature over the six flocks for Tyson 3-3. Final Report-Page 23
25 Tyson1-5 Tyson3-3 Starting time Ending time Table 3. Summary of ammonia emission rates for the two broiler houses monitored Flock name House Condition [ a ] Cumulative Emission, ER, lb/d-house ER, g/bird-d ER, g/au-d [b] lb/house Mean S.D Max Min Mean S.D Max Min Mean S.D Max Min 12/9/5 1/28/6 Flock 1 O /29/6 2/13/6 E /14/6 4/4/6 Flock 2 O /5/6 4/2/6 E /21/6 6/9/6 Flock 3 O /1/6 6/21/6 E /22/6 8/1/6 Flock 4 O /11/6 9/4/6 E /5/6 1/25/6 Flock 5 O /26/6 11/16/6 E /17/6 1/9/7 Flock 6 [c] O Tyson 1-5 between flocks E Tyson 1-5 all 6 flocks O /7/5 11/29/5 Flock 1 O /3/5 12/14/5 E /15/5 2/3/6 Flock 2 O /4/6 2/19/6 E /2/6 4/1/6 Flock 3 O /11/6 5/21/6 E /22/6 7/11/6 Flock 4 O /12/6 7/27/6 E /28/6 9/19/6 Flock 5 O /2/6 1/4/6 E /5/6 11/27/6 Flock 6 O Tyson 3-3 between flocks E Tyson 3-3 all 6 flocks O All between flocks E All 12 flocks O [a] House condition O: Occupied; E: Empty [b] AU: 5 kg animal unit [c] This flock had unexpected high mortality due to the improper vaccine procedure in the hatchery Final Report-Page 24
26 Emission rate per animal unit Figures 2 and 21 present ammonia ER in terms of 5 kg animal unit (g/au-d) for all 12 flocks from the two houses. The ERs per AU versus bird age show the different trends for the flocks with new litter and built-up litter. The ERs per AU of three flocks with new litter (Tyson 1-5 flocks 1 and 5, and Tyson 3-3 flock 1) increased from very lower levels and the peak occurred after d bird age. The ERs per AU of the flocks with built-up litter started high but relatively trended to be stable with bird growth. Specifically, at the beginning of each flock with built-up litter, ER per AU varied from 1.4 to 5.5 kg/au-d (Table 3). There was no significant difference between Tyson 1-5 and Tyson 3-3 in ER per AU (P=.97). The daily ERs per AU were ± and ± g/au-d for Tyson 1-5 and Tyson 3-3, respectively. The overall ER per AU was ± g/au-d. 6 5 Tyson1-5(12/9/25-1/28/26)_Flock1 NH3, g Outside Temp, of Tyson1-5 (2/14/26-4/4/26)_Flock2 NH3, g Outside Temp, of 9 7 NH3 ER, g/au-d Outside Temperature, o F NH3 ER, g/au-d Outside Temperature, o F Bird age, day Bird age, day -3 6 Tyson1-5 (4/21/26-6/9/26)_Flock3 9 6 Tyson1-5 (6/22/26-8/1/26)_Flock4 9 NH3 ER, g/au-d NH3, g Outside Temp, of Outside Temperature, o F NH3 ER, lg/au-d NH3, g Outside Temp, of Outside Temperature, o F Bird age, day Bird age, day -3 NH3 ER, g/au-d Tyson1-5 (9/5/26-1/25/26)_Flock5 NH3, g Outside Temp, of Outside Temperature, o F NH3 ER, g/au-d Tyson1-5 (11/17/26-1/9/27)_Flock6 NH3, g Outside Temp, of 4-d missing Outside Temperature, o F Bird age, day Bird age, day -3 Figure 2. Tyson 3-3 NH 3 ER per AU (5 kg) mean outside temperature vs. bird age Final Report-Page 25
27 6 5 Tyson3-3 (1/7/25-11/28/25) NH3, g Outside Temp, of Tyson3-3 (12/15/25-2/3/26)_Flock2 NH3, g Outside Temp, of 9 7 NH3 ER, g/au-d d missing Outside Temperature, o F NH3 ER, g/au-d Outside Temperature, o F Bird age, day Bird age, day Tyson3-3 (2/2/26-4/1/26)_Flock3 NH3, g Outside Temp, of Tyson3-3 (5/22/26-7/11/26)_Flock4 9 7 NH3 ER, g/au-d d missing Outside Temperature, o F NH3 ER, g/au-d NH3, g Outside Temp, of 3-d missing Outside Temperature, o F Bird age, day Bird age, day -3 6 Tyson3-3 (7/28/26-9/19/26)_Flock5 9 6 Tyson3-3 (1/5/26-11/27/26)_Flock6 one day missing NH3 ER, g/au-d NH3, g Outside Temp, of one-d missing Outside Temperature, o F NH3 ER, g/au-d NH3, g Outside Temp, of Outside Temperature, o F Bird age, day Bird age, day -3 Figure 21. Tyson 3-3 NH 3 ER per AU (5 kg) mean outside temperature vs. bird age Emission rate during downtime between flocks Ammonia emissions from the two houses were continuously monitored when the houses were empty between flocks or during downtime. Ventilation rate (VR) of the houses had a significant impact on the ER when the VR was lower than 8, cfm (Figure 22). However, it was also related to the litter management practice, e.g. litter decaking. The average ER for Tyson 1-5 and Tyson 3-3 downtime between flock periods was 26.2 ± 19.5 and 13.9 ± 15. lb/d-house, respectively. The overall ER for the two houses during downtime was 19.3 ± 18.2 lb/d-house. These values are approximately two-thirds of the mean ER when birds were present in the houses. Final Report-Page 26
Use of CO 2 Concentrations or CO 2 Balance to Estimate Ventilation Rate of Modern Commercial Broiler Houses
 An ASABE Meeting Presentation Paper Number: 64156 Use of CO 2 Concentrations or CO 2 Balance to Estimate Ventilation Rate of Modern Commercial Broiler Houses H. Xin 1, H. Li 1, R. T. Burns 1, R. S. Gates
Air Emissions from Tom and Hen Turkey Houses in the U.S. Midwest
 Agricultural and Biosystems Engineering Publications Agricultural and Biosystems Engineering 2011 Air Emissions from Tom and Hen Turkey Houses in the U.S. Midwest Hong Li Iowa State University Hongwei
Use of CO2 Concentration Difference or CO2 Balance to Assess Ventilation Rate of Broiler Houses
 Agricultural and Biosystems Engineering Publications Agricultural and Biosystems Engineering 2009 Use of CO2 Concentration Difference or CO2 Balance to Assess Ventilation Rate of Broiler Houses Hongwei
Ammonia Emissions from Twelve U.S. Broiler Chicken Houses
 Agricultural and Biosystems Engineering Publications Agricultural and Biosystems Engineering 26 Ammonia Emissions from Twelve U.S. Broiler Chicken Houses Eileen F. Wheeler Pennsylvania State University
Propane Saving in Poultry Farm through Waste Heat Recovery System
 Heat Equivilent (Gallon/day) Ambient Temperature, F Introduction Propane Saving in Poultry Farm through Waste Heat Recovery System Dr. Shawn Yunsheng Xu, Tingsheng Xu, and Dr. Robert Reed College of Engineering,
AIR EMISSIONS FROM TWO SWINE FINISHING BUILDING WITH FLUSHING: AMMONIA CHARACTERISTICS
 This is not a peer-reviewed article. Livestock Environment VII, Proceedings of the Seventh International Symposium, 18-2 May 25 (Beijing, China) Publication Date 18 May 25, ASAE Publication Number 71P25.
Ammonia Emissions from U.S. Laying Hen Houses in Iowa and Pennsylvania
 Agricultural and Biosystems Engineering Publications Agricultural and Biosystems Engineering 25 Ammonia Emissions from U.S. Laying Hen Houses in Iowa and Pennsylvania Yi Liang Iowa State University Hongwei
Performance of an Infrared Photoacoustic Single Gas Analyzer in Measuring Ammonia from Poultry Houses
 Agricultural and Biosystems Engineering Publications Agricultural and Biosystems Engineering 215 Performance of an Infrared Photoacoustic Single Gas Analyzer in Measuring Ammonia from Poultry Houses Hong
WV Poultry Energy Audits
 WV Poultry Energy Audits Completed energy audits of four farms in 2009 April 30, May 7, May 21, & May 27 Collaboration between the WVU Industrial Assessment Center and IOF-WV Funded by the WV Division
In house composting of litter between flocks is a litter management technique of growing interest in the poultry industry. This procedure is also
 In house composting of litter between flocks is a litter management technique of growing interest in the poultry industry. This procedure is also called in-house pasteurization and windrowing. The basic
Windrowing Poultry Litter Pros and Cons
 Windrowing Poultry Litter Pros and Cons Casey W. Ritz, Ph.D. Department of Poultry Science The University of Georgia 2009 Georgia Poultry Conference or How to do it Right Acknowledements Bud Malone, Malone
TEST REPORT. EVALUATION CENTER Intertek Testing Services NA Inc Murphy Drive Middleton, WI 53562
 TEST REPORT REPORT NUMBER: 102741836MID-001bR2 REPORT DATE: October 24, 2016 REVISED REPORT DATE: August 7, 2017 REVISED REPORT DATE: August 11, 2017 REVISED REPORT DATE: September 6, 2017 EVALUATION CENTER
Electricity and Fuel Use of Aviary-Laying Hen Houses in the Midwestern United States
 Agricultural and Biosystems Engineering Publications Agricultural and Biosystems Engineering 2014 Electricity and Fuel Use of Aviary-Laying Hen Houses in the Midwestern United States Morgan D. Hayes Iowa
Controls and Software CHORE-TRONICS 2 Controls
 Controls and Software 2 Controls Chore-Time s Controls and Software Make House Management Easier and More Convenient Dependable hardware technology and software algorithms Chore-Time s Controls are industry
Sub Wet-Bulb Evaporative Chiller
 Emerging Technologies Sub Wet-Bulb Evaporative Chiller Prepared by: Emerging Products Customer Service Southern California Edison June 2015 Acknowledgments Southern California Edison s Emerging Products
HEAT RECUPERATION IN VENTILATION SYSTEM OF BASEMENT LABORATORY
 HEAT RECUPERATION IN VENTILATION SYSTEM OF BASEMENT LABORATORY Alena Krofova, Pavel Kic Czech University of Life Sciences Prague krofovaa@tf.czu.cz, kic@tf.czu.cz Abstract. Basement spaces in many university
Online Gas Analyzer / Monitor
 Sheet No. 1 of 9 CH4 H2 SOX NOX NH3 CO2 HF HCL HCN CO O2 Providing the latest in Combustion Gas & Emission Analyzers for Boiler, Engine, Furnace, and other applications. Sheet No. 2 of 9 Vasthi OMGA 8000
CHAPTER 6 : GAS SAMPLING SYSTEMS
 CHAPTER 6 : GAS SAMPLING SYSTEMS 1 Scope : 1.1 This Chapter describes two types of gas sampling systems in paragraphs 2.1 and 2.2 meeting the requirements specified in para 4.2 of Chapter 3 of this Part.
Reducing ammonia emissions from laying-hen houses through dietary manipulation
 This article was downloaded by: [Hongwei Xin] On: 31 January 2012, At: 18:21 Publisher: Taylor & Francis Informa Ltd Registered in England and Wales Registered Number: 1072954 Registered office: Mortimer
Methane emission from naturally ventilated livestock buildings can be determined from gas concentration measurements
 DOI 10.1007/s10661-011-2397-8 Methane emission from naturally ventilated livestock buildings can be determined from gas concentration measurements Bjarne Bjerg & Guoqiang Zhang & Jørgen Madsen & Hans B.
Hourly Analysis Program v.4.1 Page 1 of 1
 Air System Design Load Summary for Zona 11 DESIGN COOLING DESIGN HEATING COOLING DATA AT Dec 1700 HEATING DATA AT DES HTG COOLING OA DB / WB 33.1 C / 23.5 C HEATING OA DB / WB -0.6 C / -3.2 C Sensible
Hourly Analysis Program v.4.1 Page 1 of 1
 Air System Design Load Summary for Zona 8 DESIGN COOLING DESIGN HEATING COOLING DATA AT Dec 1700 HEATING DATA AT DES HTG COOLING OA DB / WB 33.1 C / 23.5 C HEATING OA DB / WB -0.6 C / -3.2 C Sensible Latent
ECMPS Reporting Instructions Quality Assurance and Certification
 ECMPS Reporting Instructions Quality Assurance and Certification United States Environmental Protection Agency Office of Air and Radiation Clean Air Markets Division 1310 L Street, NW Washington, DC 20005
ENERGY EFFICIENCY AND EMISSION REDUCTION OF TPM, PM 2.5, AND SO 2 FROM NATURAL GAS AND FUEL OIL FIRED BOILER EXHAUSTS
 ENERGY EFFICIENCY AND EMISSION REDUCTION OF TPM, PM 2.5, AND SO 2 FROM NATURAL GAS AND FUEL OIL FIRED BOILER EXHAUSTS Robert W. Triebe, M.A.Sc., P.Eng. CTO, Thermal Energy International Inc. Robert A.
DIRECTIONAL-BORE GROUND SOURCE HEAT PUMP FIELD REPORT
 PROJECT REPORT DIRECTIONAL-BORE GROUND SOURCE HEAT PUMP FIELD REPORT Rio Mondego, California August 214 WESTERN COOLING EFFICIENCY CENTER PREPARED FOR: Bruce Baccei Project Manager Sacramento Municipal
Southwest Clean Air Agency NE 99 th St, Suite 1294, Vancouver, WA 98682
 Source Test Guidance Test plans are required to be submitted to SWCAA prior to testing. Generally the plans must be submitted 2 weeks prior to testing but may be different based on individual facility
Online data sheet MCS100E HW-C CEMS SOLUTIONS
 Online data sheet MCS100E HW-C A B C D E F H I J K L M N O P Q R S T Ordering information Type MCS100E HW-C Part no. On request The exact device specifications and performance data of the product may deviate
Air Quality Measurements at a Laying Hen House: Experimental Methods 1 A. J. Heber 2, J.-Q. Ni, and T.-T. Lim
 ABSTRACT Air Quality Measurements at a Laying Hen House: Experimental Methods 1 A. J. Heber 2, J.-Q. Ni, and T.-T. Lim Measurements of air emissions from confined animal buildings are perhaps more challenging
For Safe and Delicious Water
 RESIDUAL CHLORINE ANALYZER 400G NON-REAGENT FREE CHLORINE ANALYZER FC400G 400G RESIDUAL CHLORINE ANALYZER FC400G NON-REAGENT FREE CHLORINE ANALYZER Bulletin 12F01A01-01E www.yokogawa.com/an/ For Safe and
ANSI/ASHRAE STANDARD , METHODS OF TESTING CHILLED BEAMS
 ANSI/ASHRAE STANDARD 200-2015, METHODS OF TESTING CHILLED BEAMS NEMIC 2017 Agenda 1. Foreword 2. Purpose & Scope 3. Definitions 4. Instrumentation & Facilities 5. Test Methods 6. Reporting 7. Normative
DOWNSTREAM DEFENDER TESTING USING MAINE DEPARTMENT OF ENVIRONMENTAL PROTECTION PROTOCOL UTILIZING OK-110 FEED SAND
 DOWNSTREAM DEFENDER TESTING USING MAINE DEPARTMENT OF ENVIRONMENTAL PROTECTION PROTOCOL UTILIZING OK-110 FEED SAND JULY 2002 Copyright 2001 H.I.L. Technology, Inc. All rights reserved. This report was
VENTILATION REQUIREMENTS TO PREVENT PIT AIR UP-DRAFTING IN
 This is not a peer-reviewed article. Pp. 05-030 in Swine Housings II Proceedings of the -5 October 003 Conference (Research Triangle Park, North Carolina USA), Publication Date October 003. ASAE Publication
AIR QUALITY IN SWINE-FINISHING BARNS 1
 Swine Day 2000 Contents AIR QUALITY IN SWINE-FINISHING BARNS 1 B. Z. Predicala 2, R. G. Maghirang 2, R.D. Goodband, S. B. Jerez 2, and J.E. Urban 3 Summary Air quality was assessed in two commercial swine-finishing
WBEA Standard Operating Procedure
 Page 1 WBEA Standard Operating Procedure SOP Title Procedures for operating continuous R&P TEOM PM 10 and PM 2.5 Analyzers Author Implementation date February 1 st 2013 Revision History Revision # Date
APPENDIX 4. Task 4. Evaluate solar walls performance and GHG impact. Evaluate the
 APPENDIX 4 Task 4. Evaluate solar walls performance and GHG impact. Evaluate the performance of existing solar walls in terms of energy use and GHG emissions. I. Building-specific degree day data and solar
Administrative Building Cooling Tower. University of Tennessee Chattanooga
 Administrative Building Cooling Tower University of Tennessee Chattanooga Ben Dalton Lab Partner: Murat Ozkaya ENCH 435 Dr. Jim Henry December 2, 2008 Abstract Experimental data was taken at the air inlet
Transfield Services Limited
 Eastlink Ambient Air Quality Monitoring NATA Accreditation No: 14184 Eastlink Ambient Air Quality Monitoring System Report 1 st June 2010 30 th June 2010 Report issue date: 15 th July 2010 Maintenance
Leveraging Smart Meter Data & Expanding Services BY ELLEN FRANCONI, PH.D., BEMP, MEMBER ASHRAE; DAVID JUMP, PH.D., P.E.
 ASHRAE www.ashrae.org. Used with permission from ASHRAE Journal. This article may not be copied nor distributed in either paper or digital form without ASHRAE s permission. For more information about ASHRAE,
Design and development of a residential gas-fired heat pump
 Design and development of a residential gas-fired heat pump Edward A Vineyard a*, Ahmad Abu-Heiba a, Isaac Mahderekal b a Oak Ridge National Laboratory, P.O. Box 2008, MS 6070, Oak Ridge, TN, 37831, USA
Unitary Air Conditioner Field Performance
 Purdue University Purdue e-pubs International Refrigeration and Air Conditioning Conference School of Mechanical Engineering 2004 Unitary Air Conditioner Field Performance Todd M. Rossi Field Diagnostic
Portable Ozone Systems for Survey Monitoring (POMS)
") Portable Ozone Systems for Survey Monitoring (POMS) John D. Ray National Park Service, Air Resources Division, Denver, CO Topics to cover: me Introduction Portable O3 system basics QA/QC and performance
Portable Ozone Systems for Survey Monitoring (POMS) John D. Ray National Park Service, Air Resources Division, Denver, CO Topics to cover: me Introduction Portable O3 system basics QA/QC and performance
Thermally operated mobile air-conditioning system
 Thermally operated mobile air-conditioning system Development and test of a laboratory prototype R. de Boer S.F. Smeding Paper to be presented on the International Sorption Heat Pump Conference 2008, Seoul,
Field Accuracy of Temperature Measurements in TAB Work Andrew P. Nolfo, PE
 Field Accuracy of Temperature Measurements in TAB Work Andrew P. Nolfo, PE The purpose of this article is to discuss the measuring and reporting of temperatures at heat transfer equipment during the Testing
Farm Energy Audit Report
 Submits this Farm Energy Audit Report To: John & Jane Grower Grower s Farm Old Town Road Anytown, US October 2010 October 2010 John & Jane Grower Grower s Poultry Old Town Road Anytown, US Dear John &
GAS 3050P NDIR FLUE GAS
 Portable gas analyser GAS 3050P NDIR FLUE GAS Industrial flue gas analysis Powerful, robust and transportable on any industrial site, the GAS 3050P NDIR FLUE GAS analyser offers the same performances as
DETERMINATION OF CONCENTRATION AND MASS FLOW OF PARTICULATE MATTER IN FLUE GAS FOR STATIONARY SOURCE EMISSIONS
 MS 1596: 2003 DETERMINATION OF CONCENTRATION AND MASS FLOW OF PARTICULATE MATTER IN FLUE GAS FOR STATIONARY SOURCE EMISSIONS Presented BY: UiTM A&A Laboratory Malaysia s 1 st University Affiliated Environmental
THE LEADER IN PERFORMANCE INDOOR AIR QUALITY MEASUREMENTS
 THE LEADER IN PERFORMANCE INDOOR AIR QUALITY MEASUREMENTS INDOOR AIR QUALITY INSTRUMENTS UNDERSTANDING, ACCELERATED BREATHE A LITTLE EASIER WITH TSI Indoor air quality is a growing concern. With the increasing
Food Service Technology Center
 Food Service Technology Center Nu-Vu X5 Electric Proofer/Convection Oven Test Report Application of ASTM Standard Test Method F1496-13 February 2015 Prepared by: Kong Sham Fisher-Nickel, Inc. Prepared
Large University Central Chiller Plant Design Considerations
 Carrier Engineering Newsletter Volume 5, Issue 3 Large University Central Chiller Plant Design Considerations Large campus chilled water plants have unique constraints and need careful evaluation for successful
HIGH CAPACITY HEATING SYSTEM BY USING FLUE GAS COOLING DEVICE.
 HIGH CAPACITY HEATING SYSTEM BY USING FLUE GAS COOLING DEVICE Edmunds Visockis 1, Gotfrids Noviks 1, Raimunds Selegovskis 2 1 Rezekne Higher Education Institution, Latvia 1 Rezekne Higher Education Institution,
MEASUREMENTS OF PERFLUOROCARBON EMISSIONS FROM NORWEGIAN ALUMINUM SMELTERS
 1 MEASUREMENTS OF PERFLUOROCARBON EMISSIONS FROM NORWEGIAN ALUMINUM SMELTERS Halvor Kvande, Helge Nes and Lars Vik 1 Hydro Aluminium Metal Products Division, N-0240 Oslo, Norway 2 Elkem Aluminium Mosjøen,
DEMAND CONTROLLED VENTILATION (DCV) SYSTEMS
 SYSTEMS") DEMAND CONTROLLED VENTILATION (DCV) SYSTEMS Mari-Liis Maripuu, PhD CIT Energy mari-liis.maripuu@cit.chalmers.se Swegon Air Academy, Portugal, 27 May 211 Outline Introduction Concept of a DCV system Adapting
DEMAND CONTROLLED VENTILATION (DCV) SYSTEMS Mari-Liis Maripuu, PhD CIT Energy mari-liis.maripuu@cit.chalmers.se Swegon Air Academy, Portugal, 27 May 211 Outline Introduction Concept of a DCV system Adapting
Using the PPM2 Portable Trace Moisture Transmitter
 APPLICATION NOTE 2016_0106 PPM2 Using the PPM2 Portable Transmitter The Model PPM2 Portable analyzer is a compact, cost effective, analyzer specifically designed to continuously measure low levels of moisture
Plant Utilities and Energy Efficiency CH505
 Plant Utilities and Energy Efficiency CH505 Teaching Scheme Course code CH505 Course Name Plant Utilities and Energy Efficiency Teaching scheme L T P Credit 3 0 0 3 Process Process is simply a method by
Figure Heat pump model validation in heating mode: power consumption percentage error between model and experiment
 Percent Error 20% 18% 16% 14% 12% 10% 8% 6% 4% 2% Deviation by Uncertainty Analysis RMS Error (10:00 AM -- 11:30 AM):12.1% 0% 9:07 9:50 10:33 11:16 12:00 Time Figure 7.30. Heat pump model validation in
Proposed Guidelines for the Reduction of Nitrogen Oxide Emissions from Natural Gas fuelled Stationary Combustion Turbines
 Proposed Guidelines for the Reduction of Nitrogen Oxide Emissions from Natural Gas fuelled Stationary Combustion Turbines Environment and Climate Change Canada May 2016 Table of Contents 1. Foreword...
Bedding and boarding while transporting pigs to slaughter-choosing the right amount
 Bedding and boarding while transporting pigs to slaughter-choosing the right amount Avi Sapkota, TTU Anna Butters-Johnson, Assoc. Professor, ISU John J. McGlone, PhD, Professor, TTU June 6 th, 2012 Overview
YORK UNITIZED ENERGY RECOVERY VENTILATOR (ERV) Superior air-flow 300 6,200 CFM
 Superior air-flow 300 6,200 CFM") YORK UNITIZED ENERGY RECOVERY VENTILATOR (ERV) Superior air-flow 300 6,200 CFM YORK UNITIZED ENERGY RECOVERY VENTILATORS Regardless of building type or rating system, today s building must be as energy
YORK UNITIZED ENERGY RECOVERY VENTILATOR (ERV) Superior air-flow 300 6,200 CFM YORK UNITIZED ENERGY RECOVERY VENTILATORS Regardless of building type or rating system, today s building must be as energy
Performance Comparison of Air-source Heat Pumps Using Economizer Vapor Injection and Internal Heat Exchanger in Cold Regions
 Purdue University Purdue e-pubs International Refrigeration and Air Conditioning Conference School of Mechanical Engineering 2016 Performance Comparison of Air-source Heat Pumps Using Economizer Vapor
Are You Really Ready for a RATA? August 5, 2015 CIBO Portland Maine Bob Davis Project Director TRC Environmental
 Are You Really Ready for a RATA? August 5, 2015 CIBO Portland Maine Bob Davis Project Director TRC Environmental So What is a RATA? R Relative A Accuracy T Test A Audit It compares data from a facility
Application of a cooling tower model for optimizing energy use
 Advances in Fluid Mechanics X 305 Application of a cooling tower model for optimizing energy use G. C. O Mary & D. F. Dyer Department of Mechanical Engineering, Auburn University, USA Abstract The overall
Size: length ft., bay width ft., number of bays: Square feet of floor space: Sq. ft. of bench/floor space covered by crops:
 Greenhouse Energy Conservation Checklist/Audit (Adapted by A.J. Both, Rutgers University, and Paul Fisher, University of Florida from a checklist developed by John W. Bartok Jr., Professor Emeritus, University
EVALUATION OF THE THERMAL PERFORMANCE OF FIVE REFRIGERATED VANS
 EVALUATION OF THE THERMAL PERFORMANCE OF FIVE REFRIGERATED VANS S. ESTRADA-FLORES, A. EDDY and N. SMALE Supply Chain Innovation, Food Science Australia PO Box 52, North Ryde, NSW 7, Australia. Fax: +61
Energy Recovery Ventilation Equipment
 ANSI/AHRI Standard 1060 (I-P) 2014 Standard for Performance Rating of Airto-Air Exchangers for Energy Recovery Ventilation Equipment Approved by ANSI on May 15, 2015 IMPORTANT SAFETY DISCLAIMER AHRI does
Giuseppe Giordano Founder & CEO
 Giuseppe Giordano Founder & CEO www.enerbrain.com 1 Your innovation partner for a sustainable future 40% of the world s energy is consumed by buildings US Green Building Council and yet, how often have
3SP_CO_1000 Package
 15x15 CO Sensor 1000 ppm Package 110-102 BENEFITS Small Size with Low Profile (20x20x3.8 mm) Long Life (10 years expected life) Fast Response (< 15 seconds) Robust (passes 5000 ppm overload) Low Power
Chilled Water Plant Redesign
 17 Chilled Water Plant Redesign OVERVIEW The chilled water plant redesign includes the addition of a thermal energy storage system. This allows for economic and operational benefits for the facility by
METHOD 3 - GAS ANALYSIS FOR THE DETERMINATION OF DRY MOLECULAR WEIGHT. NOTE: This method does not include all of the
 312 METHOD 3 - GAS ANALYSIS FOR THE DETERMINATION OF DRY MOLECULAR WEIGHT NOTE: This method does not include all of the specifications (e.g., equipment and supplies) and procedures (e.g., sampling) essential
Silica Analyzer. Automated Silica Measurement Dependable and Sensitive
 Silica Analyzer 2800Si Silica Analyzer Fully automatic calibration Trace sensitivity Grab sample capability Low maintenance Automated Silica Measurement Dependable and Sensitive Silica Analyzer 2800S i
TVOC Heated FID VE 7
 Rack Mount/Table Top THC Analyzer TVOC Heated FID VE 7 The VE7 19"/5PU rack mount and table top heated emission analyzer for the continuous determination of the mass concentration of total gaseous organic
HYSYS WORKBOOK By: Eng. Ahmed Deyab Fares.
 HYSYS WORKBOOK 2013 By: Eng. Ahmed Deyab Fares eng.a.deab@gmail.com adeyab@adeyab.com Mobile: 002-01227549943 - Email: adeyab@adeyab.com 1 Flash Separation We have a stream containing 15% ethane, 20% propane,
Asset Energy Calculator Guidance
 Asset Energy Calculator Guidance Introduction This section has been produced to give BREEAM In-Use assessors further guidance on the workings of the asset energy calculator so it is clear how any improvements
TRACKING THE GAS TEMPERATURE EFFECT IN A DISTRIBUTION SYSTEM
 TRACKING THE GAS TEMPERATURE EFFECT IN A DISTRIBUTION SYSTEM Eric Kelner, P.E. - Letton-Hall Group, San Antonio, TX Bryan Niebergall, P.E. - Questar Gas, Salt Lake City, UT AGA Operations Conference, Nashville,
CI/SfB (57.7) 1st edition
 1st edition") CI/SfB (57.7) 1st edition Vent-Axia Sentinel Multivent Wholehouse Mechanical Extract Ventilation System Ventilation Lo-Carbon Energy saving solutions Sentinel Multivent continuous mechanical extract ventilation,
CI/SfB (57.7) 1st edition Vent-Axia Sentinel Multivent Wholehouse Mechanical Extract Ventilation System Ventilation Lo-Carbon Energy saving solutions Sentinel Multivent continuous mechanical extract ventilation,
Persistence Tracking in a Retro-commissioning Program
 Persistence Tracking in a Retro-commissioning Program Mike Eardley Architectural Energy Corporation Synopsis The persistence of energy savings and electrical demand reductions created by retrocommissioning
Nilan VPL Active heat recovery and cooling (air/air)
") M a r k e t l e a d i n g c o m m e r c i a l a n d d o m e s t i c v e n t i l at i o n w i t h h e at r e c o v e r y Nilan 31-125 Active heat recovery and cooling (air/air) Nilan 31-125 Commercial ventilation
M a r k e t l e a d i n g c o m m e r c i a l a n d d o m e s t i c v e n t i l at i o n w i t h h e at r e c o v e r y Nilan 31-125 Active heat recovery and cooling (air/air) Nilan 31-125 Commercial ventilation
Steven L. Alderman, Michael S. Parsons, and Charles A. Waggoner. Institute for Clean Energy Technology, Mississippi State University
 The Effects of Media Velocity and Particle Size Distribution on Most Penetrating Particle Size and Filter Loading Capacity of 12 x12 x11.5 AG 1 HEPA Filters Steven L. Alderman, Michael S. Parsons, and
Fpollutant-free zero air for analytical
 Ambient Air Quality Monitoring System AQMS-100 Zero Air Generator PI AQMS-100 provides ultra pure Fpollutant-free zero air for analytical purpose. Remote monitoring and configuration can also be achieved
Horizontal Borehole Study
 Horizontal Borehole Study Richard A. Beier a and William A. Holloway b a Mechanical Engineering Technology Department b Electrical Engineering Technology Department Oklahoma State University Stillwater,
District Cooling Sustainable Design. Presented by George Berbari CEO of DC PRO Engineering
 2016 District Cooling Presented by George Berbari CEO of DC PRO Engineering District Cooling Brief History & Future Central Chilled Water plants existed in the Middle East as early as the 1960 s. Few examples
Analysis 2: Alternative Thermal Window Design
 Analysis 2: Alternative Thermal Window Design (8.1) Problem Statement: In the first analysis, the cost and environmental impacts of the addition of solar PV panels to the roof of GrandView was determined.
CEMS for Measurement of Ammonia, SO 3, and Low Level NOx
 CEMS for Measurement of Ammonia, SO 3, and Low Level NOx McIlvaine Company Hot Topic Hour Richard Himes Senior Project Manager rhimes@epri.com Chuck Dene Senior Project Manager cdene@epri.com October 22,
RESTORE 1030TM Testing Protocol
 RESTORE 1030TM Testing Protocol Test protocols will vary depending on the type of equipment being evaluated. The length of time required to do the testing, however, remains consistent no matter what the
Chilled Beams. The new system of choice?
 Chilled Beams The new system of choice? Presented By: Kevin M. Pope P.E. Jason Leffingwell Hammel Green And Abrahamson, Inc. and Ken Bauer, P.E., LEED AP Butters-Fetting Co., Inc. History of Chilled Beams
MEP's Letter of Assurance
 MEP's Letter of Assurance Instructions Multifamily Residential WELL Certification is determined by onsite Performance Verification and documentation, including Letters of Assurance from the appropriate
CT425 Optimize Your Process to Make Profits
 - 5058-CO900H 1 CT425 Optimize Your Process to Make Profits Rockwell s Model Predictive Control Technology Aaron Dodgson Pavilion Business Development Western Region aadodgson@ra.rockwell.com PUBLIC 2
LANCOM4 PORTABLE FLUE GAS MONITORING. NO NO2 NOx CO2 H2S SO2 CxHy. CO low CO high O 2 QUALITY CUSTOMER SOLUTIONS
 PORTABLE FLUE GAS MONITORING WWW.LANCOM4.COM i CO low CO high O 2 NO NO2 NOx CO2 H2S SO2 CxHy QUALITY CUSTOMER SOLUTIONS AMETEK LAND HAS BEEN MANUFACTURING PRECISION MEASURING EQUIPMENT SINCE 1947. WE
COBB Broiler Management Guide
 Introduction The Cobb commitment to genetic improvement continues to increase the performance potential in all areas of broiler and broiler breeder production. However, to attain both genetic potential
// XPLORER-NS. Full range Total Nitrogen, Total Sulfur instrument for the modern Laboratory.
 Configuration: XPLORER with ARCHIE and GLS* // XPLORER-NS Full range Total Nitrogen, Total Sulfur instrument for the modern Laboratory. TE Instruments has developed the XPLORER-NS, a Total Nitrogen and
Fluid Mechanics, Heat Transfer, Thermodynamics. Design Project. Production of Ammonia
 Fluid Mechanics, Heat Transfer, Thermodynamics Design Project Production of Ammonia Your assignment is to continue evaluating the details of a process to produce 50,000 tonne/y of ammonia from a syngas
Strategic Cost Management in Black Tea Processing
 Strategic Cost Management in Black Tea Processing Dr W S Botheju, Head Process Technology Division Te a Re se arch Institute of S ri Lank a Background Quality consumer demand driven Good Quality Tea better
Biogas analysers. Product overview. MRU over 30 years of innovative gas analysis! Biogas, landfill gas, biomethane, coal mine gas, CHP exhaust gas
 MRU over 30 years of innovative gas analysis! Biogas analysers Biogas, landfill gas, biomethane, coal mine gas, CHP exhaust gas Product overview MRU Biogas analysers Whether biogas, landfill and coal mine
Best Practice Recommendations for Wall Retrofit on the Two-Story Flexible Research Platform (FRP) at Oak Ridge National Laboratory (ORNL).
 at Oak Ridge National Laboratory (ORNL).") Best Practice Recommendations for Wall Retrofit on the Two-Story Flexible Research Platform (FRP) at Oak Ridge National Laboratory (ORNL). Wall retrofit strategies for retrofit on the interior side of
Best Practice Recommendations for Wall Retrofit on the Two-Story Flexible Research Platform (FRP) at Oak Ridge National Laboratory (ORNL). Wall retrofit strategies for retrofit on the interior side of
SG06UNINC-Series BGA/IP55/P Series in Outdoor Designed
 SG06UNINC-Series BGA/IP55/P Series in Outdoor Designed BIOGAS measurement and analysis in continuous of methane, carbon dioxide, hydrogen sulphide, oxygen and hydrogen. BGA/INCA as INnovative Case Analyzer
Maturity and Maturity Testing
 Maturity and Maturity Testing 4 May 2009 PTI Technical Conference Presented by: Matt Pittman The Transtec Group, Inc. Copyright Post-Tensioning Institute all rights reserved. Page 1 of 45 Session Overview
BACKGROUND DOCUMENT PROPOSED REVISION TO AP-42 EMISSION FACTORS FOR ESTIMATING PM 2.5 EMISSIONS FROM GAS-FIRED COMBUSTION UNITS
 BACKGROUND DOCUMENT PROPOSED REVISION TO AP-42 EMISSION FACTORS FOR ESTIMATING PM 2.5 EMISSIONS FROM GAS-FIRED COMBUSTION UNITS Submitted by: Karin Ritter American Petroleum Institute 1220 L Street NW
On-line Parameter Estimation and Control for a Pilot Scale Distillation Column
 On-line Parameter Estimation and Control for a Pilot Scale Distillation Column Lina Rueda, Thomas F. Edgar and R. Bruce Eldridge Department of Chemical Engineering University of Texas at Austin Prepared
Biofiltration is. The average odor. Treating Odor Emissions from Buildings Biofilters
 Biofiltration is an air-cleaning technology that uses microorganisms to break down gaseous contaminants and produce non-odorous end products. It is used successfully around the world for treating a wide
The Creative and Performing Arts High School (CAPA) Pittsburgh, PA 9/30/2002 Andrew Tech Mechanical Option Prof. S. A. Mumma
 Pittsburgh, PA 9/30/2002 Andrew Tech Mechanical Option Prof. S. A. Mumma") LEED Green Building Certification The purpose of the LEED Green Building Rating is to provide a national standard that aims to improve environmental, health and economic performance of buildings using
LEED Green Building Certification The purpose of the LEED Green Building Rating is to provide a national standard that aims to improve environmental, health and economic performance of buildings using
WEATHER MONITORING. Competitive rates available for long term hire. Hire rate Per week Per month
 WEATHER MONITORING ELE Weather Sensors 411 E 215 pw 646 pm Wide ranging expandable air monitoring system, particularly suitable for ambient air analysis Includes sensors for: Wind speed Wind direction