Initial geochemistry survey: East Arm Wharf and Alice Springs, Northern Territory
|
|
|
- Kristian Lionel Boyd
- 6 years ago
- Views:
Transcription

1 RADIATION APPENDIX M CONTENTS M1 M2 M3 M4 M5 Verification of radiation related figures in the Draft EIS Initial geochemistry survey: East Arm Wharf and Alice Springs, Northern Territory Statistical analysis of radionuclide survey data Assessment of radionuclide levels in three tissues from kangaroos in the Olympic Dam region Briefing paper on effects of radiation on the non-human environment 1 Olympic Dam Expansion Supplementary Environmental Impact Statement 2010
2 APPENDIX M1 Verification of radiation related figures in the Draft EIS
3 M1.1 AIM The aim of this technical report is to provide additional information to complement the information provided in the Olympic Dam Supplementary EIS. The report is in four parts, covering the following aspects: M1.2 Additional information on radiation estimates for the open pit M1.3 Additional information on radon estimates for the tailings storage facility M1.4 Additional radiation studies M1.5 Assumptions in estimating environmental radon concentrations. M1.2 ADDITIONAL SUPPORT INFORMATION ON RADIATION ESTIMATES FOR THE OPEN PIT The dose assessment for the open pit is based on a number of assumptions and calculations. The core assumptions were as follows: ore uranium grade 500 ppm mineralised basement (non-ore) uranium grade 70 ppm sedimentary cover uranium grade 5 ppm average uranium grade of entire pit (40 years) 100 ppm average uranium grade of all basement material (including ore) 200 ppm open pit dimensions diameter 4 km and depth 1.2 km nominal size (a larger diameter would result in no significant change in conclusions), volume approximately 6 km 3. M1.2.1 GAMMA DOSE TO MINERS Gamma dose rates were estimated using the formula of Thomson and Wilson (1980), which quotes 65 μsv/h for each per cent of uranium grade (i.e. 65 μsv/h/%u). The highest doses would be expected from a worker spending the whole working year (2,000 hours) on ore with a uranium grade of 500 ppm or 0.05%. For this case the dose rate would be 3.25 μsv/h, and the annual dose (2,000 hours per year) would be 6.5 msv. In practice, it would be expected that the actual gamma dose rates in the proposed Olympic Dam pit would be much lower than observed in other mines with higher ore grades. For example, at Ranger uranium mine in the Northern Territory the ore grade is almost five times higher than the Olympic Dam grade, however the reported maximum annual gamma doses at Ranger are approximately 4 msv (refer Table S2, Appendix S of the Draft EIS). In addition, the current underground workers at Olympic Dam, such as production drillers, raise drillers and production charge-up crews, receive an average dose of approximately 3 msv/y from gamma radiation even though they spend most of their work time in ore-bearing areas. It would be expected that because of the different exposure geometry (that is, the workers in underground mines are surrounded by ore, while in an open pit, the workers are generally exposed from only one direction), open pit workers would receive lower exposures than underground workers. Thus the calculated exposure is conservative when compared to actual measurements. From a practical perspective, another important factor is that many workers would be inside heavy mining equipment which provides some shielding from gamma radiation, resulting in lower measured gamma radiation rates than those calculated. Based on these factors, a realistic conservative estimate of the average gamma dose rate for pit miners was made and these were provided in Table S2 of Appendix S of the Draft EIS. M1.2.2 PIT DUST LEVELS AND POTENTIAL DOSES FROM DUST Dust exposure estimates for open pit workers were based on dust concentrations observed in other open pit uranium mines. This provided the estimate of the average radiation dose of 0.1 msv/y from dust. Conservatively, it was recognised that under certain low ventilation conditions the pit could become very dusty, and the probable maximum dust concentration was estimated from the results of dust monitoring in open cut coal mines. The 99th percentile dust concentration was 3 mg/m 3 (refer Section of Appendix S of the Draft EIS) and this was adopted as the probable maximum concentration. Doses were then determined through the standard dose conversion method outlined in ARPANSA (2005).
4 Calculating the potential dose from a dust concentration is straightforward, and an example is as follows: for 500 ppm ore, the activity of each radionuclide is 6.2 Bq/g (the specific activity of pure uranium-238 is 12,400 Bq/g, and 500 ppm equates to 0.05% of 12,400, giving 6.2 Bq/g for each radionuclide) the intake is calculated by assuming a standard breathing rate of 1.2 m 3 /h for 2,000 hours (2,400 m 3 per year) (Draft EIS, Appendix S), which results in an annual intake of 45 Bq of each radionuclide (assuming a dust concentration of 3 mg/m 3 for 500 ppm uranium in ore) for an annual intake of 45 Bq for each radionuclide, there would be a total of 215 alpha disintegrations per second (dps) for the five long-lived alpha-emitting radionuclides using the conversion factor 7.2 μsv/alpha dps (ARPANSA 2005), the resulting annual dose is 1.6 msv. Additional conservative assumptions in these calculations include the following: an implied activity median aerodynamic diameter (AMAD) of 1 μm, which is a conservative size classification S (slow) lung absorption class used for each radionuclide, which is the most restrictive class with the exception of Th-230 (the S class for Th-230 is justified because the ore is held within an insoluble matrix and therefore it is the solubility of this matrix rather than the solubility of the isotope that is likely to determine the retention in the lung) no allowance for any reduction in dust inhalation due to respiratory protection (either personal or from filtration in cab air-conditioning). The radiological hazard from occupational and environmental exposure to radioactive dust is low and one of the reasons is that the uranium ore grade is relatively low. M1.2.3 RADON IN THE PIT Radon emanation from a solid depends on its surface area. This means that emanation rates are based on the area expressed as m 2. The primary radon parameters used in the Draft EIS were the emanation rate for ore and broken ore as follows: ore 2.5 Bq/m 2 /s (for a uranium grade of 500 ppm) broken ore five times the unbroken ore level. The Draft EIS assumed that uranium ore grade and radon emanation rate were directly proportional. The assessment of radon in the pit is based on a number of factors, including measured emanation rates from Olympic Dam, theoretical emanation rates, estimates of modelled and measured pit ventilation rates and the effects of atmospheric conditions that might affect radon levels. These are explained below. Measurements of radon emanation Previous measurements of radon emanation at Olympic Dam show emanation rates as follows: 1 3 Bq/m 2 /s for ore (Sonter et al. 2002) 2.5 Bq/m 2 /s for ore, and 0.52 Bq/m 2 /s for underground tunnels (in non-ore) (BHP Billiton operational radiation monitoring results) 0.75 Bq/m 2 /s as an average of all underground surfaces (ore and non-ore) (Akber et al. 2001). When ore is broken by blasting or crushing (or both) more fissures will be introduced, and this would be expected to increase the rate of diffusion and hence the emanation rate. However, there appears to be a lack of general measurements in the literature on the emanation of radon from broken ore. It is difficult to measure the radon emanation rate from broken rock. Measurement usually involves fixing an airtight container to the sampling area to collect any radon that emanates from the sampling area. If a small sampling area (and therefore a small container) is used then it is often only effectively sealed onto one rock, and so collects radon only from that. If a large area sampler is used, it is difficult to completely seal the sampler to the matrix of broken rock, and radon may leak out between the interstices. Both of these problems are likely to lead to an underestimation of the true emanation rate. Theoretical estimates of radon emanation Measurements are available for the radon release from unbroken ore but, as noted, there is a lack of data for broken ore, or for broken waste rock. Therefore a theoretical assessment of radon emanation from broken rock was used. The method is described as follows.
5 There are three basic factors determining the rate of radon release (emanation rate) from the surface of some material: the rate of generation of radon in the material (radon generation) the fraction of radon generated that escapes from the mineral grain into the interstitial spaces of the rock or ore (emanation coefficient) the fraction of the radon that is able to diffuse through the interstitial spaces to the surface (diffusion coefficient). For broken ore, the factors were calculated as follows. Radon generation The radon generated in a material is directly related to the radium content. If the radium activity is A Ra, then A Ra atoms of radon will be formed each second. The number of atoms of radon (N Rn ) is related to the activity of radon (A Rn ) by the standard decay equation A= λ N, where λ is the decay constant for radon (2.1 x 10 6 /s). Therefore the rate of radon production (in Bq/s) is equal to the radium activity (in Bq) multiplied by 2.1 x The radium content of the material can be determined from the uranium grade, with the activity of radium-226 in the material being equal to the activity of uranium-238. The specific activity of uranium-238 is 12.4 MBq/kg, and therefore 100 ppm ore has 1,240 Bq/kg of radium-226. Radon escape into pore space (known as the emanation coefficient (ε)) Radon is formed in the mineral grain that contains the radium. The diffusion of radon out of the solid mineral grain is extremely slow, and so only those atoms of radon formed very close to the grain surface are likely to escape. The fraction of radon getting out of the mineral grain into the pore space is referred to as the emanation coefficient. Mudd (2008) reports 0.1 to 0.3 for waste rock and low-grade ore. A typical value for soil is approximately 0.2. Diffusion through pore spaces (known as the diffusion coefficient) Once the radon is out of the mineral grain, it then diffuses through the interstices of the host material. The rate of diffusion in a material is referred to as the diffusion coefficient D e (in m 2 /s). Diffusion coefficients for soils are generally about 10-6 while rock (non-porous) is about Concrete can be about 10-9, while saturated mud can be about The radon diffusion coefficient in free air (D 0 ) is 1.1 x 10⁻⁵, and this can be taken as an absolute upper limit on diffusion through a porous medium. Determining the amount of radon emanating from a material (radon emanation rate) The emanation rate at the surface of a material depends on the radon generation rate (proportional to radium concentration or ore grade), emanation coefficient (ε) and the diffusion coefficient (D). The rate of radon emanation (J) from a material (Mason et al. 1982; Yu et al. 1993; UNSCEAR 2000) can be written as: J = ε λ ρ R (D/λ)1/2 Where: ε is the emanation coefficient λ is the (radon) decay constant ρ is the density of the material R is the radium content of the material, and D is the diffusion coefficient in the medium. Typical values of emanation coefficients (ε) are about 20%. If this value is substituted into the above equation, using the experimentally determined emanation rate of 2.5 Bq/m 2 /s for (unbroken) Olympic Dam ore, then the resulting diffusion coefficients are 1.2 x Breaking the ore cannot give a diffusion constant of greater than 1.1 x 10⁻⁵ (the value in free air). The worst-case increase in diffusion coefficient is thus less than a factor of 100 (from 1.2 x 10⁻⁷ to 1.1 x 10⁻⁵ ). That is, the increase in diffusion coefficient must be somewhere between 1 (no increase: radon diffuses at the same rate as unbroken rock) and 100 (radon diffuses through broken rock at the same rate that it diffuses through free air). As the emanation rate depends on the square root of the diffusion coefficient (D 1/2 ), an increase in diffusion coefficient of a factor of 100 corresponds to an increase in emanation rate of 10. Possible increases thus range from a factor of 1 (no increase) to 10 (diffusion as in free air). A figure of 5 was selected as a reasonable representation in the increase in emanation rate from broken ore, compared to unbroken ore.
6 Radon concentrations in the proposed pit (under normal ventilation conditions) To calculate the subsequent radon concentrations, it is necessary to estimate the time that air spends in the pit. The ventilation rate under normal (non-inversion) conditions was obtained from an expression developed by Thompson (1994). τ = 33.8 (V/U r LW)*(0.7cos(θ) + 0.3) Here, τ is the residence time (s), V is the pit volume (m 3 ), Ur is the wind velocity (m/s), L and W are the pit length and width (m), and θ is the angle of the wind to the pit long axis. The pit was assumed to be circular, so the cos (θ) term was set to 1. This expression generated ventilation rates (that is, the number of times the air in the pit changes) in the range to 2.8 air changes/hour for wind speeds from 0.1 to 10 m/s. The equilibrium radon concentration was then calculated as follows: [Rn] = E R / (PV x VR) Where: [Rn] is the radon concentration E R the radon generation rate (Bq/h) PV is the pit volume VR is the number of air changes per hour. Resulting radon concentrations ranged from 1.76 to 176 Bq/m 3 for wind speeds from 10 m/s down to 0.1 m/s. The average wind speed at Olympic Dam is approximately 3.7 m/s (Kinhill 1997). A conservative wind speed of 2 m/s was adopted for this calculation, giving a radon concentration in the pit of 8.8 Bq/m 3. Radon concentrations atmospheric inversion conditions During cooler nights, stable conditions can result in temperature inversions (refer Section of the Draft EIS for reference to inversions). Calculating radon concentrations under inversion conditions requires information on the radon emanation rate, the height of the inversion above the emanating surface, and the length of time the inversion persists. To assess potential annual doses, the number of inversions occurring each year is also required. It was assumed that the inversion forms at a height of 100 m above the pit floor. Inversions at this height, or lower, are common on the surface, however there was little information on the properties of inversions within the pit at the time of writing the Draft EIS. The air quality modelling (Chapter 13 and Appendix L of the Draft EIS) indicated that when inversions formed on the surface, they may penetrate 200 to 350 m into the pit, which means they would be approximately 800 m above the pit base. The modelling was limited to 400 m below the surface. Recent work by Hibberd (2010), as outlined in Section of the Supplementary EIS, indicate that the assumption that inversions occur at 100 m above the pit floor is likely to be conservative. The area that is emanating radon into the volume below the inversion is the area of the base, and the walls to 100 m height. The base and walls were assumed to be entirely ore, with an emanation rate of 2.5 Bq/m2/s. While some ore will be broken, and thus have a higher emanation rate, some of the base and walls is also likely to be barren material and have a lower emanation rate; therefore, an average of 2.5 Bq/m 2 /s was used. The combination of the floor area and inversion height define a volume into which radon is being introduced from the floor, and the walls below the inversion. The radon concentration [Rn] after time T will thus be: [Rn] = P x T / (A x H) Where: P is the radon production rate (Bq/m 2 ) A the area of the base (m 2 ) H the inversion height (m). For the Draft EIS assessment, it was assumed that the inversion persists for 12 hours, from just after sunset to just after dawn.
7 After 12 hours, the radon concentration would reach approximately 1,700 Bq/m 3, corresponding to a radon decay product concentration (assuming equilibrium) of 9.3 μj/m 3. Therefore, the average concentration during the 12-hour period would be 850 Bq/m 3 (radon) and 4.6 uj/m 3 (radon decay products). To determine the frequency of inversions in the pit, surface inversion data were used. One approach was to use the frequency of very stable atmospheric conditions (Pasquil stability class F) which occur on 26% or 95 nights in the year (calculated from Table 8.5 in Section 8.5 of the Draft EIS). It was then assumed that the proportion of surface inversions would be the same as the proportion of inversions occurring in the pit. This is almost certainly an overestimate, as there are a number of factors, such as geothermal heating, heat from heavy machinery and differential solar heating of the pit walls, all of which are likely to promote convection or air movement within the pit. Dose assessment for pit workers In this calculation (under both the normal and atmospheric inversion conditions) it is assumed that the radon decay products were in equilibrium with radon. This is the most conservative assumption. The dose conversion factor recommended in ARPANSA 2005 (1.4 msv per mj.h/m 3 ) is then used to calculate the dose from 2,000 hours exposure to the average radon decay product concentration. The calculated dose is 0.14 msv/y. In addition to exposure from normal conditions, workers would be exposed to higher concentrations during inversions. The average radon decay product concentration during inversion conditions, over the 12-hour period, was calculated to be 4.6 μj/m 3. Using the dose conversion factor of 1.4 msv per mj.h/m 3 recommended in ARPANSA 2005, the dose resulting from this exposure is 78 μsv per 12-hour shift. A mine worker would not be likely to be present on all nights when inversions occurred. Typically, on a standard roster, they would work one night in four. Thus, a worker would be exposed to inversion conditions on about 25 nights a year, and receive a total dose of about 1.8 msv from nights worked in these atmospheric conditions. The total annual dose was therefore calculated to be approximately 2 msv, consisting of 1.8 msv during inversions and 0.14 msv from normal ventilation conditions. Note that there is some minor overlap. Doses have been calculated for a complete year for routine ventilation but the inversion contribution has been calculated in effect for an additional 26% of nights. Against that, the build-up of radon decay product concentration during inversions has been calculated from zero, whereas it would typically start from the average normal ventilation concentration. These corrections will be small and their net effect even smaller. It should also be noted that it was assumed that all workers are working within 100 m of the pit base during the inversion conditions (which would not be the case in practice). In addition, it should be noted that no allowance has been made for the use of respiratory protection, meaning that actual doses would be much lower than predicted. M1.3 ADDITIONAL INFORMATION ON RADON ESTIMATES FOR THE TAILINGS STORAGE FACILITY (TSF) Table S5 in Appendix S of the Draft EIS indicated the emanation rate for radon from the expanded tailings would be 0.5 Bq/m 2 /s. Based on this emanation rate and the exposed surface area of the tailings, the amount of radon emanating from the tailings was calculated to be 13.9 MBq/s for the completed TSF system. The emanation would peak at this level as TSF cells were progressively added until the facility reached its final design size. Additional information on the emanation rate for radon from the TSF is provided here. The primary source of the emanation rate used in the Draft EIS is based on actual measurements from the work of Akber et al.(2001). The work notes that the arithmetic mean of radon emanation from tailings was 0.48 Bq/m 2 /s; the arithmetic mean is the figure that would be used to represent the average emanation rate for the whole surface. For the purposes of the Draft EIS estimates, this figure was then rounded up to 0.5 Bq/m 2 /s and used as the basis for the expansion calculations. Akber et al. (2001) noted that during sampling it is important to prevent the release of radon that is effectively trapped in permeable layers beneath the surface, which would lead to an overestimate of the radon emanation rate. They provided evidence of this effect occurring by comparing results of measurements where the sampling device (an activated charcoal can) was pushed into the tailings. This resulted in a significant burst of radon from lower levels within the tailings, leading to an increase in measured emanation rates by a factor of six. This situation is not representative of long-term emanation from the tailings, however these figures were conservatively used in calculating the final averages.
8 Akber et al. (2001) also reviewed other earlier radon emanation rate monitoring results from Olympic Dam tailings, which gave results with an arithmetic mean of approximately 0.5 Bq/m 2 /s. In particular, they noted the results of extensive sampling from December 1993 to February 1994, in which the arithmetic mean of the sampling results was 0.53 Bq/m 2 /s and broader sampling from June 1993 to May 1994 (reported in 1994 Environmental Radiation Report) which reported a mean of 0.44 Bq/m 2 /s. In Olympic Dam Operation (ODO) 1996, results of radon emanation measurements are provided for the period 1988 to 1996, with the mean of the results being reported as 1.12 Bq/m 2 /s. Akber and others also note that ODO 1997 uses a figure of 1.27 Bq/m 2 /s. The earlier measured results (before 1994) are higher than the later results (after 1994), because the ore grade has declined over the life of the Olympic Dam mine. BHP Billiton metallurgical plant records show that the average uranium ore grade until the end of 1993 was 1,110 ppm. After this period, the average dropped to 690 ppm. Supporting evidence showing the reduction in ore grade on the radionuclide composition of the process material can also be seen directly in the results of routine radionuclide monitoring. Table 1 shows the concentration of radium-226 (in Bq/g) in the process feed material. Table 1: Change in 226 Ra levels in process feed material with time Sampling period 226 Ra concentration (Bq/g) March November February May March Comparison of the emanation rates between mines is problematic. Mudd (2008) and Sonter et al. (2002) noted that factors such as Ra-226 characteristics, moisture content and type of tailings (i.e. acid, alkaline or neutral) need to be considered. In these cases, direct measurements of emanation provide the most appropriate results (Mudd 2008). During 2010, additional radon emanation from tailings monitoring from the existing Olympic Dam TSF was undertaken by BHP Billiton radiation safety personnel using charcoal cups. A total of 31 samples were obtained, giving an average of 0.3 Bq/m 2 /s. This figure is consistent with the Draft EIS figure and confirms that a figure of 0.5 Bq/m 2 /s for radon emanation from tailings is appropriate. M1.4 ADDITIONAL RADIATION STUDIES The following additional radiation studies have been conducted since the submission of the Draft EIS. M1.4.1 GAMMA RADIATION MEASUREMENTS The Draft EIS provided estimates of gamma radiation from the side of a rail wagon containing copper concentrate and were based on first principle estimates. Additional work was conducted during the Supplementary EIS to verify these estimates and involved obtaining a bulk sample of copper concentrate and performing gamma radiation measurements. The gamma measurements were undertaken by BHP Billiton radiation safety personnel on a bulk sample of approximately 20 tonnes of material, which simulates the contents of a rail wagon. The estimated levels (from Appendix E, section E of the Draft EIS) and the measured levels can be seen in Table 2. Table 2: Comparison of estimated and measured gamma rates from copper concentrate Gamma rate (estimated) μsv/h Gamma rate (measured) μsv/h Level at 0.5 m Level at 5 m The results show that the estimated gamma levels used in the Draft EIS were conservative.
9 M1.4.2 RADON EMANATION MEASUREMENTS In Appendix E (section E4.10.2) of the Draft EIS, an estimate of radon release from copper concentrate is provided and is based on the assumption that all radon contained in the concentrate is released during loading operations. It was recognised that this is a significant overestimate because much of the radon would remain within the grains of the concentrate. However, in the absence of analytical data, this conservative radon release estimate was used in the Draft EIS to estimate potential doses from radon decay products to residents of Darwin EIS. To better quantify the release of radon from copper concentrate, a sample was tested in the South Australian Environment Protection Authority radon chamber in The aim of the work was to better quantify the radon release levels, which would provide more accurate information for dose assessment from exposure to radon decay products. The work was undertaken by BHP Billiton radiation safety personnel. The results of the work show that less than 5% of the total contained radon is released from the copper concentrate. Consequently, doses from exposure to radon decay products, from radon emanating from the copper concentrate, for the residents of Darwin is estimated to be one twentieth of the levels provided in the Draft EIS. M1.4.3 RADON EMANATION FROM SOUTH AUSTRALIA In Chapter 26 of the Supplementary EIS, an estimate of radon emanation from the whole of South Australia is provided. This estimate is based on broad assumptions, as follows: the total surface area of South Australia is approximately 1,000,000 km 2 the average radon emanation rate for the state was taken to be 0.01 Bq/m2/s, based on pre-operational monitoring at Olympic Dam, which is considered to be conservative the total amount of radon emanation from the expanded project is estimated to be 100 MBq/s. The total amount of radon emanation from the state is approximately 10,000 MBq/s Based on these figures, the expanded Olympic Dam operation would contribute about 1% to the current natural emanation levels in South Australia. M1.5 ASSUMPTIONS IN ESTIMATING ENVIRONMENTAL RADON CONCENTRATIONS In the Draft EIS, environmental radon concentrations arising from the proposed operation were determined from the air quality modelling (see Appendix S, section S2.5.2 and S3.1). The basic radon-related input information to the modelling is in Table 3 and 4. Table 3: Assumptions used in the estimates of point source radon emissions Details Radon emanation rate (Bq/m 2 /s) Uranium grade (ppm) Reference/Notes Ore Sonter et al. (2002), Akber (2001) Broken ore Five times broken rock Waste rock Proportional to uranium grade Broken waste rock Five times broken rock Haul roads 0 0 Assuming haul roads constructed of limestone Tailings 0.5 NA Akber et al. (2001)
 unless indicated otherwise) Underground exhaust air 105 Assumes underground operations continue at current rate, with a 10% increase to account for additional development Open pit emanation")
10 Table 4: Assumptions used in the estimate of radon emissions from broad area sources Source Radon emanation (TBq/y) Assumptions (Note that all emanation based on Akber et al. (2001) unless indicated otherwise) Underground exhaust air 105 Assumes underground operations continue at current rate, with a 10% increase to account for additional development Open pit emanation 124 Emanation from surface area of exposed ore 146 Emanation from surface area of exposed non-ore (overburden, non-mineralised rock) Processing ore stockpile 14 Assumes 3 x 100,000-tonne ore stockpiles with a 0.4 x volume factor for broken rock ROM ore stockpile 26 Based on a 240 m x 240 m x 20 m stockpile Waste rock stockpile 2,601 Based on estimated surface area of RSF at Year 40 Concentrators 29 Assumes combined existing and proposed concentrators Tailings storage facility 520 Assumes emanation rate based on Akber et al. (2001) and TSF cell configuration as per Draft EIS, with existing cells, 10-hectare total supernatant area, and walls built of waste rock. The revised radon contour plot is shown in Figure 1. Expanded Special Mining Lease Roxby Downs Radon contour (Bq/m 3 ) km Radon concentrations Figure 1 Contour plot of revised modelled radon concentrations (above natural background levels)
11 M1.6 REFERENCES Akber, R, Jeffries, C & Dhamasiri, J 2001, Rn-222 emission due to mining and milling activities at WMC Olympic Dam Operations, Western Mining Corporation, Olympic Dam, SA. ARPANSA 2005, Radiation protection and radioactive waste management in mining and mineral processing, Radiation Protection Series, vol. 9, Australian Radiation Protection and Nuclear Safety Agency, Yallambie, Victoria. Hibberd, MF 2010, Atmospheric temperature profiles in Mount Keith & Mount Whaleback pits, CSIRO, Aspendale, Victoria. International Atomic Energy Agency 1996, International basic safety standards for protection against ionizing radiation and for the safety of radiation sources, IAEA, Vienna. International Commission on Radiological Protection 1996, Age-dependent doses to members of the public from intake of radionuclides, ICRP Publication 72, Ann ICRP, 27 (2). Kinhill Engineers Pty Ltd 1997, Olympic Dam Expansion Project: Environmental Impact Statement, May 1997, prepared for WMC (Olympic Dam Corporation) Pty Ltd, Adelaide. Mason, GC, Elliott, G 1982, A study of radon emanation from waste rock in Northern Territory uranium mines, Australian Radiation Laboratory, Yallambie, Victoria. Mudd GM 2008, Radon release from Australian uranium mining and milling projects: assessing the UNSCEAR approach, Journal of Environmental Radioactivity 99, Olympic Dam Operations 1996, Justification for changes to the environmental management program and waste management program, ODO, Roxby Downs, SA. Sonter, M, Akber, RA & Holdsworth, S 2002, Radon flux from rehabilitated and unrehabilitated uranium mill tailings deposits, Radiation Protection in Australasia 19, Thompson, RS 1993, Residence time of contaminants released in surface coal mines a wind-tunnel study, 8th Air Pollution and Meteorology Conference, American Meteorological Society. Thomson, JE & Wilson, OJ 1980, Calculation of gamma ray exposure rates from uranium ore bodies, Australian Radiation Laboratory, Yallambie, Victoria. UNSCEAR 2000, Report to the General Assembly, Annex B: Exposures from natural radiation sources, United Nations Scientific Committee on the Effects of Atomic Radiation, New York. Yu, C, Loureiro, C, Cheng, JJ, Jones, LG, Wang, YY, Chia, YP & Faillace, E 1993, Data collection handbook to support modelling impacts of radioactive material in soil, Argonne National Laboratory, Argonne, Illinois.
12 APPENDIX M2 Initial geochemistry survey: East Arm Wharf and Alice Springs, Northern Territory

13 Olympic Dam EIS Port of Darwin BHP Billiton 21 September 2010 Final Report: Initial Geochemistry Survey East Arm Wharf and Alice Springs, Northern Territory
14 Olympic Dam EIS Port of Darwin Final Report: Initial Geochemistry Survey - East Arm Wharf and Alice Springs, Northern Territory AECOM Final Report: Initial Geochemistry Survey East Arm Wharf and Alice Springs, Northern Territory Prepared for BHP Billiton Prepared by AECOM Australia Pty Ltd Suite 3, 17 Lindsay Street, Darwin NT 0800, GPO Box 3175, Darwin NT 0801, Australia T F ABN September AECOM Australia Pty Ltd 2010 The information contained in this document produced by AECOM Australia Pty Ltd is solely for the use of the Client identified on the cover sheet for the purpose for which it has been prepared and AECOM Australia Pty Ltd undertakes no duty to or accepts any responsibility to any third party who may rely upon this document. All rights reserved. No section or element of this document may be removed from this document, reproduced, electronically stored or transmitted in any form without the written permission of AECOM Australia Pty Ltd. 21 September 2010
15 Olympic Dam EIS Port of Darwin Final Report: Initial Geochemistry Survey - East Arm Wharf and Alice Springs, Northern Territory AECOM Table of Contents 1.0 Introduction Scope of Works Methodology Airborne Sampling East Arm Wharf Alice Springs Sediment Samples QA/QC Desktop Review of Pre-Development Data Heavy Metals Radionuclides Sediment Quality Heavy Metals Results Air Quality High Volume Air Sampler Track Etch Detectors Sediment Geochemistry Quality Control Precision and Accuracy Summary References 26 Appendix A Analytical Results A 21 September 2010
16 Olympic Dam EIS Port of Darwin Final Report: Initial Geochemistry Survey - East Arm Wharf and Alice Springs, Northern Territory AECOM 1.0 Introduction BHP Billiton is proposing to expand the existing Olympic Dam copper, uranium, gold and silver mine and processing plant, including associated infrastructure at the Olympic Dam site in South Australia. The Darwin Transport Option proposes to transport copper concentrate by rail to Darwin and load ore from a dedicated facility onto concentrate ships for export. AECOM Australia Pty Ltd (AECOM) was commissioned by BHP Billiton to undertake an initial geochemical sampling program of marine sediment and airborne dust at East Arm Wharf and Darwin Harbour, and radon monitoring at East Arm Wharf and Alice Springs. This report on the Initial Geochemistry Survey presents the results of the sediment and air sampling in relation to national guidelines, as well as a description of the approach taken for each component. 1.1 Scope of Works The Scope of Works of the Initial Geochemistry Survey is as per the Proposal for Consulting Services Baseline Contaminant Study- Port of Darwin Transport Open dated 25 May 2009 and the Briefing on the Project dated 11 August The Scope of works was originally defined as: The collection of three sediment samples from the load out facility at the East Arm Wharf and three samples nearby in Darwin Harbour, at three depths ( , 0.5 and 1.0 m) per sample location (i.e. total of 18 samples). The laboratory analysis of sediment samples for heavy metals, including total uranium (U) and thorium (Th) and long-lived radionuclides, specifically radium-226 (Ra-226), lead-210 (Pb-210), thorium-230 (Th-230) and polonium-210 (Po210). The collection of airborne dust samples from the East Arm Wharf area for a period of three months, using a High Volume Air Sampler (HVAS). The laboratory analysis of dust samples for heavy metals, including total U and Th and long-lived radionuclides, specifically, Ra-226, Pb-210, Th-230 and Po-210. The use of track etch detectors (TEDs) to measure average radon concentrations, at East Arm Wharf and at six sites in Alice Springs, as close to the railway line as possible. The review of existing relevant data, preparation of a draft, interim final and final report. Changes to the scope as a result of unexpected or adverse field conditions are as follows: The sampling method for the seabed sediments was modified during the program as result of the sediments being very soft and loose along the berth of East Arm Wharf. A grab sampler was used instead of the piston sampler as originally proposed. The grab sampler could only retrieve surface sediments, which resulted in the sampling program being modified to include only 18 surface samples and no depth samples. The sample sites were distributed across the western face of the East Arm Wharf and behind the sand island to the south of the wharf. A total of 31 attempts were made to retrieve suitable sediment samples. Due to high tides scouring parts of the sea-floor bare of sediments, or the presence of corals/rocky substrates, only 16 successful samples were retrieved (including the QA/QC). After an assessment of the distribution and field texture analysis of the sediment in each sample location, it was determined that 13 samples (including QA/QC) would be analysed for heavy metals, as they would be representative of the surroundings, and 3 samples would be held by the laboratory to be analysed at request, if considered applicable. A total of six samples (including the QA/QC) were analysed in the laboratory for radionuclides, with one sample approximately at either end of the berth at East Arm Wharf, which would be representative of the radionuclide concentrations for the general wharf area, and three located at South Shell Island, which was identified to be representative of the background radionuclide concentrations in sediments. The remaining 10 samples were held for possible radionuclide analysis if considered applicable. The HVAS was installed for a total of 107 days from 31 July 2009 to 17 November 2009, with a total of sampling hours. 21 September
17 Olympic Dam EIS Port of Darwin Final Report: Initial Geochemistry Survey - East Arm Wharf and Alice Springs, Northern Territory AECOM Sediment samples SED_EA_02 and its QA/QC duplicate SED_EA_SPLIT were reanalysed due to unacceptable Relative Percentage Differences, as discussed in Section September
18 Olympic Dam EIS Port of Darwin Final Report: Initial Geochemistry Survey - East Arm Wharf and Alice Springs, Northern Territory AECOM 2.0 Methodology 2.1 Airborne Sampling Airborne sampling was conducted in accordance with the following guidelines: AS/NZS : Methods for Sampling and Analysis of Ambient Air. AS/NZS : Methods for Sampling and Analysis of Ambient Air. Method 9.3: Determination of suspended particulate matter Total suspended particulate matter (TSP) High volume sampler gravimetric method East Arm Wharf AECOM collected two airborne dust samples using a HVAS installed within the Darwin Port Corporation facility at East Arm Wharf, Berrimah, shown in Plate P-1. The location of the HVAS is presented in Figure F1 (in the Figures Section). The HVAS was placed on site on 30 July An issue was immediately identified with the HVAS equipment, with power failures and spikes in supply causing the equipment to switch off automatically. Over a period of 2 months, recurrent power failures resulted in a total sample run time of just over 180 hours (out of a possible 1392 hours). The original HVAS equipment was replaced with an alternative unit on 25 September 2009, which over the course of the following 2 months, due to further frequent, periodic power outages, recorded the balance of the sample run hours, hours out of a possible 1272 hours. Over a period of 107 days, the total sampling hours were Calibration of the HVAS flow rate was undertaken approximately fortnightly. The first batch of filter papers was sent to the laboratory (Australian Radiation Services) for analysis after sample hours at 70 m 3 /hr (12,894 m 3 of air sampled). The second batch was sent after sample hours at 70 m 3 /hr (11,137 m 3 of air sampled). Table 1 outlines the analytical suite for the airborne sampling undertaken using the HVAS at East Arm Wharf. Table 1: Analytical Suite for Airborne Sampling Sample ID Date Run Hours Month01 (Sample 1) Month02 (Sample 2) Notes: Analysis Metals 1 Radionuclides 2 31/07/09 13/10/ /10/09 17/11/ Metals: Sb, As, Ba, Be, Cd, Ca, Cr, Co, Cu, La, Pb, Mn, Hg, Ni, Ag, Th, U, V, Zn 2. Th-234, Th-230, Ra-226, Pb-210, Po-210 Radon was monitored using track-etch detectors (TED) according to AS/NZS :2007. All detectors were sent to Australian Radiation Services for analysis of radon levels. AECOM installed six TEDs at East Arm Wharf (Plate P-2) and one background sample in the AECOM Darwin office located at Lindsay Street, Darwin from 31 July 2009 to 6 November The locations of the TEDs in Darwin and East Arm Wharf are presented in Figure F1 (in the Figures Section). 21 September
19 Olympic Dam EIS Port of Darwin Final Report: Initial Geochemistry Survey - East Arm Wharf and Alice Springs, Northern Territory AECOM Alice Springs AECOM installed six TEDs in Alice Springs and one background sample was collected approximately 9 km southeast of the Alice Springs Town Centre for the period between 21 August 2009 and 20 November The locations of the TEDs in Alice Springs are presented in Figure F2 (in the Figures Section). 2.2 Sediment Samples Sediment sampling at East Arm Wharf was conducted on 24 and 25 of August 2009 in accordance with the Handbook for Sediment Quality Assessment (Simpson et al., 2005) and the National Assessment Guidelines for Dredging (Commonwealth of Australia, 2009). Sampling was undertaken on the lowest tides for the month, with a 0.68 metre high tide on 24 August and a 0.88 metre high tide on 25 August. Depth to sediment on the sampling days was between approximately 6 to 10m. A Dormer Piston Sampler was initially deployed with the intention of obtaining three samples at three different locations across the western face of East Arm Wharf, and three samples at three different locations running parallel to North Shell Island, located approximately 350 m south-east of the wharf. After deployment at the first intended location, it was identified that there was little to no sediments located in the area of sampling, as a result of maintenance dredging programs, and indicated that only a thin layer of recent deposited sediment was present in the nominated sampling areas. As the surface sediment layer provides information on the most recently deposited sediment materials, and can be used to determine the spatial variation in sediment properties and the distribution of potential analytes of interest (metals and LLNR s) (Simpson et al., 2005), the program was developed that using a grab sampler would still provide adequately representative samples. The number of samples, and sample locations in the original scope of work was modified to reflect the change in sampling methodology. A total of 16 sediment samples (including QA/QC) were obtained. The samples were placed in a clean (decontaminated) container, photographed, and sub-samples were placed in plastic, labelled, zip-lock bags and stored on ice for shipment to ship to the laboratory. The locations of the sediment samples taken from the East Arm area are presented in Figure F1 (in the Figures Section). Table 2 outlines the analytical suite for sediment samples obtained at East Arm Wharf. Table 2: Analytical Suite for Sediment Samples Sample ID Date Time Analysis Metals 1 Radionuclides 2 SED_EA_01 24/08/ H H SED_EA_02 24/08/ SED_EA_SPLIT 24/08/ SED_EA_03 24/08/ H SED_EA_04 24/08/ H H SED_EA_05 24/08/ SED_EA_06 24/08/ H SED_EA_07 25/08/ H SED_EA_08 25/08/ H SED_EA_10 25/08/ H SED_EA_11 25/08/ H SED_EA_14 25/08/ H SED_EA_18 25/08/ H H SED_EA_19 25/08/ SED_EA_20 25/08/ SED_EA_21 25/08/ Notes: 21 September
20 Olympic Dam EIS Port of Darwin Final Report: Initial Geochemistry Survey - East Arm Wharf and Alice Springs, Northern Territory AECOM H indicates samples held by laboratory for possible future analysis. 1. Metals: Sb, As, Ba, Be, Cd, Ca, Cr, Co, Cu, La, Hg, Mn, Ni, Pb, Ag, Th, U, V, Zn 2. Th-234, Th-230, Ra-226, Pb-210, Po-210 In summary, 31 attempts produced 16 primary sediment samples, including 1 QA/QC sample. Metals analysis was carried out on 13 samples, including the QA/QC sample, and analysis for radionuclides was carried out on 6 samples, including the QA/QC sample. 2.3 QA/QC All works completed as part of the Initial Geochemistry Survey at East Arm Wharf and Alice Springs were conducted in accordance with standard AECOM environmental sampling protocols. All fieldwork was performed under the direct supervision of the AECOM Fieldwork Coordinator/Project Manager. All AECOM fieldwork personnel responsible for undertaking the fieldwork program had been trained on previous projects and were well experienced in the relevant fieldwork protocols. The essential elements of the field QA/QC program are: The use of experienced personnel: Field work was completed by trained AECOM engineers/scientists with previous experience in contaminated site assessment, field sampling techniques and health and safety issues Record Keeping: Full records of all field activities were maintained on standard field logging sheets Sample Collection: New nitrile gloves were worn during sediment sampling, and replaced between each sample collected. All samples were collected in general accordance with the Handbook for Sediment Quality Assessment (Simpson et al., 2005) and the National Ocean Disposal Guidelines for Dredged Material (Environment Australia, 2009) Sample Labelling: A unique sample number was used for each sample to clearly specify the sample origin, preservation standards and analytical requirements. Chain of Custody: Chain of Custody procedures were required for all sample transfers. Chain of Custody sheets listed sample numbers; date of sample collection and analyses required and were signed by each person transferring and accepting custody of the samples. The collected sediment samples were transferred to approved sampling containers and then placed in cool storage prior to transfer to the laboratories Decontamination: All equipment used in the sampling process was decontaminated using Decon 90, a phosphate free detergent, followed by rinsing with de-ionised water, prior to mobilisation and between sampling locations to reduce the risks of cross contamination. Intra-laboratory Field Duplicates: Intra-laboratory Field Duplicates refer to blind field split samples analysed by the laboratory. Intra-laboratory field duplicates provide information on analysis precision and sample heterogeneity. Relative percentage differences (RPDs) are used to assess precision. To check accuracy with the sampling and analytical process, a field quality control sample was obtained as listed in Table 3. Table 3: Quality Assurance and Quality Control Sample Sample Type Primary Sample Duplicate Sample Date Field Duplicate Sample SED_EA_02 SED_EA_SPLIT 24/08/2009 Results of the QA/QC assessment are discussed in Section September
21 Olympic Dam EIS Port of Darwin Final Report: Initial Geochemistry Survey - East Arm Wharf and Alice Springs, Northern Territory AECOM This page has been left blank intentionally. 21 September
22 Olympic Dam EIS Port of Darwin Final Report: Initial Geochemistry Survey - East Arm Wharf and Alice Springs, Northern Territory AECOM 3.0 Desktop Review of Pre-Development Data 3.1 Heavy Metals A pilot air quality study (CSIRO, 2001) was carried out from March to December in 2000 to provide measurements of selected National Environment Protection Measure (NEPM) components, from two sites in Darwin; the Charles Darwin University Campus (formerly referred to as Northern Territory University (NTU) and approximately 13 km to the north of East Arm), and the CSIRO facility at Berrimah (approximately 10 km north-east of East Arm). The 2001 CSIRO study has been included in this review as it is the only publicly available air quality data relevant to this investigation. The data obtained for the Berrimah site are presented as representative of an urban location. Measurements undertaken in the study included airborne mass for particles with aerodynamic diameter less than 10 µm (PM10), airborne lead, zinc and iron (in PM10), NO 2, SO 2 and ozone. Atmospheric lead loadings at the Berrimah site varied markedly throughout the sampling period, as shown in Figure 1, with the highest reading of approximately 11 ng/m 3 recorded in September. This concentration falls well below the National Environment Protection Measure for Ambient Air Quality (NEPC, 1998) guideline of 500 ng/m 3 (0.5 µg/m 3 ) for 24 hour average lead loading (CSIRO, 2001). Figure 1: Atmospheric Lead Loadings in PM10 Source: CSIRO (2001) Atmospheric zinc loadings at the Berrimah site generally remained below 100 ng/m 3 throughout the sampling period, with one high sample recorded in March (CSIRO, 2001), as shown in Figure 2. There is currently no NEPM for Ambient Air Quality guideline for zinc. 21 September
23 Olympic Dam EIS Port of Darwin Final Report: Initial Geochemistry Survey - East Arm Wharf and Alice Springs, Northern Territory AECOM Figure 2: Atmospheric Zinc Loadings in PM10 Source: CSIRO (2001) 3.2 Radionuclides The Australian Radiation Protection and Nuclear Safety Agency (ARPANSA) have issued technical reports summarising the monitoring of radioactivity of waters, soils and foodstuffs as well as the atmospheric monitoring of natural and man-made radionuclides. Table 4 summarises the data for average lead-210 activity concentrations in air across Australia between 1996 and Table 4: Average Lead-210 Activity Concentrations in Air in Darwin Year Lead-210 mbq/m Note: Hardege, 2008 (approximations only, raw data not available) Samples are collected by continuous sampling of the air over a period of one week, at average flow rates of 80m 3 per hour and are measured by high-resolution gamma-ray spectrometry for no less than 2 hours. Results are reported in millibecquerel per cubic metre (mbq/m 3 ). Figure 3 reproduced from Hardege (2008) shows monitoring data for lead-210 in a number of capital cities from 1996 to Table 4 presents the activity concentrations of lead-210 in Darwin from 1996 to 2001 estimated from the bar chart (Figure 3). 21 September

24 Olympic Dam EIS Port of Darwin Final Report: Initial Geochemistry Survey - East Arm Wharf and Alice Springs, Northern Territory AECOM Figure 3: Annual average lead-210 activity concentrations across Australia Source: Hardege, Sediment Quality Many reports exist summarising various studies undertaken to assess the sediment quality in Darwin Harbour; however, few were undertaken prior to the development of East Arm Wharf. Three studies are summarised in this section that allow for comparison with the AECOM Initial Geochemistry Survey results. No data were available on the radionuclide concentrations of sediments in Darwin Harbour Heavy Metals The most comprehensive study undertaken to date to characterise for heavy metal content of the sediments in Darwin Harbour was undertaken by the Northern Territory Department of Natural Resources, Environment, the Arts and Sport (NRETAS) in 1993, and was reported by Fortune in The study was undertaken to assess the spatial distribution of Darwin Harbour sediment grainsizes and heavy metal content, and represents baseline data prior to infrastructure development and dredging of the East Arm Port Facility. The East Arm area was one of the seven areas of Darwin Harbour examined in the study, with the locations of the sampling sites within this study area presented in Figure F3 (in the Figures Section). A summary of results from the East Arm sediment samples is presented in Table September
25 Olympic Dam EIS Port of Darwin Final Report: Initial Geochemistry Survey - East Arm Wharf and Alice Springs, Northern Territory AECOM Table 5: Extract of Results from Fortune (2006) Study. Site Concentrations of Selected Metals within Marine Sediments (mg/kg) As Cd Hg Cu Pb Mn Ni Zn <0.8 < < < <0.8 < < < <0.8 < < < < < < < < <0.8 < < < <0.8 < < < < <0.8 < <0.8 < < <0.8 < < <0.8 < <0.8 < < <0.8 < <0.8 < < <0.8 < < <0.8 < < <0.8 < < <0.8 < < <0.8 < <0.8 < <0.8 < Min Max Mean 27.8 < StdDev Note: Results are directly copied from Fortune (2006) Appendix 2: Heavy Metal and Arsenic Concentrations (mg/kg), Pb and Cd corrected- erroneously high values due to interference. Mean values appear to have been reported as the arithmetic averages of the value that exceeded the limit of quantification. Arsenic concentrations within the harbour area ranged from 5 to 179 mg/kg. Samples taken between East and Lee Points, the Fannie Bay area, and in the East and West Arms had concentrations greater than 100mg/kg. Average concentration in samples taken from East Arm was 27.8mg/kg, and the highest concentration was 178.9mg/kg. It was assessed that the sample sites with elevated arsenic concentrations have no known anthropogenic arsenic sources (Fortune, 2006). The highest concentration of zinc in the East Arm area (73 mg/kg) was below the screening level of 200 mg/kg, as determined by the National Assessment Guidelines for Dredging (Commonwealth of Australia, 2009). Average concentration of zinc in the analysed samples was 35mg/kg. One sediment sampling location had lead concentrations equal to the screening level of 50 mg/kg (Commonwealth of Australia, 2009); however, the average concentration was 12.7 mg/kg. Fortune (2006) concluded stormwater is a major source of anthropogenic lead to the harbour, increasing load by 90 times. The location with the highest lead concentration was upstream of the East Arm wharf, at the Elizabeth River Bridge, and receives runoff from Mitchell Creek, which is fed by stormwater drains from Palmerston (Fortune, 2006). 21 September
26 Olympic Dam EIS Port of Darwin Final Report: Initial Geochemistry Survey - East Arm Wharf and Alice Springs, Northern Territory AECOM Concentration of nickel at one site within the East Arm study area was elevated (34 mg/kg against screening level of 21mg/kg); however, the average concentration in the area was 11.9 mg/kg. Concentrations of Cd, Cu and Hg were all below the screening levels (Commonwealth of Australia, 2009). Lead and nickel were found to be elevated in many of these sites, including the East Arm study area, however Fortune (2006) states that concentrations of these metals are low when compared to those found in other estuaries of Australia and overseas. Arsenic was found to be elevated against screening levels at all sites in Darwin Harbour, and more notably in the main body of the Harbour to East Arm. Fortune (2006) concluded these concentrations are an indication of local geology rather than anthropogenic sources. Generally, elevated metals were found in areas receiving stormwater, although apart from localised elevations in metal concentration, primarily in the City area, this study found no evidence of extensive contamination of sediments (Fortune, 2006). More recent data is presented in Esslemont (1997), which summarises a study that was undertaken in 1996 to establish baseline data for heavy metal concentrations in the sediments of harbour precincts. The study provides an assessment of Cd, Cu, Cr, Pb, Ni and Zn prior to the establishment of the East Arm Port facility at various locations in the Darwin Harbour, including North Shell Island, which post-development has been incorporated into the East Arm Wharf. The location of the North Shell sampling site is presented in Figure F3 (in the Figures Section), and a summary of the concentrations of selected metals within the fine and coarse fractions of marine sediments from these sites are presented in Table 6. Table 6: Extract of results from Esslemont (1997). Site North Shell Island (coarse) North Shell Island (fine) Concentrations of Metals (mg/kg) Cd Cu Cr Pb Ni Zn The most recent study, with results available at the time of the production of this report, was undertaken in 2004 by URS with the purpose of establishing baseline contaminant data prior to the development of the Darwin City Waterfront Redevelopment, and included the sampling of a reference site located in the Elizabeth River approximately 6 km upstream from the East Arm Wharf. The location of the Elizabeth River site is presented in Figure F3 (in the Figures Section). A summary of results from this site is presented in Table 7. Table 7: Extract of results from URS (2004). Site Concentrations of Selected Metal Ions within Marine Sediments (mg/kg) As Cd Cr Pb Ni Zn Mn DWREF 31 < Fortune (2006) and URS (2004) studies concluded that the elevated arsenic concentrations, when compared against the screening level (Commonwealth of Australia, 2009) for arsenic of (20mg/kg) can be attributed to the natural weathering bedrock within the Darwin Harbour catchment, as the reference site was located remote from potential anthropogenic inputs of arsenic (URS, 2004). 21 September
27 Olympic Dam EIS Port of Darwin Final Report: Initial Geochemistry Survey - East Arm Wharf and Alice Springs, Northern Territory AECOM This page has been left blank intentionally. 21 September
28 Olympic Dam EIS Port of Darwin Final Report: Initial Geochemistry Survey - East Arm Wharf and Alice Springs, Northern Territory AECOM 4.0 Results 4.1 Air Quality High Volume Air Sampler The laboratory results for elemental concentrations and radionuclides in air from the program of air sampling using the High Volume Air Sampler (HVAS) from July to November at East Arm Wharf, the mean concentrations of lead and zinc results from previous studies, as well as applicable guidelines, are presented in Table 8. The concentrations are expressed in micrograms per cubic metre averaged by the laboratory over the period of air sampling for metals, or micro-becquerels per cubic metre averaged by the laboratory over the period of air sampling for radionuclides. Guidelines provided below are sourced from: New South Wales Department of Environment, Climate Change and Water (DECCW) (formerly Department of Environment and Conservation) Approved Methods for the Modelling and Assessment of Air Pollutants in New South Wales (DEC, 2005) National Environment Protection Council National Environment Protection Measure for Ambient Air Quality Guidelines (NEPC, 1998) All guidelines presented below are from DEC (2005) except where indicated otherwise. No guidelines are currently available for Be, Ca, Co, La, Th, U, and V, and radionuclides in air. Table 8: Analytical Results- Pollutant Concentration in Air Units Guidelines Metals Antimony µg/m Arsenic µg/m Barium µg/m Beryllium µg/m Cadmium µg/m Calcium µg/m Chromium µg/m (Cr III) Cobalt µg/m Copper µg/m (Dust) Lanthanum µg/m Lead µg/m Manganese µg/m Mercury µg/m (Inorganic) Nickel µg/m Silver µg/m (Metal) Thorium µg/m Uranium µg/m Vanadium µg/m Month 1 Month 2 CSIRO (2001) 2 21 September
29 Olympic Dam EIS Port of Darwin Final Report: Initial Geochemistry Survey - East Arm Wharf and Alice Springs, Northern Territory AECOM Units Guidelines µg/m Zinc (Oxide Fumes) U-238 Series Th-234 µbq/m 3 < ± 50 Th-230 µbq/m 3 <150 <150 Ra-226 µbq/m 3 43 ± ± 20 Pb-210 µbq/m ± ± 150 Po-210 µbq/m ± ± 20 Notes: Month 1 Month 2 CSIRO (2001) 2 1 NEPM Ambient Air Quality Guidelines (NEPC, 1998) 1 year averaging period 2 Maximum lead and zinc loadings observed over 12 month sampling period (CSIRO, 2001) DECCW Approved Methods for the Modelling and Assessment of Air Pollutants in New South Wales (DEC, 2005) 1 hour average period Elemental Concentrations in Air (metals) are expressed in microgram (µg) per cubic metre of air sampled. Radioactivity concentrations are expressed in microbecquerel (µbq) per cubic metre sampled. Reported concentrations of metals are an average for the three filters submitted to the laboratory for the sampling period. Less than (<) values indicate the limit of detection for each isotope and radionuclide for the measurement system The reported uncertainty in each radioactivity concentration in air is the expanded uncertainty calculated using a coverage factor of 2, providing a level of confidence of approximately 95%. The laboratory results for the HVAS air samples collected at East Arm Wharf show that all monitored metals met NSW DECCW (DEC, 2005) and NEPM (NEPC, 1998) assessment criteria where available. The lead results for the HVAS air samples collected at East Arm Wharf of µg/m 3 for Month 1 and µg/m 3 for Month 2 were similar to those collected in the CSIRO Pilot Study of Air Quality in Darwin (CSIRO, 2001) of µg/m 3. The laboratory analysis reports are provided in Appendix A Track Etch Detectors The laboratory results from the radon monitoring undertaken at Alice Springs and East Arm Wharf, as well as control sites, between July and November 2009 are presented. In Table 9, with concentrations reported as the reported as the Average Radon Concentration over Exposure Period (ARCOEP) Table 9: Analytical Results- Track Etch Detectors Site Detector Number East Arm Wharf ARCOEP (Bq/m 3 ) 21.5 ± 15.5 ± 6.5 ± ± ± ± ± Alice Springs ARCOEP (Bq/m 3 ) 16.3 ± ± ± ± ± ± ± 8.0 Notes: Radon concentrations are in Becquerel (Bq) per cubic metre of air. One Becquerel equals one nuclear transformation per second. 21 September
30 Olympic Dam EIS Port of Darwin Final Report: Initial Geochemistry Survey - East Arm Wharf and Alice Springs, Northern Territory AECOM The reported uncertainty in each result is the expanded uncertainly calculated using a coverage factor of 2, providing a level of confidence of approximately 95%. Exposure period for East Arm Wharf was 31 July November 2009 Exposure period for Alice Springs was 21 August 20 November The results of radon monitoring are consistent with outdoor concentrations which are reported to range from 1 to more than 100 Bq/m 3 (UNSCEAR, 2000), with typical values of 10 Bq/m 3 The laboratory analysis reports are provided in Appendix A. 4.2 Sediment Geochemistry The laboratory results from sediment sampling undertaken in July 2009 are presented in Table 10, as well as the mean concentrations of heavy metals in sediments from previous studies, as outlined in the previous section. Also presented is the sediment screening levels (Commonwealth of Australia, 2009), and average crustal abundances data (Bowen, 1979). The laboratory analysis reports for sediment samples are provided in Appendix A. 21 September
31 Olympic Dam EIS Port of Darwin Final Report: Initial Geochemistry Survey - East Arm Wharf and Alice Springs, Northern Territory AECOM 21 September
32 Olympic Dam EIS Port of Darwin Final Report: Initial Geochemistry Survey - East Arm Wharf and Alice Springs, Northern Territory AECOM This page has been left blank intentionally. 21 September
33 Olympic Dam EIS Port of Darwin Final Report: Initial Geochemistry Survey - East Arm Wharf and Alice Springs, Northern Territory AECOM Table 10: Analytical Results- Sediment Samples Analytes METALS (total) Units Screening Levels 1 Average Crustal Abundance 2 SED_EA_02 SED_EA_ SPLIT SED_EA_03 SED_EA_05 SED_EA_06 Antimony* mg/kg <2 <2 <2 <2 <2 <2 <2 <2 <2 <2 <2 <2 <2 Arsenic mg/kg Barium mg/kg # Beryllium* mg/kg # 2.8 <2 <2 <2 <2 <2 <2 <2 <2 <2 <2 <2 <2 <2 Cadmium* mg/kg <2 <2 <2 <2 <2 <2 <2 <2 <2 <2 <2 <2 <2 < <1 Calcium % # Chromium mg/kg Cobalt mg/kg # Copper mg/kg Lanthanum mg/kg # Lead mg/kg Manganese mg/kg # Mercury* mg/kg <2 <2 <2 <2 <2 <2 <2 <2 <2 <2 <2 <2 < Nickel mg/kg Silver* mg/kg # 0.07 <2 <2 <2 <2 <2 <2 <2 <2 <2 <2 <2 <2 <2 Thorium* mg/kg # <2 <2 <2 <2 <2 <2 <2 <2 <2 5 <2 Uranium mg/kg # <2 <2 <2 <2 <2 <2 <2 < Vanadium mg/kg # Zinc mg/kg SED_EA_07 SED_EA_08 SED_EA_10 SED_EA_11 SED_EA_14 SED_EA_19 SED_EA_20 SED_EA_21 Fortune (2006) Esslemont (1997) URS (2004) 21 September 2010
34 Olympic Dam EIS Port of Darwin Final Report: Initial Geochemistry Survey - East Arm Wharf and Alice Springs, Northern Territory AECOM Analytes Units RADIONUCLIDES Screening Levels 1 Average Crustal Abundance 2 SED_EA_02 SED_EA_ SPLIT SED_EA_03 SED_EA_05 SED_EA_06 SED_EA_07 SED_EA_08 SED_EA_10 SED_EA_11 SED_EA_14 SED_EA_19 SED_EA_20 SED_EA_21 Fortune (2006) Esslemont (1997) URS (2004) Th-234 Bq/kg 45±16 43±15 39±12 33±12 27±6 38±8 Th-230 Bq/kg 54±6 35±4 30±4 36±5 39±4 31±4 Ra Bq/kg - 19±2 22±3 17±2 18±2 12±1 15±2 Pb Bq/kg 65±15 78±18 52±16 39±15 34±9 27±2 Po Bq/kg 54±5 59±9 35±4 20±3 40±5 24±3 Total Radioactivity Concentrations Notes: Bq/kg 35, National Assessment Guidelines for Dredging (Commonwealth of Australia, 2009). 2. Bowen (1979)Environmental Chemistry of the Elements 3. Maximum sum of gross alpha and gross beta # No guideline is available as the quality of the data used for guideline development was poor or because guidelines developed using different methods were inconsistent. Environment Australia (2009) recommends comparing concentrations to ambient baseline levels for sediments of comparable grainsize in the vicinity of the disposal area. * The Limit of Reporting used by the laboratory was greater than that request 21 September 2010
35 Olympic Dam EIS Port of Darwin Final Report: Initial Geochemistry Survey - East Arm Wharf and Alice Springs, Northern Territory AECOM As per the scope of works, samples were collected from the load out facility at the East Arm Wharf and nearby South Shell Island in Darwin Harbour as follows: Load out facility at South Shell East Arm Wharf Island SED_EA_02 SED_EA_06 SED_EA_03 SED_EA_19 SED_EA_05 SED_EA_20 SED_EA_07 SED_EA_21 SED_EA_08 SED_EA_10 SED_EA_11 SED_EA_14 The locations are shown in Figure F1 (in the Figures Section). Plates P-3 to P-11 (in the Plates Section) depict the type of material collected for various samples. The median, range and mean concentrations of each metal and radionuclide at these sampling sites are presented in Table September
36 Olympic Dam EIS Port of Darwin Final Report: Initial Geochemistry Survey - East Arm Wharf and Alice Springs, Northern Territory AECOM Table 11: Average Concentrations for Defined Sediment Sample Areas Load out facility at East Arm Wharf South Shell Island Analytes Units Guideline 1 Median Range Mean Median Range Mean METALS (total) Antimony mg/kg 2 <2 - <2 <2 - <2 Arsenic mg/kg Barium mg/kg # Beryllium mg/kg # <2 - <2 <2 - <2 Cadmium mg/kg 1.5 <2 - <2 <2 - <2 Calcium % # Chromium mg/kg Cobalt mg/kg # Copper mg/kg Lanthanum mg/kg # Lead mg/kg Manganese mg/kg # Mercury mg/kg 0.15 <2 - <2 <2 - <2 Nickel mg/kg Silver mg/kg # <2 - <2 <2 - <2 Thorium mg/kg # 6 < <2-5 <2 Uranium mg/kg # <2 - <2 2 <2-2 2 Vanadium mg/kg # Zinc mg/kg RADIONUCLIDES (4 samples analysed for radionuclides at East Arm Wharf and 1 sample at South Shell Island) U-238 Series Th-234 Bq/kg Th-230 Bq/kg Ra-226 Bq/kg Pb-210 Bq/kg Po-210 Bq/kg Notes: 1. National Assessment Guidelines for Dredging (Commonwealth of Australia, 2009). # No guideline is available as the quality of the data used for guideline development was poor or because guidelines developed using different methods were inconsistent. Environment Australia (2009) recommends comparing concentrations to ambient baseline levels for sediments of comparable grainsize in the vicinity of the disposal area. The data presented in Table 10 and Table 11 were compared to average crustal abundances for metals (excluding radionuclides). The element enrichments were identified using the Geochemical Abundance Index (GAI) based on method developed by Förstner et al (1993). The GAI quantifies an assay result for a particular element in terms of the average crustal abundance of that element. The GAI (based on a log-2 scale) is expressed in 7 integer increments (viz. 0 to 6). A GAI of 0 indicates that the content of the element is less than, or similar to, the average crustal abundance; a GAI of 3 corresponds to a 12-fold enrichment above the average crustal abundance; and so forth, up to a GAI of 6 which corresponds to a 96-fold, or greater, enrichment above average-crustal-abundances. The data indicates that there is slight (6- to 24-fold) enrichment in arsenic in most samples from this study and a 6-fold enrichment above average crustal abundance for marine sediments in the Esslemont (1997) sampling. All other metals analysed in this and the Esslemont (1997) study reported concentrations at or below average crustal abundance. Comparison of metal concentrations with dredge spoil disposal guidelines demonstrate that most of samples returned metal concentrations below Guideline limits. Sample SED_EA_20 from East Arm reported a 3-fold arsenic concentration enrichment compared to average crustal abundance for marine sediments. 21 September
37 Olympic Dam EIS Port of Darwin Final Report: Initial Geochemistry Survey - East Arm Wharf and Alice Springs, Northern Territory AECOM There are no reported data on average crustal abundance of radionuclides for marine sediments. There are no guidelines for specific radionuclide concentrations for disposal of dredge spoil. 4.3 Quality Control A field duplicate sediment sample was prepared in the field by splitting the primary field sample. The duplicate samples were labelled so that they could not be linked to their respective primary samples. The duplicate samples and their corresponding primary sample are presented in the Table 3. The relative percentage difference (RPD) between primary and duplicate sample analysis results is used to measure the representativeness and/or precision of duplicate samples. The RPD is calculated from the absolute difference between results of the duplicate pair divided by the mean value of the duplicate pair. RPD (%) = 100 x (D1-D2) / ((D1+D2) / 2) where: D1 = primary sample analysis D2 = duplicate sample analysis. The AS (Guide to the sampling and investigation of sites with potentially contaminated soil Part 1: Non volatile and semi-volatile compounds) states that the typical RPD which can be expected from acceptable field duplicate sample is 30-50% of the mean concentration of the analytes where at least one result is greater than 10 times laboratory LOR. RPD values exceeding this range and criteria were considered unacceptable. The initial report issued by the laboratory was assessed and RPDs calculated for the primary and secondary sediment samples (SED_EA_02 and SED_EA_SPLIT). RPDs were calculated, and ranged from 14.6% to 169.6%. The calculated RPDs for arsenic, barium, cobalt, copper, lead and manganese were considered unacceptable (Standards Australia, 2005), and the laboratory was contacted immediately to initiate the re-analysis of the two samples. The final report provided to AECOM indicated that RPDs were within acceptable limits. The duplicate sample results and RPDs for both the initial and re-analysis are presented in Table 12 Table 12: Relative Percentage Difference Calculations for QA/QC Samples INITIAL ANALYSIS RE-ANALYSIS Analytes Units SED_EA_02 SED_EA_SPLIT RPD SED_EA_02 SED_EA_SPLIT RPD Antimony mg/kg <2 <2 0 <2 <2 0 Arsenic mg/kg % Barium mg/kg % % Beryllium mg/kg <2 <2 0 <2 <2 0 Cadmium mg/kg <2 <2 0 <2 <2 0 Calcium % % Chromium mg/kg % % Cobalt mg/kg % Copper mg/kg % Lanthanum mg/kg % Lead mg/kg % % Manganese mg/kg % % Mercury mg/kg <2 <2 0 <2 <2 0 Nickel mg/kg % Silver mg/kg <2 <2 0 <2 <2 0 Thorium mg/kg <2 < % Uranium mg/kg <2 < Vanadium mg/kg % % Zinc mg/kg % % 21 September
38 Olympic Dam EIS Port of Darwin Final Report: Initial Geochemistry Survey - East Arm Wharf and Alice Springs, Northern Territory AECOM Precision and Accuracy Overall, the precision and accuracy of the laboratory analysis data was satisfactory. Laboratory LOR was increased for 7 metals due to matrix interferences such as excess salinity. Raised LORs were applied to the following analytes: As, from 0.1mg/kg to 2mg/kg Sb from 0.05mg/kg to 2mg/kg Be from 0.05mg/kg to 2mg/kg Cd from 0.01mg/kg to 2mg/kg Hg from 0.01mg/kg to 2mg/kg Ag from 0.01mg/kg to 2mg/kg Th from 0.2mg/kg to 2mg/kg 21 September
39 Olympic Dam EIS Port of Darwin Final Report: Initial Geochemistry Survey - East Arm Wharf and Alice Springs, Northern Territory AECOM 5.0 Summary BHP Billiton is proposing to expand the existing Olympic Dam mine and processing plant, and proposes to transport copper concentrate by rail to Darwin and load ore from a dedicated facility onto concentrate ships for export. AECOM has undertaken an initial geochemistry survey of marine sediment and airborne dust at East Arm Wharf and Darwin Harbour, and radon monitoring at East Arm Wharf and Alice Springs for BHP Billiton, and has presented the results of the sediment and air sampling in relation to national guidelines. The geochemical study was undertaken in accordance with the scope of works as per the Proposal for Consulting Services Baseline Contaminant Study- Port of Darwin Transport Open dated 25 May 2009 and the Briefing on the Project dated 11 August 2009, and included: the collection of 16 sediment samples (including a QA/QC sample), with the analysis of 13 sediment samples for 13 heavy metals analysis and five radionuclides analysis, including the QA/QC from the load out facility (the berth) at the East Arm Wharf and from South Shell island nearby in Darwin Harbour the intermittent collection of airborne dust samples from East Arm Wharf for a period of hours using a High Volume Air Sampler (HVAS) the measurement of average radon concentrations at East Arm Wharf and Alice Springs. This report included a review of existing relevant data and a brief analysis of the laboratory results in comparison to relevant guidelines. A summary of the results is provided: Air quality concentrations for metals were within guideline concentrations for the period of monitoring undertaken at the East Arm Wharf. The radon concentrations measured at Alice Springs and East Arm Wharf were within the range of global averages for ambient air quality (UNSCEAR, 2000). The concentrations of heavy metals in marine sediments sampled, apart from arsenic, were below the screening level determined by Commonwealth of Australia (2009). Sediment sample SED_EA_20 exceeded the screening level for arsenic. Arsenic concentrations are generally elevated in Darwin Harbour due to the natural weathering bedrock in the catchment (Fortune, 2006 and URS, 2004). The radionuclide concentrations in marine sediments were documented with a limited number of samples for Th-234, Th-230, Ra-226, Pb-210, Po-210. There are no guideline concentrations for specific radionuclides for marine sediments, or for dredge spoil; however the total radioactivity count, based on the radionuclides analysed is below the screening levels as per Commonwealth of Australia (2009) for dredge spoil disposal. 21 September
40 Olympic Dam EIS Port of Darwin Final Report: Initial Geochemistry Survey - East Arm Wharf and Alice Springs, Northern Territory AECOM This page has been left blank intentionally. 21 September
41 Olympic Dam EIS Port of Darwin Final Report: Initial Geochemistry Survey - East Arm Wharf and Alice Springs, Northern Territory AECOM 6.0 References Bowen, H. J. M., Environmental Chemistry of the Elements. Academic Press, London. Commonwealth of Australia, National Assessment Guidelines for Dredging. Canberra, ACT. CSIRO Atmospheric Research (CSIRO), A Pilot Study of Air Quality in Darwin, N.T. Prepared for the Department of Lands Planning and Environment. Aspendale, Victoria. Department of Conservation (NSW), Approved Methods for the Modelling and Assessment of Air Pollutants in New South Wales. Department of Conservation, New South Wales Government. Department of Lands, Planning and Environment (NT), National Environment Protection Measure for Ambient Air Quality: Monitoring Plan for the Northern Territory. Department of Lands, Planning and Environment, Northern Territory. Esslemont, G., Heavy Metals in Scleractinian Corals and Marine Sediments from Darwin Harbour, Australia, inhanley, J.R., Caswell, G., Megirian, D., and Larson, H.K. (eds). Proceedings of the Sixth International Marine Biological Workshop. The Marine Flora and Fauna of Darwin Harbour, NT, Australia. 1997: MAGNT and the Australian Marine Sciences Association: Darwin, Australia. Förstner, U., Ahlf, W. Calmano W, Sediment Quality Objectives and Criteria Development in Germany. Water Science & Technology, 28: Fortune, J The Grainsize and Heavy Metal Content of Sediment in Darwin Harbour. Report No: 14/2006D. Aquatic Health Unit, Environment Protection Agency, Department of Natural Resources, Environment and the Arts, Northern Territory. Hardege, L., Environmental Radioactivity Monitoring in Australia 2005 and 2006: Technical Report Series No Australian Radiation Protection and Nuclear Safety Agency, Australian Government, Yallambie. National Environment Protection Council (NEPC), National Environment Protection Measure for Ambient Air Quality. National Environment Protection Council. Simpson, S.L., Bately, G.E., Chariton, A.A., Stauber, J.L., King, C.K., Chapman, J.C., Hyne, R.V., Gale, S.A., Roach, A.C., and Maher, W.A., Handbook for Sediment Quality Assessment. CSIRO. Bangor, NSW. Standards Australia, Methods for Sampling and Analysis of Ambient Air. Method 9.3: Determination of Suspended Particulate Matter Total Suspended Particulate Matter (TSP) High Volume Sampler Gravimetric Method. AS/NZS : Standards Australia, Guide to the Sampling and Investigation of Sites with Potentially Contaminated Soil Part 1: Non volatile and semi-volatile compounds. AS/NZS 4482: Standards Australia, Methods for Sampling and Analysis of Ambient Air. Part 1.1 Guide to Siting Air Monitoring Equipment. AS/NZS 3580:1.1:2007. UNSCEAR, Sources and Effects of Ionizing Radiation - ANNEX B Exposures from natural radiation sources. Report Vol. I. United Nations Scientific Committee on the Effects of Atomic Radiation. Accessed 02 March URS, Darwin Harbour Precinct Marine Sediment Quality. Prepared for Department of Infrastructure, Northern Territory. 21 September
42 Olympic Dam EIS Port of Darwin Final Report: Initial Geochemistry Survey - East Arm Wharf and Alice Springs, Northern Territory AECOM This page has been left blank intentionally. 21 September
43 Olympic Dam EIS Port of Darwin Final Report: Initial Geochemistry Survey - East Arm Wharf and Alice Springs, Northern Territory AECOM Figures 21 September
44 Olympic Dam EIS Port of Darwin Final Report: Initial Geochemistry Survey - East Arm Wharf and Alice Springs, Northern Territory AECOM This page has been left blank intentionally. 21 September


 LEGEND!. HVAS!")
45 AECOM does not warrant the accuracy or completeness of information displayed in this map and any person using it does so at their own risk. AECOM shall bear no responsibility or liability for any errors, faults, defects, or omissions in the information. SED_EA_07 Darwin" # SED_EA_08 # SED_EA_10 Northern Territory Alice Springs " Map Document: (G:\B43781 Olympic Dam\mxd\Figure2.mxd) 22/12/ :16:44 PM # SED_EA_11 #!. SED_EA_05 TE #!. SED_EA_03 # SED_EA_02 Darwin!. TE SED_EA_14 TE East Arm Wharf East Arm Wharf # # inset!.!. TE !.!. TE SED_EA_06 TE SED_EA_19 # SED_EA_20 #!. SED_EA_21 TE # # PROJECT ID CREATED BY LAST MODIFIED B43781 CW CW- 03 March metres 1:7,180 (when printed at A4) LEGEND!. HVAS!. Track Etch Detectors Sediment Sample Locations # East Arm Wharf # South Shell Island Data sources: Base Data: GoogleEarth(c) 2009 Location of Sediment Samples, HVAS and Track Etch Detectors: East Arm Wharf BHP Billiton Olympic Dam Expansion EIS Baseline Geochemistry Study East Arm Wharf and Alice Springs, Northern Territory Figure F1 A4 size

 LEGEND!")
46 Darwin" PROJECT ID CREATED BY LAST MODIFIED B43781 CW CW - 03 March ,300 AECOM does not warrant the accuracy or completeness of information displayed in this map and any person using it does so at their own risk. AECOM shall bear no responsibility or liability for any errors, faults, defects, or omissions in the information.!.!.!. TE TE TE !.!. Alice Springs TE TE !. TE Northern Territory Alice Springs " metres 1:40,000 (when printed at A4) LEGEND!. Track Etch Detectors Data sources: Base Data: GoogleEarth(c) 2009 Location of Track Etch Detectors: Alice Springs BHP Billiton Olympic Dam EIS Baseline Geochemistry Study East Arm Wharf and Alice Springs, Northern Territory Figure F2 Map Document: (G:\B43781 Olympic Dam\Draft Figures\Figure2.mxd) 3/03/ :39:19 PM A4 size


 Data sources: Esslemont (1997) URS (2004) Fortune (2006) All are approximations only Locations of Sampling Sites: Historical Data BHP Billiton ODX EIS Baseline Geochemistry Study")
47 AECOM does not warrant the accuracy or completeness of information displayed in this map and any person using it does so at their own risk. AECOM shall bear no responsibility or liability for any errors, faults, defects, or omissions in the information.!a!a 191!A 196 A!A!!A!A!A!A!A!A!A !A !A!A West Arm !A!A !A!A!A 157 A!A! A! 156!A 131!A 115!A!A!A East Arm !A!A Map Document: (G:\B43781 Olympic Dam\Draft Figures\Figure3.mxd) 3/03/ :39:12 PM!A!A !A 167!A!A 163 " East Arm Wharf !A!A!A!A !A 168!A!A!A Darwin Harbour East Point " 181!A 183 Lee Point "!A!A!A Darwin " " East Arm Wharf Elizabeth River Charles Darwin University, Casuarina Berrimah 185!A 187 PROJECT ID CREATED BY LAST MODIFIED B43781 CW CW - 22 Dec ,100 2,200 metres 1:73,500 (when printed at A4) LEGEND!A Esslemont (1997)!A CSIRO (2001)!A URS (2004)!A Fortune (2006) Data sources: Esslemont (1997) URS (2004) Fortune (2006) All are approximations only Locations of Sampling Sites: Historical Data BHP Billiton ODX EIS Baseline Geochemistry Study East Arm Wharf and Alice Springs, Northern Territory Figure F3 A4 size
48 Olympic Dam EIS Port of Darwin Final Report: Initial Geochemistry Survey - East Arm Wharf and Alice Springs, Northern Territory AECOM This page has been left blank intentionally. 21 September
49 Olympic Dam EIS Port of Darwin Final Report: Initial Geochemistry Survey - East Arm Wharf and Alice Springs, Northern Territory AECOM Plates 21 September

50 Plate P-Error! Unknown switch argument.: High Volume Air Sampler, East Arm Wharf Plate P-2: Track Etch Detector, East Arm Wharf


51 Plate P-3: East Arm Wharf Sediment Sample SED_EA_02 24/08/2009 Plate P-4: East Arm Wharf Sediment Sample SED_EA_08 25/08/09


52 Plate P-5: East Arm Wharf Sediment Sample SED_EA_08 25/08/09 Plate P-6: East Arm Wharf Sediment Sample SED_EA_11 25/08/09


53 Plate P-7: East Arm Wharf Sediment Sample SED_EA_14 25/08/09 Plate P-8: East Arm Wharf Sediment Sample SED_EA_19 25/08/09


54 Plate P-9: East Arm Wharf Sediment Sample SED_EA_20 25/08/09 Plate P-10: East Arm Wharf Sediment Sample SED_EA_21 25/08/09

55 Plate P-11: East Arm Wharf Sediment Sample SED_EA_21 25/08/09
56 Olympic Dam EIS Port of Darwin Final Report: Initial Geochemistry Survey - East Arm Wharf and Alice Springs, Northern Territory AECOM This page has been left blank intentionally. 21 September
57 Olympic Dam EIS Port of Darwin Final Report: Initial Geochemistry Survey - East Arm Wharf and Alice Springs, Northern Territory AECOM Appendix A Analytical Results 21 September 2010 A
58
59

60
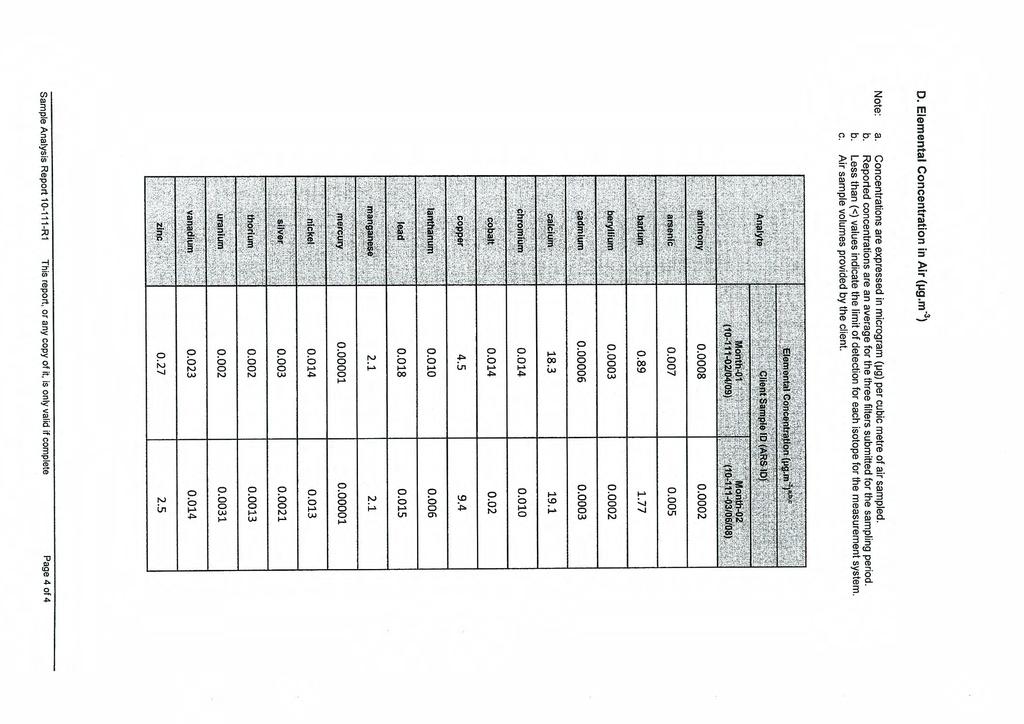
61
 and 30 th November 2009 (Batch 2)")
62 Radioactivity Analysis Report To: Aecom - Darwin Report No.: R2 P.O. Box 3175 Darwin NT 0801 Contact: Mr. Jorge Martinez Sample description: Number of detectors: Radon track etch detectors Fourteen Issue date: 24 th June 2009 Submission date: 12 November 2009 (Batch 1) and 30 th November 2009 (Batch 2) Analysis required: Analytical method: Measurment performed by: Determination of average radon concentration in air over exposure period. Radon exposure determined by alpha particle track counting after chemical etching of CR 39 detector. External laboratory, AUSTRALIAN RADIATION SERVICES PTY. LTD. Report prepared by: Dr. Malcolm Cooper Signed: Consultant Environmental Scientist Reviewed by: Mr. Colin Foley Signed: Health Physicist Date: 23 rd December 2009 Sample Analysis Report R2 This report, or any copy of it, is only valid if complete Page 1 of 2
63 Results: Average radon in air concentrations (Bq m -3 ) using track etch detectors Note: a) Radon concentrations are in becquerel (Bq) per cubic metre of air. One becquerel equals one nuclear transformation per second. b) Less than (<) values indicate the limit of detection for the measurement system. c) The reported uncertainty in each result is the expanded uncertainty calculated using a coverage factor of 2, providing a level of confidence of approximately 95%. Batch 1 Exposure period 31/7/09 to 6/11/09 Detector no. Start date Exposure period End date Detector location / Comments Average radon concentration over exposure period (Bq m -3 ) July November 2009 EAW - 4 Project #B ± July November 2009 Office (Control) 15.5 ± July November 2009 EAW - 5 Project #B ± July November 2009 EAW - 3 Project #B ± July November 2009 EAW - 6 Project #B ± July November 2009 EAW - 2 Project #B ± July November 2009 EAW - 1 Project #B ± 9.5 Batch 2 Exposure period 21/8/09 to 20/11/09 Detector no. Start date Exposure period End date Detector location / Comments Average radon concentration over exposure period (Bq m -3 ) August November August November August November 2009 Alice Springs Freight Terminal Alice Springs Freight Terminal Alice Springs Freight Terminal 16.3 ± ± ± August November 2009 Showgrounds 15.0 ± August November 2009 St. Johns 12.4 ± August November 2009 Power & Water 32.5 ± August November 2009 Bill Low 26.7 ± 8.0 Sample Analysis Report R2 This report, or any copy of it, is only valid if complete Page 2 of 2
64
65
66
67
68
69
70
71 Radioactivity Analysis Report To: Aecom - Darwin Report No.: R2 P.O. Box 3175 Darwin NT 0801 Contact: Mr. Jorge Martinez Sample description: Number of samples: Submission date: Analysis required: Analytical method: Marine Sediment and high volume air filters Six sediment, two filters 31 st August 2009 (sediments) Determination of radionuclide concentrations, including thorium-230. a. Pre-treatment Each sediment sample was dried and milled to a uniform particle size. A sub-sample was contained in a standard geometry for measurement by gamma spectrometry. An additional portion of the sample was submitted to an external laboratory for polonium-210 and thorium-230 analysis. Air filters as described in previous report, r1. b. Gamma ray-emitting radionuclides were determined by high resolution gamma ray spectrometry. Polonium-210 and thorium-230 were determined by alpha spectrometry. AUSTRALIAN RADIATION SERVICES PTY. LTD. Report prepared by: Dr. Malcolm Cooper Signed: Consultant Environmental Scientist Reviewed by: Mr. Michael Gilhen Signed: Health Physicist Date: 3 rd May 2010 Sample Analysis Report R2 This report, or any copy of it, is only valid if complete Page 1 of 3
72 Results: A. Radioactivity concentrations in sediments (Bq kg -1 ) Note: a) Radioactivity concentrations in sediment are expressed in becquerel (Bq) per kilogram of dry solid. Radioactivity concentrations in air filters are expressed in terms of becquerel per gram of dust on the filter. One becquerel equals one nuclear transformation per second. b) Less than (<) values indicate the limit of detection for each radionuclide for the measurement system. c) The reported uncertainty in each result is the expanded uncertainty calculated using a coverage factor of 2, providing a level of confidence of approximately 95%. Client Sample ID (ARS Lab. ID) SED-EA-02 SED-EA-05 SED-EA-19 SED-EA-SPLIT Radionuclide ( ) ( ) ( ) ( ) Naturally-occurring uranium (U-238) series Thorium ± ± ± ± 15 Thorium ± 6 30 ± 4 36 ± 5 35 ± 4 Radium ± 2 17 ± 2 18 ± 2 22 ± 3 Lead ± ± ± ± 18 Polonium ± 5 35 ± 4 20 ± 3 59 ± 9 Naturally-occurring thorium (Th-232) series Radium ± 5 29 ± 4 24 ± 4 24 ± 4 Thorium ± 4 27 ± 2 26 ± 2 27 ± 4 Other naturally-occurring radionuclides Potassium ± ± ± ± 30 Client Sample ID (ARS Lab. ID) SED-EA-20 SED-EA-21 Radionuclide ( ) ( ) Naturally-occurring uranium (U-238) series Thorium ± 6 38 ± 8 Thorium ± 4 31 ± 4 Radium ± 1 15 ± 2 Lead ± 9 27 ± 2 Polonium ± 5 24 ± 3 Naturally-occurring thorium (Th-232) series Radium ± 2 22 ± 2 Thorium ± 2 27 ± 3 Other naturally-occurring radionuclides Potassium ± ± 15 Sample Analysis Report R2 This report, or any copy of it, is only valid if complete Page 2 of 3
73 B. Radioactivity Concentrations in Air (µbq.m -3 ) Note: a) Radioactivity concentrations are expressed in micro-becquerel (µbq) per cubic metre of air sampled. One becquerel equals one nuclear transformation per second. b) Less than (<) values indicate the limit of detection for each radionuclide for the measurement system. c) The reported uncertainty in each result is the expanded uncertainty calculated using a coverage factor of 2, providing a level of confidence of approximately 95%. d) Air sample volumes provided by the client. Client Sample ID (ARS Lab. ID) Month 01 Month 02 Radionuclide ( /04/09) ( /06/08) Naturally-occurring uranium (U-238) series Thorium-234 < ± 50 Thorium-230 < 150 < 150 Radium ± ± 20 Lead ± ± 150 Polonium ± ± 20 Naturally-occurring thorium (Th-232) series Radium ± 8 30 ± 20 Thorium ± 7 23 ± 12 Other naturally-occurring radionuclides Potassium ± ± 130 Beryllium ± ± 400 Sample Analysis Report R2 This report, or any copy of it, is only valid if complete Page 3 of 3
74 APPENDIX M3 Statistical analysis of radionuclide survey data 1 Olympic Dam Expansion Supplementary Environmental Impact Statement 2010

75 Rho Environmetrics Pty Ltd PO 366 Highgate South Australia 5064 ρe Statistical Analysis of Radionuclide Survey Data Ray Correll Prepared for Dr Barbara Radcliffe Olympic Dam EIS September 2010 Report 29/10
76 Disclaimer Rho Environmetrics advises that the information contained in this publication comprises general statements based on scientific research. The reader is advised and needs to be aware that such information may be incomplete or unable to be used in any specific situation. No reliance or actions must therefore be made on that information without seeking prior expert professional, scientific and technical advice. To the extent permitted by law, Rho Environmetrics (including its employees and consultants) excludes all liability to any person for any consequences, including but not limited to all losses, damages, costs, expenses and any other compensation, arising directly or indirectly from using this publication (in part or in whole) and any information or material contained in it. Acknowledgement Rho Environmetrics gratefully acknowledges the cooperation given by the Olympic Dam EIS staff, and particularly the comments provided by Dr Barbara Radcliffe on a draft of this report. ii
77 Summary Radionuclide data from the Olympic Dam area have been analysed, and it is shown that concentrations of Th-234 and Ra-226 are higher nearer the plant than further away. Two statistical models are presented together with 3 methods of handling belowdetection values parameter estimates differ between the models but the significance is consistent. Th-234 and Ra-226 appear to be potential contaminants. Be-7 concentrations are depressed near the plant and although they are related to distance, Be-7 is not considered a contaminant. iii
78 Table of Contents Contents Statistical Analysis of Radionuclide Survey Data...i Disclaimer...ii Summary... iii Table of Contents...iv List of tables...v List of figures...vi Introduction...1 Data...1 Statistical Methods...2 Handling < QL...2 Statistical models of concentration from a point source...2 Exponential decay model...2 Inverse model...2 Results...3 Tabular presentation...3 Inverse model...3 Exponential model...3 Comparison of models...4 Graphical presentations...4 Thorium Radium Pb Ra Th K Be Predictions of radionuclide concentration levels...18 Inverse model...18 Exponential model...19 Discussion...19 Role of radon...19 Confounding of spatial relationships...20 Criteria for boundary of the footprint...20 Comparison of models...21 Effect of washing of foliage...23 Conclusions...24 References...25 Appendix A Transformation of the data...26 Appendix B Laboratory duplicates of analyses...28 Appendix C Handling <QL values...29 Maximum likelihood approach...29 Substitution of half QL...29 Use of Cu as a surrogate...30 Inverse model using surrogates for below detections...32 iv
79 Conclusions about handling <QL...34 Appendix D Investigation of replicate data...35 Field replicates...35 Laboratory replicates...35 Appendix E Maximum likelihood estimation of <QL values...36 Maximum likelihood estimates of inverse model...36 Maximum likelihood estimates of exponential model...36 Thorium Radium List of tables Table 1 Parameter estimates and test of significance for inverse model for seven radionuclides. Significant increase with proximity to the plant has been indicated with red shading and significant decrease with proximity to the plant has been indicated with green shading. The parameters a and b refer to the log e background concentration and the potential increase near the plant (Bq/kg dry weight) at a distance of 1 kilometre. Details of the models are described in the Statistical Methods section...3 Table 2 Parameter estimates and test of significance for exponential model for seven radionuclides. Significant increase with proximity to the plant has been indicated with red shading and significant decrease with proximity to the plant has been indicated with green shading. The parameters a, b and k refer to the log e background concentration and the potential increase near the plant (Bq/kg dry weight) and k is the rate of decline per kilometre. Details of the models are described in the Statistical Methods section...4 Table 3 Estimates of radionuclide concentration levels of Th-234 and Ra-226 at various distances from the centre of the plant using surrogate method for below detection and the inverse model. The units are Bq/kg dry weight...18 Table 4 Estimates of radionuclide concentration level of Th-234 and Ra-226 at various distances from the centre of the plant using surrogate method for below detection and the exponential model. The units are Bq/kg dry weight...19 Table 5 Decay products and half lives of radon (Rn-222)...20 Table 6 Relative concentrations of 5 radionuclides from the U-238 decay chain (after (UNSCEAR 2000)...20 Table 7 Comparison of parameters for 2 nuclides, using 3 methods of handling missing values (ml = maximum likelihood, sur=cu surrogate, and 0.5 replacing below detections with half the detection limit) and two models (exponential and inverse distance)...22 Table 8 Comparison of predictions of the concentration (Bq g -1 dry weight) for 2 radionuclides, using 3 methods of handling missing values (ml = maximum likelihood, sur=cu surrogate, and 0.5 replacing below detections with half the detection limit) and two models (exponential and inverse distance)...23 Table 9 Details of use of Cu as a surrogate for estimation of Th-234 and Ra Table 10 Parameter details for log-inverse distance model for Th-234and Ra-226. Units are in Be/kg dry weight Table 11 Variance estimates for three radionuclides based on 10 samples from near the same location, modelling variance and laboratory variance. Variances for S10 and v
80 W100 were calculated from log e transformed data of the concentration (given in Bq kg-1 dry weight)...35 Table 12 Summary of modelling inverse distance using maximum likelihood. Significant increase with proximity to the plant has been indicated with red shading and significant decrease with proximity to the plant has been indicated with green shading. The parameters a and b refer to the log e background concentration and the potential increase 1 km from the plant. Details of the models are described in the Statistical Methods section...36 Table 13 Parameter estimates and test of significance for exponential model for seven radionuclides. The s.d. (no dup) omitted the replicated series (S10 and W100) in the data. Significant increase with proximity to the plant has been indicated with red shading and significant decrease with proximity to the plant has been indicated with green shading. The parameters a, b and k refer to the log e background concentration and the potential increase near the plant (Bq/kg dry weight) and k is the rate of decline per kilometre. Details of the models are described in the Statistical Methods section38 List of figures Figure 1 Boxplot of Th-234 classified into groups defined as 0-10 km, km and >50 km from the plant. The groups had 16, 24 and 13 samples respectively. The box includes the centre 50% of samples in that class, with the heavy line representing the median and the bars showing the range of values...5 Figure 2 Effect of increasing distance from the plant on Th-234 concentrations using the inverse model and surrogate substitution for <QL values. The green dots were obtained using the surrogate method and the red triangles indicate quantifiable limit, suggesting that the true value is less than that amount...6 Figure 3 Effect of increasing distance from the plant on Th-234 concentrations using the exponential decay model and surrogate substitution for <QL values. The green dots were obtained using the surrogate method and the red triangles indicate quantifiable limit, suggesting that the true value is less than that amount...6 Figure 4 Boxplot of Ra-226 classified into groups defined as 0-10 km, km and >50 km from the plant. The groups had 16, 24 and 13 samples respectively. The box includes the centre 50% of samples in that class, with the heavy line representing the median and the bars showing the range of values...7 Figure 5 Effect of increasing distance from the plant on Ra-226 concentrations using the inverse model and surrogate substitution for <QL values. The green dots were obtained using the surrogate method and the red triangles indicate quantifiable limit, suggesting that the true value is less than that amount...8 Figure 6 Effect of increasing distance from the plant on Ra-226 concentrations using the exponential decay model and surrogate substitution for <QL values. The green dots were obtained using the surrogate method and the red triangles indicate quantifiable limit, suggesting that the true value is less than that amount...8 Figure 7 Boxplot of Pb-210 classified into groups defined as 0-10 km, km and >50 km from the plant. The groups had 16, 24 and 13 samples respectively. The box includes the centre 50% of samples in that class, with the heavy line representing the median and the bars showing the range of values...9 Figure 8 Effect of increasing distance from the plant on Pb-210 concentrations...10 Figure 9 Boxplot of Ra-228 classified into groups defined as 0-10 km, km and >50 km from the plant. The groups had 16, 24 and 13 samples respectively. The vi
81 box includes the centre 50% of samples in that class, with the heavy line representing the median and the bars showing the range of values...11 Figure 10 Effect of increasing distance from the plant on Ra-228 concentrations. The green dots were obtained using half the QL method and the red triangles indicate quantifiable limit, suggesting that the true value is less than that amount...12 Figure 11 Boxplot of Th-228 classified into groups defined as 0-10 km, km and >50 km from the plant. The groups had 16, 24 and 13 samples respectively. The box includes the centre 50% of samples in that class, with the heavy line representing the median and the bars showing the range of values...13 Figure 12 Effect of increasing distance from the plant on Th-228 concentrations using the inverse model and 0.5 QL substitution for <QL values. The fitted line has been shown as broken because it did not differ significantly from the null model...13 Figure 13 Effect of increasing distance from the plant on Th-228 concentrations using the exponential decay model and 0.5 QL for <QL values. The fitted line has been shown as broken because it did not differ significantly from the null model. The green dots were obtained using the half QL method and the red triangles indicate quantifiable limit, suggesting that the true value is less than that amount...14 Figure 14 Boxplot of K-40 classified into groups defined as 0-10 km, km and >50 km from the plant. The groups had 16, 24 and 13 samples respectively. The box includes the centre 50% of samples in that class, with the heavy line representing the median and the bars showing the range of values...15 Figure 15 Effect of increasing distance from the plant on K-40 concentrations using the inverse model. The fitted line has been shown as broken because it did not differ significantly from the null model...15 Figure 16 Effect of increasing distance from the plant on K-40 concentrations using the exponential decay model. The fitted line has been shown as broken because it did not differ significantly from the null model...16 Figure 17 Boxplot of Be-7 classified into groups defined as 0-10 km, km and >50 km from the plant. The groups had 16, 24 and 13 samples respectively. The box includes the centre 50% of samples in that class, with the heavy line representing the median and the bars showing the range of values...17 Figure 18 Effect of increasing distance from the plant on Be-7 concentrations. The fitted line is the inverse model...17 Figure 19 Effect of increasing distance from the plant on Be-7 concentrations using the exponential decay model...18 Figure 20 Relationship between reported standard error and estimate for Pb Figure 21 Relationship between reported standard error and estimate for K Figure 22 Relationship between reported standard error and estimate for Be Figure 23 Relationship between Cu concentration (mg/kg) and levels of Th-234 and Ra Figure 24 Inverse log model using surrogates for below detection. Plots on the left show the back-transformed model on a logged scale. Plots on the right show the residuals...33 Figure 25 Maximum likelihood fit of Th-234 data using the exponential decay model...39 Figure 26 Effect of increasing distance from the plant on Ra-226 concentrations using the exponential decay model...40 vii
82 Introduction Olympic Dam EIS has collected samples of foliage and analysed them for both metal and radionuclide content. This report considers data from analysis of Acacia aneura (mulga) from four transects radiating in cardinal directions from the treatment plant. In common with the previous report on heavy metals (Correll, 2010), this report considers two models for the relationship between radionuclide concentration and distance a negative exponential model and a linear model based on the inverse of distance from the plant (Correll, 2010). Many of the observations of the radionuclides were below the quantification level (QL). This posed problems in the analysis particularly as the majority of those measures were at distances up to 100 km from the potential source of concentration. The <QL data rendered estimating a background level difficult. Three different methods of estimating the <QLs and the most satisfying results were obtained using a Cu surrogate method for Th-234, Ra-226 Where the surrogate method was not feasible and there were values <QL, the simple substitution of QL/2 has been used for testing. An alternative maximum likelihood method was found to give a comparable results and these are included in an appendix. The radionuclides analysed were Th-234, Ra-226, Pb-210, Ra-228, K-40 and Be-7. Of these, two radionuclides (Th-234 and Ra-226) provided indication of potential impact and discussion has been concentrated on those two analytes. Data The data included analyses of seven radionuclides in Acacia aneura foliage which had been collected at varying distances up to a nominal 100 km north, east, south and west of the Olympic Dam facility. Distance data (calculated from GPS co-ordinates) were supplied for both radionuclide and metal data. In many cases data were assessed as being below the quantifiable limit (<QL). This implies that that sample had a concentration between zero and the QL. In the other cases an exact estimate or quantification of the concentration was available. Quality control samples were in two forms Field duplicates (two series of 10 samples taken 10 km south of the facility and 10 taken 10 km west) Check samples sent to a second laboratory to provide a measure of the quality of the assays. The data for the assessment of laboratory variation were provided on a dry weight basis but the other data were on a wet weight basis. The wet/dry ratio was supplied enabling all data to be expressed on a dry weight basis. 1
83 Statistical Methods Handling < QL Values <QL occurred in Th-234, Th-228, Ra-228 and Ra-226. As explained in Appendix C, the <QL values for Th-234 and Ra-226 were replaced using the surrogate method and the Th-228 and Ra-228 were replaced using the QL/2 method. There were no <QL values for Pb-210, K-40 and Be-7. Statistical models of concentration from a point source There are many statistical models that may be fitted to the data these include an exponential decay from the source and an inverse model: both these models offer an estimate of the background level. Exponential decay model This model has the form ln(y d ) = a + b exp(- k d) where Y d is a measure of the concentration d km from the source; a is a background concentration (log scale); b is a potential increase in concentration near the source (log scale); d is the distance from the plant (km); and k is parameter determining the rate of decline away from the source. Inverse model The inverse model has the form ln(y d ) = a + b / d where Y d is a measure of the concentration d km from the source; a is a background concentration (log scale); and b reflects the potential increase in concentration near the source (log scale). This model is linear in 1/distance and is therefore easier to fit and more stable than the exponential decay model, at least for moderate distances. However b has no immediate interpretation as its units are concentration distance it can be better understood as the increase in log concentration at a distance 1 km from the source. The model is unstable for small values of d and undefined at the source. The exponential decay and inverse distance models were fitted to estimates as obtained by half QL and surrogate methods using the package using R statistical software ( either using the lm or nls function. Standard errors of fitted values were obtained using the predict function for the inverse model or by bootstrapping (described below) for the exponential decay model. Bootstrapping is a non-parametric estimation of estimating confidence intervals. The technique involves repeatedly re-sampling with replacement to form a series of samples of the same size of the original sample. These bootstrap samples are then used to form an empirical distribution of parameters (e.g. predicted concentration at 5 2
84 km). That empirical distribution can then be used to obtain confidence intervals of the parameter. The technique is described by Efron and Tibshirani (1993). Results Tabular presentation Inverse model A summary of the inverse model substitution for <QL values) is given in Table 1. The parameters a and b are estimates of the parameters of the inverse model as described on page 2. If the parameter b is constrained to be zero, the model reduces to the background parameter a or mean of the log concentration. That model is referred to as the null model. The change in the sum of squares when b is included in the model provides an F value (on 1 degree of freedom in this case as both b was estimated, and 51 degrees of freedom) providing a test of significance for the full model as compared to the null model. Table 1 shows that there was an increase in the concentration of Th-234 and Ra-226 near the plant but a decrease in the concentration of Be-7 with increasing proximity. There was no statistically significant effect of distance on Pb-210, Ra-228, Th-228 and K-40. Table 1 Parameter estimates and test of significance for inverse model for seven radionuclides. Significant increase with proximity to the plant has been indicated with red shading and significant decrease with proximity to the plant has been indicated with green shading. The parameters a and b refer to the log e background concentration and the potential increase near the plant (Bq/kg dry weight) at a distance of 1 kilometre. Details of the models are described in the Statistical Methods section Th 234 Ra 226 Pb 210 Ra 228 Th 228 K 40 Be 7 Full model a b s of sqs df Null model Mean (a) s of sqs df F p Exponential model A summary of the exponential model substitution for <QL values) is given in Table 2. The parameters a, b and k are estimates of the parameters of the exponential decay model as described on page 2. If the parameter b is constrained to be zero, the model reduces to the background parameter a or mean of the log concentration. That model 3
85 is referred to as the null model. The change in the sum of squares provides an F value (on 2 degrees of freedom in this case as both b and k were estimated, and 50 degrees of freedom) providing a test of significance for the full model as compared to the null model. Table 2 shows that there was an increase in the concentration of Th-234 and Ra-226 near the plant but a decrease in the concentration of Be-7 with increasing proximity. There was no statistically significant effect of distance on Pb-210, Ra-228, Th-228 and K-40. Comparison of models Although the two models have a very different philosophy, the conclusions obtained were the same there was increasing concentration near the plant for Th-238 and Ra- 226, and decrease with proximity for Be-7 and no statistically significant effect of distance on Pb-210, Ra-228, Th-228 and K-40. There were differences in the estimation of the background between the models. Table 2 Parameter estimates and test of significance for exponential model for seven radionuclides. Significant increase with proximity to the plant has been indicated with red shading and significant decrease with proximity to the plant has been indicated with green shading. The parameters a, b and k refer to the log e background concentration and the potential increase near the plant (Bq/kg dry weight) and k is the rate of decline per kilometre. Details of the models are described in the Statistical Methods section Th 234 Ra 226 Pb 210 Ra 228 Th 228 K 40 Be 7 Full model a b k s of sqs df Null model Mean (a) sd s of sqs df F p Graphical presentations This section of the report provides diagrammatic presentations of key analyses. Boxplots have been included for all 7 radionuclides because of their simplicity and because they do not require any distributional assumptions. Thorium 234 The results from Th-234 data using surrogate substitution for <QL data are shown in 4
86 Figure 1 to Figure 3. The data at a distance further than 10 km from the plant are dominated by samples that had levels below the quantifiable limit. Figure 1 is a boxplot comparison and shows quite clearly that there were higher concentrations nearer the source than further away there was little overlap between the 0-10 and km groups of samples. There was strong evidence (p < 0.001) of a focus of elevated Ra-226 levels near the plant with declining values with distance (Table 1 and Table 2) as indicated by the F test. The blue line shown in Figure 2 shows the inverse model fits the high values near plant very well. The exponential decay model (Figure 3) shows a similar pattern but approaches an asymptote more rapidly. The fit away from the plant is basically background estimate (parameter a). Th-234 Bq/kg dry wt (0,10] (10,50] (50,200] Distance from plant (km) Figure 1 Boxplot of Th-234 classified into groups defined as 0-10 km, km and >50 km from the plant. The groups had 16, 24 and 13 samples respectively. The box includes the centre 50% of samples in that class, with the heavy line representing the median and the bars showing the range of values. 5
87 Th-234 Bq/kg dry wt Measured <QL Estimated Fitted Background Distance from plant (km) Figure 2 Effect of increasing distance from the plant on Th-234 concentrations using the inverse model and surrogate substitution for <QL values. The green dots were obtained using the surrogate method and the red triangles indicate quantifiable limit, suggesting that the true value is less than that amount Th-234 Bq/kg dry wt Measured <QL Estimated Fitted Background Distance from plant (km) Figure 3 Effect of increasing distance from the plant on Th-234 concentrations using the exponential decay model and surrogate substitution for <QL values. The green dots were obtained using the surrogate method and the red triangles indicate quantifiable limit, suggesting that the true value is less than that amount 6
88 Radium 226 The boxplot Figure 4, like that for Th-234, showed a strong trend between the distance classes. There was strong evidence (p < 0.001) of a focus of elevated Ra-226 levels near the plant with values declining with distance (Table 1 and Table 2) as indicated by the F test. The blue line shown in Figure 5 shows the inverse model fits the high values near plant very well. The exponential decay model (Figure 6) shows a similar pattern but approaches an asymptote more rapidly. The fit away from the plant is basically background estimate (parameter a). Ra-226 Bq/kg dry wt (0,10] (10,50] (50,200] Distance from plant (km) Figure 4 Boxplot of Ra-226 classified into groups defined as 0-10 km, km and >50 km from the plant. The groups had 16, 24 and 13 samples respectively. The box includes the centre 50% of samples in that class, with the heavy line representing the median and the bars showing the range of values. 7
89 Ra-226 Bq/kg dry wt Measured Estimated <QL Fitted Background Distance from plant (km) Figure 5 Effect of increasing distance from the plant on Ra-226 concentrations using the inverse model and surrogate substitution for <QL values. The green dots were obtained using the surrogate method and the red triangles indicate quantifiable limit, suggesting that the true value is less than that amount Ra-226 Bq/kg dry wt Measured <QL Estimated Fitted Background Distance from plant (km) Figure 6 Effect of increasing distance from the plant on Ra-226 concentrations using the exponential decay model and surrogate substitution for <QL values. The green dots were obtained using the surrogate method and the red triangles indicate quantifiable limit, suggesting that the true value is less than that amount 8
90 Pb-210 Figure 7 shows boxplots of the Pb-210 data. That plot shows that there is a large range of variability in the data but it does not support any trend with distance. There was no evidence of changing levels of Pb-210 with distance from the plant from either from the inverse or the exponential decay models (Table 1, Table 2 and Figure 8). These data were all above the quantifiable limit and the reported laboratory error was small (< 10%). Although these data offer no evidence of an influence of the site on the level of Pb-210 there was considerable uncertainty in the estimates. Other analyses were performed (results not presented in this report) included fitting a trend to the northing and easting data, but there were no statistically significant effects found. Pb-210 (Bq/kg dry weight) (0,10] (10,50] (50,200] Distance from plant (km) Figure 7 Boxplot of Pb-210 classified into groups defined as 0-10 km, km and >50 km from the plant. The groups had 16, 24 and 13 samples respectively. The box includes the centre 50% of samples in that class, with the heavy line representing the median and the bars showing the range of values. 9
91 Pb.210 Bq/kg dry weight Quantified Below quantification Practical limit Background Fitted line Distance (km) Figure 8 Effect of increasing distance from the plant on Pb-210 concentrations 10
92 Ra-228 There was no statistically significant effect found by using the inverse or the exponential decay models (Table 1 and Table 2). There was however a suggestion from the boxplots (Figure 9) that there was a decrease in concentration with proximity to the site. An examination of Figure 10 shows that the influential points were often substitutions where the values were <QL. Little inference can therefore be drawn from the Ra-228 data. Ra-228 Bq/kg dry wt (0,10] (10,50] (50,200] Distance from plant (km) Figure 9 Boxplot of Ra-228 classified into groups defined as 0-10 km, km and >50 km from the plant. The groups had 16, 24 and 13 samples respectively. The box includes the centre 50% of samples in that class, with the heavy line representing the median and the bars showing the range of values. 11
93 Measured Estimated <QL Fitted Background Ra-228 Bq/kg dry wt Distance from plant (km) Figure 10 Effect of increasing distance from the plant on Ra-228 concentrations. The green dots were obtained using half the QL method and the red triangles indicate quantifiable limit, suggesting that the true value is less than that amount Th-228 The boxplot of the Th-228 data (Figure 11) had a suggestion of decreasing concentrations with proximity to the site. There were several high values which were more than 10 km from the plant. Statistical analysis of the data (Table 1 and Table 2) indicated no significant trends. Both the inverse (Figure 12) and the exponential decay (Figure 13) models showed a decreased concentration nearer the plant, but the trend was not statistically significant. 12
94 Th-228 Bq/kg dry wt (0,10] (10,50] (50,200] Distance from plant (km) Figure 11 Boxplot of Th-228 classified into groups defined as 0-10 km, km and >50 km from the plant. The groups had 16, 24 and 13 samples respectively. The box includes the centre 50% of samples in that class, with the heavy line representing the median and the bars showing the range of values. Th-228 Bq/kg dry wt Measured Estimated <QL Fitted Background Distance from plant (km) Figure 12 Effect of increasing distance from the plant on Th-228 concentrations using the inverse model and 0.5 QL substitution for <QL values. The fitted line has been shown as broken because it did not differ significantly from the null model 13
95 Th-228 Bq/kg dry wt Measured <QL Estimated Fitted Background Distance from plant (km) Figure 13 Effect of increasing distance from the plant on Th-228 concentrations using the exponential decay model and 0.5 QL for <QL values. The fitted line has been shown as broken because it did not differ significantly from the null model. The green dots were obtained using the half QL method and the red triangles indicate quantifiable limit, suggesting that the true value is less than that amount K-40 There was no statistical evidence of changing levels of K-40 with distance from the plant ((Table 1 and Table 2). In common with Pb-210, all values were higher than the QL. A boxplot representation of the data (Figure 14) showed no consistent trend. The boxplot showed that there was one high value near the plant. This very high value had both a high wet weight reading (310) and a very high wet/dry ratio of Neither the inverse (Figure 15) nor exponential decay (Figure 16) models was statistically significant. 14
96 K-40 (Bq/kg dry weight) (0,10] (10,50] (50,200] Distance from plant (km) Figure 14 Boxplot of K-40 classified into groups defined as 0-10 km, km and >50 km from the plant. The groups had 16, 24 and 13 samples respectively. The box includes the centre 50% of samples in that class, with the heavy line representing the median and the bars showing the range of values. K-40 Bq/kg dry wt Measured Estimated <QL Fitted Background Distance from plant (km) Figure 15 Effect of increasing distance from the plant on K-40 concentrations using the inverse model. The fitted line has been shown as broken because it did not differ significantly from the null model 15
97 K-40 Bq/kg dry wt Measured <QL Estimated Fitted Background Distance from plant (km) Figure 16 Effect of increasing distance from the plant on K-40 concentrations using the exponential decay model. The fitted line has been shown as broken because it did not differ significantly from the null model Be-7 There was strong evidence of there being less Be-7 in foliage near the plant than further away (Table 1 and Table 2). There were no <QL values for Be-7, so there were less assumptions required. That makes the significance of the result very credible. Both the inverse (Figure 18) and the exponential decay model (Figure 19) showed a significant decrease in concentration with increasing proximity to the plant. 16
98 Be-7 Bq/kg dry wt (0,10] (10,50] (50,200] Distance from plant (km) Figure 17 Boxplot of Be-7 classified into groups defined as 0-10 km, km and >50 km from the plant. The groups had 16, 24 and 13 samples respectively. The box includes the centre 50% of samples in that class, with the heavy line representing the median and the bars showing the range of values. Be-7 Bq/kg dry wt Measured <QL Estimated Fitted Background Distance from plant (km) Figure 18 Effect of increasing distance from the plant on Be-7 concentrations. The fitted line is the inverse model 17
99 Be-7 Bq/kg dry wt Measured Estimated <QL Fitted Background Distance from plant (km) Figure 19 Effect of increasing distance from the plant on Be-7 concentrations using the exponential decay model Predictions of radionuclide concentration levels Inverse model The log inverse model using the Cu surrogate approach was used to estimate levels of radionuclide concentration at given distances from the plant. The predict function in R was then used to estimate log concentrations at various distances from the plant. Confidence limits were calculated on the log scale and exponentiated to give estimates in Bq/kg dry weight. The estimates and confidence limits are shown in Table 3. The estimates at 1 km represent extrapolations as the nominal 1 km samples were all taken further than 1 km from the site for operational reasons. The 1 km predictions are unreliable and should not be used for decisions-making. Table 3 Estimates of radionuclide concentration levels of Th-234 and Ra-226 at various distances from the centre of the plant using surrogate method for below detection and the inverse model. The units are Bq/kg dry weight. Distance Th-234 Ra-226 (km) Lower CL Estimat e Upper CL Lower CL Estimat e Upper CL Background Similar confidence intervals (not shown) were also obtained for the inverse mode using bootstrapping. 18
100 Exponential model The estimates and bootstrapped confidence limits are shown in Table 4. The estimates at 1 km represent extrapolations as the nominal 1 km samples were all taken further than 1 km from the site. The 1 km predictions are unreliable and should not be used for decisions-making. Table 4 Estimates of radionuclide concentration level of Th-234 and Ra-226 at various distances from the centre of the plant using surrogate method for below detection and the exponential model. The units are Bq/kg dry weight. Distance Th-234 Ra-226 (km) Lower CL Estimat e Upper CL Lower CL Estimat e Upper CL Background Discussion Role of radon Radon (Rn-222) is an inert gas that is part of the decay series shown in Table 5. A decay product of Rn-222 is Pb-210, which because of its relatively long half life, has the potential to accumulate. Elevated levels of Rn-222 could thus lead to measureable concentrations of Pb-210. Rn-222 naturally emanates from soils and can be considered to be a transport mechanism for radionuclides which are produced from the decay of Rn-222 (such as Pb-210 and Po-210) into the environment. Elevated concentrations of Pb-210 occur naturally and UNSCEAR (2000) reports relative concentrations of radionuclides from the U-238 decay chains as summarised in Table 6. 19
101 Table 5 Decay products and half lives of radon (Rn-222) Nuclide Isotope Decay type Half life Decay product Radon Rn 222 α d Polonium Po 218 Polonium Po 218 α 3.05 m Lead Pb 214 Lead Pb 214 β 26.8 m Bismuth Bi 214 Bismuth Bi 214 β 19.8 m Polonium Po 214 Polonium Po 214 α 164 µs Lead Pb 210 Lead Pb 210 β 22.3 y Bismuth Bi 210 Bismuth Bi 210 β 5.01 d Polonium Po 210 Polonium Po 210 α d Lead Pb 206 Lead Pb 206 Stable Table 6 Relative concentrations of 5 radionuclides from the U-238 decay chain (after (UNSCEAR 2000) Radionuclide Relative concentration in air U Th Ra Pb Po An elevation in Pb-210 and Po-210 concentrations could therefore be caused by an elevation of the concentration of Rn-222. Rn-222 concentrations are therefore a useful indicator of possible elevated levels of Pb-210 due to the operation. Confounding of spatial relationships While there have been very significant spatial relationships noted for Th-234 and Ra- 226 (and also for Be-7 but in the reverse direction), the relationships cannot be directly linked to the plant operation through analysis of those data alone. Local geological anomalies are known to affect properties of vegetation (see for example Correll and Taylor 1974). It is possible that some of the observed effects could be due to local geological features. Criteria for boundary of the footprint Currently there would appear no objective criteria for determining the footprint of the effect of the operation using the distribution of radionuclides. The highly variable natural levels of radionuclides make it difficult to set criteria for determining trigger levels. There may be scope for having a variable background level for radionuclides in a manner similar to that suggested by Hamon and McLaughlin (2004) for metals in soils. Naturally high levels of radionuclides have been reported in food from Nigeria near a tin mining site (up to 83.5 Bq/kg for Ra-226 and 89.6 Bq/kg for Th-228). The authors of that work considered those dose levels as low and harmful health effects would not be expected (Jiribi et al. 2007). However, Ra-226 is known to bio-accumulate in 20
102 shellfish, so there is potential for bio-accumulation (Supervising Scientist 2007). This aspect needs to be considered. Comparison of models A comparison of the parameters resulting from using the three methods of handling the below detection values and two models is shown in Table 7. While there was general agreement between the results, there were sufficiently large differences between the methods to remind the user that the model selection can have an effect on the parameter estimates. Much of the problem is in the estimation of background where there are in fact very few data for either isotope. The comparison of the predicted concentrations (Table 8) is more encouraging with reasonable agreement between the models at the 3 and 5 km distances. The inverse model using the Cu surrogate method typically returned a prediction near the median of the other methods. This is taken as support for choosing that combination as the preferred method of estimation. Note that the estimates given in Table 4 differ slightly as they were the median of bootstrapped samples rather than direct estimates from the model. A further positive comparison was in the significance testing, which identified Th-234 and Ra-226 activity as declining with distance from the site and also identified Be-7 as being lower near the plant than at distance with all the methods. No weighting of the values was used in the analysis. Changing the weights does not generally cause a bias to the data it generally affects the efficiency of the estimates of the parameters. Weights that are not optimal yield less efficient estimates of the parameters. In view of the differences between the models, the confidence limits quoted in Table 3 may be too narrow as they do not take into account model uncertainty. Fortunately the most consistent part of the modelling includes the distances of most concern, namely 3-10 km. 21
103 Table 7 Comparison of parameters for 2 nuclides, using 3 methods of handling missing values (ml = maximum likelihood, sur=cu surrogate, and 0.5 replacing below detections with half the detection limit) and two models (exponential and inverse distance) Radionuclide Method Exp(ml) Inv(ml) Exp(sur) Inv(sur) Exp(0.5) Inv(0.5) Background (Bq.kg -1 dry weight) a Th-234 Maximum impact (Bq.kg -1 dry weight) b k (km -1 ) Method Exp(ml) Inv(ml) Exp(sur) Inv(sur) Exp(0.5) Inv(0.5) Background (Bq.kg -1 dry weight) a Ra-226 Maximum impact (Bq.kg -1 dry weight) b k (km -1 )
104 Table 8 Comparison of predictions of the concentration (Bq g -1 dry weight) for 2 radionuclides, using 3 methods of handling missing values (ml = maximum likelihood, sur=cu surrogate, and 0.5 replacing below detections with half the detection limit) and two models (exponential and inverse distance) Radionuclide Th-234 Ra-226 Distance Exp(ml) Inv(ml) Exp(sur) Inv(sur) Exp(0.5) Inv(0.5) Back ground Back ground Effect of washing of foliage The current data were based on unwashed samples of foliage on the basis that grazing animals would consume the total load including the foliage and the dust on the foliage. There is merit in this argument. The use of unwashed foliage does pose some challenges to interpretation. For example, if there were an inert layer of dust on the foliage that could conceivably increase the dry weight and thus dilute potential concentration. That effect is likely to be small. A more likely possibility is that there is concentration in the dust on the foliage this could be a source of heavy metals and radionuclides. In the case of A. aneura this dust could be lost with a shower of rain. Conversely it could accumulate over time so that the analyte would accumulate between rain events (particularly near access tracks). If that is the case, there could be a large effect of time since the last rain on contaminant levels. Rain in that area includes thunderstorms these can be intense and localised. A local thunderstorm therefore has the potential to create differential reductions in surface concentration. This problem could be investigated by washing foliage from an area close to the workings (e.g. 3 km distance) and analysing unwashed foliage, washed foliage and the washing water, thus obtaining information as to whether the concentration is based on the surface or whether it has been incorporated into the foliage. 23
105 Conclusions There is evidence that there are elevated levels Th-234 and Ra-226 close to the operation, but the exact extent of the footprint cannot be defined until a working definition of its extent has been accepted There is a depression of Be-7 near the plant. Estimation of background levels and the extent of the spread is very dependent on the choice of the model used and where there are values less than the quantifiable limit, the estimates are affected by how those values are handled. 24
106 References Correll, RL (2009). Analyses of foliar analysis data for Acacia aneura, Acacia ligulata and Atriplex vesicaria Rho Environmetrics Report 28/10 Correll, R. L. and Lange, R. T. (1965). Some aspects of the dynamics of semi-arid vegetation. Trans. Roy. Soc. S. Aust. 90: Correll, R. L., and Taylor, R. G. (1973). An occurrence of Polycarpeae spirostylis at the Daisy Bell Copper Mine, Emuford, Queensland, Australia. Trans. I.M.M. 83, B30-B34. Diomides, C., Correll, R. and Naidu, R. (2002). Assessment of aberrant levels. Proceedings of the Fifth National Workshop on the Assessment of Site Contamination / Environment Protection and Heritage Council ; editors, Langley, A., Gilbey, M. and Kennedy, B Adelaide, S. Aust. : NEPC Service Corporation, c2003. Efron B. and Tibshirani R.J. (1993). An introduction to the bootstrap Chapman and Hall Hamon, R., and McLaughlin, M.J. (2004). Moving away from single number background concentrations for metals in soils. SETAC Europe 14th Annual Meeting, April 2004, Prague, Czech Republic. Jibiri, N,N.,Farai, I.P. and Alausa, S.K. (2007). Activity concentrations of 226Ra, 228Th, and 40K in different food crops from a high background radiation area in Bitsichi, Jos Plateau, Nigeria Radiat Environ Biophys 46:53 59 Available at Lee, L. and Helsel, D. (2007). Statistical analysis of water-quality data containing multiple detection limits II: S-language software for nonparametric distribution modeling and hypothesis testing. Computers and Geosciences 33(5): Supervising Scientist (2007). Supervising Scientist Annual Reports. UNSCEAR (2000c)., Report to the General Assembly, Annex B: Exposures from natural radiation sources, 2000, United Nations Scientific Committee on the Effects of Atomic Radiation, New York. 25
107 Appendix A Transformation of the data A common assumption in statistical modelling is that the variance about the fitted model remains constant. Often the variability increases as the fitted values increase. A transformation of the data is often used to stabilise the variance. Two common transformations are the square root and logarithmic. When the variance of the data increases proportionally to the predicted mean, a square root transformation is appropriate; a classical case of this is where there are count data. When the standard deviation is proportional to the fitted mean (that is, the coefficient of variation remains constant) a logarithmic transformation can be used to stabilise the variance. Radionuclide data are often transformed to a square root scale when they are measured by counts per unit time per kg of material. This is expressed as Bq (disintegrations) per kg of material. However, often the sampling error dominates over the counting error, and this then requires a stronger transformation. More frequently the standard deviation is approximately proportional to the mean in which case a logarithmic transformation is appropriate. Figure 20, Figure 21 and Figure 22 show plots of the standard error (as supplied in the data) against the laboratory mean for Pb-210, K-40 and Be-7. The relationship is ambiguous for Pb-210 but for and Be-7, andk-40 the relationship appears weakly linear, implying the standard deviation is proportional to the mean (or constant coefficient of variation). A logarithmic transformation was therefore appropriate to give constant variance on the transformed scale. A logarithmic transformation is also consistent with the previous report on chemicals that may be of potential concern (Correll 2009). Many statistical tests are robust against changes in the variance across the modelled values. This may not be so when the variance is used in modelling the maximum likelihood estimates where there are many values that are <QL. Backtransformed means are usually biased. The correction for bias is non-trivial and dependent on assumptions such as the transformed data had normal residuals and that the variance is known. The validity of the assumptions cannot be guaranteed, and deviation from them can have a large effect. No attempt has been made to correct for the backtransformation bias. 26
108 Figure 20 Relationship between reported standard error and estimate for Pb-210 Figure 21 Relationship between reported standard error and estimate for K-40 Figure 22 Relationship between reported standard error and estimate for Be-7 27
109 Appendix B Laboratory duplicates of analyses No. Th-234 Ra-226 Pb-210 Ra-228 Th-228 K-40 Be ± 156 ± 226 ± 1 6 ± 10 < 4 16 < 4 5 ± ± 175 ± 184 ± S ± 1 < 2 13 < 4 < ± 398 ± 115 ± 1 < ± 11 < 4 < W ± 130 ± 2 2 < 10 < 2 59 ± 18 < 4 < ± 450 ± 1 < 8 < 1 21 ± 6 < ± ± 2 < 5 < ± 9 < 1.8 < ± 14 < 8 < ± 449 ± 95 ± 12 W ± 7 <
110 Appendix C Handling <QL values The data contain numerous below detection values and these present a challenge in the analysis. There are non-parametric methods of handling the below-detection levels (e.g. using a Kaplan-Meier approach as suggested by Lee and Helsel (2007). Other methods use a maximum likelihood approach, which assumes some underlying distribution of the data (e.g. log normal). Two alternative methods are also considered below. Maximum likelihood approach The maximum likelihood approach was one method used in this study to handle the <QL data.. It requires combining two components. The first part is a classical maximum likelihood of a sample of values taken from a normal distribution which can be described as N(f(θ;Distance), σ 2 ), where f(θ) is a model (either the negative exponential or the inverse distance) of the expected value of the log (base e) of the contaminant level, and θ represents the parameters; this is applied to the quantified data. In addition, the probability of obtaining an observation less than a given amount (i.e. below the quantification level) can also be estimated. The combined log of the likelihood can then be estimated. A constrained model, where some components of θ were set to zero was also estimated. Twice the difference between the log likelihoods is distributed as a χ 2. These estimates were obtained using the Solver tool in Excel. No closed solution for the standard error of the parameters was available using this method. The estimation using the maximum likelihood method makes assumptions that include that 1. The distribution is known (assumed in this case that he log of the residual has a normal distribution); 2. The observations are independent; and that 3. The variance is constant across the data set. These assumptions are in addition to the assumption that the proposed model (exponential decay or inverse) was in fact the correct model. There is no way, especially when a high proportion of the data are <QL that the assumptions listed above can be validated. The maximum likelihood estimate may be sensitive to departures from these assumptions. It would therefore be imprudent to rely solely on this approach. Substitution of half QL A simple method for handling <QL is to replace all the <QL values with half the QL. The rationale for this method is that the true value could be anywhere between QL and zero. QL/2 is then a mid-range value. The method in effect assumes a symmetric distribution bounded between zero and QL. This is a weaker assumption than the method of maximum likelihood. The current data set has a variable QL, so different values are substituted, depending on the QL. The method has the advantage over the maximum likelihood method in that it uses this information. 29
111 Use of Cu as a surrogate This section of the report explores the possibility of using Cu as a predictor of radionuclides. The copper data used are those analysed in Correll (2010), and came from samples of A. aneura collected at the same time and locations as these samples. The two nuclides that may be of potential concern are Th-234 and Ra-226. There is some physical rationale for the use of Cu as a surrogate if it is assumed that the method of transports of all three analytes is through mineral dust. Personal experience is that field sampling is generally the largest component to the overall variance, and that this is followed by sub-sampling in the laboratory. Generally chemical analyses are relatively precise and contribute only a small amount to the overall variance. In the current case, the same field sample would have been used for both chemical analysis and the radionuclide analysis but there would have been a sub-sampling variance component contributing to the variance of Cu estimates and to the radionuclide estimates. As well as the above there would have been a variance component from the digestion and measurement for the Cu assay on the one hand and variation and sample preparation and counting variance from the radionuclides. There was therefore no apparent reason to assume that the precision of the Cu analysis is better than that of the radionuclide data. Because there was no reason to assume that the precision of the Cu assay and that of the radionuclides differed, they were assumed to be approximately equal. There was then no reason as to whether the Cu should be regressed against the radionuclide data, or whether the radionuclide data should be regressed against the Cu data. The compromise was to use a regression that assumed that the precision of the two assays was similar. Simple linear regressions were fitted to both data sets the slopes of these regressions will be biased toward zero because of the sampling error in the measurement of Cu concentration. The alternative forms of the regression that assumes equal error in both the Cu and radionuclide measures are also shown these have steeper slopes, and are indicated by dashed lines. This approximation of equal relative precision of both variables was preferred so the dashed regression lines were used in subsequent analyses. Diagrammatic representations of the relationships are shown in Figure 23. The correlation was strong for both radionuclides where data were available (R 2 = and for Th-234 and Ra-226) (Table 9). The adjusted R 2 (which takes into account the number of degrees of freedom used in the fitting process) was also high for each radionuclide. The red triangles on the graph indicate the below detection levels as would be expected these are predominantly above the regression line. The above is conditional on the log Cu to log Th-234 line continuing to be straight. In Figure 12 we further test the assumption that the Cu surrogates are unbiased. The graphs on the right hand side of Figure 23 include estimates of the below detection values based on half the detection limit (QL/2, where QL is the quantifiable limit). For Th-234 (upper graphs), the green dots are predominantly above the line, so had they been used as estimates of Th-234, there would have been a bias upward. This 30
112 contrasts with Ra-226 (lower graphs) where the green points are centred on the line and so using QL/2 is a fair approximation. Th 234 (Bq/kg dry wt) Known point < point Half less than Th 234 (Bq/kg dry wt) Least suares fit Modified fit Cu (mg/kg) Cu (mg/kg) Ra 226 (Bq/kg dry wt) Ra 226 (Bq/kg dry wt) Cu (mg/kg) Cu (mg/kg) Figure 23 Relationship between Cu concentration (mg/kg) and levels of Th-234 and Ra
113 Table 9 Details of use of Cu as a surrogate for estimation of Th-234 and Ra-226 Item Th-234 Ra-226 R Adjusted R Simple regression ln(th)= ln(ra)= ln(cu) ln(cu) Modified regression ln(th)= ln(ra)= Standard deviation about line ln(cu) ln(cu) Inverse model using surrogates for below detections Summaries of the models log concentration inverse distance models are given in Table 10 and Figure 24. The quantified samples and estimated points based on the surrogate both fit the inverse model. Table 10 Parameter details for log-inverse distance model for Th-234and Ra-226. Units are in Be/kg dry weight. Parameter (log base e scale) Th-234 Ra-226 Intercept (background) a ± ± Slope (elevation at 1km) b ± ± s.d. about line
114 Th-234 Bq/kg dry wt Measured Estimated Th-234 residuals Measured Estimated /Distance 1/Distance Ra-226 Bq/kg dry wt Measured Estimated Ra-226 residuals Measured Estimated /Distance 1/Distance Figure 24 Inverse log model using surrogates for below detection. Plots on the left show the back-transformed model on a logged scale. Plots on the right show the residuals Figure 24 (right side plots) shows residual plots for the model. For Th-234 the spread of the residuals of the estimates is comparable to that of the quantified samples. This infers that the variability of the quantified and estimated points are similar. There was therefore no reason to place more weight on one type of sample than the other for Th For Ra-226 there was some evidence of the estimated values having less scatter than the quantified points. This might suggest that more weight should be given to the measured values than the quantified values that would be counter-intuitive so equal weighting was again given to the estimated and quantified samples for Ra-226. A second feature of the plots is that the residuals from the estimated points are clustered around zero. Because the means of those residuals are near zero, the contribution to the fit of those points must have been unbiased. Taken together, the residual plots offer evidence that the estimated points from the surrogate do not contribute to heteroscedasticity (unequal variance of the residuals) nor do they bias the model. The residual plots thus validate the method of using Cu as a surrogate for Th-234 and Ra
115 The use of Cu as a surrogate could not be used for Ra-228 and Th-228 because in each case the correlation with Cu was non-significant, and the regression slope was negative. Conclusions about handling <QL The method of maximum likelihood is dependent on several assumptions that cannot be validated. In contrast the QL/2 substitution, while it may not be as efficient when all the assumptions are valid, is simple and takes into account the known QL limit. The Cu surrogate method has a direct statistical justification and it has been validated. There is also a physical rationale for its use for Th-234 and Ra-226. The surrogate method was therefore preferred for those two analytes. For Ra-228 and Th-228 the QL/2 method was used. A further investigation of the residuals indicated that there was no strong case for applying differential weighting to the quantified and estimated values. 34
116 Appendix D Investigation of replicate data Field replicates Simple estimates of the variances were available for three radionuclides that had complete data (all values quantified) where 10 samples had been collected from near the same location (sites S10 and W100). Comparisons of those variances with those obtained from the exponential decay model (as defined on page 2) are given in Table 11. The variance estimates among locations S10 and W100 were comparable to those obtained from the exponential decay model. If the modelling variance was dominated by large scale (say km) spatial variation, the within site variance would be less than the variance from the exponential decay model. Because the variances were similar, the inference from the comparisons was that the replicate estimates for S10 and W100 (or more precisely the residuals from those samples) were effectively independent. Each of those samples was therefore included in the overall modelling. Table 11 Variance estimates for three radionuclides based on 10 samples from near the same location, modelling variance and laboratory variance. Variances for S10 and W100 were calculated from log e transformed data of the concentration (given in Bq kg-1 dry weight). Sample Pb-210 K-40 Be-7 Variance in S10 samples Variance in W100 samples Exponential decay model variance (excluding replicates) Laboratory variance Laboratory replicates A series of replicate laboratory data was supplied (see Appendix B for details). In most cases there were insufficient quantifications to enable a meaningful analysis of the laboratory precision. There were usable data for Pb-210, K-40 and Be-7, and within sample variances were computed for those samples (see Table 11). In two cases the laboratory variance was small compared to the field variance, so in those cases there is evidence that the error being introduced at the laboratory was small compared to the error associated with fitting the model. The variance between replicates for Pb-210 was higher than for the other radionuclides. Pb-210 had estimates of 21, 45 and 24 Bq kg -1 dry weight for sample for sample W10; this variation resulted in a high estimate of the variance for that analyte. The high laboratory variance for Pb-210 in sample W10 is of some concern. However, where there was a quantifiable value, the error quoted for the analysis was generally less than 10% which is much smaller that the value obtained for the within laboratory error as shown in Table 11. Overall the laboratory replicates were aligned with the estimated precision provided with the data. 35
117 Appendix E Modelling with maximum likelihood estimation of <QL values Maximum likelihood estimates of inverse model A summary of the results of fitting a maximum likelihood model is given in Table 12. The testing first considers a null model where there is no effect of distance (or inverse distance). In that case the model reduces to the background value a, which is the log e of the background concentration in Bq kg -1 dry weight. In the case of the inverse model, the slope parameter b is taken as zero whereas in the case of the exponential model the maximum potential increase near the plant (b) is taken as zero. When b is interpreted as the increase at 1 km from the plant, the units of b are log e Bq kg -1 dry weight. Note that in the case of the exponential model, when b is zero the parameter k is not relevant. The results for the null model are the same as for the exponential model as given in Table 2. The conclusions from the inverse models were the same as for the exponential decay model there was a significant effect on Th-234 and Ra-226 and a reverse effect on Be-7. It is impractical to distinguish the effectiveness of the exponential and inverse models. The exponential model is more flexible but requires an iterative fit. The simpler inverse model has therefore been used in subsequent calculations. Table 12 Summary of modelling inverse distance using maximum likelihood. Significant increase with proximity to the plant has been indicated with red shading and significant decrease with proximity to the plant has been indicated with green shading. The parameters a and b refer to the log e background concentration and the potential increase 1 km from the plant. Details of the models are described in the Statistical Methods section Radionuclide Th-234 Ra-226 Pb-210 Ra-228 Th-228 K-40 Be-7 a Background b Slope s.d Log likelihood Null model a Background s.d Log likelihood χ 2 (Chi squared) Probability Maximum likelihood estimates of exponential model A summary of the maximum likelihood estimates and the exponential model is given in Table 13. The parameters a, b and k are estimates of the parameters of the exponential decay model as described on page 2. If the parameter b is constrained to be zero, the model reduces to just the background parameter a: this model is referred 36
118 to as the null model. The log likelihood of both the exponential decay model and the null model were estimated and the change in the likelihood was calculated, Twice the change in the log likelihood is distributed approximately as χ 2 (on 2 degrees of freedom in this case as both b and k were estimated) providing a test of significance for the full model as compared to the null model. Table 13 also includes a comparison of the standard deviation derived from the model when site replicates were included or excluded. Had the replicates from a site been similar, there would have been a reduction in the standard deviation. There was no evidence of a reduction in the standard error when the site replicates were included. It was therefore concluded that the samples from the same site were effectively independent of each other, and could therefore be included in the analysis along with all the other samples. This result is consistent with the among replicate variance being comparable to the model variance as shown in Table 11. The estimation using the maximum likelihood method makes assumptions that include that the distribution is normal, that the observations are independent and that the variance is constant across the data set. These assumptions are in addition to the assumption that the proposed model (exponential decay or inverse) was in fact the correct model. The maximum likelihood estimate may be sensitive to departures from these assumptions. 37
119 Table 13 Parameter estimates and test of significance for exponential model for seven radionuclides. The s.d. (no dup) omitted the replicated series (S10 and W100) in the data. Significant increase with proximity to the plant has been indicated with red shading and significant decrease with proximity to the plant has been indicated with green shading. The parameters a, b and k refer to the log e background concentration and the potential increase near the plant (Bq/kg dry weight) and k is the rate of decline per kilometre. Details of the models are described in the Statistical Methods section Th-234 Ra-226 Pb-210 Ra-228 Th-228 K-40 Be-7 Full Model a b k s.d s.d. (no reps) log likelihood Null model a b k s.d log likelihood χ 2 (Chi squared) p value Thorium 234 The results from Th-234 data using a maximum likelihood model fitted to the data are shown in Figure 26. The data at a distance further than 10 km from the plant are dominated by samples that had levels below the quantifiable limit. The line shown in Figure 12 fits the high values near plant very well. The shape of that curve affects the parameter k (the rate of decline) and also the parameter b the log of the increase in concentration near the plant). The fit away from the plant is basically background estimate (parameter a). There would appear to be two outliers in the data. One value was 4.14 Bq/kg dry weight at 12.1 km from the centre and the other was 3.28 Bq/kg at 48.6 km distance. Both samples were on the northern transect. The other data which were < QL are consistent with the low estimate of the background. The fit of the model is very dependent on the assumptions that the <QL data are being handled correctly and that the exponential model is appropriate. 38
120 Figure 25 Maximum likelihood fit of Th-234 data using the exponential decay model Radium 226 There was strong evidence (p < 0.001) of a focus of elevated Ra-226 levels near the plant with declining values with distance (Table 2) as indicated by the maximum likelihood test. A maximum likelihood fit is shown in Figure 6. Using the previous definition of a practical limit (Correll 2010), a value of 0.97 on the natural log scale is suggested as this would include 60% of samples above the background concentration. Samples beyond 12.2 km from the plant would be expected to be below that value. There are three quantified points in the km distance range that are clearly above the line. On the other hand there is a < QL point well below the line. These points show that there is considerable scatter about the line a point reinforced by observations from field replicates taken near the 10 and 100 km distances. 39
121 Ra.226 Bq/kg dry weight Quantified Below quantification Practical limit Background Fitted line Distance (km) Figure 26 Effect of increasing distance from the plant on Ra-226 concentrations using the exponential decay model 40
122 APPENDIX M4 Assessment of radionuclide levels in three tissues from kangaroos in the Olympic Dam region
123 M4 ASSESSMENT OF RADIONUCLIDE LEVELS IN THREE TISSUES FROM KANGAROOS IN THE OLYMPIC DAM REGION M4.1 AIMS The aims of this radiation technical note are: to review data on radionuclide activities in tissues obtained during a survey of local fauna to provide an assessment of the potential radiological implications of ingestion of meat derived from such fauna by members of the public. This work was initiated as part of the Olympic Dam expansion EIS process. This technical note will focus on the ingestion of kangaroo muscle from the Olympic Dam region. M4.2 BACKGROUND During 2005 and 2006, the Olympic Dam Environmental Department conducted radionuclide surveys in the region of the Olympic Dam mine and processing plant. Flora and fauna were sampled and analysed for radionuclide content. Fauna samples included kangaroos from inside and outside the mine lease, as well as feral cats. This technical note focuses on the results from kangaroos. The results of the radionuclide analyses were obtained from the Olympic Dam Environmental Department for statistical analysis. The raw data are included in the Appendix and this report makes no comment on the quality of the data received. One of the concerns noted has been that kangaroos are harvested for human consumption from the pastoral leases around Olympic Dam. If there is a significant build-up of radionuclides in tissues that are consumed, this could be transferred to consumers, resulting in a radiation dose beyond that of normal background. A potential dose, based on the measured radionuclide concentrations and Australian dietary behaviour, has been estimated in this report. UNSCEAR (2000) 1 provides values for concentration of uranium and thorium series radionuclides in air, water and various foodstuffs. M4.3 METHODS M4.3.1 Sample collection Kangaroos were shot by a professional shooter under destruction permit No. D Animals described as inside the mine lease or mine sample animals were collected from within the Restricted Release Zone (RRZ), in an area bounded by Eagle Way, east of the mine and south of the General Vehicles Access Road (Easting , Northing ). Seven kangaroos (Macropus rufus) were collected (four females and three males) on 28 August Seven control animals (Macropus rufus, four females and three males) were collected at distances greater than 30 km from the RRZ on Purple Downs Station on 29 January 2006 and are described as outside the mine lease (Easting , Northing and Easting , Northing ). The locations of the collection sites are shown in Figure 1. Samples of three tissue types muscle (upper hind leg) 2, liver and bone (lower hind leg) 3 were collected and sent to BHP Billiton- Olympic Dam Analytical Services for analysis of five radionuclides in the U-238 decay chain (U-238, Th-230, Ra-226, Pb-210 and Po-210). M4.3.2 Data review This Technical Note is divided into three parts: statistical analysis review of reports and published literature potential human dose assessment. 1 UNSCEAR 2000, Report to the General Assembly. Volume 1. Sources and effects of ionizing radiation. Annex B Exposures from natural radiation sources < Viewed Precise nature of muscle and bone not known. 3 Daniel, DW 1984, Biostatistics: A foundation for analysis in the health sciences, 3rd edition. John Wiley & Sons, New York.

124 Figure 1 Location of fauna sampling sites Statistical analysis The first part of this Technical Note is a broad statistical analysis of the data provided (Section M4.4). This involved determining whether there were any statistically significant differences between the samples identified as being inside the mine lease and those from outside the mine lease. With only seven animals in each group it is not possible to ascertain whether the data are normally distributed. For this reason the Mann-Whitney non-parametric test of differences between median values was used. 3 Review of reports and published literature The second part of this report involved a search for and collation of reported radionuclide levels in fauna in the Olympic Dam region since operations began. The earliest document reviewed was the 1983 Environmental Impact Statement. Subsequent annual environmental reports were also examined. The aim of this review was to identify any changes in radionuclide concentrations that could have occurred over time due to the presence of the Olympic Dam operation. In addition, a literature search identified other similar studies carried out in Australia and overseas. The results of this review are detailed in Section M4.5. Potential human dose assessment The third part of this technical note (Section M4.6) surveyed practices and regulations within the kangaroo meat industry that control the quality of meat reaching the human food chain. In addition, the results of the radionuclide analyses were used to estimate a potential human dose from the ingestion of the edible portions of an animal, and this value was compared to internationally recognised dose limits. Finally, the actual amount of kangaroo meat consumed in Australia was considered. M4.4 RESULTS M4.4.1 Measurements at Olympic Dam Table 1 summarises results of the statistical analyses of the activities of five radionuclides in three tissues from seven kangaroos shot on the mine lease and seven control animals shot at least 30 km from the boundary of the RRZ. Median and mean values are reported, together with significance as determined by the Mann-Whitney test (two-tailed). Coloured cells indicate a significant difference between mine and control animals. Yellow shading indicates mine animals were higher; blue shading that the control animals were higher. Unshaded cells indicate no significant difference was identified.
125 Table 1: Summary of radionuclide concentrations in kangaroo tissues (median and range) Tissue (location) Parameter Radionuclide (mbq/g fresh weight) U-238 Th-230 Ra-226 Pb-210 Po-210 Muscle (mine) Median (range) ** ** 0.2 ( ) 0.6 (0.06 2) 0.3 ( ) Muscle (control) Median (range) ** ** 0.2 ( ) 2.0 (0.6 3) 0.5 ( ) Significance * p p >0.05 (NS) p >0.05 (NS) p >0.05 (NS) Liver (mine) Median (range) ** ** 0.8 ( ) 21 (10 31) 23 (14 31) Liver (control) Median (range) ** ** 0.6 ( ) 6 (3 13) 10 (4 17) Significance * p p >0.2 (NS) p <0.005 p <0.005 Bone (mine) Median (range) 0.5 ( ) 0.7 ( ) 23 (6 81) 34 (23 67) 42 (19 62) Bone (control) Median (range) 0.4 ( ) 0.6 ( ) 7 (3 60) 73 (24 278) 63 (24 146) Significance * p p >0.05 (NS) p >0.05 (NS) p >0.05 (NS) p <0.05 p >0.05 (NS) * p (Mann-Whitney Test two-tailed). ** too many values at or below the limit of detection to carry out statistical analyses. M4.4.2 Discussion of Olympic Dam results The activities for U-238 and Th-230 in all tissues were very low. In the case of muscle and liver, between five and 12 of the 14 values were negative, and at least one median value was negative. No statistical analyses were attempted for the data from these tissues. The raw data are presented in the appendix. There were very low, but quantifiable, activities of U-238 and Th-230 in bone. However, there was no statistically significant difference between control and mine samples for either radionuclide. Higher levels of Ra-226 were found in bone, but there was no significant difference between mine and control animals. Activities of Ra-226 in muscle and liver were low, and no significant difference in activities of Ra-226 was identified for either tissue. In the case of Pb-210 and Po-210, activities in liver were significantly higher (both p < 0.005) in mine animals. In contrast, Pb-210 activities in bone were significantly higher in control animals (p < 0.05). Pb-210 and Po-210 activities were very low in muscle, and activities in mine and control animals did not differ significantly. No significant difference between mine and control animals was identified in Po-210 activity in bone. The main conclusion from these analyses is that activities were generally low, and in most cases (12 of 15 comparisons) no significant differences were found. Where differences were observed, no consistent pattern was discernible. Higher activities of Ra-226, Pb-210 and Po-210 were found in bone than in liver or muscle. Radium and lead are known to 4, 5, 6, 7 accumulate in bone, where they mimic calcium. There was no consistent pattern of differences. In two cases, mine animals had significantly higher activities; in one case the control animals were significantly higher. In all other cases with measurable activities of radionuclides, no significant difference was identified. 4 Agency for Toxic Substances and Disease Registry Toxicological Profile for Radium. US Public Health Service and US EPA. 5 Harley, NH Health effects of radiation and radioactive materials. In: Klaassen, CD. Casarett and Doull s Toxicology The Basic Science of Poisons 7th edition. McGraw Hill, New York. 6 Rabinowitz, M.B Toxicokinetics of bone lead. Environmental Health Perspectives. 91: Liu, J, Goyer, RA, Waalkes, MP 2008 Toxic effects of metals. In: Klaassen, CD Casarett and Doull s Toxicology The Basic Science of Poisons 7th edition. McGraw Hill, New York.
126 In summary, U-238 and Th-230 were close to or below the limit of detection in all tissues analysed, as was Ra-226 in muscle and liver, and of Pb-210 and Po-210 in muscle. Quantifiable activities of Ra-226, Pb-210 and Po-210 were found in all tissues, but were very low in muscle (all radionuclides), and liver (Ra-226). While statistically significant differences between control and mine animals were found for Pb-210 (liver and bone) and Po-210 (liver and bone), there was no consistency in the direction of the difference. In addition, data were highly variable, as illustrated by the coefficients of variation as shown in Table 2. The coefficient of variation (ratio of the standard deviation to the mean) provides an indication of the relative variability in a data set. Table 2: Coefficients of variation for activities of radionuclides in kangaroo tissue from Olympic Dam area (sd/mean) Tissue (location) Coefficient of variation (%) Radionuclide U-238 Th-230 Ra-226 Pb-210 Po-210 Muscle (mine) * * ** 83 ** Muscle (control) * * ** 55 ** Liver (mine) * * Liver (control) * * Bone (mine) Bone (control) * Too many values at or below the limit of detection to carry out statistical analysis. ** Mean values too close to 0 to calculate a meaningful coefficient of variation. M4.5 EARLIER STUDIES As part of this review, a search was conducted for data regarding radionuclide activities in kangaroo tissue in the Olympic Dam annual environmental reports published over the past 20 years. The search identified no earlier data reporting radionuclide activity in kangaroo in the annual environmental reports. It is therefore not possible to compare these results with earlier results. There were limited data on radionuclides in sheep and cattle in the Olympic Dam area, and these are summarised below. In addition, a broad literature search was conducted to identify any radionuclide surveys of kangaroos or other wildlife that may have been undertaken elsewhere in Australia or overseas. Three such studies were found at Yeelirrie, WA, in south-eastern Colorado, USA, and in north-eastern Saskatchewan, Canada. M4.5.1 Radionuclide activities in sheep and cattle from the Olympic Dam area In the and Environmental Radiation Annual Reports 8, 9, data were presented for radionuclides in tissues (bone, muscle and liver) of sheep and cattle grazing on properties adjacent to Olympic Dam. In each case a single sheep and a single steer were slaughtered. In a single sample of each tissue was analysed, while in duplicate tissue samples were analysed. In all samples, U-238 and Th-230 were very close to or below the detection levels available at that time. Two samples, steer bone and sheep muscle, had detectable levels of Th-230 (2 mbq/g fresh weight) in each case. Only two tissue samples had Ra-226 activities above the detection level steer liver (8.5 mbq/g fresh weight) and sheep bone (5 mbq/g fresh weight). For Pb-210, activities were above the detection level in liver and bone from one sheep and one steer. In the case of the steer, activities were 8 and 23 mbq/g fresh weight for liver and bone respectively, and for the sheep activities were 12 and 57 mbq/g fresh weight for liver and bone respectively. Po-210 was close to or below the level of detection available at that time in all muscle samples. Liver sample ranges were 7 to 12 mbq/g fresh weight (cattle) and 3 to 7 mbq/g fresh weight (sheep). In cattle bone, one sample was 16 mbq/g fresh weight, while the Po-210 level in the other bone was not able to be determined for technical reasons. The range of activities in sheep bone was mbq/g fresh weight. 8 Olympic Dam Operations, Environmental Radiation Annual Report June 1990 May Olympic Dam Operations, Environmental Radiation Annual Report June 1993 May 1994.
127 Given the high variability found in radionuclides in kangaroos and other species (discussed below), it is difficult to interpret the meaning of values derived from single specimens, as described in these annual reports. However, it can be noted that the values were within the ranges reported here for kangaroo tissues. M4.5.2 Activities in kangaroos from Yeelirrie, WA Results for activities of Ra-226 and Pb-210 in tissues from sampling undertaken in the Yeelirrie region of Western Australia 10 in the late 1970s were obtained and are summarised in Table 3. Values were converted from pci/g ash to Becquerels (Bq), and the denominator converted from ash to dry weight and wet weight, respectively, using the ratios provided in the report. This was done to allow comparison to be made with the current data set. Activities of Ra-226 and Pb-210 in bone for three of the four Yeelirrie kangaroos were similar to those found at Olympic Dam. High variability was evident, with the fourth animal exhibiting Ra-226 activity in bone an order of magnitude higher than the other three. Pb-210 activities in livers of three animals were similar to those found at Olympic Dam. One animal was an order of magnitude higher. Ra-226 in liver was similarly variable, with two animals below the level of detection, and two up to an order of magnitude higher than those found at Olympic Dam. Ra-226 and Pb-210 in muscle were low and near the limit of detection. Both radionuclides showed high variability, with one animal exhibiting activities more than an order of magnitude higher than the others. In all cases with high specific activities, the tissues were from the same animal (SL2). Table 3: Summary of Yeelirrie observations of Ra-226 and Pb-210 in kangaroo tissue 10 Activities are expressed on both a dry weight and wet weight basis calculated from figures supplied (pci/g ash and ratio of ash to dry and wet weight respectively). Values are from individual kangaroos. BDL indicates below detection limit. Tissue Sample site Ra-226 (mbq/g) Pb-210 (mbq/g) Dry weight Fresh weight Dry weight Fresh weight Muscle SL SL ND ND Liver SL1 BDL BDL SL ND ND2 BDL BDL Bone SL SL ND ND M4.5.3 Baseline activity in animal tissues in Colorado Whicker carried out a baseline study at the site of a proposed uranium mill in south-western Colorado, USA. His study formed part of the permitting process, and the site had not been used previously for uranium processing. Whicker sampled tissues from three jackrabbits, three cottontail rabbits and three beef cattle. Table 4 compares Whicker s values for individual animals with the median values reported for kangaroos sampled at Olympic Dam. Not all radionuclides were reported in all tissues. Values were generally of the same order of magnitude between species and sites. An exception was higher Po-210 (both mine and control animals) in kangaroo liver than in cattle liver. 10 Brownscombe AJ, Davy DR, Giles MS, Williams AR 1978, Three baseline studies in the environment of the uranium deposit at Yeelirrie, Western Australia. Australian Atomic Energy Commission Research Establishment, Lucas Heights, NSW.
128 However, given the small number of animals in the two studies, and the high variability, it appears that the radionuclide levels in kangaroo tissues (both near the mine and for controls) are very similar to those in rabbits and cattle at a site that had not then been used for uranium processing. Table 4: Comparison of radionuclide activity in herbivore tissues Species (Tissue) mbq/g (wet weight) Th-230 Ra-226 Pb-210 Po-210 *Rabbits 11 (bone) BDL 8, 22, 23, 25, 26, 30 0, 16, 20, 43, 44, 53 Not analysed (liver) BDL Not analysed 2 BDL, 4, 6, 6, 7 4 BDL, 0.9, 1 **Cow 11 (bone) BDL 1, 7, 12 BDL, 7, 53 Not analysed (liver) BDL Not analysed 4 BDL, 0.6, 5 (muscle) BDL Not analysed Not analysed BDL, 1, 5 Kangaroo (Olympic Dam median values)*** (bone) 0.7m and 0.6c 23m and 7c 34m and 73c 42m and 63c (liver) BDL 0.8m and 0.6c 21m and 6c 23m and 10c (muscle) BDL 0.2m and 0.2c 0.6m and 2.0c 0.3m and 0.5c * Values for three cottontail rabbits and three jackrabbits. ** Values for three cows. *** m and c refer to animals killed in the Olympic Dam mine area and control animals respectively. M4.5.4 Radionuclide activity in moose near Canadian uranium mines Thomas and others 12 analysed tissues from 45 moose. Fifteen animals were collected near four uranium mines, 21 from a control area with low mineralisation, and nine (livers only) from a highly mineralised area with no uranium mines (positive control). In addition, four cattle raised in areas remote from uranium mines were sampled from a local abattoir. Radionuclide levels were measured in bone, liver, kidney, muscle and rumen contents, and the mean activity for each collection site was calculated. The data were highly variable, and the authors concluded that elevated radionuclides found in some animals may have been due as much to natural soil types and diet as to uranium mining. They observed that: two moose from one mine site had low tissue concentrations Po-210 concentrations in kidneys were higher in cattle controls sourced from well outside the study area than in moose at all sites liver concentrations of Ra-226 and Po-210 from the highly mineralised control site (Hudson Bay) were as high as the highest mine site samples activities of Po-210 in liver and muscle of moose killed in the Wollaston Lake area declined with distance from the mining area. The authors state that natural uranium outcrops that occur in this area may have contributed to the finding 12. Table 5 summarises their results for Ra-226, Pb-210 and Po-210 in muscle, liver and bone. These values are presented as the range of means from mine-site related samples, the mean value for the cattle controls (C), the mean value for the controls from the area with low mineralisation (ML), and the mean value for livers from the positive control area with high mineralisation (HB). Uranium values were very low and are not included in the table. These values were estimated from the graphs presented by Thomas and others Whicker, FW 2008, Baseline survey of radionuclides in animal tissues at the proposed Pinon Ridge Millsite, < energyfuels/dos/080827/baseline.pdf>. Viewed 16/09/ Thomas, P, Irvine, J, Lyster, J & Beaulieu, R 2005, Radionuclides and trace metals in Canadian moose near uranium mines: Comparison of radiation doses and food chain transfer with cattle and caribou. Health Physics 88: Pople, T & Grigg, G 1999, Commercial harvesting of kangaroos in Australia. Chapter 5. The kangaroo industry past and present. < Viewed 24/09/2009.
129 All three radionuclides were low in muscle, as was Ra-226 in livers. Pb-210 was elevated in livers from animals killed near mine sites. Po-210 was similar in liver from mine site animals and from control animals. In bone, Ra-226 and Pb-210 were found at similar activities in mine site samples as in controls, while Po-210 was higher from samples taken near mine sites. Radionuclide activities reported in moose were of the same order of magnitude as those found in kangaroos at Olympic Dam. Table 5: Summary of data from moose collected near Canadian uranium mines (range) of means from four sites and from control animals (mean) 12 Tissue mbq/g (wet weight) C C Ra-226 Pb-210 Po-210 Mine Controls Mine Controls Mine Controls Muscle C 0.04 ML 0.9 ML 0.7 ML Liver C 0.1 ML 0.1 HB C C 1.0 ML 4 ML 10 HB Bone C C C 10 ML 43 ML C Indicates cattle control. ML Indicates moose controls from near Meadow Lake (control area with low mineralisation). HB Indicates moose (positive) controls from area of high mineralisation, but no uranium mines. 7 ML M4.6 KANGAROO CONSUMPTION AND POTENTIAL DOSE ASSESSMENT Questions have been raised regarding the likelihood of kangaroo meat harvested near Olympic Dam entering the human food chain and posing a radiological hazard to consumers. To address this issue, three topics are considered: the kangaroo meat industry in Australia studies of the extent of kangaroo home ranges potential for radionuclide dose from eating kangaroo meat. M4.6.1 The kangaroo meat industry: processing and patterns of consumption in Australia Kangaroos are harvested from the wild by licensed fauna harvesters. Handling and processing are strictly controlled to maintain meat hygiene. The animals are eviscerated in the field, and the head, limbs and, usually, the tail are discarded, but the skin is left on. The carcass is transported to a refrigerated field chiller, usually at a local town or depot, in the early morning before temperatures begin to rise. Subsequently, the carcasses are collected and transported to the processing works, where the skins are removed and stored for shipment to a tannery and the carcasses are butchered in the same way as meat from domestic stock. 13 The meat is deboned and sold in Cryovac packs (wholesale) or modified atmosphere packaging (retail). Thus, only muscle meat reaches the retail market 14 and liver and bone do not enter the human food chain. Kangaroo meat, although widely promoted as a healthy meat with fewer detrimental impacts on the environment through its production than sheep or cattle, forms only a small part of the dietary intake. Currently, only a small minority of Australians regularly consume kangaroo, as shown in Figure Less than 15% of respondents reported eating kangaroo meat four to six times a year or more. Kelly 16 reports as a rough estimate that 7,000 tpa of kangaroo meat is sold on the domestic market. Kelly 17 further argues that Even if all the kangaroos which could be taken were taken, and all the product was sold domestically, sales would only represent approximately 4.5% of the domestic red meat market. 14 Macromeats website: < Viewed 25/09/ Ampt, P & Owen, K 2008, Consumer attitudes to kangaroo meat products. RIRDC Publication No 08/026. Canberra ACT. 16 Kelly, J 2009, Personal communication. 09/09/ Kelly, J 2005, Kangaroo industry strategic plan a Report for the Rural Industries Research and Development Corporation. RIRDC Publication No 05/105. Canberra, ACT.

130 Figure 2 Responses to statements regarding consumption of kangaroo meat In contrast to the greater than 600 kg of kangaroo muscle per annum required to achieve the member of public limit for exposure, as shown in Table 8, the average Australian eats less than 0.25kg of kangaroo meat a year. For comparison, on average, Australians consume 37 kg of beef and veal a year. 18 In South Australia, a single processor provides kangaroo products to all supermarkets 14, thus effectively randomising the products in terms of where it was harvested. This reduces the likelihood of a consumer sourcing all his/her kangaroo meat from any one location in the state. M4.6.2 Home ranges of kangaroos sampled Statistically significant differences were found in only three of 15 pairs of mine/control combinations of animals collected at or near Olympic Dam. Of these, the control was statistically significantly higher in the case of Pb-210 in bone. The mine animals had higher activities in the case of Pb-210 and Po-210 in liver. This observation led to a suggestion that the two groups may share a home range extending 30 km or more from Olympic Dam, thus casting doubt on the control status of the animals harvested at distance. A literature search for information on the extent of home ranges of Macropus rufus was undertaken to cast some light on this question. Kangaroo home ranges have been reported in the literature. Frith 19 studied kangaroo movements in two areas with contrasting climates. He reported that in milder climatic conditions, red kangaroos Megaleia rufa 20 were very sedentary. However, in the more arid area studied, the animals moved greater distances to reach green herbage. Distances observed between marking and recovery of kangaroos (and time scale) are shown in Table 6. A number of more recent home range estimates for M. rufus are shown in Table 7. In some cases maximum distances travelled were indicated. Where this was not reported, an estimate of the likely distance a kangaroo would travel was calculated based on the area of the home range. This calculation assumed that the home range was roughly circular and the diameter of a circle of the stated area was taken to be an estimate of the distance a kangaroo in that home range would travel. 18 Mahr, K 2009, Kangaroo: It s what s for dinner. Time Magazine. < article/0,9171, ,00.html>. Viewed 28/09/ Frith, HJ 1964, Mobility of the red kangaroo, Megaleia rufa. CSIRO Wildlife Research 9: Megaleia rufa is a synonym for Macropus rufus.
131 Table 6: Distances travelled by Megaleia rufa (Macropus rufus) 19 Habitat type Number of kangaroos recovered Range of distance from site of marking to site of recovery (km) Elapsed time between marking and recovery for longest distance (months) Mild Arid Fisher and Owens 21 estimated home ranges of 641 and 695 ha for female and male red kangaroos, respectively, which equates to distances travelled of 2.8 and 3.0 km. Norbury and others 22 followed the movements of kangaroos in arid Western Australia over a period of drought followed by a post-drought period. They reported home ranges of 36 and 28 km 2 for males and females respectively, and noted that these were the largest home ranges reported for this species. They also reported that the longest distance travelled by males was 24 km during the drought period. This contrasts with distances of 4 km (post-drought) for males and 5 km (drought and post-drought) for females. Priddle and others 23 observed a mean shift in the centre of the home range of 1.3 km over a three-month period for red kangaroos, and concluded that they are not nomadic. A mean home range of about 8 km 2 was observed, which gives a calculated mean distance travelled of 3.2 km. Maximum observed distance was 13 km, with the majority of animals moving less than 6 km. In this study, the control animals were harvested about 30 km from the mine on Purple Downs Station. This distance is close to the maximum distance travelled reported by Frith, and well above the estimates of Priddle and others, Fisher and Owens and Norbury and others. Table 7: Reported home ranges of Macropus rufus Source Home range Estimated distance (km) Comments Male Female Male Female Fisher and Owens ha 641 ha 3.0 * 2.8 * Norbury, Norbury, and Oliver 36.1 ± 17.2 km ± 5.0 km * 4.8 * Largest home ranges recorded for this species Norbury, Norbury, and Oliver 22 Estimate based on distances between radio collar fixes during drought (D) and post-drought (PD) 24 (D) 4 (PD) 5 (D and PD) Distances quoted include 90% of radio fixes Priddel, Shepherd Male and female Maximum distance observed Radio collared and Wellard 23 animals tracked over 7.74 ± 0.90 km months * Estimated distance calculated by assuming that the home range is roughly circular and using the diameter of the circle as the distance the animals are likely to travel. While it is not possible to conclude that the animals in this study were from separate home ranges, these observed and calculated distances suggest that kangaroos harvested 30 km or more apart are not likely to share a home range. The variability in tissue activity of radionuclides observed is likely to be natural, as reported elsewhere in kangaroos and other species. M4.6.3 Dose assessment Although it is unlikely that kangaroo meat from the Olympic Dam area would form a significant proportion of a person s diet, as discussed in Section M4.6.1, dose assessments were carried out to ascertain whether it were likely that such a person s exposure would exceed the member of the public dose limit. 21 Fisher, DO & Owens, IPF 2000, Female home range size and the evolution of social organization in macropod marsupial, Journal of Animal Ecology 69: Norbury, GL, Norbury, DC & Oliver, AJ 1994, Facultative behaviour in unpredictable environments: Mobility of red kangaroos in arid Western Australia, Journal of Animal Ecology 63: Priddel, D, Shepherd, N & Wellard, G 1988, Home ranges of sympatric red kangaroos Macropus rufus, and western grey kangaroos M. fuliginosus, in western New South Wales, Australian Wildlife Research 15:
132 The dose assessments were calculated using ICRP dose conversion factors (ICRP 60/61 and ICRP 72) 24. The steps in the assessment are outlined below. The steps presented are for the potential doses from ingestion of kangaroo meat (muscle), since bone and viscera do not enter the human food chain. The mean activities of radionuclides in kangaroo tissues were calculated. Negative values were taken to be 0. Two sets of dose conversion factors were used: ICRP 60/61 (adult occupational exposures) ICRP 72 (which are age-dependent). 24 For the purposes of perspective, quantities of material were calculated that would need to be consumed to reach the member of the public limit of 1 msv above background. It should be noted that in this assessment, it has been assumed that all radionuclides in the kangaroo meat are the result of the impact of the Olympic Dam project. Therefore, this is a very conservative assessment, since normal background levels have not been taken into account. Subtracting normal background levels would reduce the activity of the radionuclides in the tissues, as shown in Figure 3. The results for each exposure scenario (ICRP 72 age-dependent factors) and (ICRP 60/61 occupational factor) are shown in Table 8. Using ICRP 72 age-dependent factors, an adult would need to ingest 648 kg of kangaroo meat a year (almost 2 kg a day) to reach the member of the public dose limit. Natural radiation Vegetation Animals Human intake Project impact radiation Soil Figure 3 Diagrammatic representation of routes for ingestion of radionuclides Table 8: Quantity of meat to be eaten based on ICRP 72 age-dependent factors or ICRP 60/61 occupational factors to receive a dose of 1 msv in one year (calculations rounded to nearest kg) Food Source Kg kangaroo tissue per year ICRP 60/61 3 months old 1 year old 5 years old 10 years old 15 years old Adult Adult Kangaroo muscle Kangaroo liver Kangaroo bone Sourced from Codell, RB & Campbell, AC 2004, Use of ICRP-72 and age-based doses for decommissioning a real-world example, WM 04 Conference, February 29 March 4, 2004, Tucson AZ. WM-4177.
133 Doses for infants younger than three months were calculated because dose conversion factors have been provided in ICRP 72. However, the meaning and usefulness of these estimates are questionable. Children of this age are rarely left alone and have relatively controlled diets with no solids and therefore would generally not be exposed to situations where they may eat like older children. Although lesser amounts of kangaroo liver and bone would need to be consumed to reach the member of the public dose limit, these tissues do not enter the human food chain (see Section M4.6.3). M4.6.4 WORST-CASE SCENARIO Another strategy for estimating any potential impact from ingesting kangaroo meat is to calculate a worst-case scenario using food intake data from national dietary surveys. 25 Table 9 presents the mean meat intake of Australian adult males and females in grams per day (g/d), as well as the intake in g/day at the 95th percentile. The latter value represents a level of intake higher than that of 95% of the population. For this EIS it is assumed that all meat intake is from kangaroo muscle. The total weight of kangaroo meat that would be consumed at each level has been calculated, and a factor calculated from the sum of the various radionuclides has been applied, multiplied by the relevant ICRP 72 dose conversion factor for adults 24. In addition, background radiation has not been subtracted from the measured activities of radionuclides in tissues. Thus, the estimated exposure represents an overestimate of radiation resulting from the mine and metallurgical processing activities. Even in the unlikely event of a man consuming meat at the 95th percentile, with all of that meat sourced from kangaroos originating near Olympic Dam, the total dose would be only 30% of the maximum allowable dose for members of the public. For those consuming lesser amounts of meat (again all of it kangaroo meat from near Olympic Dam), the doses would range from 10 20%, including background exposure. Johnston and others 26 in the context of the clean-up of the Maralinga nuclear weapons testing site, reported that Macropus rufus formed a significant part of the diet of the Indigenous population of Oak Valley. An anthropological study estimated that, on average, 600 g per person per day was consumed. This is close to the 95th percentile for males, and equates to 0.34 msv/year exposure for consuming kangaroo meat sourced from near Olympic Dam. This is a very conservative estimate, since no correction has been made for normal background radionuclide levels, and the limit of 1 msv/year is defined as exposure above background. Table 9: Worst-case scenario for radiation exposure from consumption of kangaroo meat* Consumption* Male (70 kg body weight) Female (60 kg body weight) Mean intake 95th percentile Mean intake 95th percentile g/day kg meat/year Dose conversion** 1.54 nsv/g msv/year * Assume all meat consumed is kangaroo muscle from the Olympic Dam area. ** Sum of measured activity of each radionuclide in kangaroo muscle x relevant dose conversion factor for adults (ICRP 72)24. M4.7 CONCLUSION A lack of data on background radionuclide concentration in fauna in the Olympic Dam area has made it impossible to determine whether there has been an increase in radionuclide concentrations in kangaroos over the life of the project. Sparse data available in other reports and the literature have been used as a basis for comparison. Data from Olympic Dam and Yeelirrie, WA, suggest that radionuclide activity in kangaroo is highly variable, and that muscle has much lower activities than liver and bone. Only muscle meat enters the human food chain. 25 Lester, IH 1994, Food and Nutrient Intakes. Chapter 4 in Australia s Food and Nutrition, Canberra AGPS. < au/publications/ aus/afn94/afn94.pdf>. Viewed 18/09/ Johnston, PN, Collett, AC, & Gara, TJ 2003, Aboriginal participation and concerns throughout the rehabilitation of Maralinga. Proceedings of the Third International Symposium on the Protection of the Environment from Ionising Radiation (SPEIR 3) held in Darwin, Australia July Protection of the environment from ionising radiation: the development and application of a system of radiation protection for the environment. International Atomic Energy Agency.
134 Data from other species (cattle, jackrabbits, cottontail rabbits and moose) in North America exhibited similar variability (up to an order of magnitude) in radionuclide activity in tissues including bone, muscle and liver. Variability was observed within and between tissues, radionuclides and collection sites. In this study, no significant differences occurred between control and mine kangaroo tissues in 12 out of 15 comparisons. In two cases, (Pb-210 and Po-210 in liver) the mine animals were significantly higher, and in one case (Pb-210 in bone) the control animals were significantly higher. Radionuclide activity in kangaroo muscle is consistently lower than in liver or bone for all radionuclides measured. UNSCEAR has published summary tables of concentrations of uranium series radionuclides in foods from various locations worldwide. 27 The median values for the five radionuclides in kangaroo muscle reported here all lie within the ranges reported by UNSCEAR. Conservative dose assessments indicate that any potential dose from the ingestion of kangaroo meat (muscle) is low. Bone and liver, which tend to accumulate heavy metals including radionuclides, do not enter the human food chain. In addition, consumption of kangaroo meat in Australia is low, which further reduces the likelihood of harm resulting from its consumption. The results of this assessment have been used as the basis for the dose estimates presented in the EIS. APPENDIX: RAW DATA Raw data for radionuclides in mine and control kangaroos. Muscle Location U-238 mbq/g Th-230 mbq/g Ra-226 mbq/g Pb-210 mbq/g Po-210 mbq/g 1F Mine Mine F Mine Mine F Mine Mine F Mine Mine F Mine Mine F Mine Mine F Mine Mine F Control Control F Control Control F Control Control F Control Control F Control Control F Control Control F Control Control P value (95%) UNSCEAR 2000, Report annex B: Exposures from natural radiation sources, < Viewed 1/09/2009.
135 Liver Location U-238 mbq/g Th-230 mbq/g Ra-226 mbq/g Pb-210 mbq/g Po-210 mbq/g 1L Mine Mine L Mine Mine L Mine Mine L Mine Mine L Mine Mine L Mine Mine L Mine Mine L Control Control L Control Control L Control Control L Control Control L Control Control L Control Control L Control Control P value Bone Location U-238 Concentration mbq/g Th-230 Concentration mbq/g Ra-226 Concentration mbq/g Pb-210 Concentration mbq/g Po-21 Concentration mbq/g K - 1b Mine Mine K - 2b Mine Mine K - 3b Mine Mine K - 4b Mine Mine K - 5b Mine Mine K - 6b Mine Mine K - 7b Mine Mine K - 1b Control Control K - 2b Control Control K - 3b Control Control K - 4b Control Control K - 5b Control Control K - 6b Control Control K - 7b Control Control P value Calibration
136 APPENDIX M5 Briefing paper on effects of radiation on the non-human environment 1 Olympic Dam Expansion Supplementary Environmental Impact Statement 2010

137 Uranium Services Olympic Dam Expansion EIS Technical Note Radiation exposure to Non-Human Biota Sharon Paulka Manager Radiation, Safety and Environment August 2007 The information prepared here is on the basis of Good Faith only and is based on information provided by the client and other sources at the date of production. URANIUM SERVICES ABN Level 6 West, 50 Grenfell Street ADELAIDE SA 5000 Phone: Fax : info@uel.com.au Website:
Radiation
 Radiation 04 Background radiation occurs all around us and is easily measured and controlled. In fact, the radiation risks to those working and living near a mine are very low. June 2016 WWW.ARULTD.COM
Practical implementation of anticipated radon dosimetry changes in the mining industry
 International Conference on Occupational Radiation Protection: Enhancing the Protection of Workers Gaps, Challenges and Developments Vienna, Austria, 1-5 December 2014 Practical implementation of anticipated
Environmental Monitoring Results Summary
 Environmental Monitoring Results Summary Quarter 1 2016 Name of Mine: CSA Mine Environment Protection Licence: EPL 1864 Licensee Name and Operator: Cobar Management Pty Ltd Licensee Address: PO Box 31,
Radiation Protection of the Public and Protection of the Environment
 DS432 IAEA SAFETY STANDARDS Date: March 2015 for protecting people and the environment Status: Step 8 120 day Member States consultation Deadline for comments: 20 July 2015 Radiation Protection of the
Guidance for NORM industrial activities on how to comply with the radioactive substances exemption regime
 Exemption guidance Guidance for NORM industrial activities on how to comply with the radioactive substances exemption regime February 2013 Version 1 Radioactive Substances Act 1993 The Environmental Permitting
Radiological Assessment of REX Minerals Hillside Project
 Radiological Assessment of REX Minerals Hillside Project Report prepared by: Trevlyn Radiation and Environment ABN:99 158 106 588 Report prepared for: REX Minerals LTD 1 TABLE OF CONTENTS Contents Report
STUDY ON RADON EMANATION FROM SELECTED BUILDING MATERIALS IN Iraqi Kurdistan Region
 Volume 2 Issue2 pp 18-112 May 213 www.ijsret.org ISSN 2278 882 STUDY ON RADON EMANATION FROM SELECTED BUILDING MATERIALS IN Iraqi Kurdistan Region Zakariya A. Hussein 1, Mohamad S. Jaafar 2 and Asaad H.
Norm survey in Argentina
 Norm survey in Argentina Analia Canoba ICRP Symposium on the International System of Radiological Protection October 24-26, Bethesda, MD, USA. CONTENTS INTRODUCTION INSTALLATION DESCRIPTIONS MEASUREMENTS
RADON PROGENY IN EGYPTIAN UNDERGROUND PHOSPHATE MINES
 Radiation Protection Dosimetry Vol. 95, No. 1, pp. 63 68 (2001) Nuclear Technology Publishing TECHNICAL NOTE RADON PROGENY IN EGYPTIAN UNDERGROUND PHOSPHATE MINES M. A. El-Hady, A. Mohammed, A. El-Hussein,
The assessment is based upon the design ore production of 95 million tonnes / annum.
 9A Air Quality Assessment Supporting Information This annex sets out the detailed methodology, input data and criteria for the assessment. The overarching assessment approach is detailed in Chapter 9:
Monthly Environmental Data May 2016
 Monthly Environmental Data May 2016 Contents 1 AIR QUALITY... 2 1.1 HIGH VOLUME AIR SAMPLERS... 2 1.2 TAPERED ELEMENT OSCILLATING MICROBALANCE SAMPLING (TEOM)... 7 1.3 DUST DEPOSITION SAMPLING... 11 2
Uranium mining legal and regulatory framework
 South Australia s Environment Protection Authority Uranium mining legal and regulatory framework An Australian perspective Keith Baldry Director Mining Radiation and Regulatory Support IAEA Seminar on
Peer Review of the RPII s Environmental Monitoring Programme Foundation Document. F. Exposure from Natural Sources in Ireland
 Peer Review of the RPII s Environmental Monitoring Programme 2009 Foundation Document F. Exposure from Natural Sources in Ireland 1. Introduction The European Commission is currently in the process of
The Efficiency for Gas Capture Systems for PET Cyclotrons and Hot Cells.
 The Efficiency for Gas Capture Systems for PET Cyclotrons and Hot Cells. Modern cyclotrons can produce large amounts (>500 GBq) of PET isotopes (usually F-18) per production run for radiosynthesis of various
STANDARD OPERATION PROCEDURE PILOT DUST DISPERSION AND RESUSPENSION SURVEY September 5, 2012
 1 STANDARD OPERATION PROCEDURE PILOT DUST DISPERSION AND RESUSPENSION SURVEY September 5, 2012 UTE MOUNTAIN UTE TRIBE AIR QUALITY MONITORING PROGRAM (UMUAQ) 2 TABLE OF CONTENTS A. Purpose and Applicability...3
CRIIRAD Preliminary Report No b Preliminary results of radiation monitoring near uranium mines in Namibia EJOLT Project (DRAFT version)
") CRIIRAD Commission de Recherche et d Information Indépendantes sur la Radioactivité Site : www.criirad.org Tel : + 33 (0)4 75 41 82 50 Fax : + 33 (0)4 75 81 26 48 E-mail : laboratoire@criirad.org Valence,
CRIIRAD Commission de Recherche et d Information Indépendantes sur la Radioactivité Site : www.criirad.org Tel : + 33 (0)4 75 41 82 50 Fax : + 33 (0)4 75 81 26 48 E-mail : laboratoire@criirad.org Valence,
Accidental Melting of Radioactive Sources
 Accidental Melting of Radioactive Sources K. Baldry 1, D. S. Harvey 2, A. Bishop 3 1 RWE NUKEM Limited, Windscale, Cumbria CA20 1PF, UK Email: keith.baldry@rwenukem.co.uk 2 Corus RD&T, Rotherham, S60 3AR,
A1 Australian and South Australian Government Guidelines 813. A2 South Australian Government Guidelines 871
 Appendix A EIS Guidelines CONTENTS A1 Australian and South Australian Government Guidelines 813 A2 South Australian Government Guidelines 871 A3 Northern Territory Government Guidelines 929 Olympic Dam
Dose and Risk Calculations for Decontamination of a Hot Cell
 Dose and Risk Calculations for Decontamination of a Hot Cell Amr Abdelhady and T. Mongy Reactors dept., Nuclear Research Center, Atomic Energy Authority, Cairo, Egypt Received: 1 /2/ 2014 Accepted: 6 /3/
RESIDENTIAL RADON LEVELS IN HONG KONG
 RESIDENTIAL RADON LEVELS IN HONG KONG Derek R. Lane-Smith NITON Corporation Bedford, MA ABSTRACT Hong Kong is made of concrete, which emits radon continuously. The radon concentration in a domestic apartment
TENORM A Premier for Industrial Hygienists
 TENORM A Premier for Industrial Hygienists Presentation Topics Cliff Notes Rad Fundamentals NORM and TENORM Definitions Impacted Industries Issues Work Practices and Measurement Tips for IHs Radiological
Sb Shane Brightwell. HullRAC Science Summit FEBRUARY 4, Radiological Risks from NORM/TENORM Associated with Shale Gas Development
 Sb Shane Brightwell HullRAC Science Summit FEBRUARY 4, 2014 Radiological Risks from NORM/TENORM Associated with Shale Gas Development GOALS OF THIS PRESENTATION NORM/TENORM Descriptions, Regulations Sources
WM 00 Conference, February 27 - March 2, 2000, Tucson, AZ
 DISPOSAL OF WASTE CONTAINING TECHNOLOGICALLY ENHANCED CONCENTRATIONS OF NATURALLY OCCURRING RADIOACTIVE MATERIALS WHEN IS IT A CONCERN?? ABSTRACT Roger Seitz Waste Technology Section International Atomic
Sand Mining and Transport: Potential Health Effects. Thomas M. Peters, PhD, CIH Associate Professor University of Iowa Iowa City, IA
 Sand Mining and Transport: Potential Health Effects Thomas M. Peters, PhD, CIH Associate Professor University of Iowa Iowa City, IA Midwest Environmental Health Policy Summit Feb 2014 Hydraulic Fracturing
Concentration of Natural Radionuclides in Coal and Its End Products in Steel Production
 Concentration of Natural Radionuclides in Coal and Its End Products in Steel Production N.M. Ibrahiem 1, A. Nada 2, T.M Abd El Maksoud 2, B. El Ezaby 2 & S.A Abd El Azeem 2 1 National Center for Nuclear
Cotter Corporation (N.S.L.) ( Cotter )
 ( Cotter )") COMPARISON OF BOUNDARY GAMMA EXPOSURE RATES AND AIR CONCENTRATIONS TO MODELED VALUES AND EXAMINATION OF HISTORIC ESTIMATES OF DOSE TO THE PUBLIC Prepared for: Cotter Corporation (N.S.L.) ( Cotter ) 7800
COMPARISON OF BOUNDARY GAMMA EXPOSURE RATES AND AIR CONCENTRATIONS TO MODELED VALUES AND EXAMINATION OF HISTORIC ESTIMATES OF DOSE TO THE PUBLIC Prepared for: Cotter Corporation (N.S.L.) ( Cotter ) 7800
IAEA Perspective on Management of NORM Waste
 IAEA Perspective on Management of NORM Waste Zhiwen FAN Waste and Environmental Safety Section Department of Nuclear Safety and Security Email: z.fan@iaea.org IAEA International Atomic Energy Agency Outline
ENVIRONMENTAL SAMPLING
 ENVIRONMENTAL SAMPLING 1. GENERAL. Collecting and analyzing samples provides numerical data that describe a particular situation. The ASHG shall direct sampling procedures. The sampling criteria shall
Radiological hazards from uranium mining.
 Radiological hazards from uranium mining. Bruno Chareyron Nuclear Physics Engineer and manager of the laboratory of the French Commission de Recherche et d'information Indépendantes sur la Radioactivité
Monitoring and Surveillance of Uranium Mining Residues. Peter Waggitt Waste Safety Section, IAEA Namibia October 2007
 Monitoring and Surveillance of Uranium Mining Residues Peter Waggitt Waste Safety Section, IAEA Namibia October 2007 Radioactive waste management: mining & minerals processing Safety Guide WS-G-1.2 Applies
Air Sampling in Nuclear Facilities DAY 2
 Air Sampling in Nuclear Facilities DAY 2 James Tom Voss, NRRPT, CHP jtvoss@newmexico.com WWW.VOSS-ASSOCIATES.COM Technical Management Services WWW.TMSCOURSES.COM CLASS SCHEDULE DAY 1 Fundamentals of Air
Safety Assessment of Former Uranium Mine and Milling Facilities in Ukraine and Decommission Conception
 State Nuclear Regulatory Inspectorate of Ukraine Institute of geological sciences, National Academy of Sciences of Ukraine Safety Assessment of Former Uranium Mine and Milling Facilities in Ukraine and
Australian/New Zealand Standard
 AS/NZS 3580.1.1:2007 AS/NZS 3580.1.1:2007 Australian/New Zealand Standard Methods for sampling and analysis of ambient air Part 1.1: Guide to siting air monitoring equipment AS/NZS 3580.1.1:2007 This Joint
Safety Assessment of Former Uranium Milling Facilities in Ukraine and Restoration Strategy Conception
 State State Nuclear Regulatory Committee of Ukraine Nuclear Regulatory Committee of Ukraine Safety Assessment of Former Uranium Milling Facilities in Ukraine and Restoration Strategy Conception (part 1,
Remediation of Uranium Mill Tailings Wastes in Australia : A Critical Review
 Remediation of Uranium Mill Tailings Wastes in Australia : A Critical Review G.M. Mudd Dept. Civil Eng., Uni. of Queensland, St Lucia, QLD., 4072, AUSTRALIA ABSTRACT: Australia has been an active participant
Radon and LBC at the Homestake Mine
 Radon and LBC at the Homestake Mine Keenan Thomas 28 August 2010 LRT2010 1 Instruments Started (in earnest) in May 09 Instruments on loan from various institutions and labs. o 2-3 Rad7 s (USD, Brown, BNL)
Base Metal and Iron Ore Mining
 Multilateral Investment Guarantee Agency Environmental Guidelines for Base Metal and Iron Ore Mining Industry Description and Practices This document addresses the mining of base metal ores (copper, lead
Monthly Environmental Monitoring Report
 \ Monthly Environmental Monitoring Report Name of Operation Name of Licensee Environmental Protection Licence Reporting Period start date Reporting Period end date Version Author Approver Moolarben Coal
RESEARCH REACTOR FRJ-1 (MERLIN) THE CORE STRUCTURES OF THE REACTOR BLOCK ARE DISMANTLED
 THE CORE STRUCTURES OF THE REACTOR BLOCK ARE DISMANTLED") RESEARCH REACTOR FRJ-1 (MERLIN) THE CORE STRUCTURES OF THE REACTOR BLOCK ARE DISMANTLED B. Stahn, R. Printz, K. Matela, C. Zehbe Forschungszentrum Jülich GmbH 52425 Jülich, Germany J. Pöppinghaus Gesellschaft
RESEARCH REACTOR FRJ-1 (MERLIN) THE CORE STRUCTURES OF THE REACTOR BLOCK ARE DISMANTLED B. Stahn, R. Printz, K. Matela, C. Zehbe Forschungszentrum Jülich GmbH 52425 Jülich, Germany J. Pöppinghaus Gesellschaft
THE PROBLEM OF PHOSPHOGYPSUM WASTES IN THE TINTO RIVER MARSHES HUELVA, SPAIN July 16th, 2008, Brussels
 THE PROBLEM OF PHOSPHOGYPSUM WASTES IN THE TINTO RIVER MARSHES HUELVA, SPAIN July 16th, 2008, Brussels The problem Industries HUELVA CITY Phosphogypsum spill (1.200 hectares) What is the phophogypsum?
Florida Energy Extension Service
 Florida Energy Extension Service Radon: The Gas, Threat, Detection, and Control 1 Gary D. Cook 2 THE GAS Radon is a potentially dangerous radioactive gas occurring naturally in the environment. It is one
ABM Hits 3000 Ounce Target from Trial Mining
 ASX ANNOUNCEMENT / MEDIA RELEASE ASX:ABU 12 th December 2013 ABM Hits 3000 Ounce Target from Trial Mining ABM Resources NL ( ABM or The Company ) presents an update on the Trial Mining and Processing at
Radon Progeny Size Distribution in and around Closed Uranium Mine
 Radon Progeny Size Distribution in and around Closed Uranium Mine Kimio ITO, Yuu ISHIMORI, Sada-aki FURUTA JNC Ningyo-toge, 155 Kamisaibara-son Tomata-gun Okayama, 78-698, Japan INTRODUCTION The Japan
For personal use only
 ASX ANNOUNCEMENT / MEDIA RELEASE ASX: ABU 30th September, 2014 ABM s Development Plan & Production Guidance for Old Pirate High-Grade Gold Deposit Highlights: 50,000 to 60,000 ounces of gold production
AIRBORNE PARTICULATE MATTER WITHIN 100 RANDOMLY SELECTED OFFICE BUILDINGS IN THE UNITED STATES (BASE)
") Proceedings of Healthy Buildings, Vol. 1 157 AIRBORNE PARTICULATE MATTER WITHIN 1 RANDOMLY SELECTED OFFICE BUILDINGS IN THE UNITED STATES (BASE) L.E. Burton, J.G. Girman, S.E. Womble Indoor Environments
Proceedings of Healthy Buildings, Vol. 1 157 AIRBORNE PARTICULATE MATTER WITHIN 1 RANDOMLY SELECTED OFFICE BUILDINGS IN THE UNITED STATES (BASE) L.E. Burton, J.G. Girman, S.E. Womble Indoor Environments
AUSTRALIA S NATIONAL RADIOACTIVE WASTE MANAGEMENT STRATEGY
 AUSTRALIA S NATIONAL RADIOACTIVE WASTE MANAGEMENT STRATEGY C. Perkins Department of Education, Science and Training GPO Box 9880, Canberra, ACT 2601, Australia ABSTRACT The Australian Government is committed
IAEA SAFETY STANDARDS for protecting people and the environment. Predisposal Management of Radioactive Waste from Nuclear Fuel Cycle Facilities
 DS447 Date: 20 February 2015 IAEA SAFETY STANDARDS for protecting people and the environment STATUS: SPESS STEP 12 For submission to CSS Predisposal Management of Radioactive Waste from Nuclear Fuel Cycle
Environmental Protection Licence 2688
 Perilya Environmental Protection Licence 2688 Licensee Perilya Broken Hill Limited (PBHL) Address Wentworth Rd, Broken Hill, NSW, 2880. Environmental Protection Licence 2688 (Southern Operations) Link
WM2012 Conference, February 26 March 1, 2012, Phoenix, Arizona, USA
 Modular Design of Processing and Storage Facilities for Small Volumes of Low and Intermediate Level Radioactive Waste including Disused Sealed Sources - 12372 David R. Keene*, Susanta Kumar Samanta** and
Standardised Reporting of Radioactive Discharges from Nuclear Sites
 Radiological Monitoring Technical Guidance Note 1 Standardised Reporting of Radioactive Discharges from Nuclear Sites May 2010 Version 1.0 Contents 1 Introduction 3 2 Purpose 3 3 Scope 3 4 Process for
White Dam Gold Project Dump Leach
 ALTA 2015 White Dam Gold Project Dump Leach A division of Midas Engineering Group Mineral Engineering Technical Services PO Box 5778 St Georges Tce WA 6831 P: (+61 8) 9421 9000 F: (+61 8) 9325 8311 ABN
Preparation of Natural Uranium Samples for Shipment in an Excepted Package
 WNTI W O R L D N U C L E A R T R A N S P O RT I N S T I T U T E FACT SHEET Preparation of Natural Uranium Samples for Shipment in an Excepted Package Dedicated to the safe, efficient and reliable transport
CNSC Technical Response to Dr. Gordon Edwards Critique Titled Uranium in Quebec: Truth and Consequences
 CNSC Technical Response to Dr. Gordon Edwards Critique Titled Uranium in Quebec: Truth and Consequences March 23, 2016 e-doc: 4954146 Page, section Subject Dr. Edwards critique CNSC technical response
REGULATORY CONTROL AND REMEDIATION OF URANIUM LEGACY SITES IN BULGARIA
 REGULATORY CONTROL AND REMEDIATION OF URANIUM LEGACY SITES IN BULGARIA Nikolay Todorov - Director Radiation Protection, BNRA (IAEA, J9 TR 49517) Sibiu, Romania, 7-10 September 2015 ENVIRONMENTAL MONITORING
Modelling NORM in the environment
 Modelling NORM in the environment EMRAS Project, NORM Working Group R.S. O Brien O Australia; P. McDonald UK; P.W. Waggitt IAEA; V. Koukouliou Greece; D. PérezP Sánchez Spain; J. Horyna - Czech Republic;
Risk Assessment from Radon Gas in the Greenhouses
 Risk Assessment from Radon Gas in the Greenhouses N. M. Fahmi a, M. Abd el-zaher b, A. M. El-Khatib a a- Physics Department, Faculty of Science, Alexandria University, Egypt b-department of Basic and Applied
Bengalla Mining Company Pty Limited. Particulate Matter Control Best Practice Implementation Monitoring Programs
 Bengalla Mining Company Pty Limited Particulate Matter Control Best Practice Implementation Monitoring Programs U3. Wheel Generated Dust U4. Disturbing and Handling Overburden Under Adverse Weather Conditions
Experiences on a Regulatory Clearance of the Radioactive Wastes at KAERI
 Experiences on a Regulatory Clearance of the Radioactive Wastes at KAERI - 8323 D.S. Hong, Y. Y. Ji, J. S. Shon, S. B. Hong Korea Atomic Energy Research Institute 1045 Daedeokdaero, Yuseong, Daejeon, Korea
Radiation Monitoring Network in Poland Structure and Activities
 Radiation Monitoring Network in Poland Structure and Activities D.Grabowski, M. Kurowski, W. Muszynski, B. Rubel, G. Smagala, J. Swietochowska Central Laboratory for Radiological Protection, Radioactive
North River Resources plc / Ticker: NRRP / Index: AIM / Sector: Mining 30 June 2014 North River Resources plc ( North River or the Company )
") North River Resources plc / Ticker: NRRP / Index: AIM / Sector: Mining 30 June 2014 North River Resources plc ( North River or the Company ) Namib Project - Mine Development Plan North River is pleased
North River Resources plc / Ticker: NRRP / Index: AIM / Sector: Mining 30 June 2014 North River Resources plc ( North River or the Company ) Namib Project - Mine Development Plan North River is pleased
WEACAU-III International Workshop on Environmental Aspects of Coal Ash Utilization Tel Aviv, Israel December 11 th 12 th 2012
 WEACAU-III International Workshop on Environmental Aspects of Coal Ash Utilization Tel Aviv, Israel December 11 th 12 th 2012 Stéphane Calpéna European Commission Euroforum Building EUFO 4/186 10, rue
GRADE CONTROL BLENDING AND SELECTIVITY FOR OPTIMAL PROCESS PERFORMANCE AT THE SKORPION ZINC MINE, NAMIBIA G B GNOINSKI
 GRADE CONTROL BLENDING AND SELECTIVITY FOR OPTIMAL PROCESS PERFORMANCE AT THE SKORPION ZINC MINE, NAMIBIA G B GNOINSKI Namzinc (Pty) Ltd, Private Bag 2003, Rosh Pinah, Namibia Tel: +264 63 271 2408, Fax:
Australian Tailings Group Pty Ltd Synergy (SNR) Investor Presentation
 Investor Presentation") Australian Tailings Group Pty Ltd Synergy (SNR) Investor Presentation Disclaimer Forward-Looking Statements This presentation contains forward looking statements concerning the projects owned by Australian
Australian Tailings Group Pty Ltd Synergy (SNR) Investor Presentation Disclaimer Forward-Looking Statements This presentation contains forward looking statements concerning the projects owned by Australian
Radiological Assessment of Artisanal Gold Mining Sites in Luku, Niger State, Nigeria
 Journal of Environment Pollution and Human Health, 8, Vol. 6, No., 45-5 Available online at http://pubs.sciepub.com/jephh/6// Science and Education Publishing DOI:.69/jephh-6-- Radiological Assessment
Rahim Ghanooni, M.S, CHMM Co-2 Decontamination Air Monitoring User Group Las Vegas, NV May 2010
 CO-2 Decontamination Rahim Ghanooni, M.S, CHMM Air Monitoring User Group Las Vegas, NV May 2010 The dry ice blast cleaning and decontamination process describes a technology that utilizes pellets of
NORM Waste Treatment System for oil and Gas Industry
 NORM Waste Treatment System for oil and Gas Industry SangBae Son KEPCO Engineering & Construction Company, Inc. (KEPCO E&C) 269 Hyeoksin-ro, Gimcheon-si, Gyeongsangbuk-do, 39660, Republic of Korea Phone:
Evaluation of the resuspension factor for radiological contaminants in conditions of spent nuclear fuel transports from nuclear plants
 Evaluation of the resuspension factor for radiological contaminants in conditions of spent nuclear fuel transports from nuclear plants A. Douce, D. Hameau, C. Letoffe, G. Morel, F. Saintamon, C. Penoty
Performance Standards for Indicative Ambient Particulate Monitors Environment Agency July 2012 Version 2
 Performance Standards for Indicative Ambient Particulate Monitors Environment Agency July 2012 Version 2 Foreword We set up our Monitoring Certification Scheme (MCERTS) to provide a framework of standards
IAEA Workshop Decontamination of Tubings
 IAEA Workshop Decontamination of Tubings Prof. Dr.-Ing. Sascha Gentes KIT University of the State of Baden-Wuerttemberg and National Research Center of the Helmholtz Association www.kit.edu Overview Naturally
Niagara Falls Storage Site Safety Measures During Remediation
 Niagara Falls Storage Site Safety Measures During Remediation On-Site Worker Protection Community and Environmental Protection Transportation and Disposal Safety Fully enclosed Retrieval Facility Regular
Discussion of the Environmental Impacts of the Solwara 1 Copper Concentration and Smelting Processes
 89 90 Discussion of the Environmental Impacts of the Solwara 1 Copper Concentration and Smelting Processes Tongling Non-Ferrous Metals Group copper smelter Image credit: nerin.com 91 Analysis IV Environmental
A Preliminary Assessment of Potential Impacts of Uranium Mining in Virginia on Drinking Water Sources
 A Preliminary Assessment of Potential Impacts of Uranium Mining in Virginia on Drinking Water Sources EXECUTIVE SUMMARY January 28, 2011 ES-0 Executive Summary A large uranium reserve, estimated to be
Quality Handling Systems Pty Ltd. Sampling Solution Specialists. Sampling Systems for Bulk Materials
 Quality Handling Systems Pty Ltd Sampling Solution Specialists 1 Sampling Systems for Bulk Materials 2 Quality Handling Systems Pty Ltd www.qhs.com.au Contents 3 Our Mission Our Services Our Experience
Sampling for Airborne Radioactivity
 Sampling for Airborne Radioactivity Peter D. Harty Human Protection and Performance Division Defence Science and Technology Organisation DSTO-TN-0782 ABSTRACT This report examines how to sample airborne
Notes. Lesson overview. This lesson discusses how radon enters a home, where people can be exposed to unhealthy levels.
 Lesson 3: How does radon enter a home? Lesson overview This lesson discusses how radon enters a home, where people can be exposed to unhealthy levels. Lesson objectives By the end of this lesson, the learners
RADIATION PROTECTION
 Republic of Serbia Negotiating Group on Energy BILATERAL SCREENING MEETING Examination of the Preparedness of Serbia in the field of Chapter 15 Energy Sectoral framework Nuclear energy RADIATION PROTECTION
WPG TO ENTER THE IRON ORE INDUSTRY
 Western Plains Gold Ltd ABN 51 109 426 502 PO Box N239, Grosvenor Place NSW 1220, Australia Level 11, Kyle House, 27-31 Macquarie Place, Sydney, NSW Australia Telephone (+612) 9251 1044 Facsimile (+612)
Abstract. Introduction
 Modelling dispersion of pollutants with a simple software - it is a practical approach K. Oduyemi University of Abertay Dundee, Bell Street, Dundee DD1 1HG, UK Abstract One of the most important assessment
Rajvir Singh; Scientific Officer H BSCS, BARC ;
 Rajvir Singh; Scientific Officer H BSCS, BARC ;7738910465 rajvir@barc.gov.in Radiation Radiation Ionizing alpha particles, beta particles, neutrons, gamma rays, and x-rays. Non Ionizing: microwaves, ultraviolet
Strong open pit drilling results boost plan to grow Paulsens' production to 100,000ozpa
 ASX ANNOUNCEMENT 21 DECEMBER 2011 Australian Securities Exchange Code: NST Strong open pit drilling results boost plan to grow Paulsens' production to 100,000ozpa Highlights High-grade results of up to
Questionnaire (Conventional Energy)
") Questionnaire (Conventional Energy) QUESTIONNAIRE FOR CONVENTIONAL ENERGY (SECTOR-RELATED QUESTIONS) The completion of this questionnaire is voluntary. However, replying to the relevant questions as completely
Questionnaire (Conventional Energy) QUESTIONNAIRE FOR CONVENTIONAL ENERGY (SECTOR-RELATED QUESTIONS) The completion of this questionnaire is voluntary. However, replying to the relevant questions as completely
CHAPTER 2 - Air Quality Trends and Comparisons
 CHAPTER 2 - Air Quality Trends and Comparisons Particulate Sampling Total Suspended Particulate Matter With the monitoring for PM 2.5 particulate matter being labor intensive, DEP reduced the number of
2016 No. 411 (W. 129) WATER, WALES. The Private Water Supplies (Wales) (Amendment) Regulations 2016 W E L S H S T A T U T O R Y I N S T R U M E N T S
 WATER, WALES. The Private Water Supplies (Wales) (Amendment) Regulations 2016 W E L S H S T A T U T O R Y I N S T R U M E N T S") W E L S H S T A T U T O R Y I N S T R U M E N T S 2016 No. 411 (W. 129) WATER, WALES The Private Water Supplies (Wales) (Amendment) Regulations 2016 EXPLANATORY NOTE (This note is not part of the Regulations)
W E L S H S T A T U T O R Y I N S T R U M E N T S 2016 No. 411 (W. 129) WATER, WALES The Private Water Supplies (Wales) (Amendment) Regulations 2016 EXPLANATORY NOTE (This note is not part of the Regulations)
RADIOLOGICAL PROTECTION
 Title of document ONR GUIDE RADIOLOGICAL PROTECTION Document Type: Unique Document ID and Revision No: Nuclear Safety Technical Assessment Guide Date Issued: November 2017 Review Date: November 2020 Approved
Radiological Evaluation associated to the Mining of Monazite in Central Spain
 Radiological Evaluation associated to the Mining of Monazite in ntral Spain R.García-Tenorio a, E. Sanz b, E. Burkhalter c, G.Manjón a, I. Vioque a and I. Diaz a a Departmentof Applied Physics II, University
A Radiation Protection Perspective- Decommissioning of the Moata Reactor. Biological Shield Dismantling
 A Radiation Protection Perspective- Decommissioning of the Moata Reactor Biological Shield Dismantling Australian Nuclear Science & Technology Organisation IAEA Workshop (R2D2) Sydney Australia 7 th -11
Excerpt of Thermal Power Guidelines for New Plants
 Excerpt of Thermal Power Guidelines for New Plants The following is an excerpt of the Thermal Power guidelines for New Plants, a complete version of which is found in the Pollution Prevention and Abatement
Core Analysis with the Tracer
 BRUKER ELEMENTAL Core Analysis with the Tracer Prepared by: Lee Drake, Senior Application Scientist January 23, 2014 BRUKER ELEMENTAL Key Points OBJECTIVE 3 EXPLORATION 3 DECISION MAKING 3 RECLAMATION
RADON MIGRATION MODEL FOR COVERING U MINE AND ORE PROCESSING TAILINGS *
 RADON MIGRATION MODEL FOR COVERING U MINE AND ORE PROCESSING TAILINGS * A. VÁRHEGYI, J. SOMLAI 2, Z. SAS 2 MECSEK-ÖKO Environment Protection Co. H-7633 Pécs, Estergár L. str. 9. Hungary, E-mail: varhegyiandras@mecsekoko.hu
Meteorological and Air Dispersion Modeling Methodology and Discussion for INPRO Project
 Meteorological and Air Dispersion Modeling Methodology and Discussion for INPRO Project Introduction The transport and dilution of radioactive materials in the form of aerosols, vapors, or gases released
Environmental Regulator's RWA Syllabus mapped to PHE's RPTS courses. RPTS coverage EA. No
 Environmental Regulator's mapped to PHE's RPTS courses EA. No RPTS Sylalbus/Course RPA Reference requirement 1 Basic atomic and nuclear physics Atomic structure and composition of the nucleus Yes F DU
THE NUCLEAR FUEL CYCLE
 Getting to the Core of THE NUCLEAR FUEL CYCLE From the mining of uranium to the disposal of nuclear waste @ Getting to the Core of the Nuclear Fuel Cycle The various activities associated with the production
EXTENSION TO THE WILUNA URANIUM PROJECT ASSESSMENT NO: 2002 (CMS14025) PUBLIC ENVIRONMENTAL REVIEW EXECUTIVE SUMMARY NOVEMBER 2015
 PUBLIC ENVIRONMENTAL REVIEW EXECUTIVE SUMMARY NOVEMBER 2015") EXTENSION TO THE WILUNA URANIUM PROJECT ASSESSMENT NO: 2002 (CMS14025) PUBLIC ENVIRONMENTAL REVIEW EXECUTIVE SUMMARY NOVEMBER 2015 Toro Energy Limited ABN 48 117 127 590 Level 3, 33 Richardson Street,
EXTENSION TO THE WILUNA URANIUM PROJECT ASSESSMENT NO: 2002 (CMS14025) PUBLIC ENVIRONMENTAL REVIEW EXECUTIVE SUMMARY NOVEMBER 2015 Toro Energy Limited ABN 48 117 127 590 Level 3, 33 Richardson Street,
2008 Beltwide Cotton Conferences, Nashville, Tennessee, January 8-11, 2008
 546 UPDATE ON THE FIELD EVALUATION OF EPA METHOD CTM-039 (PM2.5 STACK SAMPLING METHOD) Michael D. Buser USDA-ARS Cotton Production and Processing Research Unit Lubbock, TX Derek P. Whitelock USDA-ARS,
THE MAP OF INDOOR RADON CONCENTRATIONS IN NORTHEASTERN ROMANIA
 THE JOURNAL OF PREVENTIVE MEDICINE 2002; (3): -15 THE MAP OF INDOOR RADON CONCENTRATIONS IN NORTHEASTERN ROMANIA C. Grecea, Olga Iacob Institute of Public Health Iaşi Abstract. The radon concentrations
Preliminary Field Evaluation of EPA Method CTM-039 (PM2.5 Stack Sampling Method) Michael D. Buser and Derek P. Whitelock
 Michael D. Buser and Derek P. Whitelock") Preliminary Field Evaluation of EPA Method CTM-039 (PM2.5 Stack Sampling Method) Michael D. Buser and Derek P. Whitelock ABSTRACT Agricultural operations are encountering difficulties complying with current
Preliminary Field Evaluation of EPA Method CTM-039 (PM2.5 Stack Sampling Method) Michael D. Buser and Derek P. Whitelock ABSTRACT Agricultural operations are encountering difficulties complying with current
POLICY ON RADIOACTIVE MATERIALS
 POLICY ON RADIOACTIVE MATERIALS HEALTH & SAFETY UNIT SUMMER TERM 2010 CONTENTS 1 AIM OF THE POLICY... 3 2 INTRODUCTION... 3 3 MANAGEMENT... 4 4 ORGANISATIONAL STRUCTURE FOR RADIATION PROTECTION... 4 4.1
Physics 171, Physics and Society Quiz 1 1pm Thurs Sept 14, 2017 Each question has one correct answer, or none (choose e on the clicker). 1.
. 1.") Physics 171, Physics and Society Quiz 1 1pm Thurs Sept 14, 2017 Each question has one correct answer, or none (choose e on the clicker). 1. Maria is riding her bicycle on a flat road at 10 mi/hr. Then
Physics 171, Physics and Society Quiz 1 1pm Thurs Sept 14, 2017 Each question has one correct answer, or none (choose e on the clicker). 1. Maria is riding her bicycle on a flat road at 10 mi/hr. Then
IAEA-TECDOC Derivation of activity limits for the disposal of radioactive waste in near surface disposal facilities
 IAEA-TECDOC-1380 Derivation of activity limits for the disposal of radioactive waste in near surface disposal facilities December 2003 The originating Section of this publication in the IAEA was: Waste
IAEA SAFETY STANDARDS for protecting people and the environment. Predisposal Management of Radioactive Waste from Nuclear Fuel Cycle Facilities
 DS447 Date: September 2014 IAEA SAFETY STANDARDS for protecting people and the environment STATUS: SPESS STEP 11 MS comments incorporated Review Committee Member comments due 31 Oct Predisposal Management