Emissions Testing Report
|
|
|
- Myles Eaton
- 6 years ago
- Views:
Transcription
 Accredited for compliance with ISO/IEC 17025 This document is issued in accordance with NATA s accreditation requirements.")
1 National Ceramic Industries Australia 05-May Commercial-in-Confidence Emissions Testing Report National Ceramic Industries Australia NATA ACCREDITATION No (14391) Accredited for compliance with ISO/IEC This document is issued in accordance with NATA s accreditation requirements. This document may not be reproduced except in full.
2 AECOM Emissions Testing Report National Ceramic Industries Australia Commercial-in-Confidence Emissions Testing Report National Ceramic Industries Australia Client: National Ceramic Industries Australia ABN: Prepared by AECOM Australia Pty Ltd 17 Warabrook Boulevard, Warabrook NSW 2304, PO Box 73, Hunter Region MC NSW 2310, Australia T F ABN May-2014 Job No.: AECOM in Australia and New Zealand is certified to the latest version of ISO9001, ISO14001, AS/NZS4801 and OHSAS AECOM Australia Pty Ltd (AECOM). All rights reserved. AECOM has prepared this document for the sole use of the Client and for a specific purpose, each as expressly stated in the document. No other party should rely on this document without the prior written consent of AECOM. AECOM undertakes no duty, nor accepts any responsibility, to any third party who may rely upon or use this document. This document has been prepared based on the Client s description of its requirements and AECOM s experience, having regard to assumptions that AECOM can reasonably be expected to make in accordance with sound professional principles. AECOM may also have relied upon information provided by the Client and other third parties to prepare this document, some of which may not have been verified. Subject to the above conditions, this document may be transmitted, reproduced or disseminated only in its entirety. Reports/1.9 Stack Testing 2013/NCIA Emissions Testing Report 2013_2014.docx Revision May-2014 Prepared for National Ceramic Industries Australia ABN:
3
4 AECOM Emissions Testing Report National Ceramic Industries Australia Commercial-in-Confidence This page has been left blank intentionally. Reports/1.9 Stack Testing 2013/NCIA Emissions Testing Report 2013_2014.docx Revision May-2014 Prepared for National Ceramic Industries Australia ABN:
5 AECOM Emissions Testing Report National Ceramic Industries Australia Commercial-in-Confidence Table of Contents 1.0 Introduction Sampling Plane Requirements Methodology NATA Accredited Methods Sampling Location Equipment Calibration Results 11 Appendix A Field Sheets and Final Calculations (190 pages) Appendix B Laboratory Analytical Reports (30 pages) Appendix C Raw and Calculated Gas Data (12 pages) A B C List of Tables Table 1 Criteria for Selection of Sampling Planes (AS ) 3 Table 2 AECOM NATA Endorsed Methods 5 Table 3 Sampling Location Summary 7 Table 4 Summary Particulate Emission Monitoring Results, October and November Table 5 Kiln 1 and Kiln 2 Emission Monitoring Results Summary, January & April Table 6 Kiln 1 and 2 Gaseous Data Results, January Table 7 Clay Prep Stack Total Particulate and Fine Particulate (PM 10) Results, 30 October Table 8 Pressing and Drying Stack Total Particulate and Fine Particulate (PM 10) Results, 30 October Table 9 Dryer 1 Stack Total Particulate and Fine Particulate (PM 10) Results, 1 November Table 10 Dryer 2 Stack Total Particulate and Fine Particulate (PM 10) Results, 1 November Table 11 Glaze Line Stack Total Particulate and Fine Particulate (PM 10) Results, 30 October Table 12 Selection Line Stack Total Particulate and Fine Particulate (PM 10) Results, 29 October Table 13 Spray Dryer Stack Total Particulate and Fine Particulate (PM 10) Results, 29 October Table 14 Hot Air Cooler Stack Total Particulate and Fine Particulate (PM 10) Results, 28 October Table 15 Hot Air Cooler 2 Stack Total Particulate and Fine Particulate (PM 10) Results, 28 October Table 16 Kiln 1 Stack Total Particulate, Fine Particulate (PM 10) and Fluoride Results, 29 January Table 17 Kiln 1 Hazardous Substances (Metals), Sulfuric Acid Mist (H 2SO 4 as SO 3) and Sulfur Dioxide (SO 2 as SO 3) Results 30 January Table 18 Kiln 2 Stack Total Particulate, Fine Particulate (PM 10) and Total Fluoride 30 January Table 19 Kiln 2 Hazardous Substances (Metals) Results 31 January Table 20 Kiln 2 Sulfuric Acid Mist (H 2SO 4 as SO 3) and Sulfur Dioxide (SO 2 as SO 3) Results, 3 April Table 21 Kiln 1 Elemental Hazardous Substances (Metals) Results 27 Table 22 Kiln 2 Elemental Hazardous Substances (Metals) Results 28 Reports/1.9 Stack Testing 2013/NCIA Emissions Testing Report 2013_2014.docx Revision May-2014 Prepared for National Ceramic Industries Australia ABN:
6 AECOM Emissions Testing Report National Ceramic Industries Australia Commercial-in-Confidence This page has been left blank intentionally. Reports/1.9 Stack Testing 2013/NCIA Emissions Testing Report 2013_2014.docx Revision May-2014 Prepared for National Ceramic Industries Australia ABN:
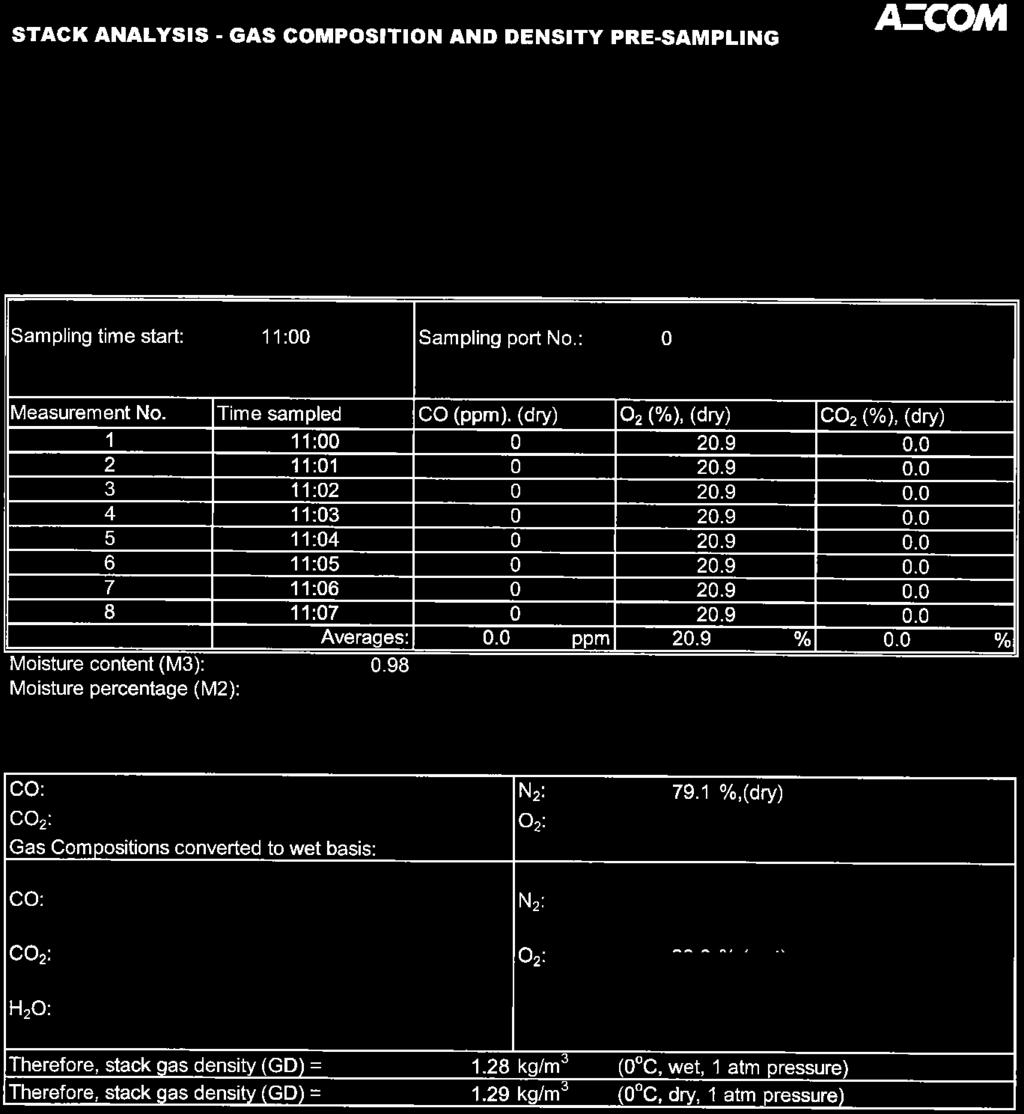
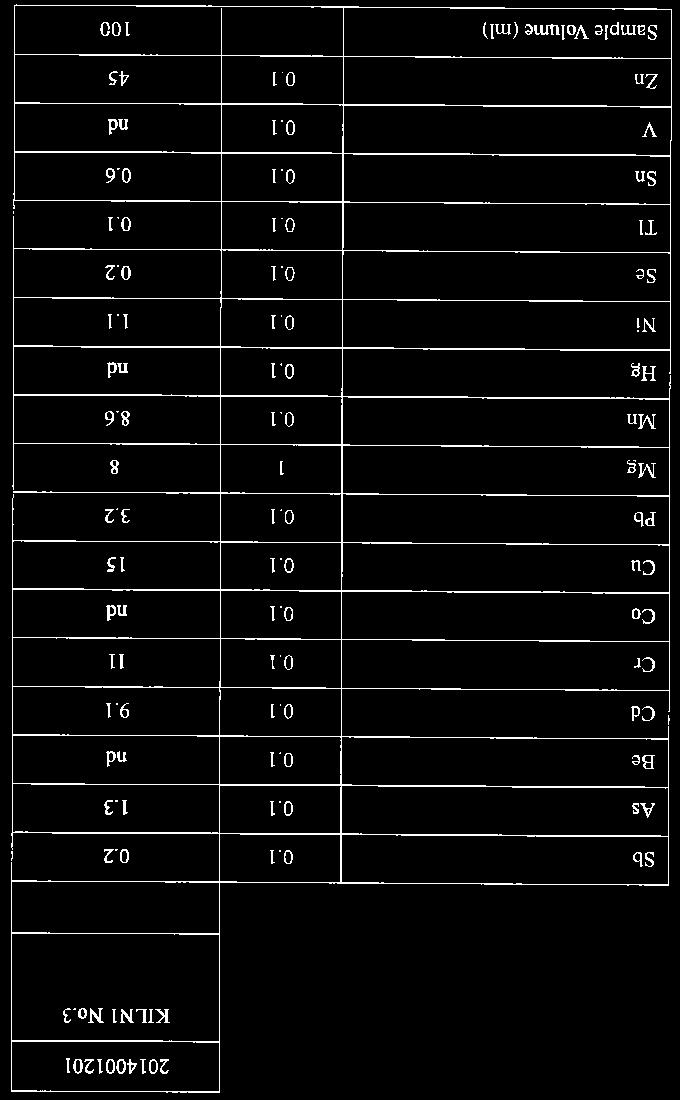
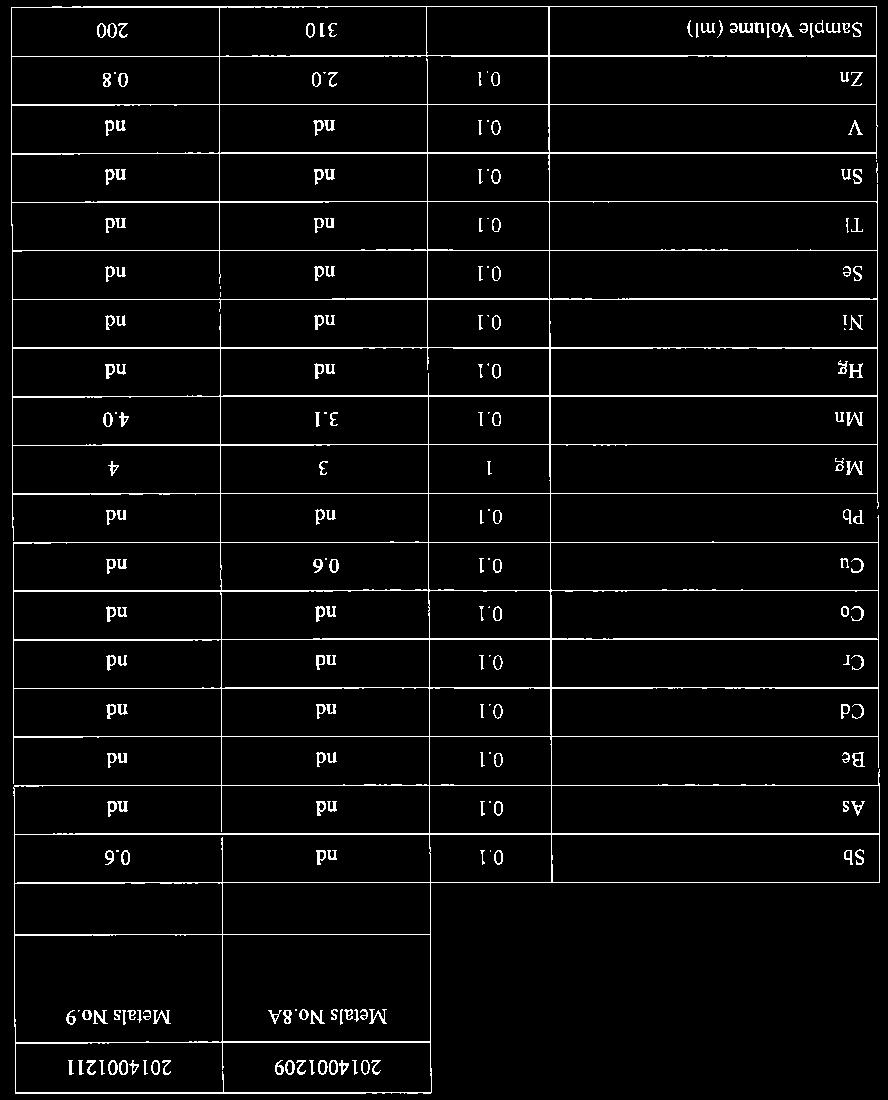
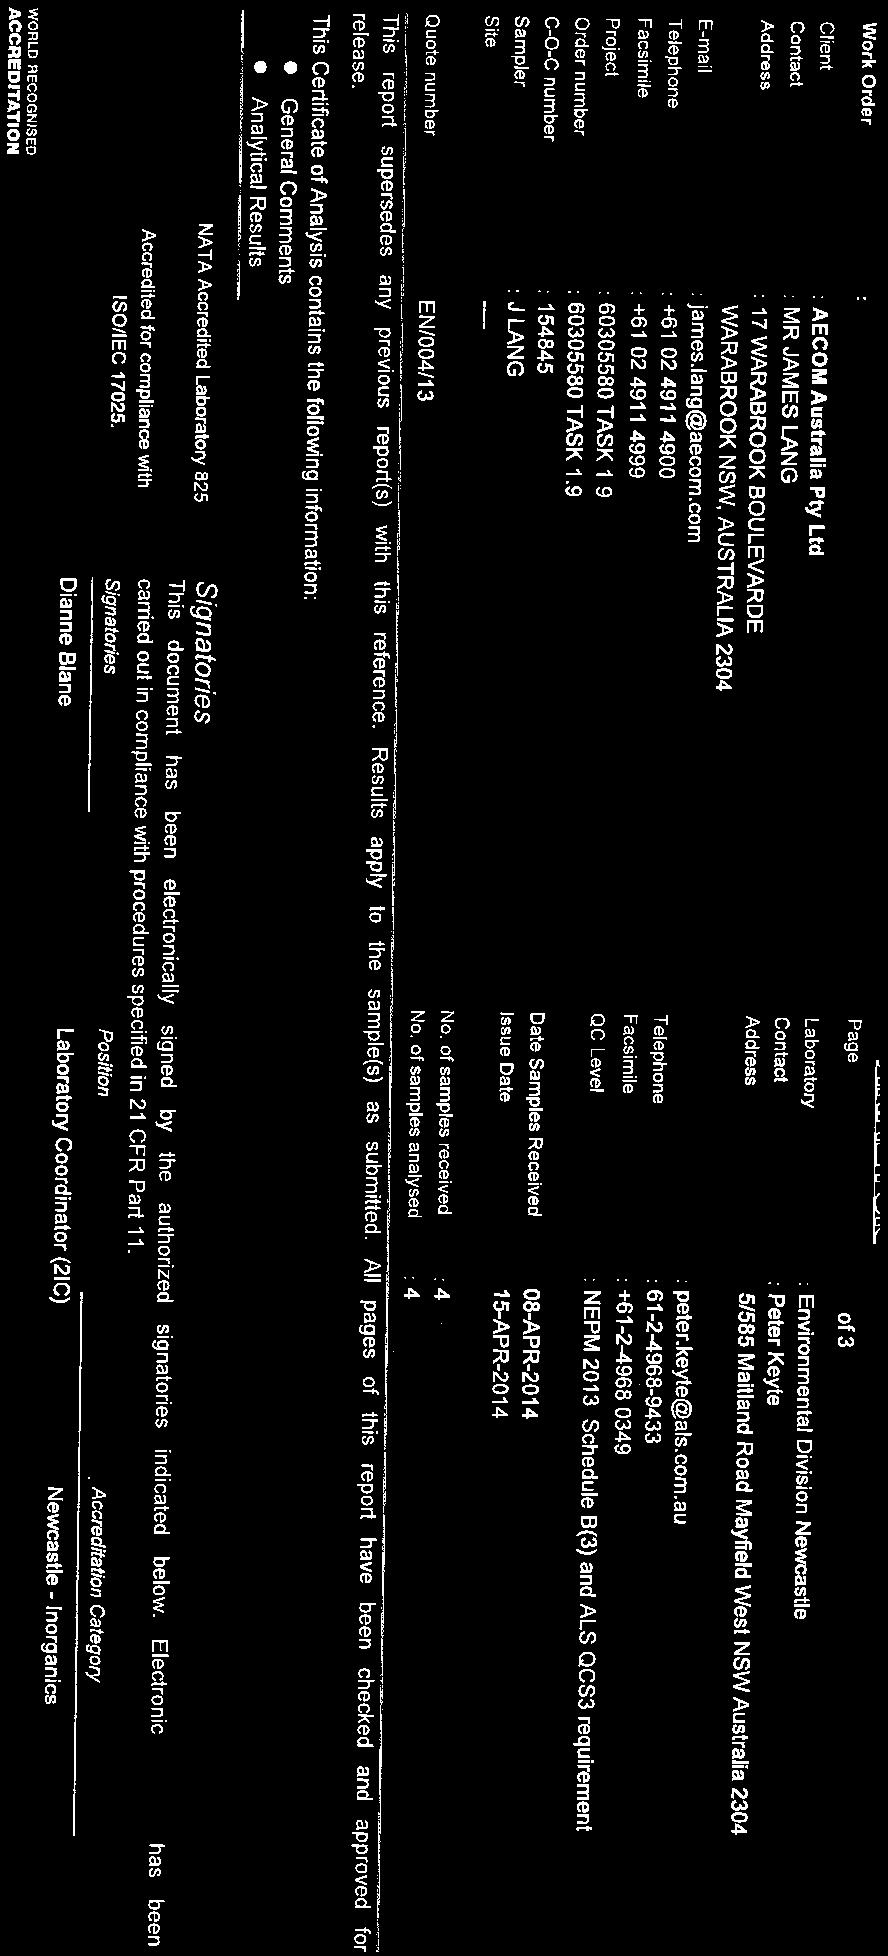
7 AECOM Emissions Testing Report National Ceramic Industries Australia Commercial-in-Confidence Introduction AECOM was appointed by National Ceramic Industries Australia Pty Limited (NCIA) to conduct annual air emission measurements at their facility located at Racecourse Road, Rutherford NSW. Emission testing was performed for the assessment of compliance with requirements of the facility s Environment Protection Licence (EPL 11956). Emission sources assessed during the testing period where EPL points 1 (Clay Prep), 2 (Pressing and Drying), 5 (Dryer 1), 6 (Dryer 2), 9 (Glaze Line), 10 (Selection Line), 12 (Spray Dryer), 14 (Kiln 1), 15 (Kiln 2) 18 (Hot Air Cooler 1) and 19 (Hot Air Cooler 2). Assessment of the following emission parameters associated with each source was performed during October - November 2013 and January - April 2014: - Velocity; - Volumetric Flow rate; - Moisture Content; - Carbon Monoxide, Carbon Dioxide and Oxygen (for determination of Dry Gas Density); - Total Particulate Matter; and - Fine Particulate (PM 10). Concentrations of the following air contaminants were also assessed on Kiln 1 & Kiln 2 stack emissions: - Total Fluoride; - Sulfur Dioxide (SO 2 as SO 3) and Sulfuric Acid Mist (H 2SO 4 as SO 3); - Hazardous Substances; and - Oxides of Nitrogen (NO, NO 2, NO x and Equivalent NO 2). Laboratory analysis was conducted by the following laboratories, which hold NATA accreditation for the specified tests: - Steel River Testing Pty. Ltd., NATA accreditation number 18079, performed the following analysis detailed in report number P, M, P, M & M: Total Particulate; Fine Particulate (PM 10); and Moisture - Australian Laboratory Services (ALS), laboratory NATA accreditation number 825, performed the following analysis detailed in reports numbered EN & EN : Total Fluoride; Sulfuric Acid Mist (H 2SO 4 as SO 3); and Sulfur Dioxide (SO 2 as SO 3). - Leeder Consulting, NATA accreditation number 14429, performed the following analysis detailed in report numbers M140192: Hazardous Substances (Metals). Reports/1.9 Stack Testing 2013/NCIA Emissions Testing Report 2013_2014.docx Revision May-2014 Prepared for National Ceramic Industries Australia ABN:
8 AECOM Emissions Testing Report National Ceramic Industries Australia Commercial-in-Confidence 2 This page has been left blank intentionally. Reports/1.9 Stack Testing 2013/NCIA Emissions Testing Report 2013_2014.docx Revision May-2014 Prepared for National Ceramic Industries Australia ABN:
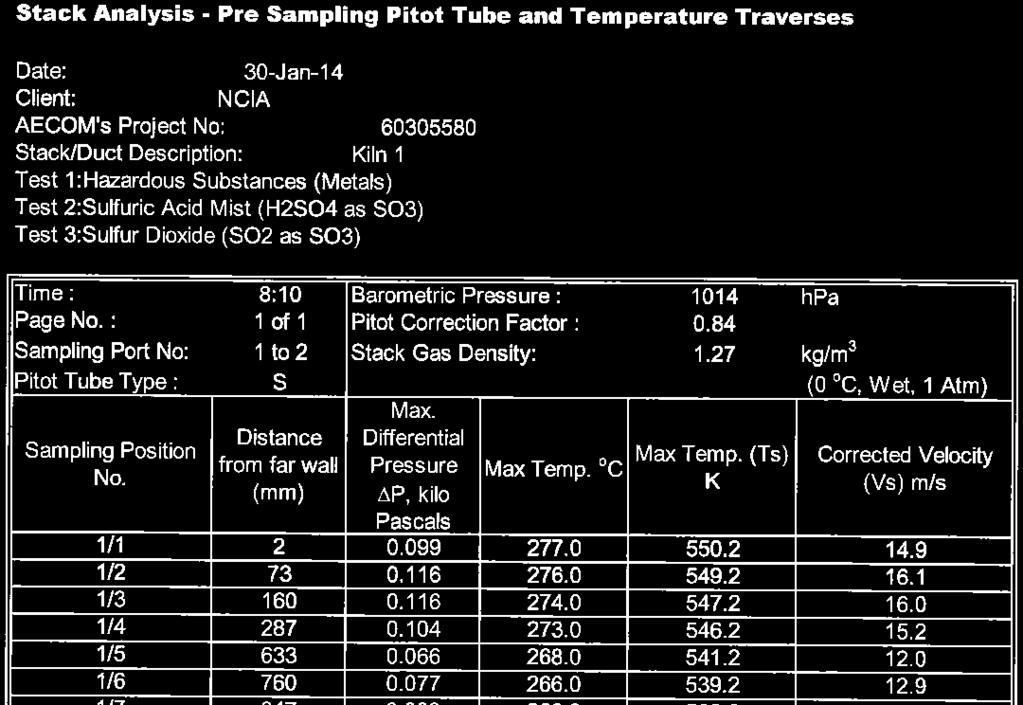
9 AECOM Emissions Testing Report National Ceramic Industries Australia Commercial-in-Confidence Sampling Plane Requirements The criteria for sampling planes are specified in AS Table 1 Criteria for Selection of Sampling Planes (AS ) Type of flow disturbance Bend, connection, junction, direction change Louvre, butterfly damper (partially closed or closed) Minimum distance upstream from disturbance, diameters (D) Minimum distance downstream from disturbance, diameters (D) >2D >6D >3D >6D Axial fan >3D >8D (see Note) Centrifugal fan >3D >6D NOTE: The plane should be selected as far as practicable from a fan. Flow straighteners may be required to ensure the position chosen meets the check criteria listed in Items (a) to (f) below. a) The gas flow is basically in the same direction at all points along each sampling traverse; b) The gas velocity at all sampling points is greater than 3 m/s; c) The gas flow profile at the sampling plane shall be steady, evenly distributed and not have a cyclonic component which exceeds an angle of 15 o to the duct axis, when measured near the periphery of a circular sampling plane; d) The temperature difference between adjacent points of the survey along each sampling traverse is less than 10% of the absolute temperature, and the temperature at any point differs by less than 10% from the mean; e) The ratio of the highest to lowest pitot pressure difference shall not exceed 9:1 and the ratio of highest to lowest gas velocities shall not exceed 3:1. For isokinetic testing with the use of impingers, the gas velocity ratio across the sampling plane should not exceed 1.6:1; and f) The gas temperature at the sampling plane should preferably be above the dewpoint. The following stacks did not meet the above criteria in regards to distances from disturbances; as a result extra sampling points were added in accordance with AS section 4.2: - Kiln 1 & 2; - Pressing and Drying; - Glaze Line; - Selection Line; - Spray Dryer; and - Hot Air Coolers 1 & 2. All other points sampled comply with the above criteria. Reports/1.9 Stack Testing 2013/NCIA Emissions Testing Report 2013_2014.docx Revision May-2014 Prepared for National Ceramic Industries Australia ABN:
10 AECOM Emissions Testing Report National Ceramic Industries Australia Commercial-in-Confidence 4 This page has been left blank intentionally. Reports/1.9 Stack Testing 2013/NCIA Emissions Testing Report 2013_2014.docx Revision May-2014 Prepared for National Ceramic Industries Australia ABN:
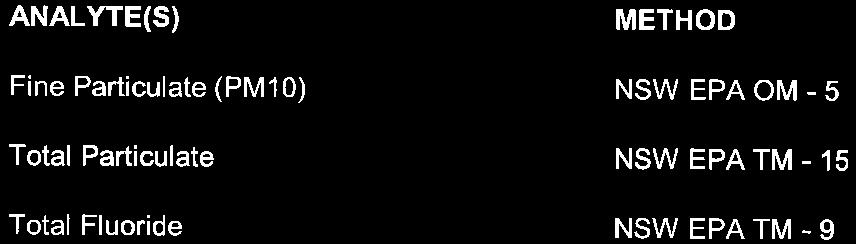
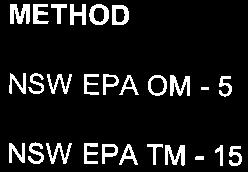
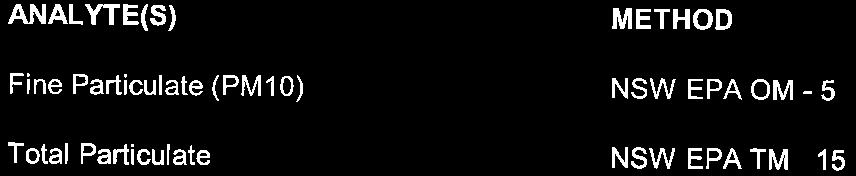
11 AECOM Emissions Testing Report National Ceramic Industries Australia Commercial-in-Confidence Methodology 3.1 NATA Accredited Methods The following methods are within the scope of our National Association of Testing Authorities (NATA) accreditation. Accreditation Number 2778 (14391) and are approved for the sampling and analysis of gases. Specific details of the methods are available on request. All sampling and analysis is conducted according to the methods in Table 2. Table 2 AECOM NATA Endorsed Methods NSW EPA Approved Methods AS (NSW EPA TM-1) AS (NSW EPA TM-15) NSW EPA TM-2 NSW EPA TM-3 NSW EPA TM-4 NSW EPA TM-9 NSW EPA TM-11 NSW EPA TM-12 USEPA Methods USEPA (2000) Method 1 USEPA (2000) Method 5 under approved circumstances USEPA (2000) Method 2 or 2C or USEPA (1999) Method 2F or 2G or 2H (as appropriate) USEPA (2000) Method 8 (for sampling and analysis only if interference from fluorides, free ammonia and/or dimethyl aniline has been demonstrated to the satisfaction of the chief Scientist, EPA) (as appropriate) USEPA (2000) Method 6 or 6A or 6B or USEPA (1996) Method 6C or ISO (1989) Method 7934 or ISO (1992) Method 7935 or ISO (1993) Method or ISO (1998) Method (as appropriate) USEPA (2000) Method 13A or 13B (as appropriate) USEPA (2000) Method 7 or 7A or 7B or 7C or 7D or USEPA (1990) Method 7E or USEPA (1996) Method 20 or ISO (1993) Method (as appropriate). NOx analysers may be substituted in Method 7E provided the performance Specifications of the method are met. Both NO and NOxmust be directly measured. USEPA (2000) Method 29 or USEPA (2000) Method 102 (for mercury only in hydrogen rich streams) (as appropriate) Method Title Selection of sampling positions Determination of total particulate matter isokinetic manual sampling gravimetric method Determination of stack gas velocity and volumetric flow rate (type s pitot tube) Determination of sulfuric acid mist emissions from stationary sources Determination of Sulfur Dioxide (SO 2) emissions from stationary sources Determination of total fluoride emissions from stationary sources Nitrogen dioxide (NO2) or nitric oxide (NO) Type 1 substances (elements antimony (Sb), arsenic (As), cadmium (Cd), lead (Pb) or mercury (Hg) or any compound containing one or more of those elements) Reports/1.9 Stack Testing 2013/NCIA Emissions Testing Report 2013_2014.docx Revision May-2014 Prepared for National Ceramic Industries Australia ABN:
12 AECOM Emissions Testing Report National Ceramic Industries Australia Commercial-in-Confidence 6 Table 2 Continued AECOM NATA Endorsed Methods NSW EPA Approved Methods NSW EPA TM-13 USEPA Methods USEPA (2000) Method 29 (Analysis for tin and vanadium to be done by Inductively Coupled Argon Plasma Emission Spectroscopy (ICAP) as defined in USEPA Method 29) or USEPA (1986) Method 7910 (for vanadium only) or USEPA (1986) Method 7911 (for vanadium only) (as appropriate) Method Title Type 2 substances (elements beryllium (Be), chromium (Cr), cobalt (Co), manganese (Mn), nickel (Ni), selenium (Se), tin (Sn) or vanadium (V) or any compound containing one or more of those elements) NSW EPA TM-14 USEPA (2000) Method 29 NSW EPA TM-22 USEPA (2000) Method 4 NSW EPA TM-23 USEPA (2000) Method 3 NSW EPA OM-5 USEPA (1997) Method 201 or 201A (as appropriate) Cadmium (Cd) or mercury (Hg) or any compound containing one or more of those elements Determination of moisture content in stack gases Gas analysis for the determination of dry molecular weight Determination of PM 10 emissions Reports/1.9 Stack Testing 2013/NCIA Emissions Testing Report 2013_2014.docx Revision May-2014 Prepared for National Ceramic Industries Australia ABN:
13 AECOM Emissions Testing Report National Ceramic Industries Australia Commercial-in-Confidence Sampling Location Table 3 provides a summary of the locations sampled by AECOM at the National Ceramic Industries Australia Rutherford Site during October - November 2013 and January - April Table 3 Sampling Location Summary Discharge Description Clay Preparation (CP1) (EPL 1) Pressing and Drying (PD1) (EPL2) Dryer (D1) (EPL5) Dryer (D2) (EPL6) Glaze Line (EPL9) Duct Shape Circular Circular Circular Circular Circular Construction Material Metal Metal Metal Metal Metal Duct Dimensions (mm) Minimum No. Sampling Points Sampling Ports Min. Points/Traverse Disturbance No Yes No No Yes Distance from Upstream Disturbance Type of Disturbance Junction Junction Fan Fan Junction Distance from Downstream Disturbance 1 Type of Disturbance Stack Exit Stack Exit Stack Exit Stack Exit Stack Exit Ideal Sampling Location Yes No Yes Yes No Correction Factors Applied Total No. Points Sampled No Yes No No Yes Points/Traverse Sampling Performed to Standard 2 Yes3 Yes 4 Yes 3 Yes 3 Yes 4 Notes Expressed in equivalent stack diameters AS (1995) Stationary source emissions Method 1 Selection of sampling positions AS (1995) Section AS (1995) Section Reports/1.9 Stack Testing 2013/NCIA Emissions Testing Report 2013_2014.docx Revision May-2014 Prepared for National Ceramic Industries Australia ABN:
14 AECOM Emissions Testing Report National Ceramic Industries Australia Commercial-in-Confidence 8 Emission Source Sampling Location Summary (continued) Discharge Description Selection Line (SL1,2,3,4) (EPL10) Spray Dryer (SD1) (EPL12) Kiln (KP1) (EPL14) 5 Kiln (KP2) (EPL15) 5 Hot Air Cooler (HAC1) (EPL18) Hot Air Cooler (HAC2) (EPL19) Duct Shape Circular Circular Circular Circular Circular Circular Construction Material Duct Dimensions (mm) Minimum No. Sampling Points Metal Metal Metal Metal Metal Metal Sampling Ports Min. Points/Traverse Disturbance Yes Yes Yes Yes Yes Yes Distance from Upstream Disturbance 1 Type of Disturbance Fan Bend Change in Diameter Change in Diameter Distance from Downstream Disturbance 1 Type of Disturbance Ideal Sampling Location Correction Factors Applied Total No. Points Sampled Bend Stack Exit Stack Exit Bend Bend Stack Exit Stack Exit No No No No No No Yes Yes Yes Yes Yes Yes Points/Traverse Sampling Performed to Yes 4 Yes 4 Yes 4 Yes 4 Yes 4 Yes 4 Standard 2 Notes Expressed in equivalent stack diameters AS (1995) Stationary source emissions Method 1 Selection of sampling positions AS (1995) Section AS (1995) Section Sampling occurred prior to the baghouse as per client request Fan Reports/1.9 Stack Testing 2013/NCIA Emissions Testing Report 2013_2014.docx Revision May-2014 Prepared for National Ceramic Industries Australia ABN:
15 AECOM Emissions Testing Report National Ceramic Industries Australia Commercial-in-Confidence Equipment Calibration AECOM has a calibration schedule to ensure the emission testing equipment is maintained in good order and with known calibration. Equipment used in this project was calibrated according to the procedures and frequency identified in the AECOM Calibration Schedule. Details of the schedule and the calibration calculations are available on request. Reports/1.9 Stack Testing 2013/NCIA Emissions Testing Report 2013_2014.docx Revision May-2014 Prepared for National Ceramic Industries Australia ABN:
16 AECOM Emissions Testing Report National Ceramic Industries Australia Commercial-in-Confidence 10 This page has been left blank intentionally. Reports/1.9 Stack Testing 2013/NCIA Emissions Testing Report 2013_2014.docx Revision May-2014 Prepared for National Ceramic Industries Australia ABN:
17 AECOM Emissions Testing Report National Ceramic Industries Australia Commercial-in-Confidence Results A summary of results obtained from stack emissions testing performed during October - November 2013 and January April 2014, are provided in Tables 4-6. Emission data particular to each emission source investigated is presented in Tables Element Hazardous Substances (metals) results are presented in Table 22 and 23. All emission concentrations are converted to standard conditions of 0 o C, dry gas and 1 atmosphere pressure for comparison with appropriate regulatory limits. For comparison with EPL requirements Oxides of Nitrogen, Total Particulate and Fine Particulate (PM 10) emission concentrations determined within the Kiln stacks exhausts have been corrected to 18% O 2 based on the measured oxygen content within the sampling plane during the testing period. AECOM has a calculated limit of uncertainty in regards to results. The estimation of measurement uncertainty in source testing is conducted to provide an indication of the precision of the measurement result and a degree of confidence in the range of values the reported result may represent. The measurement of uncertainty has been calculated at ±13.6%. Field sheets and final calculations can be referred to in Appendix A. Raw and Calculated Oxides of Nitrogen data is attached in Appendix B. Analytical laboratory result certificates are provided in Appendix C. Table 4 Summary Particulate Emission Monitoring Results, October and November 2013 Stack Fine Particulate (PM 10) (mg/m 3 ) Total Particulate (mg/m 3 ) Regulatory Limit (mg/m 3 )* Clay Preparation (CP1) (EPL 1) Pressing and Drying (PD1) (EPL 2) Dryer (D1) (EPL 5) Dryer (D2) (EPL 6) Glaze Line (EPL 9) < Selection Line (SL 1,2,3,4) (EPL 10) Spray Dryer (SD1) (EPL 10) Hot Air Cooler (HAC 1) (EPL 18) Hot Air Cooler (HAC 2) (EPL 19) *Note:- Regulatory limit only applies to Total Particulate. Table 5 Kiln 1 and Kiln 2 Emission Monitoring Results Summary, January & April 2014 Pollutant Kiln 1 (EPL 14) Kiln 2 (EPL 15) Regulatory Limit Fine Particulate (at 18% O 2) (PM 10) (mg/m 3 ) 2 13 N/A Total Particulate (at 18% O 2) (mg/m 3 ) Total Fluoride (as HF) (mg/m 3 ) Sulfuric Acid Mist (H 2SO 4 as SO 3) (mg/m 3 ) < Sulfur Dioxide (SO 2 as SO 3) (mg/m 3 ) NA Total Hazardous Substances (Metals) (mg/m 3 ) Cadmium (mg/m 3 ) Mercury (mg/m 3 ) < Reports/1.9 Stack Testing 2013/NCIA Emissions Testing Report 2013_2014.docx Revision May-2014 Prepared for National Ceramic Industries Australia ABN:
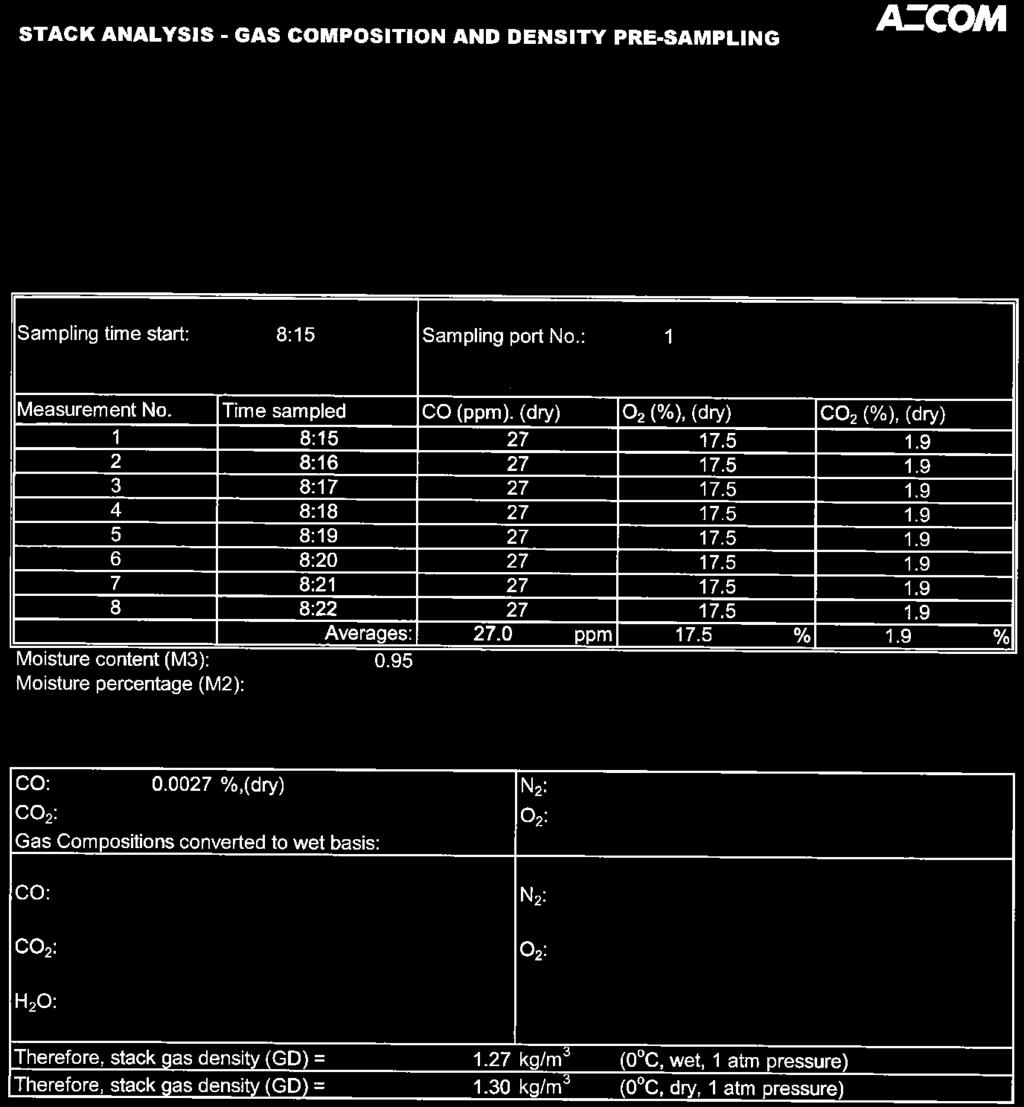
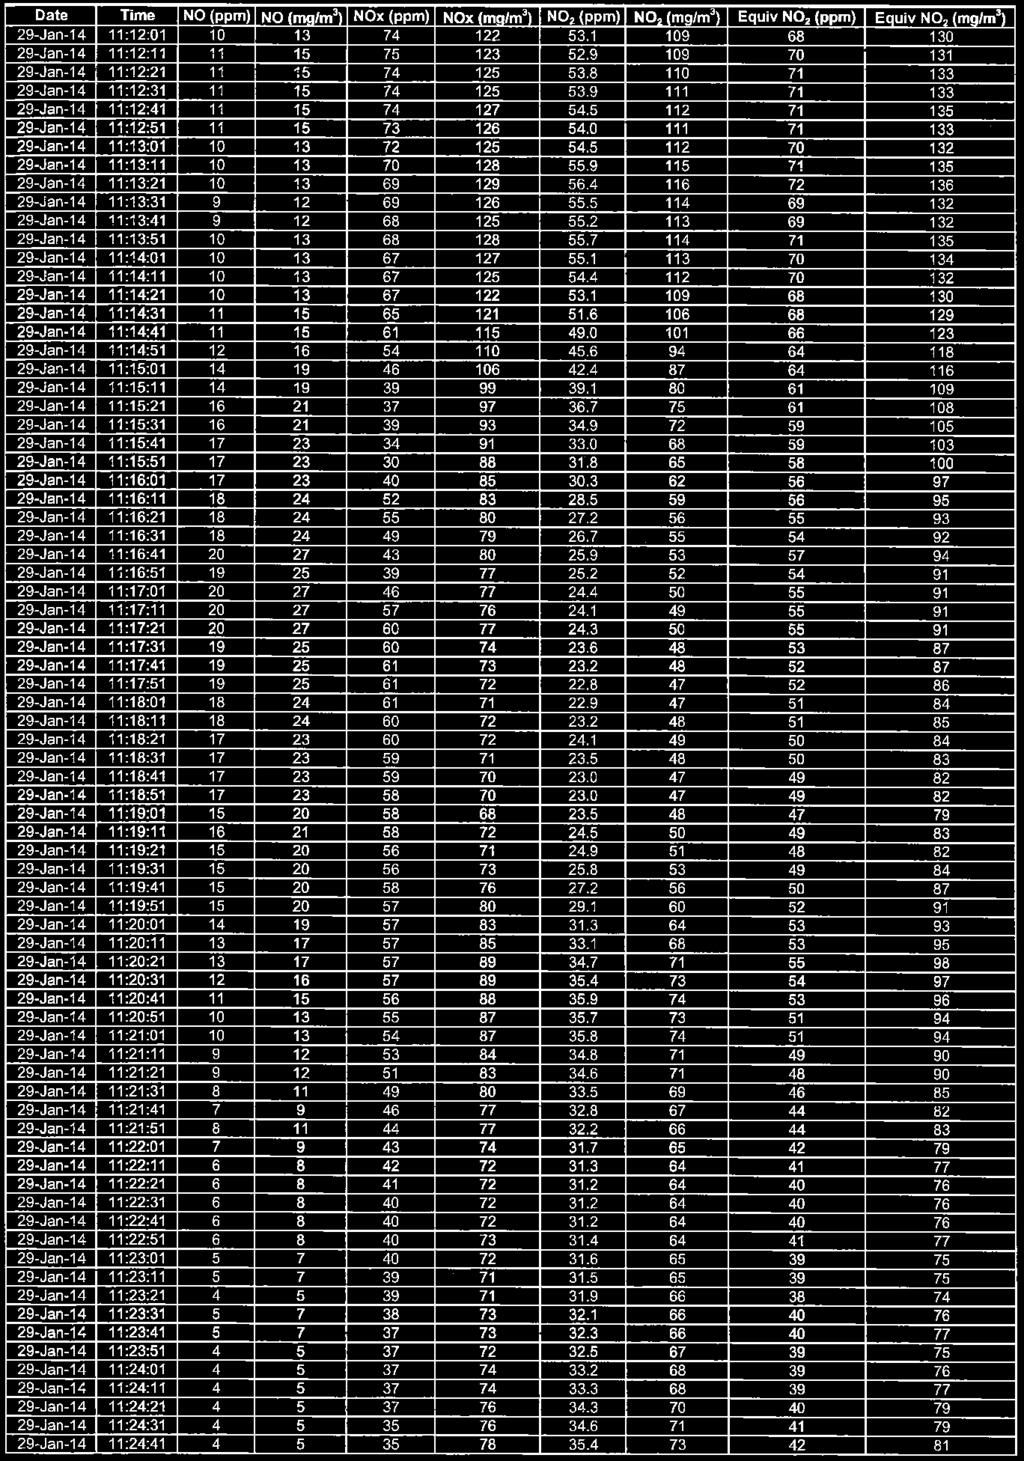
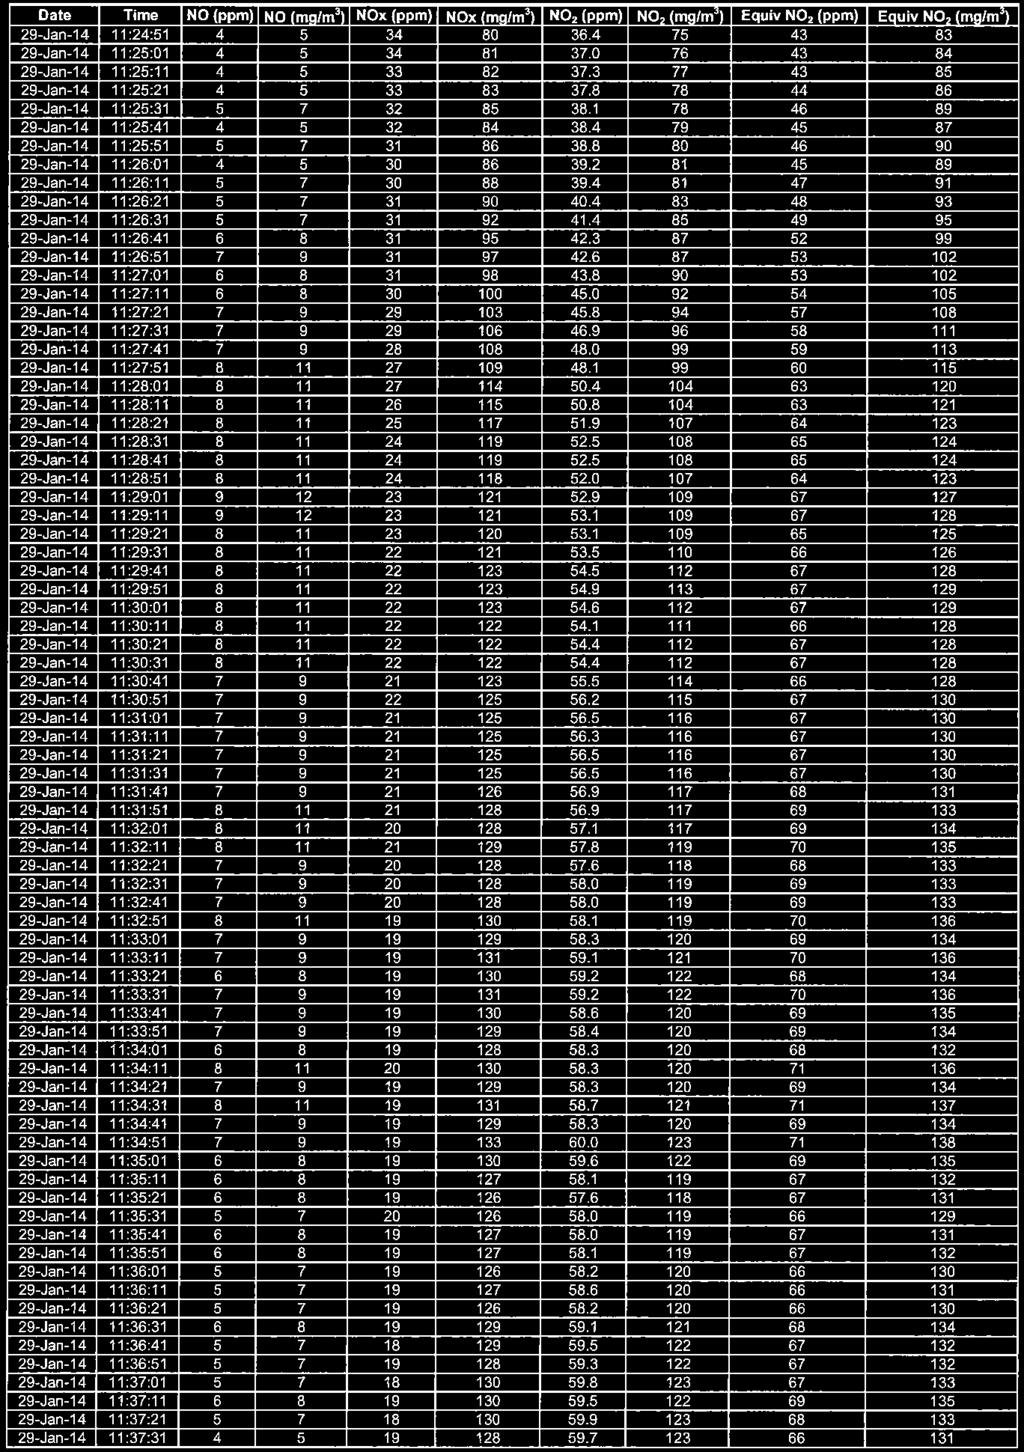
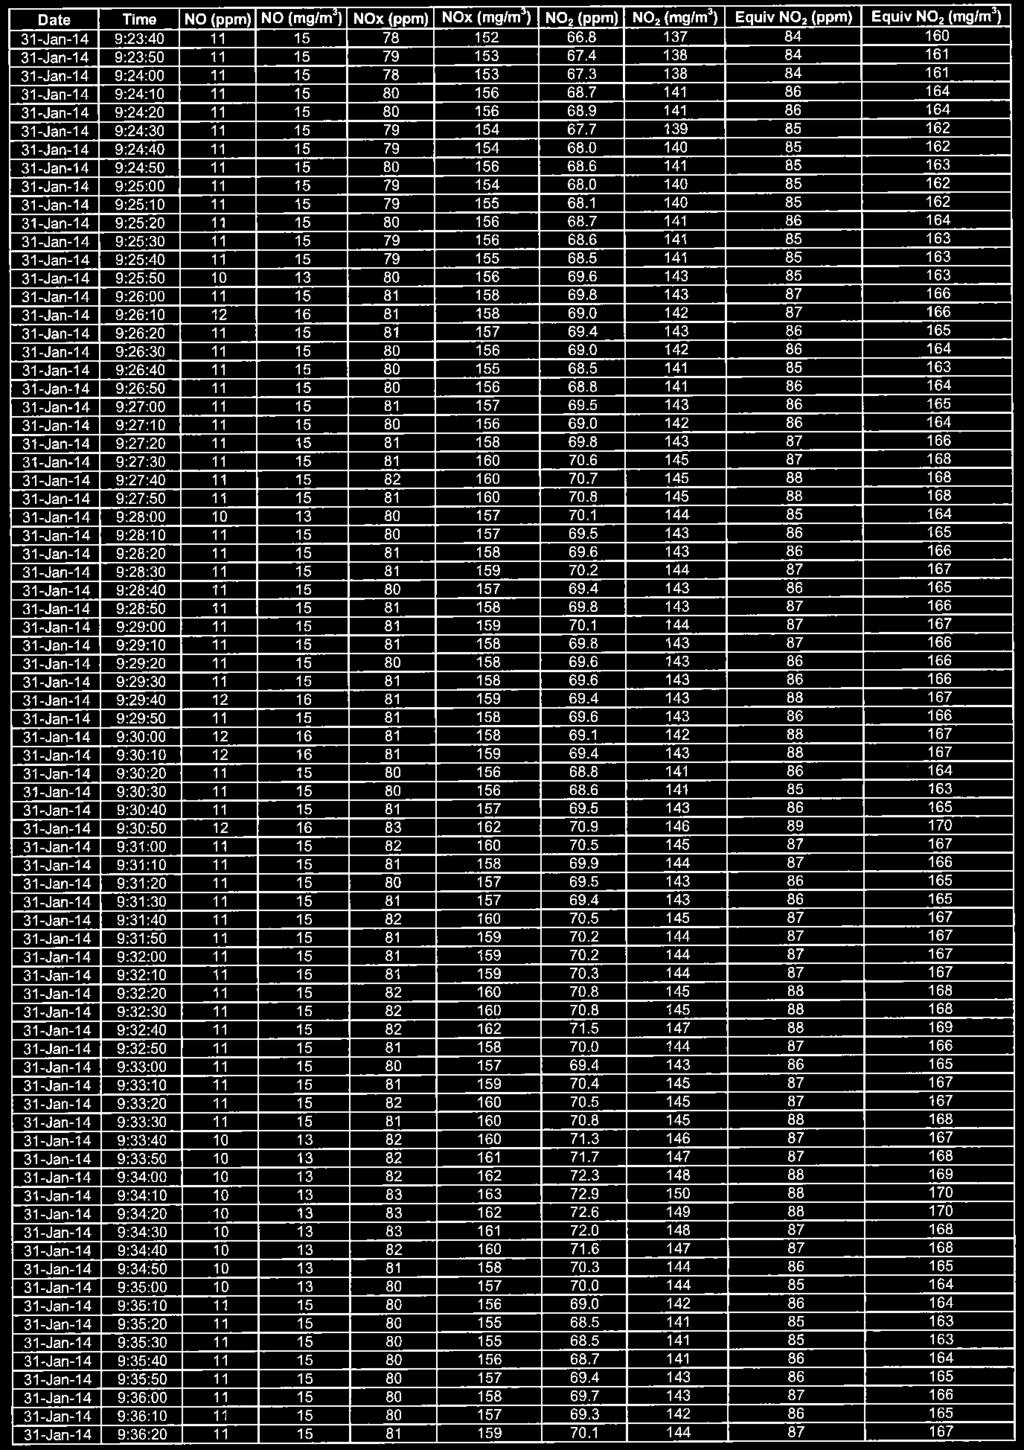
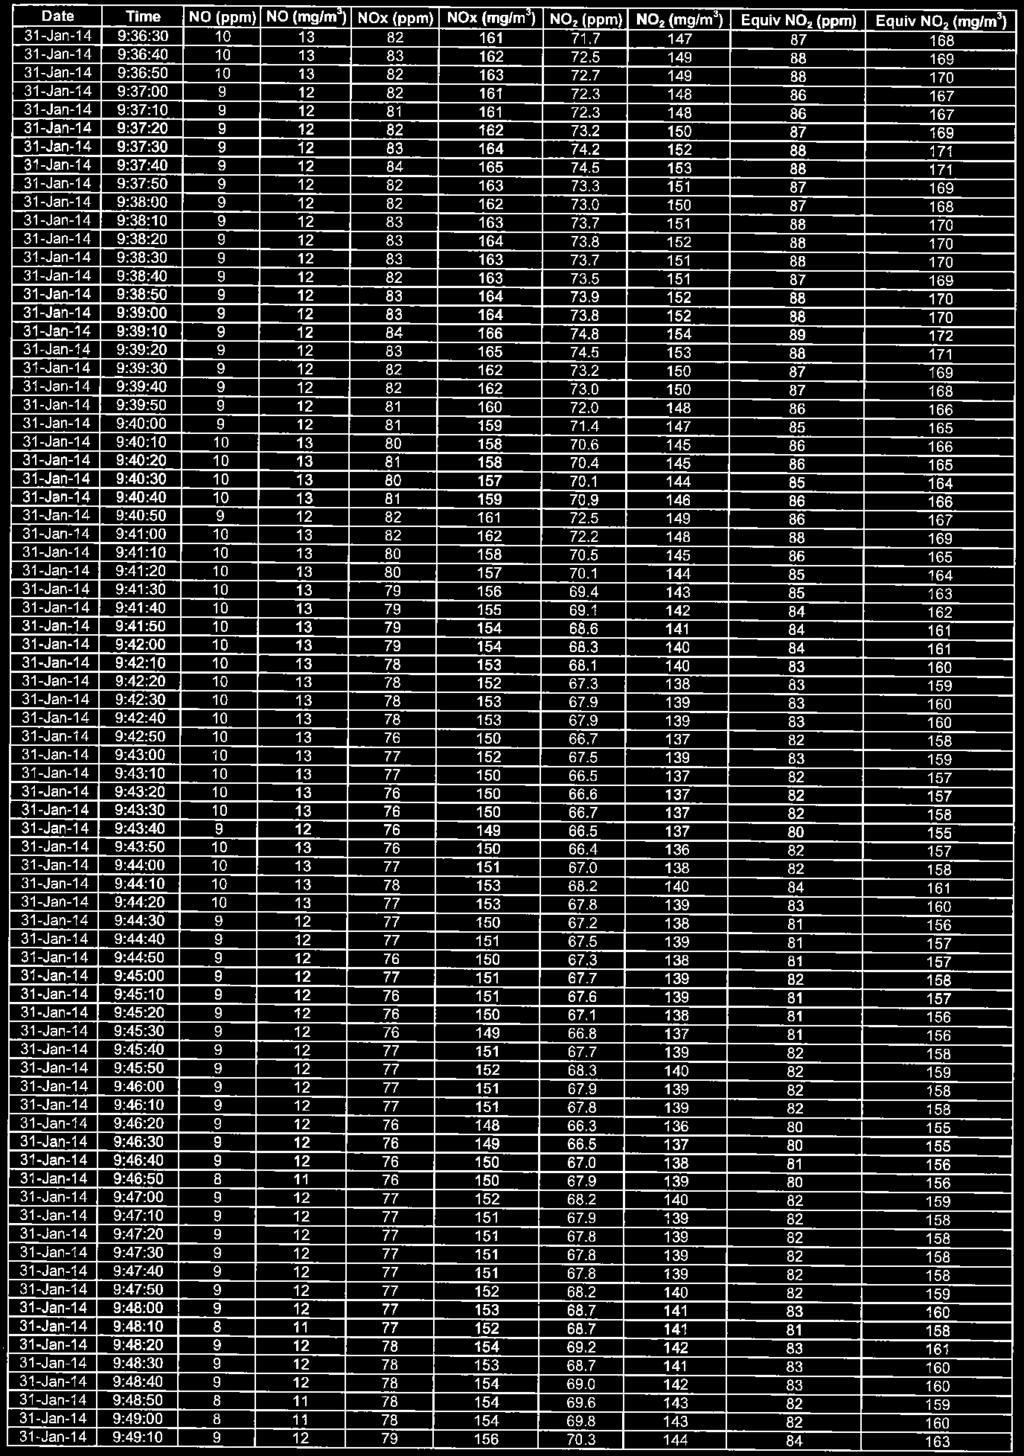
18 AECOM Emissions Testing Report National Ceramic Industries Australia Commercial-in-Confidence 12 Table 6 Kiln 1 and 2 Gaseous Data Results, January 2014 Pollutant Kiln 1 (EPL 14) Kiln 2 (EPL 15) Regulatory Limit Date Sampled 29/01/ /01/ Time Sampled 10:46:21 11:46:21 9:10:50 10:10:50 - Stack Gas Flowrate (m 3 /s) (0 0 C, dry gas, 1atm pressure) Total Oxides of Nitrogen (as Equivalent NO 2) (mg/m 3 ) at 18% O Total Oxides of Nitrogen (as Equivalent NO 2) (mg/s) at 18% O NA Nitrogen Oxide (NO) (mg/m 3 ) at 18% O NA Nitrogen Oxide (NO) (mg/s) at 18% O NA Nitrogen Dioxide (NO2) (mg/m 3 ) at 18% O NA Nitrogen Dioxide (NO2) (mg/s) at 18% O NA Total Oxides of Nitrogen (NOx) (mg/m 3 ) at 18% O NA Total Oxides of Nitrogen (NOx) (mg/s) at 18% O NA Oxygen (O 2) % NA Reports/1.9 Stack Testing 2013/NCIA Emissions Testing Report 2013_2014.docx Revision May-2014 Prepared for National Ceramic Industries Australia ABN:
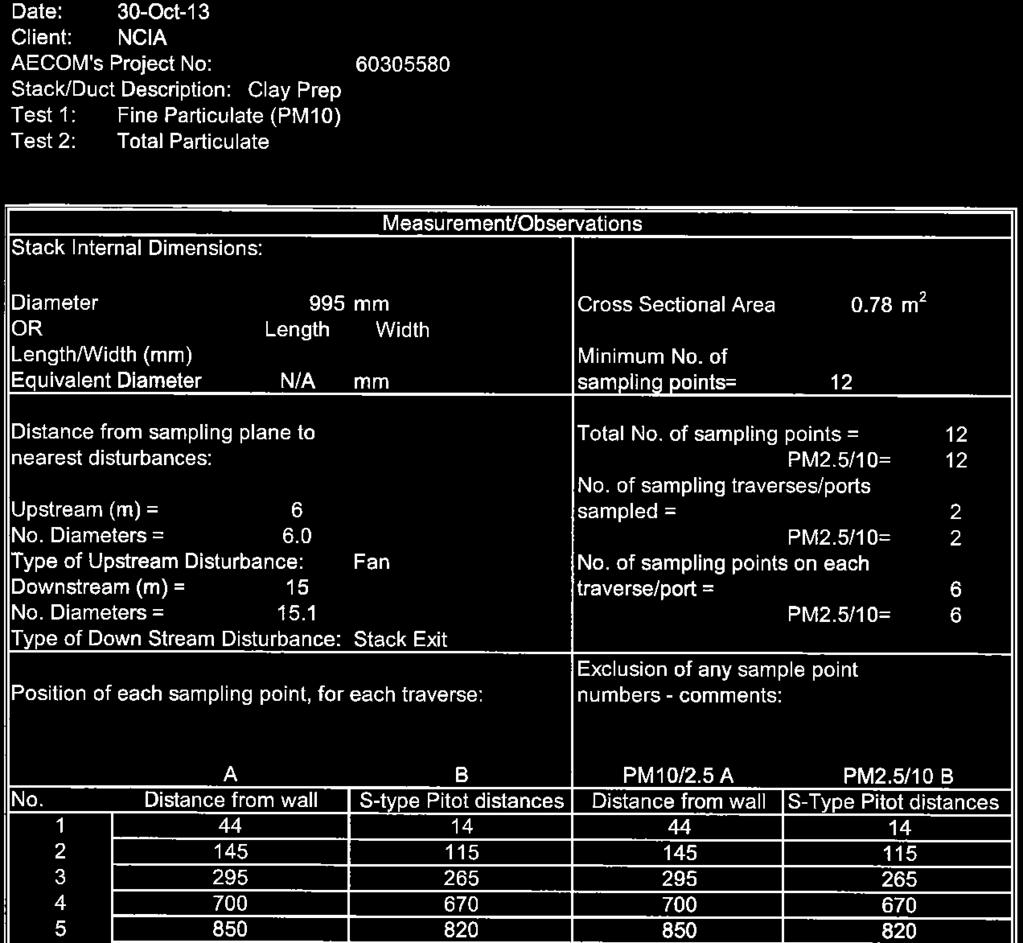
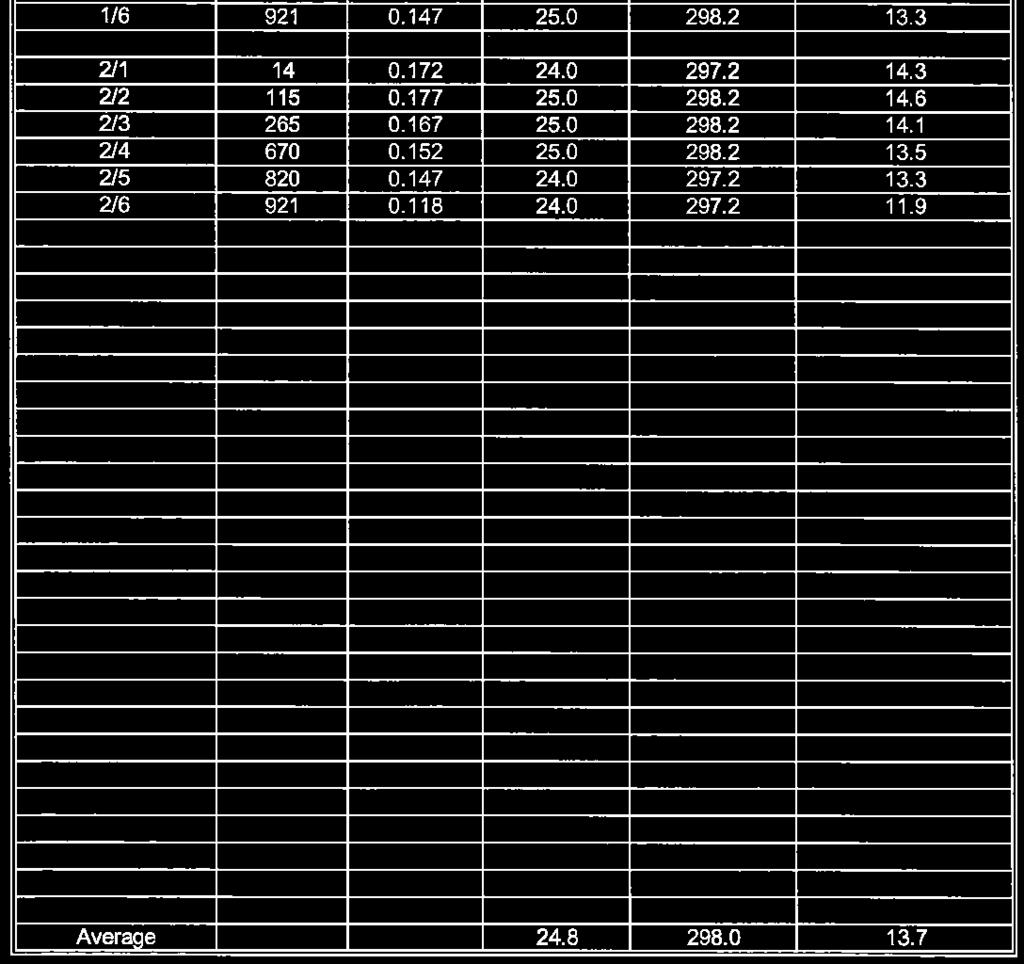
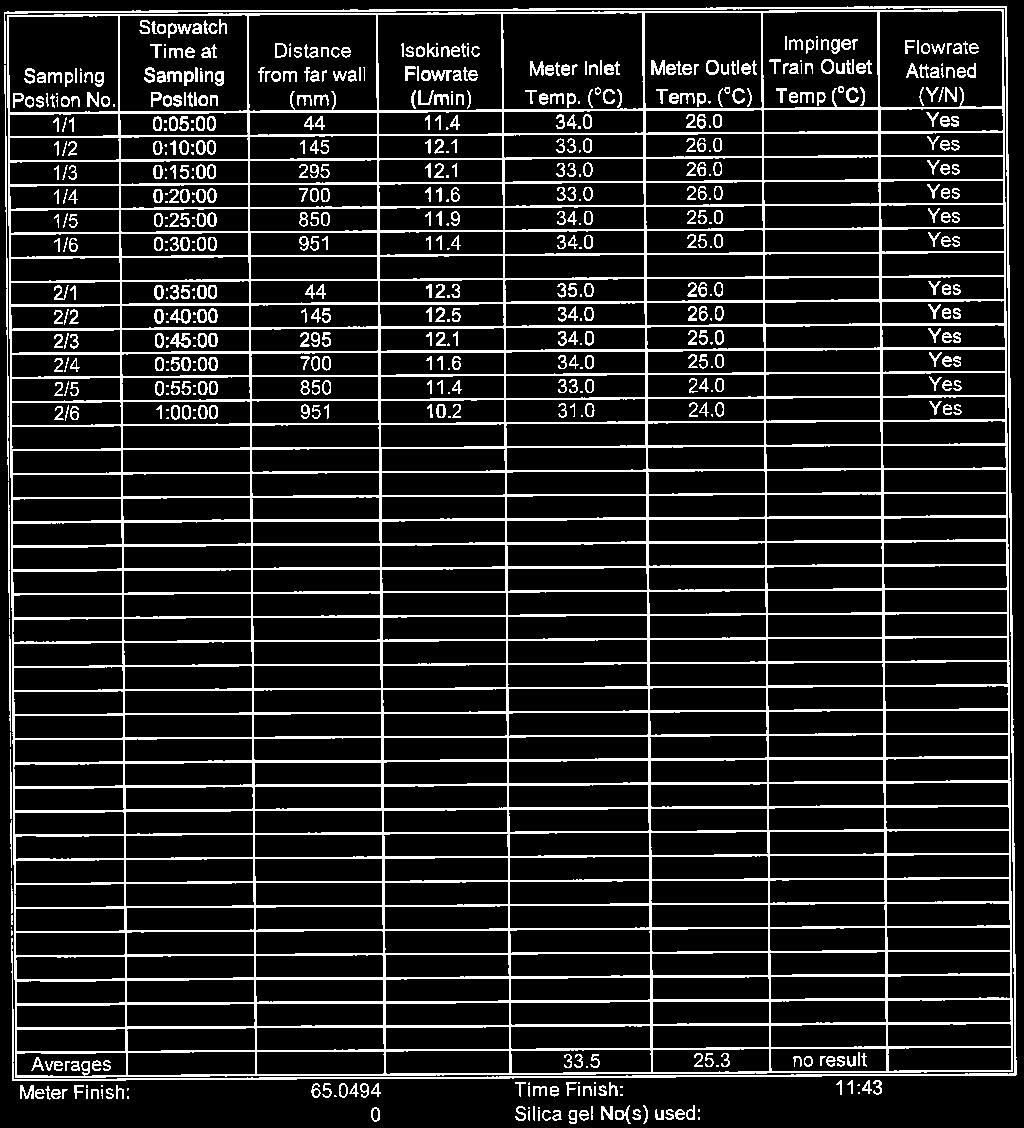
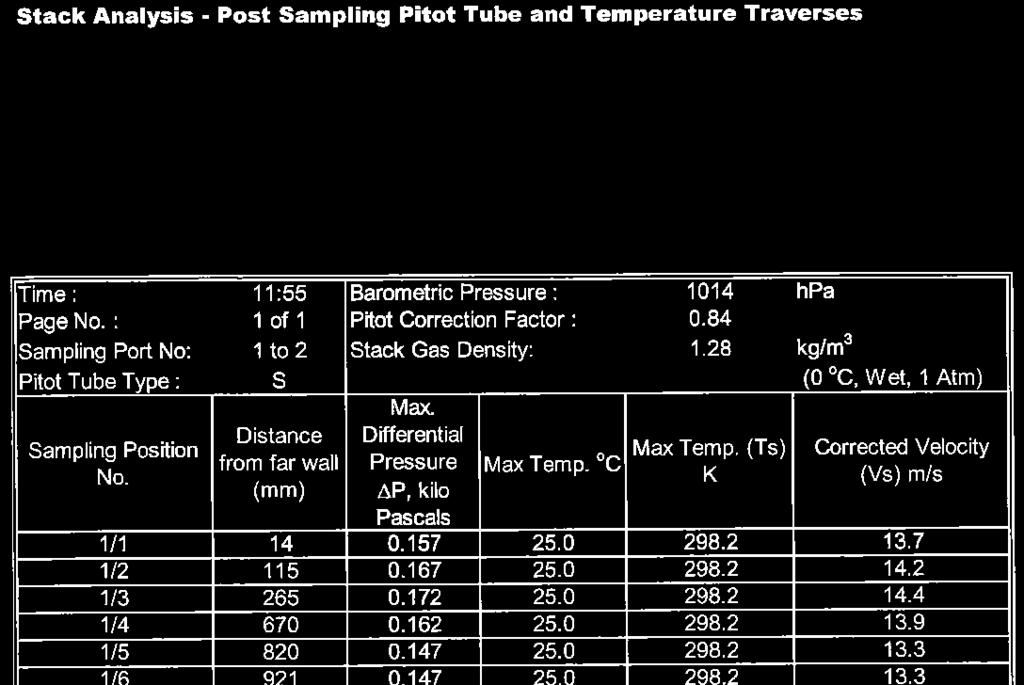
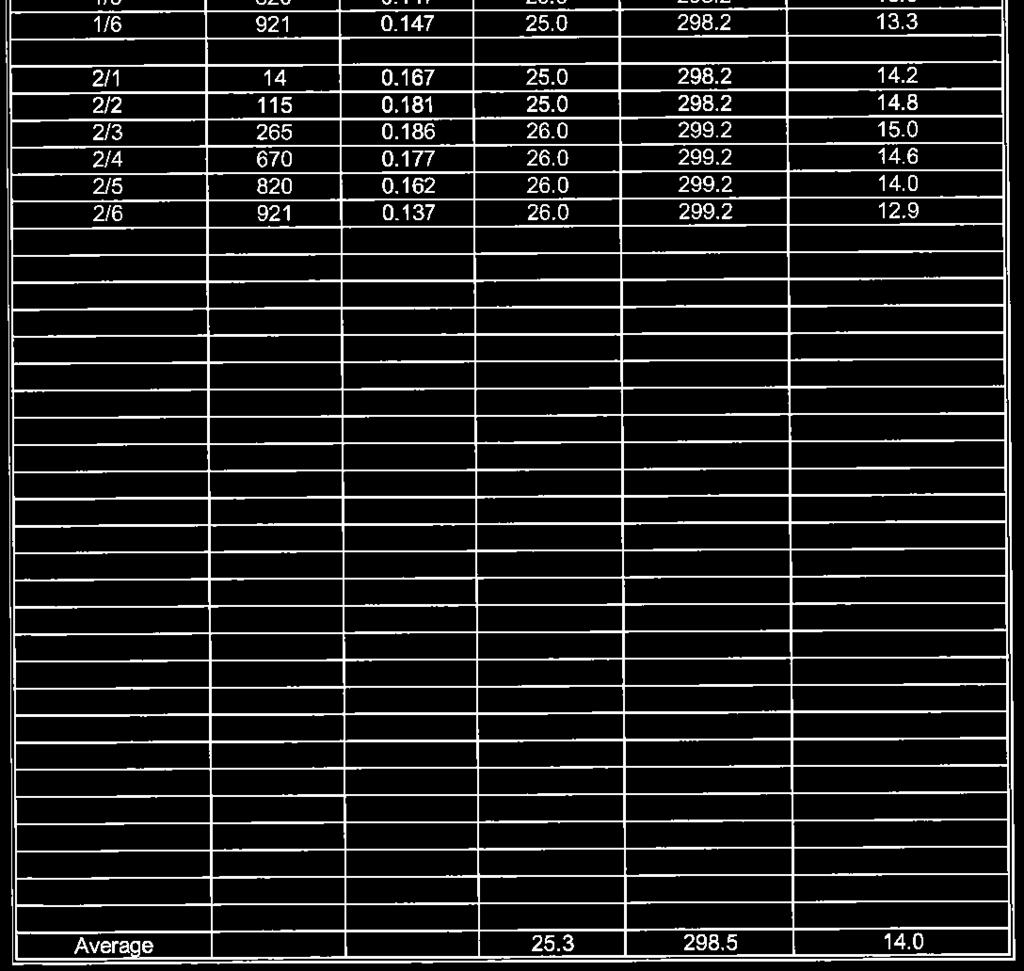
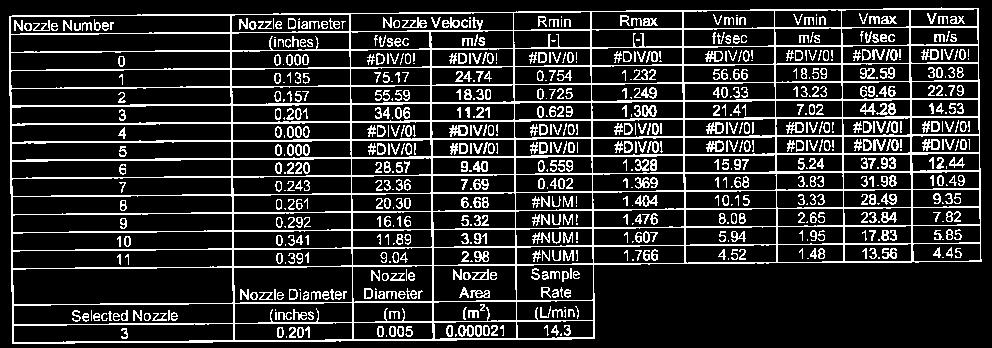
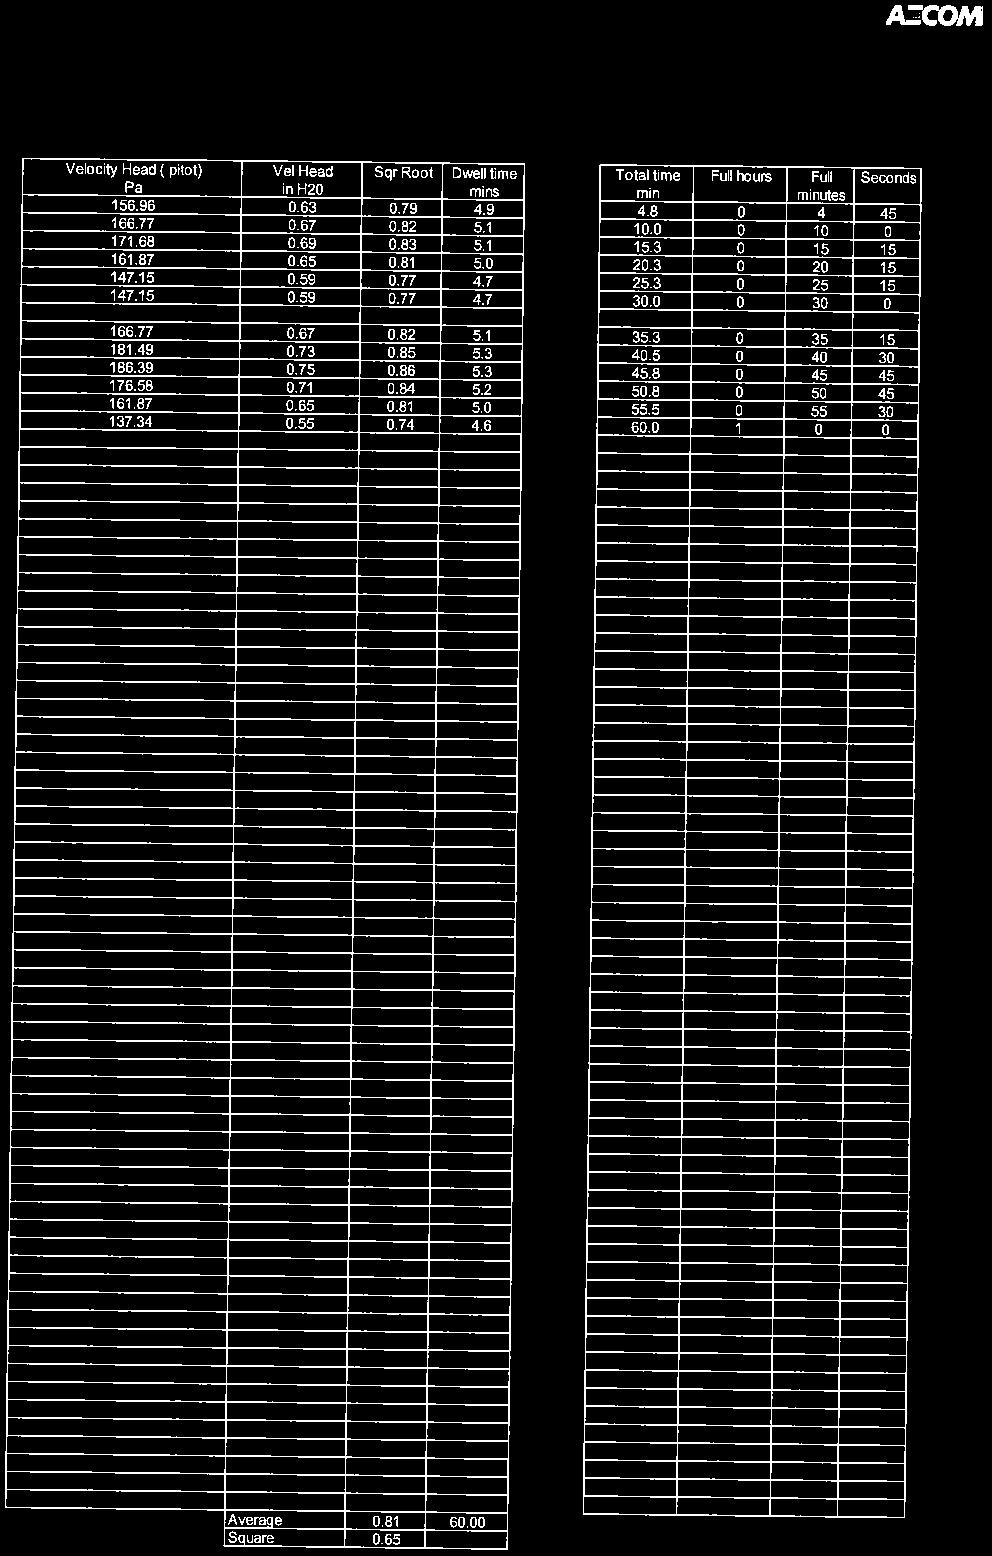
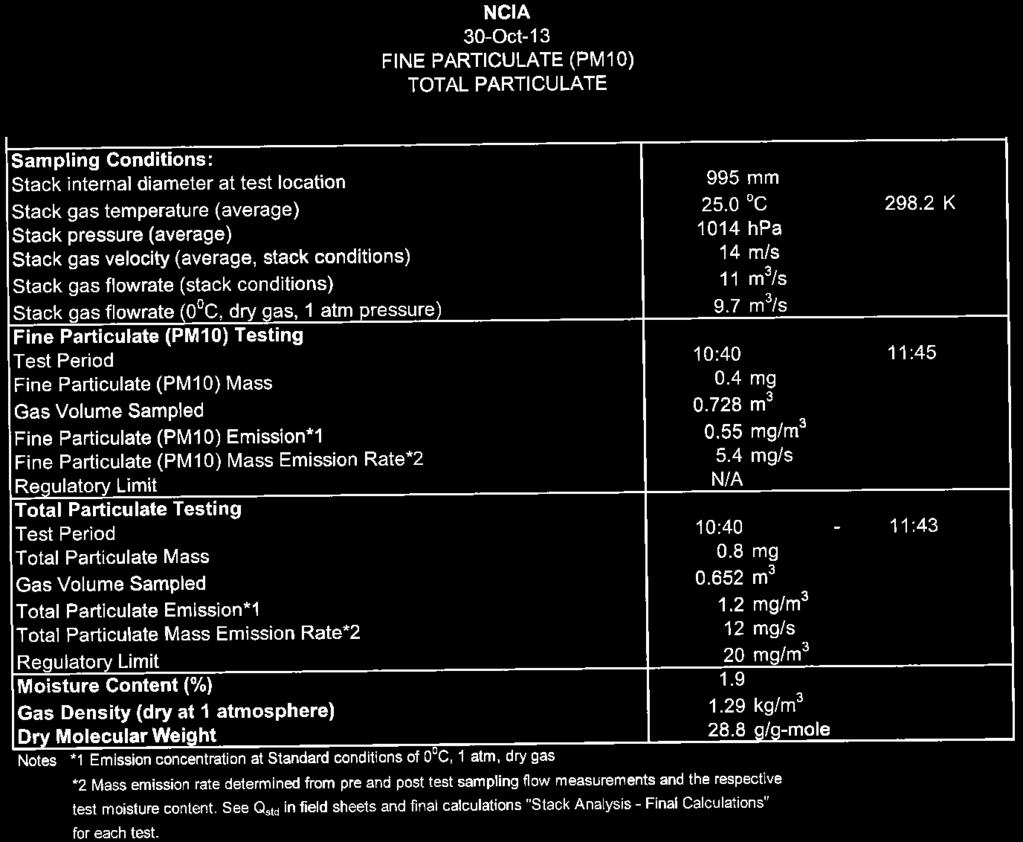
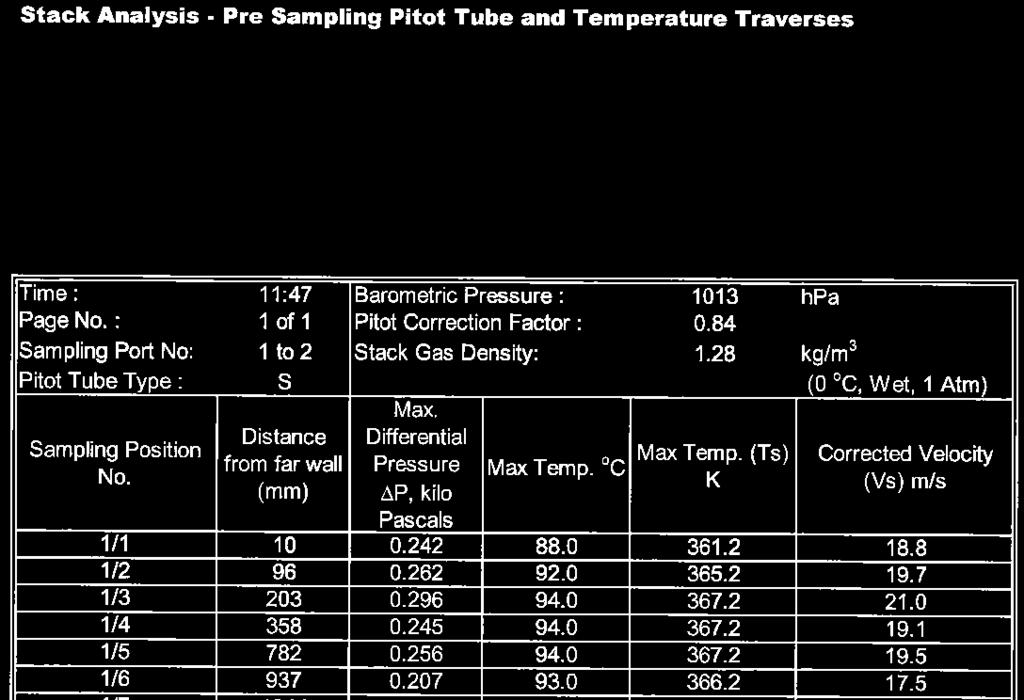
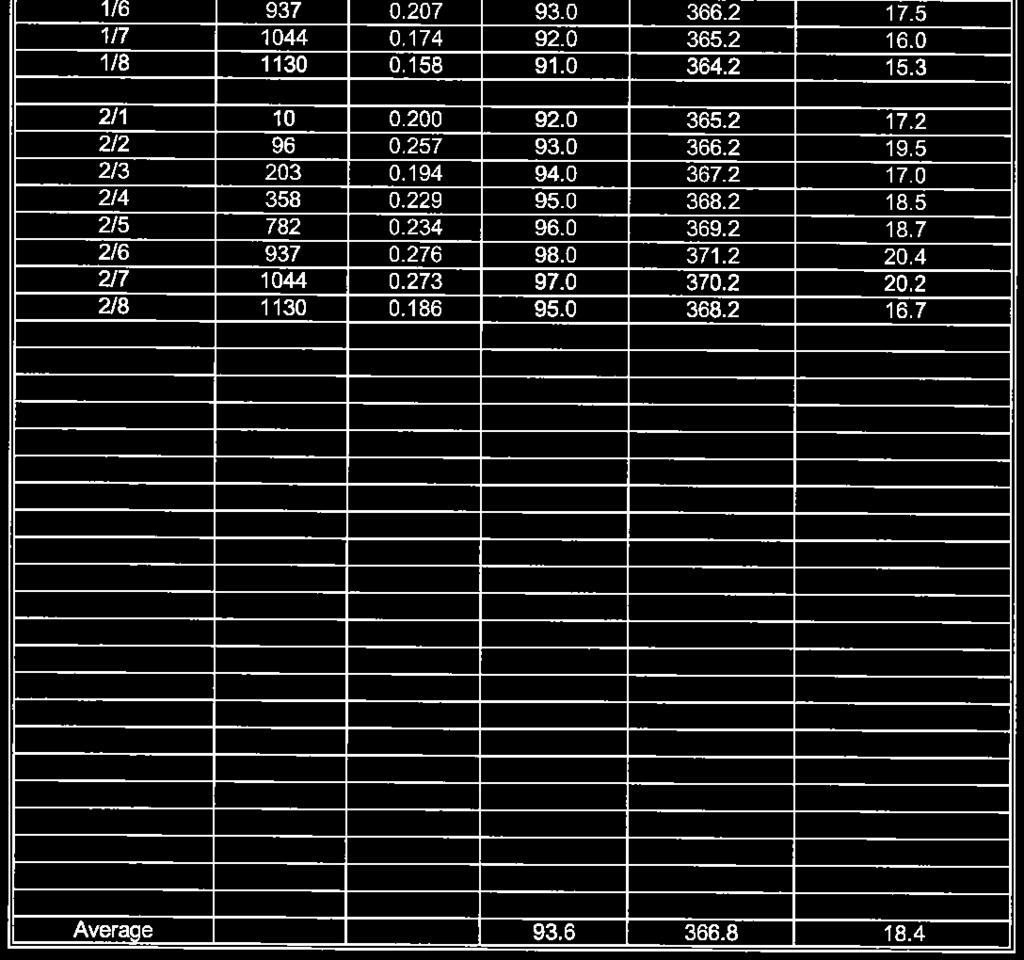
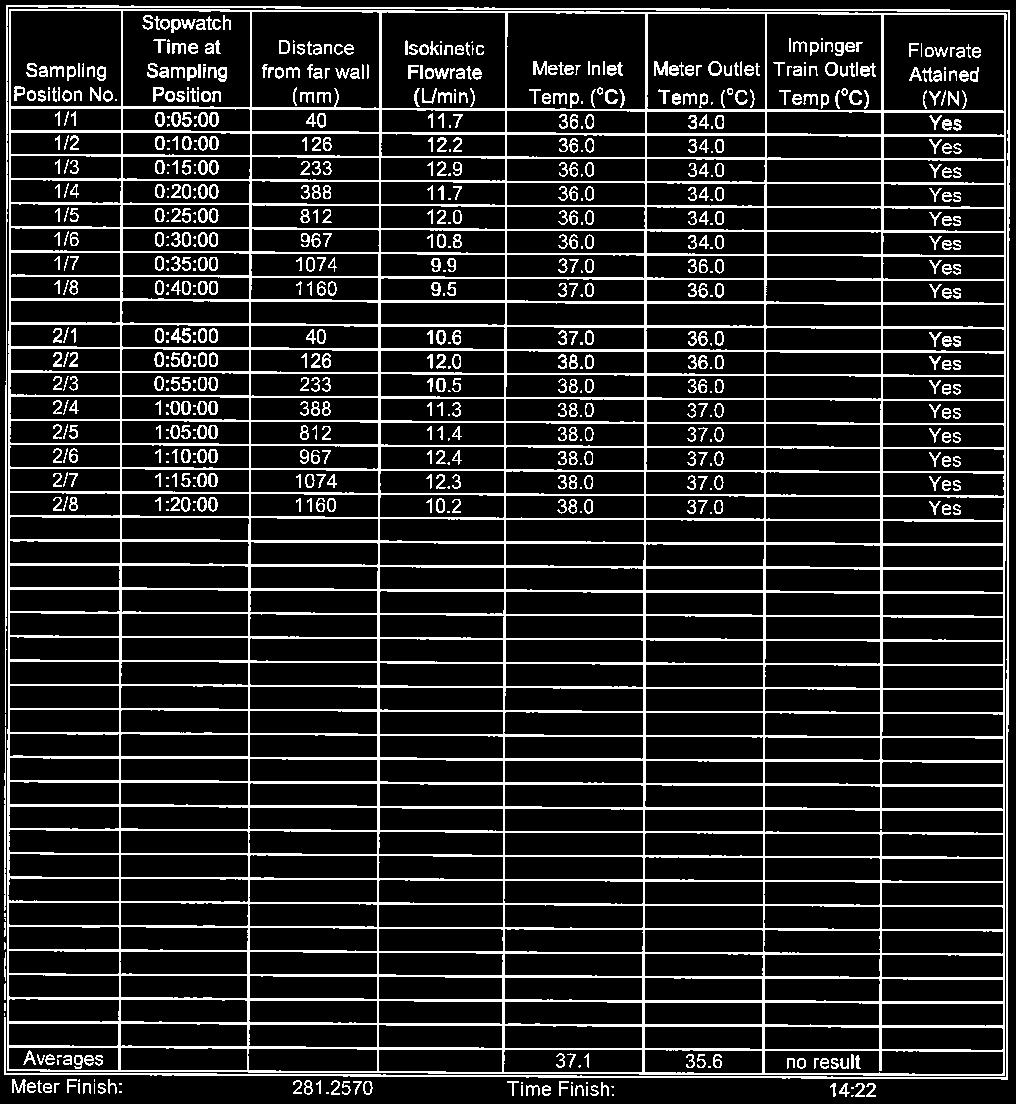
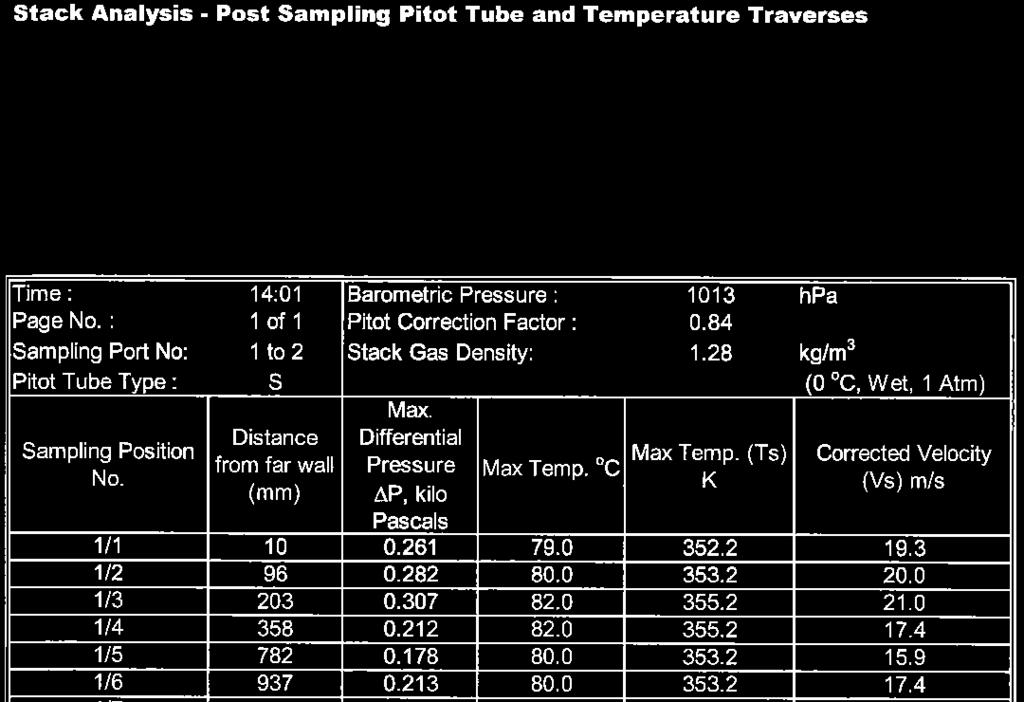
19 AECOM Emissions Testing Report National Ceramic Industries Australia Commercial-in-Confidence 13 Table 7 Clay Prep Stack Total Particulate and Fine Particulate (PM 10) Results, 30 October 2013 Sampling Conditions: Stack internal diameter at test location 995 mm Stack gas temperature (average) 25.0 o C K Stack pressure (average) 1014 hpa Stack gas velocity (average, stack conditions) 14 m/s Stack gas flowrate (stack conditions) 11 m 3 /s Stack gas flowrate (0 0 C, dry gas, 1 atm pressure) 9.7 m 3 /s Fine Particulate (PM 10) Testing Test Period 10:40-11:45 Fine Particulate (PM 10) Mass 0.4 mg Gas Volume Sampled m 3 Fine Particulate (PM 10) Emission* mg/m 3 Fine Particulate (PM 10) Mass Emission Rate* mg/s Regulatory Limit N/A Total Particulate Testing Test Period 10:40-11:43 Total Particulate Mass 0.8 mg Gas Volume Sampled m 3 Total Particulate Emission* mg/m 3 Total Particulate Mass Emission Rate* 2 12 mg/s Regulatory Limit 20 mg/m 3 Moisture Content (%) 1.9 Gas Density (dry at 1 atmosphere) 1.29 kg/m 3 Dry Molecular Weight 28.8 g/g-mole Notes *1 Emission concentration at Standard conditions of 0 0 C, 1 atm, dry gas *2 Mass emission rate determined from pre and post-test sampling flow measurements and the respective test moisture content. See Q std in field sheets and final calculations "Stack Analysis - Final Calculations" for each test. Reports/1.9 Stack Testing 2013/NCIA Emissions Testing Report 2013_2014.docx Revision May-2014 Prepared for National Ceramic Industries Australia ABN:
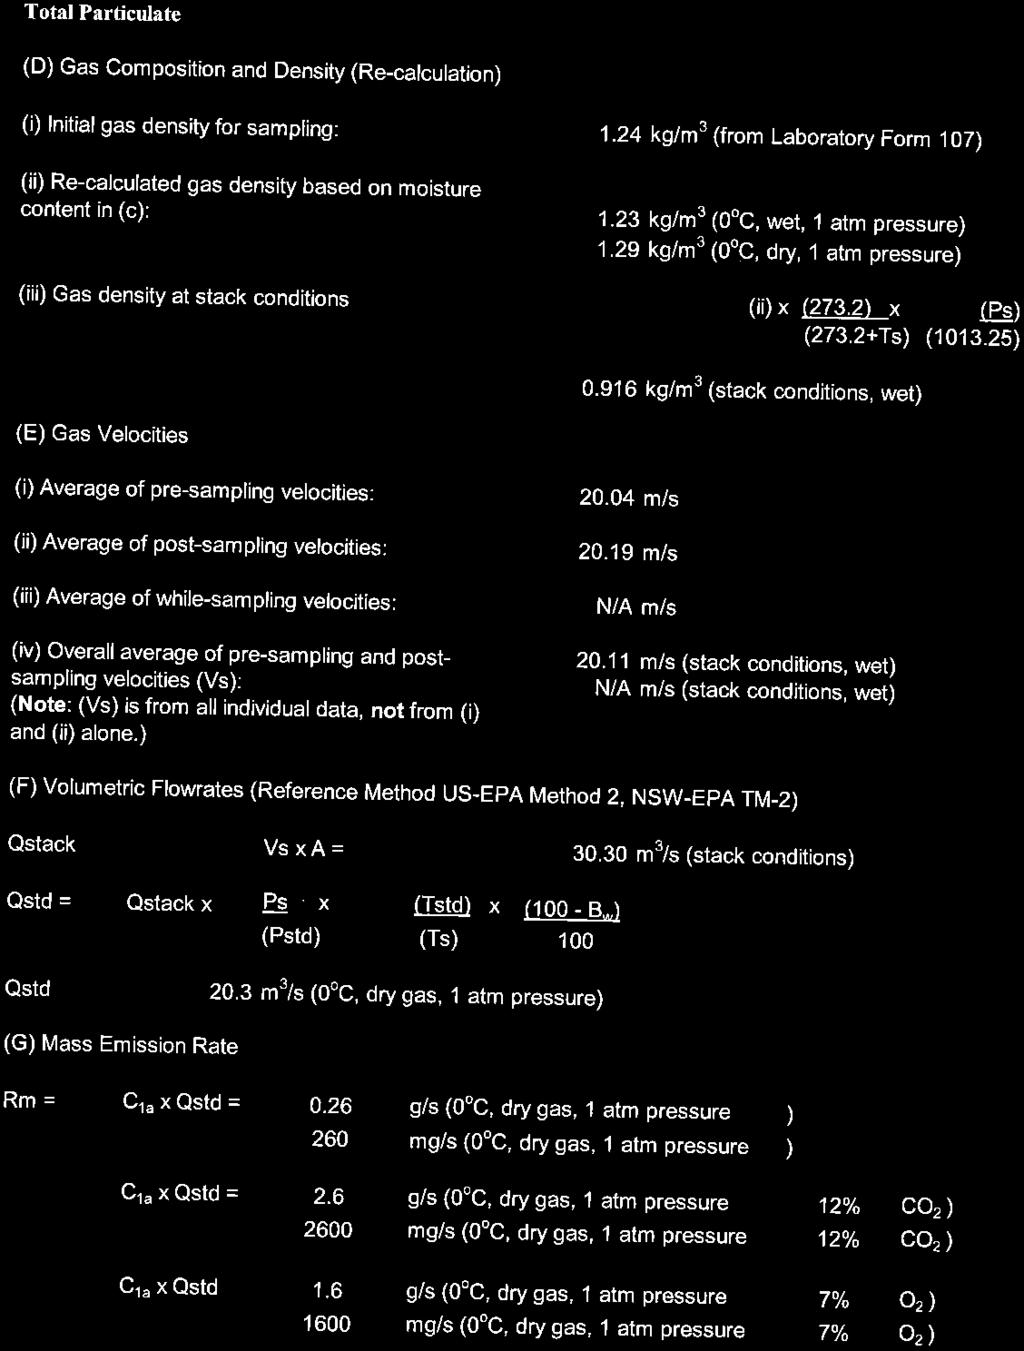
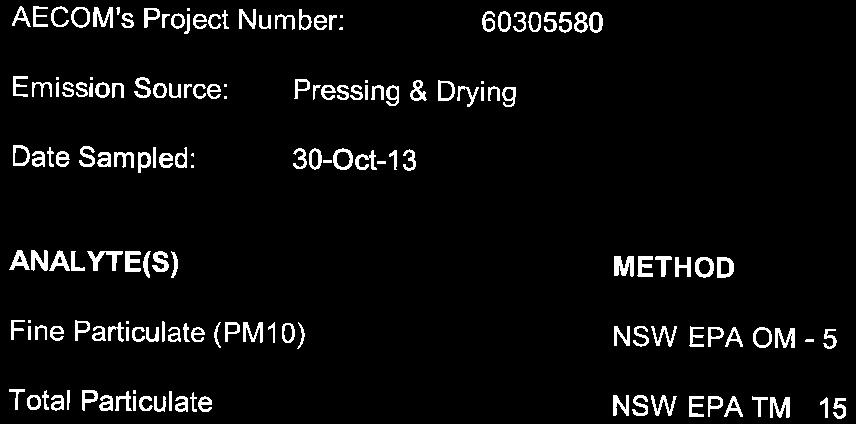
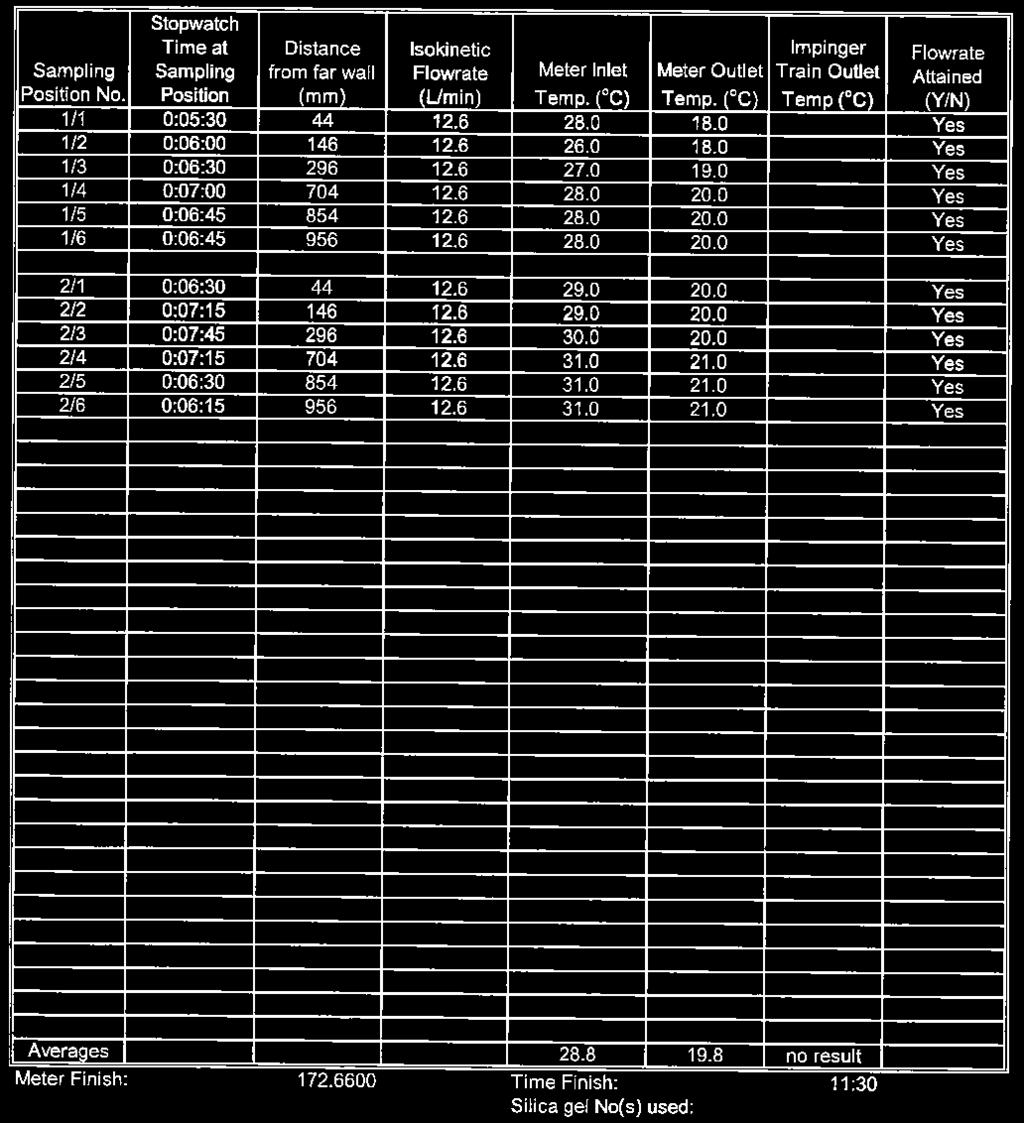
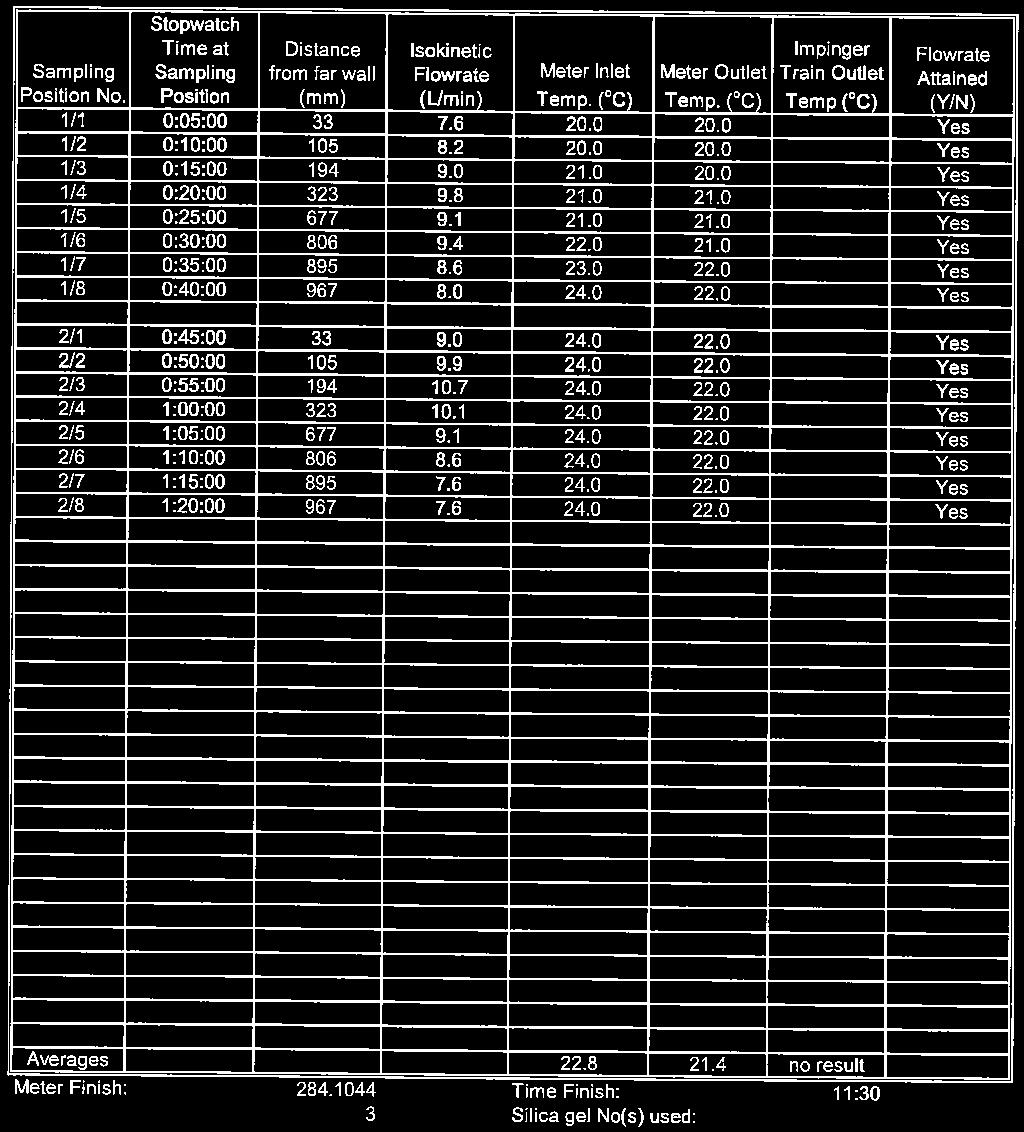
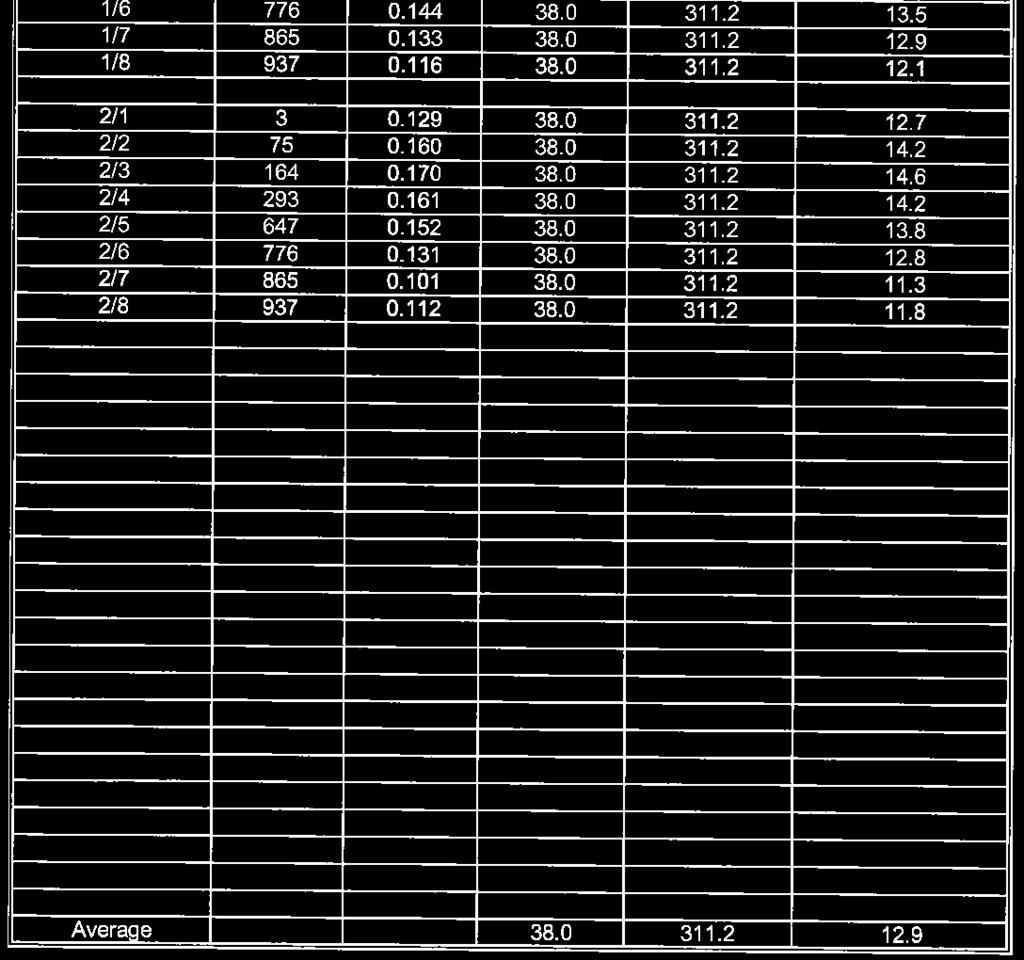
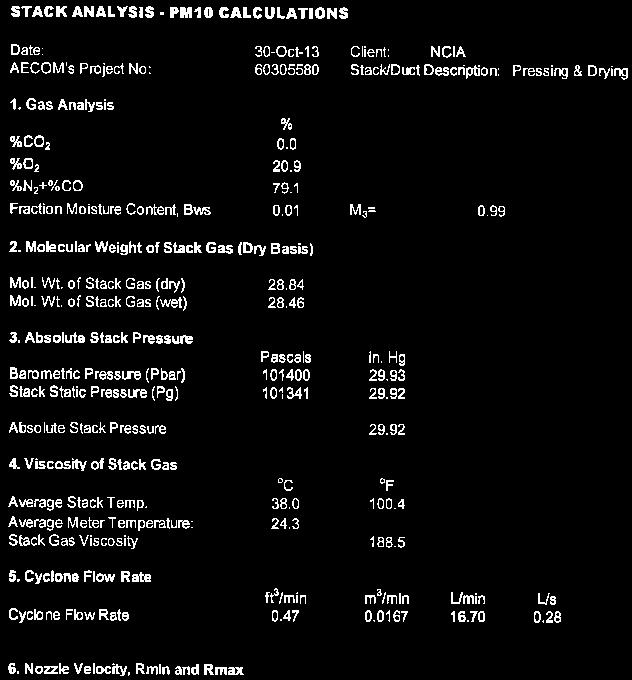
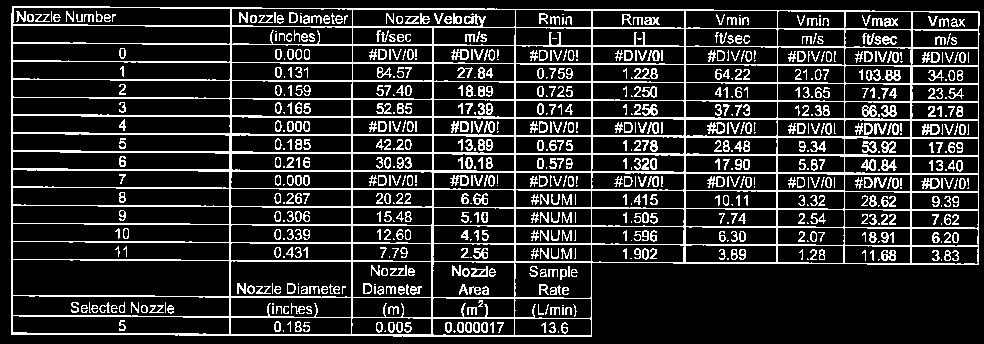
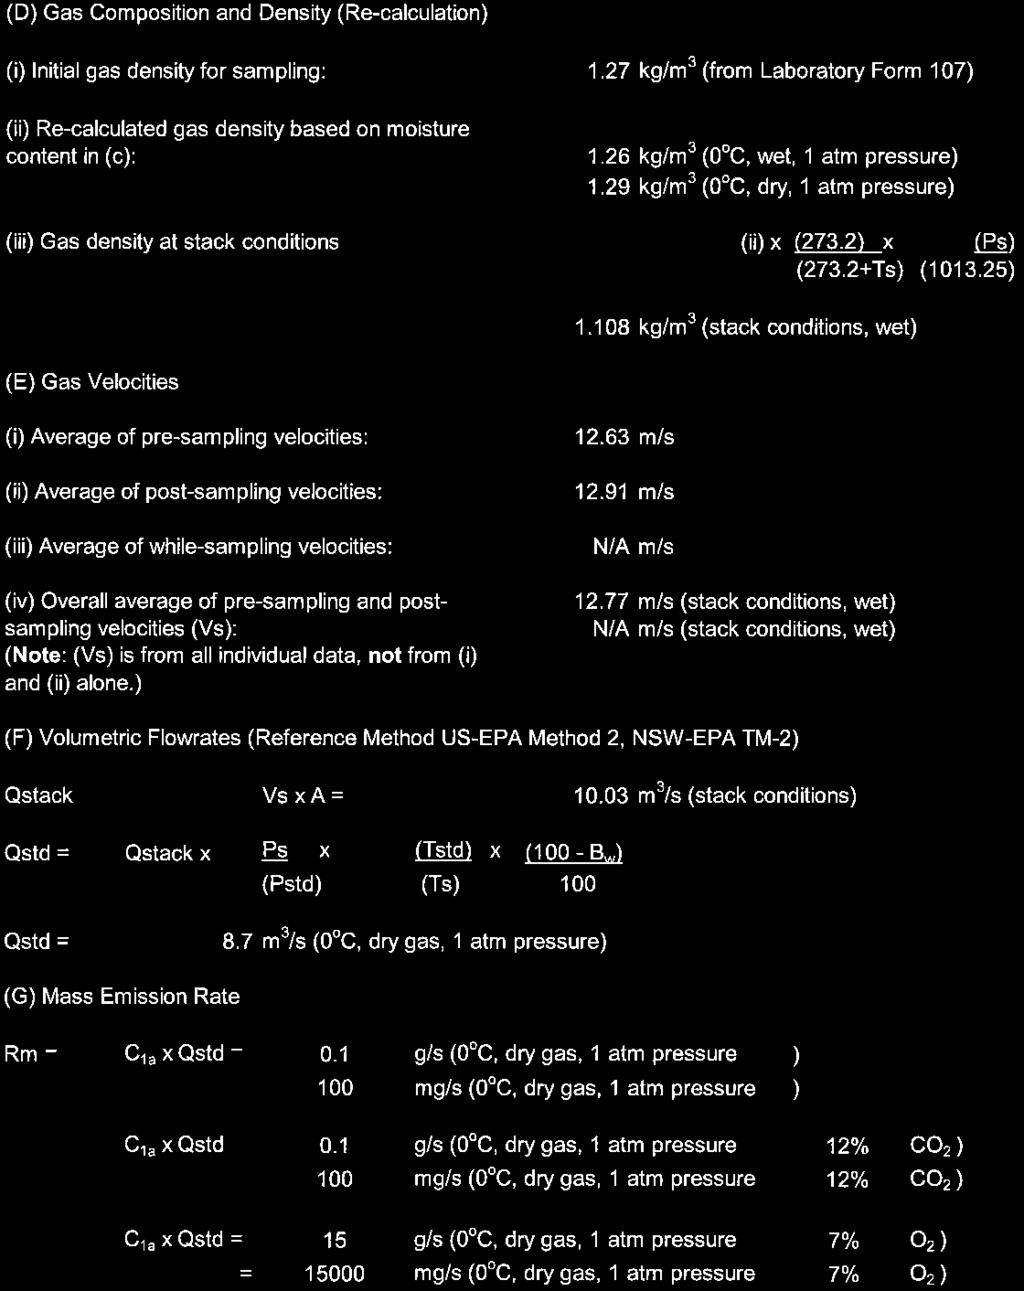
20 AECOM Emissions Testing Report National Ceramic Industries Australia Commercial-in-Confidence 14 Table 8 Pressing and Drying Stack Total Particulate and Fine Particulate (PM 10) Results, 30 October 2013 Sampling Conditions: Stack internal diameter at test location 1000 mm Stack gas temperature (average) 37.5 o C K Stack pressure (average) 1013 hpa Stack gas velocity (average, stack conditions) 13 m/s Stack gas flowrate (stack conditions) 10 m 3 /s Stack gas flowrate (0 0 C, dry gas, 1 atm pressure) 8.8 m 3 /s Fine Particulate (PM 10) Testing Test Period 10:08-11:30 Fine Particulate (PM 10) Mass 2.7 mg Gas Volume Sampled m 3 Fine Particulate (PM 10) Emission* mg/m 3 Fine Particulate (PM 10) Mass Emission Rate* 2 25 mg/s Regulatory Limit N/A Total Particulate Testing Test Period 10:08-11:30 Total Particulate Mass 8.5 mg Gas Volume Sampled 0.71 m 3 Total Particulate Emission* 1 12 mg/m 3 Total Particulate Mass Emission Rate* mg/s Regulatory Limit 20 mg/m 3 Moisture Content (%) 1.7 Gas Density (dry at 1 atmosphere) 1.29 kg/m 3 Dry Molecular Weight 28.8 g/g-mole Notes *1 Emission concentration at Standard conditions of 0 0 C, 1 atm, dry gas *2 Mass emission rate determined from pre and post-test sampling flow measurements and the respective test moisture content. See Q std in field sheets and final calculations "Stack Analysis - Final Calculations" for each test. Reports/1.9 Stack Testing 2013/NCIA Emissions Testing Report 2013_2014.docx Revision May-2014 Prepared for National Ceramic Industries Australia ABN:
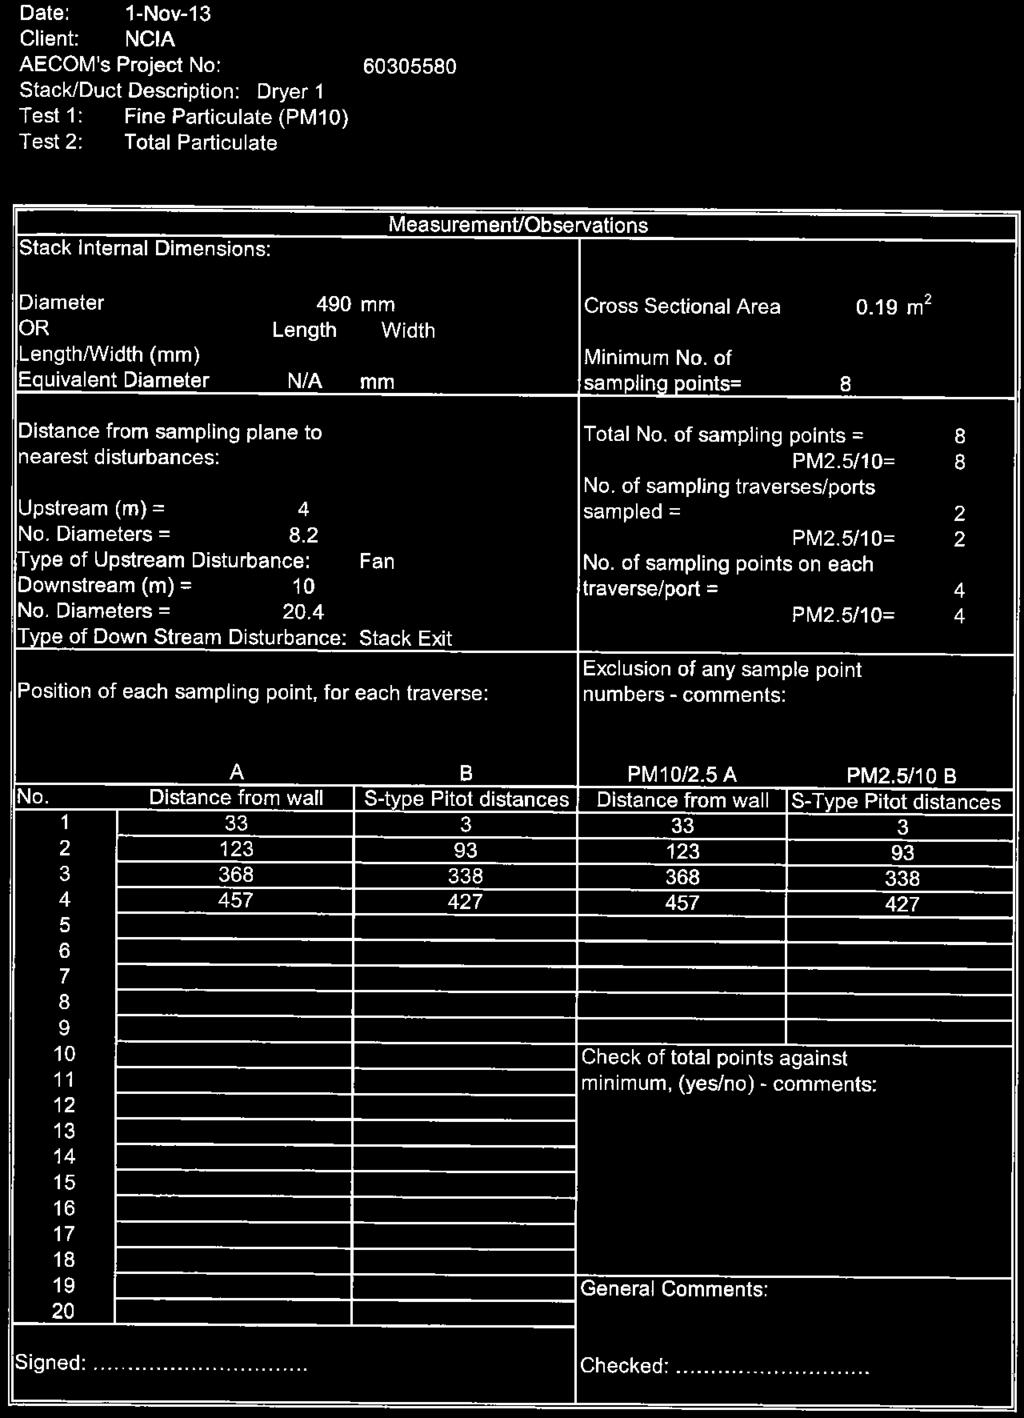
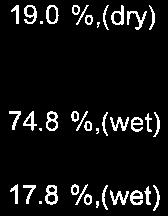
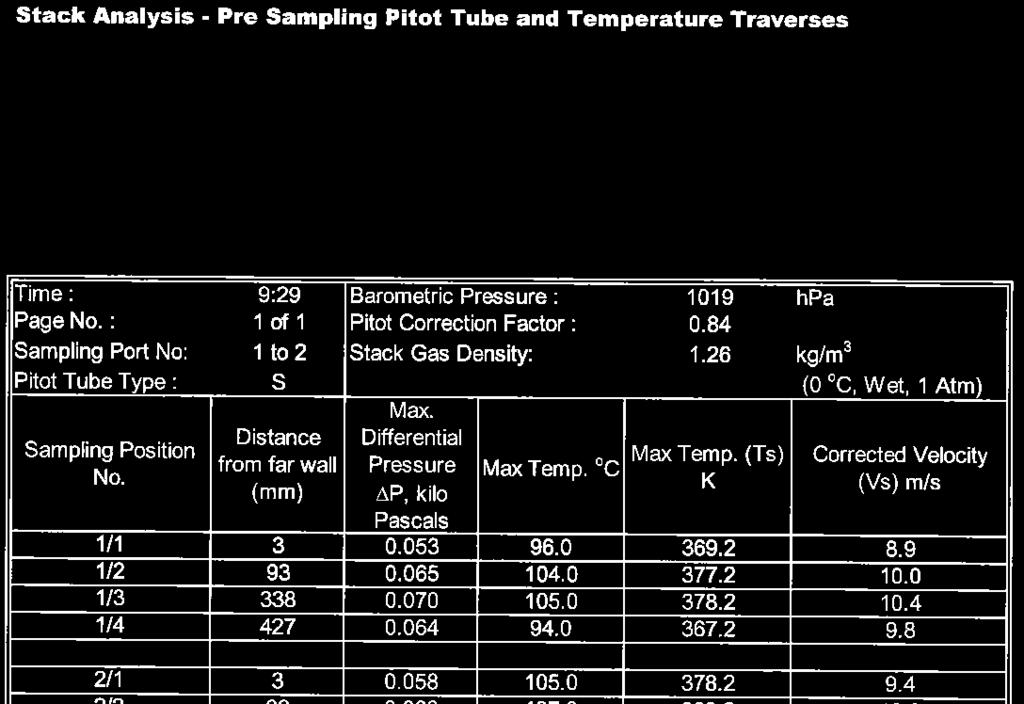
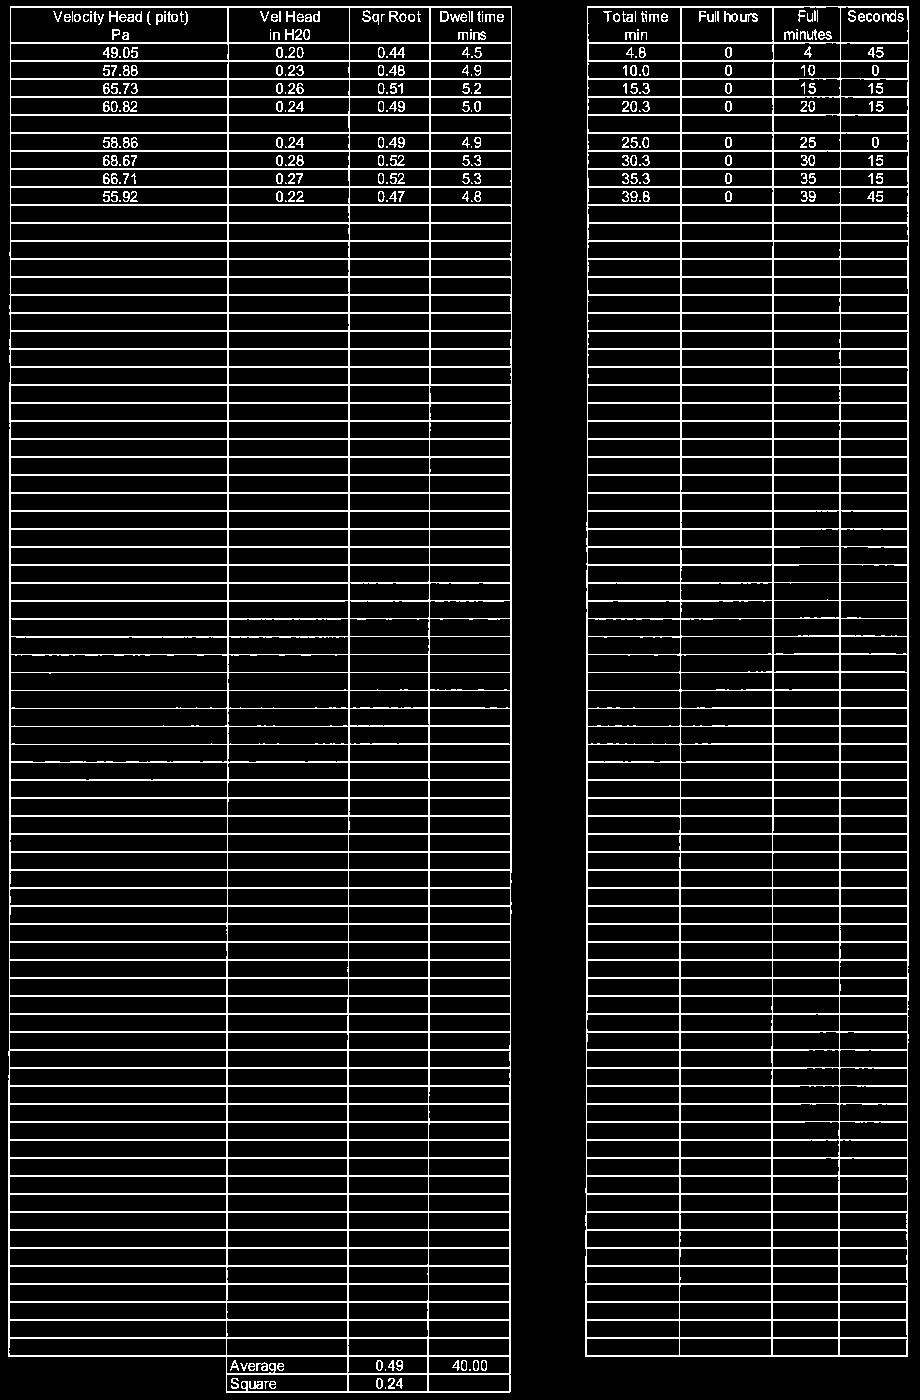
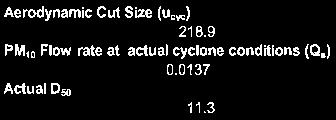
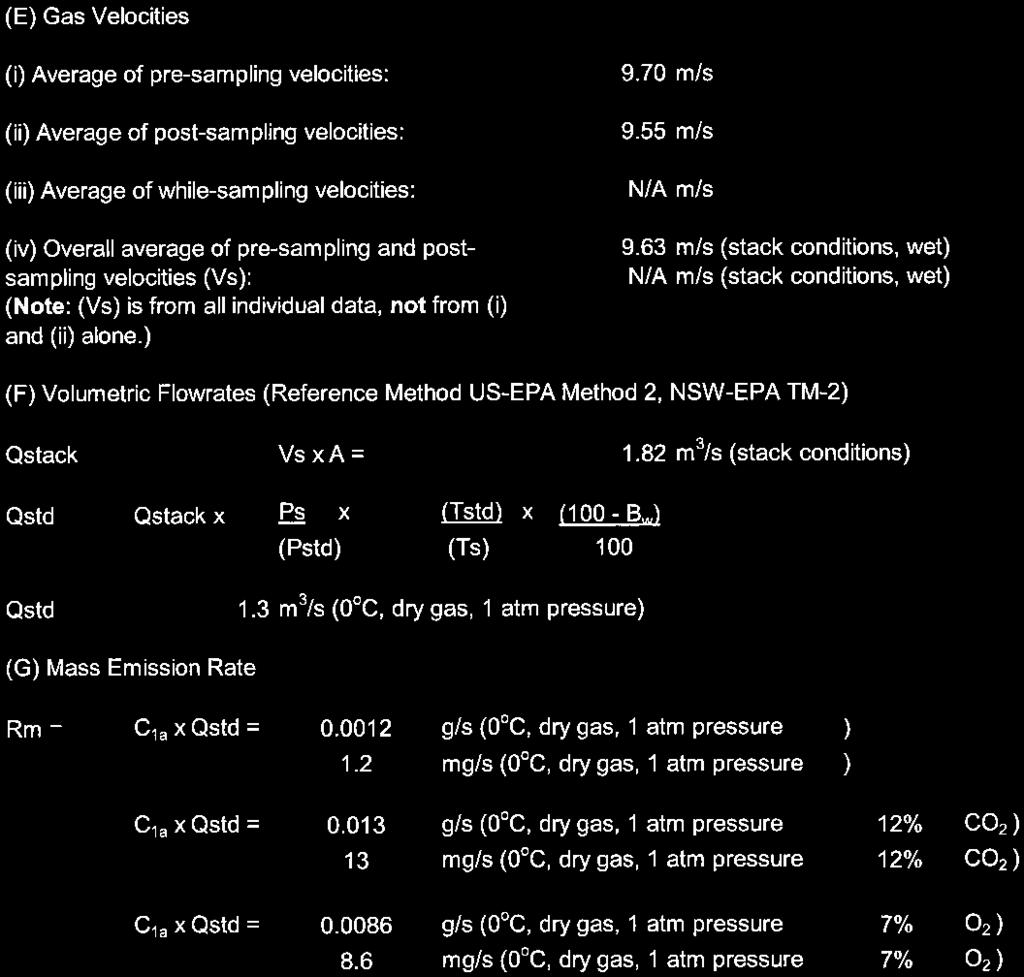
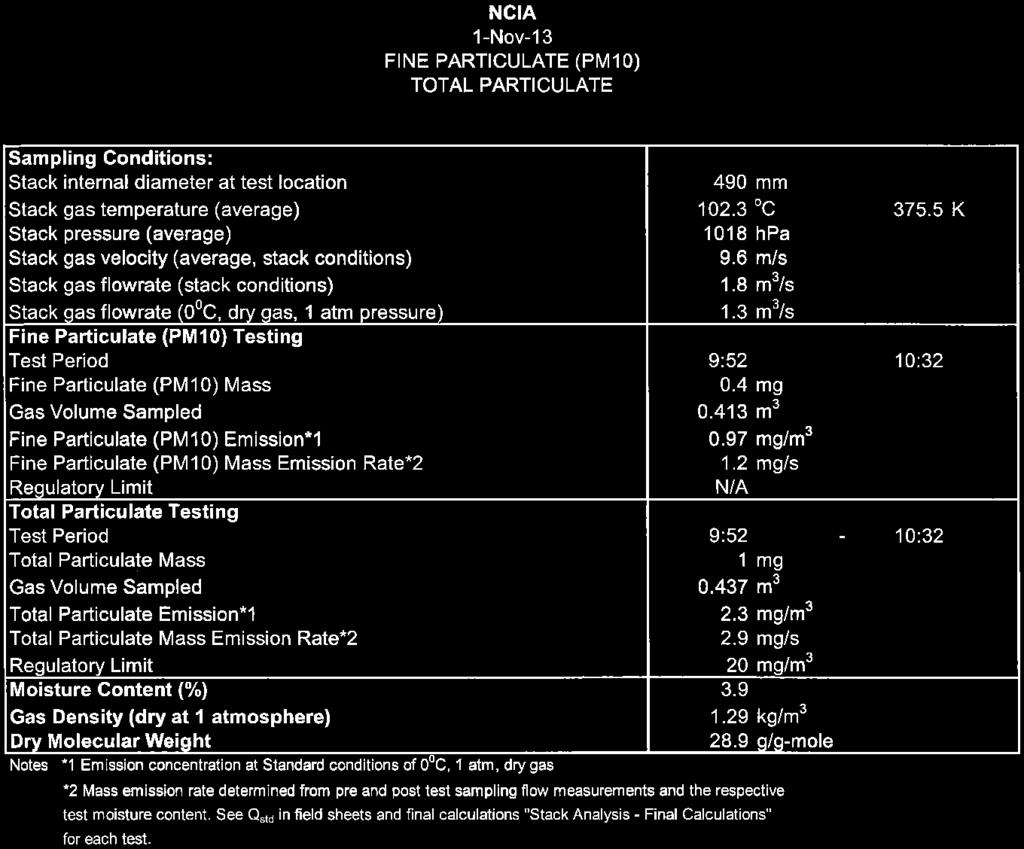
21 AECOM Emissions Testing Report National Ceramic Industries Australia Commercial-in-Confidence 15 Table 9 Dryer 1 Stack Total Particulate and Fine Particulate (PM 10) Results, 1 November 2013 Sampling Conditions: Stack internal diameter at test location 490 mm Stack gas temperature (average) o C K Stack pressure (average) 1018 hpa Stack gas velocity (average, stack conditions) 9.6 m/s Stack gas flowrate (stack conditions) 1.8 m 3 /s Stack gas flowrate (0 0 C, dry gas, 1 atm pressure) 1.3 m 3 /s Fine Particulate (PM 10) Testing Test Period 9:52-10:32 Fine Particulate (PM 10) Mass 0.4 mg Gas Volume Sampled m 3 Fine Particulate (PM 10) Emission* mg/m 3 Fine Particulate (PM 10) Mass Emission Rate* mg/s Regulatory Limit N/A Total Particulate Testing Test Period 9:52-10:32 Total Particulate Mass 1 mg Gas Volume Sampled m 3 Total Particulate Emission* mg/m 3 Total Particulate Mass Emission Rate* mg/s Regulatory Limit 20 mg/m 3 Moisture Content (%) 3.9 Gas Density (dry at 1 atmosphere) 1.29 kg/m 3 Dry Molecular Weight 28.9 g/g-mole Notes *1 Emission concentration at Standard conditions of 0 0 C, 1 atm, dry gas *2 Mass emission rate determined from pre and post-test sampling flow measurements and the respective test moisture content. See Q std in field sheets and final calculations "Stack Analysis - Final Calculations" for each test. Reports/1.9 Stack Testing 2013/NCIA Emissions Testing Report 2013_2014.docx Revision May-2014 Prepared for National Ceramic Industries Australia ABN:
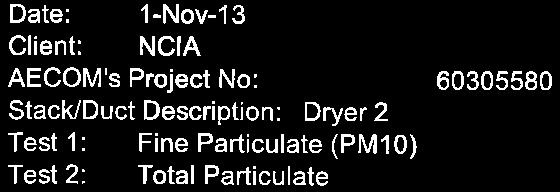
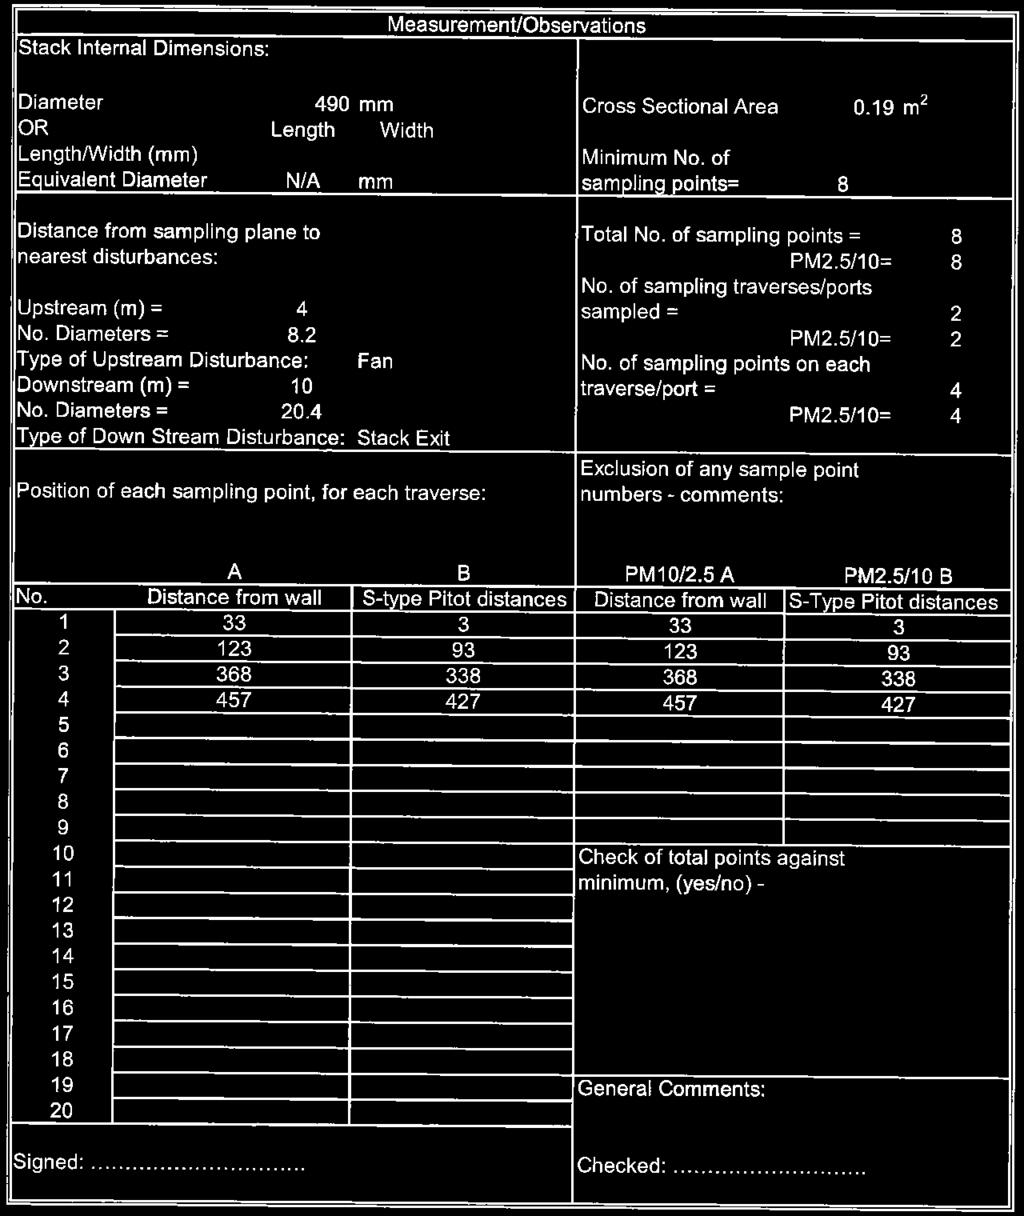
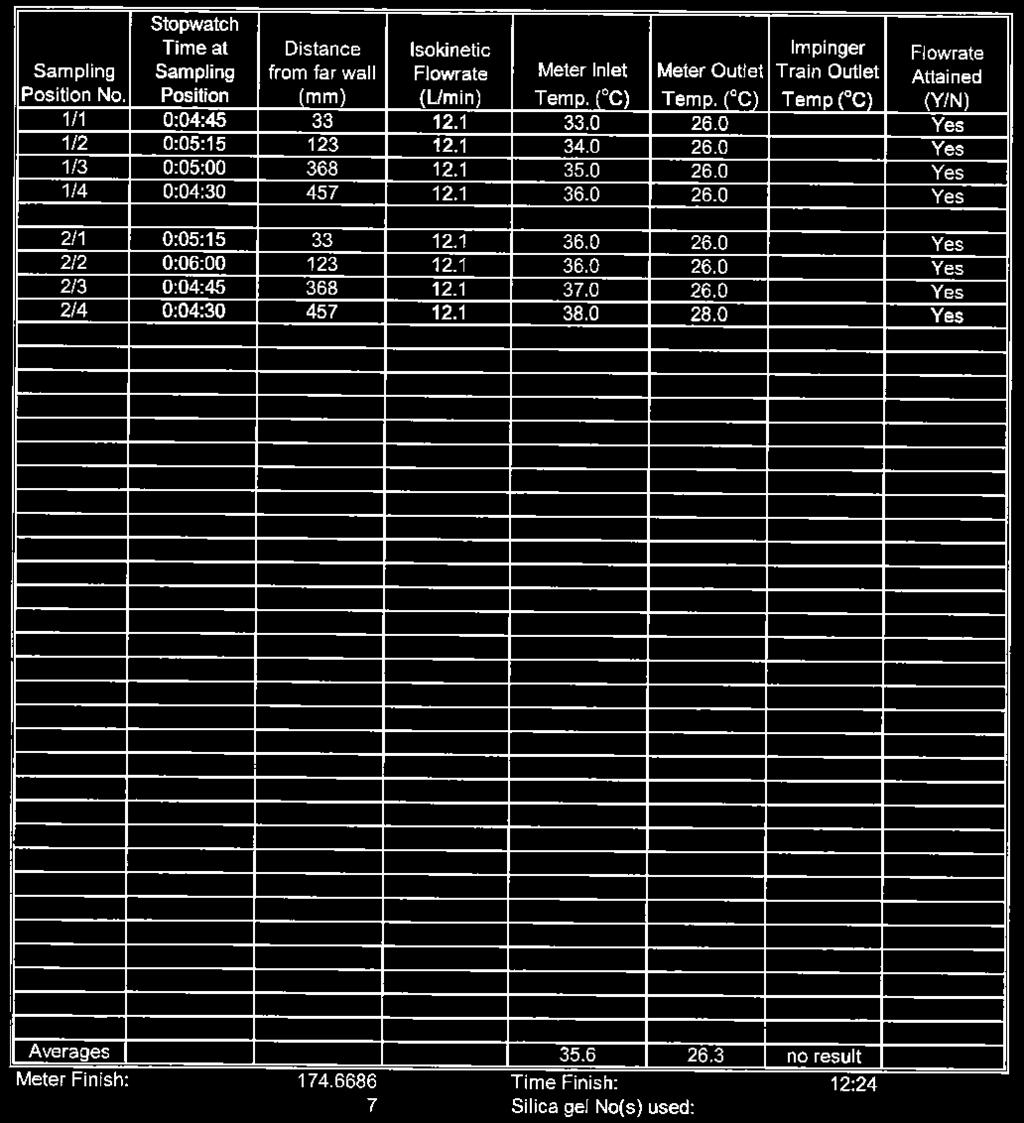
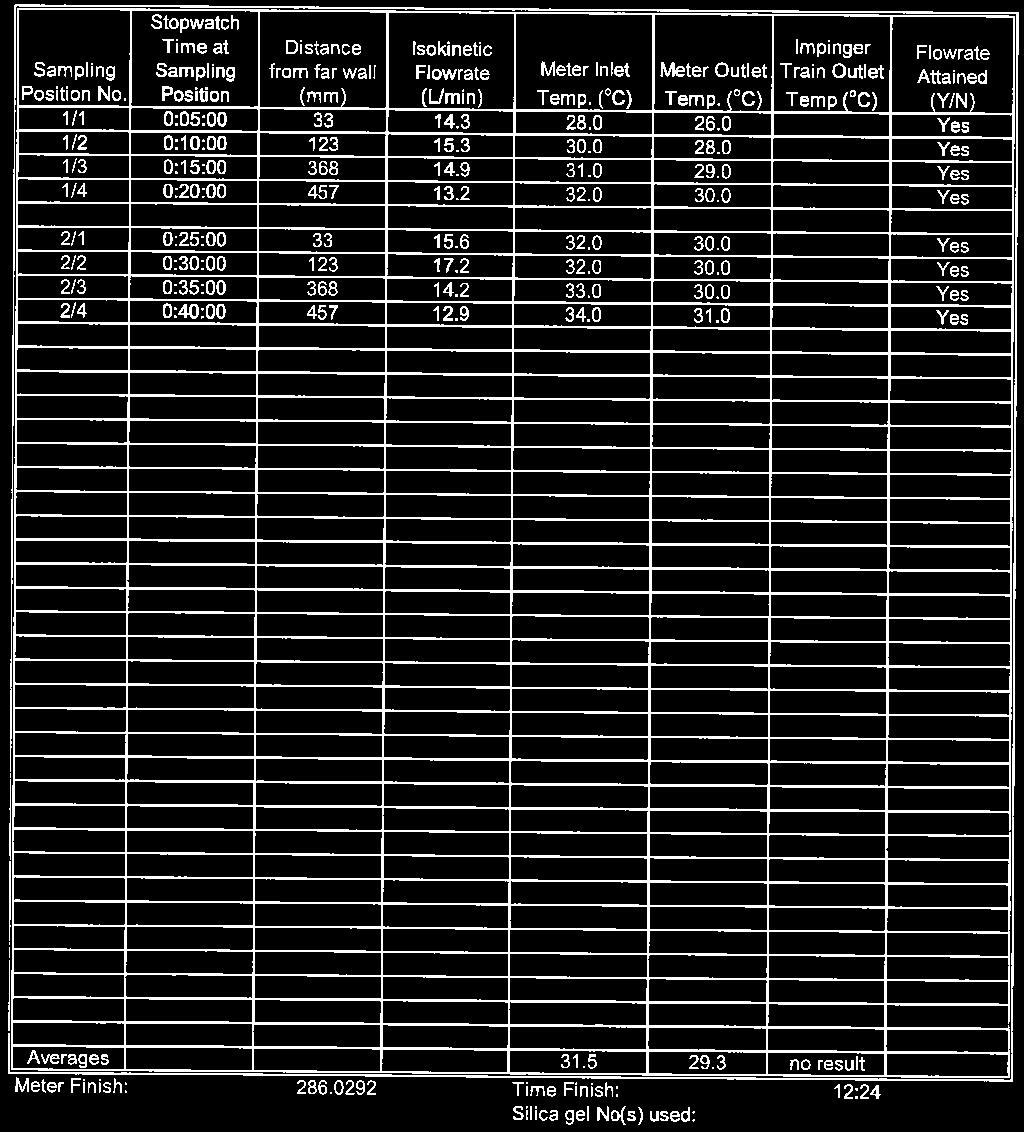
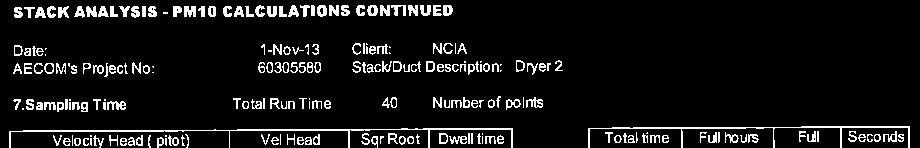
22 AECOM Emissions Testing Report National Ceramic Industries Australia Commercial-in-Confidence 16 Table 10 Dryer 2 Stack Total Particulate and Fine Particulate (PM 10) Results, 1 November 2013 Sampling Conditions: Stack internal diameter at test location 490 mm Stack gas temperature (average) o C K Stack pressure (average) 1011 hpa Stack gas velocity (average, stack conditions) 12 m/s Stack gas flowrate (stack conditions) 2.2 m 3 /s Stack gas flowrate (0 0 C, dry gas, 1 atm pressure) 1.5 m 3 /s Fine Particulate (PM 10) Testing Test Period 11:42-12:24 Fine Particulate (PM 10) Mass 0.4 mg Gas Volume Sampled m 3 Fine Particulate (PM 10) Emission* mg/m 3 Fine Particulate (PM 10) Mass Emission Rate* mg/s Regulatory Limit NA Total Particulate Testing Test Period 11:42-12:24 Total Particulate Mass 1.1 mg Gas Volume Sampled m 3 Total Particulate Emission* mg/m 3 Total Particulate Mass Emission Rate* mg/s Regulatory Limit 20 mg/m 3 Moisture Content (%) 5.1 Gas Density (dry at 1 atmosphere) 1.29 kg/m 3 Dry Molecular Weight 28.8 g/g-mole Notes *1 Emission concentration at Standard conditions of 0 0 C, 1 atm, dry gas *2 Mass emission rate determined from pre and post-test sampling flow measurements and the respective test moisture content. See Q std in field sheets and final calculations "Stack Analysis - Final calculations" for each test. Reports/1.9 Stack Testing 2013/NCIA Emissions Testing Report 2013_2014.docx Revision May-2014 Prepared for National Ceramic Industries Australia ABN:
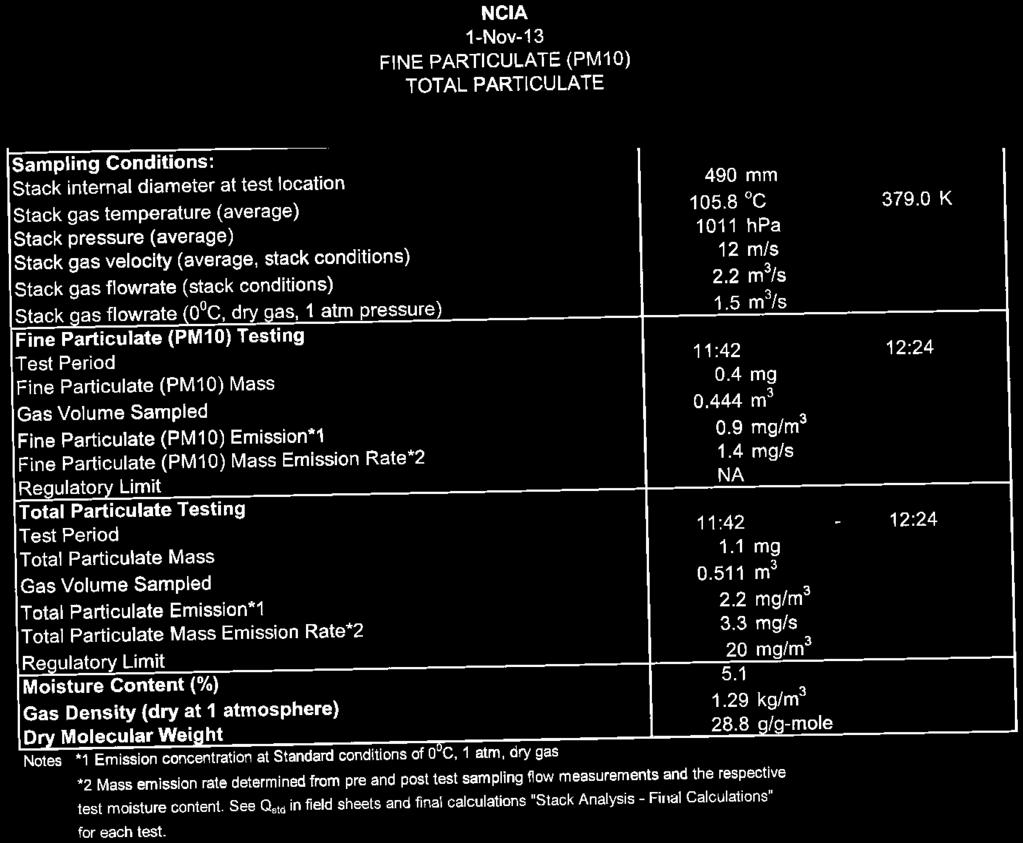
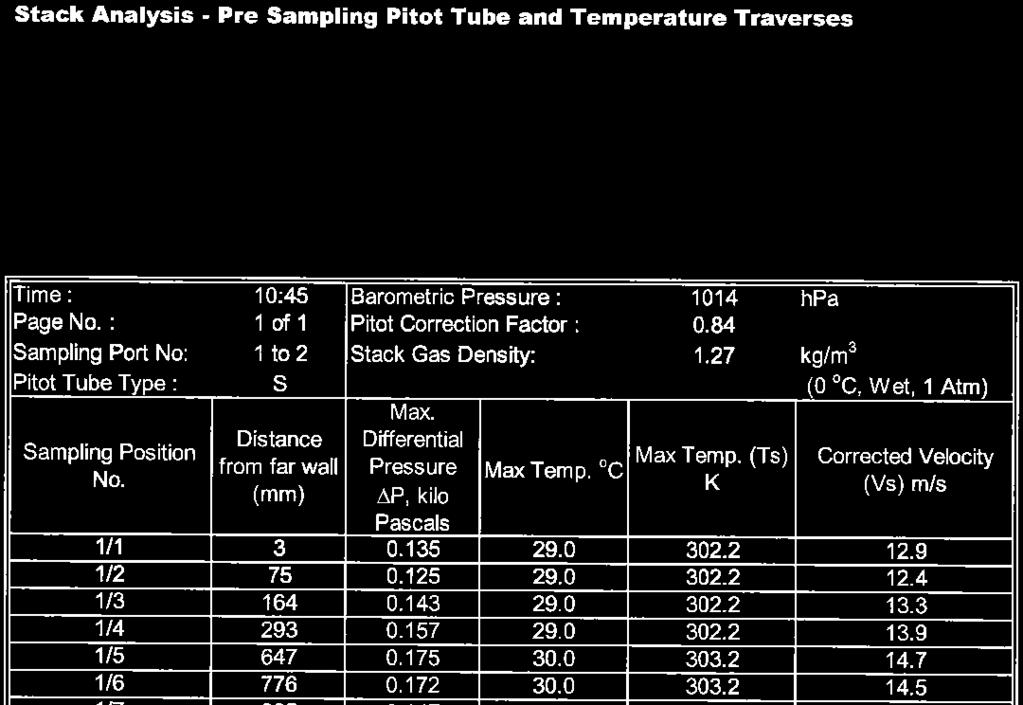
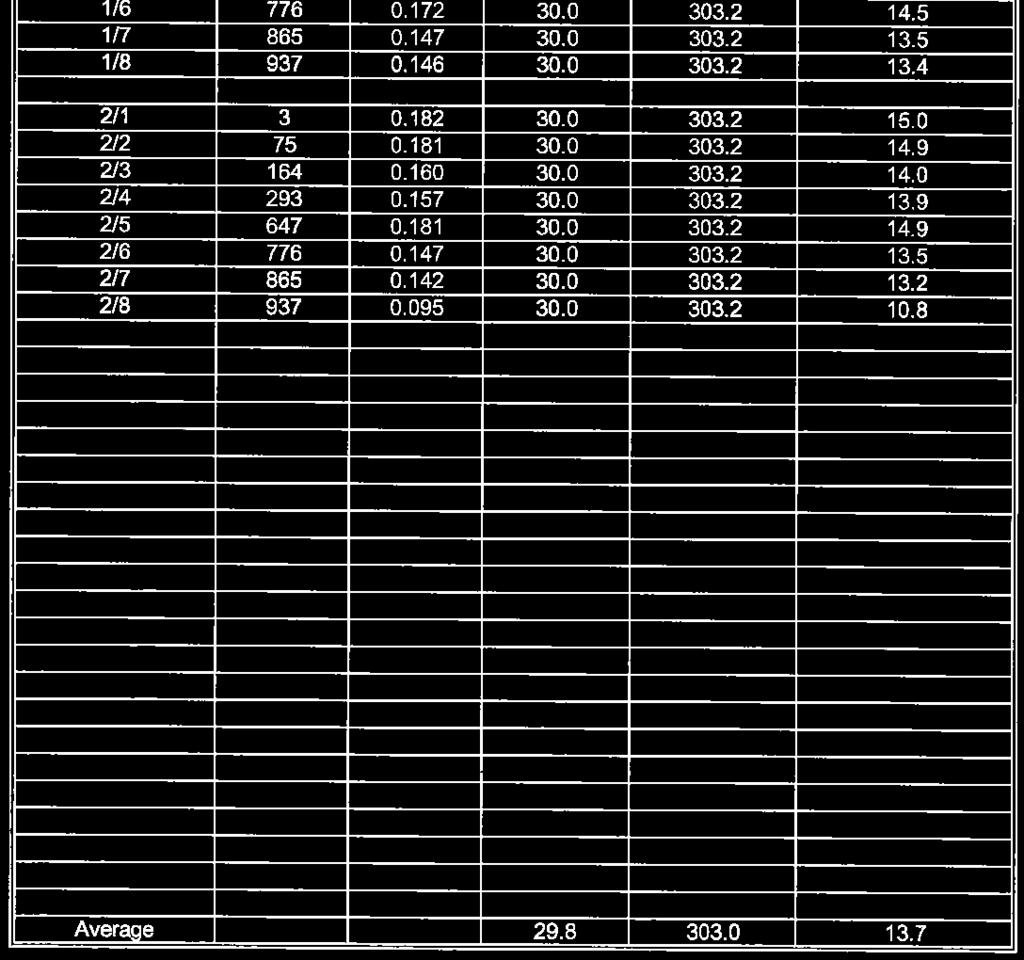
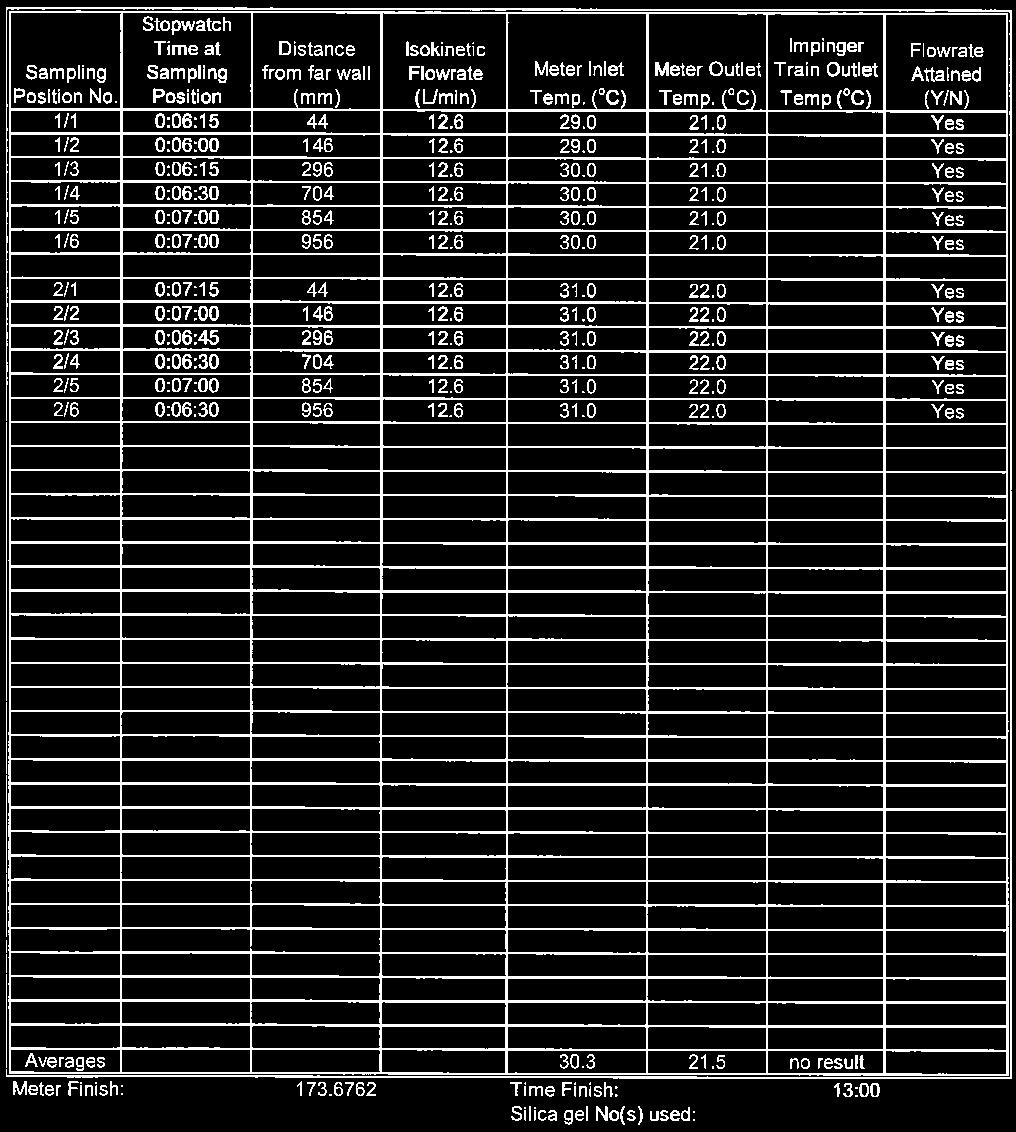
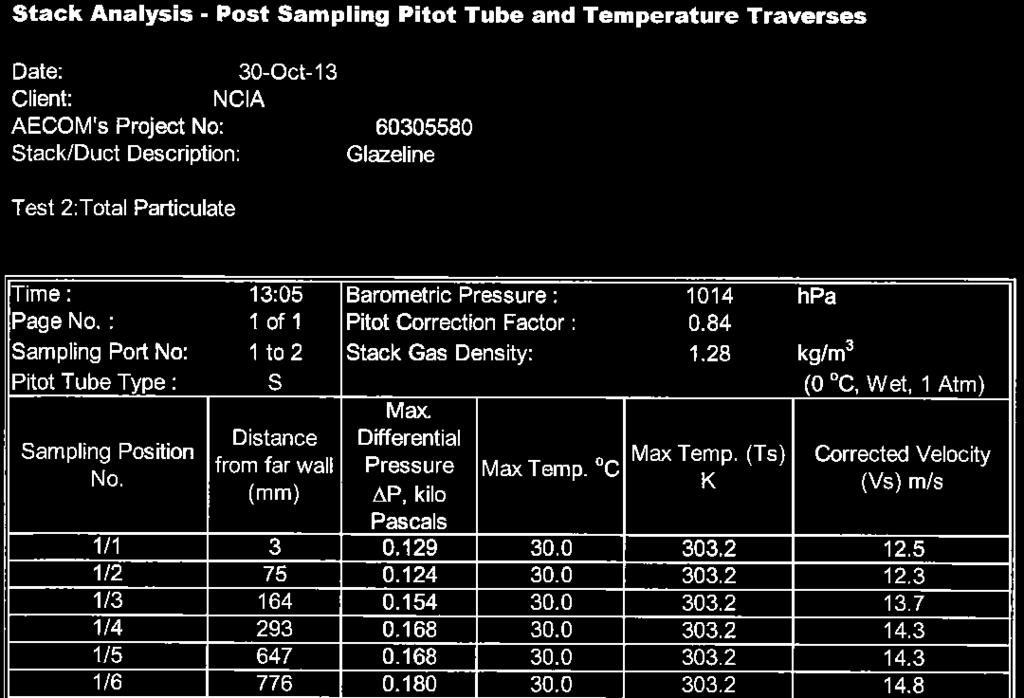
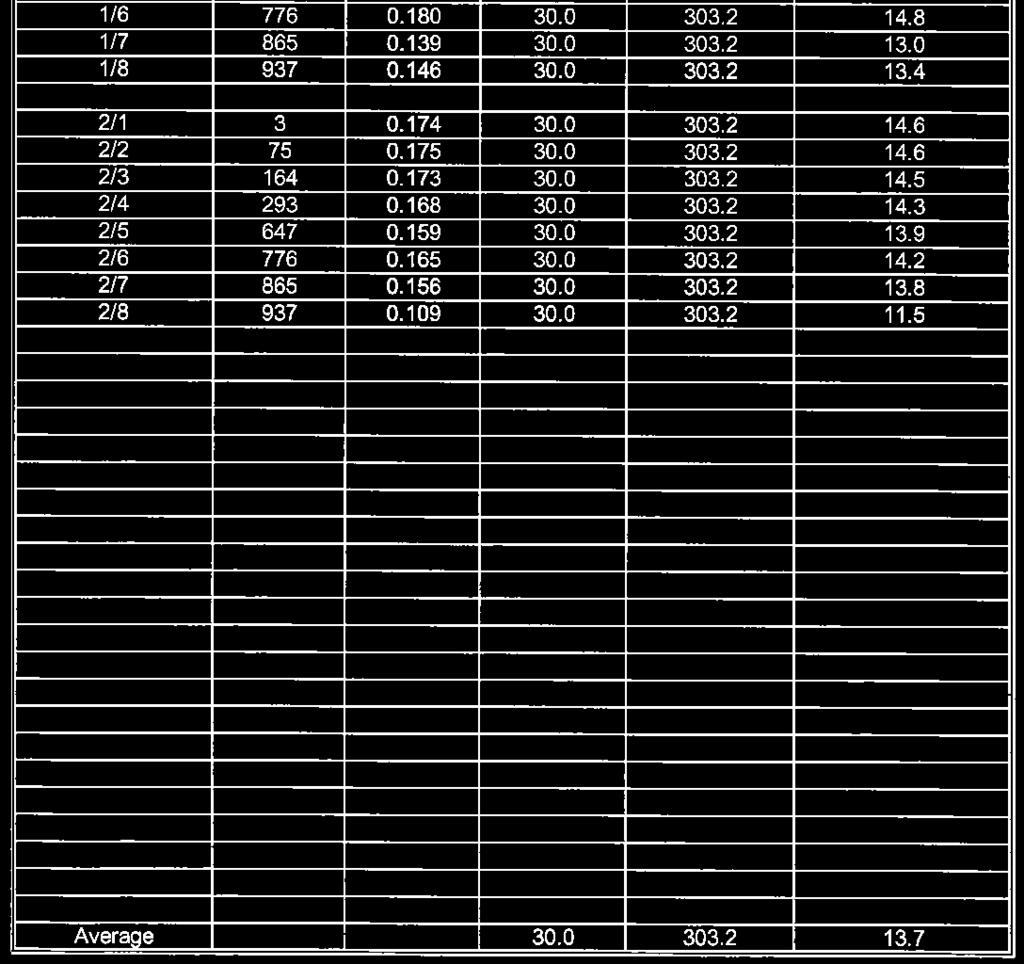
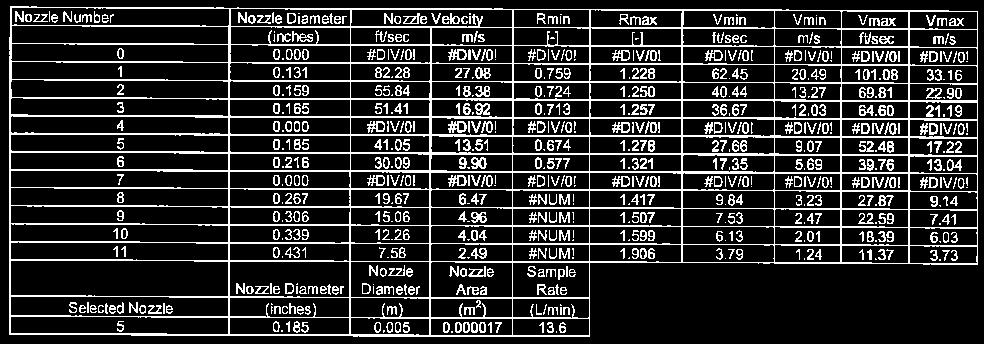
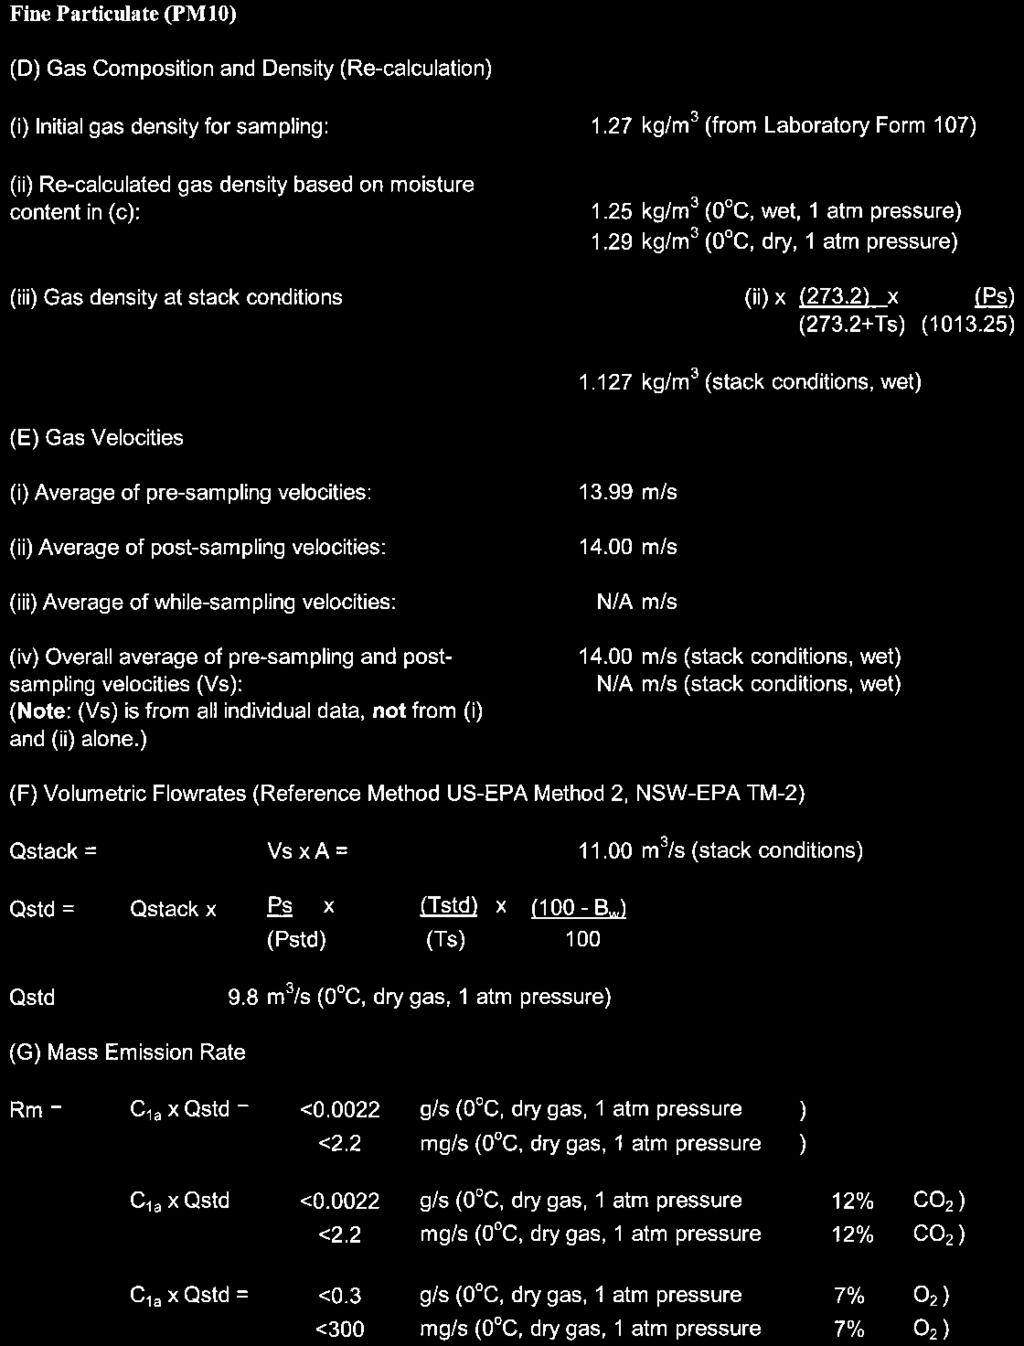
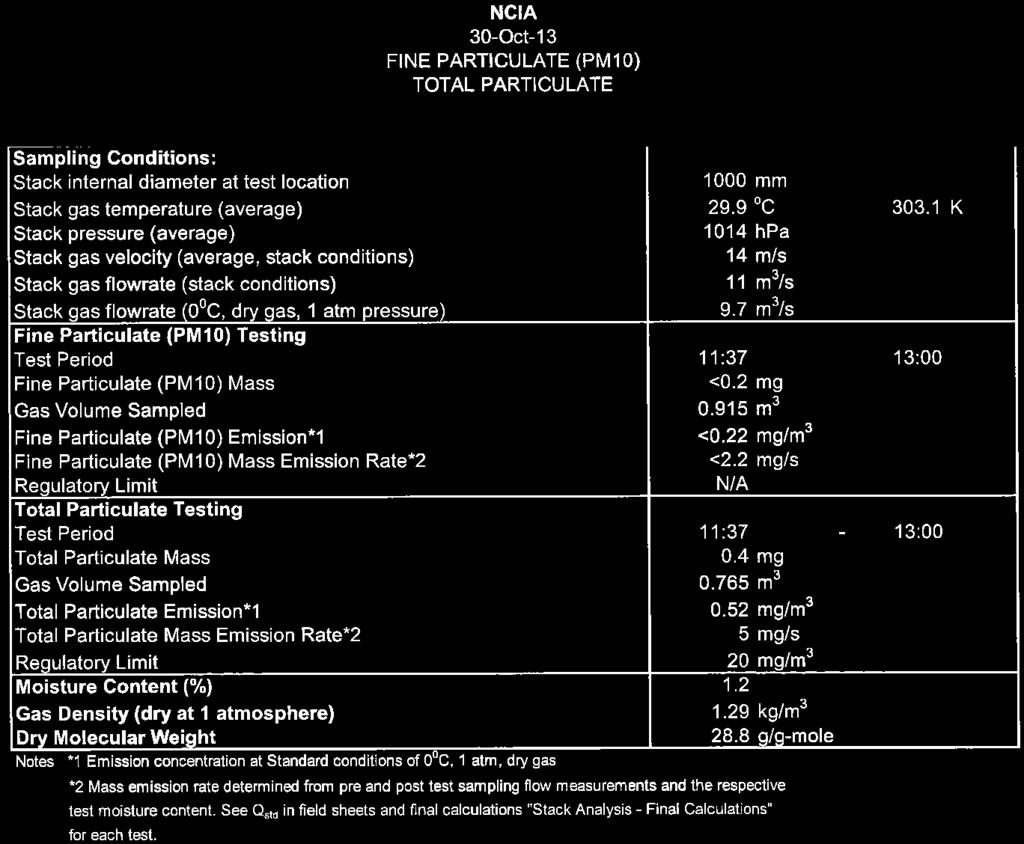
23 AECOM Emissions Testing Report National Ceramic Industries Australia Commercial-in-Confidence 17 Table 11 Glaze Line Stack Total Particulate and Fine Particulate (PM 10) Results, 30 October 2013 Sampling Conditions: Stack internal diameter at test location 1000 mm Stack gas temperature (average) 29.9 o C K Stack pressure (average) 1014 hpa Stack gas velocity (average, stack conditions) 14 m/s Stack gas flowrate (stack conditions) 11 m 3 /s Stack gas flowrate (0 0 C, dry gas, 1 atm pressure) 9.7 m 3 /s Fine Particulate (PM 10) Testing Test Period 11:37-13:00 Fine Particulate (PM 10) Mass <0.2 mg Gas Volume Sampled m 3 Fine Particulate (PM 10) Emission* 1 <0.22 mg/m 3 Fine Particulate (PM 10) Mass Emission Rate* 2 <2.2 mg/s Regulatory Limit N/A Total Particulate Testing Test Period 11:37-13:00 Total Particulate Mass 0.4 mg Gas Volume Sampled m 3 Total Particulate Emission* mg/m 3 Total Particulate Mass Emission Rate* 2 5 mg/s Regulatory Limit 20 mg/m 3 Moisture Content (%) 1.2 Gas Density (dry at 1 atmosphere) 1.29 kg/m 3 Dry Molecular Weight 28.8 g/g-mole Notes *1 Emission concentration at Standard conditions of 0 0 C, 1 atm, dry gas *2 Mass emission rate determined from pre and post-test sampling flow measurements and the respective test moisture content. See Q std in field sheets and final calculations "Stack Analysis - Final Calculations" for each test. Reports/1.9 Stack Testing 2013/NCIA Emissions Testing Report 2013_2014.docx Revision May-2014 Prepared for National Ceramic Industries Australia ABN:
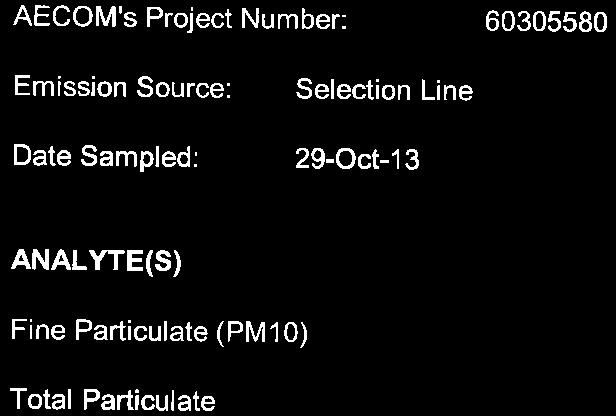
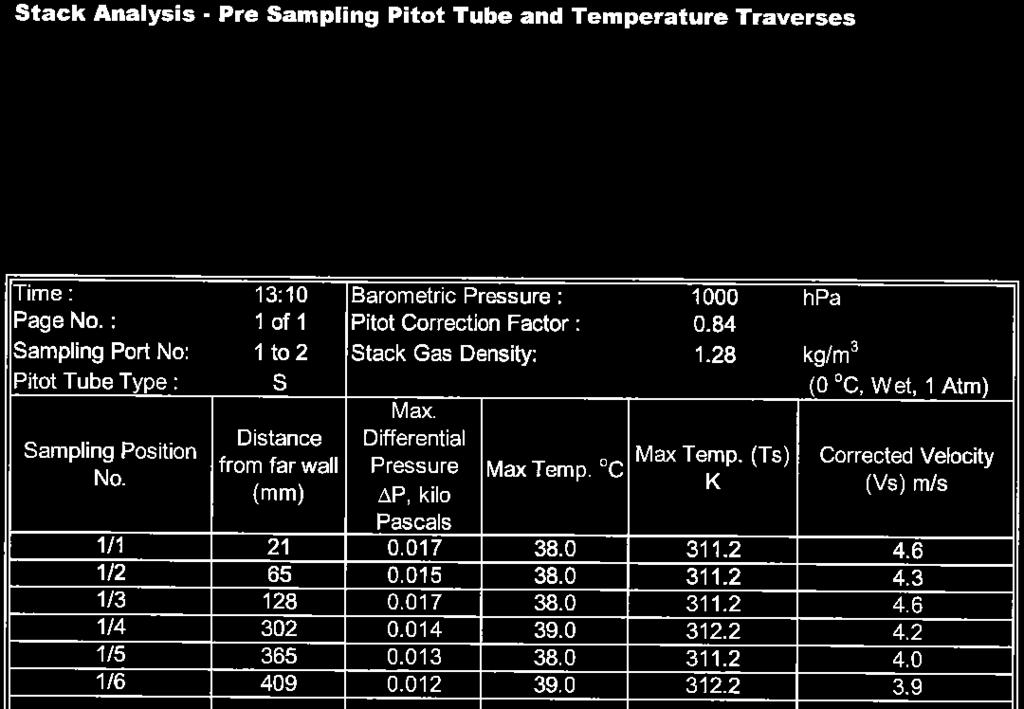
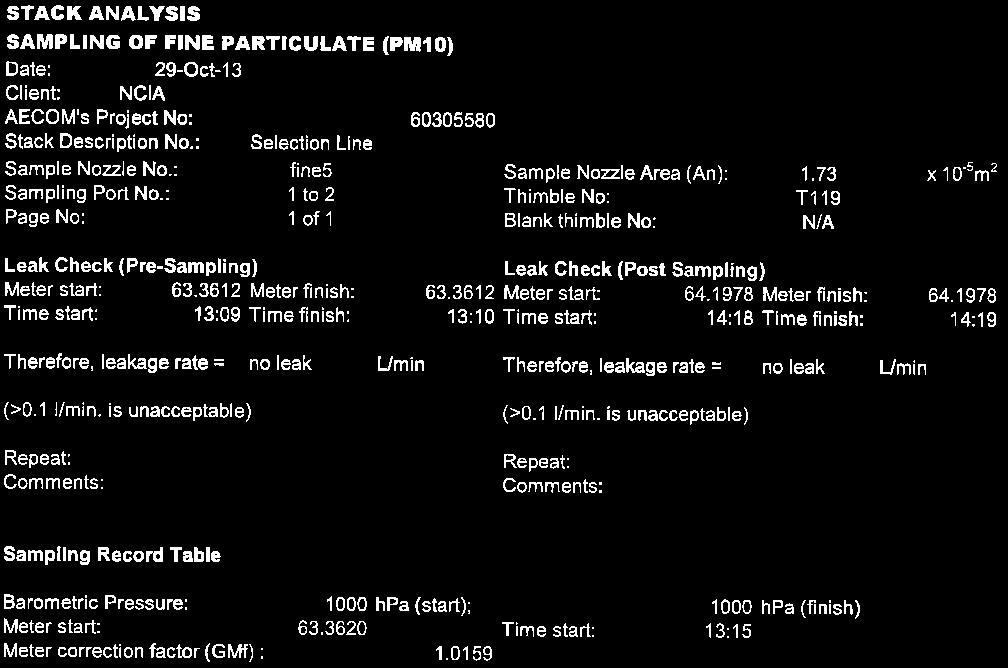
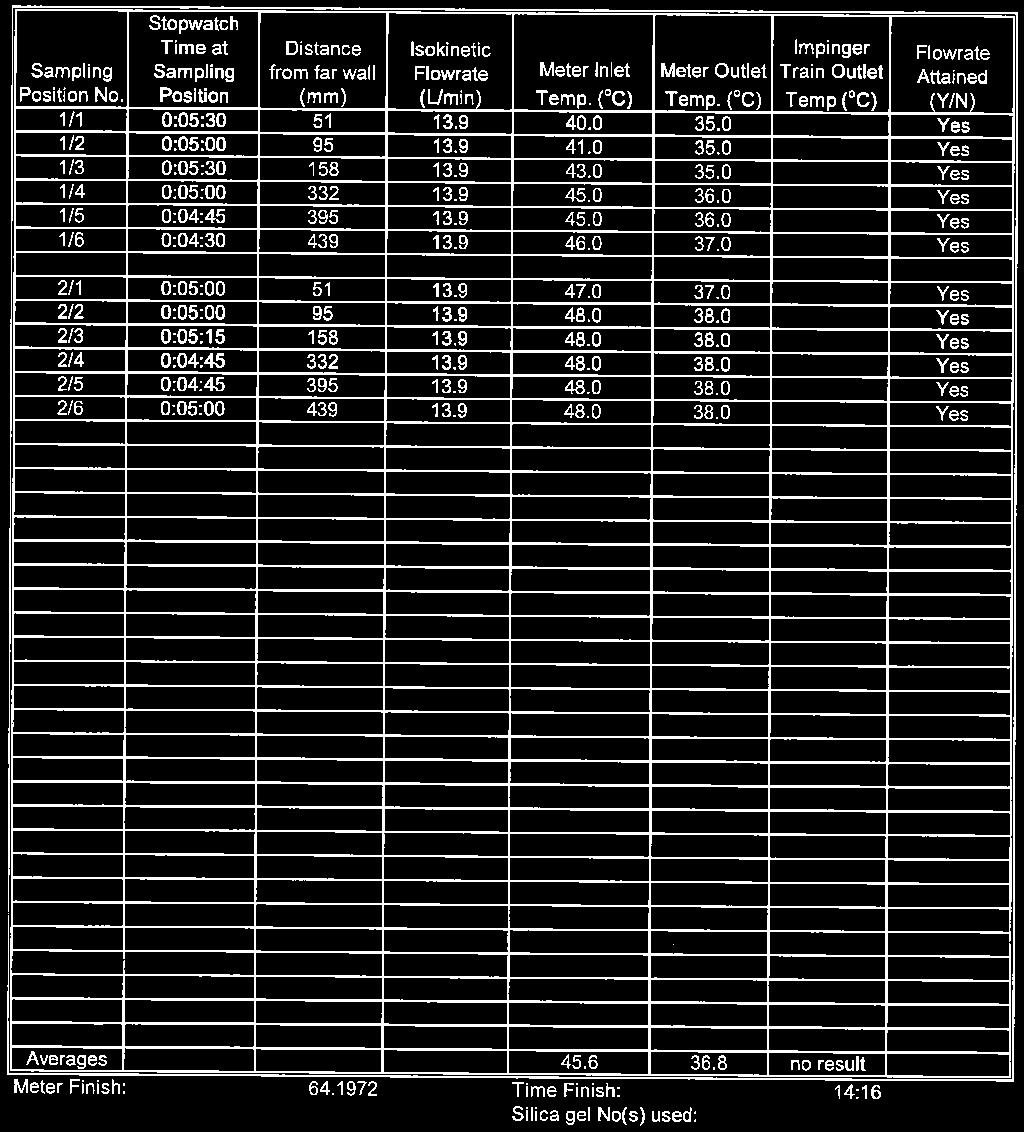
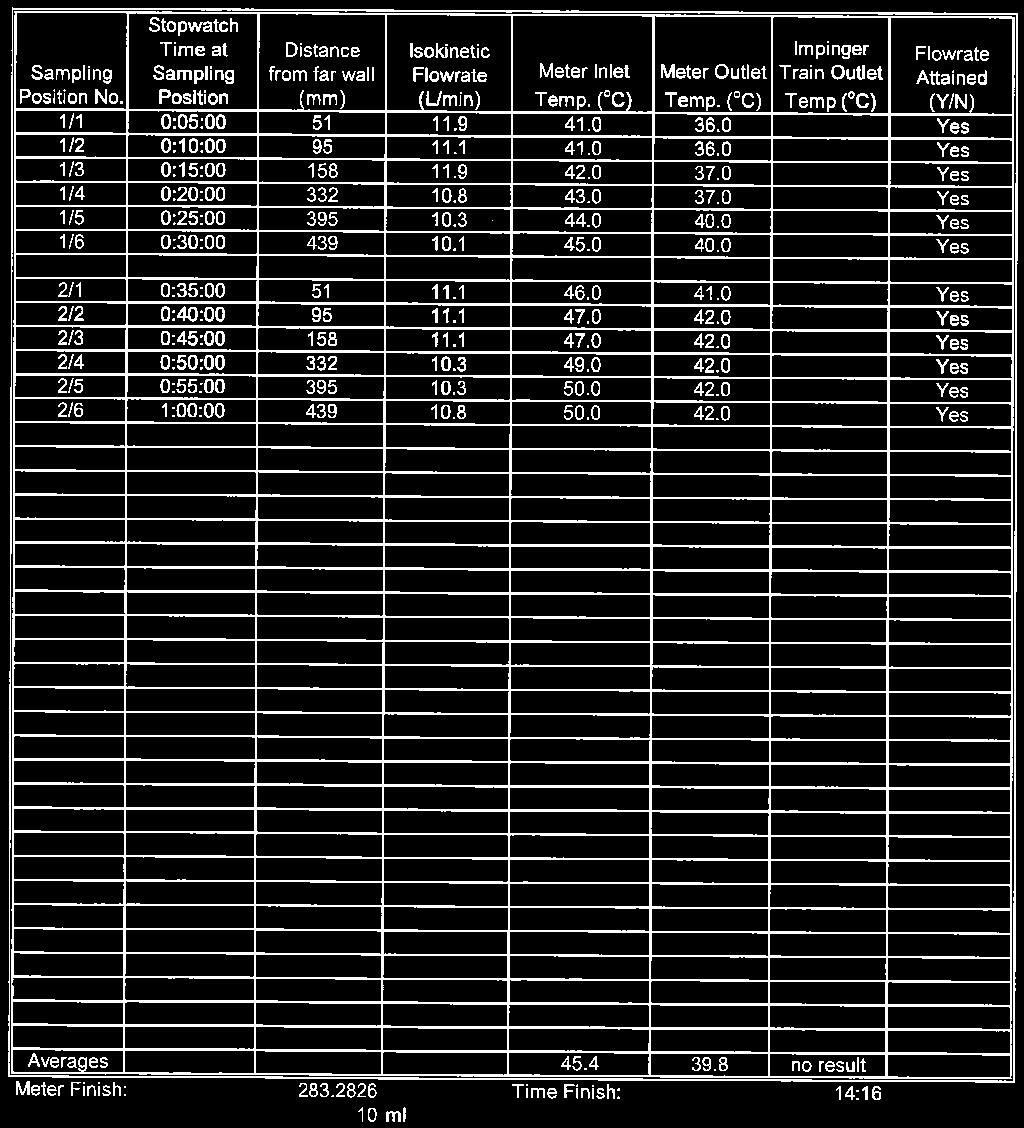
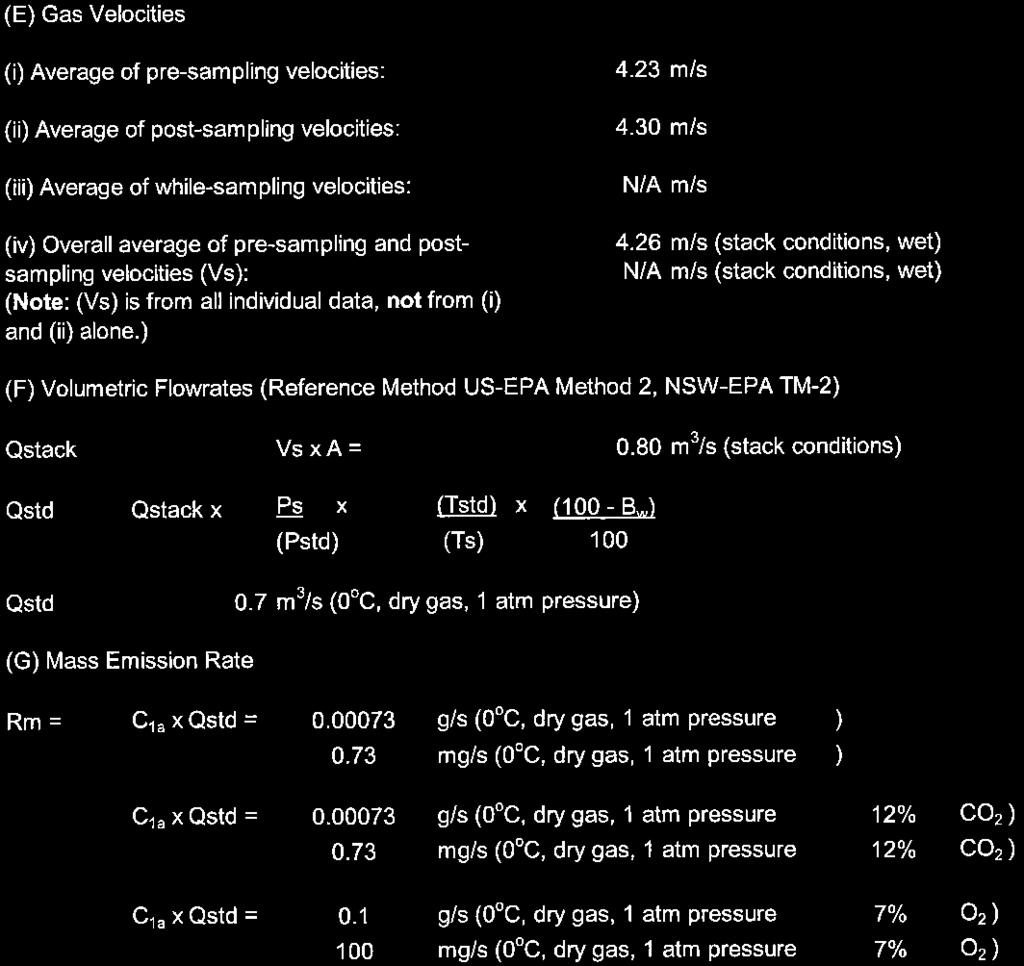
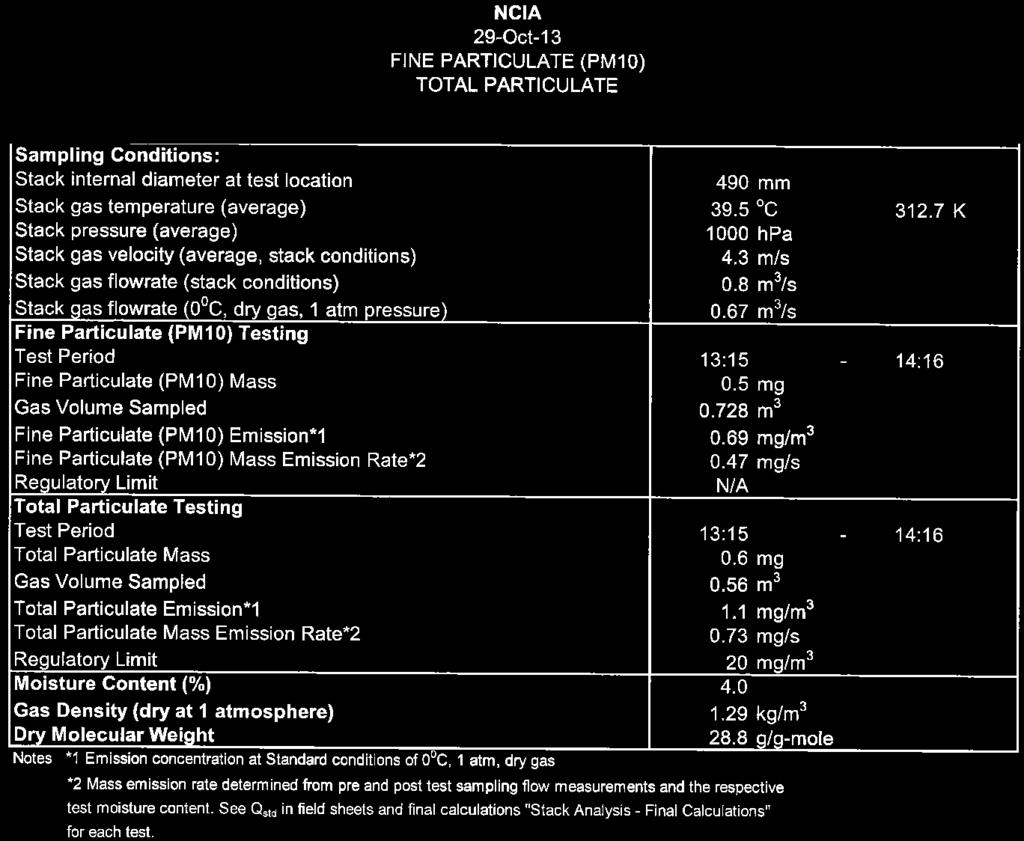
24 AECOM Emissions Testing Report National Ceramic Industries Australia Commercial-in-Confidence 18 Table 12 Selection Line Stack Total Particulate and Fine Particulate (PM 10) Results, 29 October 2013 Sampling Conditions: Stack internal diameter at test location 490 mm Stack gas temperature (average) 39.5 o C K Stack pressure (average) 1000 hpa Stack gas velocity (average, stack conditions) 4.3 m/s Stack gas flowrate (stack conditions) 0.8 m 3 /s Stack gas flowrate (0 0 C, dry gas, 1 atm pressure) 0.67 m 3 /s Fine Particulate (PM 10) Testing Test Period 13:15-14:16 Fine Particulate (PM 10) Mass 0.5 mg Gas Volume Sampled m 3 Fine Particulate (PM 10) Emission* mg/m 3 Fine Particulate (PM 10) Mass Emission Rate* mg/s Regulatory Limit N/A Total Particulate Testing Test Period 13:15-14:16 Total Particulate Mass 0.6 mg Gas Volume Sampled 0.56 m 3 Total Particulate Emission* mg/m 3 Total Particulate Mass Emission Rate* mg/s Regulatory Limit 20 mg/m 3 Moisture Content (%) 4.0 Gas Density (dry at 1 atmosphere) 1.29 kg/m 3 Dry Molecular Weight 28.8 g/g-mole Notes *1 Emission concentration at Standard conditions of 0 0 C, 1 atm, dry gas *2 Mass emission rate determined from pre and post-test sampling flow measurements and the respective test moisture content. See Q std in field sheets and final calculations "Stack Analysis - Final Calculations" for each test. Reports/1.9 Stack Testing 2013/NCIA Emissions Testing Report 2013_2014.docx Revision May-2014 Prepared for National Ceramic Industries Australia ABN:
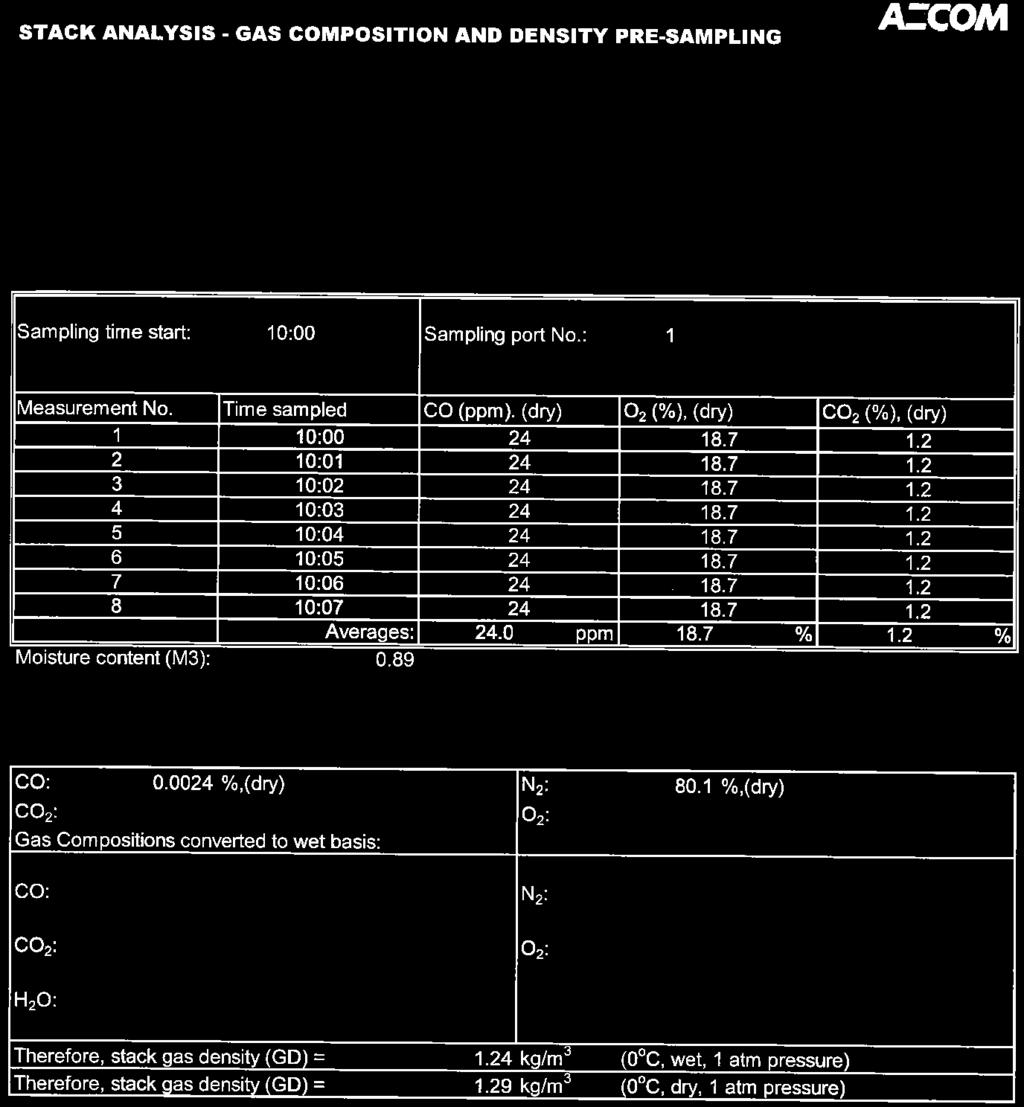
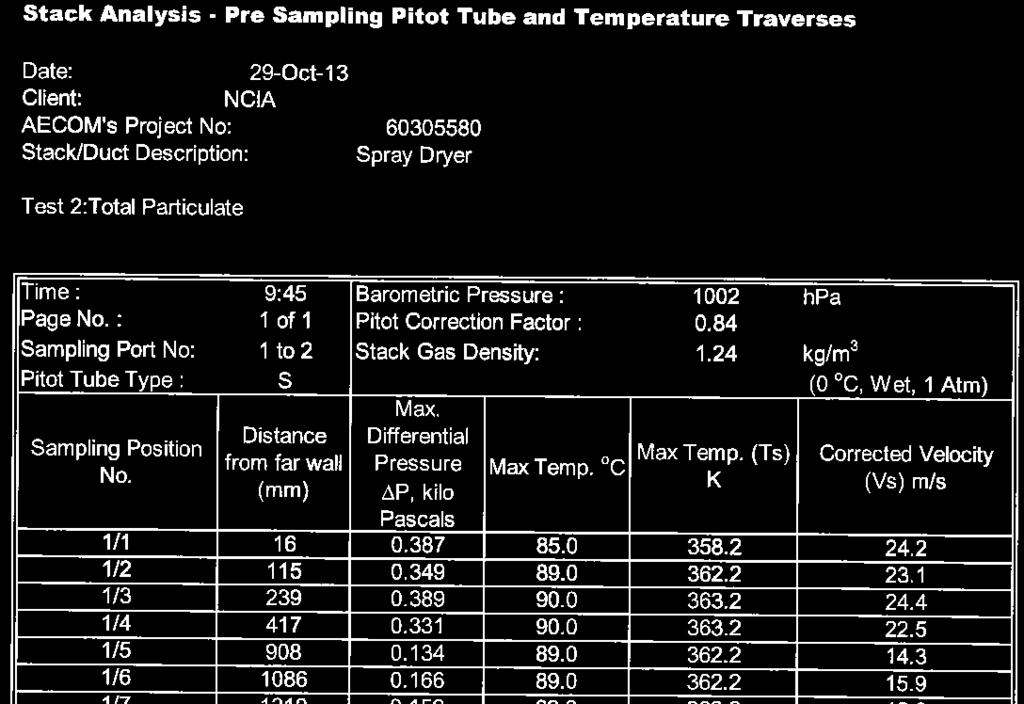
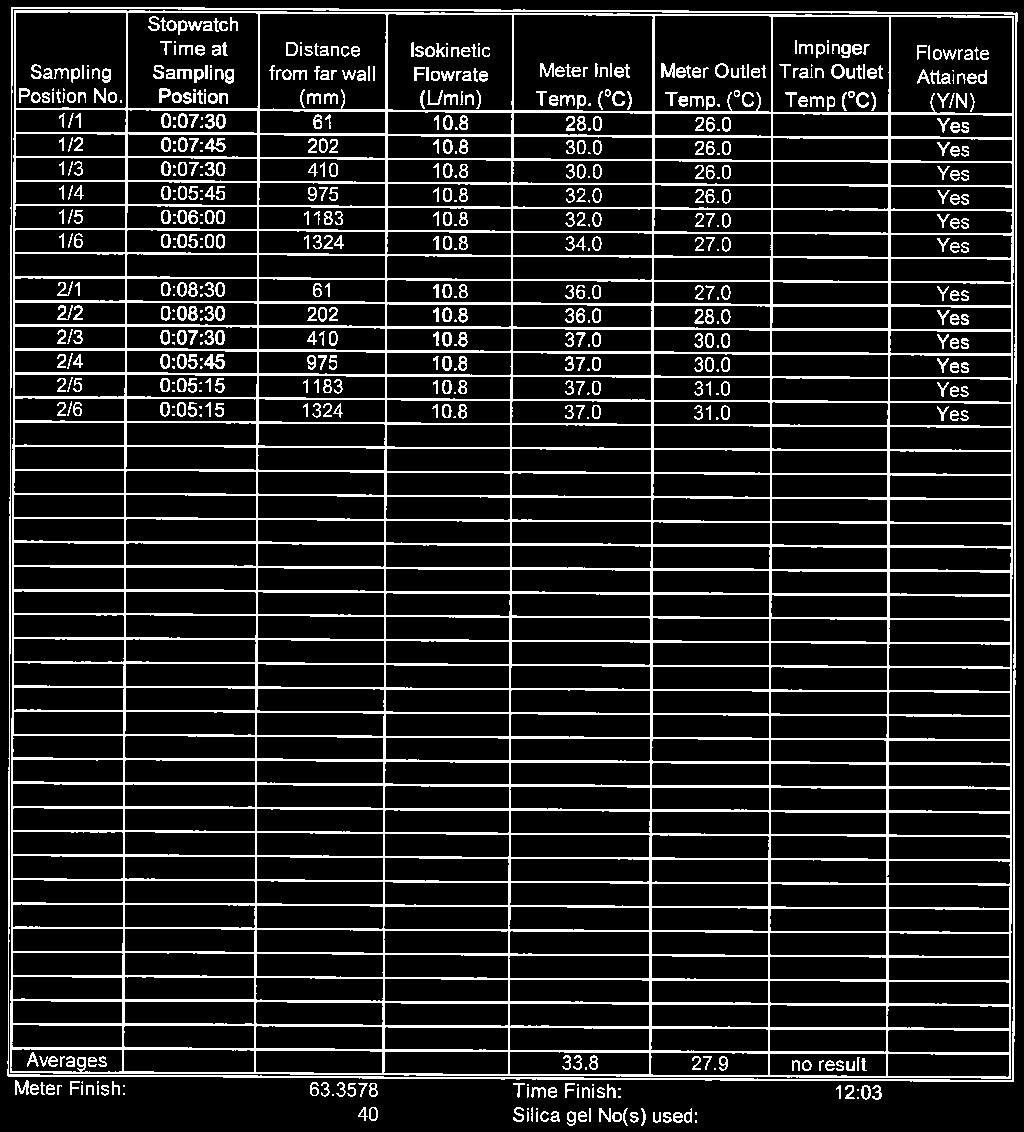
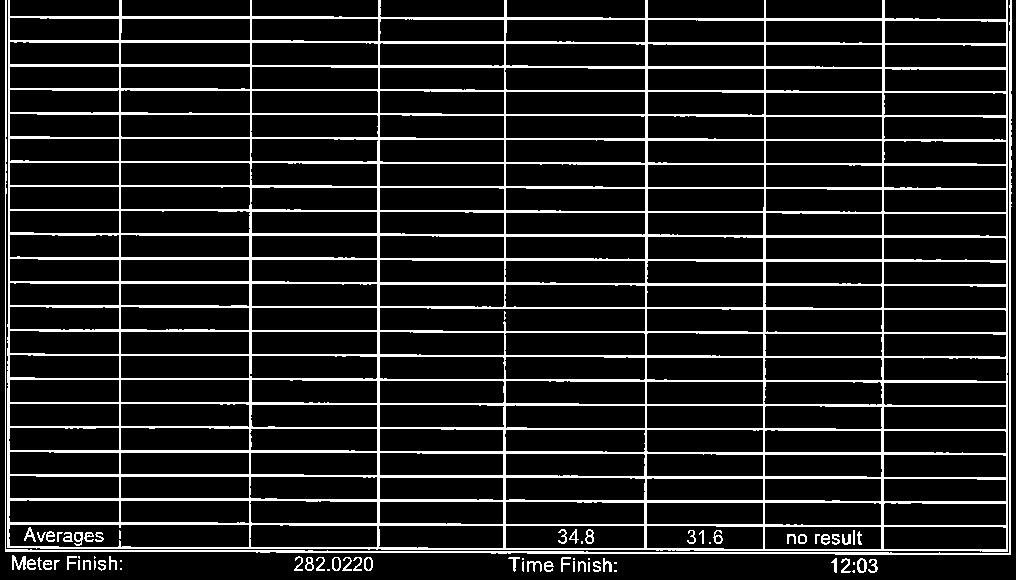
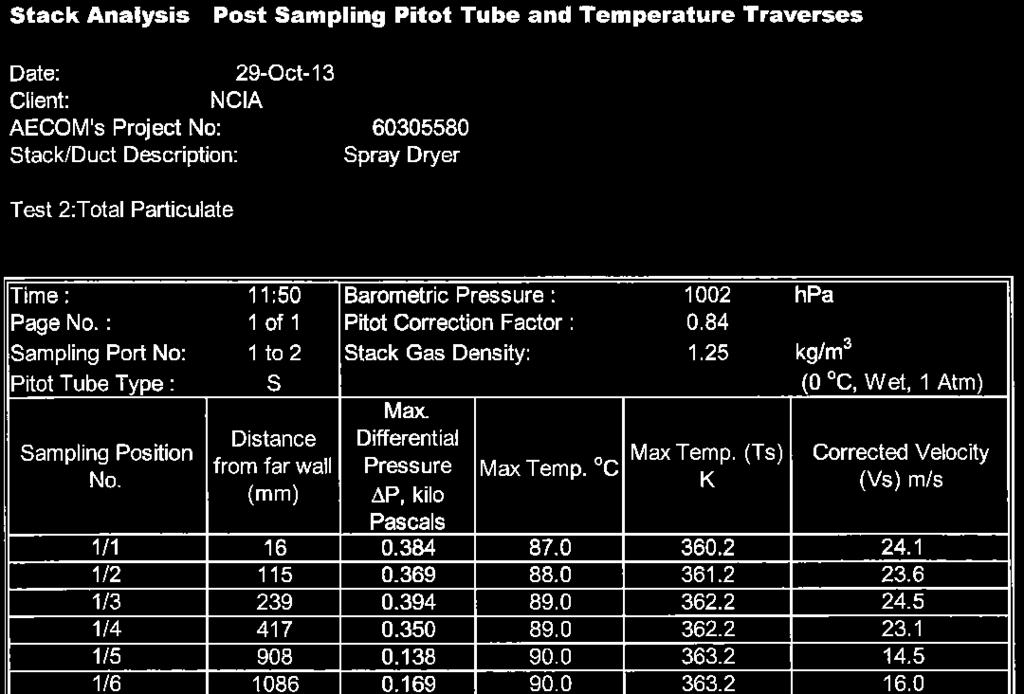
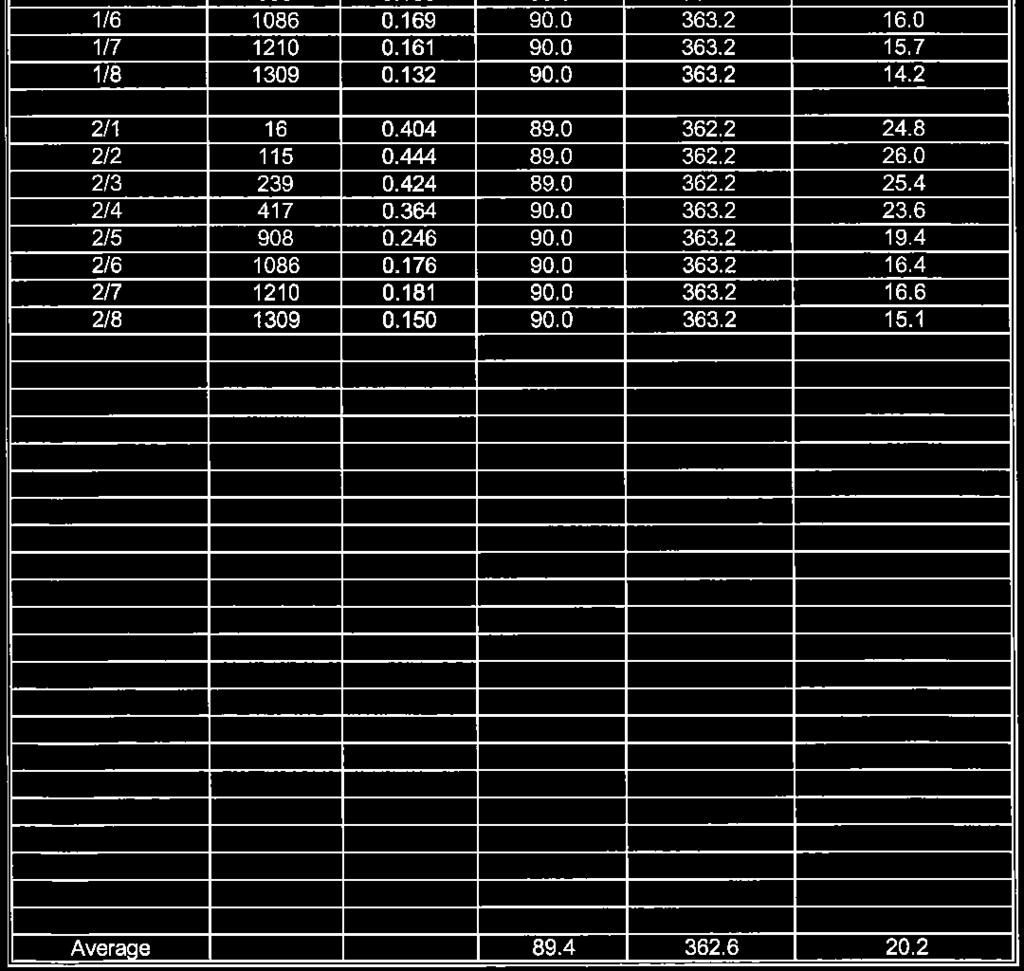
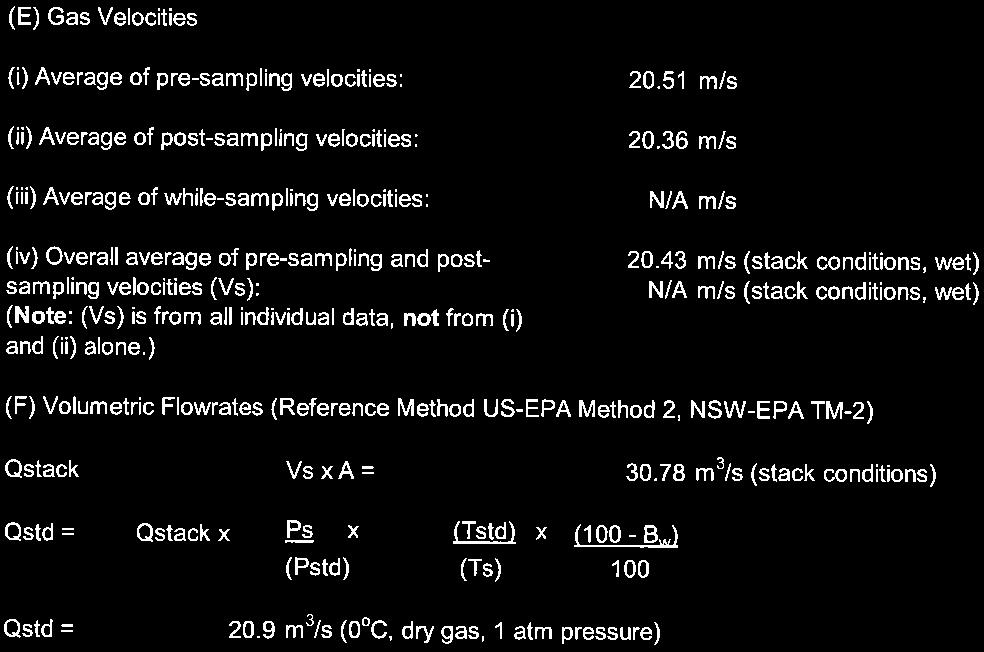
25 AECOM Emissions Testing Report National Ceramic Industries Australia Commercial-in-Confidence 19 Table 13 Spray Dryer Stack Total Particulate and Fine Particulate (PM 10) Results, 29 October 2013 Sampling Conditions: Stack internal diameter at test location 1385 mm Stack gas temperature (average) 89.1 o C K Stack pressure (average) 1000 hpa Stack gas velocity (average, stack conditions) 20 m/s Stack gas flowrate (stack conditions) 31 m 3 /s Stack gas flowrate (0 0 C, dry gas, 1 atm pressure) 21 m 3 /s Fine Particulate (PM 10) Testing Test Period 10:43-12:03 Fine Particulate (PM 10) Mass 4.3 mg Gas Volume Sampled m 3 Fine Particulate (PM 10) Emission* mg/m 3 Fine Particulate (PM 10) Mass Emission Rate* mg/s Regulatory Limit N/A Total Particulate Testing Test Period 10:43-12:03 Total Particulate Mass 8.3 mg Gas Volume Sampled m 3 Total Particulate Emission* 1 13 mg/m 3 Total Particulate Mass Emission Rate* mg/s Regulatory Limit 20 mg/m 3 Moisture Content (%) 9.9 Gas Density (dry at 1 atmosphere) 1.29 kg/m 3 Dry Molecular Weight 28.9 g/g-mole Notes *1 Emission concentration at Standard conditions of 0 0 C, 1 atm, dry gas *2 Mass emission rate determined from pre and post-test sampling flow measurements and the respective test moisture content. See Q std in field sheets and final calculations "Stack Analysis - Final Calculations" for each test. Reports/1.9 Stack Testing 2013/NCIA Emissions Testing Report 2013_2014.docx Revision May-2014 Prepared for National Ceramic Industries Australia ABN:
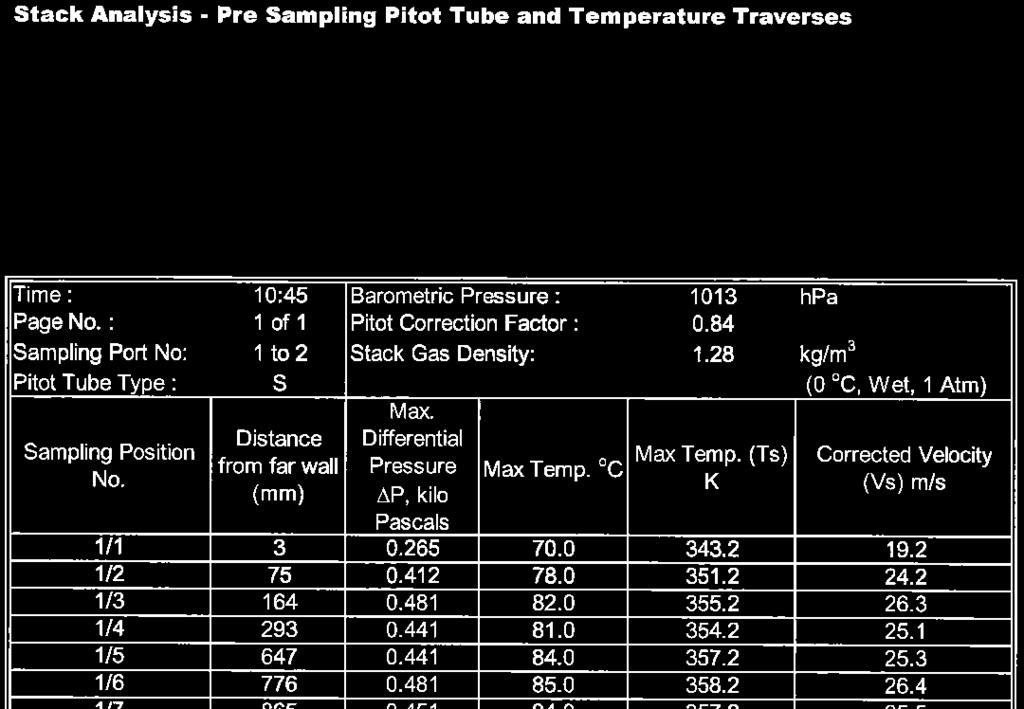
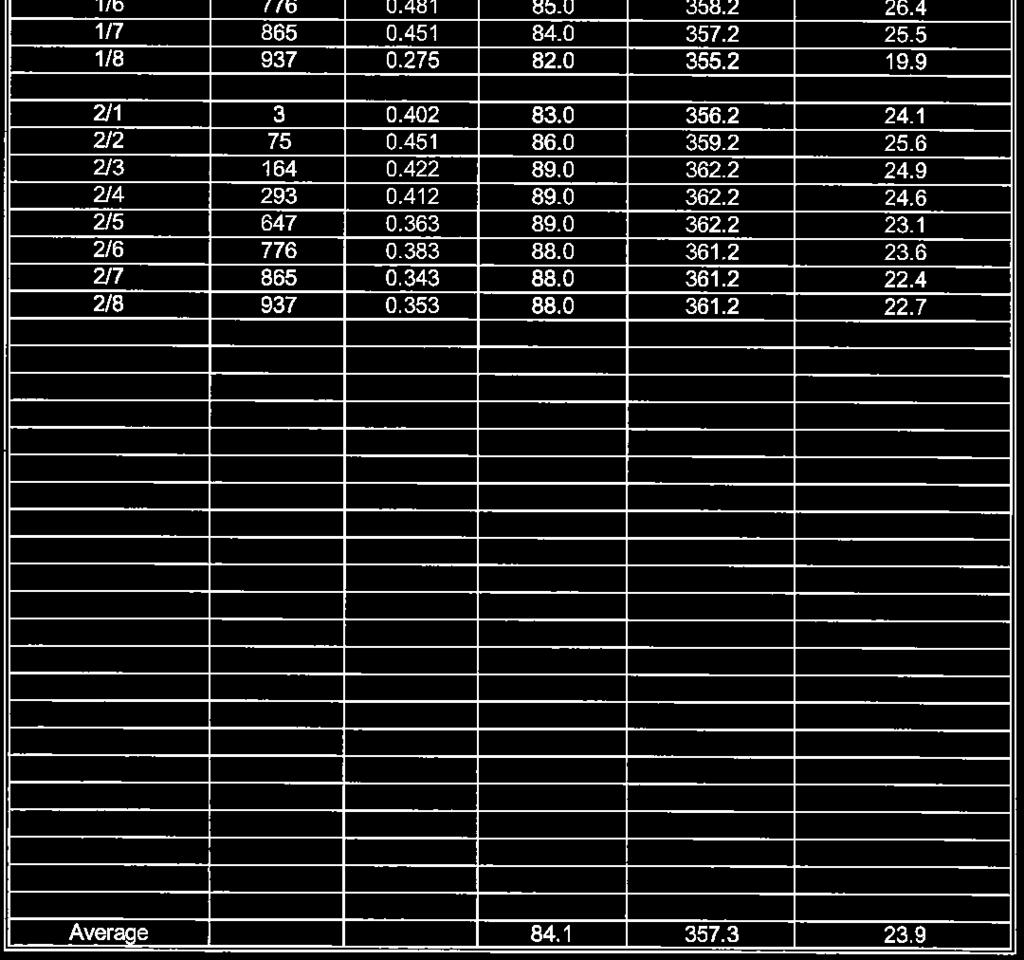
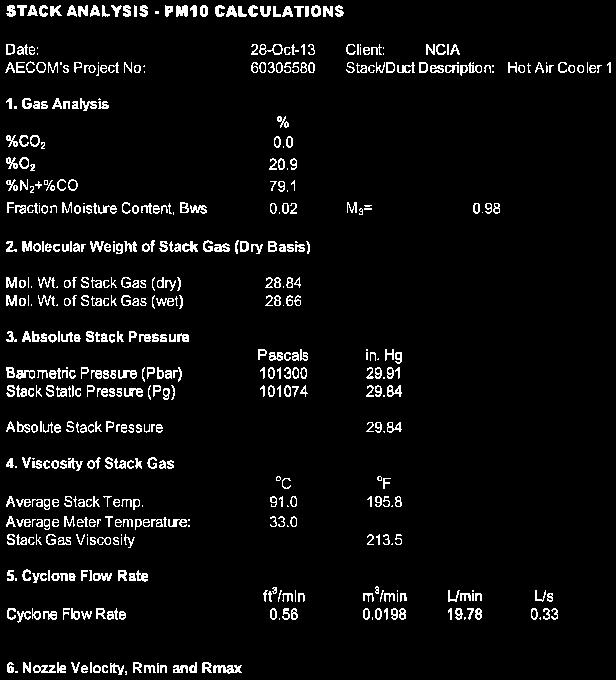
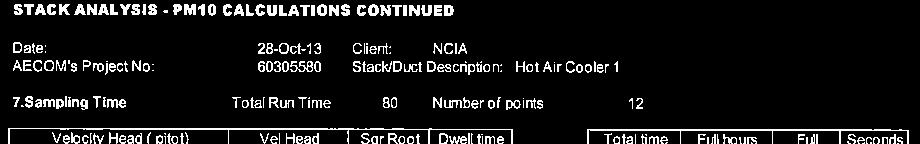
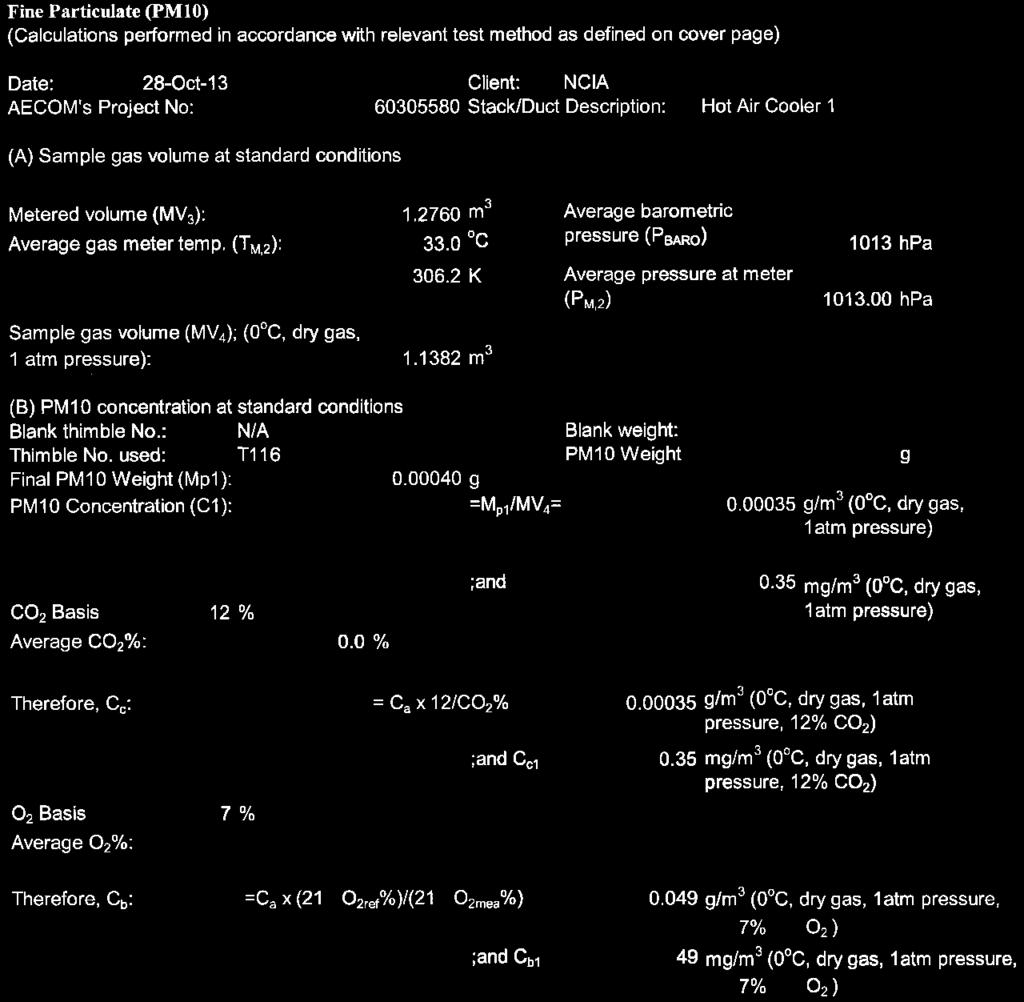
26 AECOM Emissions Testing Report National Ceramic Industries Australia Commercial-in-Confidence 20 Table 14 Hot Air Cooler Stack Total Particulate and Fine Particulate (PM 10) Results, 28 October 2013 Sampling Conditions: Stack internal diameter at test location 1000 mm Stack gas temperature (average) 87.7 o C K Stack pressure (average) 1011 hpa Stack gas velocity (average, stack conditions) 24 m/s Stack gas flowrate (stack conditions) 19 m 3 /s Stack gas flowrate (0 0 C, dry gas, 1 atm pressure) 14 m 3 /s Fine Particulate (PM 10) Testing Test Period 11:25-12:46 Fine Particulate (PM 10) Mass 0.4 mg Gas Volume Sampled 1.14 m 3 Fine Particulate (PM 10) Emission* mg/m 3 Fine Particulate (PM 10) Mass Emission Rate* mg/s Regulatory Limit N/A Total Particulate Testing Test Period 11:25-12:46 Total Particulate Mass 0.7 mg Gas Volume Sampled 1.16 m 3 Total Particulate Emission* mg/m 3 Total Particulate Mass Emission Rate* mg/s Regulatory Limit 5 mg/m 3 Moisture Content (%) 1.6 Gas Density (dry at 1 atmosphere) 1.29 kg/m 3 Dry Molecular Weight 28.8 g/g-mole Notes *1 Emission concentration at Standard conditions of 0 0 C, 1 atm, dry gas *2 Mass emission rate determined from pre and post-test sampling flow measurements and the respective test moisture content. See Q std in field sheets and final calculations "Stack Analysis - Final Calculations" for each test. Reports/1.9 Stack Testing 2013/NCIA Emissions Testing Report 2013_2014.docx Revision May-2014 Prepared for National Ceramic Industries Australia ABN:
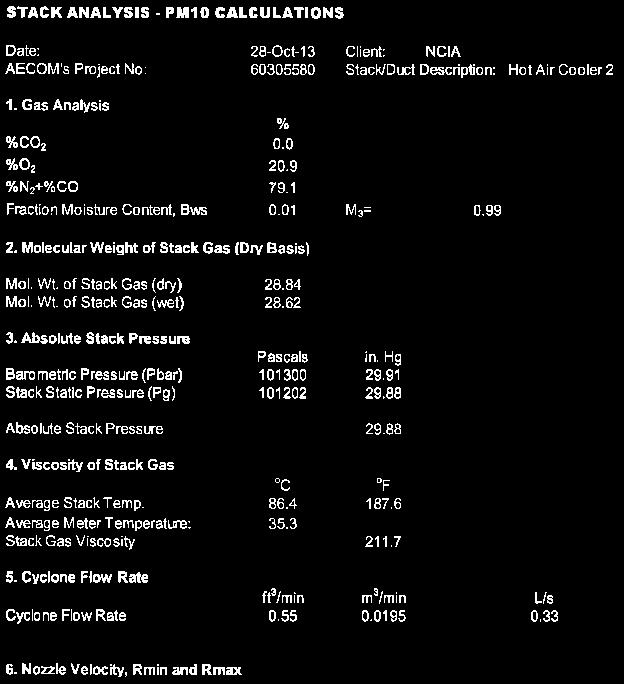
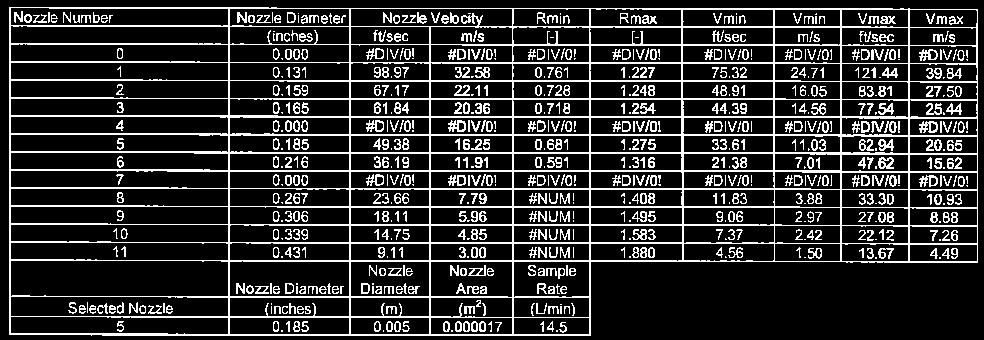
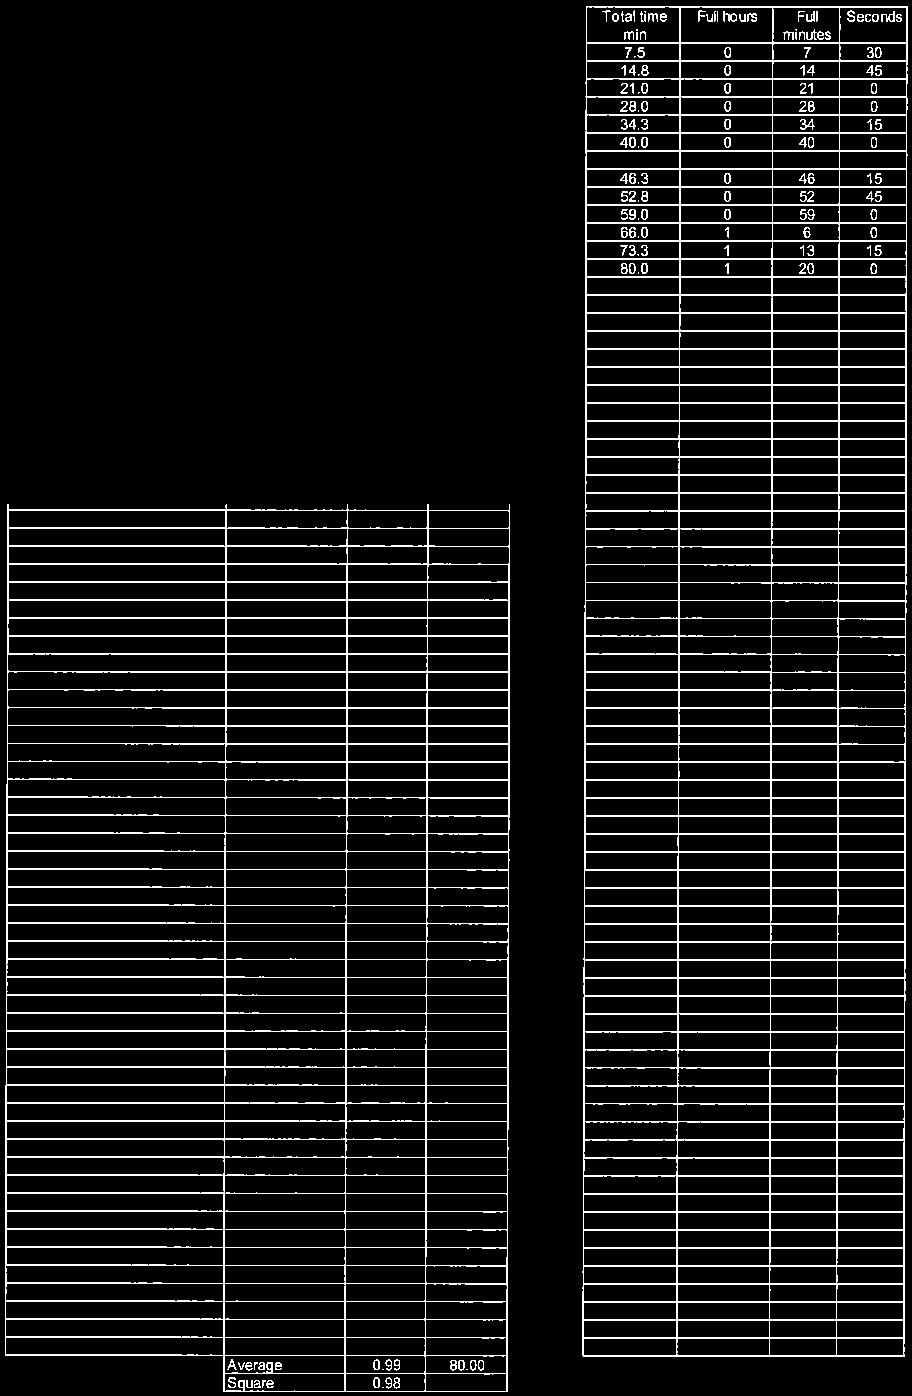
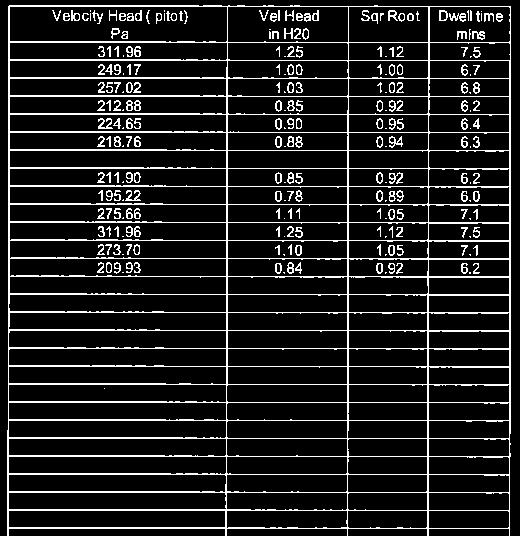
27 AECOM Emissions Testing Report National Ceramic Industries Australia Commercial-in-Confidence 21 Table 15 Hot Air Cooler 2 Stack Total Particulate and Fine Particulate (PM 10) Results, 28 October 2013 Sampling Conditions: Stack internal diameter at test location 1200 mm Stack gas temperature (average) 90.0 o C K Stack pressure (average) 1012 hpa Stack gas velocity (average, stack conditions) 19 m/s Stack gas flowrate (stack conditions) 21 m 3 /s Stack gas flowrate (0 0 C, dry gas, 1 atm pressure) 16 m 3 /s Fine Particulate (PM 10) Testing Test Period 13:00-14:22 Fine Particulate (PM 10) Mass 0.3 mg Gas Volume Sampled 1.22 m 3 Fine Particulate (PM 10) Emission* mg/m 3 Fine Particulate (PM 10) Mass Emission Rate* 2 4 mg/s Regulatory Limit N/A Total Particulate Testing Test Period 13:00-14:22 Total Particulate Mass 0.4 mg Gas Volume Sampled m 3 Total Particulate Emission* mg/m 3 Total Particulate Mass Emission Rate* mg/s Regulatory Limit 5 mg/m 3 Moisture Content (%) 1.3 Gas Density (dry at 1 atmosphere) 1.29 kg/m 3 Dry Molecular Weight 28.8 g/g-mole Notes *1 Emission concentration at Standard conditions of 0 0 C, 1 atm, dry gas *2 Mass emission rate determined from pre and post-test sampling flow measurements and the respective test moisture content. See Q std in field sheets and final calculations "Stack Analysis - Final Calculations" for each test. Reports/1.9 Stack Testing 2013/NCIA Emissions Testing Report 2013_2014.docx Revision May-2014 Prepared for National Ceramic Industries Australia ABN:
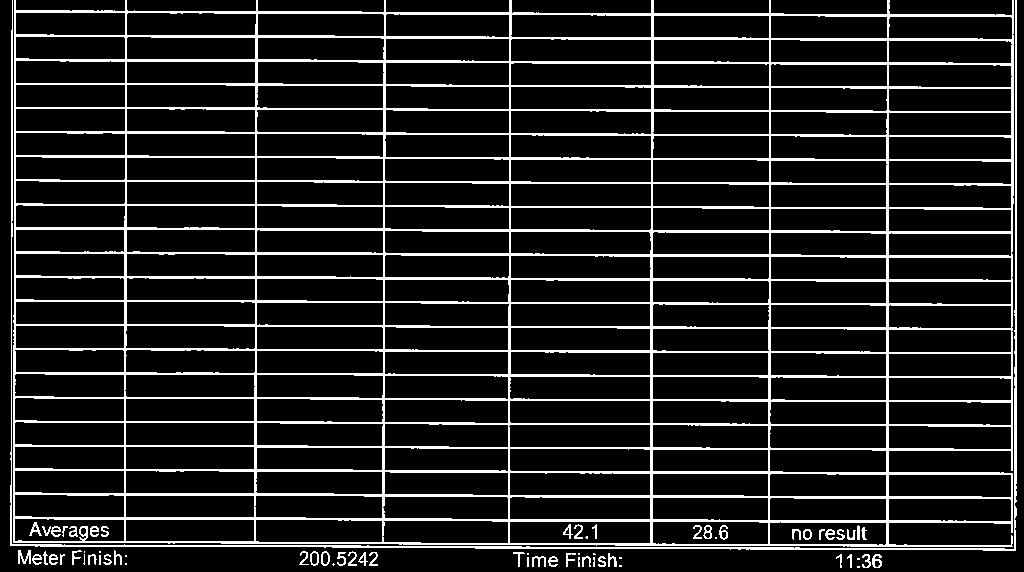
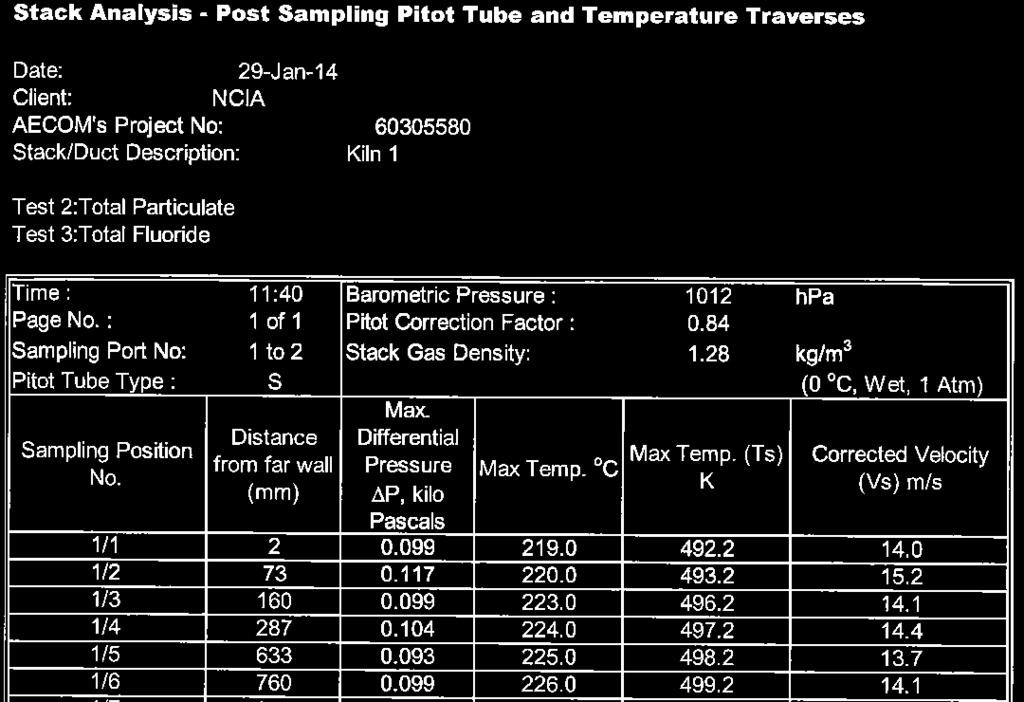
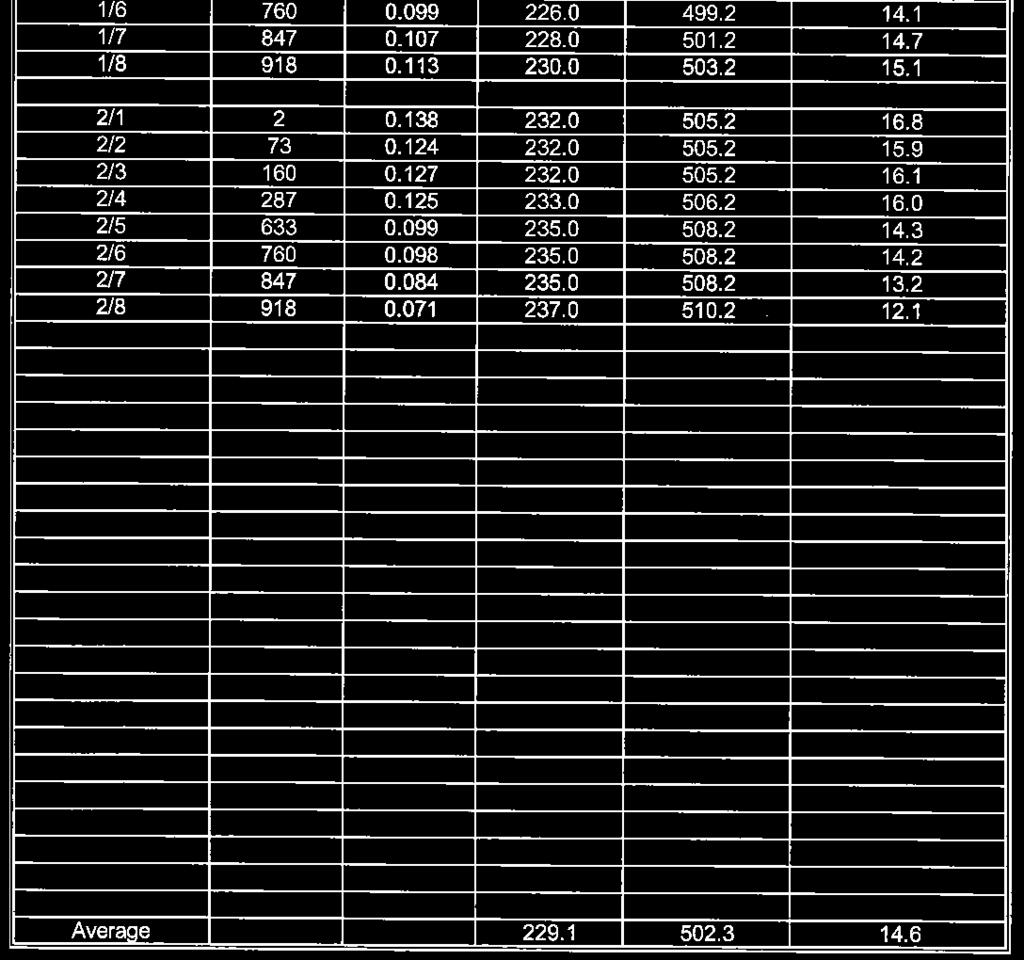
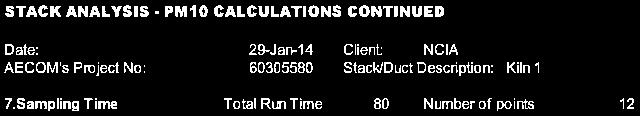
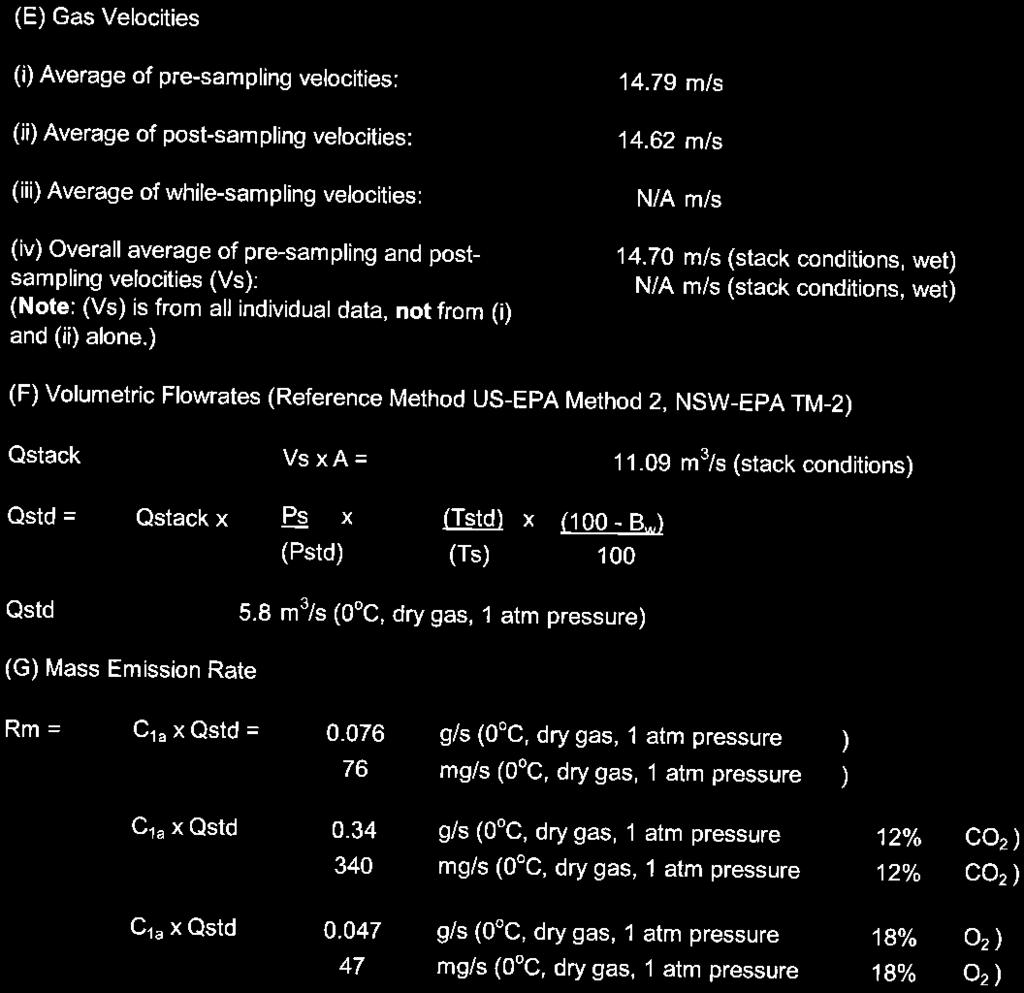
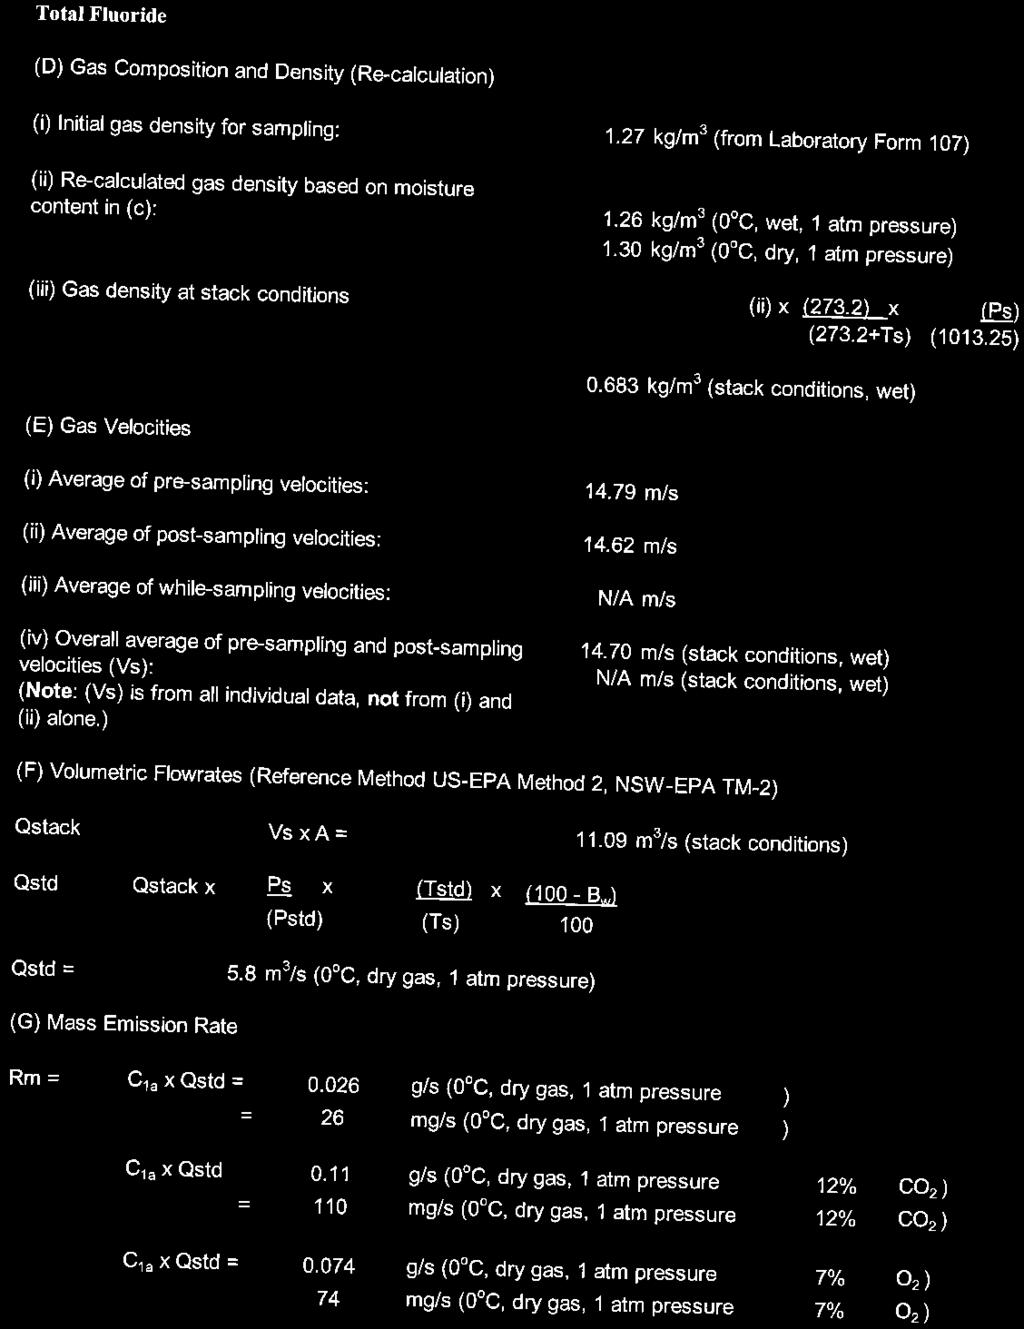
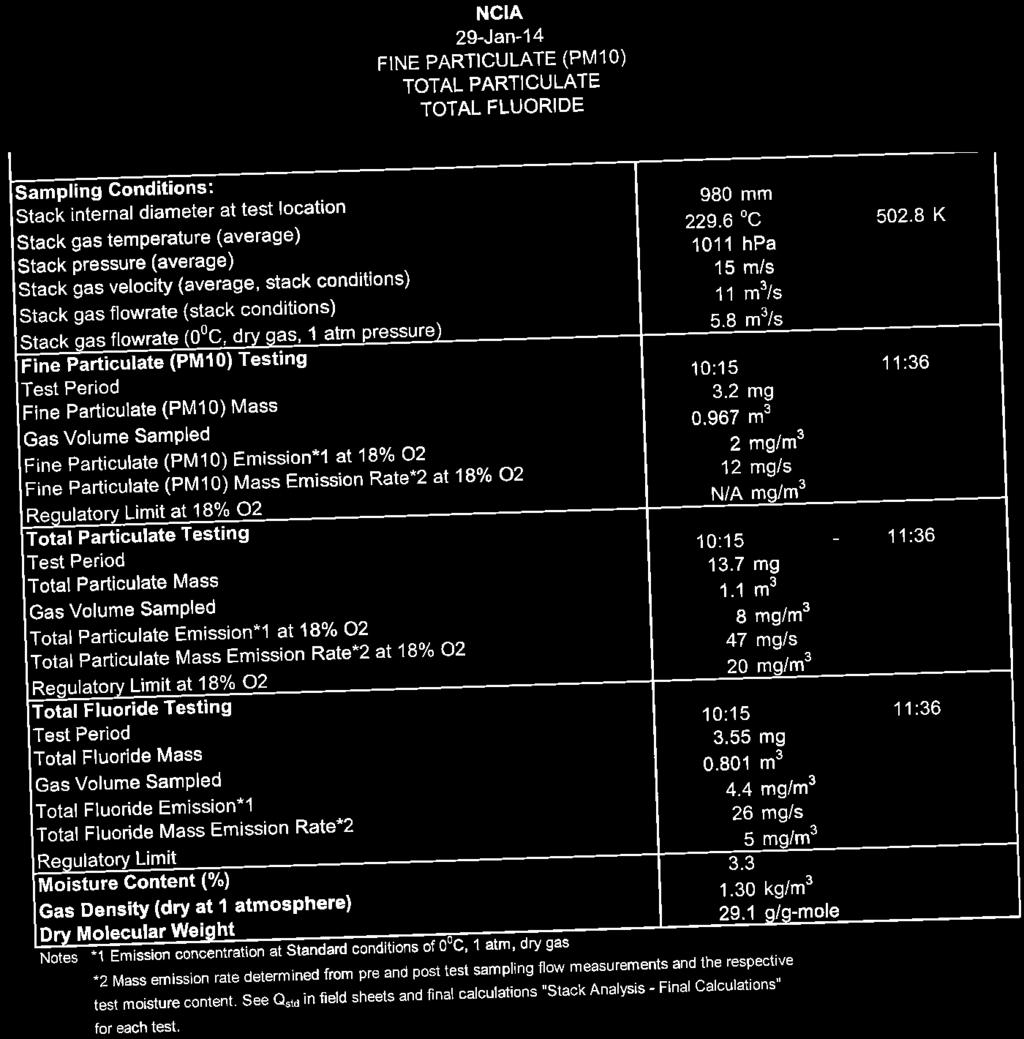
28 AECOM Emissions Testing Report National Ceramic Industries Australia Commercial-in-Confidence 22 Table 16 Kiln 1 Stack Total Particulate, Fine Particulate (PM 10) and Fluoride Results, 29 January 2013 Sampling Conditions: Stack internal diameter at test location 980 mm Stack gas temperature (average) o C K Stack pressure (average) 1011 hpa Stack gas velocity (average, stack conditions) 15 m/s Stack gas flowrate (stack conditions) 11 m 3 /s Stack gas flowrate (0 0 C, dry gas, 1 atm pressure) 5.8 m 3 /s Fine Particulate (PM10) Testing Test Period 10:15-11:36 Fine Particulate (PM 10) Mass 3.2 mg Gas Volume Sampled m 3 Fine Particulate (PM 10) Emission* 1 at 18% O 2 2 mg/m 3 Fine Particulate (PM 10) Mass Emission Rate* 2 at 18% O 2 12 mg/s Regulatory Limit at 18% O 2 N/A Total Particulate Testing Test Period 10:15-11:36 Total Particulate Mass 13.7 mg Gas Volume Sampled 1.1 m 3 Total Particulate Emission* 1 at 18% O 2 8 mg/m 3 Total Particulate Mass Emission Rate* 2 at 18% O 2 47 mg/s Regulatory Limit at 18% O 2 20 mg/m 3 Total Fluoride Testing Test Period 10:15-11:36 Total Fluoride Mass 3.55 mg Gas Volume Sampled m 3 Total Fluoride Emission* mg/m 3 Total Fluoride Mass Emission Rate* 2 26 mg/s Regulatory Limit 5 mg/m 3 Moisture Content (%) 3.3 Gas Density (dry at 1 atmosphere) 1.30 kg/m 3 Dry Molecular Weight 29.1 g/g-mole Notes *1 Emission concentration at Standard conditions of 0 0 C, 1 atm, dry gas *2 Mass emission rate determined from pre and post-test sampling flow measurements and the respective test moisture content. See Q std in field sheets and final calculations "Stack Analysis - Final Calculations" for each test. Reports/1.9 Stack Testing 2013/NCIA Emissions Testing Report 2013_2014.docx Revision May-2014 Prepared for National Ceramic Industries Australia ABN:
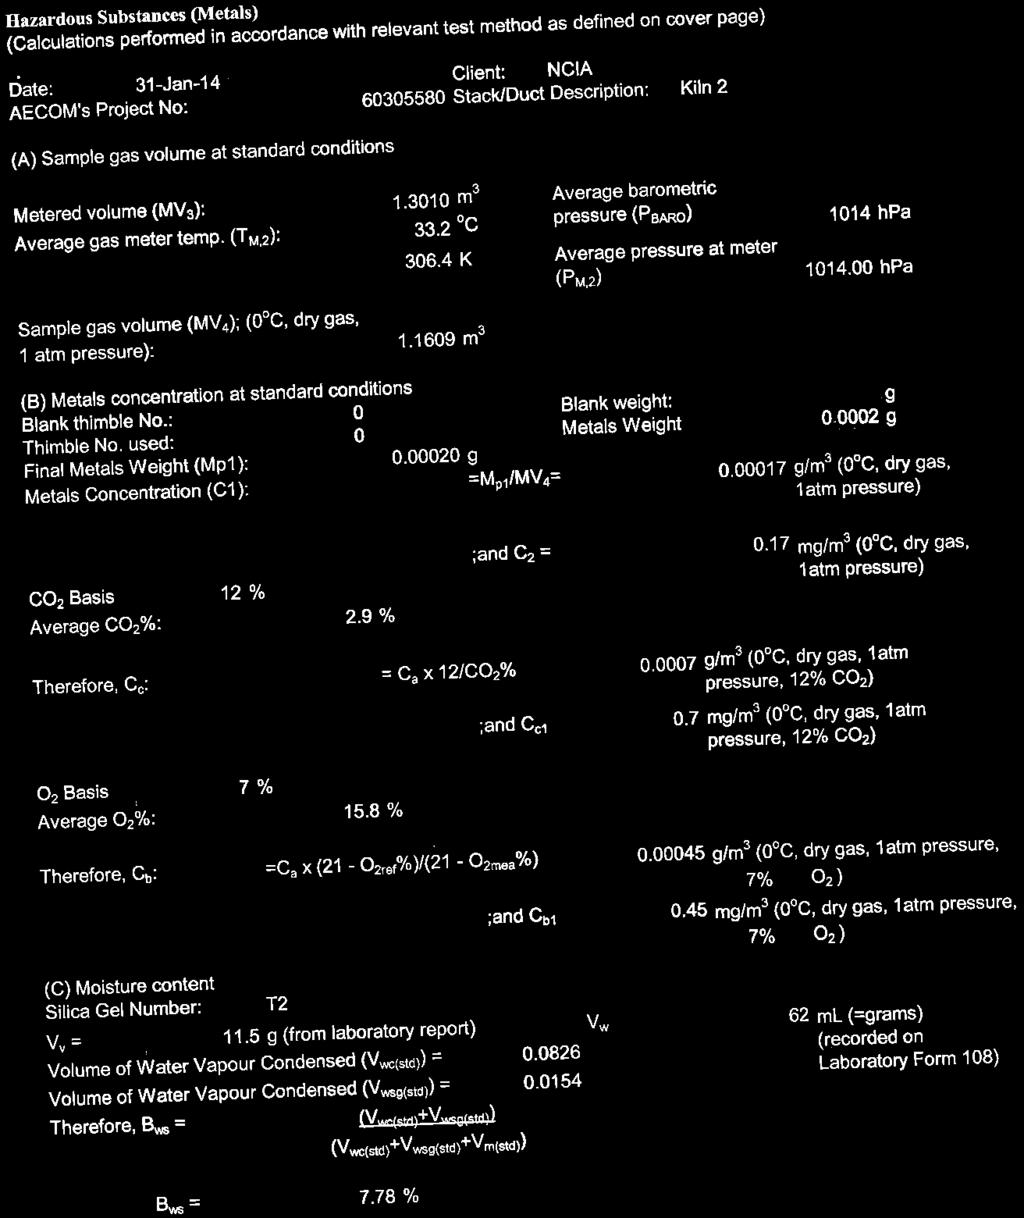
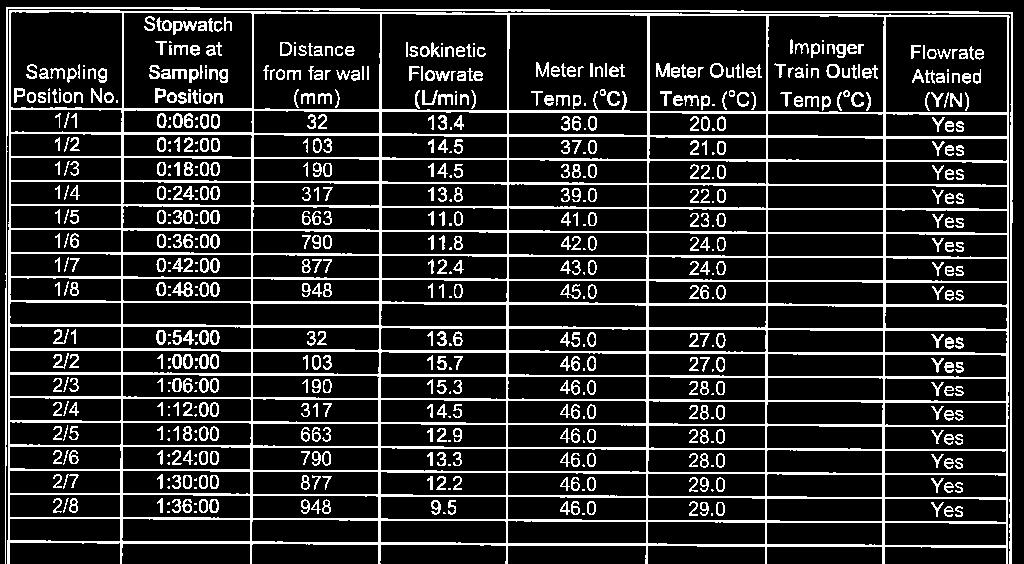
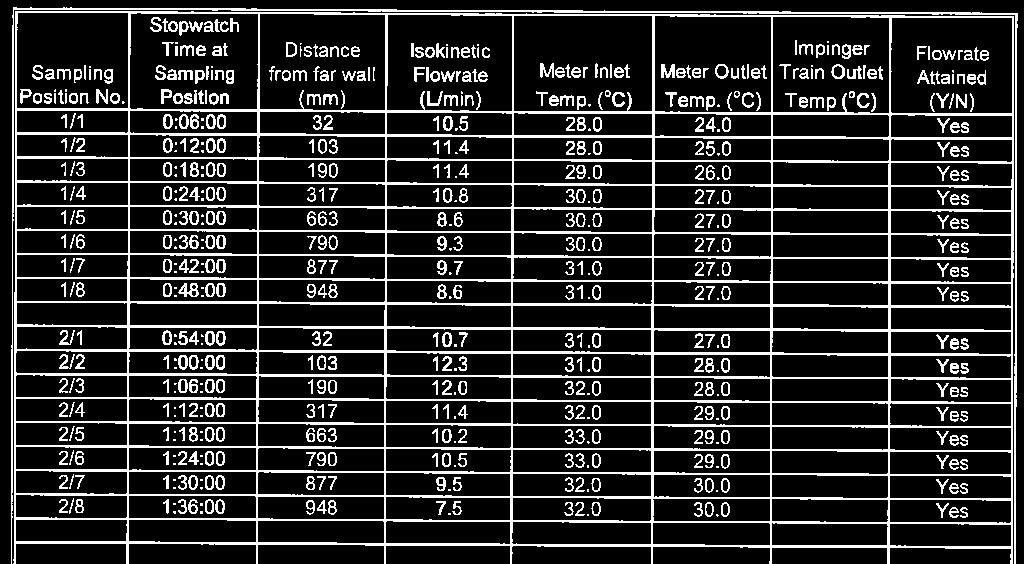
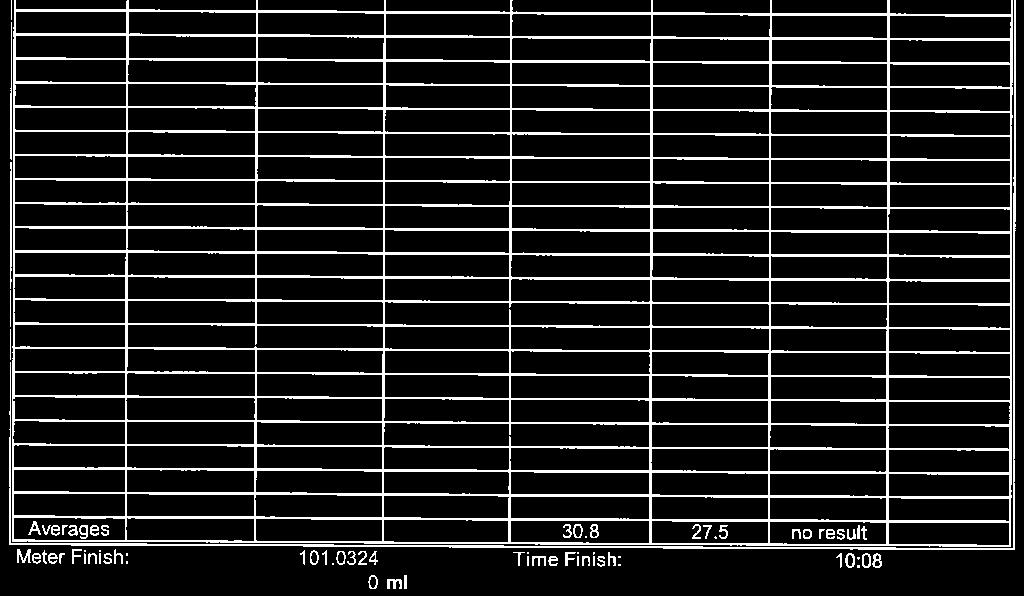
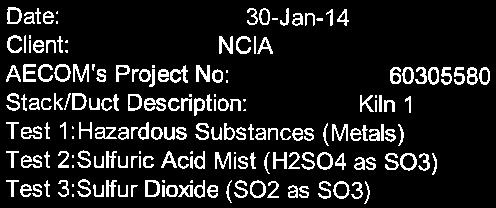
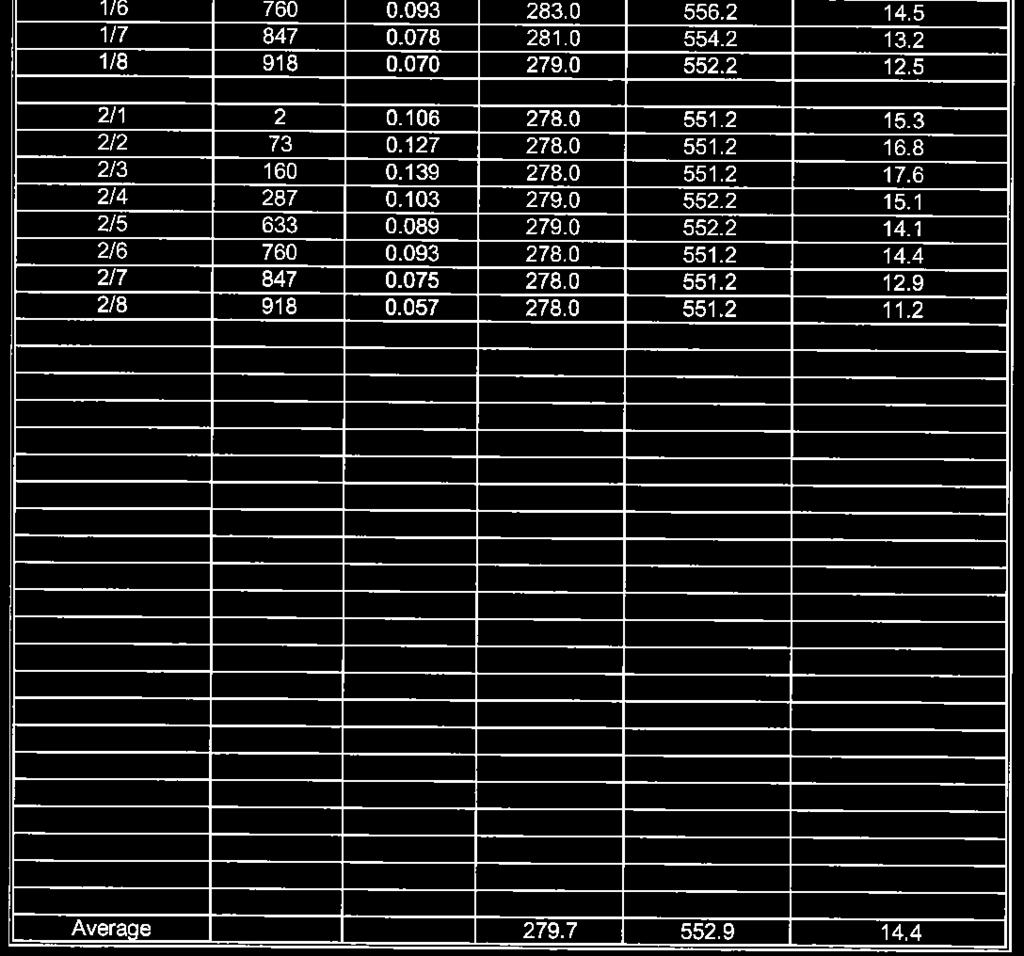
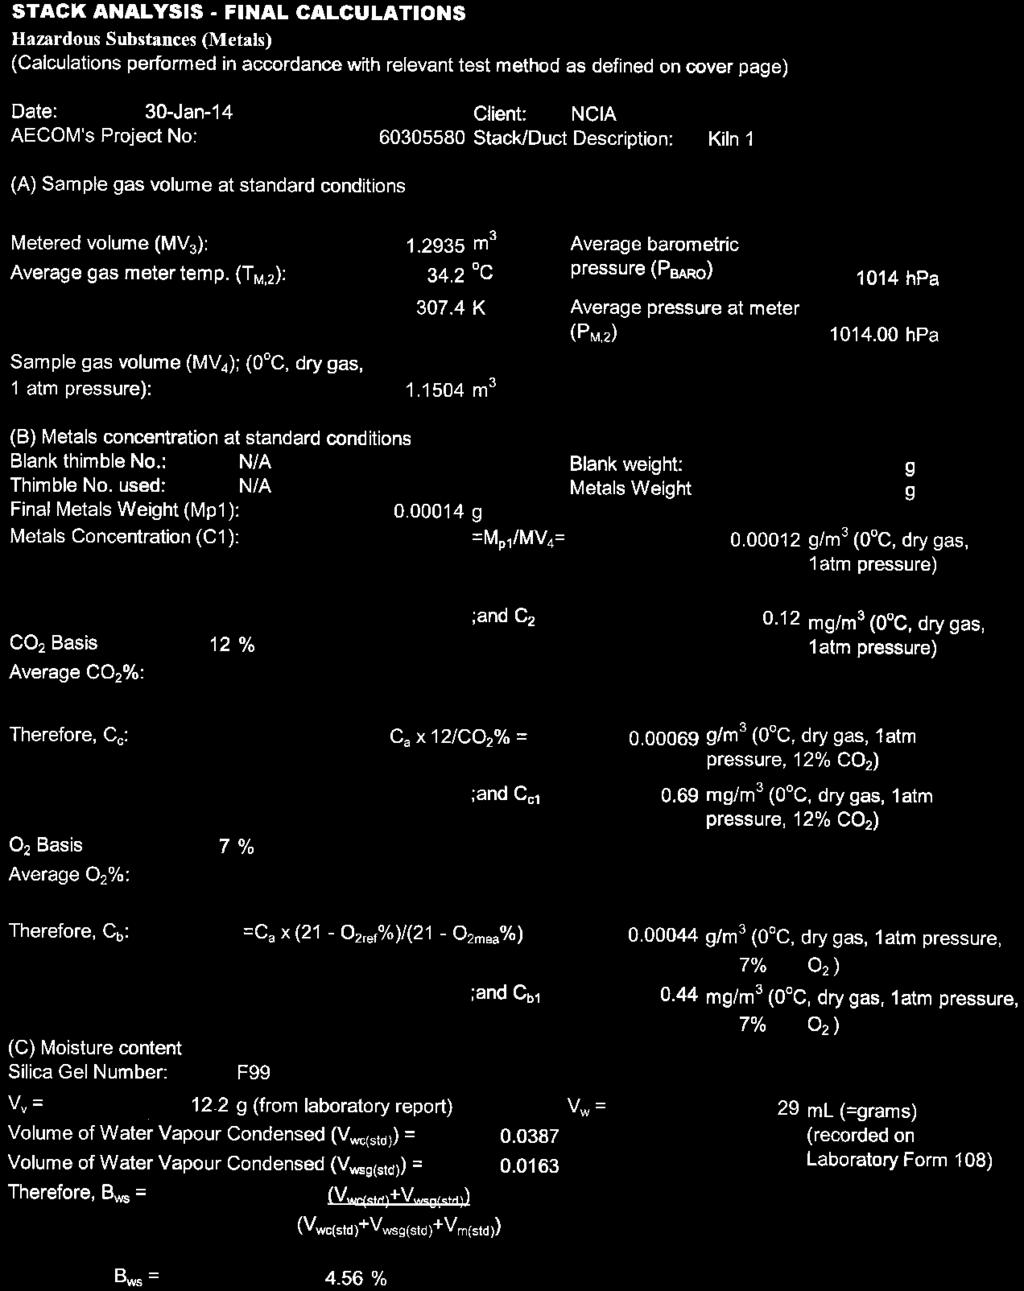
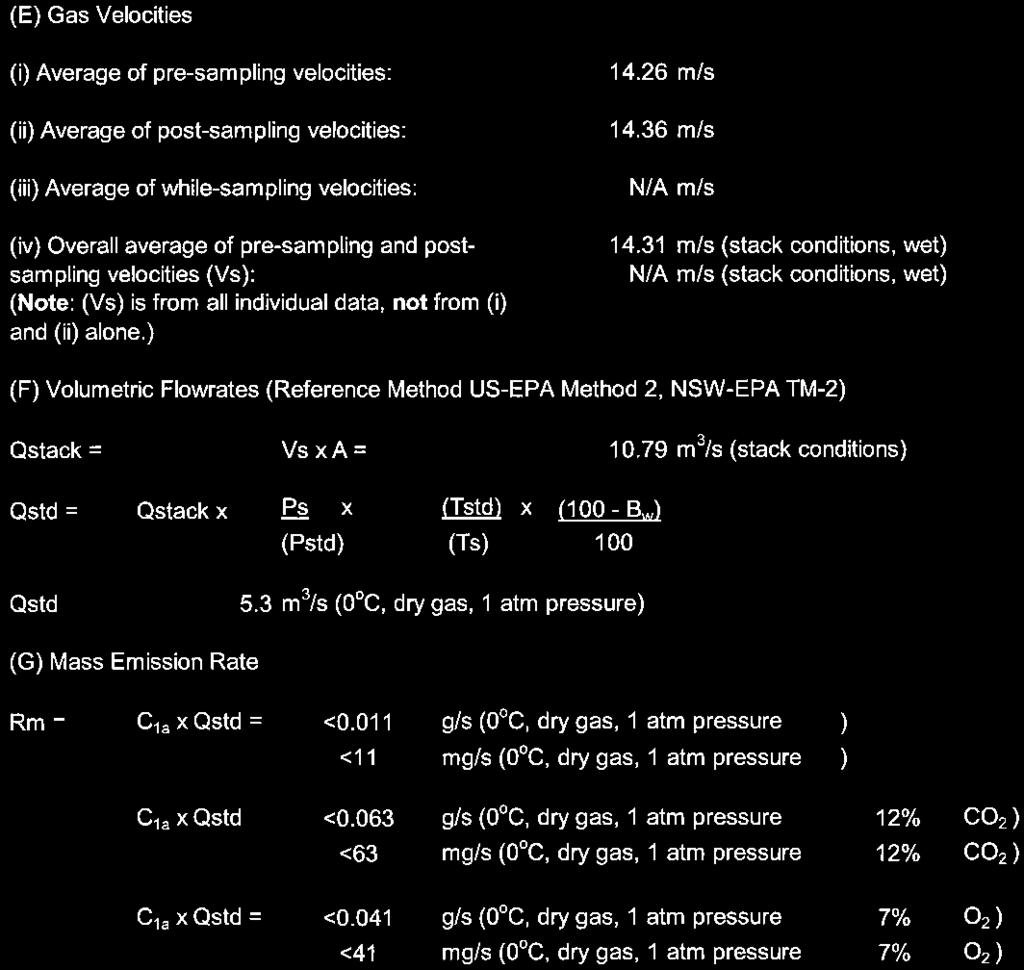
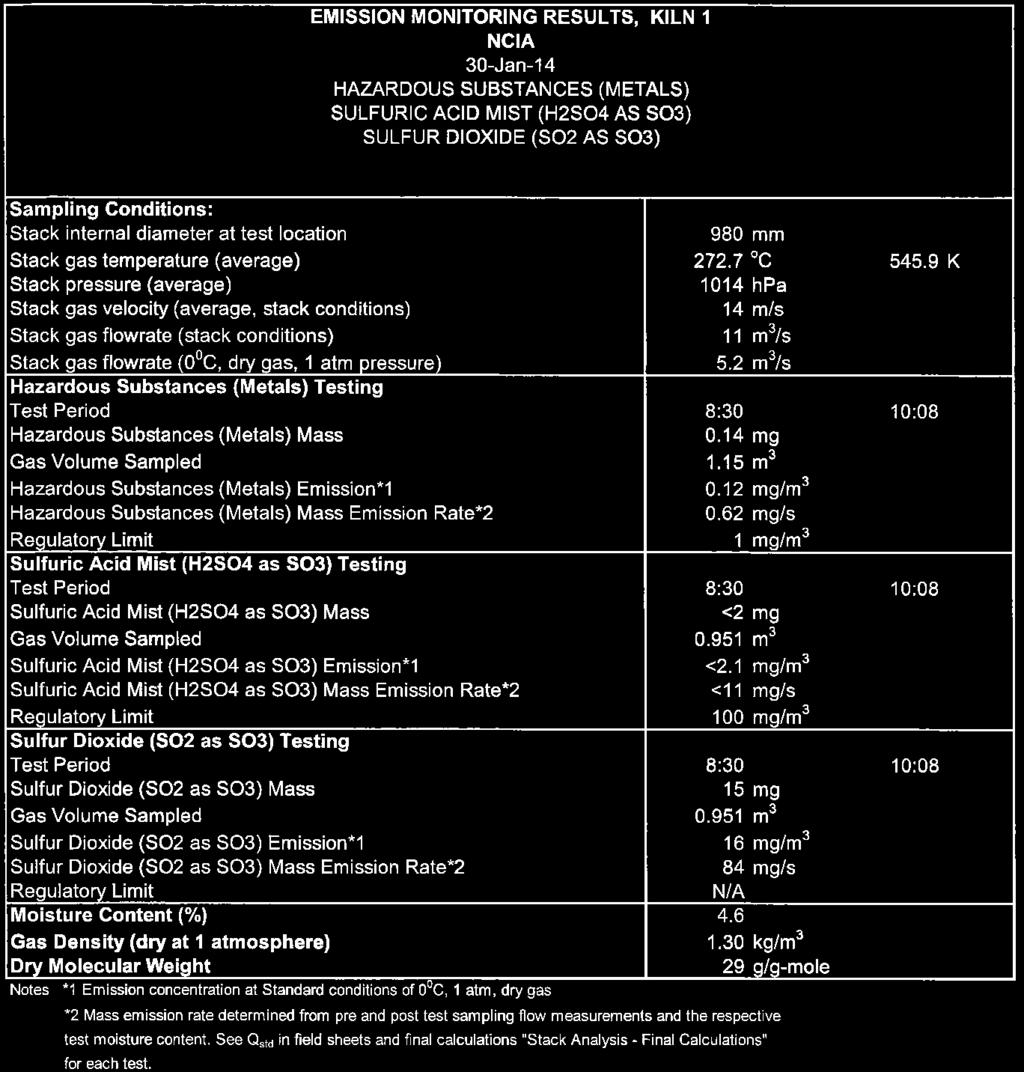
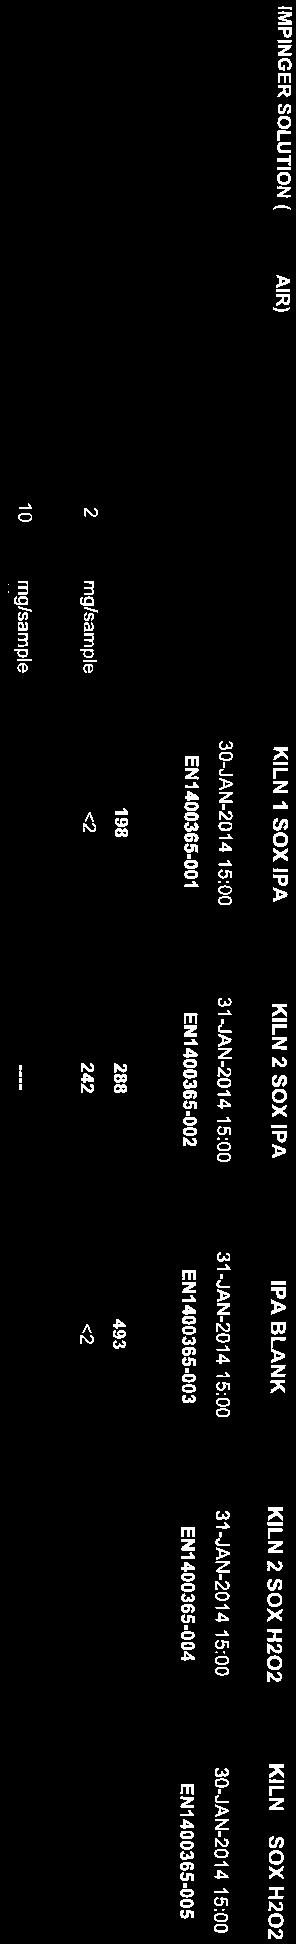
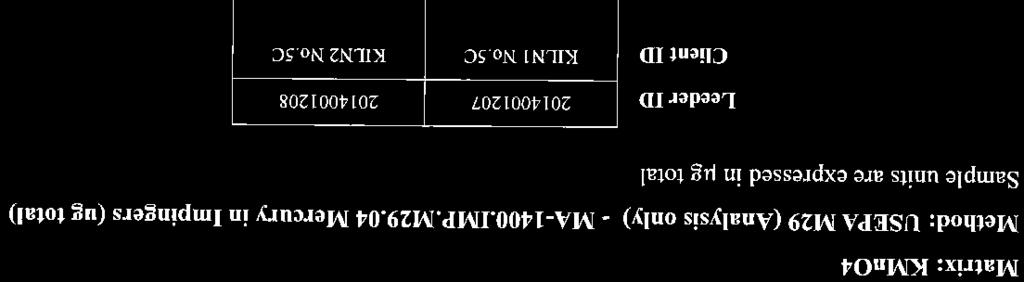
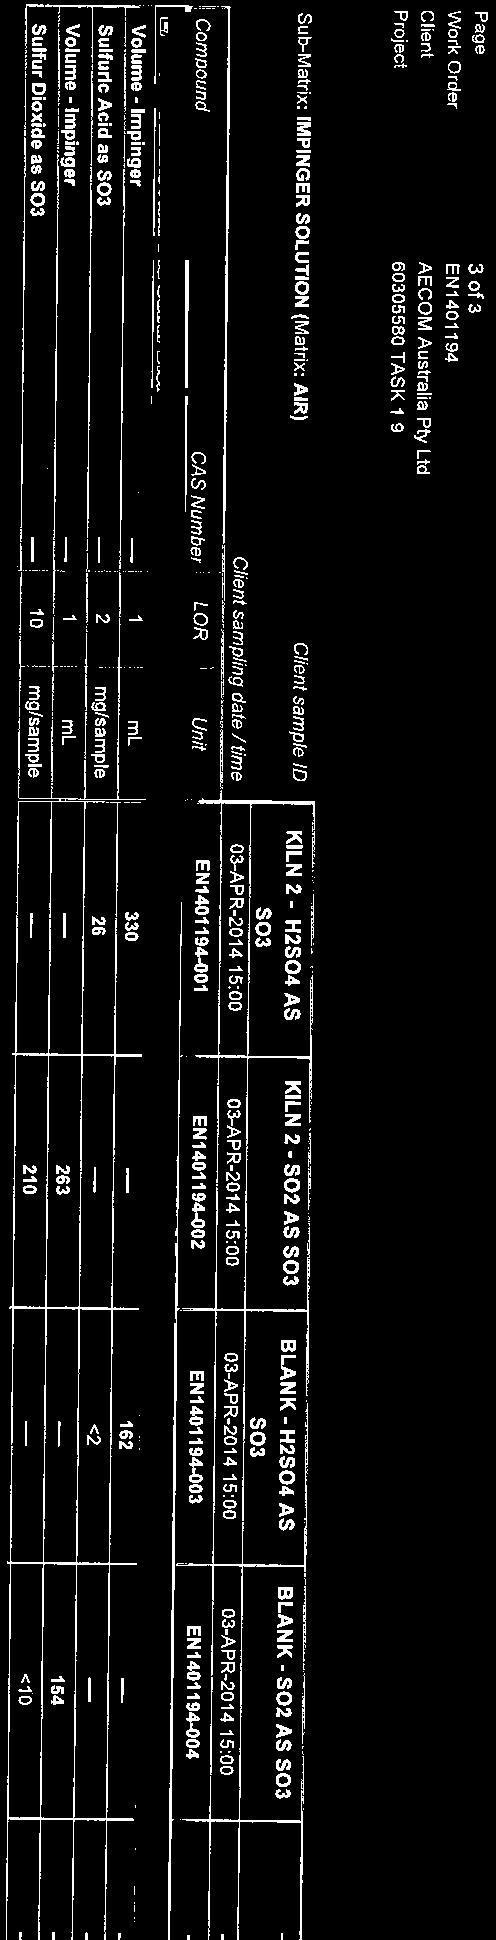
29 AECOM Emissions Testing Report National Ceramic Industries Australia Commercial-in-Confidence 23 Table 17 Kiln 1 Hazardous Substances (Metals), Sulfuric Acid Mist (H 2SO 4 as SO 3) and Sulfur Dioxide (SO 2 as SO 3) Results 30 January 2014 Sampling Conditions: Stack internal diameter at test location 980 mm Stack gas temperature (average) o C K Stack pressure (average) 1014 hpa Stack gas velocity (average, stack conditions) 14 m/s Stack gas flowrate (stack conditions) 11 m 3 /s Stack gas flowrate (0 0 C, dry gas, 1 atm pressure) 5.2 m 3 /s Hazardous Substances (Metals) Testing Test Period 8:30-10:08 Hazardous Substances (Metals) Mass 0.14 mg Gas Volume Sampled 1.15 m 3 Hazardous Substances (Metals) Emission* mg/m 3 Hazardous Substances (Metals) Mass Emission Rate* mg/s Regulatory Limit 1 mg/m 3 Sulfuric Acid Mist (H2SO4 as SO3) Testing Test Period 8:30-10:08 Sulfuric Acid Mist (H 2SO 4 as SO 3) Mass <2 mg Gas Volume Sampled m 3 Sulfuric Acid Mist (H 2SO 4 as SO 3) Emission* 1 <2.1 mg/m 3 Sulfuric Acid Mist (H 2SO 4 as SO 3) Mass Emission Rate* 2 <11 mg/s Regulatory Limit 100 mg/m 3 Sulfur Dioxide (SO2 as SO3) Testing Test Period 8:30-10:08 Sulfur Dioxide (SO 2 as SO 3) Mass 15 mg Gas Volume Sampled m 3 Sulfur Dioxide (SO 2 as SO 3) Emission* 1 16 mg/m 3 Sulfur Dioxide (SO 2 as SO 3) Mass Emission Rate* 2 84 mg/s Regulatory Limit N/A Moisture Content (%) 4.6 Gas Density (dry at 1 atmosphere) 1.30 kg/m 3 Dry Molecular Weight 29 g/g-mole Notes *1 Emission concentration at Standard conditions of 0 0 C, 1 atm, dry gas *2 Mass emission rate determined from pre and post-test sampling flow measurements and the respective test moisture content. See Q std in field sheets and final calculations "Stack Analysis - Final Calculations" for each test. Reports/1.9 Stack Testing 2013/NCIA Emissions Testing Report 2013_2014.docx Revision May-2014 Prepared for National Ceramic Industries Australia ABN:
30 AECOM Emissions Testing Report National Ceramic Industries Australia Commercial-in-Confidence 24 Table 18 Kiln 2 Stack Total Particulate, Fine Particulate (PM 10) and Total Fluoride 30 January 2014 Sampling Conditions: Stack internal diameter at test location 980 mm Stack gas temperature (average) o C K Stack pressure (average) 1013 hpa Stack gas velocity (average, stack conditions) 13 m/s Stack gas flowrate (stack conditions) 9.8 m 3 /s Stack gas flowrate (0 0 C, dry gas, 1 atm pressure) 5.4 m 3 /s Fine Particulate (PM10) Testing Test Period 10:16-11:36 Fine Particulate (PM 10) Mass 8.7 mg Gas Volume Sampled m 3 Fine Particulate (PM 10) Emission* 1 at 18% O 2 13 mg/m 3 Fine Particulate (PM 10) Mass Emission Rate* 2 at 18% O 2 67 mg/s Regulatory Limit at 18% O 2 N/A mg/m 3 Total Particulate Testing Test Period 10:16-11:36 Total Particulate Mass 13.1 mg Gas Volume Sampled m 3 Total Particulate Emission* 1 at 18% O 2 18 mg/m 3 Total Particulate Mass Emission Rate* 2 at 18% O 2 94 mg/s Regulatory Limit at 18% O 2 20 mg/m 3 Total Fluoride Testing Test Period 10:16-11:36 Total Fluoride Mass 0.55 mg Gas Volume Sampled m 3 Total Fluoride Emission* mg/m 3 Total Fluoride Mass Emission Rate* mg/s Regulatory Limit 5 mg/m 3 Moisture Content (%) 5.1 Gas Density (dry at 1 atmosphere) 1.29 kg/m 3 Dry Molecular Weight 28.9 g/g-mole Notes *1 Emission concentration at Standard conditions of 0 0 C, 1 atm, dry gas *2 Mass emission rate determined from pre and post-test sampling flow measurements and the respective test moisture content. See Q std in field sheets and final calculations "Stack Analysis - Final Calculations" for each test. Reports/1.9 Stack Testing 2013/NCIA Emissions Testing Report 2013_2014.docx Revision May-2014 Prepared for National Ceramic Industries Australia ABN:
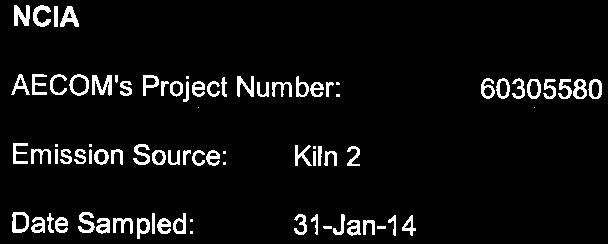
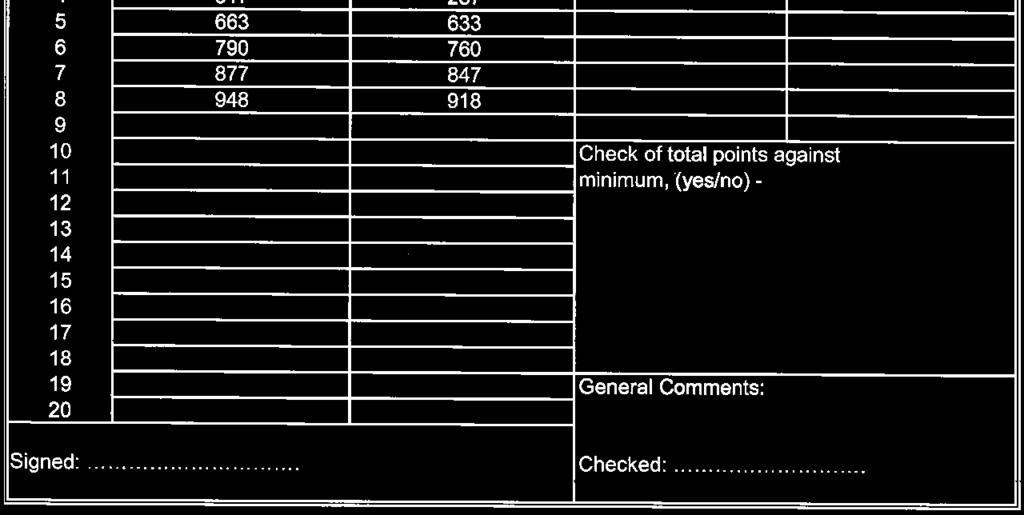
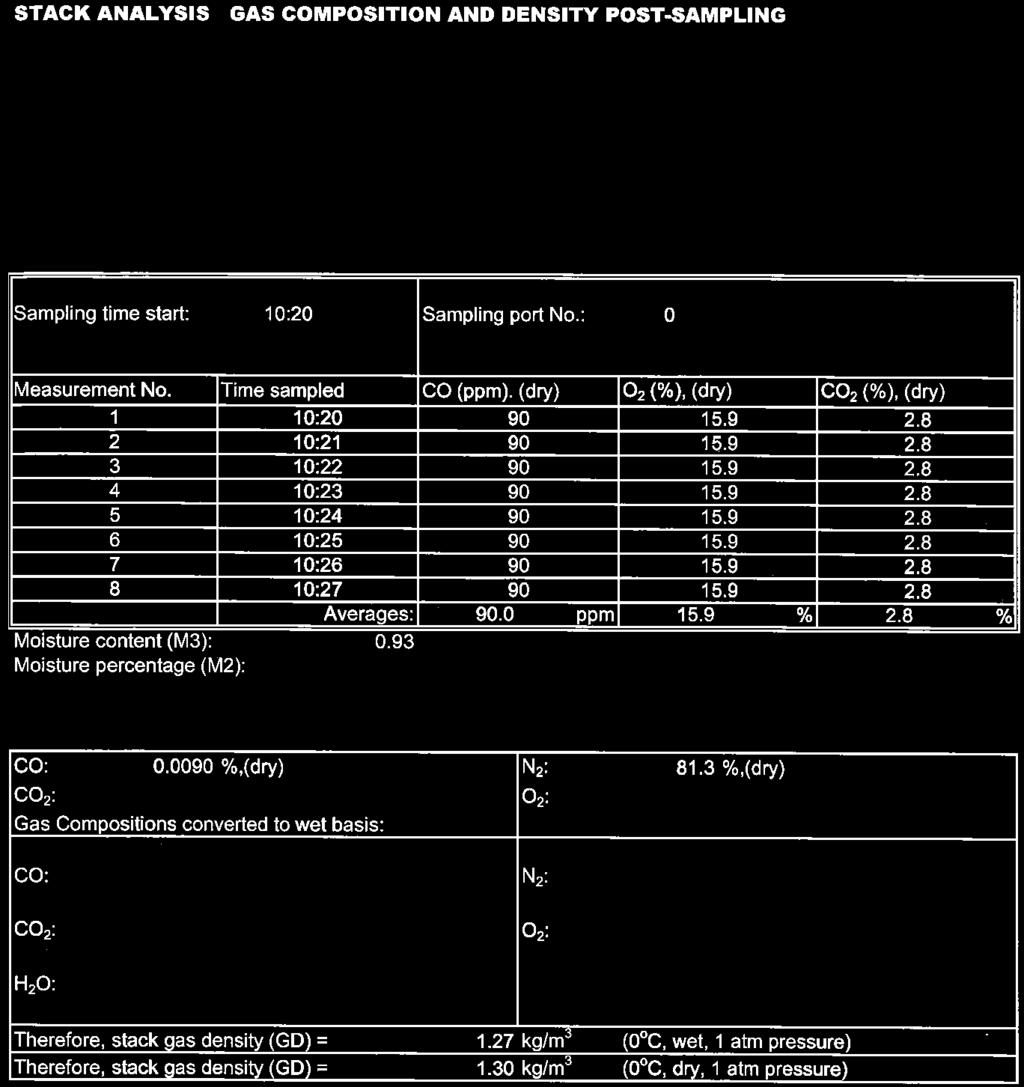
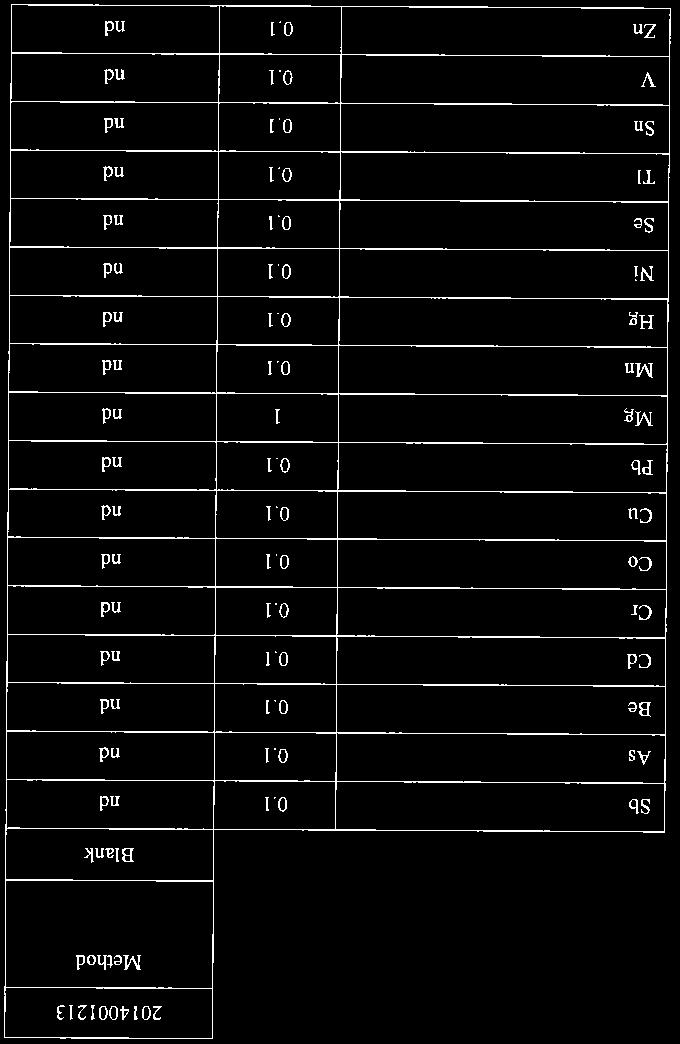
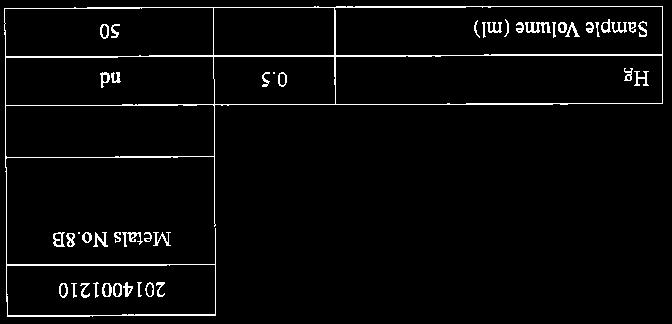
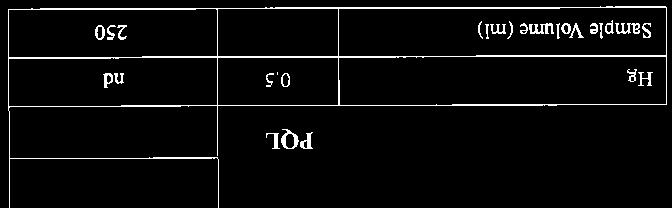
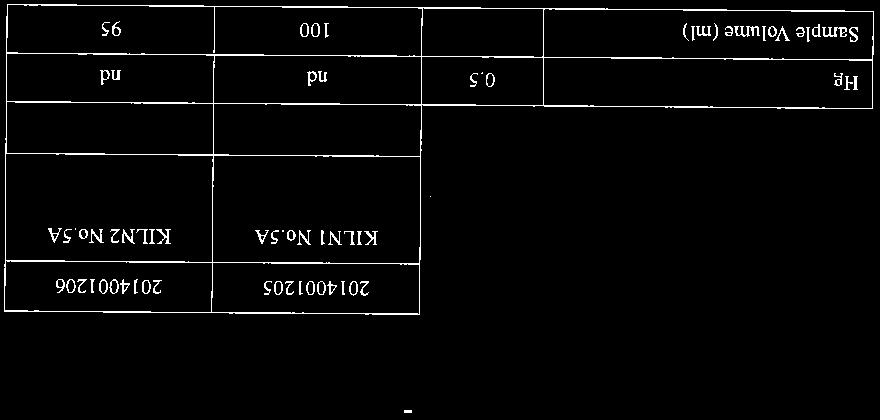
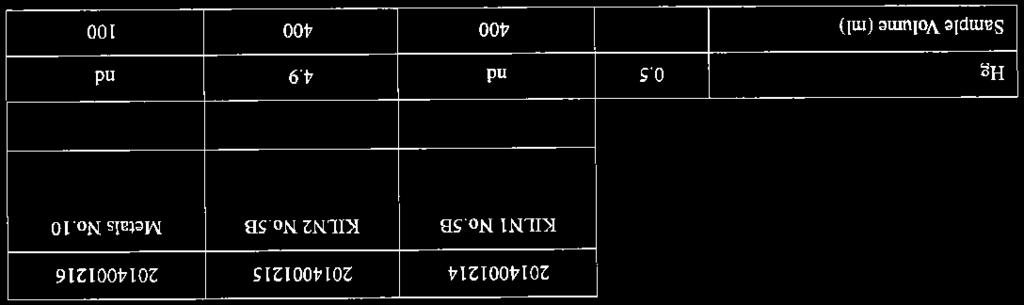
31 AECOM Emissions Testing Report National Ceramic Industries Australia Commercial-in-Confidence 25 Table 19 Kiln 2 Hazardous Substances (Metals) Results 31 January 2014 Sampling Conditions: Stack internal diameter at test location 980 mm Stack gas temperature (average) o C K Stack pressure (average) 1014 hpa Stack gas velocity (average, stack conditions) 12 m/s Stack gas flowrate (stack conditions) 9.2 m 3 /s Stack gas flowrate (0 0 C, dry gas, 1 atm pressure) 5.2 m 3 /s Hazardous Substances (Metals) Testing Test Period 8:47-10:17 Hazardous Substances (Metals) Mass 0.2 mg Gas Volume Sampled 1.16 m 3 Hazardous Substances (Metals) Emission* mg/m 3 Hazardous Substances (Metals) Mass Emission Rate* mg/s Regulatory Limit 1 mg/m 3 Moisture Content (%) 7.8 Gas Density (dry at 1 atmosphere) 1.30 kg/m 3 Dry Molecular Weight 29.1 g/g-mole Notes *1 Emission concentration at Standard conditions of 0 0 C, 1 atm, dry gas *2 Mass emission rate determined from pre and post-test sampling flow measurements and the respective test moisture content. See Q std in field sheets and final calculations "Stack Analysis - Final Calculations" for each test. Reports/1.9 Stack Testing 2013/NCIA Emissions Testing Report 2013_2014.docx Revision May-2014 Prepared for National Ceramic Industries Australia ABN:
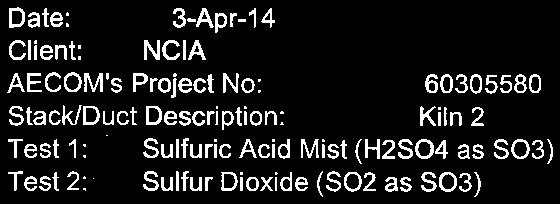
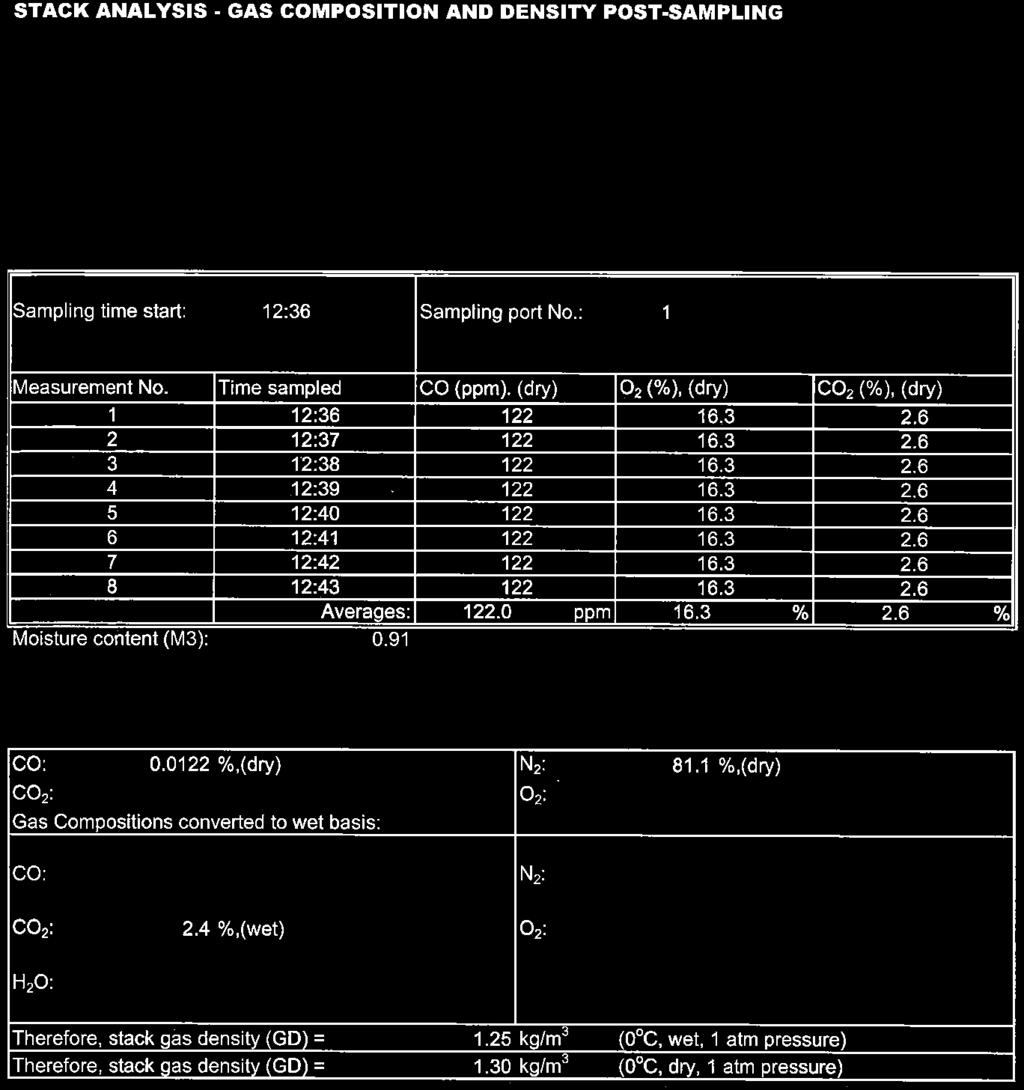
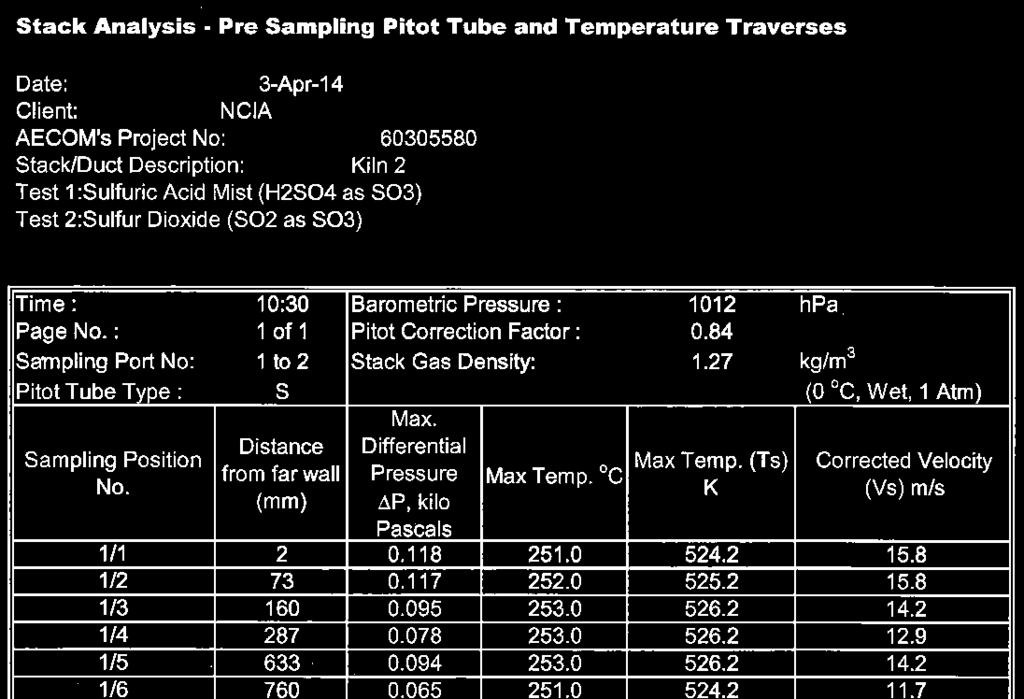
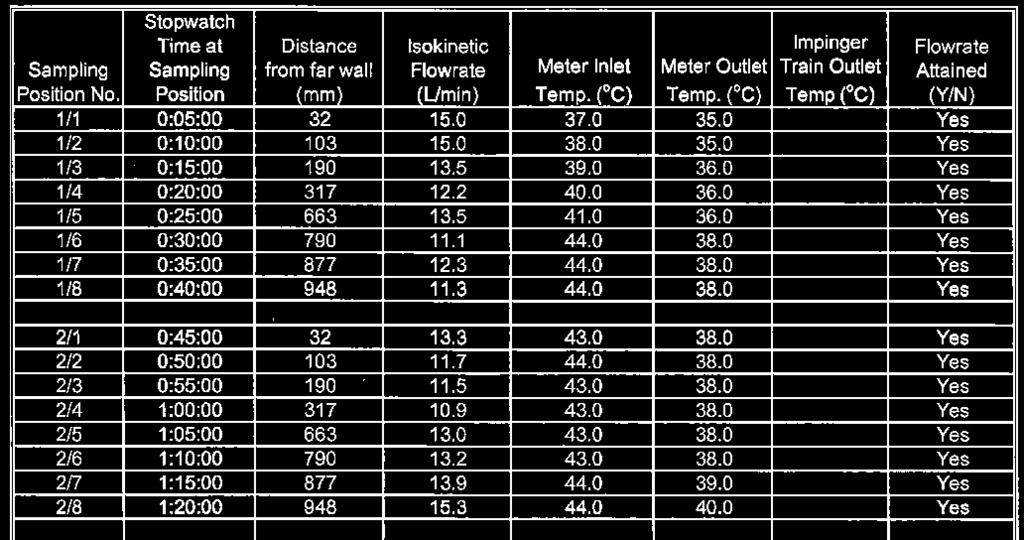
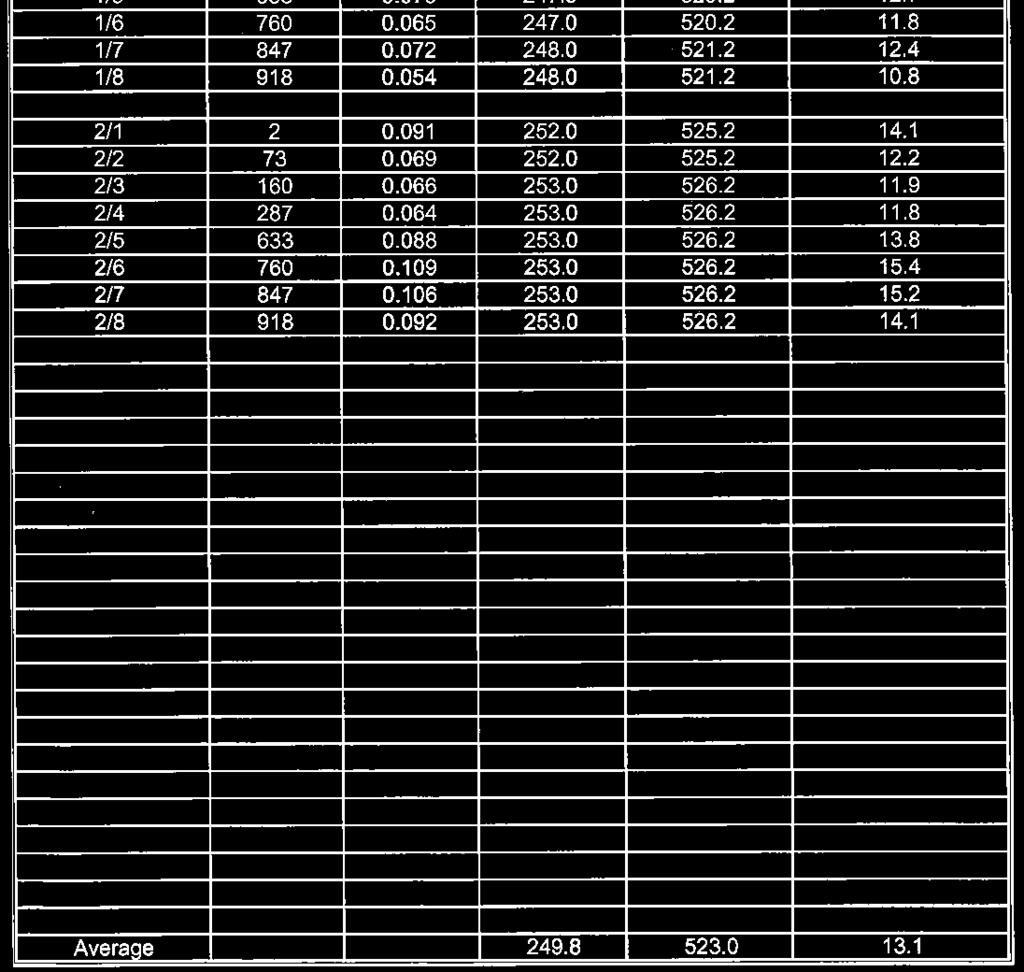
32 AECOM Emissions Testing Report National Ceramic Industries Australia Commercial-in-Confidence 26 Table 20 Kiln 2 Sulfuric Acid Mist (H 2SO 4 as SO 3) and Sulfur Dioxide (SO 2 as SO 3) Results, 3 April 2014 Sampling Conditions: Stack internal diameter at test location 980 mm Stack gas temperature (average) o C K Stack pressure (average) 1012 hpa Stack gas velocity (average, stack conditions) 13 m/s Stack gas flowrate (stack conditions) 10 m 3 /s Stack gas flowrate (0 0 C, dry gas, 1 atm pressure) 4.8 m 3 /s Sulfuric Acid Mist (H2SO4 as SO3) Testing Test Period 11:08-12:35 Sulfuric Acid Mist (H 2SO 4 as SO 3) Mass 26 mg Gas Volume Sampled m 3 Sulfuric Acid Mist (H 2SO 4 as SO 3) Emission* 1 29 mg/m 3 Sulfuric Acid Mist (H 2SO 4 as SO 3) Mass Emission Rate* mg/s Regulatory Limit 100 mg/m 3 Sulfur Dioxide (SO2 as SO3) Testing Test Period 11:08-12:35 Sulfur Dioxide (SO 2 as SO 3) Mass 210 mg Gas Volume Sampled m 3 Sulfur Dioxide (SO 2 as SO 3) Emission* mg/m 3 Sulfur Dioxide (SO 2 as SO 3) Mass Emission Rate* mg/s Regulatory Limit N/A Moisture Content (%) 9.1 Gas Density (dry at 1 atmosphere) 1.30 kg/m 3 Dry Molecular Weight 29.1 g/g-mole Notes *1 Emission concentration at Standard conditions of 0 0 C, 1 atm, dry gas *2 Mass emission rate determined from pre and post-test sampling flow measurements and the respective test moisture content. See Q std in field sheets and final calculations "Stack Analysis - Final Calculations" for each test. Reports/1.9 Stack Testing 2013/NCIA Emissions Testing Report 2013_2014.docx Revision May-2014 Prepared for National Ceramic Industries Australia ABN:
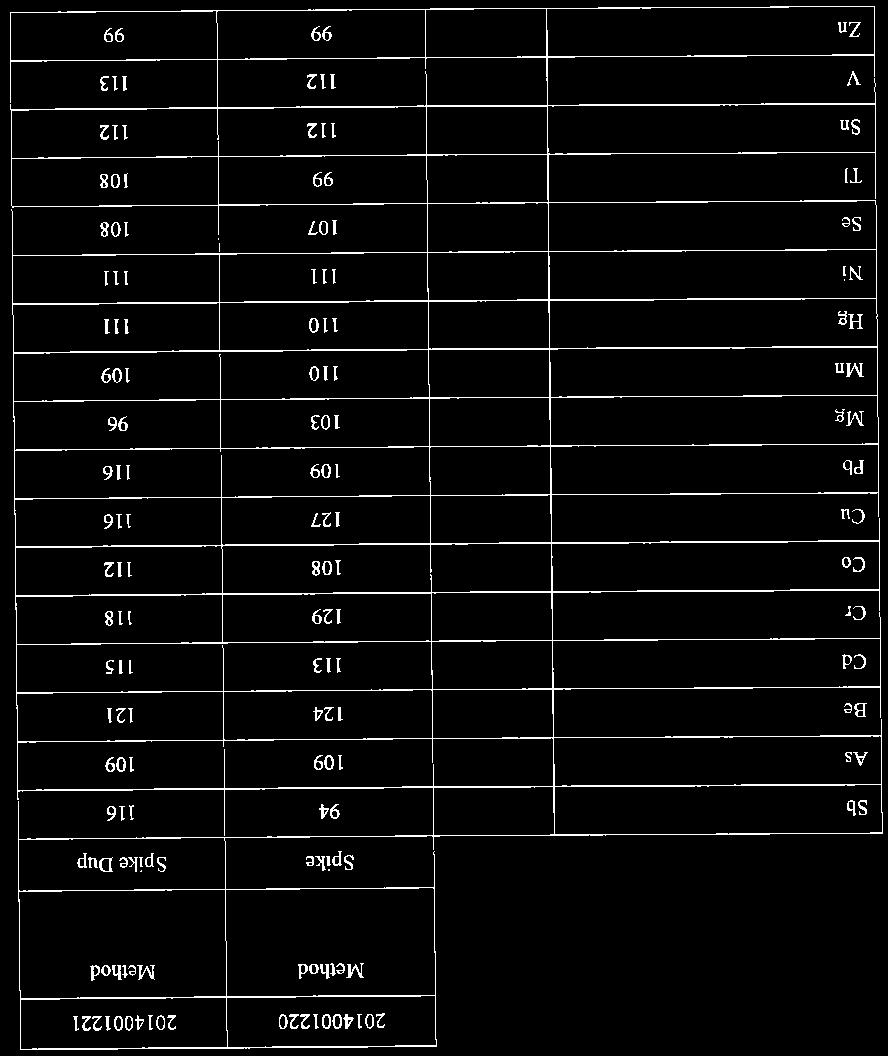
33 AECOM Emissions Testing Report National Ceramic Industries Australia Commercial-in-Confidence 27 Table 21 Kiln 1 Elemental Hazardous Substances (Metals) Results Sample Total Particulate Metals (mg) Total Particulate Metals (mg/m 3 ) Total Gaseous Metals (mg) Total Gaseous Metals (mg/m 3 ) Total Oxidisable Mercury (mg) Total Oxidisable Mercury (mg/m 3 ) Reports/1.9 Stack Testing 2013/NCIA Emissions Testing Report 2013_2014.docx Revision May-2014 Prepared for National Ceramic Industries Australia ABN: Total (mg) Total (mg/m 3 ) Antimony Arsenic Mass Emission Rate (mg/s) Beryllium < < < < < < < Cadmium Chromium Cobalt < < < < < < < Copper < < Lead Magnesium Manganese < < Mercury < < < < < < < < < Nickel Selenium Thallium < < Tin Vanadium < < Zinc Total Hazardous Metals* < < Total Metals * Total does not include Copper, Magnesium and Zinc as they are classed non-hazardous
34 AECOM Emissions Testing Report National Ceramic Industries Australia Commercial-in-Confidence 28 Table 22 Kiln 2 Elemental Hazardous Substances (Metals) Results Sample Total Particulate Metals (mg) Total Particulate Metals (mg/m 3 ) Total Gaseous Metals (mg) Total Gaseous Metals (mg/m 3 ) Total Oxidisable Mercury (mg) Total Oxidisable Mercury (mg/m 3 ) Total (mg) Total (mg/m 3 ) Antimony Arsenic Mass Emission Rate (mg/s) Beryllium < < < < < < < Cadmium Chromium Cobalt < < < < < < < Copper Lead Magnesium Manganese < < Mercury Nickel < < Selenium Thallium Tin Vanadium < < Zinc Total Hazardous Metals* Total Metals * Total does not include Copper, Magnesium and Zinc as they are classed non-hazardous Reports/1.9 Stack Testing 2013/NCIA Emissions Testing Report 2013_2014.docx Revision May-2014 Prepared for National Ceramic Industries Australia ABN:
35 AECOM Emissions Testing Report National Ceramic Industries Australia Commercial-in-Confidence Appendix A Field Sheets and Final Calculations (190 pages) Reports/1.9 Stack Testing 2013/NCIA Emissions Testing Report 2013_2014.docx Revision May-2014 Prepared for National Ceramic Industries Australia ABN:
36 AECOM Emissions Testing Report National Ceramic Industries Australia Commercial-in-Confidence a-1 Appendix A Field Sheets and Final Calculations (190 pages) Reports/1.9 Stack Testing 2013/NCIA Emissions Testing Report 2013_2014.docx Revision May-2014 Prepared for National Ceramic Industries Australia ABN:

37


38

39

40

41


42
43
44
45
46

47

48

49

50
51

52


53

54

55

56
57

58

59

60


61

62

63

64


65

66
67

68


69

70

71

72
73

74


75

76

77
78

79

80

81
82


83

84

85
86
87
88
89
90

91
92


93

94
95


96


97
98
99
100
101

102

103
104


105

106
107

108
109
110

111

112
113
114

115
116
117


118
119

120
121
122
123

124

125
126
127

128
129

130
131

132
133

134
135

136

137

138

139

140


141
142
143

144
145

146
147

148
149
150

151

152

153

154
155

156

157
158
159

160
161
162
163
164
165
166

167
168

169

170


171
172
173


174

175

176

177

178

179

180
181

182

183
184

185

186
187


188
189

190

191

192
193

194
195
196

197


198
199

200
201

202

203


204
205

206
207

208

209
210

211

212


213

214


215
216

217
218

219
220
221

222
223
224

225


226
227 AECOM Emissions Testing Report National Ceramic Industries Australia Commercial-in-Confidence Appendix B Laboratory Analytical Reports (30 pages) Reports/1.9 Stack Testing 2013/NCIA Emissions Testing Report 2013_2014.docx Revision May-2014 Prepared for National Ceramic Industries Australia ABN:
228 AECOM Emissions Testing Report National Ceramic Industries Australia Commercial-in-Confidence b-1 Appendix B Laboratory Analytical Reports (30 pages) Reports/1.9 Stack Testing 2013/NCIA Emissions Testing Report 2013_2014.docx Revision May-2014 Prepared for National Ceramic Industries Australia ABN:
229


230


231
232

233

234


235


236


237


238


239

240

241

242
243

244

245


246
247


248
249

250

251
252


253


254

255
256

257


258
259 AECOM Emissions Testing Report National Ceramic Industries Australia Commercial-in-Confidence Appendix C Raw and Calculated Gas Data (12 pages) Reports/1.9 Stack Testing 2013/NCIA Emissions Testing Report 2013_2014.docx Revision May-2014 Prepared for National Ceramic Industries Australia ABN:
260 AECOM Emissions Testing Report National Ceramic Industries Australia Commercial-in-Confidence c-1 Appendix C Raw and Calculated Gas Data (12 pages) Reports/1.9 Stack Testing 2013/NCIA Emissions Testing Report 2013_2014.docx Revision May-2014 Prepared for National Ceramic Industries Australia ABN:

261

262

263
264
265

266
267

268
269
270

271

272
CBH RESOURCES LIMITED BROKEN HILL OPERATIONS PTY LTD
 SOURCE EMISSIONS MONITORING RASP MINE, BROKEN HILL CBH RESOURCES LIMITED BROKEN HILL OPERATIONS PTY LTD Project ID. 10358 R_0 DATE OF RELEASE: 5/04/2016 Unit 7, 142 Tennyson Memorial Avenue Tennyson Queensland
Assured Monitoring Group
 ABN: 87 604 851 078 Assured Monitoring Group SOURCE EMISSIONS MONITORING RASP MINE, BROKEN HILL CBH RESOURCES LIMITED BROKEN HILL OPERATIONS PTY LTD Project ID. 10263 R_0 DATE OF RELEASE: 28/01/2016 Unit
DETERMINATION OF CONCENTRATION AND MASS FLOW OF PARTICULATE MATTER IN FLUE GAS FOR STATIONARY SOURCE EMISSIONS
 MS 1596: 2003 DETERMINATION OF CONCENTRATION AND MASS FLOW OF PARTICULATE MATTER IN FLUE GAS FOR STATIONARY SOURCE EMISSIONS Presented BY: UiTM A&A Laboratory Malaysia s 1 st University Affiliated Environmental
Emission Testing August 2013 EPA 4 Benzene Combustor Inlet/Outlet Testing
 Page: 1 of 12 Gate 38B, 45 Friendship Rd Port Botany NSW 2036 Dear Mr G Millard, August 2013 EPA 4 Benzene Combustor Inlet/Outlet Testing Tests were performed 10th August 2013 to determine emissions from
GUIDANCE NOTE ON THE BEST PRACTICABLE MEANS FOR
 GUIDANCE NOTE ON THE BEST PRACTICABLE MEANS FOR INCINERATORS (MUNICIPAL WASTE INCINERATION) BPM 12/1 (08) Environmental Protection Department Air Policy Group February 2008 1. INTRODUCTION 1.1 This Note
SUB-Programs - Calibration range Fe Base for "PMI-MASTER Pro" Spark - mode Fe 000
 SUB-Programs - Calibration range Fe Base for "PMI-MASTER Pro" Spark - mode Fe 100 Fe 200 *** Fe 250 *** Fe 300 Fe 400 Fe 500 Fe 000 Fe low alloy steel cast iron Cr hard / Ni resist stainless steel tool
CERTIFICATE OF ANALYSIS REVISED REPORT
 Your C.O.C. #: A122303 Attention: STEPHEN LEGAREE EDMONTON 9331 9331-48 Street EDMONTON, AB CANADA T6B 2R4 Report #: R1787645 Version: 2R CERTIFICATE OF ANALYSIS REVISED REPORT MAXXAM JOB #: B4B4991 Received:
EU Water Analysis Using the Thermo Scientific icap 7400 ICP-OES Duo
 EU Water Analysis Using the Thermo Scientific icap 7400 ICP-OES Duo James Hannan, Applications Chemist, Thermo Fisher Scientific, Cambridge, UK Application Note 43171 Key Words Environmental, EU, waste,
KKB Micro Testing Labs Pvt. Ltd., , 2 nd Floor, Tarun Plaza, NFC Main Road, Krishna Nagar Colony, Moula Ali, Hyderabad, Telangana
 Last Amended on - Page 1 of 7 I. AIR, GASES & ATMOSPHERE 1. Ambient Air Monitoring RSPM ( PM 10) IS 5182 (Part 23): 2006 (RA ) 5 µg/m 3 to 750 µg/m 3 PM 2.5 SOP 11 dated 17.11.2014 12.5 µg/m 3 to 500 µg/m
27.0 SAMPLING AND TESTING METHODS
 27.0 SAMPLING AND TESTING METHODS 27.1 General It is explicitly implied that in addition to and consistent with specific methods of sampling and analysis described herein, that samples shall be taken in
CARBOWAX SENTRY Polyethylene Glycol (PEG) and Methoxypolyethylene Glycol (MPEG) Products
 and Methoxypolyethylene Glycol (MPEG) Products") Effective: June 9, 2016 Supercedes: None CARBOWAX SENTRY Polyethylene Glycol (PEG) and Methoxypolyethylene Glycol (MPEG) Products Elemental Impurities / Metal Impurities USP general chapter Elemental
Effective: June 9, 2016 Supercedes: None CARBOWAX SENTRY Polyethylene Glycol (PEG) and Methoxypolyethylene Glycol (MPEG) Products Elemental Impurities / Metal Impurities USP general chapter Elemental
Government Decree on Waste Incineration (151/2013; amendments up to 1303/2015 included)
") Translation from Finnish Legally binding only in Finnish and Swedish Ministry of the Environment, Finland Government Decree on Waste Incineration (151/2013; amendments up to 1303/2015 included) Enacted
Translation from Finnish Legally binding only in Finnish and Swedish Ministry of the Environment, Finland Government Decree on Waste Incineration (151/2013; amendments up to 1303/2015 included) Enacted
Hot Gas Filters for Control of Emissions to Atmosphere
 Hot Gas Filters for Control of Emissions to Atmosphere by: Chris Withers CEng, FIChE Caldo Consultants, Tel:+(44) 1562 743346 Email info@caldo.com The Case for Hot Gas Filters Part 1 Most controlled processes
REVISED NATIONAL ENVIRONMENTAL QUALITY STANDARDS (NEQS)
") REVISED NATIONAL ENVIRONMENTAL QUALITY STANDARDS (NEQS) Background PEPC in its first meeting held on 10 th May 1993 approved the NEQS. The approved NEQS were uniform standards applicable to all kind of
REVISED NATIONAL ENVIRONMENTAL QUALITY STANDARDS (NEQS) Background PEPC in its first meeting held on 10 th May 1993 approved the NEQS. The approved NEQS were uniform standards applicable to all kind of
Compliance Measurements. Mike Klein & Robert Kettig BTS (609)
") Compliance Measurements Mike Klein & Robert Kettig BTS (609) 530-4140 BTS Emission Measurement Section Bureau Chief (vacant) 1 Section Chief 1 Supervisor 5* Staff Professionals + 1-2 part time Consultants
Compliance Measurements Mike Klein & Robert Kettig BTS (609) 530-4140 BTS Emission Measurement Section Bureau Chief (vacant) 1 Section Chief 1 Supervisor 5* Staff Professionals + 1-2 part time Consultants
Appendix C1: Batch Kinetics Tests
 Appendix C1: Batch Kinetics Tests This appendix contains the entire data set for the batch kinetics tests for the potential biofilter components. These tests were performed to provide estimates of optimal
US EPA Method using the Thermo Scientific icap 7600 ICP-OES Duo
 APPLICATION NOTE 43157 US EPA Method 200.7 using the Thermo Scientific icap 7600 ICP-OES Duo Authors Introduction James Hannan, Application Specialist, Thermo Fisher Scientific, Hemel Hempstead, UK In
EPA Method 1 Field Procedures Example:
 EPA Method 1 Field Procedures Step Instruction 100 Is the stack or duct circular or square/rectangle? If square/rectangular go to step 170. 105 Determine the diameter of the stack from one of the following
DETERMINATION OF ELEMENTS IN DRINKING WATER AS PER BUREAU OF INDIAN STANDARDS 10500, & USING THE AGILENT 5100 ICP-OES
 ENVIRONMENTAL ANALYSIS DETERMINATION OF ELEMENTS IN DRINKING WATER AS PER BUREAU OF INDIAN STANDARDS 10500, 14543 & 13428 USING THE AGILENT 5100 ICP-OES Solutions for Your Analytical Business Markets and
Corrosion Studies on GeoBrom HG520
 Corrosion Studies on GeoBrom HG520 Vapor Space Study a Chemtura business Great Lakes Solutions: brominated derivative products for mercury control Contents Background Information 1 Objectives 1 Executive
New GCSE 4462/02 SCIENCE A HIGHER TIER CHEMISTRY 1
 Surname Other Names Centre Number 0 Candidate Number New GCSE 4462/02 SCIENCE A HIGHER TIER CHEMISTRY 1 ADDITIONAL MATERIALS A.M. WEDNESDAY, 18 January 2012 1 hour In addition to this paper you may require
CERTIFICATE OF ANALYSIS
 Your Project #: 001\DRINKABLE WATER Your C.O.C. #: na Attention: Michael Bourgon 7111 Syntex Dr Suite 354 Mississauga, ON CANADA L5B 4P5 CERTIFICATE OF ANALYSIS MAXXAM JOB #: B2H1428 Received: 2012/11/01,
AGL UPSTREAM INVESTMENTS PTY LTD ROSALIND PARK GAS PLANT Monthly Continuous Air Monitoring Report
 AGL UPSTREAM INVESTMENTS PTY LTD ROSALIND PARK GAS PLANT Monthly Continuous Air Monitoring Report Reporting Period: February 2018 AGL Upstream Investments Pty Ltd ABN 58 115 063 744 Locked Bag 1837, St
Coal Ash Material Safety
 Coal Ash Material Safety A Health Risk-Based Evaluation of USGS Coal Ash Data from Five US Power Plants Lisa JN Bradley, Ph.D., DABT International Concrete Sustainability Conference, May 2013 Study Objective
Abu Dhabi Trade Effluent Standards & Regulations Summary
 Abu Dhabi Trade Effluent Standards & Regulations Summary August 2010 Disclaimer: The standards & regulations provided here are attributable to the named source and are assumed to be accurate at the time
Corrosion Studies on GeoBrom HG520
 Corrosion Studies on GeoBrom HG520 Partial Immersion Study a Chemtura business Great Lakes Solutions: brominated derivative products for mercury control Contents Background Information 1 Objectives 1 Executive
The Determination of Toxic Metals in Waters and Wastes by Furnace Atomic Absorption
 The Determination of Toxic Metals in Waters and Wastes by Furnace Atomic Absorption Application Note Atomic Absorption Authors Douglas E. Shrader Lucinda M. Voth Lawrence A. Covick Introduction With the
ADEQ NON-CRITERIA POLLUTANT CONTROL STRATEGY Revised April 2015
 ADEQ NON-CRITERIA POLLUTANT CONTROL STRATEGY Revised April 2015 BACKGROUND Under the federal Clean Air Act, EPA is obligated to establish ambient air quality standards for 6 commonly found criteria pollutants:
Comparison of Dry Sorbent Injection of Sodium Bicarbonate, Lime, and Carbon and Their Control of Dioxins/Furans, Mercury, Chlorides and Sulfur Dioxide
 Comparison of Dry Sorbent Injection of Sodium Bicarbonate, Lime, and and Their Control of Dioxins/Furans, Mercury, Chlorides and Sulfur Dioxide Acid Gas and Toxics Removal at WCA Hospital, Jamestown, NY
A.M. MONDAY, 18 January minutes
 Candidate Name Centre Number Candidate Number 0 GCSE 240/01 ADDITIONAL SCIENCE FOUNDATION TIER CHEMISTRY 2 A.M. MONDAY, 18 January 2010 45 minutes ADDITIONAL MATERIALS In addition to this paper you may
GCSE 4462/01 CHEMISTRY 1 FOUNDATION TIER SCIENCE A/CHEMISTRY. P.M. FRIDAY, 12 June hour JUN S
 Surname Centre Number Candidate Number Other Names 0 GCSE 4462/01 S15-4462-01 SCIENCE A/CHEMISTRY CHEMISTRY 1 FOUNDATION TIER P.M. FRIDAY, 12 June 2015 1 hour For s use Question Maximum Mark Mark Awarded
Pilot Study Report. Z-92 Uranium Treatment Process
 Pilot Study Report for Z-92 Uranium Treatment Process conducted at the Mountain Water & Sanitation District, Conifer, Colorado Revised November 11, 4 Page 2 Executive Summary Mountain Water & Sanitation
SILLIKER, Inc. Southern California Laboratory 6360 Gateway Drive, Cypress, CA Tel. 209/ Fax. 714/
 6360 Gateway Drive, 90630 95073 Page 1 of 8 CI-516 Cistanche 361439388 ICP MS Full Mineral Screen EPA 3050/6020 USP730 BRN Aluminum 2.2 ppm (w/w) Antimony Arsenic 0.06 ppm (w/w) Barium 0.09 ppm (w/w) Beryllium
A.M. MONDAY, 18 January minutes
 Candidate Name Centre Number Candidate Number 0 GCSE 240/02 ADDITIONAL SCIENCE IGER TIER CEMISTRY 2 A.M. MONDAY, 18 January 2010 45 minutes ADDITIONAL MATERIALS In addition to this paper you may require
LABORATORY TURNAROUND TIMES AND CHARGES
 LABORATORY TURNAROUND TIMES AND CHARGES The enclosed prices reflect a 5 business day turnaround time. There will be a $25.00 minimum charge per report. Same Day Rush 24 Hour Rush 48 Hour Rush 72 Hour Rush
2017 Air Emissions Testing FAQs
 2017 Air Emissions Testing FAQs Q: What is the purpose of annual air emissions stack testing? A: Stack testing is an important tool that measures the amount of regulated pollutants being emitted from a
Corrosion Studies on GeoBrom HG520
 Corrosion Studies on GeoBrom HG520 Total Immersion Study a Chemtura business Great Lakes Solutions: brominated derivative products for mercury control Contents Background Information 1 Objectives 1 Executive
Schedule of Accreditation issued by United Kingdom Accreditation Service 2 Pine Trees, Chertsey Lane, Staines-upon-Thames, TW18 3HR, UK
 2 Pine Trees, Chertsey Lane, Staines-upon-Thames, TW18 3HR, UK Metals and Minerals Division 2 Perry Road Witham Essex CM8 3TU Contact: Mrs C Hargreaves Tel: +44 (0)1376 536800 Fax: +44 (0)1376 520819 E-Mail:
Test Report No. F690101/LF-CTSAYHA Issued Date : August 20, 2013 Page 1 of 5
 Test Report No. F690101/LF-CTSAYHA13-05147 Issued Date : August 20, 2013 Page 1 of 5 To: 3M Korea 27-3, Yoido-dong Yeongdeungpo-gu Seoul Korea The following sample(s) was/were submitted and identified
Ambient Air Quality Monitoring Baseline Report, Kirby Misperton A Wellsite, KM8 Production Well
 Ambient Air Quality Monitoring Baseline Report, Kirby Misperton A Wellsite, KM8 Production Well. Prepared for: Third Energy UK Gas Ltd. Document Control Page Client Third Energy UK Gas Ltd. Document Title
ENVIRONMENTAL LABORATORY LICENSE. ACZ Laboratories, Inc. AZ0102
 ARIZONA DEPARTMENT OF HEALTH SERVICES ENVIRONMENTAL LABORATORY LICENSE Issued to: Laboratory Director: Owner/Representative: Brett Dalke Matt Sowards ACZ AZ0102 is in compliance with Environmental Laboratory
*This report is combined with 18 copies of report which provides by client*
 Page : 1 of 10 The following merchandise was(were) submitted and identified by the client as : Type of Product : Style/Item No : Sample Received : Testing Date : THERMOSTATS T20, T23, T24, T26, T27 SERIES
Alabama Department of Environmental Management Air Division Planning Branch Emission Measurement Section
 Alabama Department of Environmental Management Air Division Planning Branch Emission Measurement Section Particulate Sampling Guideline & Reporting Format Revision No. 6 December 2003 PARTICULATE SAMPLING
Agilent Resources for Workflow Compliance MEASURING ELEMENTAL IMPURITIES IN PHARMACEUTICAL MATERIALS
 Agilent Resources for Workflow Compliance MEASURING ELEMENTAL IMPURITIES IN PHARMACEUTICAL MATERIALS AGILENT SOLUTIONS USP / & ICH Q3D Implementing Elemental Impurities Tests in the Pharmaceutical
Green Label Product Products made from rubberwood
 Green Label Product Products made from rubberwood (TGL 22- R1 11) Revision Approved on 24 June 2012 Thailand Environment Institute (TEI) 16/151 Muang Thong Thani, Bond Street, Bangpood, Pakkred, Nonthaburi
The Determination of Trace Elements in Waters using the US EPA Method and the Thermo Scientific icap 6500 ICP-OES (Duo)
") Application Note: 40853 The Determination of Trace Elements in Waters using the US EPA Method 200.7 and the Thermo Scientific icap 6500 ICP-OES (Duo) Matthew Cassap, Senior ICP Applications Specialist,
Application Note: 40853 The Determination of Trace Elements in Waters using the US EPA Method 200.7 and the Thermo Scientific icap 6500 ICP-OES (Duo) Matthew Cassap, Senior ICP Applications Specialist,
This method is applicable to the following parameters: Nitric Hydrochloric acid digestion, Instrumental analysis.
 Metals Revision Date: Nov 6, 2015 1.2.1 Strong Acid Leachable Metals () in Soil - Prescriptive s List & EMS Codes Analytical Method Introduction Method Summary Metals in Soil and Sediment. This method
Final Report DMR-QA 36. NPDES Permit: IL DMR-QA Study. Open Date: 03/18/16. Close Date: 07/01/16. Report Issued Date: 07/29/16
 Keith Richard Decatur Sanitary District Decatur, IL 62522-1842 USA DMR-QA 36 Final Report NPDES Permit: IL0028321 DMR-QA Study Open Date: 03/18/16 Close Date: 07/01/16 Report Issued Date: 07/29/16 Study
REPORT NUMBER REPORT DATE SEND TO ISSUE DATE Apr 18, Apr 18, 2017 RECEIVED DATE Apr 05, 2017
 PAGE 1/7 Sample ID: EWA PELLETS Lab Number: 2653281 Date Sampled: 2017-04-04 0850 Carbon nitrogen ratio C/N 6 : 1 0.1 Calculation Auto-2017/04/12 Auto-2017/04/18 Carbon (total) 38.53 % 0.050 ASTM D 5373
Part 1. Preparation and Color of Solutions. Experiment 1 (2 session lab) Electrons and Solution Color. Pre-lab Report, page 29
 Electrons and Solution Color. Pre-lab Report, page 29") Experiment 1 (2 session lab) Electrons and Solution Color Pre-lab Report, page 29 Session 1 One hour discussion (E2) Two hour lab (E1) Aim to complete Parts 1, 2, and 3 of E1. Part 1. Preparation and Color
Experiment 1 (2 session lab) Electrons and Solution Color Pre-lab Report, page 29 Session 1 One hour discussion (E2) Two hour lab (E1) Aim to complete Parts 1, 2, and 3 of E1. Part 1. Preparation and Color
Analysis of steel and its alloys using the GB/T standard and an Agilent 5100 ICP-OES in dual view mode
 Analysis of steel and its alloys using the GB/T 20125-2006 standard and an Agilent 5100 ICP-OES in dual view mode Application note Metals analysis and production Authors John Cauduro Agilent Technologies
Material Evaporation Application Comment MP P / Optical films, Oxide films, Electrical contacts. Doping, Electrical contacts.
 for vapour Aluminum (Al) -, Optical, Oxide, Electrical BN liners with lid are recommended due to the reactivity and the fact that Al creeps out. Cooling down of the cell with 1K per minute. 660 972 Antimony
SCOPE OF ACCREDITATION TO ISO GUIDE 34:2009
 SCOPE OF ACCREDITATION TO ISO GUIDE 34:2009 SCP SCIENCE 21800 Clark Graham Baie d'urfe, Quebec H9X 4B6 CANADA David Smith Phone: 514 457 0701 dsmith@scpscience.com REFERENCE MATERIAL PRODUCER Valid To:
Poly Met Mining, Inc. NPDES Antidegradation Review - Preliminary MPCA Determination
 January 10, 2018 Poly Met Mining, Inc. NPDES Antidegradation Review - Preliminary MPCA Determination Antidegradation Procedures Overview Poly Met Mining, Inc. (PolyMet) submitted an NPDES/SDS application
AGL UPSTREAM INVESTMENTS PTY LTD GLOUCESTER GAS PROJECT
 AGL UPSTREAM INVESTMENTS PTY LTD GLOUCESTER GAS PROJECT July 2016 Water Monitoring Report Waukivory Pilot Project: Fracture Stimulation and Flow Test EPL 20358 Reporting Period: June 2016 AGL Upstream
Identify three common gaseous pollutants in air and state how each of these pollutants are produced.
 1 Clean dry air contains mainly nitrogen and oxygen. (a) Name two other gases that are in clean dry air.. [2] (b) Air often contains pollutants. Identify three common gaseous pollutants in air and state
Environment Protection Licence
 Licence Details Number: Anniversary Date: 767 01-January Licensee METROPOLITAN COLLIERIES PTY. LTD. PO BOX 402 HELENSBURGH NSW 2508 Premises METROPOLITAN COLLIERY PARKES STREET HELENSBURGH NSW 2508 Scheduled
Proposed Guidelines for the Reduction of Nitrogen Oxide Emissions from Natural Gas fuelled Stationary Combustion Turbines
 Proposed Guidelines for the Reduction of Nitrogen Oxide Emissions from Natural Gas fuelled Stationary Combustion Turbines Environment and Climate Change Canada May 2016 Table of Contents 1. Foreword...
AAS - Atomic Absorption Mono Element ppm Standard Solutions (Spectro ECON)
") CL01.0105 CL01.0106 CL01.0107 CL01.0126 CL01.0127 CL01.0135 CL01.0136 CL01.0137 CL01.0138 CL01.0205 CL01.0206 CL01.0207 CL01.0216 Aluminium standard solution (Spectro ECON) 8.948 g AlCl3.6H2O / l H2O Solution
CL01.0105 CL01.0106 CL01.0107 CL01.0126 CL01.0127 CL01.0135 CL01.0136 CL01.0137 CL01.0138 CL01.0205 CL01.0206 CL01.0207 CL01.0216 Aluminium standard solution (Spectro ECON) 8.948 g AlCl3.6H2O / l H2O Solution
DRPK-005
 1114 Seaco Avenue Deer Park, TX 77536 Ph: (713) 844-3200 Fax: (713) 844-3330 Report of Analysis Submitted By: Address: Contact: Item No.: Client Ref. No.: Date Received: Testing Period: Country of Origin:
Welcome to the H1 Software
 Welcome H1 Version Welcome to the H1 Software 2.01- May 2010 Introduction This version of the tool accompanies Horizontal Guidnace Note 1 Version 2.0 April 2010 (As Amended) Important Notes: This software
Greenhouse Gas Regulation (new Federal)
") Mercury & Air Toxics (MATS) Interstate Transport (CAIR/CSAPR) Regional Haze/Visibility Portland Cement NESHAP Greenhouse Gas Regulation (new Federal) Mercury & Air Toxics (MATS) Finalized December 2011
Mercury & Air Toxics (MATS) Interstate Transport (CAIR/CSAPR) Regional Haze/Visibility Portland Cement NESHAP Greenhouse Gas Regulation (new Federal) Mercury & Air Toxics (MATS) Finalized December 2011
State Of The Art (SOTA) Manual For Non-Hazardous Onsite Remediation Processes
 Manual For Non-Hazardous Onsite Remediation Processes") State Of The Art (SOTA) Manual For Non-Hazardous Onsite Remediation Processes July 1997 State of New Jersey Department of Environmental Protection Air Quality Permitting Program State of the Art (SOTA)
State Of The Art (SOTA) Manual For Non-Hazardous Onsite Remediation Processes July 1997 State of New Jersey Department of Environmental Protection Air Quality Permitting Program State of the Art (SOTA)
Newmont Mining Corporation Water Management Standard
 Page No: Page 1 of 5 1 PURPOSE AND OBJECTIVES This Global Standard sets the minimum Newmont requirements to proactively plan and manage water from exploration to post-closure in accordance with Newmont
METHOD 3 - GAS ANALYSIS FOR THE DETERMINATION OF DRY MOLECULAR WEIGHT. NOTE: This method does not include all of the
 312 METHOD 3 - GAS ANALYSIS FOR THE DETERMINATION OF DRY MOLECULAR WEIGHT NOTE: This method does not include all of the specifications (e.g., equipment and supplies) and procedures (e.g., sampling) essential
High Purity Acids Trace Elemental Analysis. Detect as low as 1 to 100 ppt
 High Purity Acids Trace Elemental Analysis Detect as low as 1 to 100 ppt High purity acids If you are looking for acids, look no further. Whether you are analyzing environmental samples, etching glass,
4. Where do the names of the elements come from? Some were named as substances before they were known to be elements. sulfur 16
 4. Where do the names of the elements come from? Some were named as substances before they were known to be elements. silver 47 sulfur 16 copper 29 Some are named from the natural substance that they are
Alinta Cogeneration (Wagerup) Pty Ltd Alinta Wagerup Units 1 2
 Pty Ltd Alinta Wagerup Units 1 2") Pty Ltd Alinta Wagerup Units 1 2 STACK EMISSIONS MANAGEMENT PLAN WP03100-EV-PL-0006 Rev 1 October 2006 Pty Ltd Alinta Wagerup Units 1 2 STACK EMISSIONS MANAGEMENT PLAN WP03100-EV-PL-0006 Rev 1 October
Pty Ltd Alinta Wagerup Units 1 2 STACK EMISSIONS MANAGEMENT PLAN WP03100-EV-PL-0006 Rev 1 October 2006 Pty Ltd Alinta Wagerup Units 1 2 STACK EMISSIONS MANAGEMENT PLAN WP03100-EV-PL-0006 Rev 1 October
Strong Acid Leachable Metals (SALM) in Soil - Prescriptive
 in Soil - Prescriptive") Strong Acid Leachable Metals () in Soil - Prescriptive Metals Revision Date: Sept 15, 2017 Parameter Analytical Method Introduction Method Summary MDL(s) and EMS Analyte Code(s)* Metals in Soil and Sediment.
Strong Acid Leachable Metals () in Soil - Prescriptive Metals Revision Date: Sept 15, 2017 Parameter Analytical Method Introduction Method Summary MDL(s) and EMS Analyte Code(s)* Metals in Soil and Sediment.
COMAR Amendments and Regulation.12 Standards for Biomass Fuel-Burning Equipment Equal to or Greater Than 350,000 Btu/hr
 Department of the Environment COMAR 26.11.09 Amendments and Regulation.12 Standards for Biomass Fuel-Burning Equipment Equal to or Greater Than 350,000 Btu/hr October 30, 2013 Topics Covered Standards,
PM Compliance Options for MACT and MATS Rules. Ed McCall PCME
 PM Compliance Options for MACT and MATS Rules Ed McCall PCME 1 First Some Definitions: PM- CEM, PM-CPMS and BLDs PM-CEM (PM- Continuous Emission Monitor) PM-CPMS (PM-Continuous Parametric Monitoring System)
ATI FLAT ROLLED PRODUCTS Brackenridge, PA for technical competence in the field of
 A2LA has accredited Brackenridge, PA for technical competence in the field of Mechanical Testing This laboratory is accredited in accordance with the recognized International Standard ISO/IEC 17025:2005
High-Purity Acids & Reagents
 J.T.Baker Brand High-Purity Acids & Reagents Purity and consistency are essential for all reagent chemicals, particularly acids. Whether used for tracemetal analysis or for general use, aligning the correct
Certificate of Compliance
 Certificate of Compliance DUNS Document Date URL for Additional Information 00-489-5751 Apr 26, 2017 Fairchildsemi.com Contact Title Phone Email Jolene Small Product Ecology Manager 207-761-6214 jolene.small@fairchildsemi.com
Excerpt of Thermal Power Guidelines for New Plants
 Excerpt of Thermal Power Guidelines for New Plants The following is an excerpt of the Thermal Power guidelines for New Plants, a complete version of which is found in the Pollution Prevention and Abatement
Swedish Environmental Protection Agency Code of Statutes
 Swedish Environmental Protection Agency Code of Statutes ISSN 1403-8234 Swedish Environmental Protection Agency Regulations on Assessment of Air Quality; enacted 23 June 2010. NFS 2010:8 Printed 8 July
calcium oxide removes acidic oxides basic oxides acidic oxides basic oxides Iron obtained from the blast furnace is contaminated with
 1 Iron from a blast furnace is treated with and with calcium oxide to make steel. Which substances in the are removed? removes calcium oxide removes acidic oxides basic oxides acidic oxides basic oxides
CERTIFICATE OF ACCREDITATION
 CERTIFICATE OF ACCREDITATION ANSI-ASQ National Accreditation Board 500 Montgomery Street, Suite 625, Alexandria, VA 22314, 877-344-3044 This is to certify that 2609 North River Road Port Allen, LA 70767
Recommended List of Common Impurities for Metallic Fixed-point Materials of the ITS-90
 Recommended List of Common Impurities for Metallic Fixedpoint Materials of the ITS90 Dean Ripple 1, Anatoly Pokhodun 2, Peter Steur 3, Gregory Strouse 1 and Osamu Tamura 4 1 National Institute of Standards
Can your unit pass a Particulate Emission Compliance Test?
 Source Emissions Testing and Emissions Specialists Can your unit pass a Particulate Emission Compliance Test? Kevin Crosby The Avogadro Group, LLC California - Oregon - Arizona McIlvaine Hot Topic Hour,
Emission Estimation Technique Manual
 National Pollutant Inventory Emission Estimation Technique Manual for Sewage Sludge and Biomedical Waste Incineration First published in February 1999 EMISSION ESTIMATION TECHNIQUE MANUAL FOR SEWAGE SLUDGE
Accreditation No: LAB 023
 Accreditation No: Awarded to Chemical & Environmental Laboratory, SGS Pakistan Private Limited. Karachi, Pakistan. H-3/3, Sector 05, Korangi Industrial Area, Karachi, UAN. +92 21 111 222 747 The scope
Elemental Analysis (EA)
") Elemental Analysis Elemental Analysis (EA) - Weight percentages of C, H, N, S done by combustion in O 2 - Gas chromatographic analysis of CO 2, H 2 O and N 2, SO 2 - Oxygen as CO - Other elements such
Elemental Analysis Elemental Analysis (EA) - Weight percentages of C, H, N, S done by combustion in O 2 - Gas chromatographic analysis of CO 2, H 2 O and N 2, SO 2 - Oxygen as CO - Other elements such
Notification of Department of Industrial Works
 tification of Department of Industrial Works Subject: Type or category of factory required to prepare a report of type and quantity of pollutants discharged from a factory B.E. 2553 (2010) It is deemed
ISO INTERNATIONAL STANDARD. Iron ores Determination of various elements by X-ray fluorescence spectrometry Part 1: Comprehensive procedure
 INTERNATIONAL STANDARD ISO 9516-1 First edition 2003-04-01 Iron ores Determination of various elements by X-ray fluorescence spectrometry Part 1: Comprehensive procedure Minerais de fer Dosage de divers
NATIONAL REGULATION AND BORDER CONTROL ACTIVITIES IN THAILAND
 The Workshop 2012 of the Asian Network for Prevention of Illegal Transboundary Movement of Hazardous Wastes 20-23 November 2012 Cebu, Philippines NATIONAL REGULATION AND BORDER CONTROL ACTIVITIES IN THAILAND
Alter NRG Plasma Gasification: Environmental Performance
 Alter NRG Plasma Gasification: Environmental Performance Deep Dive Workshop on Waste-to-Energy Session C 216 Asia Clean Energy Forum, 7 June 216 ALTER NRG PLASMA GASIFICATION PROCESS A WASTE REDUCTION
GENERAL PERMIT WMGR098 BENEFICIAL USE OF WASTE FOUNDRY SAND AND SAND SYSTEM DUSTS
 A. Description: The approval herein granted is limited to the beneficial use of waste foundry system sand and sand system dusts (hereinafter referred to as waste foundry sand) generated by ferrous metal
Air & Stack Emissions AIR PT Workplace Air, Ambient Air and Stack Emissions PT Scheme Application Form
 -17 Please complete all sections below and return to LGC Standards Proficiency Testing by email, fax or post. LGC lab number (if applicable): AR Purchase order no.: (compulsory) Samples Round Despatch
13 February Nathan Wood Hamcon Civil Pty Ltd PO Box 2356 Orange NSW Our ref: L Dear Nathan, Water analysis - Bald Hill Quarry
 Envirowest Consulting Pty Ltd ABN 18 103 955 246 9 Cameron Place, PO Box 8158, Orange NSW 2800 Tel (02) 6361 4954 Fax (02) 6360 3960 Email admin@envirowest.net.au Web www.envirowest.net.au Environmental
Testing Report. Applicant: XX Overall Rating: XX Data Satisfactory Contact(s): XX Unsatisfactory Others, See Detail Enclosed
: XX Unsatisfactory Others, See Detail Enclosed") Applicant: Overall Rating: Data Satisfactory Contact(s): Unsatisfactory Others, See Detail Enclosed Sample Information Client: Supplier: Factory: Item No.: Description: HEART PENDANT BEADED BRACELET PO
Applicant: Overall Rating: Data Satisfactory Contact(s): Unsatisfactory Others, See Detail Enclosed Sample Information Client: Supplier: Factory: Item No.: Description: HEART PENDANT BEADED BRACELET PO
CANADA BRITISH COLUMBIA WATER QUALITY MONITORING AGREEMENT
 CANADA BRITISH COLUMBIA WATER QUALITY MONITORING AGREEMENT WATER QUALITY ASSESSMENT OF Salmon River AT SALMON ARM (1985 24) Prepared by: L. G. Swain, P. Eng. B.C. Ministry of Environment Prepared for:
PERFORMANCE AGREEMENT CONCERNING AIR POLLUTANTS FROM BASE METALS FACILITIES (herein Agreement ) BETWEEN
 BETWEEN") PERFORMANCE AGREEMENT CONCERNING AIR POLLUTANTS FROM BASE METALS FACILITIES (herein Agreement ) BETWEEN HER MAJESTY THE QUEEN IN RIGHT OF CANADA, AS REPRESENTED BY THE MINISTER OF THE ENVIRONMENT WHO IS
PERFORMANCE AGREEMENT CONCERNING AIR POLLUTANTS FROM BASE METALS FACILITIES (herein Agreement ) BETWEEN HER MAJESTY THE QUEEN IN RIGHT OF CANADA, AS REPRESENTED BY THE MINISTER OF THE ENVIRONMENT WHO IS
Haryana Test House & Consultancy Services, 50-C, Sector-25, Part-II, HUDA, Panipat, Haryana. Discipline Chemical Testing Issue Date
 Last Amended on 15.09.2014 Page 1 of 12 I. AIR, GASES & ATMOSPHERE 1. Ambient Air Particulate Matter (PM 10 ) IS: 5182 (Part-23) : 2006 (RA2012) 10 to 200 g/m 3 Particulate Matter (PM 2.5 ) Carbon Monoxide
USP Chapters <232> and <233> Implementation Strategy. Horacio Pappa, Ph.D. Director - General Chapters U.S. Pharmacopeia
 USP Chapters and Implementation Strategy Horacio Pappa, Ph.D. Director - General Chapters U.S. Pharmacopeia Chapter Heavy Metals - Issues 1. Difficulties in reproducibility Monitor solutions/standards
CAM does have exemptions for certain emission units as follows: Page 1 of 8
 Title: Authors: PM CEMS: The Current Reality of Monitoring Particulate Matter Ms. Robynn Andracsek, Burns & McDonnell Ms. Mary Hauner, Burns & McDonnell Mr. Craig Clapsaddle, MSI/Mechanical Systems, Inc.
Mercury Sampling: A Comparison of Common Test Methods
 Mercury Sampling: A Comparison of Common Test Methods Tina Sanderson, B.Sc. QSTI Senior Specialist Emission Testing ORTECH Consulting Inc. AWMA Ontario Section Air and Acoustic Monitoring Conference October
for production of 2-[ F]-fluoro-2-deoxy-D-glucose with the
![for production of 2-[ F]-fluoro-2-deoxy-D-glucose with the](/thumbs/78/76807906.jpg "for production of 2-[ F]-fluoro-2-deoxy-D-glucose with the") Reagents Kit 18 for production of 2-[ F]-fluoro-2-deoxy-D-glucose with the GE TRACERlab MX FDG Module Catalog No.: RK-100 Date of Manufacturing: Sep.16 2008 Lot No.: RK-100-080916 Expiry Date: Sep.15 2009
Reagents Kit 18 for production of 2-[ F]-fluoro-2-deoxy-D-glucose with the GE TRACERlab MX FDG Module Catalog No.: RK-100 Date of Manufacturing: Sep.16 2008 Lot No.: RK-100-080916 Expiry Date: Sep.15 2009
June 8, Submitted to: The Environmental Protection Agency Research Triangle Park, NC. Prepared by:
 Performance Specification YY: Specifications and Test Procedures for X- Ray Fluorescence Based Multi-Metals Continuous Emission Monitoring Systems at Stationary Sources June 8, 2005 Submitted to: The Environmental
A COMPREHENSIVE APPROACH TO POWER PLANT TOXIC RELEASE INVENTORIES
 A COMPREHENSIVE APPROACH TO POWER PLANT TOXIC RELEASE INVENTORIES Edward S. Rubin and Mark D. Bedillion Center for Energy and Environmental Studies Carnegie Mellon University, Pittsburgh, PA 15213 Pittsburgh,