Advanced Nuclear Fuel
|
|
|
- Raymond Claud Chambers
- 5 years ago
- Views:
Transcription


1 Nuclear Development Advanced Nuclear Fuel Cycles and Radioactive Waste Management N U C L E A R E N E R G Y A G E N C Y
2
3 Nuclear Development Advanced Nuclear Fuel Cycles and Radioactive Waste Management OECD 2006 NEA No NUCLEAR ENERGY AGENCY ORGANISATION FOR ECONOMIC CO-OPERATION AND DEVELOPMENT
4 ORGANISATION FOR ECONOMIC CO-OPERATION AND DEVELOPMENT The OECD is a unique forum where the governments of 30 democracies work together to address the economic, social and environmental challenges of globalisation. The OECD is also at the forefront of efforts to understand and to help governments respond to new developments and concerns, such as corporate governance, the information economy and the challenges of an ageing population. The Organisation provides a setting where governments can compare policy experiences, seek answers to common problems, identify good practice and work to co-ordinate domestic and international policies. The OECD member countries are: Australia, Austria, Belgium, Canada, the Czech Republic, Denmark, Finland, France, Germany, Greece, Hungary, Iceland, Ireland, Italy, Japan, Korea, Luxembourg, Mexico, the Netherlands, New Zealand, Norway, Poland, Portugal, the Slovak Republic, Spain, Sweden, Switzerland, Turkey, the United Kingdom and the United States. The Commission of the European Communities takes part in the work of the OECD. OECD Publishing disseminates widely the results of the Organisation s statistics gathering and research on economic, social and environmental issues, as well as the conventions, guidelines and standards agreed by its members. * * * This work is published on the responsibility of the Secretary-General of the OECD. The opinions expressed and arguments employed herein do not necessarily reflect the official views of the Organisation or of the governments of its member countries. NUCLEAR ENERGY AGENCY The OECD Nuclear Energy Agency (NEA) was established on 1 st February 1958 under the name of the OEEC European Nuclear Energy Agency. It received its present designation on 20 th April 1972, when Japan became its first non-european full member. NEA membership today consists of 28 OECD member countries: Australia, Austria, Belgium, Canada, the Czech Republic, Denmark, Finland, France, Germany, Greece, Hungary, Iceland, Ireland, Italy, Japan, Luxembourg, Mexico, the Netherlands, Norway, Portugal, Republic of Korea, the Slovak Republic, Spain, Sweden, Switzerland, Turkey, the United Kingdom and the United States. The Commission of the European Communities also takes part in the work of the Agency. The mission of the NEA is: to assist its member countries in maintaining and further developing, through international co-operation, the scientific, technological and legal bases required for a safe, environmentally friendly and economical use of nuclear energy for peaceful purposes, as well as to provide authoritative assessments and to forge common understandings on key issues, as input to government decisions on nuclear energy policy and to broader OECD policy analyses in areas such as energy and sustainable development. Specific areas of competence of the NEA include safety and regulation of nuclear activities, radioactive waste management, radiological protection, nuclear science, economic and technical analyses of the nuclear fuel cycle, nuclear law and liability, and public information. The NEA Data Bank provides nuclear data and computer program services for participating countries. In these and related tasks, the NEA works in close collaboration with the International Atomic Energy Agency in Vienna, with which it has a Co-operation Agreement, as well as with other international organisations in the nuclear field. OECD 2006 No reproduction, copy, transmission or translation of this publication may be made without written permission. Applications should be sent to OECD Publishing: rights@oecd.org or by fax (+33-1) Permission to photocopy a portion of this work should be addressed to the Centre Français d exploitation du droit de Copie, 20 rue des Grands Augustins, Paris, France (contact@cfcopies.com).
5 FOREWORD Advanced fuel cycle options address some of the problems raised by the long-term radiotoxicity of high-level waste (HLW) by burning most of the long-lived minor actinides. Reducing the amount of actinides to be disposed of does not facilitate the short- and medium-term waste management, because a key issue during that timeframe is the heat generated by fission products. However, advanced separation technologies may offer alternatives for the management of the trouble-maker fission products, such as nuclides generating large amounts of heat. Earlier studies have concluded that partitioning facilities for actinides (such as plutonium, americium, curium and neptunium) and some long-lived fission products could be designed and constructed as extensions to existing reprocessing plants, although much work remains to be done to make these extensions compatible with industrial reprocessing practices. Many studies have demonstrated that fast-neutron-spectrum devices (dedicated fast reactor or accelerator-driven facilities) are more efficient than current light water reactors for recycling and transmuting long-lived radionuclides. A previous NEA study on advanced fuel cycles showed that the development of such cycles relies on new reactor designs which will require substantial, long-term R&D efforts and will likely take decades to implement. The scope of the present study and the fuel cycles assessed are introduced in the first two chapters. The waste categories used in this study and the secondary waste flows generated in different fuel cycle steps are presented in Chapter 3. In Chapter 4, the alternative fission product management options are described. The results of the HLW repository performance assessment calculations are presented in Chapter 5. The economic aspects of transmutation strategies are analysed in Chapter 6. Each technical chapter carries its own conclusions. The overall conclusions of the study are given in Chapter 7. 3
6
7 TABLE OF CONTENTS EXECUTIVE SUMMARY INTRODUCTION Background Sustainable development perspective Main results of earlier studies Current study References FUEL CYCLES Introduction Fuel cycle schemes Reactor and fuel cycle characteristics Analysis methods Results Conclusions References WASTE GENERATION PROCESSES AND WASTE CHARACTERISTICS Introduction Waste generated by processes of the fuel cycle Decommissioning waste Comparison between fuel cycles Conclusions References FISSION PRODUCT MANAGEMENT OPTIONS Fission product separation Fission product target fabrication Effects of heat-generating fission product separation ORIENT-cycle
8 4.5 Conclusions References WASTE MANAGEMENT AND DISPOSAL Introduction Disposal of LILW Geological disposal of HLW Evaluations of the impact of advanced fuel cycles on geological disposal of HLW Conclusions References ECONOMIC ANALYSES Introduction Methodology Results Conclusions References CONCLUSIONS APPENDICES Appendix A. List of Expert Group members Appendix B. Acronyms Appendix C. Fuel cycle descriptions and main data Appendix D. OREOX process for the fabrication of DUPIC fuel and the related waste types Appendix E. Simplified block diagrams of reprocessing processes Appendix F. Management of depleted and separated uranium Appendix G. Characteristics of the considered HLW waste packages Appendix H. Assessment of the disposal of HLW from advanced fuel cycle schemes in the boom clay formation Appendix I. HLW disposal granite concept, Spain Appendix J. Performance assessment for different types of vitrified high-level radioactive waste using JNC H12 method Appendix K. HLW disposal salt concept Appendix L. Technical parameters and unit costs TABLES Table 2.1. Reactor design and fuel cycle parameters Table 2.2. Heavy metal mass flow and equilibrium fuel composition
9 Table 2.3. Heavy metal losses and fission products in HLW streams Table 2.4. Separated plutonium Table 2.5. Natural uranium consumption relative to Scheme 1a Table 3.1. Relative characteristics of fuel cycle generated waste Table 3.2. Waste categories Table 3.3. NPP operational waste arising and their indirect sources Table 3.4. Amount of conditioned waste generated by the reprocessing plants Table 3.5. Waste flows generated by the reprocessing plants Table 3.6. Estimated amount of waste generated by decommissioning Sellafield (United Kingdom) commercial reprocessing plant Table 4.1. Experimental fabrication and irradiation of FP targets Table 4.2. Evaluated number of vitrified HLW canisters Table 5.1. Required excavation length for different schemes (ENRESA calculations for a repository in granite) Table 5.2. High-level waste types arising, thermal outputs and needed length of disposal galleries for a maximum linear thermal loading of 300 W/m (SCK CEN calculation for a repository in clay) Table 5.3. Calculated utilisation limits in an unsaturated tuff repository Table 5.4. Thermal outputs from HLW after 50 and 200 years of cooling Table 5.5 Main contributors to the total dose FIGURES Figure 1. Comparison of eleven representative indicators for various fuel cycle schemes Figure 2.1. Schemes based on current industrial technology and possible extensions Figure 2.2. Schemes with partially closed fuel cycles Figure 2.3. Schemes with fully closed fuel cycles Figure 2.4. TRU inventories Figure 2.5. TRU losses to waste Figure 2.6. Decay heat per scheme relative to Scheme 1a Figure 2.7 Long-term evolution of decay heat from actinides in waste Figure 2.8. Uranium mass balances Figure 3.1. Diagram of some depleted UF 6 management options Figure 3.2. Fabrication process of actinide nitride fuel Figure 3.3. Examples of carbide fuel fabrication processes Figure 3.4. NPP operational waste flow streams Figure 3.5. Total amount of short-lived low- and interdediate-waste types
10 Figure 3.6. Total amount of long-lived low- and interdediate-waste types Figure 3.7. Total amount of conditioned high-level waste Figure 3.8. Amount of decommissioning LILW-SL (uranium mining excluded) Figure 3.9. Amount of decommissioning LILW-LL (uranium mining excluded) Figure 4.1. Possible flow sheet of LLFP transmutation Figure 4.2. Scenarios for comparative study Figure 4.3. Concept of ORIENT-cycle Figure 4.4. Conceptual separation flow sheet of ORIENT-cycle (aqueous process) Figure 4.5. Mass reduction of vitrified HLW Figure 5.1. Underground installations for a reference repository concept in granite (Spain).. 84 Figure 5.2. Scheme of the near field of a repository in clay (Belgium) Figure 5.3. Sketch of a disposal facility in salt (Germany) Figure 5.4. Conceptual design of a disposal facility in unsaturated tuff (United States) Figure 5.5. Calculated maximum temperatures in the bentonite buffer as a function of the distance between 2 high-level waste containers (ENRESA calculations for a repository in granite) Figure 5.6. Evolution of temperature relevant for salt creep calculation Figure 5.7. Schematic illustration of the predictability of various components of a geological repository system over time Figure 5.8. Dose per radionuclide in Scheme 1a Figure 5.9. Dose per radionuclide due to vitrified waste in Scheme 1b Figure Normalised total doses for the different schemes Figure Comparison of total dose Figure Dose for each radionuclide for Scheme 1b Figure Total dose and its main contributors calculated for Scheme 1a Figure Total dose and its main contributors calculated for Scheme 3cV Figure Total dose calculated for Schemes 1a, 1b, 2a, 3cV1 and 3cV1 with separation of Cs/Sr Figure Calculated dose for waste from Scheme 1a Figure Calculated dose for waste from Scheme 2a Figure Calculated dose for waste from Scheme 3cV Figure Normalised dose rates for Schemes 1a, 1b, 2a, and 3cV1 in an unsaturated tuff repository Figure Evolution of the activity in the waste as function of time Figure Schematic illustration of the coverage of the expected reliability of the main components of a geological repository system by different elements of the waste management policies
11 Figure 6.1. Main steps of the nuclear fuel cycle schemes considered in the study Figure 6.2. Relative total generation costs calculated with the nominal values of the unit costs Figure 6.3. Ranges of relative total generation costs Figure 6.4. Result of Monte-Carlo analysis for total generation costs Figure 6.5. Relative fuel cycle cost ranges Figure 6.6. Result of Monte-Carlo analysis for fuel cycle costs Figure 6.7. Dependence of relative total generation cost on FR investment cost Figure 6.8. Dependence of relative total generation cost on ADS investment cost Figure 6.9. Dependence of relative total generation cost on pyroprocessing cost Figure Dependence of relative fuel cycle cost on pyroprocessing cost Figure Dependence of relative total generation cost on uranium price Figure Dependence of relative fuel cycle cost on uranium price Figure 7.1. Comparison of eleven representative indicators for various fuel cycle schemes
12
13 EXECUTIVE SUMMARY This study was carried out by the ad hoc Expert Group on the Impact of Advanced Fuel Cycles on Waste Management Policies convened under the auspices of the NEA Committee for Technical and Economic Studies on Nuclear Energy Development and the Fuel Cycle (NDC); the Integrated Group on Safety Case from the Radioactive Waste Management Committee provided support in the field of waste repository issues; the Nuclear Science Committee Working Group on Flowsheet Studies provided also some input data. The study broadens the scope of the analyses carried out in previous Nuclear Energy Agency (NEA) studies on advanced fuel cycle schemes focusing on partitioning and transmutation (P&T) and accelerator-driven fuel cycle schemes (ADS). It addresses waste management issues, providing for the first time a performance assessment for several examples of high-level waste (HLW) repositories. The impact of different HLW isotopic compositions on repository performance is analysed. In addition, although current repository concepts have not been optimised for the new type of waste, the effect of advanced fuel cycle schemes on HLW repository capacity is assessed. The overall findings from the present study confirm the vision set up by previous NEA studies. In particular, they show that it is possible to establish a strategic progression towards a maximal reduction of the waste source term and a maximal use of uranium resources. The nine fuel cycle schemes and four variants investigated in the study illustrate the possibility to reduce the activity of the waste by burning plutonium, then minor actinides, and then to reduce specific uranium consumption (per unit of electricity generated) as the fraction of fast reactors in the mix is increased to 100%. Given the wide range and flexibility of advanced fuel cycles under development represented in this study by a limited number of representative schemes it should be feasible to design and implement safe and economic nuclear energy systems addressing efficiently natural resource and waste management issues. Strategic choices will be based on the priorities of policy makers which reflect country specific criteria such as characteristics of available waste repositories, access to uranium resources, size of the nuclear power programme, and social and economic considerations. The results of the study complement the analysis of effects of advanced fuel cycles on uranium use and transuranic losses by a description of their impact on waste management policies. The issues addressed include the activity of HLW after years, their decay heat after 50 and 200 years of cooling, their volume and the maximum dose originating from underground repository concepts in four different host rocks, namely clay, granite, salt and tuff. The set of fuel cycle schemes considered covers a broader spectrum than it was the case in previous studies, including present industrial practices, partially-closed cycles and fully-closed cycles with fast-reactor systems. Fuel cycle schemes are analysed with emphasis on primary and secondary waste generated at each step. The compositions, activities and heat loads of all waste flows are tracked and their impact on the waste repository concepts mentioned above is assessed. The study also 11
14 investigates economic aspects based on parametric calculations relying on best available cost data and expert judgements. The data used in the study regarding processes and material flows for each fuel cycle scheme considered are drawn from published literature complemented by expert judgments whenever needed, e.g., because published data were scarce, uncertain, inconsistent or lacking. Qualitative comparisons with current technologies were used for relative assessments of innovative processes when reliable data were not available, in particular concerning secondary waste. Ranges of values have been used in the assessments to reflect uncertainties on the characteristics of advanced processes. In some cases, e.g. for unit costs of processes not yet fully developed at the industrial and commercial scale, sensitivity studies were carried out. In those cases, the width of the range reflects the level of technology preparedness and the nominal value adopted reflects the most likely value to be reached by mature technology, according to expert judgements. The sensitivity study approach provides insights on the impact of various assumptions on the findings from the analysis. The fuel cycle schemes considered in the study pertain to three main families. The first family, based on current industrial technology and its possible extensions, includes the current once-through fuel cycle in pressurised water reactors (PWRs) and schemes with only one fuel recycling. The second family includes schemes with partially-closed fuel cycles, all fully closed for plutonium, while neptunium is always transferred to waste. The schemes differ, however, with regard to the treatment of americium and curium. The study shows that these schemes are useful for managing the plutonium, but cannot qualify as transmutation strategies, defined as strategies that meet the customary hundredfold transuranic elements (TRU) reduction goal. Partially-closed fuel cycles cannot achieve high TRU reductions but they are reasonably easy to implement and are useful for reducing the amount of plutonium and minor actinides (MA) disposed of in the repository. A key feature of the third family of schemes is that the advanced reactors have fully-closed fuel cycles, meaning that all actinides are recycled continuously until they fission. As only reprocessing losses go to waste, fully-closed fuel cycles produce nearly actinide-free waste. The analyses were performed for schemes at equilibrium because the fuels and processes (reprocessing and fuel fabrication) considered in the study and hence the resulting waste streams are not sensitive to transient phenomena. However, in a holistic approach, the lead times necessary to reach equilibrium should be taken into account in the assessment of alternative schemes. The main findings from the study are summarised in Figure 1 on a logarithmic-scale spider graph which provides eleven representative indicators for illustrative schemes representative of the three families, including the reference once-through PWR fuel cycle scheme. The indicators selected for comparative assessment purpose are: x x x x x x x uranium consumption; TRU loss/transfer to waste; activity after years; decay heat after 50 years; decay heat after 200 years; HLW, including spent fuel, volume; maximum dose for repositories in granite; 12
15 x x x x maximum dose for repositories in clay; maximum dose for repositories in tuff; fuel cycle cost; and total electricity generation cost. Figure 1. Comparison of eleven representative indicators for various fuel cycle schemes Fuel Cycle Cost Total Generation Cost 10 1 Uranium Consumption Max. Dose (tuff) TRU Loss Max. Dose (clay) Activity (after 1000 yrs) Max. Dose (granite) Decay Heat (after 50yrs) 1a 1b 2a 3cV1 HLW Volume (+SF) Decay Heat (after 200yrs) Note: 1a: once-through PWR scheme (reference); 1b: 100% PWRs, spent fuel reprocessed and Pu reused once; 2a: 100% PWR, spent fuel reprocessed and multiple reuse of Pu; 3cV1: 100% fast reactors and fully closed fuel cycle. The uranium consumption is driven essentially by the fraction of fast reactors in the mix. While all the schemes based on light water reactors have uranium consumptions differing by less than 15%, schemes based on fast reactors reduce uranium consumption by more than two orders of magnitude. TRU loss is the indicator which is the most sensitive to the details of the schemes. Multirecycling can divide the TRU flow to waste by six and deeper burning schemes allow for a further reduction of up to two orders of magnitude of this flow. The activity of HLW after years describes the radioactive source term after decay of heat generating isotopes. At this horizon, the short-lived fission products have decayed strongly and the removal of actinides from the waste flux is very efficient in decreasing the cold source term. Indeed, the fully-closed fuel cycle schemes reduce by almost two orders of magnitude the activity of HLW after years. 13
16 Decay heat is a major input for the design of underground repositories. For disposal in granite, clay and tuff formations the maximum allowable disposal density is determined by thermal limitations. HLW arising from advanced fuel cycle schemes generates considerably less heat than the spent fuel arising from the reference PWR once-through scheme. This lower thermal output of HLW allows a significant reduction in the total length of disposal galleries needed. Separation of caesium and strontium reduces even further the required repository size. For example, in the case of disposal in a clay formation the gallery length needed in the HLW disposal is reduced by a factor 3.5 through a fully-closed cycle scheme as compared with the reference PWR once-through scheme and by a factor 9 through a scheme including separation of caesium and strontium. After 50 years of cooling, variations in decay heat of HLW do not exceed a factor of four for any of the fuel cycle schemes considered in the study. After 200 years, the decay heat of HLW would be reduced by a factor of up to 30 in all MA-burning schemes as compared to the reference PWR oncethrough scheme. Extending the cooling time from 50 to 200 years will result in a drastic reduction of the thermal output of HLW from advanced fuel cycle schemes and, consequently, of the repository size needed. The volume of HLW to dispose of is a driving factor to determine the total capacity of a given repository site. This volume is reduced significantly by closed fuel cycle schemes as compared with the reference PWR once-through scheme. Further HWR volume reductions, by an order of magnitude, are achievable by progressing towards deeper burning of minor actinides and lesser use of uranium. Differences in heat load and waste volume may have a major impact on the detailed concept of the repositories. This in turn has technical and economic impacts. For example, a given repository could receive the waste issued by the production of 5 to 20 times more electricity if the electricity were produced by advanced reactors associated with advanced fuel cycle processes than if it were produced by light water reactors operated once through. The maximum dose released to the biosphere at any time in normal conditions remains well below authorised limits for all the schemes and all the repositories considered. For all the repositories considered in the study, the maximum dose resulting from the disposal of the high-level waste does not differ significantly for any of the various fuel cycle schemes envisaged. The doses resulting from the disposal of HLW from fuel cycle schemes with reprocessing are at most a factor eight lower than those from the reference PWR once-through scheme. However, the lower dose mainly results from the removal of iodine 129 from the liquid HLW during reprocessing; should it be captured and disposed of in the HLW repository, the doses resulting from all scenarios would be about equal. In the very long-term, i.e. after a few million years, the total dose is lower in the case of the fully closed fuel cycle schemes, because much smaller amounts of actinides have to be disposed of in the repository. The economic analysis carried out in the study aims mainly at illustrating through parametric sensitivity cases the impacts of different cost elements, and moreover of the uncertainties on those elements, on the total fuel cycle costs of the various schemes considered. Therefore, the economic indicators displayed in Figure 1 are indicative only. The fuel cycle costs are directly correlated with the number of recycling operations. However, the large costs conservatively ascribed to the more innovative processes, such as pyrochemistry, have a small impact on the total fuel cycle cost due to the very small mass flows being processed. For all the schemes considered fuel cycle costs vary at most by a factor of two. 14
17 The share of waste management costs, including repository, in the total is low enough for uncertainties regarding the costs of this step of the fuel cycle to have no significant impact in total costs. However, it should be noted that, in absolute value, waste management costs represent sizeable amounts which justify cost reduction actions. Fuel cycle cost is only a small fraction of total nuclear electricity generation cost. Nuclear power is a capital intensive technology and the investment cost associated with building, refurbishing and eventually dismantling the reactor exceeds by far the fuel cycle cost. Therefore, the impact of various fuel cycle schemes on the economics of nuclear electricity remains marginal under any set of assumptions. The total electricity generation costs vary by no more than 20% from one scheme to the other and the uncertainties on unit costs and other parameters which increase with the degree of innovation in the fuel cycle scheme are of the same order of magnitude. The Monte Carlo simulation carried out in the Study illustrates the impact of the large uncertainties on unit costs on the comparative economic assessment of various schemes. It confirms that fuel cycle cost differences have a very modest impact on total electricity generation costs. It shows also that the range of uncertainties is broad enough to allow for the possibility that advanced schemes with recycling would have lower total generation costs than the reference PWR once-through scheme. 15
18
19 1. INTRODUCTION 1.1 Background A first series of comprehensive studies investigating the role and feasibility of P&T as an alternative waste management option was conducted in the 1970s predominantly in Europe. A renewed interest in P&T arose in the late 1980s, this time in Japan. A detailed history of this development has been described in [1]. The NEA has conducted a series of studies on P&T systems. The first study, between 1996 and 1998 [2], focused on a review of the progress in the separation of long-lived actinides and fission products, the options for their transmutation, and the benefit for waste management. Specific fuel cycle schemes were examined, covering plutonium-recycling and the additional burning of minor actinides in dedicated systems. However, the study did not address transmutation strategies with fully closed fuel cycles, or the technology of ADS, including the specific role of ADS in such closed fuel cycles. The second P&T systems study [1] complemented the first one. It aimed at clarifying the roles and relative merits of critical and sub-critical fast-spectrum systems in closed fuel cycles with the help of a set of representative fuel cycle schemes. It also assessed the development status of ADS with emphasis on reactor technology and safety, fuel cycle technology, cost/benefit issues, and general feasibility. The target values for the waste mass and radiotoxicity reduction to be achieved by an effective transmutation strategy were defined and the incentive for closed fuel cycles were discussed, including the role of fast-spectrum systems in such fuel cycles. One recent study [3] paid special attention to the non-technical aspects, especially sustainable dimensions of advanced fuel cycles. This report attempted, by taking an approach broader than only the economic and technical aspects, to lay a basis for a more comprehensive decision-aiding technique, i.e. multi-criteria analysis (MCA), that can be used in decision making concerning nuclear energy and other energy options. Representatives of different parts of society (stakeholders) could use this technique to assess the sustainability characteristics of a particular project. MCA is based on the identification of the criteria associated with a sustainable development approach and of their key quantifying indicators. The present study focuses on the impact of advanced fuel cycles on waste management policies. The set of fuel cycles considered here covers a broader spectrum than previous studies, from present industrial practice to fully closed, fast reactor cycles, via partially closed cycles. Elements of fuel cycles are considered primarily as sources of waste (both primary and secondary), the internal mass flows of each cycle being kept for the sake of mass conservation. The masses, compositions, activities and heat loads of all waste flows are tracked. Their impact is finally assessed on waste repository concepts located in four different host rocks: clay, granite, tuff and salt. A track of economic impacts has been kept as well. 17
20 1.2 Sustainable development perspective A central goal of sustainable development is to maintain or increase the overall assets (natural, man-made and human or social assets) available to future generations. The aim of advanced fuel cycles is to improve the sustainability of nuclear energy by enhancing the effectiveness of natural resource utilisation and by reducing the volume and long-term radiotoxicity of high-level waste while the costs of energy products, for example electricity, stay economically viable. Advanced fuel cycles address among others the problem of long-term radiotoxicity of HLW by burning the majority of the long-lived MA. Reducing the amount of actinides to be disposed of does not facilitate the short and medium term waste management issues, because the problem of the heat produced by the fission products remains as an important issue. However, the advanced separation technologies offer more degrees of freedom in waste management policies. For instance, after being separated from the main waste stream, some of the fission products that are key contributors to dose and heat output could be immobilised in specially designed matrices for disposal, or some of them could be stored separately and disposed after they have been cooled down, or some of them could be transmuted in reactors. This potential reduction of short-term heat load may have a direct impact on present repository concepts. Previous studies have shown that advanced fuel cycles reduce substantially the uranium consumption per unit of energy produced, and thereby all associated waste streams. More specifically, transmutation of actinides reduces the source term that dominates the released dose in the long and very long terms. The reduction of short-term heat load and long-term dose per TWhe can increase drastically the mass and volume of waste that can be disposed of in a given repository concept at a specific site. The present study aims at providing quantitative estimates of these effects. 1.3 Main results of earlier studies Earlier studies have concluded that partitioning facilities for actinides (such as plutonium, americium, curium and neptunium) and some long-lived fission products could be designed and constructed as extensions to existing reprocessing plants. But much work is still to be performed in order to make these extensions compatible with industrial reprocessing practices. Studies have constantly re-demonstrated that the fast neutron-spectrum devices [dedicated fast reactor (FR) or ADS facilities] are more efficient than current LWRs for recycling and transmuting long-lived radionuclides. FR and ADS have been found to have similar performances with respect to criteria concerning environmental friendliness. However, they differ considerably regarding their level of technology readiness and from the safety viewpoint. Being a sub-critical system, the advantage of the ADS reactor concept is that it has fewer limitations on the fuel composition as compared with reactors operated in critical mode. On the other hand, the coupling between a reactor and an accelerator presents a particular technological challenge [1]. Studies on fission product transmutation have shown that transmutation rates are in most cases insufficient to reduce significantly the heat generation and the mass of the disposed fission products. 18
21 Some of the long-lived fission products, such as 129 I and 99 Tc, could theoretically be transmuted by the excess neutrons available in FR and ADS. The study on trends in the nuclear fuel cycle [3] showed that the developments of advanced cycles rely on new reactor concepts which will require substantial long-term R&D efforts and will likely take decades to implement. Furthermore, the partitioning and transmutation fuel cycles may need operation for decades to reach equilibrium and to achieve the claimed significant reduction of the radiotoxicity of the waste. 1.4 Current study The aim of the current study is to analyse a range of advanced fuel cycle options from the perspective of their effect on waste management policies. The characteristics of radioactive waste generated by advanced nuclear fuel cycles are evaluated. The fuel cycles considered illustrate differences between various technologies, they are not intended to represent foreseeable future options. The effects of the advanced fuel cycles on the management of waste are presented relative to the current technologies, using tools such as repository performance analysis and cost studies. The current study extends the analysis performed in previous studies and assesses the fuel cycles as a whole including all radioactive waste generated in each step of the cycles. Comparisons, more qualitative in nature, to current technologies are used as a basic method, as the waste generation data, especially secondary waste, for the advanced technologies are mainly based on estimates by experts. A novelty of this study is the performance assessment performed for the HLW repositories. Two aspects of the impact of different HLW forms and radionuclide inventories arising from different fuel cycles are analysed: their impact of on repository performance; and the effect on repository size and cost, though current repository concepts have not been optimised for the new type of waste. References [1] NEA (2002), Accelerator-driven Systems (ADS) and Fast Reactors (FR) in Advanced Nuclear Fuel Cycles; A Comparative Study, OECD, Paris. [2] NEA (1999), Actinide and Fission Product Partitioning and Transmutation; Status and Assessment Report, OECD, Paris. [3] NEA (2002), Trends in the Nuclear Fuel Cycle; Economic, Environmental and Social Aspects, OECD, Paris. 19
22
23 2. FUEL CYCLES 2.1 Introduction The long-term goal of sustainable, radiologically clean nuclear energy systems is an important driver for the development of advanced fuel cycles. The goal may be approached in successive steps with emphasis, first, on an improved management of the plutonium and, then, on an additional management of the minor actinides neptunium, americium and curium by integrating P&T technologies in the fuel cycle. Different approaches for implementing such technologies have been proposed. A meaningful comparison of the possible choices with regard to the quantity and composition of the resulting high-, intermediate- and low-level waste and the impacts on repository performance requires a thorough analysis of the mass flows at each step of fuel cycle for all the reactors included in each scheme. This is the purpose of this chapter. To facilitate the task, the Expert Group selected a number of fuel cycle schemes which are representative of most presently considered options. The selection of the schemes was guided by the following considerations: x x x As the low resource efficiency of LWRs will not become a limiting factor in the foreseeable future, the LWRs can be expected to remain the principal components of reactor mixes. Accordingly, most of the selected schemes incorporate LWRs. A Generation IV (Gen-IV), all-fr scheme is considered because it represents a long-term goal of nuclear energy development. As the conditions for the transient phases of nuclear energy development vary widely between countries and are subject to large uncertainties, the analyses are performed using a steady-state approach for each scheme, i.e. it is assumed that all reactors operate at constant power and all mass flows have reached an equilibrium. In the light of the large variety of schemes evaluated in the study, its results should permit the assessment of a country specific scenario. Proliferation resistance is outside the scope of the present study and was not considered as a basic criterion. However, it is discussed when it has influenced the selection of a scheme. The mass flow of separated, pure plutonium has been used as a rough indicator for comparing the proliferation sensitivity of different schemes. Nine main fuel cycle schemes and 4 variants, grouped in 3 families, were selected for analysis and comparison within the study. Sections 2.2 and 2.3 of this chapter present the basic characteristics of the selected schemes including reactor types. Section 2.4 describes the analysis methods and explains why a steady-state approach is appropriate for the present study, and Section 2.5 summarises the principal results with emphasis on the masses of heavy metal (HM), TRU and fission products disposed to high-level waste. Particular attention is paid to the decay heat which has consequences for the reprocessing of the fuel as well as the handling, conditioning and final disposal of the waste. Additional information concerning the schemes including reactors is given in Appendix C. 21
24 The analyses comprise the optimisation of the different reactor cores as well as the calculation of the reactor support ratios, mass flows, fuel compositions, and fuel inventories at equilibrium. As these depend on the amount and composition of the fuel which is reloaded into the reactors, it is necessary to make assumptions regarding the efficiency of the fuel recovery processes. The actinides which are not recovered and all fission products are assumed to go to high-level waste. Being restricted to reactor and fuel cycle physics, however, the methods are not capable of assessing intermediate- and low-level waste arisings which are considered also in this study. These will be derived from the flow sheets presented in Chapter Fuel cycle schemes Considering the different potential regarding waste reduction, the required investment in advanced technology, and the different time scale for the development and implementation of this technology, it is appropriate to distinguish between three families of fuel cycle schemes: x Schemes based on current industrial technology and possible extensions. x Schemes with partially closed fuel cycles. x Schemes involving fully closed fuel cycles. The principal features of the 3 families of schemes are illustrated in Figures 2.1, 2.2 and 2.3, respectively. Some of these schemes were analysed already in an earlier NEA [1]. The present study complements previous analyses extending the scope to cover more conventional fuel cycles as well as Gen-IV systems. Furthermore, it emphasises waste management rather than reactor and fuel cycle aspects Current industrial technology and extensions Family 1 includes the current once-through fuel cycle in PWRs and schemes with a single recycle of the fuel. The once-through fuel cycle, Scheme 1a, will serve as the reference fuel cycle for all comparisons. Scheme 1b is the conventional reprocessing fuel cycle with a single recycling of the separated plutonium in the form of uranium-plutonium mixed-oxide (MOX) fuel. Scheme 1c is a more proliferation resistant variant of Scheme 1b where the neptunium goes with the plutonium, thereby avoiding the separation of pure plutonium. Scheme 1d, the DUPIC 1 fuel cycle with OREOX processing, avoids any chemical reprocessing. A brief description of this fuel cycle is given in Appendix D Partially closed fuel cycles Family 2 schemes feature fuel cycles which are fully closed for plutonium, while neptunium is always transferred to waste. The schemes differ, however, with regard to the treatment of americium and curium. Two of the schemes are remarkable in that they continuously recycle transuranic elements in PWRs only [2]. All fuels are reprocessed using aqueous ( wet ) methods, either PUREX, or advanced PUREX if minor actinide separation is involved. 1. DUPIC = Direct Use of spent PWR fuel In CANDU reactors. 22
25 Schemes 2a and 2cV represent two plutonium burning strategies based on either PWRs or fast reactors (FR). The continuous plutonium recycling in Scheme 2a demands a special MOX fuel with enriched uranium (MOX-EU) to compensate for the degradation of the plutonium isotopic composition in the thermal neutron spectrum of the PWR. The fraction of fast reactors in Scheme 2cV could be reduced by incorporating one or two intermediate PWR-MOX stages between the PWRuranium oxide fuel (UOX) and the FR (a FR-based plutonium burning strategy with a single PWR- MOX stage was investigated in the previous study). Schemes 2b and 2c include americium burning in addition to the plutonium burning. The americium is recycled either homogeneously in PWRs using a special, americium-loaded MOX-EU fuel, or heterogeneously in FRs using moderated target assemblies which are directly disposed after irradiation. The concept for recycling minor actinides in moderated target assemblies is described in [3]. An additional processing step is required to separate the americium from the curium (A similar scheme in the previous study circumvented this step by heterogeneously recycling americium and curium together). An unusual feature of Schemes 2b, 2c and 2cV is a minor actinide storage facility with a delayed recycling option. After about 100 years, much of the stored curium would have decayed and, after some additional reprocessing, could be recycled as plutonium. It should, however, be clarified that the present analysis does not account for the effect of such a delayed recycling on the fuel composition Fully closed fuel cycles A key feature of the Family 3 schemes is that the advanced reactors have fully closed fuel cycles, meaning that all actinides are recycled continuously until they fission. As only reprocessing losses go to waste, fully closed fuel cycles produce practically actinide-free waste. The fuels are reprocessed using aqueous (UREX+ and advanced PUREX) as well as pyrochemical ( dry ) reprocessing methods. The latter are particularly suited for fully closed fuel cycles because they circumvent unnecessary separation processes (only fission products are extracted) and can cope with the very high decay heat of multi-recycled fuels (see Section 2.5.5). Schemes 3a and 3b are representative of two alternative P&T approaches, the integral fast reactor (IFR) system [4], based on critical TRU burners, and the double strata system [5] which burns the minor actinides in a dedicated ADS. 2 In the IFR system, the plutonium and the minor actinides are coprocessed; in the double strata system, plutonium and minor actinides are handled separately. In the latter, all plutonium is managed in conventional, MOX-fuelled LWRs and fast reactors. By avoiding a pure plutonium stream, Scheme 3a features high proliferation resistance, whereas Scheme 3b is unique in that it maximises electricity production in conventional reactors (LWRs and MOX-fuelled fast reactors). Scheme 3bV, a variant of the double strata system, circumvents the MOX-FR stage by transferring the plutonium from the MOX-PWR stage directly to the ADS fuel cycle. This may be attractive for countries without a FR programme, but implies a three times higher investment in ADS technology. For Schemes 3a, 3b and 3bV mass flows were available from the earlier study and were adopted in the present analyses; small differences in the assumptions for the fuel cycle parameters (see Table 2.1) do not influence the comparisons. 2. The ADS concept allows the degraded core characteristics of a minor actinide burner to be compensated by a sub-criticality margin. 23
26 Schemes 3cV1 and 3cV2 are representative of two all-fr strategies based on either Gen-IV gascooled fast reactors (GFRs) with carbide fuel or European fast reactor (EFR) -type sodium-cooled fast reactors with minor-actinide loaded MOX fuel. Scheme 3cV1 minimises the actinide losses to waste while simultaneously maximising the uranium resource utilisation. In the FR-MOX version of this scheme, the uranium is recovered from the irradiated fuel, but not recycled. This means that the fuel cycle of the FR in Scheme 3cV2 is not fully closed as in Scheme 3cV1. It should be noted that the closure of the fuel cycle in Scheme 3cV2 also for uranium would influence the uranium mass balance, but would not affect significantly the other characteristics of the scheme. Figure 2.1. Schemes based on current industrial technology and possible extensions Scheme 1a Once-through fuel cycle Reference fuel cycle. U enr. UOX fuel PWR 100% Direct disposal Scheme 1b Conventional reprocessing fuel cycle Plutonium is recycled once in the form of MOX. U enr. UOX fuel PWR 89% PUREX FP, MA Pu HLW ILW LLW U depl. Scheme 1c (Variant of Scheme 1b) Avoids the separation of pure plutonium by recycling the neptunium together with the plutonium. MOX fuel PWR 11% Direct disposal Scheme 1d DUPIC fuel cycle PWR spent fuel is reused in CANDU heavy water reactors while avoiding any chemical reprocessing. U enr. UOX fuel PWR 72.7% OREOX HM losses FP HLW ILW LLW HM, FP DUPIC fuel CANDU 27.3% Direct disposal 24
27 Figure 2.2. Schemes with partially closed fuel cycles Scheme 2a Plutonium burning in LWR Uses LWRs only. Requires MOX fuel with enriched uranium (MOX-UE). U enr. UOX fuel PWR 72 % HLW ILW LLW MOX - EU fuel PWR 28 % PUREX FP, MA H M losses Pu Scheme 2b Plutonium and americium burning in LWR Requires two types of MOX-UE fuel as well as americium-curium separation. The curium decay products (mostly plutonium) are either disposed or recycled as MOX fuel. U enr. UOX fuel MOX - EU1 fuel 33% 67% MOX - EU2 fuel PWR PWR PWR 54% 11% 35% Advanced PUREX Pu Am FP, N p HLW ILW LLW HM losses Cm Storage 100 years Pu Scheme 2c Heterogeneous americium recycling Americium is recycled in targets which are disposed after irradiation. Scheme 2cV (variant) Americium goes to storage facility, together with the curium. The decay products are either disposed or recycled as MOX fuel. U enr. U depl. UOX fuel MOX fuel Target fabrication PWR FR 44% 56% Irradiated targets Advanced PUREX Am Pu FP, Np HLW ILW LLW HM losses Cm Storage 100 years Pu 25
28 Figure 2.3. Schemes with fully closed fuel cycles Scheme 3a TRU burning in FR Based on Integral Fast Reactor concept. Avoids any separation of pure plutonium. U enr. UOX fuel PWR 63.2% UREX+ FP, HM losses TRU HLW ILW LLW U depl. Actinides Metal fuel FR 36.8% PYRO FP, HM losses Scheme 3b Double strata fuel cycle Burns all plutonium in conventional LWRs and fast reactors. U enr UOX f uel MOX f uel PWR PWR 66.0% 9.8% Advanced PUREX Advanced PUREX FP, HM losses MA Pu MA Pu HLW ILW LLW Scheme 3bV (variant) Circumvents the FR stage by transferring the plutonium from the PWR-MOX stage directly to the ADS fuel cycle. MOX f uel Nitride f uel FR ADS 19.0% 5.2% Advanced PUREX PYRO MA Actinides FP, HM losses Scheme 3cV1 All-FR strategy Based on Gen-IV gas-cooled fast reactor. U depl. Carbide fuel FR 100% PYRO FP, HM losses HLW ILW Scheme 3cV2 (variant) Based on EFR using MOX fuel reprocessed by UREX+. Uranium is not recycled. All actinides LLW 26
29 2.3 Reactor and fuel cycle characteristics The schemes are composed of PWRs, HWR CANDUs, FRs and fast-spectrum ADS which utilise different types of fuels. The 10 reactor-fuel combinations are: x PWR-UOX (All schemes except 3cV1 and 3cV2) EPR-type pressurised water reactor with uranium oxide fuel [6]. x PWR-MOX (Schemes 1b, 1c, 3b and 3bV) Same reactor with 100% MOX fuel. Variant with uranium-plutonium-neptunium mixed-oxide fuel (MOX-Np). x PWR-MOX-EU (Schemes 2a and 2b) As PWR-MOX, but with enriched instead of depleted uranium. Variant with different plutonium content and different fissile-plutonium and uranium enrichment (MOX-EU1), variant with admixed americium (MOX-EU2). x CANDU (Scheme 1d) CANDU heavy water reactor with DUPIC fuel. The concept is described in Appendix D. x FR-MOX (Schemes 3cV2, 2c and 2cV) EFR-type sodium-cooled FR [7] with minor-actinide loaded MOX-fuel (Scheme 3cV2). Plutonium burning variant (FR-MOX1) with pure MOX fuel, with or without irradiation positions for americium target assemblies (Schemes 2c and 2cV). x FR-HBU (Scheme 3b) EFR-type plutonium burner with a high burn-up core (HBU) [8]. The plutonium content of the MOX fuel is increased to 44% to maximise the plutonium consumption. For more information on the optimisation of this burner see plutonium burner in [1]. x FR-metal (Scheme 3a) Advanced liquid metal reactor (ALMR)-type sodium-cooled actinide burner with a metalfuelled, low conversion ratio core. The reactor model is the same as that used in the 600 MWe, metal-fuelled, multiple recycle burner core benchmark exercise of the NEA Nuclear Science Committee Working Party on the Physics Plutonium Recycling (currently Working Party on the Scientific Issues of Reactor Systems) [9]. For the core optimisation see critical TRU burner in [1]. x FR-carbide (Scheme 3cV1) Gas-cooled fast reactor (GFR) with solid solution carbide fuel as proposed for Gen-IV [10]. x ADS-MA (Scheme 3b) Small ADS with a lead-bismuth cooled core with nitride fuel, following a minor actinide burner concept proposed by JAERI [11]. The core geometry is similar to that of the ALMR Reference Model A. For detailed specifications see accelerator-driven minor actinide burner in [1]. x ADS-TRU (Scheme 3bV) ADS, lead-bismuth cooled TRU burner with nitride fuel [12]. Important fuel cycle parameters include fuel burn-up and cooling and storage time before reprocessing and after fabrication, and reprocessing losses. To achieve low actinide losses to waste, the fuel burn-up should be high, and the reprocessing losses should be small. Reprocessing losses of 0.1% are assumed for all fuel types and reprocessing methods. This value is an extrapolation from the current technology to a technology which can be expected to be available when advanced fuel cycles could be introduced on a large scale. 27
30 For some of the reprocessing methods, a recovery efficiency of 99.9% has already been proven on a laboratory scale. To ensure that transmutation strategies can meet the goal of a hundredfold reduction in the long-term waste radiotoxicity, it has to be demonstrated that such high recovery efficiencies can be achieved also on an industrial scale. An overview of the reactor design and fuel cycle parameters is given in Table 2.1. Reactor Thermal power (MW) Table 2.1. Reactor design and fuel cycle parameters Net electric power (MW) Electrical efficiency (%) Fuel Fuel burn-up (GWd/tHM) Storage/ cooling time (y) PWR-UOX UOX /5 3 PWR-MOX MOX /5 MOX-EU MOX-EU 60 2/5 CANDU DUPIC 15 2/ FR-MOX MOX 140 2/5 FR-HBU MOX 185 2/5 FR-metal Ac-Zr 140 1/2 FR-carbide (U,Pu)C-SiC 100 2/5 ADS-MA AcN-ZrN 150 1/2 ADS-TRU AcN-ZrN 150 1/ GWd/tHM for Scheme 1d and 50 GWd/tHM for Schemes 3a, 3b and 3bV GWd/tHM for Schemes 3b and 3bV years cooling for Scheme 1d and 4 years cooling for Schemes 3a, 3b and 3bV. 2.4 Analysis methods Steady-state simulation of the schemes The analysis of most fuel cycle schemes was performed by CEA/Cadarache, France. The mass flows for Schemes 3a and 3b (IFR and double strata systems) were drawn from a previous study [1]. CIEMAT, Spain, supplied the mass flows for Scheme 3bV, and KAERI, Republic of Korea, supplied all data for Scheme 1d (DUPIC fuel cycle). As mentioned before, the analysis was restricted to the equilibrium state of the schemes. The analysis of the schemes with partially and fully closed fuel cycles involves the difficulty of repeated fuel burn-up calculations with subtraction of the material which is not recycled and addition of top-up material when the recovered material is fabricated into new fuel. The calculations have to take into account the shutdown time for fuel reloading between reactor cycles as well as the fuel storage and cooling times. While ensuring, at any time, adequate reactor core characteristics, the iterations have to be continued until the fuel composition reaches equilibrium. The simulations of the Schemes 3bV and 1d were computed respectively with the EVOLCODE (or EVOL code) system developed by CIEMAT [13] and with the FAST code developed by KAERI [14]. All the other simulations were carried out using the DARWIN code system [15] developed by CEA, COGEMA, EDF and Framatome. The neutronic input data for DARWIN consist of selfshielded cross-sections and neutron fluxes, prepared by either the APOLLO2-CRONOS2 or the ECCO-ERANOS route. Both APOLLO2 [16], the standard French thermal reactor analysis code system, and the European fast reactor analysis code system ERANOS [17] use neutronic data libraries based on the JEF 2.2 nuclear data file. 28
31 The characteristics of the HLW during storage were calculated by means of the CESAR code [18]. Applying actinide decay chains with about 100 isotopes from 206 Pb to 257 Fm, this code calculates quantities such as activity, decay heat, neutron source strength, and radiotoxicity up to one million years. The library of the code includes 208 explicit fission products from 72 Zn to 166m Ho and 125 activation products. CESAR is particularly suited for this application because it accounts for the necessary number of explicit fission products for accurately predicting activity and decay heat, and can deal with the spontaneous fissions in californium which contributes significantly to the neutron emission of multi-recycled minor actinide fuels Choice of a steady-state approach The steady-state approach does not take into account that the equilibrium phase of a nuclear energy scenario is preceded by a deployment phase and followed by a shutdown phase when nuclear power plants are replaced eventually by another type of energy system. The deployment phase lasts until the heavy metal inventory of the fuel cycle has built up and the fuel composition has reached equilibrium. For a transmutation strategy with multiple recycling of the fuel, the deployment phase takes many decades. The transmutation benefits (i.e. the TRU and radiotoxicity reduction) are, however, not impeded during this time, although the detailed isotopic composition of the waste might show significant differences with the values for the cycle at equilibrium. The preservation of the TRU reduction of a transmutation strategy during the shutdown phase, on the other hand, requires the TRU inventory to be burnt in dedicated TRU burners when the reactors are phased out. Otherwise, the TRU inventory would become an important contributor to the total TRU waste legacy, even after a long operation of the reactors. The TRU inventory can be burnt either in critical TRU burners (FRs as in Scheme 3a), or in subcritical TRU burners (ADSs as in Scheme 3bV), whereby the burners consume, first, the remaining TRU from the decommissioned LWRs and, later, their own TRU inventory. After the shutdown of the LWRs, the TRU burners can continue operating by reloading their own fuel, and while the total fuel inventory decreases, the burners will progressively terminate operation until the TRU reduction goal is met, or the residual fuel inventory is no longer sufficient for running the last reactor [19, 20]. As to the significance of the transient phenomena for the present study, it should be noted that the fuels used, the processes applied (reprocessing and fuel fabrication) and hence the resulting waste are not sensitive to these phenomena. This means that, for the purpose of the present study, there is no need for a transient modelling. 2.5 Results Heavy metal mass flow and equilibrium fuel composition Table 2.2 summarises the results of the reactor and fuel cycle analyses in terms of the HM mass flow and the fuel composition at the end of the fuel cooling period (for the fuel cooling time after irradiation see Table 2.1). For reactors with partially or fully closed fuel cycles, the fuel composition corresponds to the equilibrium state of the scheme of which the reactor is a component. The HM mass flow is of importance because it determines the capacity of (a) the repository for fuels going directly to disposal and (b) the reprocessing plant for fuels to be recycled. In both cases, a higher mass flow results in an increased fuel cycle cost. 29
32 In comparison with the light water reactors, the HM mass flow of the heavy water reactor is large, and the mass flows of the fast-spectrum systems are smaller. It is interesting to note that the mass flows and the fuel burn-ups of all fuels investigated in the present study approximately obey a simple reciprocal law (for the fuel burn-up see Table 2.1). Regarding the fuel composition, unusual features are the high plutonium content of the FR-HBU fuel and the high TRU content of the ADS fuels (the ADS fuels are practically uranium free). The technological challenges arising from these unusual compositions will be discussed in Section Table 2.2. Heavy metal mass flow and equilibrium fuel composition Reactor (Scheme) Fuel composition after irradiation (%) HM mass flow (kg/twhe) 1 U Np Pu Am Cm PWR-UOX (1a) PWR-MOX (1b) PWR-MOX-Np (1c) PWR-MOX-EU (2a) PWR-MOX-EU1 (2b) PWR-MOX-EU2 (2b) CANDU (1d) FR-MOX (3cV2) FR-MOX1 (2c, 2cV) FR-HBU (3b) FR-metal (3a) FR-carbide (3cV1) ADS-MA (3b) ADS-TRU (3bV) Am targets (2c) Per TWhe of each reactor. 2. PWR-UOX (60 GWd/tHM) used in all Family 1 and Family 2 schemes, except Scheme 1d. 3. Per TWhe of the FR-MOX1 reactor in Scheme 2c. The characteristics of the irradiated americium targets in the heterogeneous recycling scheme (Scheme 2c) differ considerably from those of the fuels. For an effective TRU reduction in a single irradiation (the targets are not reprocessed), the targets are irradiated for 8 years to the very high burnup of 90%, meaning that 90% of the loaded americium is directly or indirectly fissioned. While the mass flow of the targets is small compared with that of the fuels, the remaining heavy metal is highly enriched in curium. The curium mass disposed with the targets amounts to about one third of that going to the special curium storage facility. 30
33 2.5.2 TRU inventories The multi-recycling of fuels in the Family 2 and 3 schemes leads to high in-pile and out-of-pile TRU inventories. These have safety implications due to their high radiotoxicity and influence the time constants under transient conditions, e.g., in the deployment and shutdown phases of a nuclear energy scenario (see Section 2.4.2). As the respective issues and requirements are different, it is appropriate to decompose the out-of-pile TRU inventory into: fresh fuel (fuel storage inventory); irradiated fuel (fuel cooling inventory); and in the case of Schemes 2b, 2c and 2cV minor actinide in storage facility (decay storage inventory). The inventories in Figure 2.4 have to be compared with in-pile inventories of 0.6 and 1.3 kg/mwe for the once-through and the conventional reprocessing fuel cycle (Schemes 1a and 1b), respectively. Figure 2.4 shows that all Family 2 schemes have similar fuel storage and fuel cooling inventories and that the thermal americium recycling and the substitution of PWRs by fast reactors somewhat increase the in-pile inventory. Regarding Scheme 2c, the in-pile inventory shown in Figure 2.4 is that of the fuel and is augmented by about 0.1 kg/mwe if the in-pile inventory of the americium targets is taken into account. The additional decay storage inventory in Schemes 2b and 2cV is significant as it is comparable to the in-pile inventory. Figure 2.4. TRU Inventories 20 TRU Inventory (kg/mwe) Decay storage Fuel cooling Fuel storage In-pile a 2b 2c 2cV 3a 3b 3bV 3cV1 3cV2 Fuel cycle scheme Regarding the schemes with fully closed fuel cycles, one can distinguish between the transmutation schemes (Schemes 3a, 3b and 3bV) and the all-fr schemes (Schemes 3cV1 and 3cV2). Whereas the TRU inventories of the transmutation schemes and the schemes with partially closed fuel cycles are comparable, a change to an all-fr scheme implies an increase in the TRU inventory by a factor of about 2. In the light of their smaller TRU inventories, transmutation strategies can respond to unexpected changes in the nuclear energy development programmes more flexibly than all-fr strategies. This is of importance, e.g., for preserving the transmutation benefits in the shutdown phase of a nuclear energy (see Section 2.4.2). Schemes 3a and 3bV feature respectively the smallest total, and the smallest in-pile, TRU inventory of all Family 2 and 3 schemes. 31
34 2.5.3 Heavy metal losses and fission products in HLW streams Compared with the once-through fuel cycle and the conventional reprocessing fuel cycle with vitrification, advanced fuel cycles generate additional waste streams with unusual characteristics, and these are processed into novel types of waste forms which influence waste management and disposal concepts. Table 2.3 quantifies the waste arising from the fuel cycle schemes in terms of the HM and fission product (FP) mass flow for different types of high-level waste. In the case of the Family 2 and 3 schemes, new types of waste arise from the irradiated americium targets and the pyrochemical reprocessing of metal, nitride and carbide fuels. If the material accumulating in the minor actinide storage facilities is not recycled, this material also has to be further processed and disposed. Waste from activated structural materials such as waste from the liquid-metal targets of the ADSs in Schemes 3b and 3bV, which also have to be disposed as high-level waste is not shown in the table. Table 2.3. Heavy metal losses and fission products in HLW streams (Mass flow in kg/twhe) Scheme Spent fuel HLW, wet processing HLW, dry processing Irradiated targets Decay storage Total HM FP HM FP HM FP HM FP HM HM FP 1a b c d a b c cV a b bV cV cV The results in Table 2.3 can be commented as follows: x The single recycle schemes (1b and 1c) with recovery of the irradiated uranium reduce the HM losses to waste only by a factor of about 10 as compared with the once-through fuel cycle. Family 3 schemes with fully-closed fuel cycles achieve at fold, or higher, HM reduction, but useful reduction factors in the range 200 to 700 can also be obtained with partially-closed fuel cycles. 32
35 x x x By replacing all thermal reactors by fast reactors, the fission product mass flow can be reduced by about 30%. The reduction results primarily from the higher electrical efficiency of the fast reactors (see Table 2.1). The all-fr Scheme 3cV2 allows the HM content of the waste from reprocessing to be reduced by a factor of 5 as compared with Scheme 1b. However, as the HM content of this waste is always small (7.7% for the plutonium burning Scheme 2a and less than 5% for all other schemes), the total waste mass to be vitrified is not noticeably affected by this reduction. Waste with particularly unusual characteristics arises from the irradiated targets in Scheme 2c, and from the minor actinide storage facilities, if the decay products are not recycled. Reductions in the heavy metal content alone have a negligible effect on the mass and volume of vitrified waste because the waste consists mainly of fission products and the fission product content of the glass is limited. 3 This means that the mass and volume of the vitrified waste can only be reduced by reducing the mass of the fission products. It appears that a saving of about 30% could be achieved by changing from an all-lwr to an all-fr reactor strategy TRU losses to waste An important goal in the development of advanced fuel cycles with or without P&T is a reduction in the long-term radiotoxicity of the waste which arises primarily from the TRU it contains. The TRU losses of the different fuel cycle schemes are compared in Figure 2.5. From this figure, the following conclusions can be drawn: x x x x The single recycle Schemes 1b, 1c and 1d reduce the TRU losses to waste by only about one third as compared with the once-through fuel cycle Scheme 1a. Scheme 2a, which closes the fuel cycle for plutonium but not for the minor actinides, achieves a TRU loss reduction factor of 3.4. This means that plutonium burning strategies are useful for managing the plutonium, but cannot qualify as transmutation strategies as a TRU reduction factor of 100 is a generally accepted P&T goal. Only the Family 3 schemes with fully closed fuel cycles achieve the hundredfold TRU reduction goal of P&T. Of the typical transmutation Schemes 3a, 3b and 3bV, the FR Scheme 3a features the highest reduction factor. In the pure breeding Scheme 3cV1, the closure of the fuel cycle also for uranium slightly increases the TRU mass flow to waste. The Family 2 schemes with minor actinide management (Schemes 2b, 2c and 2cV) achieve TRU reduction factors in the range 6 to 19 if the delayed recycle option for curium is not considered. These schemes fail to meet the hundredfold TRU reduction goal even if this option is implemented. It should be noted that the TRU losses in Figure 2.5 are potential losses. They apply to the equilibrium phase of the schemes and do not account for any TRU inventories which may be disposed when the reactors are phased out (see Section 2.4.2). 3. The limiting factors are the molybdenum concentration in the glass and the heat generation of the fission products (see Chapter 4). 33
36 Figure 2.5. TRU losses to waste (Mass flows in kg/twhe) 35 TRU to waste (kg/twhe) Decay storage HLW from reprocessing SF, irradiated targets 100 x 100 x 100 x 100 x 100 x 5 0 1a 1b 1c 1d 2a 2b 2c 2cV 3a 3b 3bV 3cV1 3cV2 Fuel cycle scheme Activity, decay heat and neutron source strength Closing the fuel cycle also for the minor actinides increases the activity of the fuel to a level far beyond the potentiality of current reprocessing methods. The previous study showed that some advanced fuels feature a more than 100 times higher decay heat and a more than times higher neutron source strength per kg HM than conventional UOX fuel. For the fuel cycles considered in the present study, important consequences are: x x x Regarding the wet reprocessing of multi-recycled MOX fuels as, e.g., the FR-HBU fuel in Scheme 3b, the current PUREX flow sheet has to be adapted and optimised for the high plutonium content and the short cooling time of the fuel. In particular, measures have to be taken to guarantee the required high plutonium dissolution and recovery yields in the presence of the prevailing strong radiation fields. Regarding the reprocessing of fuels from dedicated actinide burners as, e.g., the ADSs in Schemes 3b and 3bV, the activity of these fuels is so high that the radiation stability of the organic extractant in aqueous processes can no longer be guaranteed and the fuels can only be reprocessed by means of pyrochemical methods. The pyrochemical methods produce new types of waste streams and waste forms which have not yet been characterised fully. Regarding fuel handling techniques and radioprotection measures at various stages of the fuel cycle, these have to be automated and enhanced to cope with the strong radiation fields and especially the intense source of spontaneous neutrons. 34
37 Closing the fuel cycle entails a significant reduction in the actinide content of the waste and its consequences for waste management can be expected to be much smaller than those for reprocessing and fuel handling. Figure 2.6 compares the relative decay heat of the waste per scheme, where the decay heat is averaged over the waste types from the different reactor components and normalised to that of the once-through fuel cycle. Cooling times of 50, 200 and years are considered, the 50 and 200 years being representative for the time when the waste goes to the repository and the time when the majority of the original fission products have decayed. Additional activity, decay heat and neutron source strength data are given in Appendix C. Figure 2.6. Decay heat per scheme relative to Scheme 1a 1.E a 200 a a Decay heat relative to Scheme 1a 1.E+00 1.E-01 1.E-02 1.E-03 1b 1c 1d 2a 2b 2c 2cV 3a 3b 3bV 3cV1 3cV2 Fuel cycle scheme Figure 2.6 shows that the long-term effect of closing the fuel cycle is to reduce the total decay heat for all schemes as compared with the once-through fuel cycle. Except for Scheme 1c, which shows a small increase in the decay heat at disposal time due to the breeding of 238 Pu from 237 Np, this observation holds also for shorter cooling times. However, for the schemes without minor actinide management (Schemes 1b through 2a), the reductions are small, independent of the cooling time, and the maximum reduction at disposal time (Scheme 3cV1) is only about 70%. Since the decay heat at disposal time is dominated by the fission products, a significant part of the reductions can be attributed to smaller fission product mass flows (see Table 2.3). After years, the relative decay heat has dropped below 1% for Schemes 2b, 2cV and all Family 3 schemes. The somewhat higher value for Scheme 2c as compared with Scheme 2cV results from the high decay heat of the americium targets which also go to waste. The rapid cooling of the waste from these schemes after a relatively short dwelling time in the repository is an advantage for most repository concepts. 35
38 The schemes with minor actinide management (Schemes 2b through 3cV2) offer the possibility of further reducing the initial heat load for the repository by allowing the fission products to decay before the final disposal of the waste. Figure 2.6 shows that a 17- to 30-fold heat reduction relative to the once-through fuel cycle could be achieved with a cooling time of 200 years. Figure 2.7 shows the evolution of the actinide part of the decay heat for some of the reactor components (the respective schemes are indicated in Table 2.2). The normalisation to the thermal energy produced allows the decay heat of the fission products to be represented by a single curve. It can be seen that, whereas the recycling of plutonium and neptunium in LWRs generally increases the decay heat of the actinides in the waste, fast-spectrum systems with fully closed fuel cycles can achieve decay heat reduction by several orders of magnitude, compared with the once-through fuel cycle (the less pronounced reductions for the ADSs are a consequence of the very high decay heat per kg HM of the ADS fuels). Figure 2.7. Long-term evolution of decay heat from actinides in waste (per TWh(th) produced by different reactors) 1.E+04 MOX-Np 1.E+03 Fission prod. (all reactors) PWR-UOX PWR-MOX MOX-UE Decay heat (W/TWh-th) 1.E+02 1.E+01 ADS-TRU ADS-MA FR-metal FR-carbide 1.E+00 FR-MOX1 1.E Storage time (a) With regard to the heat conditions prevailing at the time of disposal, Figure 2.7 shows that the large heat reduction potential of the fast-spectrum systems cannot be exploited unless the heat from the fission products is mitigated in parallel. In practice, this means that reduction in the initial heat load of a repository can only be achieved by considerably increasing the waste cooling time and/or combining actinide transmutation methods with suitable fission product separation and management methods as, for example, in the ORIENT 4 fuel cycle [21]. 4. ORIENT = Optimisation by removing impedimental elements. 36
39 2.5.6 Separated plutonium in the fuel cycle Although questionable as a single indicator, the mass flow of separated, pure plutonium can be used as a rough indicator of the proliferation risk of a fuel cycle. Schemes 1a, 1c, 1d, 3a, 3cV1 and 3cV2 do not involve pure plutonium stream. The remaining schemes can be divided into two groups: schemes with relatively low, and schemes with 3 to 4 times higher, mass flows of separated plutonium (see Table 2.4). Table 2.4. Separated plutonium (Mass flow in kg/twhe) 1b 2a 2b 2c 2cV 3b 3bV Note: Schemes 1a, 1c, 1d, 3a, 3cV1 and 3cV2 do not involve separated, pure plutonium streams. The reduction of the pure, separated plutonium mass flows is in some cases associated with technical or economic drawbacks. For example, Scheme 1c has a lower separated plutonium mass flow than Scheme 1b, but the Np in the MOX-Np fuel, via the build-up of 238 Pu, increases the D activity of the fuel as well as the TRU losses to waste (see Figure 2.5). The Family 2 schemes feature the highest plutonium mass flows, but have the advantage of minimising the requirements for the development of advanced technology. Finally, the higher plutonium mass flow in Scheme 3b as compared with Scheme 3bV is a consequence of the aim to improve the economics of the scheme by burning as much plutonium as possible in conventional MOX-fuelled thermal and fast reactors (the impact of the different approaches on economics is presented in Chapter 5) Uranium mass balance For all fuel cycle schemes including LWRs in the reactor mix natural uranium requirements range form 10 to 20 t/twhe and residual uranium streams are similarly large (see Figure 2.8). If the residual uranium is not considered as a resource for future fast reactors, its long-term radiological impact must be assessed. As shown in [13], uranium decay products always dominate the global radiotoxicity in the very long term, if all radioactive residues of the fuel cycle are taken into account. 37
40 Figure 2.8. Uranium mass balances (Positive values production; negative values consumption) 3cV2 3cV1 3bV Irradiated U Depleted U Natural U 3b 3a 2c(V) 2b 2a 1d 1c 1b 1a Uranium mass (kg/twhe) Table 2.5 shows that a single recycle of the plutonium reduces the natural uranium demand by a modest 10% as compare with Scheme 1a. As the multiple recycling of plutonium in LWRs requires the use of MOX fuel with enriched uranium, Scheme 2a consumes about the same amount of natural uranium. This confirms the earlier conclusion that this scheme is useful for managing the plutonium, but does not otherwise contribute to improving the sustainability of nuclear energy (see Section 2.5.4). For the same reasons, the additional americium management in Scheme 2b causes the uranium demand to increase to the level of the once-through fuel cycle. Among the pure thermal reactor strategies, the DUPIC fuel cycle (Scheme 1d) is the only strategy which offers a significant (i.e. 40%) saving in the uranium demand. Table 2.5. Natural uranium consumption relative to Scheme 1a 1b 1c 1d 2a 2b 2c(V) 3a 3b 3bV 3cV1 3cV Note: Schemes 3cV1 and 3cV2 operate with depleted uranium. The natural uranium demand of LWR-based schemes can be reduced by incorporating fast reactors into the reactor mix; the reduction corresponds approximately to the percentage of fast reactors in the mix (for Schemes 2c and 2cV with 56% fast reactors, the reduction is 56%). In the long term, a transition to an all-fr strategy will allow the uranium demand to be reduced by more than two orders of magnitude (for Scheme 3cV1, for example, the reduction factor is as high as 250). As to the difference between the two all-fr schemes, it should be noted that Scheme 3cV2 uses UREX+ reprocessing of the MOX fuel with uranium recovery. If the fuel cycle was closed also for the uranium, the uranium consumption would be comparable to that of Scheme 3cV1. 38
41 Finally, it should be noted that 238 U is the natural fuel for fast reactors. In practice, the 238 U will come, first, from the stock of depleted uranium left over by the thermal reactors and, when this is exhausted, from natural uranium. In principle, the (smaller) stock of irradiated uranium can also be utilised in fast reactors. Considering the current size of the depleted uranium stock, any fast reactors which could be constructed in this century would not depend on the availability of natural uranium. On the other hand, as nuclear energy may be phased out prematurely, the long-term storage or disposal of the residual uranium has to be considered as an integral part of waste management for all advanced fuel cycles. 2.6 Conclusions The main conclusions derived from the mass flow calculations carried out can be summarised as follows: x x x x x x x Fully closing the fuel cycle can reduce the heavy metal content of the waste by more than three orders of magnitude as compared with the once-through fuel cycle. Being dominated by the fission products, the volume of the high-level waste will, however, not be noticeably affected by this reduction. Due to the higher efficiency of fast reactors, a change from an all-lwr to an all-fr reactor strategy reduces the fission product mass, and hence the high-level waste volume, by about 30%. Only transmutation strategies with fully-closed fuel cycles can meet the hundredfold TRU reduction goal of P&T. Partially-closed fuel cycles, which cannot achieve such high TRU reductions but are easier to implement, are also useful for managing plutonium and minor actinides. In the eventuality of nuclear energy phase out, it has to be ensured that the TRU waste reduction achieved in the equilibrium phase would not be jeopardised by the disposal of the residual TRU inventory. The high decay heat and neutron emission of multi-recycled fuels have consequences for the reprocessing and the handling of the fuels. As to the reprocessing, improvements to the flow sheets of aqueous processes and the introduction of pyrochemical methods will be necessary. The pyrochemical methods produce waste with unusual characteristics which will require new methods of conditioning and disposal. Minor actinide management techniques that allow recovering of most actinides reduce the total decay heat of the waste. While the achievable heat reduction at normal disposal time (50 years) is modest (Factor 2 to 4 depending on the scheme), there exists a significant heat reduction potential for longer cooling times. For example, a 20- to 30-fold heat reduction relative to Scheme 1a could be achieved with a cooling time of 200 years. The schemes considered may be classified in three groups with regard to pure separated plutonium mass flows which may serve as a rough indicator of proliferation risk: no, relatively low, and 3 to 4 times higher mass flows of pure plutonium. Measures for reducing these flows may be associated with technical or economical drawbacks. As to the natural uranium demand, the reduction potential of advanced LWR strategies is about 10% as compared with Scheme 1a. A significant (40%) uranium saving can be achieved with Scheme 1d (DUPIC). Higher savings are possible by incorporating fast reactors into the mix. An all-fr schemes allow the uranium demand to be reduced by more than two orders of magnitude. 39
42 x All reactor mixes including LWRs produce significant amounts of residual uranium. The long-term storage or disposal of this uranium has to be considered as an integral part of the waste management. References [1] NEA (2002), Accelerator-driven Systems (ADS) and Fast Reactors (FR) in Advanced Nuclear Fuel Cycles, OECD, Paris (France). [2] Youinou, G. et al. (2003), Plutonium and Americium Multirecycling in the European Pressurized Reactor (EPR) Using Slightly Over-Moderated U-235 Enriched MOX Fuel Assemblies, Proc. GLOBAL 2003, New Orleans, USA (CD ROM). [3] De Saint Jean, C. et al. (2001), Americium and curium heterogeneous transmutation in moderated S/A in the framework of CNE scenarios studies, Proc. GLOBAL 2001, Paris, France (CD ROM). [4] The Technology of the Integral Fast Reactor and its Associated Fuel Cycle, Special Issue Progress in Nuclear Energy, Vol. 31, Number 1/2, [5] Mukaiyama, T. et al. (1999), R&D Strategy for Partitioning and Transmutation under OMEGA Programme and Neutron Science Project of JAERI, in NEA (1999), Actinide and Fission Product Partitioning and Transmutation, Proc. of the 5 th Int. Information Exchange Meeting, November 1998, Mol, Belgium, OECD, Paris, p. 65. [6] Sengler G. et al. (1999), EPR core design, Nuclear Engineering and Design, 187, [7] Sztark, H. et al. (1991), Core optimization of the European Fast Reactor EFR, Int. Conf. on Fast Reactors and Related Fuel Cycles, 28 October-1 November 1991, Vol. 1, 3.1-1, Kyoto. [8] Beaumont, H.M. et al. (1997), CAPRA Core Studies. High Burn-up Core Conceptual Study, Proc. Int. Conf. on Future Nuclear Systems (Global 97), 5-10 October 1997, Yokohama, p [9] NEA (1995), Physics of Plutonium Recycling Volume IV: Fast Plutonium-Burner Reactors: Beginning of Life; (1996), Volume V: Plutonium Recycling in Fast Reactors, OECD, Paris. [10] Garnier, J.C. et al. (2005), GFR System Progress of CEA Pre-Conceptual Design Studies, Proc. ICAPP 05, May 2005, Seoul, Korea. [11] Takizuka, T. et al. (1999), Dedicated Accelerator-Driven System for Nuclear Waste Transmutation, Proc. 3 rd Int. Conf. on Accelerator Driven Transmutation Technologies and Applications, 7-11 June 1999, Praha (Pruhonice), Czech Republic, Paper Mo-O-F15 (CD ROM). [12] González, E. et al. (2001), Transuranics Transmutation on Fertile and Inert Matrix Lead- Bismuth Cooled ADS, In NEA (2001), Actinide and Fission Product Partitioning and Transmutation, 6 th Information Exchange Meeting, December 2000, Madrid, Spain, OECD, Paris. 40
43 [13] González, E. et al. (1999), EVOLCODE: ADS Combined Neutronics and Isotopic Evolution Simulation System, Presented in the Mathematics and Computation, Reactor Physics and Environmental Analysis in Nuclear Applications, MC 99 Conference, Madrid, September, [14] Ko, Won Il, et. al. (2005), Nuclear Fuel Cycle Analysis and Simulation Tool (FAST), KAERI/TR- 3005/2005, Korea Atomic Energy Research Institute, Korea. [15] Roque, B. et al. (2002), Experimental Validation of the Code System DARWIN for Spent Fuel Isotopic Predictions in Fuel Cycle Applications, PHYSOR 2002, Seoul, Korea. [16] Loubière, S. et al. (1999), APOLLO2 Twelve Years Later, Proc. M&C 99, Madrid, Spain. [17] Doriath, J.Y. et al. (1993), ERANOS I: The Advanced European System of Codes for Reactor Physics Calculation, Proc. Int. Conf. on Mathematics Methods and Supercomputing in Nuclear Applications, April 1993, Karlsruhe, Germany. [18] Samson, M. et al. (1998), Cesar: A Simplified Evolution Code for Reprocessing Applications, Proc. 5 th Int. Conf. on Recycling, Conditioning and Disposal (RECOD 98), October 1998, Nice, France, p [19] Cometto, M. (2002), Standardisation des outils de calcul pour les ADS et leur application à différents scénarios de transmutation des déchets, PhD thesis No. 2714, EPFL, Lausanne. [20] González, E. et al. (2001), TRU transmutation studies for phase-out scenarios based on fast neutron ADS systems, Presented on the ADTTA 2001, Nuclear Applications in the New Millennium, Reno, Nevada, November [21] Takaki, N. et al. (2003), ORIENT-Cycle Evolutional Recycle Concept with Fast Reactor for Minimising High-Level Waste, in NEA (2003), Actinide and Fission Product Partitioning and Transmutation, Proc. 7 th Int. Information Exchange Meeting, October 2002, Jeju, Korea, OECD, Paris. 41
44
45 3. WASTE GENERATION PROCESSES AND WASTE CHARACTERISTICS 3.1 Introduction All the operations associated to the production of nuclear energy, including mining, milling, front-end activities such as conversion, enrichment or fuel fabrication as well as the operation of nuclear power plants, generate waste that has to be managed adequately according to technical requirements and following internationally accepted principles [1]. The objective of radioactive waste management is to deal with waste in a manner that protects human health and the environment now and in the future without imposing undue burdens on future generations. Waste types arising at each stage of the nuclear fuel cycle are of different classes and categories. In order to comply with the objective of radioactive waste management, it is necessary to consider the quantities (volumes), activity, radiotoxicity physical and chemical characteristics of the waste during the operations of treatment, conditioning and disposal. Table 3.1 provides an overview of the relative volumes, activities and radiotoxicity of waste arising at different steps of the fuel cycle including reactor operation and decommissioning. Table 3.1. Relative characteristics of fuel cycle generated waste Waste generating process Relative volume Relative activity Relative radiotoxicity Mining & milling Very large Low Low Refining Small Low Low Conversion and enrichment Small Low Low Fuel fabrication, fresh Small Low Low Fuel fabrication, recycled Small Low/Medium Medium NPP operation Large Medium Low Spent fuel management Small/Medium High/Very high High reprocessing Spent fuel management Medium High High direct disposal Decommissioning Very large Low Very low Waste categories Several methods are used to categorise radioactive waste types; the method selected usually is dependent on the generator of the material. For example, a nuclear power plant operator is likely categorise waste types based on the originating stream. This system is difficult to use widely because streams differ from case to case. A classification system that takes into account qualitative considerations affecting final disposal of the conditioned waste is preferable. This report adopts the waste categories defined in the IAEA classification, shown in Table 3.2 [2]. 43
46 Category Main characteristic Heat generation HLW (deep geological disposal) Highly radioactive waste, containing mainly fission products, as well as some actinides, separated during reprocessing of irradiated fuel. Spent fuel, if it is declared a waste. Any other waste with radioactivity levels intense enough to generate heat more than 2 kw/m 3 by the radioactive decay process. Table 3.2. Waste categories LILW-LL (geological disposal) Waste which, because of its radionuclide content requires shielding but needs little or no provision for heat dissipation during its handling and transportation. < 2 kw/m 3 < 2 kw/m 3 Half-life > 30 y < 30 y Other characteristic LILW-SL (surface or geological disposal) Waste, which, because of its low radionuclide content, does not require shielding during normal handling and transportation. Activity content < 400 Bq/g of long lived alpha emitters. The classification system described in Table 3.2 distinguishes radioactive waste types based on two key characteristics thermal hazard and requirement for disposal. Two types are identified: high level; and low- and intermediate-level waste (LILW) with short and long lifetimes. High-level waste originates from spent nuclear fuel (SNF) and contains large concentrations of both short and long lived radionuclides. It requires a high degree of isolation from the biosphere. During the reprocessing of SNF, the liquid concentrate from its dissolution generates significant amounts of heat from radioactive decay. This decay heat generation continues for several centuries, until the concentration of high energy emitters is significantly reduced. Typical activity levels range from 5x10 4 to 5x10 5 TBq/m 3. They correspond to a heat generation rate of about 2 to 20 kw/m 3 for decay periods of about ten years after discharge of spent fuel from the reactor [2]. The second type of waste, LILW is characterised by low heat generation. It is subdivided in two categories depending on the degree of containment required for long-lived radionuclides and alpha emitters. Long-lived waste (LILW-LL) requires geological disposal while some countries dispose of shortlived waste (LILW-SL) in surface facilities. The boundary between short- and long-lived waste categories cannot be specified in a universal manner regarding concentration levels for radioactive waste disposal, because allowable levels depend on management options. However, current practices in several countries limit the average concentration of long-lived alpha emitters to 400 Bq/g in near surface disposal facilities. Sometimes long-lived beta emitters, such as 129 I and 99 Tc are taken into consideration also. A distinction is made in the requirements of shielding during the normal transport of these waste types; guidelines in this regard are found in the IAEA Regulations for the Safe Transport of Radioactive Material [3]. A radiation requirement is included also for low specific material, usually the conditioned waste from nuclear power plants. The IAEA regulations require that LSM have an unshielded radiation level below 10 msv/h at a distance of 3 metres. As a result, some LILW might have to be transported with shielding to ensure compliance with the transport regulations. 44
47 Some countries have different approaches to categorising radioactive waste. For example, in the United States radioactive waste types are classified for land disposal (Classes A, B or C depending on the concentration of defined radionuclides and thus requiring different degrees of stability and length of the institutional control [4]), HLW and greater than Class C waste [5] Low- and intermediate-level waste LILW is characterised by various chemical and radiochemical compositions, activities, physicochemical properties (e.g. phase) and other parameters. Raw ( as generated ) waste is usually treated directly at the facility with the aim of reducing its volume for storage at the facility and/or facilitating its further final conditioning for storage or disposal. Waste treatment technologies are well established and commercially available for each common waste flow stream; extensive operational experience has been accumulated. There are no technological limitations and constraints in their application. However, the development and implementation of advanced, more efficient technologies is still in progress, reflecting increased requirements for operational safety of nuclear facilities and the need to enhance the competitiveness of nuclear energy. Effective sorting and segregation of waste at the generation points, regulated discharge of cleared waste together with recycle/reuse of media and materials are among the most efficient tools prior to any waste processing. Treatment technologies Solid waste treatment technologies are predominantly aimed at reducing the waste volume and the size of bulk pieces, in order to simplify temporary storage and facilitate final processing for disposal. The most common solid waste treatment technologies are: x x x x Decontamination followed by clearance of bulk material and processing of small volumes of decontamination media. Shredding and cutting of bulk pieces to facilitate their embedding into inert matrix. Compaction (low pressure) mostly to reduce temporary storage volume. Incineration and super-compaction are treatment methods resulting in a product (ash, pellets from super-compactor) which has to be further encapsulated/embedded for final disposal. Both methods will be discussed further, in the section on LILW conditioning. Aqueous liquid waste treatment technologies aim either at reduction of bulk volume of liquid waste mostly through evaporation resulting in liquid concentrates with high salinity and higher activity, or at separation of radionuclides from raw liquid waste using various advanced filtration and sorption techniques resulting in the generation of substantially smaller volume of filtration materials and absorbents, belonging usually to intermediate level waste category [6]. The treatment of various kinds of raw waste flow streams results in the following main categories of treated waste: x dry solid waste (dispersed solids, pieces of various materials, small equipment and tools, etc.); x wet solid waste (spent filtration materials, ion exchange resins, etc.); x liquid waste (mostly aqueous concentrates, and, in smaller quantities, organic liquids solvents, oil, etc.). 45
48 Conditioning technologies Treated waste must be further conditioned for final disposal. The purpose of the conditioning procedure is to provide for proper isolation of radioactive waste substances from the environment, inside waste packages. The package includes the processed waste either transformed into a more stable, solid form or incorporated in an inert matrix with or without chemical binding of the radionuclides, and a container providing additional isolation of the conditioned waste from the environment. A set of mature waste conditioning technologies is commercially available, and extensive operational experience has been accumulated. However, the development and implementation of advanced conditioning technologies is ongoing to respond to the growing demand for higher quality and longer term durability of the waste forms and for the reduction of conditioned waste volume leading to final disposal cost reduction [7]. Solid waste conditioning Technology for solid waste conditioning should be selected considering the particular waste properties and expected waste form. For dry solid waste (mostly textile material, paper, small tools and equipment, air filters, maintenance waste, metals, insulation, electric cables, as well as fuel cladding hulls from fuel reprocessing, etc.) the following technologies can be considered: x x x x Compactable (including ash from incineration) super-compaction [volume reduction factor (VR) 5-10, depending on the type of the waste] with following embedding of waste pellets in inert matrix or packaging in high integrity containers (HIC). Combustible incineration (VR up to 40) with follow up processing of ash either by supercompaction or encapsulation in inert matrix (cement, polymers, etc.). Non-compactable, non-combustible (e.g. metals, concrete, etc.) usually (after size optimisation) embedding into inert matrix cement, polymers, etc. In some cases the cement mixture is prepared within liquid radioactive waste. Various processing in plasma torch (VR depends on the kind of the waste) very advanced technology, still not commonly applied, resulting in glass- or ceramic-like waste form with excellent chemical durability. x Metals recycling or reuse after proper decontamination or, for metal activated or which cannot be decontaminated, embedding in inert matrix or melted and poured in canisters. For wet solid waste (mostly spent ion exchangers, filtration materials, sludge, etc.) conditioning treatments include: x Packaging into high integrity containers after dewatering and/or drying (calcinations). x x x Encapsulation (usually after drying and/or calcinations) in inert matrix (cement, bitumen, polymers, etc.). High temperature technologies e.g. steam reforming, or vitrification resulting in glass- or ceramic-like waste form with excellent chemical durability. These advanced methods still have a limited industrial application. Incineration together with other combustible waste used rarely for spent ion-exchange resins. 46
49 Liquid waste conditioning technologies Liquid waste types to be processed are predominantly aqueous (radioactive concentrates), sometimes containing crystallised salts and/or sludge generated mostly in storage tanks. Organic liquid waste (oil, solvents, etc.) is generated in substantially smaller volume and usually with low activity. Organic solvents and extractants from fuel reprocessing might cause some specific problems. However, given that they are mostly recycled and considering that the array of specific technologies applied for each batch of organic waste produce in the end small volumes, they are not further described in this document. Cementation and bituminisation are well matured and technologically proven methods for aqueous liquid waste conditioning. Modern high temperature technologies (vitrification, plasma torch, etc.) are now investigated and tested. x x x By cementation, the radioactive liquid waste (usually after further pre-concentration) is mixed in various technological apparatus (operated batch wise or continuously) with cement and special additives, aiming at binding the radioactive components, increasing the quality (lower leachability) of the resulting waste form or overcoming problems with some specific components of the waste. Depending on the chemical composition of the waste, radioactive constituents are either just encapsulated or, in more favourable conditions, chemically bonded into the cement matrix. Volume reduction factors depend on many parameters and range from 0.5 (i.e. the final volume is greater than the original waste volume) to around 2 [8]. Bituminisation is a medium temperature technology (more than 100 C), based on encapsulation of crystallised waste components (radioactive constituents) into a bitumen matrix. In the most common technology, the liquid waste is injected into the heated bitumen stream in thin film rotor evaporator, where water is evaporated and a pseudo-homogenous mixture of crystalline salts with bitumen is prepared and poured into the containers (e.g. standard 200 litres steel drums). A less common technology involves mixing of evaporate with bitumen in extruder mixers. Volume reduction factors depend on the salinity of the waste and are typically expressed as content of salts in the final product (usually 40-50%). The leaching properties of this waste form are generally better then those of cemented waste. The main constraints are the potential biodegradation of the bitumen component of the waste form (followed by increased leaching probability) and the risk of fire during elaboration connected with oxidants (e.g. nitrates) in the waste. Both can be overcome using over-pack (secondary containers), e.g., from reinforced concrete, where several drums with bituminised waste are placed in the repository and free space is filled with cement grout or another filling [9]. Vitrification is industrially used for processing high-level waste from spent fuel reprocessing sufficient knowledge and operational experience has been accumulated and can be simply transposed into LILW vitrification. Promising results have been already achieved in development and pilot plant tests of LILW vitrification, especially in its cold crucible variant. 47
50 3.1.3 High-level radioactive waste Origin and constitution of HLW Most of the HLW originates from the reprocessing of spent fuel. The details of the HLW stream, in terms of chemical and isotopic composition of fission products and TRU elements, result from the exact operating conditions along the fuel cycle including enrichment at the isotopic separation plant, burn-up level in the reactor, separation factors at the reprocessing plants. A wide range of nuclear fuel types are or have been in use, ranging from natural uranium metal, with burn-up of some few GWd/tU, to light water reactor fuel with burn-up of over 50 GWd/tU or fast neutron reactor fuels with burn-up of more than 100 GWd/tU. The fission product composition can be calculated for each type of fuel and operating conditions. However, differences in spectra are generally small and chemical processing can have a much more important effect on the composition of the HLW [10]. TRU elements such as neptunium, americium and curium are formed by neutron capture. The amount of these products is small when the fuel burn-up is low, particularly the amount of curium, but the yields become significant as the burn-up increases, for fuel irradiated in fast reactors or when Pu is used in PWR-MOX fuel. These elements are of particular concern for long-term waste management because their half-lives are very long. Other chemical compounds that exist or are added to the HLW prior to the conditioning process, such as vitrification, are for example soluble poisons (gadolinium), additives (sugar), alkaline solutions for neutralisation of acidity and metal fines from dissolution process. Vitrified waste form Several vitrification processes have been developed in France, Germany, India, Japan, the Russian Federation, the United Kingdom and the United States. The French and British reprocessing plants use a two step vitrification process, calcination and borosilicate glass melting. Other processes have used a single step, liquid fuel ceramic melter, or phosphate glass instead of borosilicate glass. The basic glass properties required for vitrified HLW are containment capacity, radiation resistance and vitreous state stability. The vitrification meets two fundamental criteria [11]: x x Feasibility: the selected glass composition allows to digest all the elements that are to be confined, and the process masters the issues related to the glass pouring viscosity, crucible corrosion and possible volatilisation of some radioactive elements. Containment: the glass matrix is stable with respect to chemical, thermal and irradiation effects, and keeps its containment integrity over very long times, typically hundreds of thousands of years in leaching conditions. The thermal stability of glass is sufficient to withstand the thermal power released by fission products during the first decades of storage. The vitrification and glass storage and disposal process implementation aims at avoiding de-vitrification and crystallisation of some parts of the glass, a condition which is not considered acceptable although it has not been explicitly demonstrated that it is detrimental [12]. This objective is met by storing spent fuel for cooling purposes before reprocessing, cooling reprocessed solutions prior to vitrification, limiting the weight fraction of fission product oxides in the glass, and cooling the suitably dimensioned containers into which glass is poured. In addition, vitrified waste is stored on surface for several decades prior to their disposal. Cooling by 48
51 natural or forced convection in the repository ensures that the glass is maintained at a temperature well below the de-vitrification zone. Irradiation stability must be taken into account also. The E-J activity of the fission products is not any more preponderant after years; the long-lived actinides subsequently account for most of the energy release. They also generate helium, as an effect of D-decay, which can diminish the mechanical properties of the glass. These problems are addressed through testing long-term glass behaviour for specific specimens [13]. Two important phenomena could affect the glass containment integrity under these conditions, water corrosion and insufficient self D-irradiation resistance. Ceramic and metal waste forms Regarding waste generated in pyrochemical separation, two HLW types have to be considered. After electro-refining, remnant metallic materials are melted down. These remnant metals include scrap cladding hulls, metallic fission products, and fuel components like zirconium which are inert in the electro-refiner salt. The resulting alloy, nominally stainless steel-15 wt% zirconium, is a durable, corrosion-resistant ingot suitable for disposal. Waste types soluble in the salt baths include some transuranic elements, alkali, alkaline earths, and rare earths halides. They are immobilised in ceramic waste forms. Classical vitrification systems employ melters, heated through Joule effect. Cold crucible melters are a new advanced vitrification system that overcomes some limitations of the classical systems. The technology is based in inductively heated crucible, which can reach over C. In addition to the much higher temperature, the process allows to reduce secondary waste types. The cold crucible melter is assembled from metal tubes, transparent to electromagnetic waves. The tubes are cooled with water creating a protective insulation layer of non melted glass, preventing the tubes from melting. Cold crucible melters that could be used in the future would reduce the size and maintenance requirements of industrial equipments. The high temperatures achieved allow radioactive waste to be incorporated in a broad range of glasses; not only borosilicate or phosphate glass can be sintered, but crystalline materials such as igneous rocks could also be used. This variety of vitrified waste forms that can be produced, would allow for developing better forms in terms of resistance to leaching. Cold crucible melters can be used also to produce ceramic matrices for the containment of specific long-lived radionuclides. Radioisotopes separated by advanced reprocessing could then be conditioned in tailor made matrices. Mineral species known in nature for their selective insertion capabilities with certain radionuclides and their stability over time are potential candidates to be sintered. Such are the cases of apatites, hollandites, perowskites or zirconolites known as Synroc. Up to 30 wt% Pu and MAs can be immobilised in this way. Once in the embedded form, retrieval of the nuclides from the matrix is very difficult. Their solubility in geologic fluids is a few orders of magnitude lower (10-6 g/m 2 /d) than the one of conventionally vitrified waste. Since the leach rate and the solubility in ground waters determine the ultimate radiological risk, such a process would 49
52 significantly decrease the long-time risk of a repository as compared with conventional vitrification of HLW [14]. Other waste forms Advanced reprocessing technologies could separate trouble-making elements, such as longlived actinides or I and Tc known as soluble and easily migrating in well-know and chemically pure form. This offers a possibility to place them in specially adapted matrix having improved performance as compared to current methods. For example apatites are studied to accommodate iodine, caesium and actinides [15]. Before final disposal, the spent nuclear bundles will be encapsulated into the disposal canisters after having cooled in an interim storage for at least years. At present, there is no encapsulation plant in operation. During the normal operation of an encapsulation plant radioactive waste is produced only when activated materials (crud) is released from the structures of the bundles. This may happen in a wet storage pool. Crud may come loose also in a so-called hot cell of an encapsulation plant, where the bundles are dried and placed in disposal canisters. However, most of the crud released in the hot cell is planned to be collected there and put into the disposal canisters. Some airborne radioactive particles will be collected with the filters of the air-conditioning system. About 2 m 3 of HEPA filters may be produced yearly in the Finnish encapsulation plant [16]. Several concepts for the decommissioning and disposal of spallation targets have been developed. In the reference concept (based on MEGAPIE experimental facility), lead-bismuth together with the most activated structures will be encased in a shielded stainless steel canister designed for final disposal. The other parts are packed in a standard LLW container. Storage Spent fuel is stored in water pools or dry air cooling facilities or containers. Vitrified HLW from reprocessing is stored in dry facilities or containers. Normally, the spent fuel is discharged from a reactor into water pools which provide excellent heat transfer essential in the early phase of cooling. Generally these pools are integrated in the reactor building and spent fuel management in these pools is part of the plant operation. Water pool storage is also a rather common technology for the facilities located outside the reactor building. Water pool storage requires active process systems to ensure satisfactory performance and continuous attention to preserve water purity. However, new designs including passive cooling have recently been considered. The spent fuel assemblies could be moved to a naturally cooled dry storage after a few years of initial cooling in the water pool. The minimum required time of initial cooling in pools is mainly related to the burn-up and the irradiation history. Taking into consideration the 20 to 50 years or more required for storage, it is obvious that the naturally cooled dry storage facilities could be an attractive alternative to water pools. Several generic types of dry storage facilities are commercially available. They differ from each other in terms of construction materials, size, modularity, configuration, layout of the storage containers (horizontal, vertical, etc.) and methods of fuel handling. Dry storage in casks is being particularly recognised as a flexible option with the advantages of transportability in case of future need, and the option of leasing of casks from vendors. The dry storage facilities for spent fuel or HLW are similar, though, having different geometry. 50
53 The main additional challenge of the long-term storage facility of separated Cm compared to other HLW storages is the high decay heat. The separated Cm has to be diluted, because otherwise the cooling cannot be based on natural convection. The alternative choices are a target reprocessed for further transmutation or one that is directly disposed of. In the once-through case, an inert matrix is used. In case of reprocessing, a uranium matrix is envisaged to minimise the amount of secondary waste Chemical toxicity of radioactive waste Radioactive waste can contain toxic non-radioactive components, such as heavy metals and organics that can be harmful for humans and the environment. Some radionuclides can be chemo-toxic as well. Therefore, safety assessments of radioactive waste repositories have to consider chemical toxicity consequences as well as radiological consequences [17]. LILW The amount of chemo-toxic waste strongly depends on recycling and reuse of materials and components. For Scheme 1a (UOX in LWR) and the schemes involving recycling of Pu as MOX the IAEA report [17] gives a good overview of the chemical toxic elements than have to be considered. Typical chemical-toxic substances occurring in ILW are metals (Cr, Cu, Ni, Pb, Bi, Cd, Hg, Be, Se, U, Pu), nitric and hydrofluoric acids and various organic components such as oils, solvents, extraction fluids and complexing agents. In case of disposal of LILW containing non-negligible amounts of toxic metals or organic components, a detailed analysis of the possible chemical toxic consequences of the disposed waste will be required. HLW In the case of geological disposal of high-level waste, the radiological consequences will generally dominate the chemical toxic consequences. Many toxic metals have low solubility in the reducing chemical conditions prevailing in a geological repository or are strongly sorbed on engineered and natural barriers. In principle HLW forms such as spent fuel or vitrified high-level waste, do not contain organic components Management of depleted and separated uranium Most of the fuel cycle schemes considered do not consume all the natural uranium entering into the cycle leading to the accumulation of depleted uranium (DepU) from enrichment and separated uranium (SepU) from reprocessing. The choice of DepU and SepU management strategies depends on several factors, including government and business policy, possible uses, economic value of the materials, regulatory aspects, disposal options available, and international market developments in the nuclear fuel cycle [18], [19]. Some management options for depleted uranium are presented in Figure
54 Figure 3.1. Diagram of some depleted UF 6 management options Conversion to DU 3 O 8 powder; or DUO 2 ceramic; or DU metal; or DUF 4 DUF 6 interim storage RE-USES R&D Long-term storage and possible re-use Disposal e.g. trench; vault; mine; borehole Nuclear fuel manufacture e.g. MOX fuel Down-blending of Highly Enriched Uranium (HEU) Radiation shielding e.g. DU alloys in SF transport casks Counter weights; DU munitions DUO 2 in HLW disposal e.g. DUO 2 grout in HLW tanks; DUO 2 /steel CERMET baskets for SF; DUO 2 fill of SF basket voids; DUO 2 backfill and invert The storage of depleted UF 6 in metal cylinders is considered generally as an interim measure because its long-term storage may raise environmental risks if cylinder integrity defects lead to HF release. For long-term storage, the ideal solution is to convert the depleted UF 6 into a stable, noncorrosive and easily re-usable form such as uranium oxide [20]. SepU compounds derived from reprocessing plants usually contain radionuclide impurities (fission products and alpha-emitters such as americium, curium, neptunium and plutonium) which limit their reuse. Chemical impurities are also common e.g. phosphate and sodium. The main option is to reuse SepU in fuel fabrication. Radioactive impurities can lead to classify the compounds as intermediate-level radioactive waste. 3.2 Waste generated by processes of the fuel cycle Front-end of the fuel cycle Mining and milling generate large volumes of waste with diverse characteristics. All require appropriate management though only a part is considered to be radioactive waste. For example, waste rock contains such a small amounts of uranium that it could be used for landscaping the site after the extraction of ore has been completed. 52
55 The management of waste associated with uranium production, the largest volume of which are mill tailings, is the major issue due to its physical volume, and radiological and chemical contaminants. Tailings are rarely inert and they contain residues of process chemicals and some degree of radioactivity [21]. The amount of waste per kilogram of extracted uranium varies largely between different production sites mainly because of large variations in uranium ore concentrations. Mining and milling waste are not included in the fuel cycle waste flow estimates of the present study because their type and management requirements differ drastically from those of radioactive waste generated in other parts of the fuel cycle. As with mining and milling, the primary risks associated with conversion are chemical and radiological. Strong acids and alkalis are used in the conversion process, which involves converting the yellowcake powder to very soluble forms, leading to possible inhalation of uranium. In addition, conversion produces extremely corrosive chemicals that could cause fire and potential explosion hazards. The conversion generates relatively small amounts of radioactive waste, such as air filters, clothes and cleaning liquids. The enrichment plants are characterised by low specific activity of the materials treated. This means that enrichment plants generate only low-level waste and also relatively small amounts. Currently two technologies are in use, gas diffusion and centrifugation, though, all the new plants are based on the latter. A modern centrifuge plant generates around 4x10⁻⁵ m 3 /SWU of LILW-SL [22] Fuel fabrication plants The waste types generated in stand-alone fuel fabrication plants are describe below; for the fuel cycle schemes including pyrochemical separation, the fuel fabrication is assumed to be part of the reprocessing complex. UOX fabrication plant UOX fabrication plants are, like enrichment plants, characterised by low specific activity of the materials. Low enriched uranium (maximum 5% of 235 U) is only slightly radioactive thus reducing the handling and processing requirements. However, the picture can be complicated if second or higher generation uranium from reprocessing operations (RepU) is recycled through the facility leading to increased activity from transuranic elements (Pu, Np and Am) and fission products (mainly 99 Tc). For this study, the amount of LILW-SL generated by UOX fabrication plants is assumed to be the same as for MOX fabrication plants and the LILW-LL generation is assumed to be negligible. MOX fabrication plant The materials that arise from the operation of the LWR-MOX fuel manufacturing plants are characterised by the handling of radiotoxic plutonium in significant quantities and fission products at impurity levels. Mixed oxide fuel is normally handled within containment structures known as glove boxes. They come in several different types ranging from fibreglass to painted mild steel to stainless steel. Viewing is via Perspex or polycarbonate windows built into the glove boxes. The present trend is to use remote handling techniques. 53
56 Liquid radioactive waste originates mainly from the water and cooling circuits in the production area and from the water used for cleaning the production rooms. Plutonium-contaminated effluents are mainly produced by the plant analytical laboratories. These effluents can include variable amounts of plutonium from less than 1 milligram up to several grams per litre. If the plutonium content is high, the liquid waste undergoes a plutonium recovery treatment. Otherwise it is classified as radioactive waste. Solid waste production consists of three main categories of nuclear waste (contaminated with plutonium, low and very-low contaminated). Nuclear waste products are sorted not only according to their level of activity, but also according to treatment requirements incineration, compacting or embedding in cement. Typically around 0.6 m 3 /thm of LILW-LL and 0.6 m 3 /thm of LILW-SL waste material are produced. All materials leaving the glove boxes are considered to be contaminated waste. This waste includes tissues, tools and gloves [23]. For this study it is assumed that the amount of waste generated in the MOX fabrication plant does not change even when the other actinides are handled together with plutonium. However, in this case remote handling techniques have to be used in all the fabrication steps. OREOX The key process of the DUPIC fuel cycle as described in Appendix D, is oxidation and reduction of PWR spent oxide fuel (OREOX) to prepare powder for CANDU fuel fabrication. This is a dry process without any separation of fissile isotopes from the spent PWR fuel. The main waste stream coming from the DUPIC fuel fabrication process consists primarily of metallic components from spent PWR fuel, and the fission gases and semi-volatile fission products released from the bulk fuel material treatment. Noble gases such as Kr and Xe are compressed in 50 litres cylinders for the long-term storage and decay. Tritium and Carbon are trapped on a molecular sieve and barium hydroxide, respectively, and these are then conditioned with cement in 200 litre drums. The discarded cladding hulls are also cemented. The radioiodine is trapped on a silver zeolite, and Cs and Ru are fixed on filters. Then the filtered Cs and Ru with the dirty scrap, coming from the re-fabrication process, are vitrified for disposal. Other miscellaneous waste types are also generated from the process. The estimate of waste generated assumes that the fuel process loss rates are 1% volatile products and that the release rates of semi-volatile nuclides are 100%. The spent DUPIC fuel discharged from a CANDU reactor is packaged into a corrosion resistant container with a capacity of 72 bundles equivalent to thm for disposal in a deep geological formation. ADS nitride fuel The double strata fuel cycle has two different feed processes for the accelerator driven system fuel fabrication, Figure 3.2. Actinides separated in the aqueous process as oxides are converted into nitrides for example using carbothermic reduction. In this study the nitrification process is assumed to produce a negligible amount of radioactive waste. The spent ADS fuel goes through pyrochemical treatment to separate actinides. The obtained actinides in metallic form go through liquid-metal nitrification process before they are sent to fuel fabrication. 54
57 Figure 3.2. Fabrication process of actinide nitride fuel [24] Partitioning Actinide oxides Nitrification Actinide nitride ADS Pyrochemical reprocessing Actinide metal Liquid-metal nitrification N-15 recycling FR carbide fuel One possible fabrication method of carbide fuel is the carbothermic reduction of oxides with subsequent crushing and grinding of the reaction product before pressing and sintering, Figure 3.3. The amount and type of waste arising in that case is assumed to be similar to the ones generated by fast reactor MOX fabrication. 55
58 Figure 3.3. Examples of carbide fuel fabrication processes [25] Standard process Direct pressing U-Pu-oxides Blending + C In powder Compaction Press Disks Compaction Press Pellets Carbothermic Vacuum inert gas or reduction nitrogen, C Compaction Hammermill Ballmill Pressing Pelletise Repressing Recompact Pellets Sintering Vacuum inert gas or nitrogen, C Pellet control Dimensioning Density analysis Fuel pin preparation and final control Target fabrication The minor actinide target fabrication is envisaged in a distinct chain with reinforced shielding; target pins would be fabricated from a support material inert to neutrons. This prevents from polluting all MOX fabrication plants with Am and especially Cm, strong emitter of neutrons and alphas. Targets loaded in special assemblies contain a neutron moderating material ( 11 B 4 C or CaH 2 ), to improve the efficiency of actinide fission. The targets are incinerated in a single irradiation campaign long enough to fission 90% of the initial actinide atoms and rejected to waste without further reprocessing. 56
59 The amount and type of waste arising is assumed to be similar to the ones generated by fast reactor MOX fabrication Power plants The nature and amounts of waste produced in a nuclear reactor depend on the type of reactor, its specific design features, its operating conditions and on the fuel integrity. The radioactive waste contains activated structural, moderator and coolant materials, corrosion products, and fission product contamination arising from the fuel. Corrosion products, which originate within the reactor core or out of the reactor and are carried through the reactor core by the primary coolant or moderator, are activated. These activated species (nuclides) are typically short lived with half-lives of less than 30 years (exceptions include 63 Ni and 14 C). Both fission products and activation (corrosion) products are distributed throughout the primary coolant system and/or moderator system, thereby becoming the primary contributors to liquid processing waste and decontamination and maintenance waste. A large part of the soluble radioactivity appears in the primary coolant of water-cooled reactors and in the fuel storage pond. Additional liquid waste appears during decontamination of equipment, repairs and maintenance of contaminated reactor circuits or materials. Liquid waste from decontamination gives rise to high conductivity waste containing detergents with very low activity. Drains from reactor, turbine and fuel pond systems give rise to low conductivity waste (BWR). Blow down from the primary coolant and from the sampling system give rise to hydrogenated waste whereas leakage from purification systems, demineralisation drains, etc., give rise to aerated waste (PWR). Reactor building drains and leakages from systems handling heavy water give rise to tritiumbearing waste (HWR-CANDU); in that case the specific activity of the waste depends on the extent of heavy water leakages. Table 3.3 identifies the most common types of waste arising from the three root waste streams, along with their as-generated physical/chemical form and relative level of radioactivity. Figure 3.4 illustrates the waste flow streams as they move from cradle to grave (generation to disposal). Table 3.3. NPP operational waste arising and their indirect sources Waste stream Types of waste arising Physical form as generated Waste class Gaseous Filters, charcoal absorbers Dry solid LILW-SL Liquid organic Oils, solvents Liquid LILW-SL Liquid aqueous Evaporator concentrates, ion-exchange resin, sludge and slurries, filters and filter media Wet solid LILW-SL to LILW-LL Solid Core components Dry solid LILW-SL to LILW-LL Solid Spent fuel racks, combustible, compactable non combustible, metals, wood, concrete, rubble, soil, grit blast media, absorbents Dry solid LILW-SL to LILW-LL 57
60 Figure 3.4. NPP operational waste flow streams Clean effluents Clean effluents Liquids Treatment resin filters concentrates ash sludges/slurries sorbents Gas Treatment filters charcoal Solid (Plant components, DAW, etc.) Solid wastes Further treatment Treatment/ conditioning Disposal Another origin of radioactive waste from nuclear power plants is the use of liquid metal as coolant fast breeder reactor in LMFR or ADS. In this study sodium is the coolant in the primary and secondary circuits of LMFR and lead-bismuth eutectic (LBE) in the primary circuit of ADS. Besides the risk associated with the manipulation of radioactive material, nuclear sodium waste generates specific risks due to the chemical properties of the alkali metals. Reactions with water are very strong and exothermic, produce hydrogen explosive at low concentrations. The principal activity in sodium is determined by 24 Na (~34x10 10 Bq/kg) with a half life of 15 h, and very energetic gamma emissions. During operation, waste types are generated in cleaning components with residual sodium removed from sodium circuits. In addition there is a need to control the sodium regarding dissolved oxygen and hydrogen using cold traps. The principle used in cold traps to extract tritiated hydrogen from sodium is the crystallisation in the form of sodium hydride. There are also requirements to maintain the concentration of some radioisotopes at reasonable levels for radiation shielding. Corrosion products formed in, or entering, the primary sodium, constitute another source of activity with undesirable aspects during maintenance. They consist of isotopes of chromium, manganese, iron and cobalt mainly that can be caught using specific traps, the same as for fission products e.g. caesium. Liquid effluents are later on processed in the liquid radioactive waste system in a very similar way as in LWR. Any intervention for maintenance, repair or modification of a circuit or a component wetted with sodium metal will generate sodium contaminated gloves, tissues, tools metallic parts, etc. In the 58
61 course of such interventions it is sometimes necessary to remove limited quantities of residual sodium which have to be processed as waste. The molten lead or bismuth coolant is activated in a fast neutron flux. The natural isotope of bismuth is 209 Bi (abundance ~100%) which by neutron capture results in the formation of 210 Po (T 1/2 =139d) and to a lesser extent 210m Bi (T 1/2 =3.6x10 6 y) or 208 Bi (T 1/2 =3.6 x10 5 y). A small amount of 209 Po is formed from 210 Po. 210 Po having 138 days half-olihxqghujrhvdq -decay, and 209 Po decays in a similar way with a half-life of 120 years. Polonium is volatile at coolant operating temperatures, some amount of it migrating to the cover gas, where it forms aerosols. Leaks of cover gas or coolant may cause contamination problems and maintenance of components requires special measures to protect personnel, but not large amounts of contaminated materials will result. The generation of waste in those reactors, can be considered similar to the Na cooled reactors [26]. Helium coolant is not activated in a neutron flux. Since the GFR concept is in very early phase, it is assumed to generate similar amount and type of operation waste as LMFR. The spallation target of ADS generally contains lead-bismuth as a target material. The target is operating under very hard irradiation conditions. In this study it is assumed that the target is changed once a year. This assumption will be verified by the upcoming operation of the MEGAPIE leadbismuth target. The operation is scheduled to start in 2006 at PSI, Switzerland Reprocessing plants When the spent fuel is reprocessed volatile fission products, especially rare (noble) gases, and partially tritium ( 3 H), carbon-14 ( 14 C) and iodine, are liberated from the fuel and collected for further treatment. The radiological impact of rare gases is small, thus they are released without any particular treatment. Gaseous and liquid tritium is captured in water. 14 C is absorbed with sodium solution. Current practise is to dilute 14 C together with tritium and release them into sea water. Also both 14 C and 3 H have very small radiological impact in environment. Iodine is highly mobile, and in contrary to rare gases, is chemically reactive and radiotoxic due to its specificity for the thyroid. During aqueous reprocessing, iodine can be removed from the dissolver solution with a yield of 95-98%. To improve the separation yield, more complex chemical treatments are necessary. Better separation yields may also be achieved with high-temperature pyrochemical processes. Special methods for conditioning iodine in the form of AgI, PbIO 4, etc. have been developed but, because of its extremely long half-life, the eventual migration to the environment cannot be excluded. Presently iodine is diluted in the sea [27]. The radiological impact of this procedure is totally negligible, because the released very long-lived 129 I is diluted in natural iodine isotopes. The existence of a maximal dose that a thyroid organ can accept, when combined with the considerable isotopic dilution factor and the absence of any concentration factor that would be isotope selective, ensures that the dose delivered by 129 I can be completely negligible in all cases. The shortlived radioactive isotope of iodine, 131 I has a half-life of 8 days and therefore is totally absent from waste. PUREX and advanced PUREX During reprocessing, the irradiated nuclear fuels are dissolved in nitric acid solution. In the plants in operation today, plutonium and uranium are extracted using an organic molecule tri-butylphosphate (TBP). The remaining solution is vitrified as a high-level waste, containing the dissolved 59
62 fission products and some impurities, primarily from cladding materials and inactive process chemicals, traces of separated Pu and U, and other transuranic elements. Recent studies have shown that the conventional PUREX process can be adapted to extract the neptunium with a high yield, together with the uranium and plutonium. It is then called UREX. It can be assumed that the separation of neptunium does not change the amount of waste generated if Np is recycled together with Pu and U. The separation of americium and curium, however, is much more challenging and demands additional extraction molecules (new extractant). For this study it is assumed that each stage produces a similar amount of secondary waste, but with different chemical contents. 7KH RUJDQLF H[WUDFWLRQ PL[WXUH LV GDPDJHG E\ WKH UDGLDWLRQ HVSHFLDOO\ E\ WKH -radiation. In order to keep the damage at an acceptable level the residence time is limited. The higher is the burn-up, the shorter the residence time. UREX+ The UREX+ process consists of consecutive solvent extraction processes that separate spent fuel into several fractions, such as a uranium product, a technetium product, a caesium-strontium product, a plutonium-neptunium product, an americium-curium product. This process offers a possibility to recycle actinides and to manage separately Cs and Sr as main heat producers. Being an aqueous process, it is assumed in this study that UREX+ process produces similar secondary waste as advanced PUREX. Pyrochemical processing In contrast to conventional aqueous processing, pyroprocessing does not involve dissolving spent fuel in an acid solution. Typical steps of pyroprocessing (flow diagrams presented in Appendix E) are the following. First the structural materials of fuel assemblies, such as cladding, are removed and the fuel is cut or crunched into small pieces. Then the fuel segments are placed in a metal basket and inserted into the electro-refining cell containing an electrolyte salt, for example eutectic LiCl-KCl mixture. The cell is normally operated at a high temperature, for example K. Most of the spent fuel constituents, including uranium, TRUs and fission products, dissolve into the salt. The uranium is electro-transported to a solid cathode where it deposits in purified form. Plutonium, minor actinides and reactive fission products accumulate in the salt. After uranium recovery the solid cathode is replaced by a liquid cadmium cathode. Plutonium and other minor actinides, the rest of uranium together with small amounts of lanthanide fission products are collected in this liquid cathode. Non reactive fission products generally accumulate as metallic solids in the anode basket (anode sludge). As fission products accumulate, the heat load due to their radioactive decay increases until the heat generating elements are removed. The salt is treated to separate the actinides while nearly all of the rare earths are left in the salt. The cathode deposits from the electro-refining cell are heated to vaporise any contaminating salt, and to form an ingot of heavy metal. Pu and MAs are extracted from the cadmium using reductive techniques. The separated material may go through for example oxidation or nitrification depending on the fuel type before it is transported to the fuel fabrication unit. The salt goes through specific treatments to recover the remaining TRU elements and to remove a sufficient quantity of fission products so that it can be recycled. The designs of the dry reprocessing 60
63 plants are sketches and the uncertainty of the amount of salt going to waste is large. It is planned to colocate the fuel fabrication and separation plants on the same site because often an inert atmosphere (without H 2 O or O 2 ) is necessary for handling MA (TRU) compounds such as nitrides or chlorides. Another solution is to use fluorine components instead of chlorine. In this study the carbide fuel is assumed to be reprocessed using fluorine based technology. The waste products are similar to the ones described above, except that the ceramic waste product contains fluoride salts instead of chlorides. A pyrochemical process generates specific waste forms: off-gas trapping solutions, un-trapped gases, contaminated salts and metals used for extraction. The management of these waste forms will require substantial development work, suitable treatment and stable conditioning processes need to be identified [28]. Decontamination processes may include electrostatic filtration for gases, melting for metals or metal-salt exchange for salts. The waste conditioning techniques include: x defining a suitable containment material for the process secondary waste; x characterising the material by determining its structural properties, thermal stability, and physicochemical characteristics; and x investigating its long-term behaviour (leaching resistance, etc.) under various interim storage or disposal conditions. The losses of U, TRU and FP go with the spent salt to waste conditioning. The amount of salt and metal reagents going to waste depends on how well the processes are designed and operated, because these inorganic reagents are not damaged by the radiation contrary to organic extracting agents. Because no industrial scale experience exists the amounts can be estimated only on basis of laboratory-scale studies. Fuel hulls and end pieces and fuel cladding contaminated with the activation and fission products constitute waste streams that are conditioned with solidification materials. Another solution is to cast them with the metallic primary waste. From the industrial experience of the PUREX process, it is known that there is no or nearly negligible generation of technological waste by hydrometallurgical processes during the plant life. In the case of pyrochemical processes, no industrial experience exists to estimate the volume of technological waste but high temperature and corrosive reagents are likely to produce some. Without industrial experience it is difficult to estimate the volume of this waste, presumably mainly HLW. Table 3.4 shows the waste generation parameter values used to calculate the waste flows per TWh generated by the reprocessing plants as shown in Table 3.5. Table 3.4. Amount of conditioned waste generated by the reprocessing plants (m 3 /thm) Generated waste Reprocessing technology Aqueous Pyrochemical, nitride Pyrochemical, metal Pyrochemical, carbide LILW-SL LILW-LL * 2.9 HLW * Cladding metal included in HLW. 0.54/0.18/0.72 (ceramic/metal/total) 0.2/0.01/0.21 (ceramic/metal/total) 61
64 The basic assumptions are the following: x In the pyrochemical-metal fuel process, the stainless steel claddings and end-pieces are assumed to be mixed with noble metal waste stream. In pyrochemical-nitride fuel process, the claddings and end-pieces are assumed to be conditioned separately. The conditioning method of the carbide fuel cladding is not defined and not included in the waste flows. The amount is estimated to be 228 kg of SiC/tHM (0.076 m 3 /thm). The density of SiC is assumed to be around kg/m 3. x The metallic fission products are conditioned with stainless steel. The alloy is directly cast into a disposal canister. The waste loadings of pyronitride, pyrometal and pyrocarbide are assumed to be 20 wt%, and 1 wt% and 26 wt%, respectively. These values are based on the estimates presented in different projects, and they do not represent real differences between separation technologies. In all the cases noble metal waste is considered to be HLW. However, the heat production of the metallic waste form is low and it might be classified as LILW-LL. x The most important factor explaining the differences between the volumes of waste from the different pyrochemical processes shown in Table 3.4 is the waste loading factor of ceramic waste product. The following values are used: pyro-nitride 25 wt%, pyro-metal around 10%, pyro-carbide 15%. Table 3.5. Waste flows generated by the reprocessing plants Fuel cycle scheme Technology/fuel HM mass flow Amount of conditioned radioactive waste (m 3 /TWh) (kg/twh) LILW-SL LILW-LL HLW 1b PUREX/PWR-UOX c UREX/PWR-UOX d OREOX/UOX a PUREX/(UOX + MOX-EU) b 2c 2cV 3a 3b Adv. PUREX/(UOX + MOX-EU1 + MOX-EU2) Adv. PUREX/(UOX + FR- MOX) Adv. PUREX/(UOX + FR- MOX) UREX/UOX Pyro FR-metal Total PUREX/(UOX+MOX+FR- MOX) Pyro/ADS-MA Total PUREX/(UOX+MOX) Pyro/ADS-TRU bV Total cV1 Pyro/FR-carbide cV2 Adv. PUREX/FR-MOX
65 There are large uncertainties on the data regarding waste flows generated in the reprocessing plants, due to the fact that the amount of secondary waste produced depends not only on the technology used, but also on the composition of the spent fuel treated and on the level of optimisation of the processes. The process optimisation, as a result of learning and development work, can bring an important reduction, for example by factor of 2-3 in currently operating plants, on the amount of secondary waste produced. The difference between the amount of secondary waste produced by the COGEMA plant in La Hague and the BNFL plant in Sellafield using the same technology illustrates clearly the dependence of the waste production on the type of fuel treated. The uncertainty is very large on the secondary waste flows of new technologies which exist only at laboratory scale or in conceptual phase. The values presented in this study for these technologies are based on expert estimates and represent target values. A basic principle in assessing target values is that any new technology should not produce significantly more waste than the current one. 3.3 Decommissioning waste Decommissioning of nuclear fuel cycle plants and other nuclear installations (as particle accelerators) will give rise to large volumes of concrete, steel, other metals and used components. Some of these materials and equipment can be recycled or reused safely but others enter in the category of low or intermediate radioactive level waste types. The amount and characteristics (specific activity, isotopic composition, etc.) of the waste strongly depend on the process each plant carries out. Of course, big differences could be observed in the decommissioning waste from plants devoted to a single fuel cycle step due to different design, processes and plant ageing. Thus, a reference plant has been considered in each case Power plants Decommissioning of nuclear power plants generates significant quantities of LILW, which will have been contaminated or activated during plant operation, including: x x Activated equipment and materials such as reactor internals, reactor vessel and concrete shielding surrounding the reactor vessel; and Corrosion products such as deposits (crud) formed from corrosion and release in circulating coolant of material from primary system materials (eventually also fission products from damaged fuel), followed by subsequent deposition and activation on core surfaces; later, activated material is then re-released into the coolant and deposits on the various reactor coolant system surfaces, where subsequent release/deposition cycles continue to occur. The activated corrosion products can be a major contributor to the radiological impact of dismantling materials. Pressurised water reactors A MWe PWR with 40 years operational lifetime has been chosen as the reference plant. The main materials arising from the decommissioning of a PWR are steel and concrete. About 10 4 tonnes of steel and 10 5 tonnes of concrete are generated by the decommissioning of a MWe PWR. Approximately 95% of the large mass of concrete has only very low levels of radioactivity 63
66 (scope for exemption). In contrast, only a half of the steel would be acceptable for recycle. Around m 3 of LILW-SL and 250 m 3 of LILW-LL are generated by the dismantling of a PWR. 60 Co is the main contributor to external irradiation in particular if dismantling begins shortly after the closure of the plant. CANDU The total amount of radioactive waste generated when a CANDU power plant is dismantled is around m 3. The type and portions of waste are assumed to be similar to decommissioning waste of PWR described above. The amount of CANDU decommissioning waste relative to amount of electricity produced is similar to the PWR case. Liquid metal cooled fast reactor The main requirement in decommissioning a LMFR is to treat the liquid metal coolant as a chemical waste. Without further treatment it (cannot be considered as a stable nuclear waste due to its chemical properties: strong reaction with water and potential ignition with air when liquid. Thus in the decommissioning phases it will be necessary to transform the coolant into a stable chemical product. The presence of sodium or NaK should be taken into account at every step of decommissioning operation. For example fuel assemblies and all the components which have been in contact with coolant have to be carefully cleaned before they are either dismantled or transported. If the primary and the secondary coolants cannot be re-used, they should be treated chemically in order to transform these large amounts of metallic radioactive products (several to several hundreds of tonnes) into stable products. The primary vessel drained from the primary coolant and the secondary circuit drained from the secondary coolant will contain some residual amount of liquid metal adhering to the surface or retained inside the structures. These cleaning operations produce secondary waste comprised of sodium and highly activated or contaminated products such as cold or caesium traps. These waste types cannot be packaged directly, but a special treatment is needed to stabilise the sodium. The sodium coolant can be stabilised for example by transforming the metal into sodium sulphate or sodium hydroxide (NOAH process). Some non-nuclear industries release large amounts of sodium sulphate into rivers or seas. Considering the low activity of the primary sodium and the absence of fission products it could be possible to release the coolant into rivers or seas without reaching the dose limits. However, this method may raise public concerns. The coolant of SuperPhénix reactor is being disposed of by another method, solidification of the sodium hydroxide with cement in form of concrete blocks for storage as very low-level waste [29]. Gas cooled fast reactor Because the lack of experience on GFR decommissioning, it has been assumed that this reactor type has decommissioning waste similar to LWR decommissioning waste although the reactor might be larger due to lower heat transport capacity of gas compared to water. 64
67 Accelerator-driven system The decommissioning waste of ADS is assumed to be similar to the decommissioning waste of a lead-bismuth cooled fast reactor plus the accelerator shielding. The proton beam window and the spallation targets are taken into account as waste from normal operation. Long-term residual radioactivity of typical LBE coolant at the end of the operating life causes VSHFLDO FKDOOHQJHV IRU WUHDWPHQW FRQGLWLRQLQJ DQG GLVSRVDO RI ZDVWH 7KH VSHFLILF -activity is determined by 210m Bi (T 1/2 =3.6x10 6 \ ZKLOH -activity is controlled by 208 Bi (T 1/2 =3.6 x10 5 y). Purification of LBE coolant from the long-lived radionuclides of bismuth and polonium would be expensive, if even possible, limiting re-use of the coolant. Because of the residual activity and the chemical toxicity of the LBE, it should be isolated from the biosphere for a long period of time [26] Enrichment plants Enrichment plants are characterised by low specific activities. Low enriched uranium (maximum 5% of 235 U) is only slightly radioactive thus reducing the handling and processing requirements. This holds true during dismantling as well. LILW-SL are generated by the decommissioning of enrichment plants. However, the waste products and characterisation will differ if uranium from reprocessing operations (RepU) is recycled through the facility leading to increased activity from transuranic elements (Np) and fission products (mainly 99 Tc). The reference plant is the BNFL diffusion plant at Capenhurst having a capacity of SWU/year. In 1982 the plant ceased operation and BNFL immediately began development work on its dismantling and decommissioning. Decontamination processes and techniques made it possible to recycle for unrestricted use 99% of the tonnes of material contained in the plant. Without these decontamination processes, much of this material would have been sent for disposal as LLW. The recycling of aluminium, brass, copper and steel recovered from the project provided both a cost effective and environmentally responsible solution. The physical components of the waste from the decommissioning are metals (46%), building materials (24%), asbestos (4%), aluminium dross (8%) and other miscellaneous material (17%) amounting roughly to m Fuel fabrication plants Uranium oxide fuel plants The average production of a UOX fuel fabrication reference plant over its 40 years operational life is assumed to be about tonnes of uranium oxide per year a quantity of fuel that will produce some 490 TWh of electricity. It is assumed that there is no HLW or TRU waste present in the reference plant. The theoretical total compacted radioactive waste volume from the decommissioning of this plant amounts to m 3, but only about 3% (1 100 m 3 ) is shipped to a LLW disposal facility. The remainder ( m 3 ) is either decontaminated and disposed of in non-radioactive waste dumps or is processed to recover residual uranium. Most of the material not sent to a radioactive waste disposal facility consists of CaF 2 solids from the fluoride waste lagoons ( m 3, weighting about tonnes). The rest of the waste (about m 3 ) is decontaminated and sent to the local non-radioactive waste dump or is sold for scrap [30]. 65
68 Mixed oxide fuel plants The materials generated from the decommissioning of MOX fuel manufacturing plants are characterised by the presence of radiotoxic plutonium in significant quantities and of fission products at impurity levels. Apart from the primary materials arising from dismantling, Perspex, fibreglass, mild steel and stainless steel a considerable amount of secondary waste is generated in the form of protective clothing, including PVC suits and overalls, shoes, rubber gloves, PVC bags containing the waste, and cutting and handling tools. In addition waste arises from the contaminated filters used to capture airborne activity and liquid effluent from showers and laundry plant used to decontaminate the suits and equipment. Most, if not all of this waste is contaminated with alpha activity which generally classifies the waste as intermediate level. Smaller volumes of lower level waste are generated from dismantling external structures around the glove boxes themselves before they are cut up and the primary containment broken. These materials include instrumentation, wiring, metal piping and structural steelwork. Some of this waste can be categorised as free release and sent as scrap for reuse. Data on dismantling MOX fuel plants are limited. Average operation data have been provided by Belgonucléaire based on the statistics of the last 10 years. During that period some 20 glove boxes of 3 m 3 free volume each were dismantled and average quantities of waste generated each year give an estimate of future decommissioning waste for a MOX plant producing 40 tonnes of MOX fuel by year. OREOX The amount of the decommissioning waste coming from an OREOX plant is estimated to be very similar to that from a MOX fuel fabrication plant without any process for blending and coprecipitating uranium and plutonium solutions, and with the additional processes for the mechanical and thermal de-cladding, and for re-sinterable powder preparation. Based on the small scale MOX fuel fabrication facility [31] and on the additional processes, and assuming that the portion of ILW be 62.7% of the decommissioning waste [32], the amount of waste is estimated to be about 0.61 m 3 /TWhe of LILW-LL and 0.36 m 3 /TWhe of LILW-SL Reprocessing plants Data on dismantling fuel-reprocessing facilities is limited. Such facilities are generally contaminated by the beta and gamma emitting nuclides having relatively short half-life, except certain areas of the plant where alpha contamination is dominant. Hence facilities can be generally put into a state of care and maintenance while awaiting the benefits of radioactive decay. In addition, such plants are extremely complex and commercial facilities are very large. Fuel reprocessing plants are characterised by contamination from alpha, beta, gamma and neutron emitters resulting from the treatment of irradiated nuclear fuel. In essence, a reprocessing plant is similar in nature and design to a chemical plant. Additional features are designed to take account of the radioactivity present, including: additional shielding of vessels and cells, safe geometry design to prevent criticality, remote handling techniques and high levels of automation. Table 3.6 provides data obtained from [33] for the decommissioning of the Sellafield (United Kingdom) commercial reprocessing plant. 66
69 Table 3.6. Estimated amount of waste generated by decommissioning Sellafield (United Kingdom) commercial reprocessing plant Waste class Material 1 Volume 2 (m 3 ) LLW ILW Metals Concrete Soil Foundations Metals Concrete Soil Foundations Metals: mainly carbon steel and stainless steel, although some other materials as plastics, wood are also included; Concrete includes carbon steel rebar. 2. Volume that waste would occupy in storage, whether in vaults, drums, etc., before conditioning for long-term safe management. 3.4 Comparison between fuel cycles The data on waste flows generated in the various steps of the fuel cycles are based on the real data from the reference plants. For the new and advanced technologies when no experience or other real data is available, values for similar current technologies are used. These values should be validated eventually when more information will be available. It should be noted also that the technologies were not selected to optimise waste generation. The lack of data on the amount of LILW-SL implies that similar assumptions are made for the waste streams of many schemes. This is reflected in the small variability of waste volumes presented in Figure 3.5. However, the data indicate also that the power plant operation waste dominates this category. Figure 3.5. Total amount of short-lived low- and intermediate-waste types m 3 /TWhe a 1b 1c 1d 2a 2b 2c 2cV 3a 3b 3bV 3cV1 3cV2 Reactors Others The amount of LILW-LL generated in the fuel cycle depends on the spent fuel reprocessing technology and each additional separation step adds up its own waste. The data presented in Figure
70 are indicative only because the volume depends on the conditioning technology and the values presented here are based on preliminary estimates. Figure 3.6. Total amount of long-lived low- and intermediate-waste types m 3 /TWhe a 1b 1c 1d 2a 2b 2c 2cV 3a 3b 3bV 3cV1 3cV2 Reprocessing Others The volume of the HLW is largely defined by the waste loading factor at conditioning. In many cases the limiting factor is the amount of fission products. Thus, the amount of actinides in the waste has only a minor effect on the HLW volume (see Figure 3.7). The volume of HLW of once-through cycle corresponds to the volume of the fuel element. Thus, the density of the waste is much lower than for conditioned HLW from reprocessing. The differences between schemes within Family 3 are a result of differences in waste loading factors. The volume of conditioned waste decreases from m 3 for LILW-SL to m 3 for LILW- LL and m 3 for HLW. Figure 3.7. Total amount of conditioned high-level waste m 3 /TWhe a 1b 1c 1d 2a 2b 2c 2cV 3a 3b 3bV 3cV1 3cV2 68
71 The amount of decommissioning waste, Figures 3.8 and 3.9, depends slightly on the number of processing steps, though reactors are the largest contributor in all schemes. In this study, decommissioning is not expected to generate any HLW, but depending on the national regulation some most activated parts such as reactor internals might be classified as high-level waste. Figure 3.8. Amount of decommissioning LILW-SL (uranium mining excluded) m 3 /TWhe a 1b 1c 1d 2a 2b 2c 2cV 3a 3b 3bV 3cV1 3cV2 Reactors Others Figure 3.9. Amount of decommissioning LILW-LL (uranium mining excluded) m 3 /TWhe a 1b 1c 1d 2a 2b 2c 2cV 3a 3b 3bV 3cV1 3cV2 Reactors Others 3.5 Conclusions The conditioning technology is one of the important factors defining the volume of the HLW generated by the reprocessing plants. Current conditioning methods are not optimised for the composition of the waste streams produced by the advanced separation technologies, especially pyrochemical technologies In many cases the amount of certain fission products is the limiting factor o conditioned waste loading. This decreases the differences between the volume of conditioned HLW produced by different separation technologies and the different fuel cycle schemes. 69
72 During normal operation, the majority of the LILW-LL is generated by the reprocessing activities. The differences between fuel cycles are relatively small but the uncertainties are very large because no real or experimental data on secondary waste flows exist. Additionally, secondary waste flows depends not only on the technology used but also largely on how the plant is operated. When the fuel cycle facilities are decommissioned, reactor plants are also large contributor of LILW-LL. The volume of LILW-SL generated by the fuel cycles is dominated by the power plants. Uncertainties are also large in this case, as for the LILW-LL case. References [1] IAEA (1995), The principles of Radioactive Waste Management, IAEA Safety Series No. 111-F, Vienna. [2] IAEA (1994), Classification of Radioactive Waste, IAEA Safety Series No. 111-G-1.1., Vienna. [3] IAEA (2004), Regulations for the Safe Transport of Radioactive Material, 1996 Edition (As amended 2003), Safety Standards Series No. TS-R-1, Vienna. [4] US NRC, Licensing requirements for land disposal of radioactive waste, Code of Federal Regulations, Title 10, Part 61. [5] US NRC, Disposal of high level radioactive wastes in geologic repositories, Code of Federal Regulations, Title 10, Part 60. [6] IAEA (1994), Status of Technology for Volume Reduction and Treatment of Low and Intermediate Level Solid Radioactive Waste, IAEA TRS No. 360, Vienna. [7] IAEA (1994), Advances in Technologies for the Treatment of Low and Intermediate Level Radioactive Liquid Waste, IAEA, TRS No. 370, Vienna. [8] IAEA (1993), Improved Cement Solidification of Low and Intermediate Level Radioactive Waste, IAEA TRS No. 350, [9] IAEA (1993), Bituminisation Processes to Condition Radioactive Wastes, IAEA TRS No. 352, Vienna. [10] IAEA, Design and Operation of the High Level Waste Vitrification and Storage Facilities, IAEA TRS No. 339, Vienna. [11] IAEA (1996), Management of radioactive waste from NPP. Interregional Training Course. 9 September -4 October 1996, Vienna. [12] IAEA (1997), Performance of high level waste forms and packages under repository conditions. Coordinated research project, Vienna.G [13] IAEA (1999), The R7/T7 Vitrification at La Hague: 10 years of operation. Technologies for the Management of Radioactive Waste from Nuclear Power Plants and Back-end Nuclear Fuel Activities. Proceedings. IAEA Symposium. Taejon, 30 August-3 September 1999, Vienna. 70
73 [14] Commission Ampere, Rapport principal, Appendix A, Brussels, Belgique. [15] CEA (2002), Clefs no: 46. [16] Posiva (1999), The final disposal facility for spent nuclear fuel, Environmental impact assessment report. [17] IAEA (2002), Management of low and intermediate level radioactive wastes with regard to their chemical toxicity. IAEA-TECDOC [18] USDOE (1999), Programmatic Environmental Impact Statement for Alternative Strategies for the Long-Term Management and Use of Depleted Uranium Hexafluoride, DOE/EIS-029, US Department of Energy, Washington, D.C., April [19] NEA and IAEA (2001), Management of Depleted Uranium, 63 pp. OECD, Paris. [20] Wingender H.J., Becker H.J. and Doran J., (1994) Study on depleted uranium (tails) and on uranium residues from reprocessing with respect to quantities, characteristics, storage, possible disposal routes and radiation exposure. Report EUR EN. European Commission, Brussels. [21] NEA/IAEA (2002), Environmental Remediation of Uranium Production Facilities, OECD, Paris. [22] Health, Safety and Environment Report, 2003, Urenco (Capenhurst) Limited. [23] Environment Report 2001, Belgonucléaire. [24] Nakayama, S. Morita, Y. Hishihara, K. (2001), Radioactive wastes generated from JAERI partitioning-transmutation cycle system. Global2001 Conference Proceedings. CEA France. [25] Richter K., Blanck H., Fabrication processes and characterisation of LMFBR carbide and nitride fuel pins. IAEA-TECDOC-466, pp , Vienna. [26] IAEA (2002), Comparative assessment of thermophysical and thermohydraulic characteristics of lead, lead-bismuth and sodium coolants for fast reactors. IAEA TECDOC-1289, Vienna. [27] Wydler, P., Baetslé, L.H. (2001), Closing the nuclear fuel cycle: issues and perspectives. NEA (2001), Proceedings of 6 th Information Exchange Meeting on Actinide and Fission Product Partitioning and Transmutation, Madrid, Spain, December 2000, OECD, Paris. [28] NEA (2004), Pyrochemical Separations in Nuclear Applications, OECD, Paris. [29] Rodrigues R., Frith R., Berte M. (2002), General review of the decommissioning of liquid metal fast reactors (LMFRs) in France, IAEA Technical Meeting on Operational and Decommissioning Experience with Fast Reactors. Cadarache, France, March 2002, Vienna. [30] Technology, Safety and Costs of Decommissioning a Reference Uranium Fuel Fabrication Plant. NUREG/CR October
74 [31] Elder, H.K. (1985), Technology, safety and costs of decommissioning reference nuclear fuel cycle facilities, NUREG/CR [32] Alternative for managing wastes from reactors and post-fission operations in the LWR fuel cycle, ERDA (1976). [33] Defra/Nirex (2002), The 2001 United Kingdom Radioactive Waste Inventory. 72
75 4. FISSION PRODUCT MANAGEMENT OPTIONS Fission products are the major constituents of high-level waste in the case of a closed fuel cycle, especially from a quantitative view point, since all actinides including minor actinides are recycled, leaving a very small amount of residual actinides in high-level waste. For example, in the case of Scheme 3c the amount of fission products is more than 100 times larger than the total amount of actinides in high-level waste (see Table 2.3). Consequently, fission product management could play an important role in reducing the vitrified high-level waste in the case of closed fuel cycles. The reduction of the vitrified high-level waste will be a key issue, even in closed fuel cycles, for a continued sustainable use of nuclear energy. Fission product management, although still at an early development stage, is one of the candidate options for sustainable use of nuclear energy. 4.1 Fission product separation The separation of fission products is at the stage of fundamental research, and widely recognised proven technology options have not been identified yet in this field. Information on this topic is very scarce and therefore the following section is limited to a qualitative approach. The main fission products considered candidates for separation are strontium and caesium which are heat-generating solid FPs affecting the volume or cooling time of vitrified waste to be disposed, and iodine and technetium which are long lived and are highly mobile in certain geological environments. An example of a separation process flow within an aqueous reprocessing system is described below [1,2]. Spent fuel is dissolved in nitric acid. Gaseous iodine released from the solution as off-gas is converted into copper iodine (CuI) that is recovered after being trapped on an adsorbent such as AgX. Uranium and TRU contained in a clarified dissolver solution are then separated at the extraction step. Much of the Tc is removed at the dissolution and extraction steps and converted into oxide. The highly-active aqueous raffinate containing MA (americium, curium), some Tc, Sr, Cs and other FPs arising from the extraction step is treated to recover MA. Strontium and Cs are co-separated or separated by the chlorinated cobalt dicarbolide (CCD) method [3], and are then sent to the interim storage or the subsequent step, i.e., vitrification followed by interim storage. 4.2 Fission product target fabrication The transmutation of some long lived fission products is a relevant means to reduce the radiological impact of disposal in underground repositories because they have a very high mobility in certain geological environments, but it is less effective in reducing the radiotoxicity and mass of vitrified waste. Fission product targets have been fabricated only for the experimental irradiations [4,5]. The metallic powder of Tc was melted several times into small buttons by arc melting to improve the purity of the material by evaporation of impurities. Metal rods of Tc were prepared by casting the 73
76 metal in a cold copper mold using an arc melting system, followed by cutting the rods to the required length. The filling of the irradiation capsules, which contain metal rods and are made of stainless steel, was performed under a controlled inert (nitrogen) atmosphere. The samples were sealed by tungsten inert gas (helium) welding [5]. The fabrication process for I targets depends on their chemical forms. Experimental fabrication has been performed as described below [4]. First, NaI and CaI 2 powder was dried at 400 C in an argon atmosphere. Then, the powder was pressed to pellets inserted in stainless steel capsules filled with helium. Examples of experimental fabrication and irradiation of FP targets carried out in the past are shown in Table 4.1. The transformation of the fission products recovered from reprocessing into the chemical forms appropriate for target material should be considered. Table 4.1. Experimental fabrication and irradiation of FP targets Tc I Chemical form Tc metal Tc-Ru alloy NaI, CeI 3, PbI 2 CuI, Ca(IO 3 ) 2 NaI, CaI 2, MgI 2, CuI Irradiation experiment EFTTRA, ANTICORP1 EFTTRA HFR (NRG) Remarks [5,6] No technical limitations were observed [7] Out of pile experiment [5,6] Swelling was observed in PbI 2 [8] Out of pile experiment [4] Chemical interaction between the steel end plug and swelling were observed in CuI Multiple recycling of fission products, separation, target fabrication and transmutation, will be necessary to reduce the amount of fission products. Therefore, the chemical form of FP targets should be selected taking account of the recycling. Few studies have been reported on this topic. A possible flow sheet of long-lived fission products (LLFP) transmutation is shown in Figure 4.1. Figure 4.1. Possible flow sheet of LLFP transmutation Structural and moderator material of FP target assembly Reprocessing of spent fuel Recovery of FP material Target fabrication FP target assembly Transmutation in reactor Reprocessing of FP targets Waste 4.3 Effects of heat-generating fission product separation It is desirable to reduce the number of HLW canisters from the viewpoints of environmental impact and economical competitiveness. One of the possible approaches for this purpose is to separate heat-generating FPs such as Cs and Sr and keep them in interim storage until the heat generation 74
77 decays down to an acceptable level. An example of quantitative evaluation of the effects of heatgenerating FP separation conducted by JNC is described below [1,9]. A study has been performed in order to evaluate the number of HLW canisters and the cost of heat-generating FP separation and HLW disposal for two scenarios (shown in Figure 4.2 and compare the results. Scenario 1 is a conventional disposal of HLW without MAs. In scenario 2, Cs and Sr are separated and temporarily stored, until the heat generation decays down to an acceptable level. The separation of Cs and Sr does reduce the number of HLW canisters but entails extra costs. The assumptions made for this study are the following: x The burn-up of the fast reactor MOX spent fuel is 150 GWd/t and the cooling period is four years. x High-level radioactive liquid waste (HLLW) is the raffinate generated by an advanced aqueous reprocessing of FR spent fuel. x The glass content of a vitrified HLW canister is 500 kg/canister. x The heat generation from a canister should be less than 2.3 kw based on the criteria accepted at the Rokkasho reprocessing plant. x Three values are considered for the content of total FP oxides in a canister: 15 wt%, 20 wt%, and 25 wt%. x The recovery rate of molybdenum (Mo) is 80% in order to clear the content limit of Mo oxide (less than 2 wt% [10]), since high burn-up fuels like FR spent fuel have higher Mo content than PWR spent fuel. x The caesium and strontium co-separation process is the CCD method [3]. x The heat generation of a HLW canister should be less than 400 W for the disposal in a repository. x The cost is evaluated taking into account Cs/Sr separation, Cs/Sr interim storage, HLW interim storage, and geological disposal. The results show that scenario 2, in which Cs and Sr are separated and temporarily stored, can reduce the number of vitrified HLW canisters by 25-40% as compared with scenario 1 in which Cs and Sr are not separated (see Table 4.2). The interim storage time until the heat generation decays down to the level where the content of total FP oxides in a canister becomes the limiting factor is evaluated at 12 years and 32 years for the cases of less than 20 wt% content and less than 25 wt% content, respectively. Scenario 2 involves additional costs for Cs/Sr separation and Cs/Sr interim storage but the cost for HLW interim storage and geologic disposal can be reduced, resulting in a 5-10% increase in total cost (separation, interim storage and geological disposal) as compared with scenario 1. 75
78 Figure 4.2. Scenarios for comparative study [9] 5EGPCTKQ 5EGPCTKQ (4 URGPVHWGN (4 URGPVHWGN TGRTQEGUUKPI *..9 TGRTQEGUUKPI *..9 /#UGRCTCVKQP *..9 /# /#UGRCTCVKQP *..9 %U5T UGRCTCVKQP *..9 /# %U5T %U5T UVQTCIG XKVTKHKECVKQP XKVTKHKECVKQP %U5T KPVGTKOUVQTCIG KPVGTKOUVQTCIG TGRQUKVQT[ TGRQUKVQT[ Table 4.2. Evaluated number of vitrified HLW canisters [9] Number of HLW canisters (/ton HM) Interim storage time of Cs and Sr (year) Limiting factor Less than 15 wt% content of total oxide FPs in a canister Scenario 1 Scenario 2 More than 15 wt% content of total oxide FPs in a canister Less than 20 wt% content of total oxide FPs in a canister Less than 25 wt% content of total oxide FPs in a canister Content of total oxide FPs in a canister Heat generation Content of total oxide FPs in a canister Content of total oxide FPs in a canister The effects of Cs/Sr separation were evaluated also for the case of Yucca Mountain [11]. The main results of the evaluation are the following: x x The dominant contributions to the thermal load of the waste emplaced in Yucca Mountain that leads to reaching one or more of the temperature limits are Pu and Am. Removal of these elements and recycling them to reduce the hazard, are essential to increasing the drift loading of the repository. The benefit in increasing the drift loading (or decreasing the repository size for a given capacity) ranges from a factor of 4.3 to 5.4. After the Pu and Am have been removed, the next elements that need to be considered are Cs and Sr. Removing 99.9% of these elements and sequestering them in a separate area of the repository or another facility, would allow a further substantial increase in the drift loading of the repository, up to a factor of 42.7 as compared with the direct disposal option. 76
79 4.4 ORIENT-cycle Although most of the past research and development studies have been focussed on actinide management, the recently proposed ORIENT-cycle [12,13,14] can be considered as one of the examples which tries to manage fission products in addition to actinides. The basic philosophy of the ORIENT-cycle is rough removal of unnecessary elements instead of conventional pure recovery of necessary elements. Stable and semi-stable fission products that amount to about 60 wt% of all FPs were identified as key unnecessary elements, since they are parasitic neutron absorbers and simultaneously are non-radioactive elements that do not necessarily need to be disposed of in a deep geological repository. Therefore, unnecessary elements are selected, taking account of the front end and the back end of the fuel cycle, and core design. The elements contained in spent fuel are classified into five categories; low-level waste, vitrified waste, valuable resources, storage or transmutation, and recycled fuel, as shown in the separation process (Figure 4.3). Figure 4.3. Concept of ORIENT-cycle [12] Actinides U, Np, Pu, Am, Cm Decontaminated FP Cd, Be, Nb, Sn, Se, Sb, Pm, Ho Natural Uranium Fuel Fabrication I, Tc for transmutation Option Fast Reactor Cs, S I, Tc, H, C, Kr Separation Process Stable FP Xe, Mo Semi-stable FP Nd, Ru, Rh, Ce, Pr, Ba, La, Te, Gd, Rb, Y Low level Waste Cooling / Storage Utilization Ru, Rh, Pd, Tc, etc. Vitrified Waste Zr, Ag, Eu, Sm, etc. Condensed waste with no actinides, no stable FP (and less LLFP). Reduction Repository The major elements of the ORIENT-cycle requiring further development are separation technology and the feasibility of multi-recycling. Further R&D efforts, in particular for reducing newly produced secondary waste, are necessary. Conceptual separation processes are studied for both aqueous process and pyroprocess for reprocessing oxide fuel and metallic fuel, respectively. An example of conceptual flow sheet for the aqueous process of the ORIENT-cycle is presented in Figure
 Studies of multi-recycling have concluded that it is feasible in fast reactors if stable FPs, highly radioactive FPs and FPs that")
80 Figure 4.4. Conceptual separation flow sheet of ORIENT-cycle (aqueous process) Studies of multi-recycling have concluded that it is feasible in fast reactors if stable FPs, highly radioactive FPs and FPs that have significant impacts on the core reactivity, are be removed before recycling. Reduction of vitrified waste is the major concern of the ORIENT-Cycle. In the case of aqueous separation process, the vitrified waste generated per unit of energy produced will be reduced to about one tenth of the amount resulting from the conventional Pu recycling fuel cycle (see Figure 4.5). This reduction is mainly due to the removal of heat generating FPs, such as Sr and Cs, stable FPs, and Mo, which causes a soluble phase that deteriorates the chemical durability of the glass. Figure 4.5. Mass reduction of vitrified HLW [14] 6SHQW)XHO 83X 0$ )3 *:GW /:5&\FOH +/: NJW+0 &RQYHQWLRQDO 9LWULILHG:DVWH *ODVV )3 6DOW 0$&3 *ODVV J*:K 6SHQW)XHO 83X 0$ )3 6WDEOH 6U&V 0R )3$FWLYH *:GW 25,(17&\FOH 0R 6U&V //: +/: NJW+0 +LJK:DVWH ORDGDEOH*ODVV )3 *ODVV 6DOW &3 *ODVV J*:K $ERXW 78
81 The ORIENT-cycle is still in the conceptual phase. Further R&D efforts on separation processes, the design and fabrication of recycled materials, irradiation performance, and the waste matrices will be necessary to realise the concept. 4.5 Conclusions Following the structure of this chapter, the principal conclusions are: In the case of repository in granite, the separation and temporary storage of Cs and Sr can reduce the number of vitrified HLW canisters by 25-40%. The interim storage varies from 12 to 32 years depending on the waste loading. The additional cost of Cs/Sr separation and Cs/Sr interim storage results in a 5 to 10% increase in total cost including separation, interim storage and geological disposal. According to the evaluated results for the case of Yucca Mountain, the dominant contributors to the thermal load of the emplaced waste are Pu, Am, Cs, and Sr. Removal of Pu and Am increases the drift loading of the repository by a factor of 4.3 to 5.4. Removing and sequestering Cs and Sr in a separate area of the repository or another facility, would allow a further substantial increase in the drift loading of the repository, up to a factor of 42.7 as compared with the direct disposal case for 99.9% removal of Pu, Am, Cs, and Sr. The number of HLW canisters could be further reduced by optimising the management of all the fission products. For example ORIENT-cycle offers a possibility of tenfold reduction of the number of HLW canisters as compared with the ordinary Pu recycling fuel cycle, when separating the heat generating and stable fission products, and Mo. References [1] Fujii, K., Koma, Y., Sato, K. (2003), Effects of Separation of Minor Actinides, Caesium, and Strontium on High-Level Radioactive Waste, The RRTD 2 nd International Workshop on Nuclear Cycle, pp [2] Koma, Y., Sato, K. (2003), Possible Routes for Recovery of Some Fission Products from PUREX Process, The RRTD 2 nd International Workshop on Nuclear Cycle, pp [3] Babain, V.V., Shadrin, A.Y. (1999), New Extraction Technologies for Management of Radioactive Waste, Chem. Sep. Tech. Relat. Methods Nucl. Waste Manag., [4] Schram, R.P.C. et al. (2001), Irradiation Experiment of Metal Iodide Targets for Iodine Transmutation Studies, Proc. of GLOBAL2001, Paris, France, Sept. [5] Koning, R.J.M. et al. (1997), Transmutation of Technetium and Iodine-Irradiation Tests in the Frame of the EFTTRA Cooperation, Nucl. Technol. 117(1997)293. [6] Conti, A. et al. (1999), Long-Lived Fission Product Transmutation Studies, Proc. of GLOBAL 99, Wyoming, US, Sept. [7] Minato, K. et al. (2001), Fundamental Properties of Targets for Transmutation of Technetium- 99 and Iodine-129, Proc. of GLOBAL2001, Paris, France, Sept. 79
82 [8] Shirasu, Y. et al. (2003), Selection of Chemical Forms of Iodine for Transmutation of 129 I, Journal of Nucl. Mater., 25-30, 320. [9] Sato, K. et al. (2004), Feasibility Study on Commercialization of Fast Breeder Reactor Cycle Systems Interim Report of Phase II Technical Study report for Nuclear Fuel Cycle Systems, JNC TN , [in Japanese]. [10] Kawamura, K., Ohuchi, J. (1995), Characterization of Highly waste Loaded Glass for HLW, Mat. Res. Soc. Symp. Proc., vol. 353, p. 87. [11] Wigeland, R.A. et al. (2004), Spent Nuclear Fuel Separations and Transmutation Criteria for Benefit to a Geologic Repository, Waste Management 04, February, Tucson, AZ, US. [12] Takaki, N. et al. (2003), ORIENT-CYCLE An Evolutional Recycle Concept with Fast Reactor for Minimising High-level Waste, in Actinide and Fission Product Partitioning and transmutation, Proceedings of the 7 th Information Exchange Meeting, October 2002, Jeju, Republic of Korea. [13] Funasaka, H. et al. (2003), Present Status and Prospects in the FR fuel Cycles System in JAPAN, ICONE-11, Tokyo, Japan. [14] Nagaoki, Y. et al. (2004), Technical Approach of the Reasonable Nuclear Energy System for a New Era, 2004 ANS winter Meeting, Washington DC, US. 80
83 5. WASTE MANAGEMENT AND DISPOSAL 5.1 Introduction The different waste types described in Chapter 3 will require long-term management in a final repository. Different types of repositories are considered for the disposal of low- and intermediatelevel waste and of high-level waste. This chapter focuses mainly on the disposal of high-level radioactive waste 1 because advanced fuel cycles are expected to have a considerable impact in this regard and the radionuclide inventory of high-level waste can be relatively well estimated from the results of neutronic calculations. The information collected within this Study on the characteristics and amounts of low- and intermediate-level waste which will arise from the advanced fuel cycles was not very precise or reliable. As shown in Chapter 3, no major variations are expected on LILW volumes, and since activities and heat loads will remain at low levels, no sizeable impact is expected to result from these waste streams that might modify repository concepts. However, the impact of low- and intermediatelevel waste will need to be assessed in future studies when information on these waste categories will improve. For example, if novel materials were proposed, their impact on geological repository safety would have to be evaluated early in the decision-making process when reactor designs were being developed and considered. The rigorous assessment processes developed by countries for assessing suitability of radioactive waste would need to be followed once the materials to be used in advanced fuel cycle schemes will be known. 5.2 Disposal of LILW Disposal of short-lived LILW Short-lived LILW can be disposed in a near-surface facility or in a mined repository at a depth of typically a few tens of metres (or in a deep geological repository in case of co-disposal with high-level and/or long-lived waste). Disposal facilities for short-lived LILW constructed near the surface or at moderate depth are in operation in various countries, e.g. in France, Spain, Sweden, Finland, United Kingdom, United States, and Japan. Waste acceptance criteria have been drawn up for these facilities. For the LLW and ILW that are identified in the fuel cycle schemes it can be verified whether they can be considered as LILW-SL and hypothetically could be accepted at the existing disposal facilities or their future equivalents Disposal of long-lived LILW Long-lived LILW has to be disposed of in a deep geological repository. Just two such facilities have been developed and were/are in operation: Morsleben (Germany, ceased accepting waste in 1. For the purposes of this chapter high-level waste includes spent nuclear fuel. 81
84 September 1998) and WIPP (United States). A third facility (Konrad, Germany) has been licensed but is not yet operational. Waste acceptance criteria have been drawn up for these facilities. For the LLW and ILW that are identified in the fuel cycle schemes and that do not satisfy the waste acceptance criteria for short-lived LILW, it can be verified whether they can be considered as long-lived LILW that could hypothetically be accepted at the existing disposal facilities, or their future equivalents. 5.3 Geological disposal of HLW Objective Long-lived radioactive waste, such as spent nuclear fuel (if declared as waste) and high-level waste from fuel reprocessing must be contained and isolated from humans and the environment for many thousands of years [1]. Isolation means keeping the waste away from the biosphere by means which do not rely on active measures in the future and making deliberate human intrusion to the waste difficult without special technical capabilities. The avoidance of locations that may attract inadvertent human intrusion is typically a factor in repository siting. Since complete containment cannot be guaranteed for the whole period during which waste represents a potential hazard, any eventual releases from the repository system should present an acceptable risk. The long-term safety of the repository is provided by the protective functions of the geological environment and the engineered barriers placed around the waste, as well as by the stability of the waste form. The disposal of longlived waste in deep and stable geological formations is a generally accepted option for the long-term management of radioactive waste Considered host formations At present various types of geological formations are considered as possible host formations for deep disposal of long-lived radioactive waste. The main types considered are: x x x x hard rock formations, mainly granite; this option is currently studied by countries such as Canada, Finland, Japan, Spain, Sweden and Switzerland; argillaceous formations including plastic clays, over indurated clays and mudstones; this option is currently studied in counties such as Belgium, France, Japan, the Netherlands, Spain, Switzerland and more recently Germany; salt formations: salt layers as well as salt domes are being considered; disposal in salt domes is studied in Germany and the Netherlands; volcanic formations including tuff and basalt; the present United States programme for highlevel radioactive waste disposal focuses on a welded tuff formation at Yucca Mountain Functioning of a geological repository Repositories are typically sited in stable geological environments that offer favourable conditions in which the waste and engineered barriers are protected over a long time period [1]. This means that key characteristics that provide safety, such as mechanical stability, low groundwater flux and favourable geochemical conditions, should be unlikely to change significantly over relevant timescales. 82
85 Robustness of the repository system is favoured by the multi-barrier concept. The barriers should be complementary, with diverse physical and chemical components and processes contributing to safety, so that uncertainties in the performance of one or more components or processes can be compensated for by the performance of the others. The safety functions of a repository system can be described in relatively simple terms. Different sets of safety functions have been developed within the main national safety cases and a number of international projects. For example, the safety functions that were identified for water bearing formations in the SPIN project [2] of the European Commission are: x x x x physical containment: a watertight barrier is isolating the radioactive waste from groundwater during the first phase after repository closure; as long as this safety function is effective, no release of radionuclides can occur from the waste form; physical containment makes the disposal system more robust and easier to analyse by preventing dispersion of radionuclides during the strongly transient initial phase of the repository history (resaturation processes, heat release, strong radiation, pressure rebuilding, etc.); slow release: after container failure, when groundwater comes in contact with the conditioned waste, leaching of radionuclides from the waste matrix starts in combination with the degradation of the waste matrix; various physico-chemical processes, such as corrosion of and lixiviation from the waste matrix, precipitation, sorption or co-precipitation strongly limit the radionuclide releases into the surrounding layers; retardation: the radionuclides dissolved in the groundwater that is in contact with the waste will start to migrate through the bentonite buffer and the host formation; because of the very low groundwater fluxes in potential host formations, this transport will be very slow; furthermore, many radionuclides will be sorbed onto minerals of the buffer and the host formation; retardation delays the releases and drastically limits the amounts of radionuclides that are released into the biosphere per unit of time; dispersion and dilution: once the long-lived radionuclides leave the repository s barrier system, they are released into the overlying or surrounding aquifers and eventually into the accessible environment; the dispersion and dilution processes in the aquifers and surface waters will further reduce the radionuclide concentrations in the waters that are directly accessible by man Repository designs In the case of geological disposal of long-lived radioactive waste, the geological barrier is complemented with a number of engineered barriers which depend on the characteristics of the host formation and of the disposed waste type. For a given repository site, disposal concepts are designed by taking into account waste characteristics such as radionuclide content, heat generation, criticality, radiation field, leaching rate, gas generation, etc. Two main types of disposal configurations are considered for high-level waste: x disposal in galleries, where the waste is placed along the axis of a gallery; x disposal in boreholes, where the waste is placed in horizontal or vertical boreholes that are drilled from a gallery. A distinction has to be made between repositories located in water bearing formations on the one hand, and repositories located in salt or unsaturated formations on the other hand. 83
86 Repository designs developed for water bearing formations, i.e. hard rock and argillaceous formations, typically consist of the following engineered barriers: x x x x a metallic container, often called canister or overpack, that has to remain intact during the initial gradient phase of the repository; a buffer surrounding the container, which consists in many designs of a swelling clay material, such as bentonite; the buffer has to fill possible voids and fractures and prevent advective water flow around the container; a backfill is used to fill transport and access galleries; seals and plugs are used to isolate the disposal gallery or borehole from the transport and access galleries and from the part of the host formation that have been disturbed by the excavation of the gallery or borehole. For repositories located in salt or unsaturated formations several of the above mentioned engineered barriers are also used, but some may not be needed. a) Example of a repository designed for a granite formation The reference disposal concept, developed by ENRESA for a high-level waste repository in granite is based on the disposal of four spent fuel assemblies packed in carbon steel canisters in long horizontal galleries. The canisters are surrounded by high density bentonite. The disposal galleries are grouped in two symmetrically arranged disposal areas. Access is accomplished by means of transport galleries, which run perpendicular to the disposal galleries. The transport galleries start from a central area, which includes the required underground infrastructure. Transport between the surface and the central underground area is accomplished by 4 access shafts and a ramp. Figure 5.1 shows a view of the underground installations. Figure 5.1. Underground installations for a reference repository concept in granite (Spain) 84
87 The 10 cm thick canisters are expected to provide a minimum period of containment greater than years. The separation between canisters is mainly determined by thermal constraints. A separation of 2 m between canisters and of 35 m between disposal drifts is considered in order not to exceed a temperature of 100 C in the bentonite. When a disposal drift is filled, it is sealed using blocks of bentonite and structures of concrete at the entry to the drifts. Galleries, shafts and other remaining rock cavities are backfilled, after completion of waste emplacement, with a mixture of bentonite and sand or an appropriate crushed material. The bentonite content of backfilling material is 10%, increasing up to 20% at the top of the galleries. Sealing plugs of galleries and shafts are made of compacted bentonite blocks piled over the whole cross section. b) Example of a repository designed for an argillaceous formation The repository configuration that has been developed by the Belgian radioactive waste management agency ONDRAF/NIRAS in the SAFIR 2 study for disposal of high-level radioactive waste in the Boom Clay formation in Belgium is similar to the configuration shown in Figure 5.2. Figure 5.2. Scheme of the near field of a repository in clay (Belgium) %RRP&OD\ &RQFUHWHOLQLQJ )R&DEHQWRQLWHEDFNILOO 'LVSRVDOWXEH )RXUDVVHPEOLHV FRQWDLQHU P P P P P ;6L The repository is assumed to be constructed in the middle of the host formation. A central access facility consists of 2 or more vertical shafts connected by the main gallery, from which transport galleries start to the various disposal areas. The disposal galleries are perpendicular to the transport galleries. A scheme of a disposal gallery is shown in Figure 5.2. The spent fuel assemblies or vitrified high-level waste canisters are packed in stainless steel containers, which are placed in a disposal tube. The disposal tube is surrounded by a 60 to 80 centimetres thick bentonite-based buffer. The disposal galleries require the use of a concrete lining because of the high plasticity of the host clay formation. 85
88 c) Example of a repository designed for a salt formation The disposal facility considered by GRS is assumed to be located in a salt dome at a depth of 870 m. The thickness of the overburden is about 300 m. The waste is disposed of in horizontal drifts in a single story (single layer) arrangement. The disposal facility consists of a central field, two flank drifts and five cross connections, with 100 disposal drifts (Figure 5.3). One cross connection and the adjacent 20 disposal drifts and the two segments of the flank drifts form one section. Access to the facility is provided by two shafts. The volumes and dimensions of the near field assemblies such as flank drifts, disposal drifts, shafts and central field can be found in [14]. Figure 5.3. Sketch of a disposal facility in salt (Germany) Disposal Field Flank Drift Shaft 1 Disposal Drifts Cross connection Central Field Shaft 2 Dam Flank Drift Sealing Section 1 Section 2 Section 3 Section 4 Section 5 d) Example of a repository designed for a volcanic formation The repository concept developed for a repository at the Yucca Mountain site in the United States is located in unsaturated, fractured volcanic tuff. As shown in Figure 5.4, the repository consists of access ramps from the surface and an array of emplacement drifts about 5 metres in diameter, about 2 km long and separated by about 80 metres. The emplacement area covers several km 2 and is located several hundred metres below the surface and several hundred metres above the water table. Both intact spent fuel and vitrified high-level waste would be emplaced in horizontal waste packages set on an engineered invert in the drifts. The waste packages are double shell, with a layer of corrosion resistant nickel-based alloy over a thick structural layer of stainless steel. 86
 The density of waste emplacement is constrained to meet thermal design objectives for maximum temperature at the drift")
89 Figure 5.4. Conceptual design of a disposal facility in unsaturated tuff (United States) The density of waste emplacement is constrained to meet thermal design objectives for maximum temperature at the drift wall and at the centre-point between drifts. The engineered system is designed to work with the natural host environment to limit and delay water contact with the waste and subsequent radionuclide release and transport to the accessible environment. 5.4 Evaluations of the impact of advanced fuel cycles on geological disposal of HLW In a preceding NEA report [3], the impact of advanced fuel cycles on geological disposal was estimated by making extrapolations of the results from existing performance assessments. In the present study, specific evaluations were carried out to allow for a more accurate impact assessment. Modifications of the existing repository concepts for HLW disposal needed to accommodate the HLW types arising from advanced fuel cycles were evaluated and the performance of these concepts for the new waste types were assessed as well the resulting radiological consequences Fuel cycles selected for detailed analyses In Chapter 2, one reference and twelve advanced fuel cycle schemes have been defined. A smaller number of representative schemes were selected for quantitative evaluations. The schemes selected for the quantitative evaluations are: x the reference Scheme 1a (PWR, open cycle, UO 2 fuel); x Scheme 1b (PWR, PUREX reprocessing, single recycling of Pu as MOX) representative of current technology; x one partially-closed fuel cycle, Scheme 2a (PWR, PUREX reprocessing, multi-recycling of Pu as MOX); and x one fully-closed fuel cycle, Scheme 3cV1 (GFR, pyroreprocessing, carbide fuel). 87
90 The characteristics of the HLW types that have been considered for the analyses are given in Appendix G. For the estimation of those characteristics it was necessary to make a number of assumptions that are listed below. x It is assumed that 0.1% of the 129 I in the spent fuel is present in the vitrified HLW. x x x For most of the analyses it is assumed that HLW is disposed after a cooling period of 50 years after discharge from the reactor but in one case (Scheme 1b) it is possible to dispose one of the HLW types (MOX spent fuel) after more than 50 years because temperature limitations could not be respected. For the advanced fuel cycles using pyroreprocessing, the exact conditioning method of the HLW is not yet defined. It is assumed that the matrices used have a stability in disposal conditions comparable to the glass matrix that is used at present to condition the vitrified HLW arising from the PUREX reprocessing of uranium oxide fuels. For all conditioned HLW types a matrix lifetime of years ( years for Japanese calculations) was assumed. For the spent fuels a matrix lifetime of years was assumed. For Scheme 3cV1 it is assumed that the noble metal fission products are conditioned together with other metallic waste such as cladding and end-pieces. Although this waste is not HLW, because its heat production is negligible, it is considered in the analyses to include all the fission products. The degradation of the metallic waste matrix is neglected because noble metals have a low solubility. To illustrate the potential impact of advanced fission product management techniques discussed in Chapter 4, a sub-variant of Scheme 3cV1, which assumes that Cs and Sr are separated from the HLW, is also considered. For this specific scheme the following assumptions are made: x 99% of the Cs and Sr are separated from the liquid HLW; x the remaining HLW is vitrified and disposed of in a geological repository after 50 years; x x Sr can be disposed of in a repository for short lived waste after a sufficiently long cooling period; Cs is vitrified after an additional cooling period and disposed of in a geological repository after a total cooling period of 100 years Repositories considered in the analyses Five organisations participating in the study volunteered to make numerical analyses of the impact of advanced fuel cycles on HLW disposal. ENRESA made calculations for a hypothetical repository located in a granitic formation. JNC made calculations for a hypothetical repository located in a hard rock formation. SCK CEN made calculations for a hypothetical repository located in a clay layer. GRS made calculations for a hypothetical repository located in a salt dome. ANL performed analyses of the selected fuel cycle impacts on thermal design limits and long-term performance for a conceptual repository located in fractured unsaturated volcanic tuff Impact on repository design As already mentioned in Section 5.3.4, repository concepts are designed by taking into account waste characteristics such as radionuclide content, heat generation, criticality, radiation fields QHXWURQVOHDFKLQJUDWHJDVJHQHUDWLRQHWFThe results given in Chapter 2 (Tables 2.2 and 2.6) 88
91 show that the fissile material content of the vitrified HLW arising from reprocessing is much lower than that of spent fuel. Also the activity of and emitted neutrons are lower in the case of HLW from reprocessing than for spent fuel. In both cases, disposal of spent fuel or of vitrified HLW, gas generation in the repository will be due mainly to corrosion of the metallic containers. Consequently, it is not expected that the disposal of vitrified HLW arising from the reprocessing of spent fuel from advanced fuel cycles will require considerable adaptations of the disposal concepts. In some fuel cycle schemes considered in this study but that were not selected for detailed analyses, irradiated targets are considered as waste. If these targets are not reprocessed, they can be possibly problematic waste forms. For example, the Am targets arising from Scheme 2c generates 17 times more heat and emits times more neutrons per kg than the spent fuel from Scheme 1a. The disposal of such very high-level waste forms will require the development of new repository concepts and of an adapted engineered barrier system. It should also be noted that most spent fuels from fast reactors are significantly hotter than spent fuel from Scheme 1a and therefore, if they would not be reprocessed; their disposal would require considerable adaptations of the repository concept and of the engineered barrier system or a very long interim storage. Temperature limits that have to be respected for a number of the repository components are limiting factors for the allowable disposal density of HLW in a geological repository. In the following sections the maximum allowable disposal density will be estimated for the selected fuel cycle schemes based on temperature limits. a) Results of thermal calculations for a repository in granite ENRESA carried out thermal calculations for a hypothetical repository in granite. The calculated temperatures of the buffer in contact with the container are shown in Figure 5.5. It appears that the MOX spent fuel considered for this study, with a burn-up of 60 GWd/tHM, cannot be disposed in this repository concept after a cooling time of 50 years. Calculations were performed also on the temperatures after 75 and 100 years of cooling period. If the MOX spent fuel should be disposed after 50 years, the repository concept would have to be modified, e.g. by enlarging the diameter and/or the length of the container. Figure 5.5. Calculated maximum temperatures in the bentonite buffer as a function of the distance between 2 high-level waste containers (ENRESA calculations for a repository in granite) Maximum temperature in bentonite (ºC) Scenario 1a UOX Scenario 1b MOX Scenario 1b MOX (cooling time: 75 years) Scenario 1b MOX (cooling time: 100 years) Scenario 1b Glass Scenario 2a Glass Scenario 3c var 1 Glass Maximum temperature in bentonite Distance between canister (m) 89
92 The calculated lengths of the disposal galleries are given in Table 5.1. It may be noted that the reduction of the ratio of the required length of disposal galleries for Schemes 2a and 3cV1 as compared with Scheme 1a, respectively and 0.238, is somewhat higher than the ratio of the thermal outputs of the corresponding high-level waste, respectively and Scheme Cooling times (years) Table 5.1. Required excavation length for different schemes (ENRESA calculations for a repository in granite) Container load Waste production (cont./twhe) Container length (m) Space between containers (m) Excavation (m/twhe) Total excavation (m/twhe) 1a 50 3 UOX b Ratio 1 MOX t.l.e. 1 t.l.e. 1 > Glass > MOX Glass a 50 1 Glass cV Glass Temperature limit exceeded. 2. Values obtained considering only the HLW glasses. b) Results of thermal calculations for a repository in clay Depending on the host formation the repository site and the design, various temperature limits have to be respected. Examples of temperature limitations are: x x x Maximum temperature of the buffer at its interface with the container (canister) wall, which has to remain in many repository designs below 100 C. Maximum temperature of the host formation. Maximum temperature in the aquifers overlying the repository. For several repository designs the most stringent thermal limitation is the maximum temperature of the buffer where it is in contact with the container. In this case detailed thermal calculations can be satisfactorily estimated by using a linear thermal output limit. Examples of candidate repository sites, for which a linear thermal limit was applied, are: x The Boom Clay repository design: 300 W/m [5]. x The Opalinus Clay repository design: 200 W/m [6]. x The Yucca Mountain repository design (although it is not in clay), for which a maximum linear thermal output of 900 W/m was applied [4]. An overview of the HLW types arising from the 5 fuel cycle schemes analysed, the corresponding thermal outputs, and the estimated length of disposal galleries in case of disposal in Boom Clay is given in Table
93 Table 5.2. High-level waste types arising, thermal outputs and needed length of disposal galleries for a maximum linear thermal loading of 300 W/m (SCK CEN calculation for a repository in clay) 91 Fuel cycle scheme 1a 1b 2a 3cV1 3cV1 (separation of Cs, Sr) SF assemblies (#/TWhe) n.a. n.a. n.a. HLW canisters (#/TWhe) n.a NM canisters (#/TWhe) n.a. n.a. n.a Cs-waste canisters (#/TWhe) n.a. n.a. n.a. n.a Thermal output HLW after 50 years (W/TWhe) Thermal output Cs-waste after 100 years (W/TWhe) Length of disposal galleries (m/twhe) Length of disposal galleries relative to 1a n.a. n.a. n.a. n.a Table 5.2 shows that single or multiple recycling of Pu does not significantly reduce the thermal output of the high-level waste. On the other hand a fully-closed cycle such as Scheme 3cV1 leads to a reduction of the required length of disposal galleries by 3.5 as compared with Scheme 1a. Separation of Cs and Sr results in a drastic reduction of the thermal output and consequently the required length of disposal galleries is reduced by a factor 10 as compared with Scheme 1a. An optimisation of the waste packages might allow a further reduction of the required length of disposal galleries. c) Results of thermal loading calculations for a repository in tuff Thermal design goals restrict repository utilisation by limiting the loading density of the waste streams. In Yucca Mountain s nominal, high-temperature operating mode (HTOM), there are two thermal design limits that affect potential repository capacity: x x The host rock must remain below 200 C everywhere in the repository to limit mineral alteration. Meeting this limit at the drift wall results in limits on the linear thermal loading density along a drift, driven primarily by early-time fission product decay heat. The temperature midway between storage drifts must remain below the boiling temperature of 96 C at all times to permit drainage of water through the fracture network between drifts. This results in limits on areal thermal loading density primarily driven by long-term actinide decay heat. Drifts in Yucca Mountain are assumed separated by 81 m. The decay heat from waste stream was calculated for each scheme, in W/TWhe, for up to years using the ASIDE code for isotopic decay [7]. The maximum allowed loading density for each scheme was calculated using the AFCI Repository Thermal Model [8]. Results of these calculations are shown in Table 5.3, where calculated utilisation limits are expressed as linear and areal densities of waste arising from the generation of the indicated TWhe of electricity. Relative to Scheme 1a, all recycle schemes raise utilisation limits and the most prominent increase is associated with the Scheme 3cV1. For Schemes 1a, 1b, and 2a, the long-term a real limit driven by actinides determines the results. For the complete actinide recycle, Scheme 3cV1, the actinide decay heat drops dramatically. The results shown assume extended cooling or other thermal management of the shortterm fission products to achieve the utilisation limits shown. In addition, since the models used
94 represent realistically only the central region of a very large repository, the absolute loading limits shown in Table 5.3 are likely to be conservatively low. Table 5.3. Calculated utilisation limits in an unsaturated tuff repository Scheme 1a 1b 2a 3cV1 Linear (TWhe/m) Areal (TWhe/m 2 ) 6.42E E E E-01 Linear relative to Scheme 1a d) Results of thermal calculations for a repository in salt In the German concept, the maximum temperature for a repository in salt is expected to be limited by future regulations to 200 C at the contact surface between a disposal cask and the rock salt. Within the estimation of the temperature field a bulk temperature was calculated. The maximum bulk temperature has been fixed at 180 C. Starting from this maximum bulk temperature the upper boundary of the heat load for the disposal drifts has been determined. The maximum heat load for a short disposal drift (length m) has been estimated to be in the range of 130 to 135 kw while the maximum heat load for a long disposal drift (length m) has to be in the range of 140 to 145 kw. Figure 5.6 shows the evolution of the temperature (in Kelvin) at a central point of the disposal field for waste from Schemes 1a and 3cV1. The temperature for disposal of spent fuel from Sheme 1a reaches its maximum of 450K (177 C) at 129 years and is decreasing to 340K after years. The temperature for disposal of high-level waste from Scheme 3cV1 reaches its maximum of 400K (127 C) at 64 years and is decreasing rapidly to 340K after 593 years. The ambient temperature of the host rock is assumed to be 303K (30 C). The fast decrease of the temperature of Scheme 3cV1 waste is due to the fact that the heat load of this waste is decreasing drastically. Fifty years after unloading from the reactor the heat load is 518 W per TWhe and after 400 years it is 1.7 W per TWhe. Figure 5.6. Evolution of temperature relevant for salt creep calculation 4,60E+02 4,40E+02 4,20E+02 Temperature (K) 4,00E+02 Fuel Cycle 1a Fuel Cycle 3cVar1 3,80E+02 3,60E+02 3,40E+02 3,20E+02 3,00E+02 0,00E+00 5,00E+02 1,00E+03 1,50E+03 2,00E+03 2,50E+03 3,00E+03 3,50E+03 4,00E+03 4,50E+03 5,00E+03 Time (years) 92
95 The two completely different shapes of the temperature curves have a significant influence on the behaviour of the disposal facility in salt. For Scheme 1a the salt creep will be drastically increased due to increasing temperature and will stay for a very long time at a relatively high level. For Scheme 3cV1 the salt creep will also increase but not to such a high extent. After a relatively short time of increased salt creep, the creep will decrease and remain for a long time at the level of unaffected salt. This is important because the salt creep will result in a convergence of the repository vaults and thus contribute to the containment of the waste. Because of similar heat load characteristics the shapes of the temperature curves of Schemes 1b and 2a are somehow similar to the temperature curve of Scheme 1a. Therefore, the four estimates to be carried out may be grouped into two categories: three analyses of disposal hot waste (Schemes 1a, 1b and 2a) and one analysis of disposal of cold waste (Scheme 3cV1). e) Impact of extending the cooling time In the analyses presented above it was generally assumed that the high-level waste is disposed of after 50 years of cooling. Increasing the cooling time might allow for a considerable reduction in the size of the repository in the case of advanced fuel cycles because the thermal output of their high-level waste is decreasing much faster than it is the case for the spent fuel in Scheme 1a. An overview of the thermal outputs of the schemes considered s given in Table 5.3. Table 5.4. Thermal outputs from HLW after 50 and 200 years of cooling Fuel cycle scenario Unit 1a 1b 2a 3cV1 A. Thermal output HLW (50 y) W/TWhe B. Thermal output HLW (200 y) W/TWhe B/A A/A for Scheme 1a B/A for Scheme 1a Table 5.4 shows that if the cooling time is extended from 50 to 200 years, the thermal output of the spent fuel is reduced by a factor 3.6 while for Scheme 3cV1 the thermal output of the HLW is reduced by a factor 30. The standardised thermal outputs after 50 and 200 years cooling time (standardised by dividing by the thermal output of the reference fuel cycle 1a after 50 years cooling time) show that in the case of advanced fuel cycles the needed size of the repository can be drastically reduced. However in this case the linear relationship between the thermal output and the repository size can no longer be applied. If longer cooling times are considered, it is necessary also to reconsider the cooling time before conditioning (e.g. vitrification) of the waste. Moreover, such long cooling times might be seen as contrary to the precautionary principle due to the delay before the waste will become passively safe. 93
96 5.4.4 Assessment of long-term consequences a) Objective and limitations of the calculations, and uncertainty The main objective of the calculations carried out in this study is to evaluate the impact of advanced fuel cycles on the long-term consequences of the disposition of HLW in the geological repository concepts that have been developed in recent years. Results obtained for different repositories cannot be compared with each other in particular because of the uncertainties prevailing in the assessments. In performance assessments a distinction is often made between scenario uncertainty, uncertainty in conceptual models and uncertainty in parameters. Some of the calculations presented are carried out for generic repository locations, others are site specific and the level of characterisation of the repository systems considered can be very different. No attempt was made to harmonise the treatment of uncertainty in the reported assessments. In a safety case stochastic calculations are often performed to take account of the uncertainty in parameter values. However, as most indicators considered in the present study are relative to the value obtained for the reference fuel cycle scheme, deterministic calculations have been carried out for the impact assessments, with the exception of the repository in tuff. b) Considered repository evolution scenarios The calculations that are presented in the following sections were done for the expected evolution of the repository system, except in the case of the repository in salt. For the salt repository, as long as the salt dome remains intact, it is assumed that no groundwater will come in contact with the disposed waste and consequently no radionuclide would be released from the disposal system. Therefore, the consequences of the occurrence of one of the least unlikely events that can result in an intrusion of groundwater into the repository a brine intrusion have been chosen as basis for the analysis and an alternative less likely evolution has been studied instead of the expected one. Human intrusion scenarios, which assume that a future human action short circuits several barriers of the repository system due to reduction of the radiotoxic inventory, have not been analysed in this study. Advanced fuel cycles might reduce significantly the long-term consequences from such scenarios. c) Indicators The main safety indicator, which has been used for many years in safety assessments of radioactive waste disposal systems, is the annual effective dose (or dose rate) to an average member of the critical group affected by the repository [9]. To evaluate the safety of a repository the maximum dose rate can be compared with a dose constraint determined by the radiological protection authorities. The ICRP recommends an upper value for the dose constraint of 0.3 msv/year in normal exposure situations. However, the evaluation of the safety of a repository cannot be reduced to a simple comparison of the calculated dose with the dose (or risk) constraint; the time and duration of exposure are to be taken into consideration also. For exposure situations with a probability of occurrence lower than one, the annual risk defined as the product of the dose rate by the probability of occurrence of that situation can be used instead of dose rate. 94

97 During the time scales that have to be considered in the safety assessments of HWL repositories, various components of the repository system are expected to undergo significant changes. Figure 5.7 illustrates the limits of predictability of various components of a geological repository system [10]. It indicates that radiological exposure modes and surface environmental processes are expected to change considerably after a few decades or centuries, respectively, and that the hydrogeological system is expected to change significantly after a few thousands of years. These limits of predictability raise problems for calculating long-term doses. This has led to the development of complementary safety indicators that are independent of the biosphere and the hydrogeology [2,11]. One of these indicators is the radiotoxicity flux released from the host formation or into the biosphere and another is the integrated radiotoxicity flux over time which takes into account the duration of the radionuclide releases. Figure 5.7. Schematic illustration of the predictability of various components of a geological repository system over time [10] The results of the assessments are presented in details in Appendices H to K. A set of normalised (per produced TWhe) indicators has been calculated to illustrate various aspects of the long term consequences: x radionuclide fluxes released from the host formation; x radiotoxicity flux, together with its main contributors, released from the host formation; x x integrated radiotoxicity flux, together with its main contributors, released from the host formation; and dose. For the disposal facility in the salt rock host formation only the dose (not normalised to the produced energy) is presented. The following sections focus on the calculated doses. 95
98 d) Results of calculations for a repository in granite The evaluations are based on the computer codes and parameter values that have been used for the assessment study of the ENRESA reference disposal concept. Figure 5.8 shows the doses per radionuclide for Scheme 1a. 129 I controls the peak doses and the contribution of 135 Cs becomes significant after 1 million years. Doses due to actinides and their daughter products become significant only after several million years because these radionuclides are strongly sorbed in the bentonite barrier and the geo-sphere. Figure 5.8. Dose per radionuclide in Scheme 1a 1.E E -09 I 129 Actinides & daughter 1.E -10 Dose (Sv/yr per T Wh-e) 1.E E E E -14 S CE NAR IO 1A - UOX Se 79 S n 126 Cs E E -16 Pd 107 Tc 99 1.E E E E E E +07 Time(years) The doses per radionuclide due to the MOX fuel in Scheme 1b are similar to those in Scheme 1a. The difference in peak dose is just a factor of 2. Although the inventory of fission products per TWhe in the MOX fuel is roughly one order of magnitude smaller than in the UOX, the matrix alteration rate of MOX fuel calculated with the ENRESA model [12] is 5 times greater than for UOX fuel(due to greater alpha activity. Figure 5.9 shows the doses per radionuclide in Scheme 1b due to the vitrified waste only, not including doses due to MOX spent fuel. Since the inventory of 129 I is only 0.1% of the inventory in Scheme 1a, doses due to 129 I are much smaller than in that scheme. Doses due to the remaining fission products are greater than in Scheme 1a because in the calculations the glass is assumed to dissolve completely in years while the UO 2 (and even the MOX) matrices last much longer. The doses per radionuclide for fuel cycles 2a and 3cV1 are similar to those shown in Figure 5.9 for the vitrified HLW of fuel cycle 1b. This is logical, because the glass matrix alteration model is the same in the 3 cases (1b-vitrified waste, 2a and 3cV1) and there are only small differences in the inventory of fission products (a factor of 2 at most). 96
99 Figure 5.9. Dose per radionuclide due to vitrified waste in Scheme 1b 1.E E E -10 S CE NAR IO 1B - Vitrified Waste Actinides & daughter Dose (Sv/yr per T Wh-e) 1.E E E E -14 Se 79 S n 126 Cs E -15 Pd 107 I E -16 Tc 99 1.E E E E E E +07 Time(years) (years) Figure 5.10 shows the total doses in the 4 schemes analysed. The curve for Scheme 1b is the superposition of two curves: one for the MOX fuel that controls the doses up to years, and another for the vitrified waste which is dominant after 1 million years. Figure Normalised total doses for the different schemes 1.E E -09 1A Dose (Sv/yr per T Wh-e) 1.E E E E -13 1B 1B - MOX controlled 3C-var1 2A 1B -GL AS S controlled 1.E E E E E E E +07 Time(years) The dose curves for Schemes 2a, 3cV1 and the vitrified waste in Scheme 1b are quite similar as shown in Figure 5.9 because in the 3 schemes the same model for the glass matrix degradation is used and the inventories of fission products are quite similar. However, the maximum dose due to HLW 97
100 from Scheme 3cV1 is about 2 times higher than the maximum dose from Scheme 2a; this is due to the higher 135 Cs production in fast reactors than in light-water reactors. The higher 135 Cs production can be explained by different fission yields of 235 U (LWR) and 239 Pu (FR) and spectrum effects ( 135 Xe decays to 135 Cs but it can also capture a neutron; in a fast spectrum 135 Xe capture is lower and thus the 135 Cs production is higher). e) Results of calculations for a repository in granite The evaluations made by JNC are based on the computer codes and parameter values that have been used for the H12 report [13]. Because the disposal of spent fuel was not considered in the H12 study, JNC did not make calculations for the reference Scheme 1a, nor for the MOX spent fuel of Scheme 1b. CASE 1 corresponds to the vitrified HLW arising from the reprocessing of the uranium oxide spent fuel from Scheme 1b (excluding spent MOX fuel); CASE 2 corresponds to the HLW that will arise from Scheme 2a if the liquid waste from reprocessing of UOX and MOX spent fuels are mixed prior to vitrification; CASE 3 and CASE 4 correspond to the HLW that will arise from the separate vitrification of, respectively, the UOX and MOX spent fuels from Scheme 2a. JNC took over a number of assumptions from the H12 study including: x A zero remaining 129 I fraction in the vitrified high-level waste (hence in these calculation there was no contribution from 129 I to the dose from HLW). x A years of over-pack lifetime. x A glass matrix lifetime of about years. Total doses calculated for the four considered cases have very similar values within a factor of 2 (see Figure 5.11). Figure Comparison of total dose 98
101 Figure 5.12 which shows the dose for each radionuclide in CASE1 (1b) is representative of the 4 cases considered. Figure Dose for each radionuclide for Scheme 1b Total Table 5.5 shows the main contributors to the total dose for the 4 cases, 79 Se, 135 Cs and 229 Th; the underlined radionuclide is the main contributor to the maximum total dose which is 135 Cs for all cases. For 135 Cs which is soluble and 93 Zr which did not reach its solubility limit the calculated doses are proportional to the inventory. For 107 Pd, 79 Se, 99 Tc, and 237 Np and 238 U the solubility limits were reached. For 229 Th, the release rate is the same as for 237 Np due to radioactive equilibrium. Table 5.5. Main contributors to the total dose Before years From to years CASE1 (1b) 1 st : 79 Se 1 st : 135 Cs -> 229 Th CASE2 (2a) 1 st : 79 Se 1 st : 135 Cs -> 229 Th CASE3 (2a UOX) 1 st : 79 Se 1 st : 135 Cs -> 229 Th CASE4 (2a MOX) 1 st : 79 Se 1 st : 135 Cs -> 229 Th The importance of 135 Cs as main contributor highlights the value of reducing the inventory of long-lived fission products in HLW rather than reducing the inventory of actinides. Finally, it is concluded that the calculated doses are not significantly different for the four types of vitrified HLW (Cases 1-4) arising from the fuel cycle schemes considered in the study. 99
102 f) Results of calculations for a repository in clay The evaluations made by SCK CEN are based on the computer codes and parameter values that have been used for the SAFIR 2 report [5]. Figure 5.13 shows the doses per radionuclide for Scheme 1a. The total dose is dominated by 129 I. Smaller contributions are due to 126 Sn, 79 Se and 99 Tc. Doses due to actinides and their daughters become significant only after several million years because these radionuclides are strongly sorbed in the clay host formation. The doses calculated for the disposal of the MOX spent fuel from Scheme 1b are comparable with those shown in Figure Figure Total dose and its main contributors calculated for Scheme 1a 1,0E-10 Dose (river pathway) (Sv/a/TWhe) 1,0E-11 1,0E-12 1,0E-13 1,0E-14 1,0E-15 Se79 Tc99 Sn126 I129 Th229 TOTAL 1,0E-16 1,0E+02 1,0E+03 1,0E+04 1,0E+05 1,0E+06 1,0E+07 Time after canister failure (years) When the spent fuels are reprocessed, which is the case for Schemes 1b, 2a and 3cV1, most of the iodine escapes as gas during the fuel dissolution phase; it was assumed that 0.1 % of the 129 I present in the spent fuel is transferred to the vitrified HLW. For the vitrified HLW (see for example Figure 5.14, which shows the doses calculated for Scheme 3cV1) the calculated total doses are mainly due to 126 Sn and 79 Se; 129 I and 99 Tc give smaller contributions. Doses due to actinides become significant only after a few million years. 100
103 Figure Total dose and its main contributors calculated for Scheme 3cV1 1,0E-10 Dose (river pathway) (Sv/a/TWhe) 1,0E-11 1,0E-12 1,0E-13 1,0E-14 1,0E-15 Se79 Tc99 Sn126 I129 Th229 TOTAL 1,0E-16 1,0E+02 1,0E+03 1,0E+04 1,0E+05 1,0E+06 1,0E+07 Time after canister failure (years) Figure Total dose calculated for Schemes 1a, 1b, 2a, 3cV1 and 3cV1 with separation of Cs/Sr Dose (river pathway) (Sv/a/TWhe) 1,0E-10 1,0E-11 1,0E-12 1,0E-13 1,0E-14 1,0E-15 1a 1b 2a 3cv1 3cv1 (no Cs/Sr) 1,0E-16 1,0E+02 1,0E+03 1,0E+04 1,0E+05 1,0E+06 1,0E+07 Time Time after after canister canister failure failure (years) (a) 101
104 Figure 5.15 shows the total doses calculated for the 5 considered fuel cycle schemes. Scheme 1a has the highest maximum calculated dose because all the generated iodine is going into the geological repository. In the case of Scheme 1b a large fraction of the iodine was released from the HLW during reprocessing of the uranium oxide spent fuel, but the disposed MOX spent fuel still contains all the generated iodine. For the three schemes for which only conditioned HLW has to be disposed of, the maximum calculated doses have a similar shape. The calculated dose for Scheme 3cV1 is somewhat lower than the one for Scheme 2a because of the better efficiency of the GFR. The lower calculated dose for Scheme 3cV1 with separation of Cs and Sr is essentially explained by the more compact repository configuration which strengthens the contribution of the solubility limits for Se, Tc, Sn and the actinides, for example. g) Results of calculations for a repository in salt The results of the performance assessment carried out by GRS for a repository in salt in the cases of Schemes 1a, 2a and 3cV1 are shown in Figures 5.16 to The calculated dose rates are extremely low. The maximum is about eight orders of magnitude below the regulatory limit recently applicable in Germany, i.e., 3 x 10⁻⁴ Sv per/year. The difference between the three curves is smaller than two orders of magnitude; the calculated dose is not normalised to energy produced. Figure Calculated dose for waste from Scheme 1a 1,00E-03 1,00E-04 Dose (Sv) 1,00E-05 1,00E-06 1,00E-07 1,00E-08 1,00E-09 1,00E-10 1,00E-11 1,00E-12 U_Ra Chain Np_Chain 135 Cs 129 I 79 Se SumDose 1,00E-13 1,00E-14 1,00E-15 1,00E+03 1,00E+04 1,00E+05 1,00E+06 Time (years) 102
105 Figure Calculated dose for waste from Scheme 2a Calculated Dose FC2a 1,00E-03 1,00E-04 Dose (Sv) 1,00E-05 1,00E-06 1,00E-07 1,00E-08 1,00E-09 1,00E-10 Np_Chain U_Ra Chain Cs135 Se79 SumDose 1,00E-11 1,00E-12 1,00E-13 1,00E-14 1,00E-15 1,00E+03 1,00E+04 1,00E+05 1,00E+06 Time (years) Figure Calculated dose for waste from Scheme 3cV1 Calculated Dose FC3c 1,00E-03 Dose (Sv) 1,00E-04 1,00E-05 1,00E-06 1,00E-07 1,00E-08 1,00E-09 1,00E-10 Th_Chain Np_Chain U_Ra_Chain Cs135 Se79 SumDose 1,00E-11 1,00E-12 1,00E-13 1,00E-14 1,00E-15 1,00E+03 1,00E+04 1,00E+05 1,00E+06 Time (years) 103
106 The assessments presented here are meant to explore whether disposal of the resulting waste is feasible and can be implemented in a safe manner. In addition, it might be desirable to identify advantages and drawbacks of the considered fuel cycles. The question arises, whether the radiological dose calculation described above might serve for such a comparison. A central point for the performance assessment in salt is that the scenario under investigation is not the normal evolution but one alternative evolution scenario. It should be kept in mind that the normal evolution scenario in salt leads inevitably to zero release. Some conditions for the alternative scenario studied here have therefore been chosen arbitrarily. One of these conditions is for example the point at which the anhydrite vein is connected to the disposal field. A change of this connection point can easily result in a difference in the calculated dose of some orders of magnitude. Parameter uncertainties have been investigated in previous studies (e.g. SPA project) [14]. The parameters with the highest impact on the result are related to the description of the salt convergence (e.g. initial convergence rate, temperature, pressure). Small uncertainties on these parameters can easily result in a difference in the calculated dose of some orders of magnitude. Considering the spread of the calculated doses due to possible uncertainties and the absence of optimisation for Scheme 3cV1 disposal facility, it can be concluded that the two orders of magnitude difference between the calculated dose curves is too small to be significant. The calculated doses can serve as indicators on whether safe disposal can be implemented for waste resulting from each scheme but cannot serve as comparative criteria. The dose curves for the performance assessment in salt show that some radionuclides which are relevant in other host rocks, such as 93 Zr, 99 Tc, 107 Pd, 126 Sn, 147 Sm, Ac-Chain and Th-Chain, do not give a significant contribution to the total dose in this case. Due to the increasing uncertainty with time, the Np-peak (after years) is not significant. The uranium-radium decay chain is dominating the calculated total dose over a very long time for the three schemes considered. The amount of 238 U in the disposal facility must be reduced below the solubility limit through P&T strategies to successfully reduce the dose. The considered efficiency of the recovery of U during reprocessing (residue of 0.1%) is not sufficient to reach this objective. Also, 79 Se, 129 I and 135 Cs are considered candidates for an effective dose reduction. Figures 5.16 to 5.18 show that 79 Se and 135 Cs dominate the dose at early times. In the dose curve of Scheme 1a the dose coming from 129 I gives a significant contribution to the total dose at early times. For Schemes 2a and 3cV1 129 I does not appear in the dose curve because iodine is separated from the high-level waste flow during the reprocessing. It has been considered to separate the heat-producing fission products Sr and Cs from the waste, to store them for about 300 years and to dispose them afterwards. However, this is not necessarily an interesting option for disposal in rock salt because the heat generation of the disposed waste guarantees a fast salt creep and void volume reduction. h) Results of calculations for a repository in tuff To evaluate the effect of Schemes 1a, 1b, 2a and 3cV1 on an unsaturated tuff repository, performance assessment calculations for radionuclide release and absorbed dose were carried out at ANL with the GOLDSIM [15] code using the simplified site recommendation model [16]. The results are presented in relative terms, normalised to the reference Scheme 1a, rather than in absolute terms because the simplified approach adopted is not designed to provide absolute values. 104
107 In the simplified model, waste streams make use of two types of waste packages with different performance characteristics. Spent fuel that is removed from the reactor and sent to the repository without processing is directly disposed in commercial spent nuclear fuel waste packages [17]. Alternatively, the waste stream from processed spent fuel is vitrified into waste forms made of highlevel waste glass before placement in co-disposal waste packages. The performance assessment calculations reported here utilised an area-loading pattern. Scheme 1a was chosen as the reference case. The simplified model of direct disposal allows for disposal of Mt of commercial spent nuclear fuel (the statutory limit) within commercial spent fuel waste packages spread over a repository footprint area of m 2, corresponding to an average area loading of 17.4 kg/m 2. Directly substituting Mt of spent fuel from Scheme 1a into this model, the total electrical energy generated ( TWhe) spread over this same footprint results in a loading density of TWhe/m 2. This value is around 34% above the conservatively-low utilisation limit calculated for Scheme 1a in Table 5.3. For the waste streams of the remaining three fuel cycle schemes, the same total electrical generation ( TWhe), repository footprint, and number of waste packages (11 770) as for the reference scheme are assumed. Also, each waste package is assumed to contain the waste from generating the same amount of electrical energy, i.e / = 2.92 TWhe. With Scheme 1b, the vitrified waste was assigned to co-disposal waste packages and the spent fuel to commercial spent fuel waste packages. For Schemes 2a and 3cV1, the vitrified waste was placed in co-disposal waste packages. In all schemes the assumed average loading density is TWhe/m 2. This average loading density is slightly above the conservative utilisation limit given in Table 5.3 for Scheme 1b and well below the density for Schemes 2a and 3cV1. Thus, the following results do not reflect any increased repository utilisation (loading density) made possible in Schemes 2a and 3cV1, as the design analysis needed for repository re-optimisation is beyond the scope of this study. Figure 5.19 shows the total dose rate for the four schemes. All the results are averages based on independent samples of the stochastic input parameters and are normalised to the peak dose rate for Scheme 1a. The curves in Figure 5.19 indicate that Schemes 1b, 2a, and 3cV1 lower the dose rate as compared to the direct disposal case, Scheme 1a. However, the greatest reduction in the dose rate occurs for Scheme 3cV1. These results are not surprising since for Scheme 1a, the fraction of the dose rate contributed by actinides and their decay products is always greater than 90% after about years. After years the dose-rate contribution from actinides is essentially 100% for Schemes 1a, 1b, and 2a, and even for Scheme 3cV1 is more than 70%. During much of the time period prior to years, the dose rate is dominated by 99 Tc and, to a lesser extent by 129 I. The peak dose rate from fission products is higher for Schemes 1b, 2a, and 3cV1 than for Scheme 1a because all or most of the fission products are in the glass waste form. In the site recommendation total system performance assessment model, the glass waste form is not as durable as directly disposed commercial spent nuclear fuel with credit taken for cladding. The fission product contribution to the dose rate is lower in Scheme 3cV1 than in Schemes 1b and 2a because of the greater thermal efficiency specified for the gas-cooled fast reactor. 105
108 Figure Normalised dose rates for Schemes 1a, 1b, 2a, and 3cV1 in an unsaturated tuff repository 1 1a 1b 0.1 2a Normalized Dose Rate, Total c variant Time, (years) i) Activity in the disposed waste The above reported analyses assume that the main components of the disposal system will function as expected. In that case the disposal system confines the disposed waste in a very efficient way and the releases of radionuclides into the environment occur after long time periods and are very small. However, it cannot be ruled out that future human actions can strongly perturb and even shortcircuit one or several barriers of the disposal system. The consequences of such intrusions would depend on the activity present in the disposed waste. Figure 5.20 shows the evolution of the activity in the waste as function of time. For fuel cycle Schemes 1a, 1b and 2a the activity decays by a factor of about 100 from 50 to years; for the fully closed fuel cycle Scenario 3cV1 the activity decays by a factor of
109 Figure Evolution of the activity in the waste as function of time activity (TBq/TWhe) a 1b 2a 3cv Time time (years) (a) Complementarities of conditioning, geological disposal and P&T in handling uncertainties Figure 5.7 introduced qualitatively the notion of a limited predictability for every component of a geological repository. Using the same graphic support, Figure 5.21 illustrates the time range of relevance for the three major courses of action in waste management: conditioning, geological disposal, partitioning and transmutation. Figure Schematic illustration of the coverage of the expected reliability of the main components of a geological repository system by different elements of the waste management policies stability of geological host formation stability of waste matrix tightness of canister storage conditioning isolation P&T of Actinides 1E+1 1E+2 1E+3 1E+4 1E+5 1E+6 1E+7 1E+8 time (a) Time (years) 107
110 Within the shortest time range tens to hundreds of years processing of spent fuel is likely to increase the risk of radiological exposure of workers. Additional measures of radiation protection (shielding, process optimisation) will keep this risk at accepted levels, inducing extra costs that are expected to be marginal. No benefit is yet brought by advanced fuel cycles, except through the possibility to isolate and store heat-producing isotopes such as 137 Cs and 90 Sr; this opens the way to optimised repository concepts and the related savings at repository construction time, i.e. within the same time frame. The stability of geological systems (the host rock) can be assessed for hundreds of thousands of years and more. This time scale is the one for migration of the most mobile elements in all candidate host rocks (except salt, where transport of radionuclides can only occur after an accidental water intrusion). The amount of migrating radionuclides is here controlled by the waste-embedding matrix that resists to water leaching, together with the selection of a stable host rock of sufficient dimensions, homogeneity, and capability to retard radionuclide migration processes. In this context, it is a consistent finding that several fission products are more mobile than the actinides. The situation is even more contrasted for rocks where reducing conditions prevail (clay, granite); the actinides are in this case strongly sorbed and solubility limited. The radionuclide release to the biosphere in normal conditions, is dominated by the most mobile FPs, such as 129 I and 79 Se. The great reliability of geological formations as retention media (the rock itself) becomes more delicate to assess on the very long time scales: millions to tens of millions of years. Despite the fact that the presence of the geological layers themselves is witness of their stability over hundreds of millions of years, predictions of their continued presence in the future do not exceed a few million years. At these time scales and beyond, very basic phenomena on very simple systems still can be relied upon. The decay of a radioisotope is one of those totally predictable physical behaviours, since it depends on one single parameter, insensitive to any change in the environment: the half-life of the radioisotope. Whenever no other information on the surrounding systems is available, the activity of the radionuclide source term is a good indication for the potential radiotoxicity of the remaining radionuclides. Transmutation is the sole physical process that can modify the source term. Severe accidental situations such as human intrusion or seismic event leading to breaches into the repository are not taken into account in this study. These very unlikely events would establish pathways for radionuclide to reach the biosphere much earlier than the evolutions described here. They would increase the importance of the physical source term, i.e. the potential radiotoxicity. Figure 5.21 illustrates in a qualitative way the decrease in reliability of components by a decrease in shade of grey; the range of action (time wise) attributed to the elements of a waste management policy appears as labelled superimposed boxes. These boxes also illustrate for any specific value of time the number of redundant barriers available to secure and immobilise the waste. It appears that P&T does cover the region of gradual decrease of reliance on chemical and geochemical means of retention, by providing means to reduce the waste before its physical emplacement in the repository. Therefore, the various courses of action on waste management are complementary means to achieve redundant confinement of waste, either during the natural loss of predictability of the retention barriers or during their accidental disturbance: partitioning followed by transmutation, storing in surface halls, embedding radionuclides in durable matrices, conditioning in canisters, emplacing canisters in underground galleries within selected host rocks, sealing galleries with engineered barriers, all these actions contribute to devise safe ways of dealing with radioactive waste. Many technical solutions achieve fulfilment of radiation protection criteria over the decay times of the very long-lived radioisotopes. 108
111 5.4.6 Challenges In general the disposal of HLW that is expected to arise from advanced fuel cycles appears to be less complicated than the disposal of spent fuel from the reference fuel cycle, because the disposed waste contains less fissile materials,jhqhudwhvohvvkhdwdqghplwvlqvrphfdvhvohvv UDGLDWLRQDQG neutrons. However, some special waste types, such as targets, might not be disposable using currently considered technologies. Spent fuels from advanced fuel cycles based on the use of FRs with high burn-up and/or ADSs PLJKWQRWEHUHSURFHVVHGZLWKWKH385(;SURFHVVEHFDXVHWKHWKHUPDORXWSXWDQGWKH UDGLDWLRQRI the spent fuels are too high. The reprocessing of such spent fuels may require the application of pyrochemical reprocessing. This technology is based on the dissolution of the spent fuel in molten salts, such as fluorides and chlorides. How the HLW arising from pyrochemical reprocessing will be conditioned is not yet known. It should be noted that the presence of fluorides or chlorides in HLW can strongly complicate the design of the near field barriers of the repository system. Indeed, the leakage of fluoride and chloride to the water in the near field would strongly accelerate the corrosion of many alloys that are considered in existing repository designs as candidate canister materials. It will be necessary to try to separate fluorides or chlorides from the HLW prior to conditioning in a solid matrix or to develop a matrix material that can guarantee a stable inclusion of F or Cl during very long time spans. There is, at present, a lack of information on the intermediate level waste. Further work in that field is needed to complete that assessment of the impact of advanced fuel cycle schemes on overall waste management policies. 5.5 Conclusions The HLW arising from advanced fuel cycle schemes generates less heat than the spent fuel arising from the reference Scheme 1a. For disposal in hard rock, clay and tuff formations the maximum allowable disposal density is determined by thermal limitations. Especially in the case of a fully-closed fuel cycle, the considerably smaller thermal output of the HLW after 50 years of cooling allows a significant reduction in the total length of disposal galleries needed. Separation of Cs and Sr allows for further reduction in the HLW repository size. For example, in the case of disposal in a clay formation the required length of the HLW disposal galleries is reduced by a factor of 3.5 for the fullyclosed Scheme 3cV1, as compared with Scheme 1a, and by the reduction factor reaches 9 when Cs and Sr are separated. The separated Cs will include not only the short-lived 137 Cs but similar amounts (in mass) of the long-lived 135 Cs that should be managed somehow. For advanced fuel cycle schemes, extending the cooling time from 50 to 200 years will result in a drastic reduction of the thermal output of the HLW and, consequently, of the required size of the repository. In the case of disposal in rock salt the heat generation of the disposed waste contributes to a fast salt creep and void volume reduction. Therefore, a lowering of the thermal output of the HLW forms necessitates an optimisation of the waste packages and of the disposal configuration. The increase in size of any ILW repositories due to the reprocessing of spent nuclear fuel or separation of Cs or Sr which has not been considered in this study deserves further investigation. 109
112 For all the repositories considered the maximum dose resulting from the disposal of HLW from the fuel cycle schemes evaluated does not change significantly. The dose reduction factor resulting from reprocessing is at most 8 and mainly results from the removal of 129 I from the liquid HLW during reprocessing. Should 129 I be captured and disposed of in the HLW repository, the doses resulting from all schemes would be about equal. The releases of solubility-limited fission products are somewhat lower in the case of advanced fuel cycle schemes, because the denser repository configuration amplifies the contribution of the solubility limitation to the repository performance. Overall, disposal in reducing conditions results in very late, i.e. after a few million years, and very small releases of actinides into the biosphere. Reducing conditions exists in most hard rock or argillaceous candidate host formations. In the very long-term, i.e. after a few million years, the total dose is somewhat lower in the case of the fully-closed fuel cycle schemes, because much smaller amounts of actinides have to be disposed of in the repository. However, this effect is not proportional to the amount of disposed actinides because most of them are strongly solubility limited. The activity of the HLW arising from advanced fuel cycles decreases faster than that of the reference fuel cycle. This can considerably limit the eventual consequences of less probable repository evolution scenarios, such as future human intrusions, that might strongly perturb the functioning of the HLW repository. Advanced fuel cycles based on fast reactors or accelerator driven systems may require the application of pyroprocessing. The composition of the conditioned HLW forms that will arise from pyroprocessing is not yet known. The presence of corrosion accelerating substances, such as fluorides or chlorides, can complicate the design of an appropriate engineered barrier system. There is also currently a lack of information on the amount and characteristics of LILW types that will arise from pyroprocessing. References [1] NEA (2004), Post-closure Safety Case for Geological Repositories: Nature and Purpose. OECD, Paris. [2] Becker, D.A., D. Buhmann, R. Storck, J. Alonso, J.-L. Cormenzana, M. Hugi, F. van Gemert, P. O Sullivan, A. Laciok, J. Marivoet, X. Sillen, H. Nordman, T. Vieno, M. Niemeyer (2003) Testing of safety and performance indicators (SPIN). EC, Luxembourg, report EUR EN. [3] NEA (2002), Accelerator-driven Systems (ADS) and Fast Reactors (FR) in Advanced Nuclear Fuel Cycles: A Comparative Study, OECD, Paris. [4] USDOE (2000), Total System Performance Assessment for the Site Recommendation. US Department of Energy, Office of Civilian Radioactive Waste Management, Yucca Mountain Site Characterisation Office, Las Vegas, report TDR-WIS-PA Rev 00. [5] ONDRAF/NIRAS (2001), SAFIR 2: Safety Assessment and Feasibility Interim Report, Belgium. [6] Project Opalinus Clay: Safety Report. NAGRA, Wettingen, Technical report 02-05,
113 [7] Kalimullah and R.A. Wigeland, (1998), The ASIDE Program for Analytical Solution of Isotopic Decay, October 1998, private communication. [8] Wigeland, R.A., T.H. Bauer, T.H. Fanning, and E.E. Morris (2004), Spent Nuclear Fuel Separations and Transmutation Criteria for Benefit to a Geologic Repository, WM 04 Conference, 29 February-4 March 2004, Tucson, AZ. [9] International Commission on Radiological Protection (2000), Protection of the Public in Situations of Prolonged Radiation Exposure. Publication No. 82, Pergamon Press, Oxford, New York. [10] NEA (2002), The Handling of Timescales in Assessing Post-closure Safety of Deep Geological Repositories, Workshop Proceedings, Paris, April 2002, OECD, Paris. [11] IAEA (2003), Safety indicators for the safety assessment of radioactive waste disposal. Report TECDOC-1372, Vienna. [12] Martinez-Esparza, A., M.A. Cunado, J.A. Gago (2005), Development of a matrix alteration model (MAM), Technical report 01/2005, Enresa, Madrid. [13] JNC (2000), H12: Project to establish the scientific and technical basis for HLW disposal in Japan, report TN , Tokai-Mura. [14] Baudoin, P., D. Gay, C. Certes, C. Serres, J. Alonso, U. Nosek, K.H. Martens, D. Dodd, J. Marivoet, T. Vieno (2000), Spent Fuel Disposal Performance Assessment (SPA project), report EUR EN, EC, Luxembourg. [15] Golder Associates (2003), User s Guide: GoldSim Graphical Simulation Environment; and (2002), User s Guide: GoldSim Contaminant Transport Module, GoldSim Consulting Group, (May 2003 and April 2002). [16] Zwahlen, Eric (2002), Golder Assoc. Inc., Personal Communication, May. [17] USDOE (2001), Yucca Mountain Science and Engineering Report, DOE/RW-0539, May. 111
114
115 6. ECONOMIC ANALYSES 6.1 Introduction The objective of this chapter is to evaluate a complex indicator cost. Recognising that the study covers existing, well known technologies available today as well as technologies under development that will mature in the future, cost data has various degrees of uncertainties depending on the scheme and even process considered. A conservative view has been adopted, which assigns systematically higher nominal values to cost related to systems and processes that are not fully industrialised, assuming that new technologies are at the beginning of their learning curve. The competitive edge of innovative schemes as compared with schemes based on existing technologies might increase with expected benefits from technology progress induced by learning and series effect. The use of cost as an indicator is very attractive because it offers a means to integrate many factors. Estimates of total system cost can be used as a normalising factor for widely dissimilar processes and as a de facto integrating factor to roll all indicators into a single value. Another major benefit of the cost analysis is its ability to provide, through parametric studies, an assessment of cost sensitivity to variations in system components and features. To the extent that indicator interdependencies are understood and incorporated in the analysis, the cost tool can show the relative gain or loss in system cost resulting from variations of component characteristics. Cost analysis, however, raises a number of issues which complicate its interpretation and its relevant utilisation. Assigning costs to fuel cycle components and processes requires a number of assumptions which may unconsciously incorporate value judgments into the indicator. Furthermore, the eventual cost of a complex process currently at a very early stage of conceptual development is very difficult to predict and therefore cost estimates for such processes are open to criticism and always may be challenged. The following cost analyses are based on estimated costs for fuel cycle materials, processes and facilities which are rolled into total fuel cycle and generation costs normalised per unit of energy produced. It must be stressed that while the relative costs of different systems evaluated using consistent assumptions can provide useful guidance, the absolute cost values, especially when used out of the context of the present study, may be misleading. Recognising the uncertainty margins on input cost data, the results from the following economic assessments provide relative indicators of differences between alternative schemes rather than absolute cost values. Sensitivity analyses show how a complex cost indicator may vary when process parameters change or when the weight of a parameter itself changes, contribute valuable insight into the relative effects of fuel cycle characteristics, and permit evaluation of trade-offs between process details. 113
116 6.2 Methodology Cost breakdown structure This study follows the cost analysis methodology used in a previous NEA study [1] which assumed steady-state equilibrium of mass flows in all the steps of the fuel cycle. The cost breakdown structure of a nuclear fuel cycle scheme follows the series of steps (or processes) required for the paths included in the scheme. The thirteen fuel cycle schemes considered in this study can be described by their main steps as shown in Figure 6.1. Figure 6.1. Main steps of the nuclear fuel cycle schemes considered in the study Pu, MA NU UF 6 EU Fuel S/F S/F NU CV UE FF Rx TR S/F CS PR RU, LS LS DU LILW SD LILW S/F DS HLW NU: Natural Uranium CV: Uranium Conversion UE: Uranium Enrichment EU: Enriched Uranium DU: Depleted Uranium FF: Fuel Fabrication Rx: Reactor Operation S/F: Spent Fuel TR: Transport CS: Cooling (or Interim Storage) PR: Processing RU: Reprocessed Uranium MA: Minor Actinides HLW: High Level Waste LILW: Low- and Intermediate-Level Waste LS: Long-term Storage DS: Dry Storage PK: Packaging GD: Geological Disposal SD: Surface Disposal (or Cavernbased Disposal) PK GD HLW, S/F HLW, S/F It should be noted that all fuel cycle steps were not taken into account separately in the context of the present study. Some steps were aggregated and incorporated into previous or subsequent steps. For example, the step of fresh fuel storage and transport to reactor is included in the fuel fabrication step and the vitrification of high-level waste from reprocessing is included in the reprocessing step. The present study focusing on waste management, this part of the fuel cycle was divided into more steps than it was the case in the previous study; 1 the waste management steps considered in this study are: x dry storage (50 years), packaging and geological disposal for spent fuel and high-level waste; x disposal for low- and intermediate-level waste; and x long-term storage for depleted uranium, reprocessed uranium and separated radio-nuclides such as americium and curium. 1. In the previous study, the dry storage and long-term storage options were not considered and packaging and geological disposal were aggregated as one step repository. Disposal of low- and intermediate-level waste was not considered either assuming that the costs involved would be small enough to be neglected. 114
117 From an economic analysis viewpoint, total generation cost is the most relevant aggregated indicator. However, for nuclear generated electricity, total cost is dominated by the capital cost component while fuel cycle cost accounts for no more than some 20%. Fuel cycle cost comparisons are included in the following analyses to illustrate better the relative economics of alternative fuel cycle schemes Cost calculation Each fuel cycle step included in Figure 6.1 serves as a cost centre for conducting the cost analysis; assuming steady-state equilibrium of mass flows, the total cost of a fuel cycle scheme can be calculated as the sum of costs corresponding to each step in the scheme. The cost of each step is supposed to be proportional to its mass flow (in terms of mass, volume, electricity generated or decay heat); under this assumption, it can be calculated as the product of unit costs by corresponding flows. In this study the mass flows of each fuel cycle scheme are normalised to the amount needed for producing 1 TWhe to facilitate the comparison of total generation costs or fuel cycle costs for different fuel cycle schemes Unit costs The cost analysis of the present study aims at providing some insights on economic trends but does not intend to give best estimates. Ranges of unit costs were allocated to each of the steps described in Figure 6.1. The width of the range corresponds to uncertainties in terms of technological progress, financial arrangement, political and social environment, etc. The nominal unit cost value generally corresponds to the best estimate available on unit cost for a given fuel cycle step. The upper bound represents the estimated maximal cost value corresponding to the worst case taking into account all uncertainties. The lower bound corresponds to the lowest possible cost according to present knowledge and expert judgements. The unit costs used in the present study are drawn from previous NEA studies [1,2,3,4,5] or reflect best expert judgments from various members of the group. When economic targets had been set explicitly for a given advanced technology, they were adopted as lower bound unit costs. Appendix L contains all the unit costs used in the economic analysis presented below, expressed in US dollars of Integration tool For the purpose of the present study, a computer tool was developed using the Microsoft Excel software package. The tool was designed for an efficient conduct of nuclear fuel cycle scheme cost analyses. It is simple, transparent and offers users the capability to track down the cost analysis results. All the fuel cycle schemes considered in this study are represented in a graphic format in the tool and all values related to a fuel cycle step are shown in the graphic interface, i.e., there are no hidden values embedded in the calculations. All data on the fuel cycle schemes considered in this study including mass flows, waste generation, cost data, and other data such as activities, decay heat and neutron sources of spent fuel and high-level waste along time are included in the computer tool and can be displayed. The tool is designed to allow the user to modify easily the values of mass flows and/or cost parameters and see the corresponding changes in the results. The tool calculates: front-end fuel cycle mass flows such as requirements of enrichment and conversion services and natural uranium; mass of waste based on the waste generation parameters and 115
118 the mass flow; and all costs. It performs Monte Carlo simulations with changing the values of all unit costs within their respective ranges (from lower to upper bounds). 2 The integration tool will be available as a computer code in the OECD/NEA Databank. 6.3 Results Overall cost trends Total generation cost Figure 6.2 shows the relative total generation costs normalised to Scheme 1a for the thirteen schemes considered in this study, calculated using the nominal cost units for all fuel cycle steps. The figure shows that difference among schemes does not exceed 20%, a variation similar to the one induced by varying local and economic conditions for the same technologies within a given scheme. Scheme 1a has the lowest cost; schemes 1b, 1c, 1d and 2a are close, within a few percents; schemes 2b, 2c, 2cV, 3a have costs around 8% higher; Scheme 3b has a cost 12% higher; and schemes 3bV, 3cV1 and 3cV2 have the highest costs, 20% higher than Scheme 1a. Figure 6.2. Relative total generation costs calculated with nominal values of the unit costs (Scheme 1a = 100%) (Scheme 1a = 100%) 120% 100% 80% 60% 40% 20% 0% 1a 1b 1c 1d 2a 2b 2c 2cV 3a 3b 3bV 3cV1 3cV2 U, Conversion, Enrichment Fuel Fabrication Reprocessing Reactor Investment Reactor O&M Waste Management 2. In the Monte Carlo simulation, it is assumed that all unit costs follow a triangular probability distribution function, i.e., the probability that the unit cost has a value increases linearly from its lower bound to the nominal value and then decreases linearly to its upper bound. 116
119 Figure 6.2 also shows the components of total generation costs. Investment cost is the major component for all schemes representing between 56 and 63%. Investment plus operating and maintenance costs amount to 80 to 90% of total generation costs. Fuel cycle costs range from 10 to 20% of the total with waste management accounting for only 1 to 5% of the total. While waste management costs vary significantly among schemes, their contribution to total generation costs is small enough to prevent it from being a major driving factor in decision making. Figure 6.3 shows the ranges of relative total generation costs with the upper values calculated using the upper unit costs for each step and the lower values calculated using the lower unit costs for each step. It illustrates the importance of uncertainties on unit costs, showing that uncertainty ranges exceed differences among schemes. Figure 6.3. Ranges of relative total generation costs (Scheme 1a with nominal values = 100%) (Scheme 1a with nominal values = 100%) 250% 200% 150% 100% 50% 0% 1a 1b 1c 1d 2a 2b 2c 2cV 3a 3b 3bV 3cV1 3cV2 This effect of uncertainties is illustrated also in Figure 6.4 which displays the Monte Carlo distributions for five schemes. The curve for Scheme 1a has the lowest values and a relatively narrow distribution; the curves for schemes 2a, 3a and 3b have slightly higher values but also relatively narrow distributions; the curve for Scheme 3cV1 has the highest values and a significantly broader distribution. The overlap of all cost probability distributions indicates that cost alone cannot be a decisive factor in fuel cycle choices or policy making when considering of innovative technologies at a very early stage of technology preparedness. 117
120 Figure 6.4. Result of Monte-Carlo analysis for total generation costs a b a a cV $/MWh Fuel cycle cost Figure 6.5 shows relative fuel cycle cost ranges for the thirteen schemes; relative differences among schemes, which are larger than those regarding total generation costs, and uncertainty ranges are relevant indicators in the context of the present study. Figure 6.5. Relative fuel cycle cost ranges (Scheme 1a with nominal values = 100%) (Scheme 1a with nominal values = 100%) 250% 200% 150% 100% 50% 0% 1a 1b 1c 1d 2a 2b 2c 2cV 3a 3b 3bV 3cV1 3cV2 118
121 Generally, the addition of treatment steps increases fuel cycle costs but, as compared with Scheme 1a, the benefits from fast spectrum and full recycling in reducing final disposal costs tend to exceed the extra costs of separation. Schemes 2c, 2cV, 3cV1 and 3cV2 have fuel cycle costs, calculated with nominal unit costs, lower than the reference Scheme 1a and have also rather small fuel cycle cost uncertainty ranges. The results of the Monte Carlo analysis for fuel cycle costs displayed in Figure 6.6 show differences in uncertainty ranges and most probable values of those costs. Several of the seven schemes plotted have narrower distributions than Scheme 1a. There is also a wider spread among the distributions than it is the case for total generation costs, to the extent that the uncertainty ranges do not overlap in all cases. For example, Scheme 2b has a high fuel cycle cost because it requires more enrichment services to support multiple recycling while its total generation cost remains low because it uses mature commercial technologies for reactor and fuel processing. Figure 6.6. Result of Monte-Carlo analysis for fuel cycle costs b c 1a 3a 2a 2b cV $/MWh Sensitivity analyses Sensitivity analyses have been performed to estimate the relative importance of different parameters in total electricity generation and fuel cycle costs. The impacts of variations in the most sensitive parameters and the effect of large uncertainties on the costs and performance of new technologies are described below FR investment cost Figure 6.7 illustrates the impact of FR investment cost on total generation costs for schemes 1b, 2a, 2c, 3a, 3b and 3cV1. The horizontal axis represents the relative investment cost of a fast reactor (GFR and LMFR) as compared with a PWR and the vertical axis the total generation cost for each scheme normalised to the total generation cost of Scheme 1a. 119
122 Figure 6.7. Dependence of relative total generation cost on FR investment cost (Scheme 1a = 100%) (Scheme % 1a = 100%) 200% 180% 160% 3cV1 140% 120% 2c 3a 3b 100% 1b 2a 80% -25% 0% 25% 50% 75% 100% The uncertainty on FR investment cost is a key issue for the eventual deployment of schemes involving this reactor type. In this study, a conservative approach was adopted, assuming that FR investment costs would be 20% higher than investment costs of current generation PWRs. Some studies suggest that FR investment costs could be lower than PWR investment costs once the learning and series effect would have occurred. Schemes involving FRs would become economically attractive if and when such investment cost reductions would have been achieved ADS investment cost In this study the nominal value of accelerator investment cost is assumed to be 15$/W beam, which means that ADS investment cost (including accelerator) is about 40% higher than FR investment cost. A CEA study [6] suggests much higher values of accelerator investment cost up to 65$/W beam. In this case, the ADS investment cost would be about 170% higher than FR investment cost. Figure 6.8, where the x-axis represents % of ADS investment cost compared to FR investment cost, shows the significant sensitivity of total generation costs to ADS investment costs. This helps to define the capital cost challenge, and potential benefit, for ADS R&D. 120
123 Figure 6.8. Dependence of relative total generation cost on ADS investment cost (Scheme 1a = 100%) (Scheme 1a = 100%) 150% 140% 130% 3bV 3cV1 120% 3b 2c 110% 3a 2a 1b 100% 0% 40% 80% 120% 160% 200% Pyroprocessing cost All the data related to pyrochemical separation technology have a large uncertainty because the whole process is at an early stage of conceptual design. This does not have a very significant impact on total generation cost uncertainties because separation represents only small part of the total cost. As an example if the unit cost of the pyrochemical reprocessing of carbide fuel in Scheme 3cV1 (full- GFR system) is multiplied by 3, increasing from 1 000$/kgHM to 3 000$/kgHM, the total generation cost increases only by 5%. Figure 6.9 and 6.10 show the dependence of total generation cost and fuel cycle cost respectively on pyroprocessing unit cost, the horizontal axis showing the ratio of pyroprocessing cost versus PUREX reprocessing cost. Recent developments, e.g. by CEA, examine the possibility of reprocessing actinides globally (global actinide management), thereby enhancing proliferation resistance and simplifying the processing steps. While not considered in this study, this option would most likely show the same sensitivity to the processing cost as the one shown in Figures 6.9 and
124 Figure 6.9. Dependence of relative total generation cost on pyroprocessing cost (Scheme 1a = 100%) (Scheme 1a = 100%) 130% 3cV1 120% 3cV2 3b 110% 3a 2a 1b 100% 0% 80% 160% 240% 320% 400% Figure Dependence of relative fuel cycle cost on pyroprocessing cost (Scheme 1a = 100%) (Scheme 1a = 100%) 140% 120% 1b 100% 80% 3a 3cV1 2a 3cV2 3b 60% 40% 0% 80% 160% 240% 320% 400% 122
125 Uranium price In the long term, the motivation for advanced fuel cycles, and in particular fast reactor full recycle schemes, is in optimisation of fuel resources. Figures 6.11 and 6.12 show the sensitivity of total generation and fuel cycle costs respectively to uranium price. The vertical axis displays the total generation and fuel cycle costs respectively normalised to the costs of Scheme 1a. Obviously, advanced fuel cycles involving fast reactors are much less sensitive to uranium price variations than cycles involving PWR, particularly once-through cycle. Today s market prices for spot and long-term contracts vary from 56 to 70$/kg, as presented in a recent IAEA technical meeting [7]. A reappraisal of the uranium price range given by [2] and used in this study might raise the uncertainty range of 20-80$/kg to $/kg range. As shown in Figure 6.12, such a change would not modify the relative ranking of the different schemes. Uranium price should rise up to 200$/kg before it modifies the ranking of schemes in total generation costs. In this particular case the Scheme 3b would crossover the cost of Scheme 2b at this price level and would have a lower cost for higher uranium prices. Figure Dependence of relative total generation cost on uranium price (Scheme 1a = 100%) (Scheme 1a = 100%) 120% 115% 3cV1 110% 105% 100% 1b 2a 2c 3b 3a 95% 90% ($/kg) 123
126 Figure Dependence of relative fuel cycle cost on uranium price (Scheme 1a = 100%) (Scheme 1a = 100%) 140% 120% 100% 80% 1b 3a 2a 3b 60% 40% 2c 3cV1 20% ($/kg) 6.4 Conclusions Total electricity generation costs are dominated by reactor investment costs and, therefore, do not vary widely between schemes. Fuel cycle costs vary by a factor of two depending on the scheme and are significantly affected by uncertainties on unit costs for advanced technologies and processes. The price of natural uranium which is an important factor in fuel cycle cost for the reference Scheme 1a has a moderate impact on fuel cycle costs for schemes involving reprocessing and recycling. The portion of waste management cost, including repository, in the total electricity generation cost is so low that uncertainties in unit costs for the waste management steps have no significant impact on those total costs. Monte Carlo simulations show that, taking into account the large uncertainties on unit costs for advanced technologies and processes, innovative schemes eventually may have lower costs than the reference Scheme 1a. 124
127 References [1] NEA (2002), Accelerator-driven Systems (ADS) and Fast Reactors (FR) in Advanced Nuclear Fuel Cycles: A Comparative Study, OECD, Paris. [2] NEA (2001), Trends in the Nuclear Fuel Cycle: Economic, Environmental and Social Aspects, OECD, Paris. [3] NEA (1993), The Cost of high-level Waste Disposal in Geological Repositories: An Analysis of Factors Affecting Cost Estimates, OECD, Paris. [4] NEA (1999), Low-Level Radioactive Waste Repositories: An Analysis of Costs, OECD, Paris. [5] NEA and IEA (2005), Projected Costs of Generating Electricity: 2005 Update, OECD, Paris. [6] CEA, Dossier de motivation pour un démonstrateur hybride, CEA/DRN/SPSH [7] McMurray J., Beattie, D., Boitsov, A. and Capus, G. (2005), Uranium Demand and Supply through 2050: Key Issues Paper for Working Group 1, Technical Meeting on Fissile Material Management Strategies for Sustainable Nuclear Energy, Sep. 2005, IAEA. 125
128
129 7. CONCLUSIONS The objective of this study was to analyse a range of possible fuel cycle options from the perspective of their effect on waste management policies using to the extent possible indicators or metrics that may drive, or at least influence, waste management policy decision. A fundamental challenge in this regard was that there is no single, simple, and universally agreed upon indicator which can be used to measure benefit in the field of waste management. A wide variety of indicators are used by different stakeholders, some of which are inter-related, and some of which are more independent. The relative importance of these indicators varies with the individual, the organisation, country or decision-making entity. Therefore, the adoption of a single combined quantitative score was not possible in the context of a study carried out by an international group of experts. The indicators used in the study include waste volumes, resource consumption, radiation levels, thermal decay heat or actinide content. Some of these simple indicators can lead to more complex aggregated indicators. For example, the amount of fissile material sent to waste and its isotopic details, the heat and radiation levels, and the chemical durability of that waste may be integrated into physical security or proliferation resistance indicators. Recognising that there is no consensus on the correct way to combine simple indicators into more complex ones, a fair comparison of fuel cycle schemes should be based on a multi-criteria approach relying on simple indicators unless the assumptions and process for determining more complex indicators is adequately described. In order to summarise the main outcomes from the study, eleven indicators were selected as representative of the differences identified among the schemes considered. Figure 7.1 presents those indicators displayed on a spider chart with a logarithmic scale for four representative schemes. It should be stressed, however, that the results from the analyses described in the body of the report contain a wealth of additional valuable information of high relevance for comparative assessment of different fuel cycle schemes and policy making. Overall, the results of this study show that advanced fuel cycles offer possibilities for various strategic choices on uranium resources and on optimisation of waste repository sites and capacities, while keeping almost constant both the radiological impact of the repositories and the financial impact of the complete fuel cycle. It is therefore possible to design for acceptable costs innovative nuclear reactor cycles, which at the same time spare resources and make the most efficient use of the foreseen geological repository sites. Specific conclusions from the study regarding primary mass flows, waste generation, disposal and repository performance, fission product management and economics are summarised below. 127
130 Figure 7.1. Comparison of eleven representative indicators for various fuel cycle schemes Fuel Cycle Cost Total Generation Cost 10 1 Uranium Consumption Max. Dose (tuff) TRU Loss Max. Dose (clay) Activity (after 1000 yrs) Max. Dose (granite) Decay Heat (after 50yrs) 1a 1b 2a 3cV1 HLW Volume (+SF) Decay Heat (after 200yrs) Note: Once-through cycle (1a) is used as reference. 1b: full LWR park, spent fuel reprocessed and Pu re-used once, 2a: full LWR park, spent fuel reprocessed and multiple re-used of Pu, 3cV1: full fast reactor park and fully closed fuel cycle. Primary mass flows By fully closing the fuel cycle, the heavy metal content of the waste can be reduced by more than three orders of magnitude as compared with the once-through fuel cycle. During the transition phase towards closed cycle or during phase-out of nuclear energy the heavy metal content may be higher than in equilibrium state as assumed in this study. Due to the higher electrical efficiency of fast reactors, a change from an all-pwr to an all-fr reactor strategy would reduce the fission product mass by about 30%. This may have a major effect on HLW volume. Only transmutation strategies with fully closed fuel cycles can meet the hundredfold TRU reduction goal of P&T. Partially closed fuel cycles, which cannot achieve such high TRU reductions but are easier to implement, are also useful for managing plutonium and minor actinides. When a transmutation strategy is phased out, it has to be ensured that the TRU waste reduction achieved in the equilibrium phase is not jeopardised by the disposal of the residual TRU inventory. This could be done by optimising the use of FR and/or ADS in burning TRU during phase out period. 128
131 The high decay heat and neutron emission of multi-recycled fuels have consequences for the reprocessing and the handling of the fuel. As to the reprocessing, improvements to the flow sheets of aqueous processes and the introduction of pyrochemical methods will be necessary. Since the actinides are mostly recovered, minor actinide management techniques, in fact, always reduce the total decay heat of the waste. While the heat reduction at normal disposal time (50 years) is modest (at most 70%), schemes with minor actinide management show a significant reduction potential at longer times. A tenfold reduction could be achieved by prolonging the cooling time from 50 to 200 years. Using the mass flow of pure plutonium as a simple indicator for the proliferation risk, the schemes can be divided into groups with high (2a, 2b, 2c, 2cV, 3b), low (1b, 3bV) and no flow (all other schemes). Increases in proliferation resistance may be coupled with technical or economical drawbacks. As to the natural uranium demand, the reduction potential of advanced PWR strategies is about 10%, compared with the once-through fuel cycle. A significant (40%) uranium saving can be achieved with the DUPIC fuel cycle. Higher savings are possible by incorporating fast reactors into the park. And an all-fr strategy will allow the uranium demand to be reduced by more than two orders of magnitude. All reactor parks including PWRs produce significant amounts of residual uranium. The longterm storage or disposal of this uranium has to be considered as an integral part of the waste management. Waste generation The conditioning technology is one of the important factors defining the volume of the HLW generated by the reprocessing plants. Current conditioning methods are not necessary best optimised for the composition of the waste streams produced by the advanced separation technologies, especially pyrochemical technologies. In many cases the amount of certain fission products is the limiting factor on waste loading of the conditioned waste. This decreases the differences between the volume of conditioned HLW produced by different separation technologies (and the different fuel cycles). During normal operation, the majority of the LILW-LL is generated by the reprocessing activities. The differences between fuel cycles are estimated to be relatively small. However, there are key differences between the open and closed fuel cycles in terms of volume and waste types due to reprocessing or partitioning. At the same, the uncertainties are very large because no real or experimental data on secondary waste flows exist. Additionally, secondary waste flows depends not only the technology used but also largely on how the plant is operated. When the fuel cycle facilities are decommissioned, reactor plants are also large contributor of LILW-LL. The volume LILW-SL generated by the fuel cycles is dominated by the power plants. Uncertainties are also large in this case, because of the same reason as for LILW-LL case. 129
132 Fission product management Separation and temporarily storage of Cs and Sr can reduce the number of vitrified HLW canisters by 25 to 40%. The interim storage time needed varies from 12 to 32 years depending on the waste loading. Additional cost of Cs/Sr separation and Cs/Sr interim storage results in a 5-10% increase in total cost. Removing and sequestering Cs and Sr in a separate area of the repository or another facility, would allow a further substantial increase in the drift loading of the repository, up to a factor of 43 in comparison with the direct disposal case for 99.9% removal of Pu, Am, Cs, and Sr. Disposal and repository performance Generally, the HLW arising from the advanced fuel cycle scenarios generates less heat than the spent fuel. In case of disposal in hard rock, clay and tuff formations the maximum allowable disposal density is determined by thermal limitations. Especially in the case of a fully closed fuel cycle, the considerably smaller thermal output of the high level waste at the considered cooling time of 50 years allows a significant reduction in the total length of disposal galleries required. Separation of Cs and Sr allows further reduction in the HLW repository size. For example, in the case of disposal in a clay formation the required length of the HLW disposal galleries is reduced by a factor of 3.5 when comparing the waste from the fully closed fuel cycle compared to once-through fuel cycle, and by a factor of 9 when Cs and Sr are separated. Extending the cooling time from 50 to 200 years will result in a reduction of the thermal output of the HLW and, consequently, of the required size of the HLW repository. In the case of advanced fuel cycles this reduction is a factor of about 30. In the case of disposal in rock salt the heat generation of the disposed waste contributes to a fast salt creep and void volume reduction. Therefore, a lowering of the thermal output of the high level waste forms necessitates an optimisation of the waste packages and of the disposal configuration. The increase in size of any ILW repositories due to the reprocessing of spent nuclear fuel or separation of Cs or Sr has not been considered in this study. For all considered repositories the maximum dose resulting from the disposal of the high level waste from the various considered fuel cycles scenario does not significantly change from one scenario to another. The doses resulting from the cycles for disposal of fuel with reprocessing are at most a factor 8 lower than those from the reference fuel cycle 1a. However, the lower dose mainly results from the removal of 129 I from the high level waste during reprocessing. Should 129 I be captured and disposed of in the HLW repository, the doses resulting from all scenarios will be about equal. The releases of solubility limited fission products are somewhat lower in the case of advanced fuel cycle scenarios, because the denser repository configuration amplifies the contribution of the solubility limitation to the repository s performance. Overall, disposal in reducing conditions results in very late, i.e. after a few million years, and very small releases of actinides into the biosphere. Reducing conditions exist in most hard rock or argillaceous candidate host formations. 130
133 At the very long-term, i.e. after a few million years, the total dose is somewhat lower in the case of the fully closed fuel cycle scenarios, because much smaller amounts of actinides have to be disposed of in the repository. However, this effect is not proportional to the disposed amount of actinides because most actinides are strongly solubility limited. The activity of the high level waste arising from advanced fuel cycles decreases faster than that of the reference fuel cycle. This can considerably limit the eventual consequences of less probable repository evolution scenarios, such as future human intrusions, that might strongly perturb the functioning of the HLW repository. Advanced fuel cycles based on fast reactors or accelerator driven systems may require the application of pyroreprocessing. The composition of the conditioned high level waste forms that will arise from pyroprocessing is not yet known. The presence of corrosion accelerating substances, such as fluorides or chlorides, can complicate the design of an appropriate engineered barrier system. There is also currently a lack of information on the amount and characteristics of low- and intermediate-level waste that will arise from pyroprocessing. Economic analyses Total electricity generation costs are dominated by reactor investment costs and, therefore, do not vary widely between schemes. Fuel cycle costs vary by a factor of two depending on the scheme and are significantly affected by uncertainties on unit costs for advanced technologies and processes. The price of natural uranium which is an important factor in fuel cycle cost for the reference Scheme 1a has a moderate impact on fuel cycle costs for schemes involving reprocessing and recycling. The portion of waste management cost, including repository, in the total electricity generation cost is so low that uncertainties in unit costs for the waste management steps have no significant impact on those total costs. Monte Carlo simulations show that, taking into account the large uncertainties on unit costs for advanced technologies and processes, innovative schemes eventually may have lower costs than the reference Scheme 1a. 131
134
135 Appendix A LIST OF EXPERT GROUP MEMBERS BELGIUM Mr. Jean-Marie CUCHET Belgonucléaire (from 11/2004) Mr. Servais PILATE Belgonucléaire (until 11/2004) Mr. Guy DEMAZY SYNATOM Mr. Edouard Mbala MALAMBU SCK CEN Dr. Jan MARIVOET SCK CEN FINLAND Dr. Markku ANTTILA FRANCE Mr. Marc DELPECH Ms. Christine LOAËC Prof. Charles MADIC Mr. Alain ZAETTA GERMANY Mr. Ludger LAMBERS Dr. Aleksandra SCHWENK-FERRERO ITALY Mr. Mario DIONISI Mr. Piero RISOLUTI JAPAN Dr. Tetsuo IKEGAMI KOREA (REPUBLIC OF) Dr. Kwan Sik CHUN Dr. Jae-Hyung YOO RUSSIAN FEDERATION Mr. A.N. LUKINYKH VTT SACLAY SACLAY SACLAY CADARACHE GRSKOLN FZK APATSIA CASACCIA JNC KAERI KAERI NIIAR 133
136 SPAIN Dr. Enrique GONZALEZ-ROMERO Dr. Armando URIARTE SWEDEN Mr. Per-Eric AHLSTRÖM SWITZERLAND Prof. Jean-Marc CAVEDON Dr. Peter WYDLER* UNITED KINGDOM Dr. Samantha KING Dr. Colin Hunter ZIMMERMAN Dr. Darren PARKER UNITED STATES OF AMERICA Dr. James Collins BRESEE Dr. William HALSEY Mr. Leroy STEWART Dr. Abraham VAN LUIK International Atomic Energy Agency (IAEA) Mr. José Luis GONZALEZ GOMEZ European Commission Dr. Ved BHATNAGAR Mr. Enric PLA CAMPANA OECD/Nuclear Energy Agency Dr. Timo HAAPALEHTO Dr. Kwang-Seok LEE CIEMAT ENRESA SKB PSI NIREX BNFL BNFL DOE LLNL DOE DOE IAEA DG Research DG Energy and Transport Nuclear Development Division Nuclear Development Division * With support from PSI Villigen and HSK Villigen. 134
137 Appendix B ACRONYMS ADS Accelerator-driven system (sub-critical) AFCI Advanced fuel cycle initiative ALMR Advanced liquid metal (-cooled) reactor An Actinide, i.e. U, Pu, Np, Am or Cm. Actinides stands for any combination of U, Pu, Np, Am and Cm. ANL Argonne National Laboratory (United States) Bq Becquerel, unit of activity, often TBq (10 12 ) BNFL British Nuclear Fuels Limited BWR Boiling water reactors CANDU Canadian deuterium uranium Canadian reactor CCD Chlorinated cobalt dicarbolide CEA Commissariat à l énergie atomique (France) CIEMAT Centro de Investigaciones Energéticas, Medioambientales y Tecnológicas COGEMA Compagnie générale des matières nucléaires CRIEPI Combined Research Institute of the Electric Power Industries (Japan) DAW Dry active waste DepU Depleted uranium from enrichement DOE Department of Energy (United States) DUPIC Direct Use of spent PWR fuel in CANDU reactors EBS Engineering barrier system EDF Électricité de France EFR European fast reactor concept ENEA Ente per le Nuove tecnologie, l Energia e l Ambiente (Italy) ENRESA Empresa Nacional de Residuos Radioactivos S.A. FP Fission product FR Fast reactor (operating at criticality) Framatome Franco-Américaine de constructions atomiques FZJ Forschungszentrum (research centre) Jülich (Germany) 135
138 FZK Gen-IV GeV GFR GRS GWd GWe HBU HEPA HEU HIC HLLW HLW HM HTOM HWR IAEA ICRP IFR ILW JAERI JNC KAERI LANL LBE LILW LL LLFP LMFR Ln LLNL LSM LWRs MA Forschungszentrum Karlsruhe (Germany) Next generation nuclear energy systems Giga-electron-volt (10 9 electron volts) Gas-cooled fast reactor Gesellschaft für Anlagen- und Reaktorsicherheit mbh Gigawatt-day (usually thermal, i.e. without allowance for conversion losses) Gigawatt (electrical) High burn-up core High efficiency particulate absorbing Highly enriched uranium High integrity containers High-level radioactive liquid waste High-level waste Heavy metal High-temperature operating mode Heavy water reactor International Atomic Energy Agency International Commission on Radiological Protection Integral fast reactor Intermediate-level waste Japan Atomic Energy Research Institute Japan Nuclear Cycle Development Institute Korea Atomic Energy Research Institute Los Alamos National Laboratory (US) Lead bismuth eutectic Low- and intermediate-level waste Long-lived waste Long-lived fission products Liquid metal (cooled) fast reactor Lanthanide Lawrence Livermoore National Laboratory (United States) Low specific material Light water reactors (either pressurised or boiling) Minor actinides, principally neptunium, americium and curium 136
139 MCA MEGAPIE Mo MOX Mt MW NIRAS ONDRAF OREOX ORIENT P&T PSI PUREX PWR RIAR SAFIR 2 SCK CEN SepU SL SNF SWU TBP thm t.l.e. TRU tu TWhe UOX UREX+ VR Multi-criteria analysis MEGAwatt Pilot Experiment molybdenum Mixed oxide fuel, uranium and plutonium unless otherwise specified Metric ton Megawatt (million watts) Nationale instelling voor radioactief afval en verrijkte splijtstoffen Organisme national des déchets radioactifs et des matières fissiles enrichies Oxidation and reduction of oxide fuel Optimisation by removing impedimental elements Partitioning and transmutation Paul Scherrer Institute (Switzerland) Plutonium and uranium reduction of oxide fuel Pressurised water (cooled and moderated) reactor Research Institute of Atomic Reactors (Russia) Safety Assessment and Feasibility Interim Report Studiecentrum voor Kernenergie Centre d étude de l Énergie nucléaire Separated uranium from reprocessing Short-lived waste Spent nuclear fuel Separating work unit tri-butyl-phosphate, an organic molecule to extract plutonium (Pu) and uranium (U) from dissolved spent fuel ton of heavy metal temperature limit exceeded Transuranic elements, i.e. Pu, Np, Am and Cm ton of uranium Terawatt-hour (electrical), i.e watt-hours after conversion losses Uranium oxide fuel Aqueous fuel reprocessing scheme Volume reduction factor 137
140
141 Appendix C FUEL CYCLE DESCRIPTIONS AND MAIN DATA Scheme 1a Open cycle Fuel Characteristics and Mass Flows (kg/twhe) U nat :20723kg Enrichment U dep :18673kg UOX Fuel 2050kg PWR STORAGE UOX: kg U: kg Pu: 26 kg Np: 1.9 kg Am: 1.6 kg Cm: 0.28 kg PF: 130 kg ENRICHMENT Natural Uranium Depleted Uranium Enriched Uranium FUEL Burn Up Ageing time Cooling time REACTOR Thermal power Electrical power PWR/UOX 0.71% 235 U 0.25% 235 U 4.90% 235 U UOX 60 GWd/tHM 2 years 5 years PWR EPRtype MWth MWe 139
142 Power for scenario 1a 1,00E+04 Power (Watt/TWhe) 1,00E+03 1,00E+02 1,00E+01 5 years 6.69E years 2.11E years 5.91E years 1.71E years 3.83E+01 1,00E Year Activity for scenario 1a 1.00E E+04 5 years 6.88E years 1.70E+04 Activity (TBq/TWhe) 1.00E E E years 1.07E years 2.01E years 4.92E E Year Neutron Source for scenario 1a 1,00E+10 Neutron Source (neutron/sec/groupe/twhe) 1,00E+09 1,00E+08 1,00E+07 5 years 2.99E years 5.90E years 5.73E years 3.93E years 1.39E+07 1,00E Year 140
143 Scheme 1b UOX reprocessed (PUREX) Pu once cycling in MOX Fuel Characteristics and Mass Flows (kg/twhe) U nat : kg 1683kg U irr Enrichment UOX FUEL 1825kg PWR 89% PUREX UOX kg U dep :16623kg 202 kg MOX FUEL 225 kg Pu: 23 kg PWR 11% DISPOSAL Pu: kg Np: 1.7 kg Am: 1.4 kg Cm: 0.25 kg PF: 116 kg STORAGE MOX: 225 kg Pu: 15.2 kg Np: 0.04 kg Am: 1.4 kg Cm: 0.33 kg U: 193 kg PF: 15 kg ENRICHMENT Natural Uranium Depleted Uranium Enriched Uranium PWR/UOX 0.71% 235 U 0.25% 235 U 4.90% 235 U PWR/MOX 0.25% 235 U FUEL Burn Up Ageing time Cooling time Pu Content Fissile Pu UOX 60 GWd/tHM 2 years 5 years MOX 60 GWd/tHM 2 years 5 years 10% 63% REACTOR Thermal power Electrical power REPROCESSING Losses PWR EPRtype MWth MWe PUREX 0.1% U,Pu 100% MA, FP PWR EPR 100% MOX MWth MWe 141
144 Power for scenario 1b Power (Watt/TWhe) 1.00E E E E E+00 5years 5.38E E E years 1.19E E E years 1.11E E E years 2.63E E E+02 UOX MOX Total years 2.75E E E E Year Activity for scenario 1b Activity (TBq/TWhe) 1.00E E E E E+01 5 years 4.99E E E years 1.32E E E years 4.89E E E years 3.46E E E years 6.36E E E+01 UOX MOX Total 1.00E Year Neutron Source for scenario 1b Neutron Source (neutron/sec/groupe/twhe) 1,00E+10 1,00E+09 1,00E+08 1,00E+07 5 years 2.63E E E years 4.94E E E years 2.92E E E years 2.31E E E+07 UOX MOX Total years 6.29E E E+07 1,00E Year 142
145 Scheme 1c UOX reprocessed (UREX) Pu, Np once cycling in MOX Fuel Characteristics and Mass Flows (kg/twhe) U nat : kg 1720kg U irr Enrichment UOX FUEL 1835kg PWR 90% UREX UOX kg U dep : kg 190 kg MOX + Np FUEL 215 kg Pu: 23 kg Np: 1.7 kg PWR 10% DISPOSAL Pu: kg Np: kg Am: 1.4 kg Cm: 0.25 kg PF: 116 kg U dep : kg STORAGE MOX: 215 kg U: 182 kg Pu: 16.8 kg Np: 0.84 kg Am: 1.43 kg Cm: 0.29 kg PF: 14 kg ENRICHMENT Natural Uranium Depleted Uranium Enriched Uranium FUEL Burn Up Ageing time Cooling time Pu, Np Content Fissile Pu REACTOR Thermal power Electrical power REPROCESSING Losses PWR/UOX 0.71% 235 U 0.25% 235 U 4.90% 235 U UOX 60 GWd/tHM 2 years 5 years PWR EPRtype MWth MWe UREX 0.1% U, Pu, Np 100% other MA, FP PWR/MOX 0.25% 235 U MOX with Np 60 GWd/tHM 2 years 5 years 11.5% 63% PWR EPR 100% MOX MWth MWe COMMENTS: 1. This scenario has been calculated by CEA on the basis of an EPR RMA for MOX fuel. 2. EPR 100% MOX has an increased moderation ratio up to For FP mass composition of irradiated MOX with Np fuel, MOX fuel has been used (same spectra). 143
146 Power for scenario 1c Power (Watt/TWhe) 1.00E E E E E+00 5years 5.41E E E years 1.19E E E years 1.12E E E years 2.64E E E+02 UOX MOX Total years 2.72E E E E Year Activity for scenario 1c Activity (TBq/TWhe) 1.00E E E E E+01 5years 5.02E E E years 1.32E E E years 4.92E E E years 3.47E E E+02 UOX MOX Total years 6.30E E E E Year Neutron Source (neutron/sec/groupe/twhe) 1,00E+10 1,00E+09 1,00E+08 1,00E+07 5 years 2.65E E E+09 Neutron Source for scenario 1c 50 years 4.97E E E years 2.94E E E years 2.33E E E+07 UOX MOX Total years 6.34E E E+07 1,00E Year 144
147 Scheme 1d UOX processed (OREOX) Fuel Characteristics and Mass Flows (kg/twhe) U nat :12178kg Enrichment U dep :10141kg UOX 2037kg PWR (72.7%) Cooling time 10 years U: kg Pu: 18.1 kg Np: 1.06 kg Am: 1.20 kg Cm: 0.04 kg FP: 73.4 kg OREOX processing U: 1924 kg Pu: 17.9 kg Np: 1.05 kg Am: 1.19 kg Cm: 0.04 kg FP: 52.3 kg STORAGE U: 19 kg Pu: 0.18 kg Np: 0.01 kg Am: 0.01 kg FP: 21.1 kg DUPIC Fuel CANDU (27.3%) STORAGE Spent DUPIC U: kg Pu: 16.6 kg Np: 1.09 kg Am: 0.69 kg Cm: 0.21 kg FP: 83.2 kg DISPOSAL UOX, HLW, ILW ENRICHMENT Natural Uranium Depleted Uranium Enriched Uranium FUEL Burn Up Ageing time Cooling time Pu Content/SPWRF Fissile Pu REACTOR Thermal power Electrical power REPROCESSING Losses PWR/UOX 0.71% 235 U 0.25% 235 U 3.50% 235 U UOX 35 GWd/tHM 10 years PWR MWth MWe OREOX 1% U, Pu, MA, FPs 100% Kr, Xe, Ru, Cs, I CANDU/DUPIC DUPIC 15 GWd/tHM 0.90% 68.40% CANDU MWth 713 MWe 145
148 Power for scenario 1d 1.00E , Power (W/TWhe) 1.00E E E , , , , E years Activity for scenario 1d 1.00E , Activity (TBq/TWhe) 1.00E E E E , , , , E years Neutron Source for scenario 1d 1,00E+10 Neutron Source (neutron/sec/twhe) 1,00E+09 1,00E+08 1,00E+07 1,00E+06 1,00E+05 UOX DUPIC 10 years 4.62E E E years 1.18E E E years 1.79E E E years 1.04E E E years 4.23E E E+07 1,00E+04 Total Year 146
149 Scheme 2a UOX and MOX-EU reprocessed (PUREX) Pu recycling Fuel Characteristics and Mass Flows (kg/twhe) U nat : kg Enrichment UOX FUEL 1475kg PWR 72% DISPOSAL Np: 1.6 kg Pu: 0.07 kg Am: 5.9 kg Cm: 1.3 kg PF: 128 kg PUREX UOX and MOXUE: kg U dep :15954kg MOX-UE FUEL 575 kg PWR 28% Pu: 69 kg U irr : kg ENRICHMENT Natural Uranium Depleted Uranium Enriched Uranium FUEL Burn Up Ageing time Cooling time Pu Content Fissile Pu REACTOR Thermal power Electrical power REPROCESSING Losses COMMENTS: PWR/UOX 0.71% 235 U 0.25% 235 U 4.90% 235 U UOX 60 GWd/tHM 2years 5years PWR EPRtype MWth MWe PUREX 0.1% U, Pu 100% MA, FP PWR/MOX-EU 0.71% 235 U 0.25% 235 U 3% 235 U MOX-EU 60 GWd/tHM 2years 5years 12% 56.8% PWR EPR100%MOX MWth MWe PUREX 0.1% U, Pu 100% MA, FP 1. For FP mass composition of irradiated MOX-EU fuel, MOX fuel has been used. 2. EPR MOX-EU has an increased moderation ratio up to
150 Power (Watt/TWhe) 1.00E E E E+01 5 years 4.34E E E+03 Power for scenario 2a 50 years 9.57E E E years 9.01E E E years 2.13E E E+02 UOX MOX Total years 2.22E E E E Year Activity (TBq/TWhe) 1.00E E E E E E+00 5years 4.03E E E+04 Activity for scenario 2a 50 years 1.06E E E years 3.95E E E years 2.79E E E+02 UOX MOX Total years 5.14E E E Year Neutron Source (neutron/sec/groupe/twhe)) 1,00E+11 1,00E+10 1,00E+09 1,00E+08 1,00E+07 5years 2.12E E E+10 Neutron source for scenario 2a 50 years 3.99E E E years 2.36E E E years 1.87E E E+08 UOX MOX Total years 5.09E E E+07 1,00E Year 148
151 Scheme 2b UOX and MOX reprocessed (Advanced PUREX) Am and Cm Partitioning Cmstorage PuandAmrecyclinginMOX-EU Fuel Characteristics and Mass Flows (kg/twhe) U nat :20607kg Enrichment UOX FUEL 1101kg PWR 54% DISPOSAL Np: 1.7 kg Pu: 0.07 kg Am: kg PF: 129 kg STORAGE Cm: kg U dep :18637kg MOX UE 1 FUEL 238 kg 238 kg PWR 11% ADVANCED PUREX UOX and MOXUE: kg Pu: 24 kg U irr : kg Storage after 100 years MOX-UE 2 FUEL 711 kg PWR 35% U: kg Pu: kg Am: kg Cm: kg Pu:48kg Am:8kg ENRICHMENT Natural Uranium Depleted Uranium Enriched Uranium FUEL Burn Up Ageing time Cooling time Pu Content Fissile Pu Am Content REACTOR Thermal power Electrical power REPROCESSING Losses PWR/UOX PWR/MOX-EU 1 PWR/MOX-EU % 235 U 0.25% 235 U 4.90% 235 U UOX 60 GWd/tHM 2 years 5 years PWR EPRtype MWth MWe Advanced PUREX 0.1% U, Pu, Am 100% Np, Cm, FP % 235 U 0.25% 235 U 3.48% 235 U MOXEU1 60 GWd/tHM 2 years 5 years 10% 42.8% PWR EPRtype 100% MOX MWth MWe Advanced PUREX 0.1% U, Pu, Am 100% Np, Cm, FP COMMENTS: 1. For FP mass composition of irradiated MOX-EU 1 and 2 fuel, MOX fuel has been used. 2. EPR MOX-EU 1 and MOX-EU 2 have an increased moderation ratio up to % 235 U 0.25% 235 U 5.85% 235 U MOXEU2 60 GWd/tHM 2 years 5 years 6.7% 42.8% 1.13% PWR EPRtype 100% MOX MWth MWe Advanced PUREX 0.1% U, Pu, Am 100% Np, Cm, FP
152 Power for scenario 2b Power (Watt/TWhe) 1.00E E E E E E-01 5years 2.80E E E E years 5.85E E E E years 1.78E E E E years 1.28E E E E-01 UOX MOX-UE1 MOX-UE2 Total years 5.93E E E E E Year Activity for scenario 2b Activity (TBq/TWhe) 1.00E E E E E E+00 5years 2.96E E E E years 7.80E E E E years 2.38E E E E years 1.18E E E E+00 UOX MOX-UE1 MOX-UE2 Total years 1.07E E E E E Year Neutron Source (neutron/sec/groupe/twhe) 1,00E+08 1,00E+07 1,00E+06 5 years 1.61E E E E+07 Neutron source for scenario 2b 1000 years 2.16E E E E years 7.93E E E E years 1,00E E+05 UOX 8.25E E years 5.58E E+04 1,00E+04 MOX-UE1 7.12E+04 MOX-UE2 4.15E+05 1,00E+03 Total 5.17E Year 150
153 Scheme 2c UOX and MOX reprocessed (Advanced PUREX) Am and Cm Partitioning Cm storage Am once through transmutation Fuel Characteristics and Mass Flows (kg/twhe) U nat : kg Enrichment UOX FUEL 905 kg PWR 44% DISPOSAL Pu: 0.08 kg Am: kg Np: 1.0 kg FP: 101 kg STORAGE Cm: 0.3 kg ADVANCED PUREX U irr: 1090kg 310 kg U dep : kg U dep : kg MOX FR FUEL 390 kg TARGETS 2.55 kg FR 56% Am: 2.55 kg UOX 905 kg MOX/FR 390 kg TARGETS DISPOSAL Pu: 0.11 kg Am: kg Cm: 0.11 kg FP: 2.3 kg Storage after 100 years U: kg Pu: kg Cm: kg Pu: 80 kg ENRICHMENT Natural Uranium Depleted Uranium Enriched Uranium FUEL Burn Up Ageing time Cooling time Pu Content REACTOR Thermal power Electrical power REPROCESSING Losses PWR/UOX FR/MOX Am TARGET 0.71% 235 U 0.25% 235 U 4.90% 235 U UOX 60 GWd/tHM 2years 5years PWR EPRtype MWth MWe Advanced PUREX 0.1% U, Pu, Am 100% Np, Cm, FP 0.25% 235 U MOX 140 GWd/tHM 2 years 5 years 18.6% FR EFR type MWth MWe Advanced PUREX 0.1% U, Pu, Am 100% Np, Cm, FP Am TARGET FR EFR type MWth MWe 151
154 Power for scenario 2c 1.00E+04 REP Power (Watt/TWhe) 1.00E E E E E-01 5years 2.30E E E E years 4.80E E E E years 1.46E E E E years 1.05E E E E+00 RNR CIBLES Total years 4.87E E E E E Year Activity for scenario 2c Activity (TBq/TWhe) 1.00E E E E E E+00 5years 2.43E E E E years 6.40E E E E years 1.95E E E E years 9.65E E E E+00 REP RNR CIBLES Total years 8.78E E E E E Year Neutron source for scenario 2c 1,00E+10 REP Neutron Source (neutron/sec/groupe/twhe) 1,00E+09 1,00E+08 1,00E+07 1,00E+06 1,00E+05 1,00E+04 5 years 1.32E E E E years 2.61E E E E years 2.57E E E E years 1.77E E E E+08 RNR CIBLES Total years 6.51E E E E+08 1,00E Year 152
155 Scheme 2c Variant UOX and MOX reprocessed (Advanced PUREX) Am and Cm Partitioning Am and Cm storage Fuel Characteristics and Mass Flows (kg/twhe) U nat : kg DISPOSAL Pu: 0.08 kg Np: 1.0 kg FP: 101 kg STORAGE Am: 2.55 kg Cm: 0.3 kg Enrichment UOX FUEL 905 kg PWR 44% U dep : kg U dep : kg 310 kg MOX FR FUEL 390 kg FR 56% ADVANCED PUREX UOX 905 kg MOX/FR 390 kg U irr : kg Storage after 100 years U: kg Np: kg Pu: kg Am: kg Cm: kg Pu: 80 kg ENRICHMENT Natural Uranium Depleted Uranium Enriched Uranium FUEL Burn Up Ageing time Cooling time Pu Content REACTOR Thermal power Electrical power REPROCESSING Losses PWR/UOX 0.71% 235 U 0.25% 235 U 4.90% 235 U UOX 60 GWd/tHM 2years 5years PWR EPRtype MWth MWe Advanced PUREX 0.1% U, Pu, MA 100% FP FR/MOX 0.25% 235 U MOX 140 GWd/tHM 2 years 5 years 18.6% FR EFR type MWth MWe Advanced PUREX 0.1% U, Pu, MA 100% FP 153
156 Power for scenario 2c variant Power (Watt/TWhe) 1.00E E E E E+00 5 years 2.34E E E years 4.88E E E years 1.49E E E years 1.07E E E-01 REP RNR Total years 4.95E E E E E Year Activity for scenario 2c variant Activity (TBq/TWhe) 1.00E E E E E+01 5 years 2.47E E E years 6.51E E E years 1.99E E E years 9.87E E E+00 REP RNR Total years 8.98E E E E E Year Neutron source for scenario 2c variant Neutron Source (neutron/sec/groupe/twhe) 1,00E+07 1,00E+06 1,00E+05 1,00E+04 5years 1.34E E E years 2.66E E E years 2.61E E E years 1.80E E E+04 REP RNR Total years 6.62E E E+04 1,00E Year 154
157 Scheme 3a TRU Burning in FR UOX reprocessed (UREX) Metal reprocessed (PYRO) TRU partitioning and homogeneous transmutation Fuel Characteristics and Mass Flows (kg/twhe) U nat :12991kg U irr : 1413 kg Enrichment U dep :11478kg UOX FUEL 1513kg PWR (63.2%) UREX (UOX) FP, HM losses Pu + MA WASTE U: kg Pu: kg Np: kg Am: kg Cm: kg FP: kg FR FUEL 289 kg FR (36.8%) PYRO (metal 78Ac-22Zr) FP, HM losses Actinides Disposal ENRICHMENT Natural Uranium Depleted Uranium Enriched Uranium FUEL Burn Up Ageing time Cooling time Pu Content MA Content REACTOR Thermal power Electrical power REPROCESSING Power Source Losses COMMENTS: PWR/UOX 0.71% 235 U 0.25% 235 U 4.20% 235 U UOX 50 GWd/tHM 2 years 4 years PWR MWth MWe UREX 3.5 W/kgHM 1. E6 n/s-kghm 0.1% U, Pu, MA 100% FP FR/METAL 0.25% 235 U FR METAL AcZr 140 GWd/tHM 1 year 2 years 29.1% 3.9% FR MWth 600 MWe PYRO 46 W/kgHM 86. E6 n/s-kghm 0.1% U, Pu, MA 100% FP 1. For FP mass composition of the irradiated metallic fuel, the values calculated by PSI have been used. 155
158 Power for scenario 3a Power (Watt/TWhe) 1.00E E E E E E-01 5 years 2.78E E E years 6.61E E E years 2.02E E E years 1.35E E E-01 UOX FR-metal Total years 4.19E E E E Year Activity for scenario 3a Activity (TBq/TWhe) 1.00E E E E E+01 5 years 3.14E E E years 8.82E E E years 2.69E E E years 1.32E E E+00 UOX FR-metal Total years 1.18E E E E E Year Neutron source (neutron/sec/groupe/twhe) 1,00E+08 1,00E+07 1,00E+06 1,00E+05 1,00E+04 1,00E+03 5 years 1.73E E E+07 Neutron Source for scenario 3a 50 years 3.31E E E years 1.95E E E years 9.63E E E years 4.52E E E Year UOX FR-metal Total 156
159 Scheme 3b Double Strata UOX, MOX and FR(MOX) reprocessed (PUREX) Pu once recycling in PWR (MOX) Pu multi recycling in FR(MOX) Pu and MA partitioning and homogeneous transmutation ADS (nitride) Fuel reprocessed (PYRO) Fuel Characteristics and Mass Flows (kg/twhe) Enrichment U nat :13561kg FP, HM losses UOX Fuel 1579kg U dep :11757kg MOX Fuel 236 kg PWR (66%) PWR (9.8%) Pu 19 kg PUREX (UOX) (U irr : 1476 kg) PUREX (MOX) (U irr : 208 kg) Pu MA Pu MA WASTE U: kg Pu: Np: Am: Cm: FP: Pu 47 kg Pu FR Fuel kg FR (19%) Actinides 46 kg PUREX (MOX) MA Disposal ADS Fuel 46.2 kg ADS (5.2%) PYRO (29AcN-71ZrN) Actinides FP, HM losses ENRICHMENT Natural Uranium Depleted Uranium Enriched Uranium FUEL Burn Up Ageing time Cooling time Pu Content MA Content REACTOR Thermal power Electrical power REPROCESSING Losses PWR/UOX PWR/MOX FR/MOX ADS Nitride 0.71% 235 U 0.25% 235 U 4.20% 235 U UOX 50 GWd/tHM 2 years 4 years PWR N4 type 4250MWth 1450MWe Advanced PUREX 3.5 W/kgHM 1. E6 n/s-kghm 0.1% U, Pu, AM 100% FP 0.25% 235 U 0.25% 235 U MOX 50 GWd/tHM 2 years 5 years 8% PWR N4 type 4250MWth 1450MWe Advanced PUREX 6.3 W/kgHM 11. E6 n/s-kghm 0.1% U, Pu, AM 100% FP FR MOX 185 GWd/tHM 2 years 5 years 44.4% FR EFR Type 3600MWth 1450MWe Advanced PUREX 21.8 W/kgHM 40 E6 n/s-kghm 0.1% U, Pu, AM 100% FP ADS Nitride 150 GWd/tHM 1 years 2 years 40.5% 55% ADS JAERI Type Lead Bismuth cooled system PYRO 455 W/kgHM E6 n/s-kghm 0.1% U, Pu, AM 100% FP COMMENTS: 1. For FP mass composition of the irradiated ADS fuel, PSI calculated values have been used. 2. For mass composition of the irradiated PWR-MOX and FR-MOX fuels, a 5 years cooling time versus a 7 years cooling time value has been recalculated. 3. For the FR, a metal fuel reprocessed by pyro could be considered as an alternative. 157
160 Power (Watt/TWhe) 1.00E E E E E E-01 5 years 2.91E E E E E+03 Power for scenario 3b 50 years 6.93E E E E E years 2.16E E E E E years 2.66E E E E E-01 REP-UOX REP-MOX FR-MOX ADS-nitr Total years 4.39E E E E E E Year Activity (TBq/TWhe) 1.00E E E E E E+00 5years 3.29E E E E E+04 Activity for scenario 3b 50 years 9.23E E E E E years 2.82E E E E E years 1.52E E E E E+00 REP-UOX REP-MOX FR-MOX ADS-nitr Total years 1.23E E E E E E Year 1,00E+09 Neutron Source for scenario 3b Neutron Source (neutron/sec/groupe/twhe) 1,00E+08 1,00E+07 1,00E+06 1,00E+05 1,00E+04 1,00E+03 1,00E+02 1,00E+01 1,00E+00 5 years 1.83E E E E E+07 REP-UOX REP-MOX FR-MOX ADS-nitr Total 50 years 3.64E E E E E years 3.45E E E E E years 1.40E E E E E years 4.72E E E E E Year 158
161 Scheme 3b Variant Double Strata UOX and MOX reprocessed (PUREX) Pu once recycling in PWR(MOX) TRU partitioning and homogeneous transmutation ADS fuel reprocessed (PYRO) Fuel Characteristics and Mass Flows (kg/twhe) U nat :15328kg Enrichment FP, HM losses UOX Fuel 1785kg PWR 75.1% PUREX (UOX) (U irr : 1667 kg) MA Pu U dep :13318kg MOX Fuel 225 kg PWR 9.4% Pu 22 kg PUREX (MOX) (U irr : 198 kg) MA Pu WASTE U: kg Pu: kg Np: kg Am: kg Cm: kg FP: 122 kg Pu 13 kg Actinides 104 kg ADS Fuel 117 kg ADS 15.5% PYRO (29AcN-71ZrN) Actinides Disposal FP, HM losses ENRICHMENT Natural Uranium Depleted Uranium Enriched Uranium FUEL Burn Up Ageing time Cooling time Pu Content TRU Content REACTOR Thermal power Electrical power REPROCESSING Losses PWR/UOX PWR/MOX ADS/Nitride 0.71% 235 U 0.25% 235 U 4.20% 235 U UOX 50 GWd/tHM 2 years 4 years PWR French N MWth MWe Extended PUREX 0.1% U, Pu, MA 100% FP 0.25% 235 U MOX 50 GWd/tHM 2 years 5 years 10% PWR French N MWth MWe Extended PUREX 0.1% U, Pu, MA 100% FP ADS Nitride 150 GWd/tHM 1 years 2 years 42.3% ADS JAERI Type Lead Bismuth cooled system PYRO 0.1%U, Pu, MA 100% FP COMMENTS: 1. For FP mass composition of the irradiated ADS fuel, PSI calculated values have been used. 2. For mass composition of the irradiated PWR-MOX and FR-MOX fuels, a 5 years cooling time versus a 7 years cooling time value has been recalculated. 159
162 Power for scenario 3b variant Power (Watt/TWhe) 1.00E E E E E E-01 5 years 3.39E E E E years 8.06E E E E years 2.45E E E E years 1.54E E E E-01 REP-UOX REP-MOX ADS-nitr Total years 5.29E E E E E Year Activity for scenario 3b variant Activity (TBq/TWhe) 1.00E E E E E E+00 5years 3.83E E E E years 1.08E E E E years 3.28E E E E years 1.59E E E E+00 REP-UOX REP-MOX ADS-nitr Total years 1.44E E E E E Year Neutron Source for scenario 3b variant Neutron Source (neutron/sec/groupe/twhe) 1,00E+09 1,00E+08 1,00E+07 1,00E+06 1,00E+05 1,00E+04 1,00E+03 5 years 1.83E E E E+08 REP-UOX REP-MOX ADS-nitr Total 50 years 3.67E E E E years 3.99E E E E years 2.73E E E E years 9.26E E E E Year 160
163 Scheme 3c Variant 1 Carbide fuel reprocessed (PYRO) TRU partitioning and homogeneous transmutation Fuel Characteristics and Mass Flows (kg/twhe) U dep :86kg Solid Solution FUEL (U,Pu)C; SiC 849 kg GCFR PYRO Reprocessing PYRO WASTE U: kg Pu: kg Np: kg Am: kg Cm: kg FP: 86 kg Cooling time: 5 years U, Pu, Am, Cm, Np Pu: 149 kg Np: 0.9 kg Am: 6.7 kg Cm: 1.8 kg FP: 86 kg U: 605 kg Disposal ENRICHMENT Natural Uranium Depleted Uranium Enriched Uranium FUEL Burn Up Pu Content MA Content Ageing time Cooling time REACTOR Thermal power Electrical power REPROCESSING Losses GCFR/Carbide 0.25% 235 U Solid Solution: (U, Pu)C; SiC 100 GWd/tHM 17.6% 1.1% 2 years 5 years GCFR (He) MWth MWe PYRO 0.1% U, Pu, MA 100% FP COMMENTS: 1. For FP mass composition of the irradiated CERCER fuel, MOX EFR fuel with a five year cooling time has been used (same spectra) with a mass normalisation. 161
164 Power for scenario 3c variant1 1.00E+04 Power (Watt/TWhe) 1.00E E E E+00 5 years 2.66E years 5.71E years 1.93E years 2.75E E years 7.94E E Year Activity for scenario 3c variant1 1.00E E+04 5 years 3.22E+04 Activity (TBq/TWhe) 1.00E E years 7.90E years 2.47E E years 2.28E years 1.65E E Year Neutron Source for scenario 3c variant1 1.00E+08 Neutron Source (neutron/sec/twhe) 1.00E E+06 5 years 1.85E years 5.19E years 2.35E years 2.10E years 9.35E E Year 162
165 Scheme 3c Variant 2 MOX reprocessed (Extended PUREX) TRU partitioning and homogeneous transmutation Fuel Characteristics and Mass Flows (kg/twhe) U irr : 640 kg U dep :739kg MOX FUEL 890 kg FR EXTENDED PUREX 890 kg Cooling time: 5years Pu: 143 kg Np: 0.75 kg Am: 6.25 kg Cm: 1.5 kg FP: 98.4 kg Pu, Am, Cm, Np DISPOSAL WASTE Pu: 0.14 kg Np: kg Am: kg Cm: kg PF: 98.4 kg ENRICHMENT Natural Uranium Depleted Uranium Enriched Uranium FUEL Burn Up Ageing time Cooling time Pu Content MA Content REACTOR Thermal power Electrical power REPROCESSING Losses FR/MOX 0.25% 235 U MOX 140 GWd/tHM 2 years 5 years 16% 1% FR EFR type MWth MWe ADVANCED PUREX 0.1% U, Pu, MA 100% FP 163
166 Neutron Source for scenario 3c variant2 1,00E+08 1,00E+07 5 years 2.37E years 5.95E years 2.24E+06 1,00E years 2.51E years 9.62E+05 1,00E Year Power for scenario 3c variant2 1.00E E+03 5years 4.27E years 8.34E+02 Power (Watt/TWhe) 1.00E E E years 2.75E years 8.27E years 3.02E E E Year Activity for scenario 3c variant2 1.00E E+04 5 years 5.17E years 1.16E+04 Activity (TBq/TWhe) 1.00E E E years 3.63E years 2.88E years 2.22E E Year 164
167 Appendix D OREOX PROCESS FOR THE FABRICATION OF DUPIC FUEL AND THE RELATED WASTE TYPES The DUPIC (Direct Use of Spent PWR Fuel in CANDU Reactors) fuel cycle is based upon dry thermal and mechanical processes to directly fabricate CANDU (Canada Deuterium Uranium) fuel from spent PWR fuel material without separating the fissile material and fission products. This concept was proposed and termed the DUPIC fuel cycle in a joint development programme involving KAERI (Korea Atomic Energy Research Institute), AECL (Atomic Energy Canada Limited) and the US Department of State in 1991 [1]. Since then, KAERI, AECL and the United States, with the participation of IAEA, have been engaged in a practical exercise to verify the concept. The fissile material that typically remains in spent PWR fuel exceeds the natural uranium fissile content of wt%. The neutron economy of a CANDU reactor is sufficient to allow DUPIC fuel to be used in a CANDU reactor which is originally designed for natural uranium fuel, even though the neutron-absorbing fission products remain as impurities in the DUPIC fuel. The DUPIC fuel cycle offers several benefits to countries operating both PWR and CANDU reactors. The benefits include the additional energy extracted from the fuel in a CANDU reactor, efficient natural uranium utilisation, and a significant reduction in spent fuel arisings through a proliferation resistant process of reusing spent PWR fuel [2]. The general compatibility and safeguardability of the DUPIC fuel cycle were confirmed in a broad feasibility study, and the OREOX (Oxidation and Reduction of Oxide fuel) process was selected as the most promising fabrication method for DUPIC fuel [3]. This OREOX process is the heart of the DUPIC fuel cycle and the key feature in the DUPIC fuel fabrication. The latter differs from the conventional CANDU fuel fabrication process in that it has to be done in a shielded facility because the fuel material remains highly radioactive throughout the process [4]. In the following, the feasibility of the concept was confirmed in an experimental verification programme. To verify the in-reactor performance of the DUPIC fuel, a comprehensive fuel development programme was carried out, including irradiation tests in the NRU reactor in Canada and in HANARO in the Republic of Korea [5]. In the DUPIC fuel cycle, schematically shown in Figure D.1 [6], spent PWR fuel having a nominal burn-up of 35 MWd/kg discharged from a PWR could be stored for about 10 years prior to being processed into CANDU fuel. The spent PWR fuel re-fabricated by the OREOX process, could achieve an additional 15 MWd/kg burn-up in a CANDU reactor. The spent DUPIC fuel discharged from the CANDU reactor would be cooled for 50 years in an interim storage facility and then disposed of. 165
168 Figure D.1. Schematic flow sheet of DUPIC fuel cycle Mining/ Milling Conversion Enrichment LEU Fuel Fabrication PWR -yr) DUPIC Fuel Fabrication CANDU - AFR Storage Permanent Disposal As shown in Figure D.2, the key process of the DUPIC fuel cycle is oxidation and reduction of oxide fuel (OREOX) for preparing spent PWR fuel powder to be fabricated CANDU fuels, which is a dry process inherently having no steps to separate any fissile isotopes from the spent PWR fuel. Figure D.2. Schematic drawing of DUPIC fuel fabrication process Spent PWR Fuel Fuel Rods Cut to Size Skeleton Volatiles Decladding Cladding Hulls Oxidation/Reduction Volatiles & Semi-volatiles Pelletizing/Sintering Structural Parts Welding DUPIC Fuel Rods DUPIC Fuel Bundle As shown in this figure, the fabrication process begins with disassembling of the spent PWR fuel assembly to extract the fuel rods. The fuel pellet is recovered from the rod by decladding using a mechanical and thermal method. The fuel pellet is then subjected to several cycles of OREOX process to produce resinterable powder feedback. During the oxidation and reduction treatment, the fuel pellet is pulverised to fine powder due to crystallographic transformation in the pellet matrix which causes volume changes and develops more micro-crack in a particle. Once the resinterable powder is 166
169 prepared, the pellet and rod manufacturing processes are almost the same as the conventional powder/pellet route in CANDU fuel fabrication except all the processes must be done remotely in the shielded hot cells. The main DUPIC fuel fabrication campaign has been performed at DUPIC fuel development facility (DFDF) using spent PWR fuel (G23 assembly discharged from Gori Unit #1 in 1986; burnup 35.5 GWD/tU) since January Until now, nearly one thousand DUPIC fuel pellets were made for the fabrication experiments and the fuel pellet irradiation tests. Twelve elements were manufactured for the irradiation tests in HANARO and for the verification of the DUPIC fuel fabrication technology [7]. A series of DUPIC fuel element fabrication experiments are being performed for the further improvement of the fabrication technology and for more irradiation tests to evaluate the DUPIC fuel performance. The main waste stream is coming from the DUPIC fuel fabrication process, which mainly consists of metallic components from spent PWR fuel, and the fission gases and semi-volatile fission products released from the bulk fuel material treatment, in addition to the measurable discards and losses such as cladding hulls, trapped or collected fission gases, vitrified Cs/Ru and dirty scrap, and other miscellaneous waste. The projected waste generation for a 400 thm/yr facility is summarised in Table D.1, assuming that the process loss rate is 1% [6]. Also the estimated generation rates of waste from the DUPIC fuel fabrication plant, based on the electricity of one TWhe produced by the DUPIC fuel cycle, are included in this table. Table D.1. Projected annual waste generation in DUPIC facility (400 thm/yr) Waste constituent Waste form Volume for disposal package 3 H, 14 C Kr, Xe Iodine Dirty scrap Cs, Ru SpentfuelH/W Zircalloy hulls Miscellaneous waste Total LLW (Generation rate) Total ILW (Generation rate) Total HLW (Generation rate) 200 litres cemented drums Compressed 50 litres cylinders Silver zeolites Vitrified Vitrified Compacted Cemented Cemented 80.0 m m m m m m m m m 3 (5.91 m 3 /TWhe) 79 m 3 (0.55 m 3 /TWhe) 50 m 3 (0.35 m 3 /TWhe) On the other hand, the generation rates of the waste coming from the decommissioning of this plant was estimated under assuming that the waste from this plant be very similar to those from a MOX fuel fabrication plant without any process for blending and co-precipitating uranium and plutonium solutions, and with the additional processes for the mechanical and thermal decladding, and for resinterable powder preparation. Based on the small scale MOX fuel fabrication facility [8] and on the additional processes, and assuming that the portion of ILW be 62.7% of the decommissioning waste [9], the rates were estimated to be about 0.61 m 3 /TWhe for ILW and 0.36 m 3 /TWhe for LLW. The major R&D items in the near future will include: 1) data accumulation related to the fuel performance, 2) improvement of NDA system related to the accountability of fissile materials to reduce measurement error, 3) improvement of productivity including economics and 4) a safe management of the produced waste [10]. 167
170 References [1] Yang, M.S. et al. (1997), Characteristics of DUPIC Development in Korea, Proc. Int. Conf. on Future Nuclear Systems (Global 97), Yokohama, Japan, pp [2] Sullivan, J.D. et al. (1999), Benefits of the DUPIC Fuel Cycle Strategy,Proc.Int.Conf.onFuture Nuclear Systems (Global 99), 29 August-3 September 1999, Jackson Hole, Wyoming, USA. [3] Lee, J.S. et al. (1993), Research and Development Program of KAERI for DUPIC, Proc.Int. Conf. on Future Nuclear Systems (Global 93), Seattle, Washington, pp [4] Lee, J.W. et al. (2001), DUPIC Fuel Fabrication in Shielded Facilities in Korea, Proc. 7 th CANDU Fuel Conference, Kingston, Canada, p [5] Song, K.C., Lee, J.W. and Yang, M.S. (2003), Performance evaluation of DUPIC fuel using a research reactor, Proc. GLOBAL 2003, November 2003, New Orleans, Louisiana, USA. [6] Ko, W.I., Kim, H.D. and Yang, M.S. (2002), Radioactive waste arisings from various fuel cycle options, J. Nucl. Sci. Tech., Vol. 39, No. 2, pp [7] Lee, J.W. et al. (2003), KAERI s experience in developing the DUPIC fuel technology. [8] Elder, H.K. (1985), Technology, safety and costs of decommissioning reference nuclear fuel cycle facilities, NUREG/CR [9] ERDA (1976), Alternative for managing wastes from reactors and post-fission operations in the LWR fuel cycle, ERDA [10] Chun, K.S. and Yang, M.S. (2003), Innovative nuclear fuel cycle approaches using DUPIC, Technical Specialist Meeting on Innovative Nuclear Fuel Cycles, IAEA, Vienna. 168
171 Appendix E SIMPLIFIED BLOCK DIAGRAMS OF REPROCESSING PROCESSES Simplified block diagram of the Extented PUREX partitioning process U Pu Np Tc I Am Cm Spent fuel PUREX Am/Cm separation HA Solution DIAMEX/SANEX FP Source: NEA (2005), Actinide and Fission Product Partitioning and Transmutation, Boullis, B.; Lecomte, M.; Ranchoux, M.; Baron, P.; Rostaing, C.; Warin, D. and Madic, C., CEA Actual Demonstration Programme for Actinide Partitioning, Proceedings of 8 th Information Exchange Meeting on, Las Vegas, Nevada, USA, 9-11 November 2004, OECD, Paris. PUREX process. A new flow-sheet has been designed in order to be able to extract the neptunium with a high yield, together with the uranium and plutonium. DIAMEX process. This process, based on the use of the DMDOHEMA diamide extractant will co-extract the trivalent minor actinides, An(III) = Am and Cm, together with the lanthanides (Ln) fission products from the high active raffinate issuing the implementation of the PUREX process. DIAMEX-SANEX process. This process, based on the use of a mixture of DMDOHEMA and an acidic organophosphorous extractant (HDEHP) will permit to separate the An(III) vs the most abundant Ln(III) from the product issued from the implementation of the DIAMEX process. 169
172 Simplified block diagram of the UREX+ partitioning process UREX U Tc CCD-PEG Cs/Sr NPEX Np/Pu TRUEX Zr, noble metals Cyanex 301 Am/Cm Rare earths Source: Vandegrift, G.F.; Regalbuto, Monica, C.; Aase, S.B.; Arafat, H.A.; Bakel, A.; Bowers, D.; Byrnes, J.P.; Clark, M.A.; Emery, J.W.; Falkenberg, J.R.; Gelis, A.V.; Hafenrichter, L.; Leonard, R.; Pereira, C.; Quigley, K.J.; Tsai, Y.; Vander Pol, M.H. and Laidler, J.J. (2004), Lab-Scale Demonstration of the Urex+ Process, Waste Management Symposium, 29 February- 4 March 2004, Tucson, AZ. The UREX+ process is a series of five solvent-extraction flowsheets that perform the following operations: (1) recovery of Tc and U (UREX), (2) recovery of Cs and Sr (CDC-PEG), (3) recovery of Pu and Np (NPEX), (4) recovery of Am, Cm, and rare-earth fission products (TRUEX), and finally (5) separation of Am and Cm from the rare earths (Cyanex 301). 170
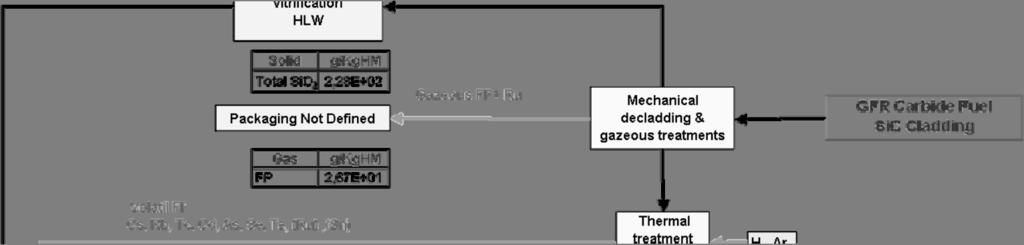
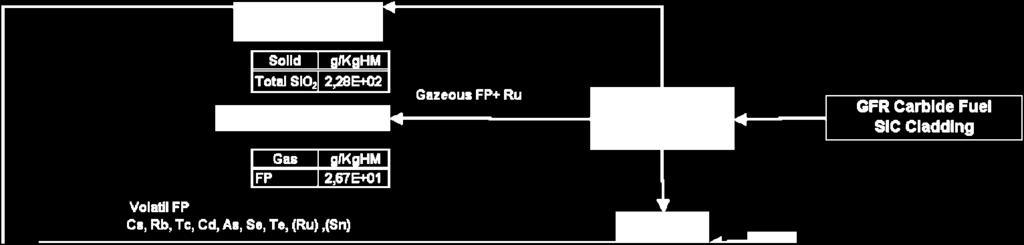
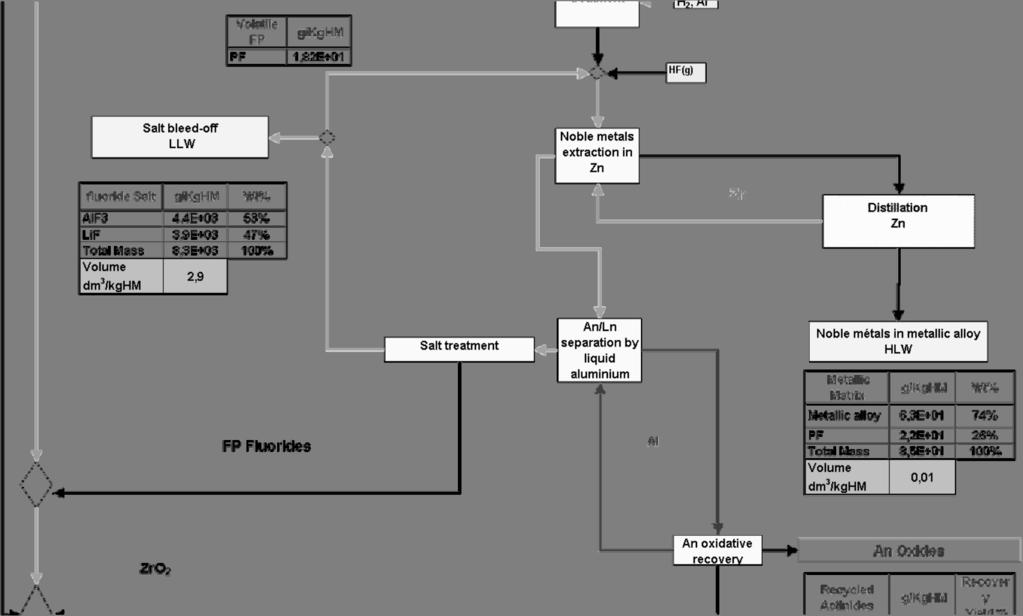
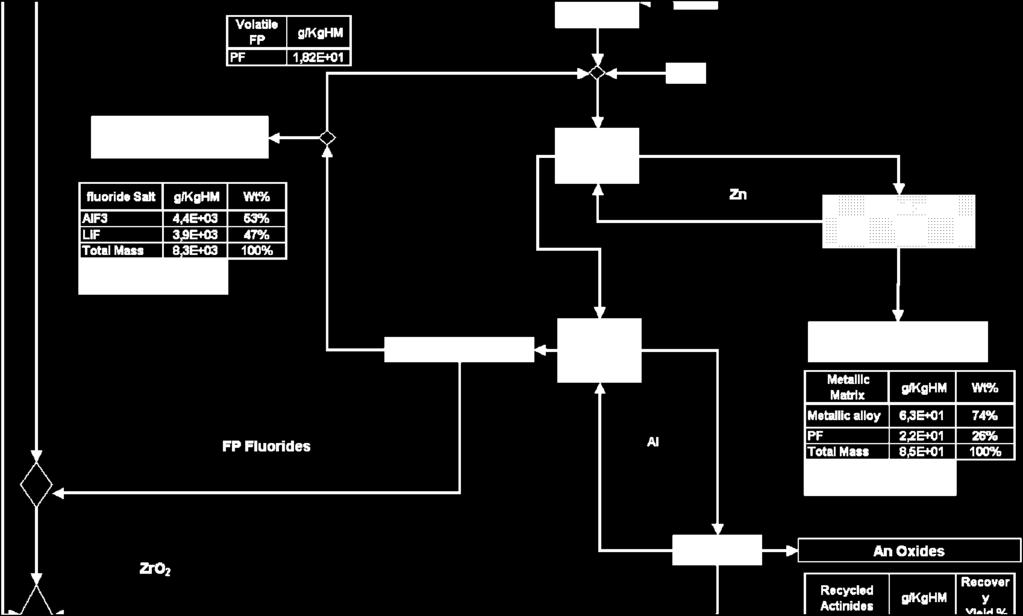
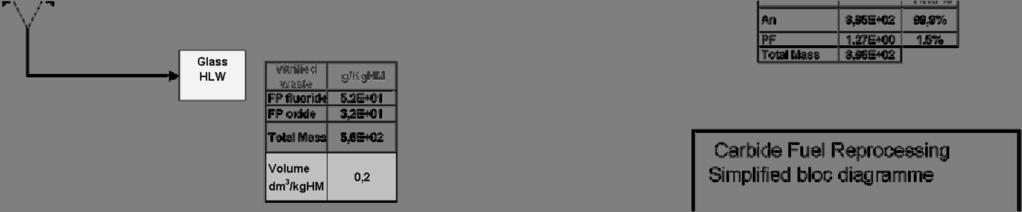
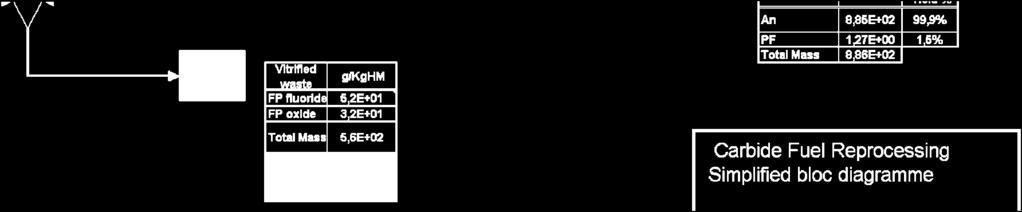
173 Simplified block diagram of carbide fuel reprocessing Source: CEA. 171
174 Simplified block diagram of nitride fuel reprocessing PUREX reprocessing PUREX reprocessing 4 Group partitioning Actinides 1. End piece Dry reprocessing 2. Rare gas 3. Cladding Dismantle and cut Electrolysis refining Actinides Actinide burner Actinide burner 4. Salt Fuel manufacture Actinides 5. Noble metal 6. Miscellaneous Waste Examples of advanced PUREX processes * Use of supercritical CO 2 Supercritical separation may reduce volume of highly radioactive waste LWR spent fuel SC CO 2 extraction Storage fuel fabrication TRU extraction MA burning Hulls, fines Waste conditioning Repository Source: Carrott, Mike J., Waller, Brenda E., Smart Neil G. and Wai, Chien M. (2001), Reprocessing of Spent Nuclear Fuel in SC-CO 2, Chem. Commun. 172
175 The extractant oxidises uranium(iv) to uranium(vi) to form a complex that is very soluble ( M) in supercritical CO 2. Solid uranium dioxide, a nuclear fuel, dissolves in supercritical CO 2 containing a complex of tri-n-butylphosphate (TBP) and nitric acid. No aqueous solution or organic solvent needed. The resulting uranyl-nitrate-tbp complex is recovered by reducing the fluid pressure to atmospheric pressure and then allowing the gas to expand into a collection vial. * U crystallisation LWR Spent Fuel Actinide crystallisation Storage fuel fabrication PUREX extraction TRU extraction MA burning Hulls, fines Waste conditioning Repository Source: Jarvinen, G., Villareal, B., Ford, D., Long, K. (2003), Actinide Crystallisation Process, LANL. Dissolve spent fuel in nitric acid. Crystallise uranyl nitrate at -20 to -40 C by evaporative concentration. Several recrystallisation-washing steps needed to obtain desired decontamination. U can be separated alone, leaving Pu and Np with the fission products. Under oxidising conditions U(VI), Pu(VI) and Np(VI) can be co-crystallised and separated later by changing the oxidation state. 173
176
177 Appendix F MANAGEMENT OF DEPLETED AND SEPARATED URANIUM Introduction Depleted uranium (DU) has a 235 U content of less than the wt% value found in natural uranium. Over 95% of the global stocks of DU (~1.2 million tu) are produced as uranium hexafluoride tails from the operation of gas diffusion and centrifuge uranium enrichment plants. The largest holders of depleted UF 6 are the United States with ~ tu and the Russian Federation with ~ tu (NEA and IAEA, 2001). Minor separated uranium (SepU) stocks have arisen from reprocessing of spent nuclear fuels, commonly Magnox fuels (DU with < 0.5 wt% 235 U) and high burn-up gas cooled or light water reactor fuel (DU with > 0.5 wt% 235 U) (NEA and IAEA, 2001). Separated uranium trioxide UO 3 is commonly produced during the PUREX or tributyl phosphate plutonium uranium reduction extraction process, which separates uranium as uranyl nitrate solution. This can be concentrated and de-nitrified to form UO 3 solid product. In the United States this was typically packed into plastic bags and placed in 55-gallon steel drums with a plastic liner for storage. SepU salt precipitates e.g. ammonium diuranate, have also been produced from the reprocessing of spent fuel e.g. from fast breeder reactors. These stocks of separated uranium that come from fuel processing typically have significantly higher radioactivity levels than DU from enrichment, primarily due to 236 U. Because of this, the storage and disposal requirements may differ, making it important to differentiate these materials. Traces of DU may also be present in the highly radioactive liquid raffinate waste but these are not considered here. Some properties of depleted uranium compounds from enrichment plants The most important chemical characteristics of the various DU compounds derived from enrichment plants are their potential solubilities and reactions in water. The chemical properties of these DU compounds under ambient conditions (e.g. Biwer et al., 2000; USDOE, 1999; Duerksen et al., 2000) are briefly summarised below: DUF 6 uranium hexafluoride is a solid at ambient pressure (m.pt. 64 C) and reacts easily with water to form uranyl fluoride UO 2 F 2 and hydrofluoric acid (HF), which is highly chemotoxic and corrosive; DUF 6 is stored as a solid in air- and water-tight containers to stop hydrolysis. DUF 4 very slightly soluble this non-volatile solid compound reacts slowly with moisture to form DUO 2 and HF and eventually other oxides and minerals. Steel container corrosion can be enhanced by the presence of HF in the DUF 4. DUO 2 insoluble finely divided DUO 2 i.e. uranium dioxide powder can be pyrophoric in air; granules and pellets are not pyrophoric; DUO 2 reacts very slowly with oxygenated groundwater to yield more stable oxides e.g. DU 3 O 8, and eventually, minerals; DUO 2 is ideal for disposal in reducing geological environments. 175
178 DU 3 O 8 insoluble uranium sesquioxide reacts very slowly with oxygenated groundwater to yield more stable uranium minerals; this oxide is very stable, non-corrosive and passively safe for long-term storage; as a conversion product from DUF 6, it tends to be a fine particulate or powder, which may not be a suitable form for waste packaging for disposal, if it is to be regarded as waste. DU metal insoluble reacts slowly with moisture to form oxides in the presence of oxygen; condensed water moisture promotes the generation of H 2 and uranium hydride, UH 3, which is highly flammable; DU may form pyrophoric surface in the absence of oxygen; oxide layers normally spall to reveal fresh metal surfaces. Some properties of separated uranium compounds from reprocessing plants SepU compounds derived from reprocessing plants usually contain radionuclide impurities (fission products and alpha-emitters such as americium, curium, neptunium and plutonium) which can render the compounds as intermediate-level radioactive waste. Chemical impurities are also common e.g. phosphate and sodium. UO 3 insoluble solid uranium trioxide reacts very slowly with oxygenated groundwater to yield more stable oxides e.g. U 3 O 8, and eventually, minerals. ADU insoluble salt ADU i.e. ammonium diuranate (NH 4 ) 2 U 2 O 7 canbestoredasaflocin tanks, e.g. at Dounreay, United Kingdom. It can be easily heated to expel ammonia gas to yield UO 3 ; also it is easy to convert it to other salts e.g. Na and Ca, for storage or cementation prior to disposal. Management of separated uranium from reprocessing operations United States The USDOE has a depleted UF 6 management programme to manage the DOE s inventory of DUF 6 in a way that protects the health and safety of workers and the public, and protects the environment until the DUF 6 is either used or disposed. The programme involves three primary activities: cylinder surveillance and maintenance; conversion of DUF 6 to a more stable chemical form for use or disposal; and development of beneficial uses of depleted uranium (see The final programmatic environmental impact statement (PEIS) for alternative strategies for the long-term management and use of depleted uranium hexafluoride assesses the potential impacts of alternative management strategies for DUF 6 currently stored at three DOE sites: Paducah site, Kentucky, Portsmouth site, Ohio, and K-25 site on the Oak Ridge Reservation, Tennessee. The alternatives analysed in the PEIS include no action, long-term storage as DUF 6, long-term storage as uranium oxide, use as uranium oxide, use as uranium metal, and disposal. The DOE s preferred alternative is to begin conversion of the DUF 6 inventory as soon as possible, either to uranium oxide, uranium metal, or a combination of both, while allowing for use of as much of this inventory as practicable (USDOE, 1999). Along with the impacts from other management options, the PEIS discussed the environmental impacts from the disposal of depleted uranium oxide from conversion of DUF 6. The impacts were evaluated for three disposal facility options: shallow earthen structures, belowground vaults, and 176
179 mines. These were evaluated for a dry environmental setting representative of the western United States e.g. the Nevada Test Site (NTS). The environmental impacts of the same options for disposal of DUF 4 have also been aired (ANL, 2001). The DU products are considered to be low-level waste (LLW) under both DOE orders and Nuclear Regulatory Commission (NRC) regulations. The four potential forms of DU (DU metal, DUF 4, DUO 2,andDU 3 O 8 ) are considered to be acceptable for nearsurface disposal at sites at the NTS, although each form has a degree of uncertainty regarding acceptability for disposal with the uncertainty decreasing in the order: metal, UF 4,UO 2,U 3 O 8 (Croff et al., 2000). While DU may qualify for disposal as LLW by US NRC regulations, disposal of large quantities in shallow land burial may cause the site to violate US EPA ground water standards. For this reason, there have been suggestions to create a regulatory framework for greater confinement disposal to accommodate DU (and separated U), such as placement in abandoned deep mines. France To meet general French safety requirements related to environmental protection issues, COGEMA commissioned an industrial facility in 1984 to convert DUF 6 into DU 3 O 8 for safe interim storage. The by-product is high purity aqueous hydrofluoric acid (70% HF) which is sold on to other industries in Europe. A second facility was commissioned in 1993, doubling the capacity. Improvement work has been performed over the years e.g. optimising the de-fluorination output, reducing the corrosion inside the kilns, improving the uranium oxide powder compaction factor etc. Up to the end of 2000, about tons of DUF 6 had been de-fluorinated (Hartmann et al., 2001). United Kingdom and other countries About 60% of the United Kingdom stockpile of DU is in the DUF 6 form. BNFL in the United Kingdom has about tu of DUF 6 and is considering a conversion plant for DU metal. Russia is also considering conversion technologies for its ~ tu of DUF 6. Japan has about tu of DUF 6 and is planning to build a conversion plant to store DU sesquioxide as a future energy resource. Urenco (Germany, Netherlands and United Kingdom) is like-minded with its ~ tu inventory (NEA and IAEA, 2001). Nirex has carried out some initial scoping performance assessment (PA) work for the disposal of cemented DU 3 O 8 on the basis of the Nirex Phased Disposal Concept for ILW/LLW (Nirex, 2001). Each 2-metre box would hold 50 tu. In this concept there would be a preference for DU in the U(IV) form e.g. DUO 2,ratherthanU(VI),tohelpmaintainalowredoxpotential. Management of SepU from reprocessing operations Two options have been discussed recently for managing the ~ metric tonnes of separated UO 3 that are stored in 55-gallon drums stacked three high in several buildings at the Savannah River Site: the feasibility of using the separated UO 3 as a high density inert filler in grout for filling HLW storage tanks for closure; and disposing directly into existing waste facilities on site (Jones, 2002). However, the fission products present in the oxide are an issue under the WAC for the SRS LLW and ILW facilities. 177
180 A number of management options of the ADU floc at Dounreay are being considered e.g. continued safe storage, direct in-drum cementation, conversion to sodium diuranate slurry followed by direct in-drum cementation, etc. References ANL (2001), Environmental impacts of options for disposal of depleted uranium tetrafluoride (UF 4 ), ANL report ANL/EAD/TM July 2001, Argonne National Lab., IL, United States. Biwer, B.M. et al. (2000), Depleted uranium disposal feasibility assessment, Appendix D in J.R. Hightower and J.R. Trabalka (2000), Depleted Uranium Storage and Disposal Trade Study Summary Report, ORNL/TM-2000/10, January. Croff AG, Hightower JR, Lee DW, Michaels GE, Ranek NL and Trabalka JR (2000), Assessment of Preferred Depleted Uranium Disposal Forms, ORNL/TM-2000/161, Oak Ridge National Laboratory, Oak Ridge, Tennessee. June. Duerksen, W.K. et al. (2000), Selection of optimum storage forms for depleted uranium, Appendix B in J.R. Hightower and J.R. Trabalka (2000), Depleted Uranium Storage and Disposal Trade Study Summary Report, ORNL/TM-2000/10, January. Hartmann D., Le Motais B., Duperret B. (2001) The French approach for management of depleted uranium. A constantly improved technology. WM 01 Conference, 25 February-1 March 2001, Tucson, AZ, United States. Jones, T. (2002), Disposal Options for Depleted Uranium Trioxide (DUO 3 ) Study. Report no. WSRC-TR Westinghouse Savannah River Company, 30 May 2002, Savannah River Site, Aiken, SC, United States. Nirex (2001), Generic Repository Studies Nirex Phased Disposal Concept. Nirex Report N/025. Nirex Ltd., March, United Kingdom. NEA and IAEA (2001), Management of Depleted Uranium,63pp.OECD,Paris. USDOE (1999), Programmatic Environmental Impact Statement for Alternative Strategies for the Long-Term Management and Use of Depleted Uranium Hexafluoride, DOE/EIS-029, US Department of Energy, Washington, DC., April Wingender, H.J., Becker, H.J. and Doran, J. (1994), Study on depleted uranium (tails) and on uranium residues from reprocessing with respect to quantities, characteristics, storage, possible disposal routes and radiation exposure. Report EUR EN. European Commission. 178
181 Filename: 139_178_APP_C_F.doc Directory: T:\NEA\SOSSO\Adv.fuelcycles\word Template: W:\OfficeXP\Workgroup Templates\AuthenvXP.wiz Title: Annex A Subject: Author: DERY Keywords: Comments: Creation Date: 21-Mar-06 2:14 PM Change Number: 22 Last Saved On: 03-May-06 11:22 AM Last Saved By: phamvan Total Editing Time: 81 Minutes Last Printed On: 19-May-06 11:12 AM As of Last Complete Printing Number of Pages: 40 Number of Words: 5,170 (approx.) Number of Characters: 29,475 (approx.)
182 Appendix G CHARACTERISTICS OF THE CONSIDERED HLW PACKAGES The number of spent fuel assemblies or containers (in case of reprocessing) per produced TWhe is given Table G.1. For the estimation of the number of vitrified HLW containers a number of assumptions had to be made. For Scheme 1b a waste loading of 40 kg waste per 150 litre container (COGEMA type), which corresponds to the present practise, was assumed. For Scheme 2a two options for the HLW vitrification have been considered. In the first option the HLW from the reprocessing of both fuels (UOX and MOX) is assumed to be mixed before vitrification. In the second option both waste streams are assumed to be conditioned separately. Because the waste at vitrification was too hot (> 2300 W/canister), the glass matrix loading was reduced to 30 kg (option 1) and even to 19 kg for the HLW from the MOX-EU fuel (option 2). In the case of pyro-reprocessing (Scheme 3cV1) the removal of noble metals should allow a higher waste loading (55 kg). The noble metals waste is assumed to be packed also in a standard (COGEMA type) container, with the same maximum weight (412.5 kg), and a metallic matrix consisting of 26% waste and 74% inert metal. For Scheme 3cV1, considering the separation of Cs and Sr, it is assumed that the Cs is conditioned after a sufficient decay period in a glass matrix and disposed of in a geological repository, because of the presence of the very long-lived 135 Cs, after a total cooling time of 100 years. Table G.1. Number of waste forms per produced TWhe for each fuel cycle scheme Fuel cycle Waste type Waste form Number/TWhe 1a spent fuel assemblies b HLW canister b MOX spent fuel assemblies a HLW (mixed) canister a HLW (UOX) canister a HLW (MOX) canister cV1 HLW canister cV1 Noble metals canister cV1 (Cs,Sr) HLW canister cV1 (Cs,Sr) Noble metals canister cV1 (Cs,Sr) Cs-waste canister The radionuclide inventories, corresponding to a 50 years cooling time, of the considered high level waste types are given in Table G.2. As mentioned in 5.4.1, it is assumed that 0.1% of the iodine in the spent fuel is present in the high level waste. At the bottom of the table the total amount of the elements Se and Pd is also given what allows to take into account isotopic dilution when applying solubility limits. 179
183 Table G.2. Radionuclide inventory of the considered HLW types Spent fuel HLW Spent fuel HLW HLW HLW Isotope UOX 1a UOX 1b MOX 1b UOX 2a MOX 2a 3cV1 (g/twhe) (g/twhe) (g/twhe) (g/twhe) (g/twhe) (g/twhe) SE E E E E E E+01 SR E E E E E E+02 Y E E E E E E-02 ZR E E E E E E+02 ZR E E E E E E+03 NB 93M 2.33E E E E E E-02 MO E E E E E E+03 MO E E E E E E+01 MO E E E E E E+03 MO E E E E E E+03 MO E E E E E E+03 TC E E E E E E+03 RU E E E E E E-13 RH E E E E E E-19 PD E E E E E E+01 PD E E E E E E+03 AG E E E E E E-03 SN E E E E E+01 SB E E E E E-05 TE E E E E E-02 I E E E E E E-01 I E E E E E E-01 CS E E E E E E-06 CS E E E E E E+03 CS E E E E E E+02 BA E E E E E E+01 BA E E E E E E-02 BA E E E E E E+03 BA137M 2.14E E E E E E-04 ND E E E E E E-08 PM E E E E E E-04 SM E E E E E E+02 EU E E E E E E+00 GD E E E E E E+01 TL E E E E E-14 2,93E-18 TL E E E E E-15 1,25E-22 PB E E E E E-09 3,73E-11 PB E E E E E-08 3,64E-12 PB E E E E E-08 7,24E-16 PB E E E E E-14 6,72E-17 PB E E E E E-09 1,14E-10 PB E E E E E-14 2,26E-17 PB E E E E E-12 7,40E-20 PB E E E E E-14 8,37E-16 BI E E E E E-10 1,79E
184 Table G.2. Radionuclide inventory of the considered HLW types (continued) Spent fuel HLW Spent fuel HLW HLW HLW Isotope UOX 1a UOX 1b MOX 1b UOX 2a MOX 2a 3cV1 (g/twhe) (g/twhe) (g/twhe) (g/twhe) (g/twhe) (g/twhe) BI E E E E E-12 7,04E-14 BI E E E E E-15 1,36E-18 BI E E E E E-13 7,02E-21 BI E E E E E-15 1,64E-17 BI E E E E E-14 6,22E-16 PO E E E E E-11 1,87E-12 PO E E E E E-23 3,71E-31 PO E E E E E-24 2,46E-26 PO E E E E E-21 8,59E-23 PO E E E E E-20 1,90E-23 PO E E E E E-17 2,75E-25 PO E E E E E-15 9,71E-17 AT E E E E E-20 1,97E-22 RN E E E E E-16 4,30E-20 RN E E E E E-15 1,11E-22 RN E E E E E-12 1,79E-13 FR E E E E E-16 1,82E-18 RA E E E E E-11 1,09E-14 RA E E E E E-11 6,44E-19 RA E E E E E-12 8,09E-15 RA E E E E E-07 2,78E-08 RA E E E E E-14 4,10E-16 AC E E E E E-12 5,46E-15 AC E E E E E-08 7,87E-12 AC E E E E E-18 5,01E-20 TH E E E E E-11 1,82E-14 TH E E E E E-09 1,25E-16 TH E E E E E-07 1,50E-09 TH E E E E E-03 1,62E-04 TH E E E E E-11 2,63E-12 TH E E E E E-05 1,27E-06 TH E E E E E-09 8,71E-09 PA E E E E E-05 2,61E-08 PA E E E E E-05 5,11E-08 PA E E E E E-13 1,31E-13 PA234M 9.06E E E E E-13 2,93E-13 U E E E E E-07 7,10E-06 U E E E E E-03 1,70E-05 U E E E E E+00 1,81E+00 U E E E E E+00 6,49E-01 U E E E E E+00 1,12E+00 U E E E E E-08 2,20E-08 U E E E E E+02 6,03E+02 U E E E E E-15 1,97E-17 NP E E E E E+02 1,51E
185 Table G.2. Radionuclide inventory of the considered HLW types (continued) Spent fuel HLW Spent fuel HLW HLW HLW Isotope UOX 1a UOX 1b MOX 1b UOX 2a MOX 2a 3cV1 (g/twhe) (g/twhe) (g/twhe) (g/twhe) (g/twhe) (g/twhe) NP E E E E E-06 3,94E-08 NP E E E E E-03 1,33E-06 NP E E E E E-16 1,51E-18 PU E E E E E+00 2,52E+00 PU E E E E E+01 7,93E+01 PU E E E E E+02 5,40E+01 PU E E E E E-01 7,11E-01 PU E E E E E+01 6,34E+00 PU E E E E E-12 8,17E-13 PU E E E E E-04 1,03E-06 AM E E E E E+03 9,72E+00 AM242M 2.25E E E E E+01 2,21E-01 AM E E E E E+03 1,55E+00 CM E E E E E-02 5,60E-04 CM E E E E E+00 1,11E-02 CM E E E E E+02 2,28E-01 CM E E E E E+02 2,87E-01 CM E E E E E+01 1,86E-01 CM E E E E E-01 2,29E-02 CM E E E E E-03 1,29E-02 BK249 8,73E-22 CF249 8,39E-04 CF250 8,08E-06 CF251 6,89E-06 CF252 2,91E-13 Se_tot 2.00E E E E E E+02 Pd_tot 5.45E E E E E E

186 Appendix H ASSESSMENT OF THE DISPOSAL OF HLW FROM ADVANCED FUEL CYCLE SCHEMES IN THE BOOM CLAY FORMATION 1 1. Considered repository 1.1 Reference repository concept The repository considered for this study is the reference repository that is described in detail in the Belgian safety case report SAFIR 2 [1]. This reference repository is assumed to be excavated in the Boom Clay Formation at the Mol site. A scheme of the geology of the Mol site is given in Figure H.1. Figure H.1. Geological cross-section of Mol site W Antwerpen Mol Lommel E Mol Sands of Mol Sands of Kasterlee Sands of Diest and Dessel NEOGENE Sands of Antwerp Sands of Voort Boom Clay repository BOOM CLAY F Sands of Ruisbroek Sands of Onderdale Asse Clay Sands of Lede and Brusse Ieper Clay and Sands km SCK CEN/F0521/IW/00/ Sands of Landen Landen Clay Marl of Gelinden Tuff of Maestricht Water flow direction in the aquifer Leakage direction through the aquitard F: fault area The considered repository will have a central access facility consisting of at least two vertical transport shafts and two transport galleries. The disposal galleries will be excavated perpendicular upon the transport galleries. The density of the HLW disposal in a gallery and the spacing between disposal galleries depend on the thermal output of the disposed HLW. 1. This work was contributed by Jan Marivoet and Eef Weetjens (SCK CEN, Mol, Belgium). 183
Current options for the nuclear fuel cycle:
 Current options for the nuclear fuel cycle: 1- Spent fuel disposal 2- Spent fuel reprocessing and Pu recovery Spent fuel and radiotoxicity 1/3 Composition of Spent Nuclear Fuel (Standard PWR 33GW/t, 10
Impact of partitioning and transmutation on nuclear waste management and the associated geological repositories
 Impact of partitioning and transmutation on nuclear waste management and the associated geological repositories Enrique M. González-Romero CIEMAT, Madrid, Spain Summary Recent Eurobarometers show that
Potential Benefits and
 1.6 3.13 4 waste forms 9.3 Nuclear Science 2011 Potential Benefits and Impacts of Advanced Nuclear Fuel Cycles with Actinide Partitioning and Transmutation Transition scenario and impact of P&T: concept
Burn-up Credit Criticality Benchmark
 Nuclear Science ISBN 92-64-02316-X Burn-up Credit Criticality Benchmark Phase II-D PWR-UO 2 Assembly Study of Control Rod Effects on Spent Fuel Composition Anne BARREAU Commissariat à l énergie atomique
WM2012 Conference, February 26 March 1, 2012, Phoenix, Arizona, USA. Opportunities for the Multi Recycling of Used MOX Fuel in the US
 Opportunities for the Multi Recycling of Used MOX Fuel in the US - 12122 P. Murray*, F. Bailly**, E. Bouvier**, T. Gain**, F. Lelièvre**, G.H. Senentz**, and E. Collins*** *AREVA Federal Services LLC,
Influence of Fuel Design and Reactor Operation on Spent Fuel Management
 Influence of Fuel Design and Reactor Operation on Spent Fuel Management International Conference on The Management of Spent Fuel from Nuclear Power Reactors 18 June 2015 Vienna, Austria Man-Sung Yim Department
DOE Activities Promoting Understanding of Advanced Nuclear Fuel Cycles
 DOE Activities Promoting Understanding of Advanced Nuclear Fuel Cycles Patricia Paviet Director for Systems Engineering and Integration (NE-51) Office of Fuel Cycle Technologies Office of Nuclear Energy
IMPACT OF A PROGRESSIVE DEPLOYMENT OF FAST REACTORS IN A PWR FLEET
 IMPACT OF A PROGRESSIVE DEPLOYMENT OF FAST REACTORS IN A PWR FLEET Christine Chabert, Anne Saturnin CEA Cadarache, DEN/DER AIEA TECHNICAL MEETING, Advanced Fuel Cycles for Waste Burden Minimization June
ANICCA CODE AND THE BELGIAN NUCLEAR FUEL CYCLE
 ANICCA CODE AND THE BELGIAN NUCLEAR FUEL CYCLE TECHNICAL WORKSHOP : DYNAMIC NUCLEAR FUEL CYCLE 06-08 July, 2016 Ivan Merino Rodriguez Contents ANICCA Introduction Structure General Input The Belgian Nuclear
Perspectives of Partitioning and Transmutation Technology. H. Oigawa Japan Atomic Energy Agency
 Perspectives of Partitioning and Transmutation Technology H. Oigawa Japan Atomic Energy Agency 1 Partitioning and Transmutation (P&T) Spent fuel Reprocessing FP MA U Pu MA (Np, Am, Cm) Geological disposal
Composition of Spent Nuclear Fuel (Standard PWR 33GW/t, 10 yr. cooling)
") Spent fuel and radiotoxicity 1/3 Composition of Spent Nuclear Fuel (Standard PWR 33GW/t, 10 yr. cooling) 1 tonne of SNF contains: 955.4 kg U 8,5 kg Pu Minor Actinides (MAs) 0,5 kg 237 Np 0,6 kg Am 0,02
Spent fuel and radiotoxicity 1/3 Composition of Spent Nuclear Fuel (Standard PWR 33GW/t, 10 yr. cooling) 1 tonne of SNF contains: 955.4 kg U 8,5 kg Pu Minor Actinides (MAs) 0,5 kg 237 Np 0,6 kg Am 0,02
THE STATUS OF THE US ACCELERATOR TRANSMUTATION OF WASTE PROGRAMME. James C. Bresee 1, James J. Laidler 2 1
 THE STATUS OF THE US ACCELERATOR TRANSMUTATION OF WASTE PROGRAMME James C. Bresee 1, James J. Laidler 2 1 United States Department of Energy 1000 Independence Avenue, SW, Washington, DC 20585, USA 2 Argonne
U.S. DOE currently has a number of initiatives to promote the growth of nuclear energy
 U.S. Department of Energy Innovative Generation IV and Advanced Fuel Cycle Initiative Research Programs Buzz Savage AFCI Program Director U.S. DOE 1st COE-INES International Symposium Tokyo, Japan November
The Nuclear Fuel Cycle Lecture 5
 The Nuclear Fuel Cycle Lecture 5 David J. Hamilton d.hamilton@physics.gla.ac.uk 7th February 2011 1. Overview Limitations of thermal recycling of Pu. Fast critical reactors: core physics; breeders; transmutation.
Nuclear Fuel Cycle Transition Scenario Studies
 Nuclear Science ISBN 978-92-64-99068-5 Nuclear Fuel Cycle Transition Scenario Studies Status Report OECD 2009 NEA No. 6194 NUCLEAR ENERGY AGENCY ORGANISATION FOR ECONOMIC CO-OPERATION AND DEVELOPMENT FOREWORD
What to do with Used Nuclear Fuel: Considerations regarding the Back-end of the Fuel Cycle
 What to do with Used Nuclear Fuel: Considerations regarding the Back-end of the Fuel Cycle William D. Magwood, IV Director-General Nuclear Energy Agency International Conference on the Management of Spent
Role of Partitioning and Transmutation (P&T) in Nuclear Energy
 in Nuclear Energy") Role of Partitioning and Transmutation (P&T) in Nuclear Energy Kazufumi TSUJIMOTO Japan Atomic Energy Agency Nov. 6, 2013, Tokyo, Japan Topical Meeting embedded to INES-4 : International Nuclear Law Symposium
Role of Partitioning and Transmutation (P&T) in Nuclear Energy Kazufumi TSUJIMOTO Japan Atomic Energy Agency Nov. 6, 2013, Tokyo, Japan Topical Meeting embedded to INES-4 : International Nuclear Law Symposium
The Nuclear Fuel Cycle Simplified
 The Nuclear Fuel Cycle Simplified Nuclear Power Committee August 27, 2009 Albert Machiels Senior Technical Executive Topics The Nuclear Fuel Cycle Simplified Light-Water Reactor (LWR) Power Block Used
Radiochemistry Webinars
 National Analytical Management Program (NAMP) U.S. Department of Energy Carlsbad Field Office Radiochemistry Webinars Nuclear Fuel Cycle Series Introduction to the Nuclear Fuel Cycle In Cooperation with
Nuclear Power Plant Life
 Nuclear Development Nuclear Power Plant Life Management and Longer-term Operation N U C L E A R E N E R G Y A G E N C Y Nuclear Development Nuclear Power Plant Life Management and Longer-term Operation
Systematic Evaluation of Uranium Utilization in Nuclear Systems
 Systematic Evaluation of Uranium Utilization in Nuclear Systems Taek K. Kim and T. A. Taiwo 11 th Information Exchange Meeting on Actinide and Fission Product Partitioning and Transmutation San Francisco,
OECD Nuclear Energy Agency Activities Related to the Nuclear Fuel Cycle
 International Symposium on Nuclear Back-end Issues and the Role of Nuclear Transmutation Technology Kyoto University, 28 November 2013 ECD Nuclear Energy Agency Activities Related to the Nuclear Fuel Cycle
The Economics of the. Back End of the Nuclear Fuel Cycle NEA. Nuclear Development Fuel pellet of uranium dioxide. Spent nuclear fuel.
 Nuclear Development 2013 The Economics of the Back End of the Nuclear Fuel Cycle Fuel pellet of uranium dioxide Spent nuclear fuel Ductile iron insert Bentonite clay Surface portion of final repository
Abstract ANALOGIES OF EXPERIENCE IN THE UNITED STATES TRANSURANIUM ELEMENT PRODUCTION PROGRAM
 Analogies of experience in the United States Transuranium Element Production Program with partitioning and transmutation of transuranic actinides in commercial used fuels Abstract ACTINIDE AND FISSION
LONG-TERM ENVIRONMENTAL IMPACT OF UNDERGROUND DISPOSAL OF P&T WASTE. G. Volckaert, D. Mallants SCK CEN, Boeretang Mol Belgium
 LONG-TERM ENVIRONMENTAL IMPACT OF UNDERGROUND DISPOSAL OF P&T WASTE G. Volckaert, D. Mallants SCK CEN, Boeretang 200 2400 Mol Belgium R. Bush AEA-Technology L. Lambers GRS, Schwertnergasse 1 50667 Köln
THE FRENCH PROGRAM FOR A SUSTAINABLE MANAGEMENT OF NUCLEAR MATERIALS AND WASTE
 THE FRENCH PROGRAM FOR A SUSTAINABLE MANAGEMENT OF NUCLEAR MATERIALS AND WASTE Bernard BOULLIS Fuel Cycle Back End Programs Director CEA, Nuclear Energy Division PAGE 1 International Symposium TOKYO, October
WM2013 Conference, February 24 28, 2013, Phoenix, Arizona USA
 The Potential Role of the Thorium Fuel Cycle in Reducing the Radiotoxicity of Long-Lived Waste 13477 Kevin Hesketh and Mike Thomas The UK s National Nuclear Laboratory, Preston Laboratory, Preston, PR4
Green Buildings in Use
 Please cite this paper as: Watson, C. (2007), Green Buildings in Use: Post Occupancy Evaluations, PEB Exchange, Programme on Educational Building, 2007/12, OECD Publishing, Paris. http://dx.doi.org/10.1787/070286367536
Strategic Aspects of Nuclear and Radiological Emergency Management
 Radiological Protection ISBN 978-92-64-99146-0 Strategic Aspects of Nuclear and Radiological Emergency Management Planning for Effective Decision Making Consequence Management and Transition to Recovery
Near-term Options for Treatment and Recyle
 Near-term Options for Treatment and Recyle Dr. Alan Hanson AREVA NC Inc. Executive Vice President, Technology and Used-Fuel Management American Nuclear Society Annual Meeting June 26, 2007 Boston, MA GNEP
Critique of The Future of the Nuclear Fuel Cycle: An Interdisciplinary MIT Study (2011)
") Critique of The Future of the Nuclear Fuel Cycle: An Interdisciplinary MIT Study (2011) Developed by the Science Council for Global Initiative Contact: Tom Blees 1. The Study
Critique of The Future of the Nuclear Fuel Cycle: An Interdisciplinary MIT Study (2011) Developed by the Science Council for Global Initiative Contact: Tom Blees 1. The Study
COE-INES-1 CORE CONCEPT OF COMPOUND PROCESS FUEL CYCLE
 COE-INES-1 CORE CONCEPT OF COMPOUND PROCESS FUEL CYCLE Objectives # Proposal of innovative nuclear fuel cycle system - economic competitiveness - efficient utilization of nuclear fuel resources - reduction
International Atomic Energy Agency (IAEA) Activities on Spent fuel Management; Keeping the Recycle Option Open
 Activities on Spent fuel Management; Keeping the Recycle Option Open") International Atomic Energy Agency () Activities on Spent fuel Management; Keeping the Recycle Option Open Z. Lovasic WM 09 Panel on SF Recycle International Atomic Energy Agency Current world scene in
International Atomic Energy Agency () Activities on Spent fuel Management; Keeping the Recycle Option Open Z. Lovasic WM 09 Panel on SF Recycle International Atomic Energy Agency Current world scene in
Nuclear Waste: How much is produced, and what can be used
 Nuclear Waste: How much is produced, and what can be used Physics of Nuclear Reactors Faculty of Applied Sciences Delft University of Technology Products from fission Material balance in fuel cycle (1
Nuclear Development Trends towards. Sustainability in the Nuclear Fuel Cycle
 Nuclear Development 2011 Trends towards Sustainability in the Nuclear Fuel Cycle N U C L E A R E N E R G Y A G E N C Y Nuclear Development ISBN 978-92-64-16810-7 Trends towards Sustainability in the Nuclear
Economics of Spent Nuclear Fuel Management An International Overview
 Economics of Spent Nuclear Fuel Management An International Overview Hans Forsström Senior Adviser, SKB International AB CEG Workshop, Aronsborg, Sweden, 7 October 2011 Spent fuel - a resource or waste?
Nuclear Fuel Cycle Indian Scenario
 Nuclear Recycle Group Nuclear Fuel Cycle Indian Scenario KAILASH AGARWAL Associate Director, NUCLEAR RECYCLE GROUP BHABHA ATOMIC RESEARCH CENTRE DEPARTMENT OF ATOMIC ENERGY MUMBAI, INDIA Advanced Fuel
Transmutation. Janne Wallenius Professor Reactor Physics, KTH. ACSEPT workshop, Lisbon
 Transmutation Janne Wallenius Professor Reactor Physics, KTH Why would one want to transmute high level nuclear waste? Partitioning and transmutation of Pu, Am & Cm reduces the radio-toxic inventory of
Analysis of European fuel cycle transition and equilibrium scenarios with LWR and ADS
 ANALYSIS OF EUROPEAN FUEL CYCLE TRANSITION AND EQUILIBRIUM SCENARIOS WITH LWR AND ADS Analysis of European fuel cycle transition and equilibrium scenarios with LWR and ADS F. Álvarez-Velarde, F. Martín-Fuertes,
The Nuclear Fuel Cycle Lecture 4
 The Nuclear Fuel Cycle Lecture 4 David J. Hamilton d.hamilton@physics.gla.ac.uk 31st January 2011 1. Overview The back-end of the cycle (continued): Once-through and geological disposal; Reprocessing-recycling
OECD RECOMMENDATION OF THE COUNCIL FOR ENHANCED ACCESS AND MORE EFFECTIVE USE OF PUBLIC SECTOR INFORMATION [C(2008)36]
![OECD RECOMMENDATION OF THE COUNCIL FOR ENHANCED ACCESS AND MORE EFFECTIVE USE OF PUBLIC SECTOR INFORMATION [C(2008)36]](/thumbs/75/71656038.jpg "OECD RECOMMENDATION OF THE COUNCIL FOR ENHANCED ACCESS AND MORE EFFECTIVE USE OF PUBLIC SECTOR INFORMATION [C(2008)36]") OECD RECOMMENDATION OF THE COUNCIL FOR ENHANCED ACCESS AND MORE EFFECTIVE USE OF PUBLIC SECTOR INFORMATION [C(2008)36] OECD RECOMMENDATION OF THE COUNCIL FOR ENHANCED ACCESS AND MORE EFFECTIVE USE OF PUBLIC
OECD RECOMMENDATION OF THE COUNCIL FOR ENHANCED ACCESS AND MORE EFFECTIVE USE OF PUBLIC SECTOR INFORMATION [C(2008)36] OECD RECOMMENDATION OF THE COUNCIL FOR ENHANCED ACCESS AND MORE EFFECTIVE USE OF PUBLIC
The Future of the Nuclear Fuel Cycle
 The Future of the Nuclear Fuel Cycle Results* and Personal Observations Charles W. Forsberg Executive Director MIT Nuclear Fuel Cycle Study Department of Nuclear Science and Engineering cforsber@mit.edu
Advanced Fuel Cycle System R&D Activities at KAERI
 IFR Symposium, Tokyo Advanced Fuel Cycle System R&D Activities at KAERI - Pyroprocessing and SFR. May 28, 2014 In-Tae Kim* Nuclear Fuel Cycle Technology Development * E-mail : nitkim@kaeri.re.kr Outline
Plutonium Management in France. Current Policy and Long Term Strategy for the Used Fuel Recycling by LWR and Fast Reactors
 1 Plutonium Management in France Current Policy and Long Term Strategy for the Used Fuel Recycling by LWR and Fast Reactors Christophe XERRI, Nuclear Counsellor 2 3 French Nuclear Fleet 2013 One operator:
Introduction to the Nuclear Fuel Cycle
 Introduction to the Nuclear Fuel Cycle Overview of fuel cycle Mining F R O N T E N D Milling & Extraction Convert to UF6 Enrichment Fuel Fabrication REACTOR Store U Pu LLW ILW HLW REPROCESS BACK END Store
FRENCH WASTE MANAGEMENT STRATEGY FOR A SUSTAINABLE DEVELOPMENT OF NUCLEAR ENERGY
 FRENCH WASTE MANAGEMENT STRATEGY FOR A SUSTAINABLE DEVELOPMENT OF NUCLEAR ENERGY Charles Courtois and Franck Carré Waste Management Research Direction CEA/Saclay, Gif-sur-Yvette, Cedex, France Abstract
European Vision in P&T. Advances in Transmutation Technology
 European Vision in P&T Advances in Transmutation Technology Prof. Dr. Hamid Aït Abderrahim SCK CEN, Boeretang 200, 2400 Mol, Belgium haitabde@sckcen.be or myrrha@sckcen.be Copyright 2010 SCK CEN 1 After
Dynamic Analysis of Nuclear Energy System Strategies for Electricity and Hydrogen Production in the USA
 Dynamic Analysis of Nuclear Energy System Strategies for Electricity and Hydrogen Production in the USA L. Van Den Durpel, D. C. Wade, H. Khalil, A. Yacout Nuclear Engineering Division, Argonne National
Mathematical Modelling of Regional Fuel Cycle Centres
 Mathematical Modelling of Regional Fuel Cycle Centres by Leonard L. Bennett and Larry D. Reynolds The concept of Regional Fuel Cycle Centres (RFCC) has attracted wide interest as a possible approach towards
SOME IMPLICATIONS OF RECYCLING USED CANDU FUEL IN FAST REACTORS
 SOME IMPLICATIONS OF RECYCLING USED CANDU FUEL IN FAST REACTORS M.F. Ion and M. Gobien Nuclear Waste Management Organization, Toronto, Ontario, Canada mion@nwmo.ca, mgobien@nwmo.ca Abstract This paper
Nuclear Energy: Challenges and Opportunities for a Low Carbon Future
 Nuclear Energy: Challenges and Opportunities for a Low Carbon Future William D. Magwood, IV Director-General Nuclear Energy Agency CEIDEN General Assembly 17 November 2016 2016 Organisation for Economic
Trends towards Sustainability in the Nuclear Fuel Cycle
 Trends towards Sustainability in the Nuclear Fuel Cycle Dr Ron CAMERON Head, Nuclear Development OECD Nuclear Energy Agency ron.cameron@oecd.org IChemE April 2012 1 Sustainability of nuclear energy Nuclear
IAEA/JAEA INTERNATIONAL WORKSHOP
 IAEA/JAEA INTERNATIONAL WORKSHOP TOKAI-MURA, november 2007 NUCLEAR ENERGY IN THE 21th CENTURY: MAIN TRENDS AND POSSIBLE SCENARIOS IN FRANCE Bernard BOULLIS Program Director for fuel cycle technologies
OECD-NEA Task Force on Potential Benefits and Impacts of Advanced Fuel Cycles with Partitioning and Transmutation: Summary of Major Findings
 OECD-NEA Task Force on Potential Benefits and Impacts of Advanced Fuel Cycles with Partitioning and Transmutation: Summary of Major Findings Massimo SALVATORES 1,2, Jan MARIVOET 3, Hiroyuki OIGAWA 4, Roald
How Spent Fuel Management Affects Geologic Disposal
 ?? Vitrified Waste?? Geologic Repository Spent Nuclear Fuel Stored or Processed Fuel How Spent Fuel Management Affects Geologic Disposal Peter Swift Senior Scientist Sandia National Laboratories, USA International
Nuclear fuel cycle synergies and regional scenarios for Europe
 Nuclear Science ISBN 978-92-64-99086-9 Nuclear fuel cycle synergies and regional scenarios for Europe M. Salvatores, M. Meyer, V. Romanello, L. Boucher, A. Schwenk-Ferrero OECD 2009 NEA No. 6857 NUCLEAR
We are IntechOpen, the world s leading publisher of Open Access books Built by scientists, for scientists. International authors and editors
 We are IntechOpen, the world s leading publisher of Open Access books Built by scientists, for scientists 3,900 116,000 120M Open access books available International authors and editors Downloads Our
RECYCLING SCHEMES OF AMERICIUM TARGETS IN PWR/MOX CORES. Th. Maldague, S. Pilate, A. Renard, Belgonucléaire, Brussels, Belgium
 RECYCLING SCHEMES OF AMERICIUM TARGETS IN PWR/MOX CORES Th. Maldague, S. Pilate, A. Renard, Belgonucléaire, Brussels, Belgium A. Harislur, H. Mouney, M. Rome, Électricité de France, Paris & Lyon, France
Used Nuclear Fuel Management Options
 Used Nuclear Fuel Management Options Main challenges and AREVA overall positioning November 15, 2016 Isabelle Morlaes, AREVA, Sales Back-End Dpt. SVP France & New Business Development AREVA Proprietary
ABSTRACT INTRODUCTION. T-11-3, P-3b-172. P. Croüail 1, T. Schneider 1, A. Sugier 2 1 CEPN BP n 48, Fontenay-aux-Roses Cedex France 2
 Evaluation of the Impact and Inter-Generation Risk Transfers Related to the Release and Disposal of Radioactive Waste from the Nuclear Fuel Cycle: A Methodological Exercise P. Croüail 1, T. Schneider 1,
RECYCLING SPENT NUCLEAR FUELS FROM LWRS TO FAST REACTORS. Carole WAHIDE CEA Direction for Nuclear Energy FRANCE
 RECYCLING SPENT NUCLEAR FUELS FROM LWRS TO FAST REACTORS Carole WAHIDE CEA Direction for Nuclear Energy FRANCE 1 FRENCH ELECTRICITY NUCLEAR > 75 % OF ELECTRICITY GENERATION LOW-CARBON ENERGY MIX : # 4G
A new environment for nuclear safety: Main challenges for the OECD/NEA
 A new environment for nuclear safety: Main challenges for the OECD/NEA Javier Reig Director Nuclear Safety OECD Nuclear Energy Agency TSO Conference, Beijing, October 2014 2014 Organisation for Economic
THORIUM FUEL OPTIONS FOR SUSTAINED TRANSURANIC BURNING IN PRESSURIZED WATER REACTORS
 THORIUM FUEL OPTIONS FOR SUSTAINED TRANSURANIC BURNING IN PRESSURIZED WATER REACTORS - 12381 Fariz Abdul Rahman*, Fausto Franceschini**, Michael Wenner**, John C. Lee* *University of Michigan, Ann Arbor,
AN INVESTIGATION OF TRU RECYCLING WITH VARIOUS NEUTRON SPECTRUMS
 AN INVESTIGATION OF TRU RECYCLING WITH VARIOUS NEUTRON SPECTRUMS Yong-Nam Kim, Hong-Chul Kim, Chi-Young Han and Jong-Kyung Kim Hanyang University, South Korea Won-Seok Park Korea Atomic Energy Research
Considerations for a Sustainable Nuclear Fission Energy in Europe
 International Conference Nuclear Energy for New Europe 2005 Bled Slovenia September 5-8 Considerations for a Sustainable Nuclear Fission Energy in Europe G. Cognet - P. Ledermann D.G. Cacuci CEA - France
Transmutation of nuclear wastes by metal fuel fast reactors
 PSN Number: PSNN-2014-0979 Document Number: AFT-2014-000359 Rev.000(0) Transmutation of nuclear wastes by metal fuel fast reactors International Symposium on Present Status and Future Perspective for Reducing
Development of The Evaluation Tool for Reduction of High Level Radioactive Waste
 International Symposium on Present Status and Future Perspective for Reducing Radioactive Wastes ~ Aiming for Zero-Release ~ Development of The Evaluation Tool for Reduction of High Level Radioactive Waste
On the Practical Use of Lightbridge Thorium-based Fuels for Nuclear Power Generation
 On the Practical Use of Lightbridge Thorium-based Fuels for Nuclear Power Generation Revision 1 - July 2010 Lightbridge Corporation 1600 Tysons Blvd. Suite 550 Mclean, VA 22102 USA P +1 571.730.1200 F
The Thorium Fuel Cycle. An independent assessment by the UK National Nuclear Laboratory
 The Thorium Fuel Cycle An independent assessment by the UK National Nuclear Laboratory August 2010 Position Paper The Thorium Fuel Cycle An independent assessment by the UK National Nuclear Laboratory
Reprocessing versus Direct Disposal of Spent CANDU Nuclear Fuel: A Possible Application of Fluoride Volatility. D. Rozon and D. Lister January 2008
 NWMO DISCUSSION PAPER Reprocessing versus Direct Disposal of Spent CANDU Nuclear Fuel: A Possible Application of Fluoride Volatility D. Rozon and D. Lister January 2008 (Final draft as discussed at the
The Economics of the Back-end of the Nuclear Fuel Cycle
 The Economics of the Back-end of the Nuclear Fuel Cycle Vladimir Lebedev OECD Nuclear Energy Agency AtomECO 2013 Objectives OECD/NEA established in 2011 the Ad hoc Expert Group on the Economics of the
Thorium an alternative nuclear fuel cycle
 Thorium an alternative nuclear fuel cycle 5th Smart Grids & Clean Power Conference, Cambridge, 5 June 2013 www.cir-strategy.com/events/cleanpower Kevin Hesketh, Senior Research Fellow Outline General Principles
Role of the Fast Reactor and Efforts on Monju
 Int. Symposium on Present Status and Future Perspective for Reducing Radioactive Wastes ~ Aiming for Zero-Release~, Oct. 9-10, 2014, Tokyo Role of the Fast Reactor and Efforts on Monju October 9, 2014
The Decommissioning and Dismantling of Nuclear Facilities
 Radioactive Waste Management The Decommissioning and Dismantling of Nuclear Facilities Status, Approaches, Challenges NUCLEAR ENERGY AGENCY ORGANISATION FOR ECONOMIC CO-OPERATION AND DEVELOPMENT ORGANISATION
Concept of Waste Management and Geological Disposal Incorporating Partitioning and Transmutation Technology
 Oct. 7, 2008 10th OECD/NEA IEM on PT at Mito, Japan 1 Concept of Waste Management and Geological Disposal Incorporating Partitioning and Transmutation Technology Hiroyuki OIGAWA, Kenji NISHIHARA, Shinichi
Closed Fuel Cycle Strategies and National Programmes in Russia
 Closed Fuel Cycle Strategies and National Programmes in Russia A.V. Bychkov RIAR, RUSSIA 9 th IEM on Actinide and Fission Products Partitioning and Transmutation Nimes, France, 25-29 September 2006 Unique
Key Performance Indicators for the. European Sustainable Nuclear Industrial Initiative
 EUROPEAN COMMISSION DIRECTORATE-GENERAL JOINT RESEARCH CENTRE Institute for Energy and Transport SET-Plan Information System (SETIS) Key Performance Indicators for the European Sustainable Nuclear Industrial
UNDERSTANDING THERMAL CONSTRAINTS FOR HIGH-HEAT-GENERATING WASTES IN THE UK. Ann McCall, Martin Cairns
 UNDERSTANDING THERMAL CONSTRAINTS FOR HIGH-HEAT-GENERATING WASTES IN THE UK Ann McCall, Martin Cairns Radioactive Waste Management Limited, Building B587, Curie Avenue, Harwell Oxford, Didcot Oxfordshire,
TECHNOLOGICAL BREAKTHROUGHS AND ELECTRICITY OF TOMORROW
 TECHNOLOGICAL BREAKTHROUGHS AND ELECTRICITY OF TOMORROW Atoms for the future 2013 Christophe Béhar OCTOBER 21 st, 2013 Christophe Béhar October 21st, 2013 PAGE 1 THE ENERGY ISSUES Christophe Béhar October
Saint-Petersburg Conference. Session 4. Drivers for Deployment of Sustainable and Innovative Technology
 Saint-Petersburg Conference Session 4. Drivers for Deployment of Sustainable and Innovative Technology Speech by Christophe Behar, Director of the Nuclear Energy Division of the CEA Chairman, Ministers,
Science of Nuclear Energy and Radiation
 CNS Science of Nuclear Energy and Radiation Ben Rouben 1998 June page 1 The Nuclear Fuel Cycle Ben Rouben Manager, Reactor Core Physics AECL page 2 Topic of Discussion Nuclear fuel cycle. Will cover various
BACK-END SCENARIOS FOR THE FRENCH NUCLEAR FLEET
 BACK-END SCENARIOS FOR THE FRENCH NUCLEAR FLEET Caroline DREVON Areva, Back-end Michel PAYS EDF, Fuel Cycle Division Bernard BOULLIS CEA, Nuclear Energy Division Sino-French Seminar Building up an Advanced
ACTINIDE COMPOSITION ANALYSIS OF LIGHT WATER REACTOR (LWR) FOR DIFFERENT REACTOR CONDITION OF BURNUP AND COOLING TIME
 FOR DIFFERENT REACTOR CONDITION OF BURNUP AND COOLING TIME") ACTINIDE COMPOSITION ANALYSIS OF LIGHT WATER REACTOR (LWR) FOR DIFFERENT REACTOR CONDITION OF BURNUP AND COOLING TIME Sidik Permana 1, Abdul Waris 1, Mitsutoshi Suzuki 2 and Masako Saito 3 1 Department
ACTINIDE COMPOSITION ANALYSIS OF LIGHT WATER REACTOR (LWR) FOR DIFFERENT REACTOR CONDITION OF BURNUP AND COOLING TIME Sidik Permana 1, Abdul Waris 1, Mitsutoshi Suzuki 2 and Masako Saito 3 1 Department
A Strategy for the Nuclear Fuel Cycle in the 21st Century
 A Strategy for the Nuclear Fuel Cycle in the 21st Century uji. Kazim assachuse s Ins tu of Technolog A lecture for The ANS Chapter in Austria The IAEA, Vienna, Austria May 26, 2009 MIT Center for Advanced
The Legacy of U.S. Energy Leadership
 Future Nuclear Energy Systems: Generation IV Kevan D. Weaver, Ph.D. U.S. System Integration Manager, Gas-Cooled Fast Reactor 50th Annual Meeting of the Health Physics Society 11 July 2005 - Spokane, Washington,
Nuclear Fuel Cycle and Materials Technologies
 Nuclear Fuel Cycle and Materials Technologies Objective To enhance and further strengthen the capabilities of interested Member States for policy making, strategic planning, technology development and
The Thorium Fuel Cycle
 The Thorium Fuel Cycle ThEC13 Daniel Mathers daniel.p.mathers@nnl.co.uk Outline Content: Background Sustainability, proliferation resistance, economics, radiotoxicity Advantages and disadvantages Fuel
Japanese FR Deployment Scenario Study after the Fukushima Accident
 FR13, Paris, France, 4-7 March 213 Japanese FR Deployment Scenario Study after the Fukushima Accident Kiyoshi ONO Hiroki SHIOTANI, Akira OHTAKI, Kyoko MUKAIDA and Tomoyuki ABE Japan Atomic Energy Agency
Selecting Strategies for the Decommissioning of Nuclear Facilities
 Radioactive Waste Management ISBN 92-64-02305-4 Selecting Strategies for the Decommissioning of Nuclear Facilities A Status Report OECD 2006 NEA No. 6038 NUCLEAR ENERGY AGENCY ORGANISATION FOR ECONOMIC
The OECD The Nuclear Energy Agency
 The OECD The Nuclear Energy Agency Janice Dunn Lee OECD/NEA Deputy Director-General WNU Summer Institute July 14, 2011 1 Overview The OECD/NEA The Work of the NEA The NEA and Other International Organisations
Report to Congress. Advanced Fuel Cycle Initiative: The Future Path for Advanced Spent Fuel Treatment and Transmutation Research.
 Report to Congress on Advanced Fuel Cycle Initiative: The Future Path for Advanced Spent Fuel Treatment and Transmutation Research Prepared by U.S. Department of Energy Office of Nuclear Energy, Science,
Nuclear energy in Europe
 Nuclear energy in Europe Contribution to the Future Low Carbon Energy Society Dr. Ákos Horváth Director General, MTA Centre for Energy Research (HU) akos.horvath@energia.mta.hu EASAC/JRC meeting on Nuclear
Scenario Development Methods and Practice
 Radioactive Waste Management Scenario Development Methods and Practice An evaluation based on the NEA Workshop on Scenario Development Madrid, May 1999 NUCLEAR ENERGY AGENCY ORGANISATION FOR ECONOMIC CO-OPERATION
Synergistic Spent Nuclear Fuel Dynamics Within the European Union. Jin Whan Bae, Kathryn Huff, Clifford Singer 1
 261 Synergistic Spent Nuclear Fuel Dynamics Within the European Union Jin Whan Bae, Kathryn Huff, Clifford Singer 1 1 Dept. of Nuclear, Plasma, and Radiological Engineering, University of Illinois at Urbana-Champaign
SAFIR 2: Belgian R&D Programme on the Deep Disposal of High-level and Long-lived Radioactive Waste
 Radioactive Waste Management ISBN 92-64-18499-6 SAFIR 2: Belgian R&D Programme on the Deep Disposal of High-level and Long-lived Radioactive Waste An International Peer Review OECD 2003 NUCLEAR ENERGY
Nuclear Energy Economics and Policy Analysis S 04. Classnote. The Economics of the Nuclear Fuel Cycle: (2) MOX Recycle in LWRs
 MOX Recycle in LWRs") 22.812 Nuclear Energy Economics and Policy Analysis S 04 Classnote The Economics of the Nuclear Fuel Cycle: (2) MOX Recycle in LWRs We can use the same fuel cycle cost model to investigate the economics
22.812 Nuclear Energy Economics and Policy Analysis S 04 Classnote The Economics of the Nuclear Fuel Cycle: (2) MOX Recycle in LWRs We can use the same fuel cycle cost model to investigate the economics
WM2009 CONFERENCE Waste Management for the Nuclear Renaissance
 WM2009 CONFERENCE Waste Management for the Nuclear Renaissance March 1-5 2009, Phoenix, Arizona New Policy Developments and Challenges for Radioactive Waste Management in South Africa Session 03: 10h00-12h00:
The relevance for the nuclear industry decommissioning programmes
 Control and Management of Inadvertent Radioactive Material in Scrap Metal Tarragona, 23-27 February 2009 The relevance for the nuclear industry decommissioning programmes Patrick J O Sullivan Radiation
JAEA s Efforts for Reduction of Radioactive Wastes
 International Symposium on Present Status and Future Perspective for Reducing of Radioactive Wastes JAEA s Efforts for Reduction of Radioactive Wastes February 17, 2016 Yasushi Taguchi Executive Vice President
A Clean, Secure Nuclear Energy Solution for the 21 st Century Advanced Reactor Concepts, LLC (ARC) June 2010
 June 2010") A Clean, Secure Nuclear Energy Solution for the 21 st Century Advanced Reactor Concepts, LLC (ARC) June 2010 Introduction As the world grapples with the energy requirements of the future, and the associated
A Clean, Secure Nuclear Energy Solution for the 21 st Century Advanced Reactor Concepts, LLC (ARC) June 2010 Introduction As the world grapples with the energy requirements of the future, and the associated