CAT Enterprise. Supervisor Manual
|
|
|
- Verity Warren
- 5 years ago
- Views:
Transcription

1 CAT Enterprise Supervisor Manual Version 1.6 Revised February 20, 2013
2 NOTICE AND DISCLAIMER The information contained herein (WORK) was prepared by or contributed to by various parties in support of professional continuing education. For purposes of this Disclaimer, Company Group is defined as PetroSkills, LLC., OGCI Training, Inc., John M. Campbell and Company, its and their parent, subsidiaries and affiliated companies, and, its and their co-lessees, partners, joint ventures, co-owners, shareholders, agents, officers, directors, employees, representatives, instructors, and contractors. Company Group takes no Position as to whether any method, apparatus or product mentioned herein is or will be covered by a patent or other intellectual property; furthermore, the information contained herein does not grant the right, by implication or otherwise, to manufacture, sell, offer for sale or use any method, apparatus or product covered by a patent or other intellectual property right, nor does it insure anyone against liability for infringement of same. Except as stated herein, Company Group makes no warranties, express, implied, or statutory, with respect to the WORK, including, without limitation, any warranties of merchantability or fitness for a particular purpose. Company Group does not guarantee results. All interpretations using the WORK, and all recommendations based upon such interpretations, are opinion based on inferences from measurements and empirical relationships and on assumptions, which inferences and assumptions are not infallible, and with respect to which competent specialists may differ. In addition, such interpretations, recommendations and descriptions may involve the opinion and judgment of the USER. The USER has full responsibility for all interpretations, recommendations and descriptions utilizing the WORK. Company Group cannot and does not warrant the accuracy, correctness or completeness of any interpretation, recommendation or description. Under no circumstances should any interpretation, recommendation or description be relied upon as the basis for any drilling, completion, well treatment, production, financial decision, or any procedure involving any risk to the safety of any drilling venture, drilling rig or its crew or any other individual. The USER has full responsibility for all such decisions concerning other procedures relating to the drilling or production operations. Except as expressly otherwise stated herein, the USER agrees that Company Group shall have no liability to the USER or to any third party for any ordinary, special, or consequential damages or losses which might arise directly or indirectly by reason of the USER s use of the WORK. The USER shall protect, indemnify, hold harmless and defend Company Group of and from any loss, cost, damage, or expense, including attorneys fees, arising from any claim asserted against Company Group that is in any way associated with the matters set forth in this Disclaimer. No part of the text or original figures of the WORK may be reproduced in any form without the express written consent of PetroSkills, LLC. Use of the WORK as a reference or manual for adult training programs is specifically reserved for PetroSkills, LLC. All rights to the WORK, including translation rights, are reserved. Copyright PetroSkills, LLC., 2013 This WORK is copyrighted by PetroSkills, LLC. and printed under exclusive license by PetroSkills, LLC.
3 TABLE OF CONTENTS TOPIC 1: USING CAT FOR THE SUPERVISOR... 6 YOUR ROLE AS A SUPERVISOR... 6 Focus on Team Development with Your CAT Dashboard... 6 NAVIGATING THE SUPERVISOR S HOMEPAGE/DASHBOARD... 7 CUSTOMIZING YOUR DASHBOARD... 8 Organizing Windows... 8 Collapsing/Expanding Windows... 9 USING THE SEARCH FEATURES Editing Items from Search Results Exporting Search Results to Excel TOPIC 2: USING YOUR DASHBOARD CHARTS OVERVIEW USING THE BASIC CHART FUNCTIONS Drilling in and Out of a Chart Viewing Chart Details Filtering Data in a Chart Showing/Hiding Charts INTERPRETING AND USING EACH CHART TYPE Participant Assessments Required Supervisor Assessments Required Skill Gaps High Importance Skill Gaps People with High Importance Skill Gaps Recommended Development Activities Lowest Percent Developed My Team s Development Status TOPIC 3: USING QUICK REPORTS OVERVIEW UNDERSTANDING THE QUICK REPORTS WINDOW OPENING A QUICK REPORT SUBSCRIBING TO QUICK REPORTS Subscribe CC INTERPRETING EACH QUICK REPORT TYPE Assessment Status by Position Gap Analysis by Position High Importance Skill Gaps Lowest Percent Developed Participant Assessments Required People with High Importance Skill Gaps Recommended Development Activities Skill Gaps Supervisor Assessments Required TOPIC 4: VIEWING AND EDITING A PERSON VIEWING A PERSON Dashboard Competency Inventory Gap Analysis Activity Profile Development Plan... 58
4 EDITING A PERSON S DETAILS Deleting a Person TOPIC 5: ASSESSING A PERSON SELECTING A PERSON OPENING A PERSON S POSITION ASSESSING A PERSON S SKILLS Normal Assessment Review Managing Notes Assessing an Entire Skill Group Concurring with a Person s Self-Assessment Assessing Skills of High Importance DEVELOPMENT CYCLE TRACKING Setting Stages as Complete VIEW HISTORICAL COMPARISON OF COMPETENCY INVENTORY SHOW ONLY ASSESSMENTS AS OF A PARTICULAR DATE SHOW ONLY ASSESSMENTS THAT DO NOT AGREE TOPIC 6: SETTING SKILL IMPORTANCE SETTING SKILL IMPORTANCE FOR AN INDIVIDUAL SETTING SKILL IMPORTANCE FOR A GROUP TOPIC 7: MANAGING DEVELOPMENT PLANS REVIEWING AND AMENDING A DEVELOPMENT PLAN TOPIC 8: MANAGING GROUPS MANAGING A GROUP Dashboard/Overview Properties and the History GROUP COMPETENCY INVENTORY GROUP GAP ANALYSIS GROUP ACTIVITY PROFILE... 94
5 USING CAT FOR THE SUPERVISOR Topic 1 Your Role as a Supervisor Navigating the Supervisor s Homepage/Dashboard Using the Search Features
6 Topic 1: Using CAT for the Supervisor This manual will cover the Supervisor functions; however, you may have permissions to other functions that are covered in the other CAT manuals. Your Role as a Supervisor Your key Supervisor responsibility is managing the assessment and development of employees within your assigned groups. While the exact supervisor role and any associated standards of practice are specific to your company, your activities will typically focus on cross-assessment of direct reports and their development plans. You will use your Dashboard to easily monitor team planning and progress, and to navigate to areas of CAT that need attention. The My Team s Development area within CAT allows you to perform a subset of important performance management functions. Supervisor s main responsibilities: Conduct cross-assessments and oversee development plans; Supervise and report on Participants, Mentors, and Supervisors; Manage groups by creating, editing, and deleting groups and group memberships; Use the Dashboard to review and plan your team s development. Managing Team Development from Your CAT Dashboard As soon as your log in, you will see your Dashboard which displays information about your team with easy-to-interpret charts and quick reports. Your role as a Supervisor involves using the Dashboard to remain fully aware of your team s skill gaps and competencies by monitoring changes in your team s development. Your Dashboard lets you to manage your team development efficiently and effectively by helping you: Easily identify strengths and weaknesses of your team; Clearly see gaps, assessment statuses, and development data; View development data to ensure that your team members can safely perform high importance tasks to established company and industry standards; Quickly navigate straight from your charts to specific areas of CAT that need attention. 6

7 Navigating the Supervisor s Homepage/Dashboard When you log in as a Supervisor, your homepage will look similar to the image in Figure 1. By default, the Dashboard tab is selected, which displays information about your team s assessments, gaps, and development. You will use your chart to identify strengths and weaknesses within your team and to navigate to those specific areas in CAT. You will also run reports about your entire team from the Quick Reports window on your Dashboard. To learn about how to interpret and work with your Dashboard, refer to Topics 2 and 3. Other tabs on your homepage allow you to view details about your CAT account. Figure 1 Your Dashboard allows you to navigate into CAT, but you can also use the My Team s Development button on the main menu to access your groups and people (Figure 2). Figure 2 7 This Manual focuses on the functionality of the Dashboard and My Team s Development area to support your performance management role. The other parts of your homepage are explained in full detail in the CAT Enterprise Participant Manual.


8 Customizing Your Dashboard The items on your Dashboard help you manage your team most effectively. You have multiple charts and reports to choose from, and you can tailor your Dashboard to show whatever information is most important for the growth of your team. Below are two examples of how you can customize your Dashboard. The Dashboard on the left shows the Skill Gaps and Lowest Percent Developed charts as well as the Quick Reports window. With the remaining windows collapsed, you can focus on development status and running reports about your team. The Dashboard layout on the right shows the Participant and Supervisor Assessments Required charts and the My Team s Development Status chart. This allows you to focus on assessments that need to be completed, while keeping an eye on development. Organizing Windows You can rearrange the windows on your Dashboard by dragging and dropping them into a new space. You may want to move your most important charts to the top of your Dashboard, while leaving your least important charts at the bottom of your Dashboard. You can drag and drop expanded or collapsed windows. To move a window on your Dashboard: 1. Place your cursor over a title bar of a window until the cursor looks like four arrows pointing outwards (Figure 3). Figure 3 8
9 2. Click and hold and drag the window to the area where you want it to appear. The new area will be outlined in a dotted line when the window is ready to be dropped (Figure 4). 3. Drop the window into its new place. Figure 4 4. Continue to drag and drop windows until you have the layout you want. Your new layout will be saved, and you will see it every time you log in. You can rearrange the layout any time as your information needs change. Collapsing/Expanding Windows Collapsing and expanding windows on your Dashboard allows you to hide a window so you can just see its title bar, or to expand a window to the normal view. This feature enables you to hide charts that you are not using and to show only charts that you want to focus on. To collapse a window, click on the Collapse/Expand icon, located in the top right corner of any title bar window (Figure 5). To expand a window, click the Collapse/Expand icon again (the icon arrow looks inverted when a window is collapse). 9
. You can use this function to easily access and edit the People and Groups you have searched for, and to export your search results to Excel.")
10 Figure 5 Using the Search Features The Search function allows you to quickly find Groups, People, Skill Groups, Skills, Skill Descriptions, and Development Activities (more options for Administrators and System Owners). You can use this function to easily access and edit the People and Groups you have searched for, and to export your search results to Excel. Editing Items from Search Results When you conduct a search, you will see the Edit icon beside the results that you are authorized to edit. What you can edit and search for depends on your role and permissions. For example, Administrators can edit Maps, but Supervisors cannot. Clicking on the Edit icon redirects you to the page to edit your selection. If a search result does not have the Edit icon then you do not have the permissions to edit it. Exporting Search Results to Excel You can export your search results to Excel by clicking on the Export to Excel icon located in the top-right corner of the search results area (Figure 6). Your search results will be exported to an Excel sheet, providing a simple way to interpret and manipulate your search results outside of the CAT application. You must have Microsoft Excel installed on your computer for this function to work. Figure 7 shows the exported results in Excel. 10


11 Figure 6 Figure 7 For more information on the basic search features, refer to the Participant Manual, Topic 1: Searching in CAT Enterprise. You ve reached the end of Topic 1. You can now move on to Topic 2: Using Your Dashboard Charts. 11
12
13 Topic 2 Using Your Dashboard Charts Overview Using the Basic Chart Functions Interpreting and Using Each Chart Type
14 Topic 2: Using Your Dashboard Charts Overview Charts are a vital part of effectively managing your team. Charts show you information about the people you manage right on your Dashboard. They help you to identify strengths and weaknesses within your team, so you can quickly address areas that need attention. Your charts are interactive and have a drilldown feature that allows you to navigate to specific areas of CAT from the Dashboard. Several charts appear on your Dashboard by default: Participant Assessments Required Displays your team members who need to complete the most assessments. Supervisor Assessments Required Displays which team members need the most Supervisor assessments. Skill Gaps Displays your team s weakest skills. High Importance Skill Gaps Displays which High Importance Skills are the weakest on your team. People with High Importance Skill Gaps Displays the people who have the greatest gap in their High Importance Skills. Recommended Development Activities Displays the most impactful Development Activities for your team. Lowest Percent Developed Displays which people on your team need the most development. My Team s Development (no drilldown feature) Displays your team s development status. Although all the charts appear on your Dashboard by default, you can customize your Dashboard to organize and show only the charts that you want to see. Refer to Customizing Your Charts in Topic 1. Note that you can click on the to that chart. Info button on any Dashboard chart to view a help page specific 11
15 Using the Basic Chart Functions Charts show different types of data, but their interactive features work in the same way. Some of the functions simply change the view of your chart windows, and the others allow you to interact with your chart to view different levels of data; furthermore, you can also navigate from your charts to specific areas of CAT. Figure 8 defines the different functions you use to view and interpret a chart: a. b. c. d. e. f. g. h. i. Figure 8 j. a. Title Bar - To move a chart, click and hold the title bar and drag it to a new position on your Dashboard. b. Full-Screen Mode - Click to expand the chart to full screen size. c. Collapse/Expand Window - Click to collapse the chart to its title bar/click to expand the chart to normal view. d. Info Button - Displays information specific to a dashboard chart. e. Popup Box - When you mouse over different areas of a bar, a popup box appears showing you information about a particular area. f./g. Page Back/Forward Arrow - Click on the arrows beside the slider bar to move through the chart pages. h. Slider - Right click and hold the slider, then drag the slider back and forth through chart pages. i. Legend - Explains what the chart colors represent. Some charts allow you to click on the legend symbols to filter the chart details. j. Page Numbers - Shows you the current page you are viewing and the total number of pages in the chart. 12

16 Drilling in and Out of a Chart The drilldown feature of the Dashboard charts is a vital function, as it allows you click on specific data in the chart and navigate to a relevant area of CAT, such as the Gap Analysis. Some charts also have multiple levels of data. When you click on a bar in a chart, you will drill into the next level of the chart. For example, in the Skill Gaps chart you can click on a Skill Description bar, and the next level will show you all the people assigned this Skill Description and the dominant assessment status for each Competency Level (Figure 9 & Figure 10). Looking at the second level of the Skill Gaps chart (Figure 10), you can click on a bar beside a person s name, and you will be redirected to his/her Gap Analysis, where relevant Development Activities will be highlighted for you (Figure 11). Figure 9 When you want to go back to the previous level of a chart, simply click on the Back button located in the upper left-hand corner of a chart (You will never see this icon on the first level of a chart). Figure 10 13

17 Figure 11 Viewing Chart Details On each chart, you mouse over different areas of the pie section or bar to get more detail through a popup display (Figure 12). You can access additional data pages by using the back/forward arrows or the slider at the bottom of charts. A legend lets you filter the chart data. Figure 12 Filtering Data in a Chart You can filter the data you see in your chart by clicking on the items in the legend. You can see in the images below that Normal has been clicked in the legend, so now only High Importance Skill bars show up in the chart (Figure 13). 14


18 Figure 13 Showing/Hiding Charts You will also use some of these functions to customize the Dashboard to your performance management needs. If the chart information is not currently useful, the Collapse/Expand Window button allows you to reduce the chart so only the Title Bar remains. To move a chart, click and hold the title bar then drag it to the new position on your Dashboard. Figure 14 shows a Dashboard where two charts have been collapsed to their Title Bars. Figure 14 15

19 Interpreting and Using Each Chart Type Chart data helps you plan and monitor your team s competency during each stage of the performance development cycle. Each Dashboard chart makes timely data available to supervisors for individual Participants and for the team. Understanding the purpose and functions specific to each Dashboard chart will help you select the most useful chart data for your team s development. Participant Assessments Required Interpreting the Chart This chart (Figure 15) displays your team members who need to complete the most assessments. This interactive bar chart shows you the percentage of required Skill assessments that each person on your team has or has not completed. The darker yellow represents High Importance Skills, and the lighter yellow represents Normal Skills. Using the Chart The chart data shows the Participants with the fewest completed assessments first. You can view the outstanding assessments by the bar charts or through the popup display. As Figure 16 shows, you can click from this chart to a Participant s Gap Analysis. a. b. c. d. e. Figure 15 a. Percentage of assessments done or required. b. Dark yellow indicates High Importance Skill Descriptions. c. Light yellow indicates Normal Skill Descriptions d. Click anywhere on a bar to go to a person s Gap Analysis (Figure 16). e. Place your cursor on a light or dark yellow part of a bar to view percentage of uncompleted assessments. 16


20 Figure 16 Supervisor Assessments Required Interpreting the Chart The Supervisor Assessments Required chart (Figure 17) displays which team members need the most Supervisor assessments. This interactive bar chart shows you the percentage of Skill assessments you need to complete for each person on your team. The dark orange represents High Importance Skills and the light orange represents Normal Skills. Using the Chart The chart first displays Participants with the fewest completed assessments. When you click to the Participant s Gap Analysis, you can see which assessments you need to complete for that person. 17

21 a. c. b. d. e. Figure 17 a. Percentage of assessments done or required. b. Click anywhere on a bar to go to a person s Gap Analysis. c. Dark orange indicates High Importance Skill Descriptions. d. Light orange indicates Normal Skill Descriptions e. Place your cursor on a light or dark orange part of a bar to view percentage of uncompleted assessments. Skill Gaps Interpreting this Chart This chart displays your team s weakest skills. The first level (Figure 18) shows you the names of the Skills and Skill Descriptions assigned to your team. The colored bars represent the Skill gaps and/or strengths that exist for each Skill for all the people on your team. The red represents undeveloped, and the green represents developed. When you click on any bar, you will drill into the next level of the chart that shows the people assigned this Skill and their assessments represented by Competency Level (Figure 19). Using the Chart The first level of the chart shows the Skill Descriptions starting with the least to the most developed. From this level you can drill down to the second chart level (Figure 19) to see the assessed Skill Description status of each team member. 18

22 b. c. a. d. e. f. Figure 18 a. Skill names. b. Red indicates undeveloped Skill Descriptions. c. Green indicates developed Skill Descriptions d. Click anywhere on a bar to go to a person s Gap Analysis. e. Place your cursor on a red or green part of a bar to view the number and percentage of undeveloped skills. f. Number of Skill Descriptions represented in a Skill Gap. g. Click on the legend to filter your chart data. At the second level of the Skill Gaps chart, bars or a popup box show you the Skill Description assessments of the people assigned this Skill (Figure 19). From this chart, you can click on any bar color to be redirected to the person s Gap Analysis to see relevant Development Activities. g. 19
.")
23 a. c. b. d. e. Figure 19 a. Skill Gap name. b. Team member names. c. Competency levels. d. Click anywhere on a bar to go to a person s Gap Analysis. e. Place your cursor on a bar color to view the count and percentage of Skill Descriptions assessed at that competency level for the team member. High Importance Skill Gaps Interpreting this Chart This chart displays which High Importance Skills are the weakest on your team (Figure 20). The colored bars represent the High Importance Skill gaps and/or strengths that exist for your team. The red represents undeveloped, and the green represents developed. When you click on a red or green bar, you will drill into the next level of the chart which shows the Participants assigned each High Importance Skill and their competency assessment level for the skill. From there you can click through to the Person s Gap Analysis. Using the Chart The first level of the chart shows the High Importance Skill Gaps for all you team starting with the largest gaps. You can click anywhere on a bar to drill into the next level of the chart and view the people assigned this Skill (Figure 21). 20

24 b. c. a. d. e. f. Figure 20 g. a. Skill names. b. Red indicates undeveloped Skill Descriptions. c. Green indicates developed Skill Descriptions d. Click anywhere on a bar to go to a person s Gap Analysis. e. Number of Skill Descriptions represented in a Skill Gap. f. Place your cursor on a red or green part of a bar to view the number and percentage of undeveloped skills. g. Click on the legend to filter your chart data. The second level of the chart, shows your team member names beginning with the person with the most gaps (Figure 21). When you click on a person s High Importance Skill Gaps bar, you will be redirected to his/her Gap Analysis where relevant Development Activities will be highlighted. 21
25 a. c. b. d. e. Figure 21 a. Skill Gap name. b. Team member names. c. Competency levels. d. Place your cursor on a red or green part of a bar to view the number and percentage of undeveloped skills. e. Click anywhere on a bar to go to a person s Gap Analysis. People with High Importance Skill Gaps Interpreting this Chart This chart (Figure 22) displays the people who have the greatest gap in their High Importance Skills. The first level of the chart shows you the number of High Importance Skills assigned to each team member and the number of Skill Descriptions that are undeveloped or developed for each person. The red represents undeveloped, and the green represents developed. Using the Chart Team members are displayed starting with those who have the most High Importance Skill Gaps to develop. When you click on a person s High Importance Skill Descriptions bar, you will be redirected to his/her Gap Analysis so you can easily see their Skill gaps in context and plan development to fill those gaps. 22

26 b. a. c. d. e. f. g. Figure 22 a. Team member names. b. Red indicates undeveloped Skill Descriptions. c. Place your cursor on a red or green part of a bar to view the number and percentage of undeveloped skills. d. Green indicates developed Skill Descriptions e. Number of High Importance Skill Descriptions represented in a Skill Gap. f. Click anywhere on a bar to go to a person s Gap Analysis. g. Click on the legend to filter your chart data Recommended Development Activities Interpreting this Chart This chart displays the most impactful Developmental Activities for your team. On the first level, colored bar sections represent the number of Skill Descriptions assigned to your team, by assessment type, for each Developmental Activity. The next chart level shows you the number of Skill Descriptions that a Developmental Activity would impact for each person. Using the Chart This chart displays all the recommended Development Activities for your team starting with the Development Activity that has the highest number of Skill Descriptions assessed as Not Assessed and FEW (Figure 23). Development Activity names are hyperlinks that you can click on for more detailed information on that activity. When you click on a Recommended Development Activities 23

27 bar, you will drill into the next level of the chart (Figure 23). From that level you can go to the person s Gap Analysis. a. b. c. g. d. e. f. Figure 23 a. Development Activity names b. Colors indicate the assessment status of team Skill Descriptions affected by the Development Activity c. Click anywhere on a bar to go to detailed information on Skills impacted for individuals (Figure 24). d. Place your cursor on any part of a bar to view count and percentage details. e. Indicates the number of Skill Descriptions impacted by the Development Activity f. Click on any item in the legend to filter your chart by assessment status. g. Click the hyperlink for more detail on an Activity. At the next level of the Recommended Development Activities chart (Figure 24), you see the number of Skill Descriptions that a Developmental Activity would impact for each person. The chart starts with the team member who would have the most Skill Descriptions impacted. When you click on a person s Skill Descriptions bar, you will be redirected to his/her Gap Analysis so you can easily see their Skill Gaps in context and plan development for those gaps. 24
28 a. b. d. c. Figure 24 a. Development Activity name b. Team member names c. Place your cursor on any part of a bar to view count details. d. Click anywhere on a bar to go to the Gap Analysis for individuals. Lowest Percent Developed Interpreting this Chart This chart displays which people on your team need the most development (Figure 25). The first level shows your team members names and their percent developed in comparison to the Position averages. When you click on a person s Percent Developed bar, you will drill into the next level of the chart and see detailed development and assessment information for a selected person. From that level you can go to the person s Gap Analysis. Using the Chart This chart starts with the Participant with the lowest percent developed. For more detailed information on a Participant s development and assessment percentages, you can click on the bar to drill into the next chart level (Figure 26). 25
29 a. b. c. d. e. Figure 25 a. Percentage of development b. Position average company-wide c. Click anywhere on a bar to go to a person s assessment and development percentages. d. Click on Percent Developed and/or Position Average in the legend to filter your chart. e. Place your cursor on a bar to view more development details. On the next level of the Lowest Percent Developed chart, you can learn more about each team member s percentage developed and assessed (Figure 26). When you click on a person s bar, you will be redirected to his/her Gap Analysis to quickly see which Skills need to be developed or assessed. 26
30 a. b. d. c. Figure 26 a. Percentage of development of assessment b. Place your cursor on any bar to view more details about a person s development and assessment c. Click on any item in the legend to filter your chart d. Click on any bar, and you will be redirected to the person s Gap Analysis for more detailed information My Team s Development Status Interpreting this Chart This chart overviews your team Percent Developed status based on Supervisor, Participant, and Team development (Figure 27). Colored bars show the percentage of development and assessment completed by you and the Participants. 27
31 f. a. b. c. d. e. Figure 27 Team average Percent Developed based on: a. Supervisor assessments. b. Participant assessments. c. Dominant assessment. Team average for completion of: d. Participant assessments. e. Supervisor assessments. f. Place your cursor on a bar to view details. You ve reached the end of Topic 2. You can now move on to Topic 3: Using Quick Reports 28
32 Topic 3 Using Quick Reports Overview Understanding the Quick Reports Window Opening a Quick Report Subscribing to Quick Reports Interpreting Each Quick Report Type
. You can then share your reports with others, delete, or save according to your needs and preferences.")
33 Topic 3: Using Quick Reports Overview You can run reports about your team s development directly from the Quick Reports window on your Dashboard, as shown in Figure 28. (Your Dashboard layout may look different than in the screenshot below). You can then share your reports with others, delete, or save according to your needs and preferences. You can also move the Quick Reports window to a different area on your Dashboard or collapse the window. See Customizing Your Dashboard in Topic 1. Figure 28 The following Quick Reports appear by default in a list on your Dashboard. This list may look different for you if your organization has decided to customize this list. Assessment Status by Position Displays your team s completion of their assessments. Gap Analysis by Position Allows you to quickly identify gaps and strengths of your team members. 30


34 High Importance Skill Gaps Displays which High Importance Skills are the weakest in your team. Lowest Percent Developed Displays which people on your team need the most development. Participant Assessments Required Displays your team members who need to complete the most assessments. People with High Importance Skill Gaps Displays your team members who have the greatest gap in their High Importance Skills. Recommended Development Activities Displays the most impactful Developmental Activities for your team. Skill Gaps Displays which Skills are the weakest for your team. Supervisor Assessments Required Displays which team members need the most Supervisor assessments. Understanding the Quick Reports Window The Quick Reports window appears on your Dashboard, and allows you to run, subscribe to, and share the listed reports. Figure 29 outlines the features of the Quick Reports window. 31 Figure 29 Report names: Click on the hyperlinked report name to generate the report. Info button: Click on the Info button to view a help page specific to that report. Subscribe: Use a dropdown box to choose how often you would like a report automatically delivered to your inbox. CC: Click to forward reports to others or arrange for reports to be automatically forwarded.


35 Opening a Quick Report Quick Reports are run from your Dashboard, and then viewed as an Excel document. Opening the Quick Report will vary slightly depending on your system configuration. If you are working with Microsoft Office 2.0 or earlier or Internet Explorer systems 8.0 or earlier, you will need to save the report before opening it for the data to display properly. Also, when the Excel page opens, you will need to click the Enable Editing button for the report data to be displayed. To Open a Quick Report: 1. Click on the hyperlinked name of a Quick Report (Figure 30). A dialogue box appears with Open, Save, and Cancel options. 2. Click Open (Figure 31). An Excel page will open in a Protected View. Note: If you are working with Internet Explorer 8 or earlier or with Microsoft Office 2.0 or earlier, you will need to click Save and save the report to a folder or desktop before opening the file. 3. Click Enable Editing (Figure 32) to display the report data (Figure 33). Figure 30 Figure 31 Figure 32 32


36 Figure 33 Subscribing to Quick Reports Using the Subscribe and CC features of Quick Reports, you can select reports to be automatically sent to your inbox every week or month. You can also have those reports automatically ed to other people in the CAT system. Note that you must have an address in the system to use the Subscribe and CC features. If you do not have an address in the system, all the subscribe features will be grayed out, and you will see the warning message that you see in Figure 34. To add an address to your account, contact your Administrator. Subscribe Figure 34 You can subscribe to any of the Quick Reports to have an Excel file sent to your inbox every week or month. Figure 35 shows the three scheduling options available in a dropdown menu for any Quick Report. 33

.")
37 Figure 35 Not Subscribed: Report will not be sent to you. Every week on Sunday: Receive the report at the start of every week. Every month on day 1: Receive the report on the first of every month. CC You can also have the report information forwarded to others, either by ing the file directly to them or by having the report automatically ed to them by using the CC feature (Figure 36). Figure 36 To arrange for a report to be forwarded to other recipients, choose a report, select the subscription frequency, and then click on the CC button to open the Quick Report Recipients dialogue box (Figure 37). The CC button will always be grayed-put when Not Subscribed is selected. 34

38 Figure 37 In the dialogue box, you can list multiple recipient addresses, separating each address by a comma (Figure 38). After entering the addresses, click Save to close the dialogue box. The recipients will automatically receive the selected report according to the schedule you selected. To cancel a subscription, click CC to re-open the dialogue box and delete the address, and click Save. Figure 38 If you enter an address that is not in the system, the error message in Figure 39 will be generated. 35

39 Figure 39 Interpreting Each Quick Report Type After you have run a report from the Quick Reports window, it appears in Excel in a Pivot format. The remainder of this topic presents information on interpreting and using each type of Quick Report as displayed in Excel. Assessment Status by Position 36 Interpreting this Report This report displays data about your team s assessment status by assigned Position (Figure 40). Data is displayed in both a bar chart and a table. The bar chart (1) shows the top five Positions on your team with the most development required. The Percent Assessed for each Position is shown as well. The purple bar represents the percentage assessed and the gold bar represents the Percent Developed. Below the bar chart, a PivotTable (2) lists data about assessment and development percentages for your entire team for all assigned Positions. The table has eight columns. The first four columns display your team member s names, the percentage of development and assessment for team members, and the date Participants last assessed themselves. The next three columns repeat that development and assessment information for the team Supervisor. The eighth column displays the average percentage of development for all the people within the company assigned the same Position. The rows in the PivotTable are displayed in hierarchical levels by Position, Map, Skill Group, Skill, and team member names. Using the Report This report is in Excel format and has three worksheets: Assessment Status by Position This is the main worksheet of the report, displaying the chart and table in Pivot format. You can use the Name filter dropdown menu button (2) to filter data
 allows you to show or hide rows of data by Position, Map, Skill Group, Skill, and team member names.")
40 you want to see in the table. You can also filter the data based on the group structure within CAT using the dropdown menus (3) in the top-left corner of the worksheet. Clicking on the expand + and collapse icons (2) allows you to show or hide rows of data by Position, Map, Skill Group, Skill, and team member names. You can also customize and manipulate the chart (1) in any way you want by filtering information, or you can change the aesthetics of your chart by using Excel s features. ReportSettings This worksheet shows the selections used to generate this report. You can use this worksheet as a reference to see what data was chosen to be reported on. This is especially useful when trying to differentiate a Quick Report from a normal report. ReportData This worksheet shows all the data that was used to generate this report. It is highly recommended that you use this sheet only as a reference and not modify the data on this sheet. Since this report is in Excel format, you can save, share, and print the report or you can discard the report when you are finished with it. Tip: To remove the blank row(s) at the top of the table, click on the dropdown arrow beside Name column title, and deselect blank. Figure 40 37
41 Gap Analysis by Position Interpreting this Report The Gap Analysis Percent Quick Report (Figure 41) allows you to quickly identify gaps and strengths of your team members by displaying data about the Percent Developed averages for your team members in a PivotTable. The table columns (1) display the four Competency Levels and the average percentages for each row label. The competency status for each row label is easily identified by the assessment colors. Red and yellow areas indicate gaps, and green areas indicate strengths. The rows (2) display the Positions, Maps, Skill Groups, Skills, and team member names. Using the Report This report is in Excel format and has three worksheets: Gap Analysis by Position This is the main worksheet of the report, displaying the table in Pivot format. You can use the Row Labels filter dropdown menu button (1) to filter data you want to see in the table. You can also filter the data by using the Position Classifier and Position Sub Classifier dropdown menus (3). Clicking on the expand + and collapse icons (2) allows you to show or hide rows of data. ReportSettings This worksheet shows the selections used to generate this report. You can use this worksheet as a reference to see what data was chosen to be reported on. This is especially useful when trying to differentiate a Quick Report from a normal report. ReportData This worksheet shows all the data that was used to generate this report. It is highly recommended that you use this sheet only as a reference and not modify the data in this sheet. Since this report is in Excel format, you can save, share, and print the report or you can discard the report when you are finished with it. 38

42 Figure 41 High Importance Skill Gaps Interpreting this Report The High Importance Skill Gaps Quick Report (Figure 42) displays data, in a bar chart and table, about the people on your team who need to develop the most High Importance Skill Descriptions. The bar chart shows you the five most undeveloped High Importance Skills assigned to your team. The red represents undeveloped, and the green represents developed. Below the bar chart, a table lists the number of undeveloped and developed High Importance Skills for your team, from the least to the most developed. The table has three columns that display the Skill Gap names and the number of undeveloped and developed High Importance Skill Descriptions. Using the Report This report is in Excel format and has two worksheets: High Importance Skill Gaps This is the main worksheet of the report, displaying the chart and table in Pivot format. You can use the filter dropdown button to filter the data that appears in the table. Using Excel s features and Pivot functionality, you can also customize and manipulate the chart, such as filtering information and changing the aesthetics. 39
43 ReportData This worksheet shows all the data that was used to generate this report. It is highly recommended that you use this sheet only as a reference and not modify the data in this sheet. Since this report is in Excel format, you can save, share, and print the report or you can discard the report when you are finished with it. Figure 42 Lowest Percent Developed Interpreting this Report The Lowest Percent Developed Quick Report (Figure 43) displays data about how much development the people on your team need. Data is displayed in both a bar chart and a table. The bar chart shows you the five team members who need the most development in comparison to the Position averages. The green line shows the average Percent Developed for all the people within the company assigned the same Position as the person indicated in the chart. Below the bar chart, a table lists data about development for your entire team, listed by the least to the most developed. The table has four columns that display your team member s names, their 40

44 Positions, their Percent Developed, and the average development for that Position company-wide (Position Average). Using the Report This report is in Excel format and has two worksheets: Lowest Percent Developed This is the main worksheet of the report, displaying the chart and table in Pivot format. You can use the filter dropdown button to filter the data that appears in the table. Using Excel s features and Pivot functionality, you can also customize and manipulate the chart, such as filtering information and changing the aesthetics. ReportData This worksheet shows all the data that was used to generate this report. It is highly recommended that you use this sheet only as a reference and not modify the data in this sheet. Since this report is in Excel format, you can save, share, and print the report or you can discard the report when you are finished with it. Figure 43 41
45 Participant Assessments Required Interpreting this Report The Participant Assessments Required Quick Report (Figure 44) displays your team members who need to complete the most assessments. Data is displayed in both a bar chart and a table. The bar chart shows you the five team members with the highest percentage of assessments to complete. The darker yellow represents High Importance Skills, and the lighter yellow represents the Normal Skills. Below the bar chart, a table presents data about the assessments team members need to complete, listed by the most assessments required to the least assessments required. The table has four columns that display your team member s names, the percentage of High Importance Skills and Normal Skills requiring assessments, as well as the total percent of assessments required. Using the Report This report is in Excel format and has two worksheets: Participant Assessment Required This is the main worksheet of the report, displaying the chart and table in Pivot format. You can use the filter dropdown button to filter the data that appears in the table. Using Excel s features and Pivot functionality, you can also customize and manipulate the chart, such as filtering information and changing the aesthetics. ReportData This worksheet shows all the data that was used to generate this report. It is highly recommended that you use this sheet only as a reference and not modify the data in this sheet. Since this report is in Excel format, you can save, share, and print the report or you can discard the report when you are finished with it. 42
46 Figure 44 People with High Importance Skill Gaps Interpreting this Report The People with High Importance Skill Gaps Quick Report (Figure 45) displays your team members who have the greatest gap in their High Importance Skills. Data appears in a bar chart and table. The bar chart shows you the five team members with the highest number of undeveloped High Importance Skill Descriptions. The red represents undeveloped, and the green represents developed. Below the bar chart, a table shows the number of undeveloped and developed High Importance Skill Descriptions for your entire team from the least to the most developed. The table has three columns that display your team member s names and the number of undeveloped and developed High Importance Skill Descriptions. Using the Report This report is in Excel format and has two worksheets: People High Importance Skill Gaps This is the main worksheet of the report, displaying the chart and table in Pivot format. You can use the filter dropdown button to filter the data in the 43
47 table. You can also customize and manipulate the chart in any way you want by filtering information or changing the aesthetics of your chart by using Excel s features. ReportData This worksheet shows all the data that was used to generate this report. It is highly recommended that you use this sheet only as a reference and not modify the data in this sheet. Since this report is in Excel format, you can save, share, and print the report or you can discard the report when you are finished with it. Recommended Development Activities Figure 45 Interpreting this Report The Recommended Development Activities Quick Report (Figure 46) displays a bar chart and a table about which Developmental Activities would develop the most Skills Descriptions for your team. The bar chart shows you the five Development Activities that would impact the most Skill Descriptions assigned to your team. Each Development Activity s bar shows the number of impacted Skill Descriptions, and the colors on the bar represent the current assessment statuses of those Skill Descriptions for all the people on your team. 44

48 Below the bar chart, a table lists data about all Development Activities that would impact your team s development, listed from the most impacted to the least impacted. The table has seven columns that display the Developmental Activity code and name, the number of Skill Descriptions by assessment type, and the total number of Skill Descriptions to be developed. Using the Report This report is in Excel format and has two worksheets: Recommended Dev Activities This is the main worksheet of the report, displaying the chart and table in Pivot format. You can use the filter dropdown button to filter the data that appears in the table. Using Excel s features and Pivot functionality, you can also customize and manipulate the chart, such as filtering information and changing the aesthetics. ReportData This worksheet shows all the data that was used to generate this report. It is highly recommended that you use this sheet only as a reference and not modify the data in this sheet. Since this report is in Excel format, you can save, share, and print the report or you can discard the report when you are finished with it. Figure 46 45
49 Skill Gaps Interpreting this Report The Skill Gaps Quick Report (Figure 47) displays data about which Skills need the most development on your team, in both a bar chart and a table. The bar chart shows you the five least developed Skills that are assigned to your team. The red represents undeveloped, and the green represents developed. Below the bar chart, a table lists the number of undeveloped and developed Skill Descriptions for your team, from the least to the most developed. The table has three columns that display the Skill Gap names, and the number of undeveloped and developed Skill Descriptions. Using the Report This report is in Excel format and has two worksheets: Skill Gaps This is the main worksheet of the report, displaying the chart and table in Pivot format. You can use the filter dropdown button to filter the data that appears in the table. Using Excel s features and Pivot functionality, you can also customize and manipulate the chart, such as filtering information and changing the aesthetics. ReportData This worksheet shows all the data that was used to generate this report. It is highly recommended that you use this sheet only as a reference and not modify the data in this sheet. Since this report is in Excel format, you can save, share, and print the report or you can discard the report when you are finished with it. 46

50 Figure 47 Supervisor Assessments Required 47 Interpreting this Report The Supervisor Assessments Required Quick Report (Figure 48) displays data about which team members need the most Supervisor assessments. Data is presented in both a bar chart and a table. The bar chart shows your top five team members with the highest percentage of Skill assessments that you need to complete. The darker orange represents High Importance Skills, and the lighter orange represents the Normal Skills. Below the bar chart, a table lists data about the assessments you need to complete for your entire team, listed by the most assessments required to the least assessments required. The table has four columns that display your team member s names, the percentage of High Importance Skills and Normal Skills requiring assessments, as well as the total percent of assessments required. Using the Report This report is in Excel format and has two worksheets: Participant Assessments Required This is the main worksheet of the report, displaying the chart and table in Pivot format. You can use the filter dropdown button to filter the data that appears in the table. Using Excel s features and Pivot functionality, you can also customize and manipulate the chart, such as filtering information and changing the aesthetics. ReportData This worksheet shows all the data that was used to generate this report. It is highly recommended to use this sheet only as a reference and not to modify the data in this sheet.

51 Since this report is in Excel format, you can save, share, and print the report or you can discard the report when you are finished with it. Figure 48 You ve reached the end of Topic 3. You can now move on to Topic 4: Viewing and Editing a Person 48
52 VIEWING AND EDITING A PERSON Topic 4 Viewing a Person Editing a Person s Details
53 Topic 4: Viewing and Editing a Person A Supervisor can view information about a particular person this includes Person and Role information, Competency Inventory, Gap Analysis, Activity Profile, and Development Plan. You may be able to edit this information, depending on your permissions. Viewing a Person To view a person, click on My Team s Development in the menu (Figure 49). Figure 49 Choose a person from the Assigned Groups tree, as shown in Figure 50. (This can also be done by clicking on a Group in the main screen, then selecting a Person from the Participant list.) Figure 50 Once you have clicked on a person, your main screen will display a number of navigation tabs (Figure 51). 50

54 Figure 51 Dashboard The Dashboard tab is selected by default, and it has several sub tabs: Overview, Details, Role Summary, Account History, and Role History. These tabs display account and role information about the selected person. Overview Overview is the first tab displayed under the Dashboard tab. It displays the selected person s Dashboard, as he/she would see it when logging in (Figure 52). Depending on the options set by your System Owner, the Supervisor Assessment chart, Development Status chart, and Development Cycle chart may not be displayed. Figure 52 51
55 The charts you see in the Overview are interactive. You can place your mouse over the chart pie sections or bars to see count and/or percentage information. If you click on a pie chart you are redirected to the Participant s Competency Inventory. To learn more about how to interpret and use each chart, click on its Info button. Details The Details tab shows a person s details, which are sectioned into four boxes: Properties, Person Profile (optional), Assigned Positions, and Group Membership, as shown in Figure 53. Figure 53 Properties Lists the person s last name, first name, middle name, employee number, address, account status, last login, user ID, Position, and account creation date. The person picture is displayed in the top-right corner (Figure 54). 52

56 Figure 54 Person Profile Displays information the organization can customize (Figure 55). The Profile Categories listed will be ordered alphabetically. Hierarchy representation will always be shown with an indentation of 2 characters to the right. Assigned category values of sub-categories will not be indented but aligned with all the other category values shown. Figure 55 Note: The Person profile may show no information at all, if your organization has decided not to use this feature. Assigned Positions Displays a tree of the Position and Growth Position assigned to a Person. Clicking on a Position sets the Position Context to be used by the Competency Inventory, Gap Analysis, and Activity Profile tabs. This means the data within the Competency Inventory tab will be based on the Position selected. 53


57 In Example A, you can see that the Junior Engineer Position was selected; therefore, this Position is opened up in the Competency Inventory. In Example B, the Reservoir Engineer Position is selected; therefore, this Position is opened in the Competency Inventory. Example A Example B If Competency Inventory, Gap Analysis, or Activity Profile tabs are selected and there was no Position Context set, the person s assigned Position will open by default. Group Membership Lists the groups the person belongs to and his/her roles(s). As shown in Figure 56, this person belongs to a group named Oil & Gas and has been assigned the Participant role. (If the person belongs to multiple groups, they will be displayed in a hierarchy.) Clicking on the group name will open up the Group Profile page. Figure 56 54


58 Role Summary The Role Summary tab displays a list of assigned roles and which groups that person belongs to in those roles. Its associated permission sets are assigned under Groups, Positions, Maps, and Development Activities. This provides a centralized location for you to retrieve security policy information on the objects assigned to the selected person. The objects will be ordered alphabetically and will only appear if the person has permissions against it. Competency Map, Development Activity, and Position objects in the classifier and sub-classifier will always appear. Assigned roles will be displayed beside the object as (<role icon> <role name> - <permission set name>). As a Supervisor, you will be managing Participants, unless you have been granted additional permissions. Figure 57 shows an example of a Participant role summary for the person, Jane Smith. You can see that this person belongs to be United States group with the Participant role. Figure 57 Account History With so many roles and group memberships within a system, it is important to have a history of when changes occur. The Account History tab displays records related to the properties and profile for a selected person. You may find this tab useful at times as you plan and monitor employee development information. A change may affect an employee in your group and you may want to clarify the reason for the change. As shown in Figure 58, the Account History tab shows the changes that were made to Jane Smith s properties or profile information, including when the change was made, who made the change, and details about the change. Figure 58 55
59 Role History The Role History tab provides history records related to role and group membership changes for the selected person. Information is tracked through Date, Editor, Area, Type of Edit, and Value fields. You may find this tab valuable when you notice a discrepancy. For example, if a new person is added to your group, you may wonder how that person got there. By looking at the Role History tab, you would be able to see when the change was made and who made the change you can then directly inquire about why the change was made. Competency Inventory The Competency Inventory tab displays the Supervisor s version of the Competency Inventory (Figure 59). By default, it will load the person s assigned Position, but a Growth Position could be loaded, if the Position Context is set, as explained under Assigned Positions in this topic. Figure 59 If the Person has no assigned Position, then a message would appear within the Competency Inventory area in red font: Person does not have an assigned Position. If the person has a Growth Position, please set that as the context and reload this tab. Note: If the System Owner has decided to hide Map names, you will only see the Map s Skill Group names. Map names will also be hidden in the Gap Analysis. Gap Analysis The Gap Analysis tab will load the Supervisor s version of the Gap Analysis page for the selected Person (Figure 60). By default, it will load the person s Position (as opposed to their Growth Position), if the Position Context was not set. 56


60 Figure 60 If the person has no assigned Position then a message would appear in red font: Person does not have an assigned Position. If the person has a Growth Position, please set that as the context and reload this tab. Activity Profile The Activity Profile tab loads the Supervisor s version of the Activity Profile for the selected person (Figure 61). By default, it will load the person s assigned Position if the Position Context was not set. Figure 61 If the Person has no assigned Position then a message would appear in red font: Person does not have an assigned Position. If the person has a Growth Position, please set that as the context and reload this tab. 57

61 Development Plan The Development Plan tab will load the Development Plan for the selected person (Figure 62). You will be able to add and remove Activities, set Dates, and provide notes, just as the Participant can. This is explained in Topic 4: Managing Development Plans in this manual. It is your role as a Supervisor to review the Participant s Development Plan and make the appropriate changes that are most beneficial to the development of a person s Position. Figure 62 Editing a Person s Details In the Details page header, you will see the Edit User and Delete User icons, if you have the permissions to edit and delete users. Edit User Will allow you to edit properties of the person selected. The availability of this icon will be controlled by a permission value. Delete User Will allow you to delete the person selected. When clicked, a message box will appear to request confirmation of the action. The availability of this icon will be controlled by a permission value. Figure 63 shows where the icons would appear on a person s Details page. 58
, and user id.")
62 Figure 63 Clicking on the Edit Person icon will display the same criteria pages used to create a new Person. The header shows the person s last name, first name, middle name (if applicable), and user id. You will be able to navigate through these pages by clicking on the criteria icons, as shown in Figure 64. In the header, the person s information is displayed as Last Name<comma> <space>first Name<space>Middle Name. Depending on configuration settings, the User ID or Employee Number also would be visible. Note: On the Properties page, the password in the Password field will always appear as 6 characters, even if it is longer or shorter. This is to provide another level of security in protecting a Person s password (Figure 64). 59
.")

63 Figure 64 Deleting a Person You can delete a person from the system by clicking on the Delete Person icon located on the Person Details page (refer back to Figure 63). A confirmation box will appear to ensure you want to make the deletion (Figure 65). Clicking Yes will remove the person from the system permanently. All records associated with that person within the database will be removed. Figure 65 You ve reached the end of Topic 4. You can now move on to Topic 5: Assessing a Person. 60
64 ASSESSING A PERSON Topic 5 Selecting a Person Opening a Person s Position Assessing a Person s Skills Development Cycle Tracking View Historical Comparison of Competency Inventory Show Only Assessments as of a Particular Date Show Only Assessments that Do Not Agree

65 Topic 5: Assessing a Person As a Supervisor, one of your main roles is to cross-assess the Skills of the people in your assigned groups. Conducting these assessments is an essential part in a person s development. Supervisors assess the Skills of a person like a Participant does. Refer to the CAT Enterprise Participant Manual, Topic 2: Assessing Your Skills, for instructions. Selecting a Person The first step in assessing a person is selecting a person. To select a person to assess: 1. Click on My Team s Development in the menu (Figure 66). Figure Expand a group name and then a role group from the Assigned Groups tree, and choose a person from the expanded list (Figure 67). Figure 67 Once you have a person selected, you can view information pertaining to this person by clicking on the navigation tabs in the main screen (Figure 68). You can learn more about viewing a 62
.")
66 person s information in Topic 3 of this manual, Viewing and Editing a Person. Figure 68 Opening a Person s Position To begin assessing a Person s Skills, click on the Competency Inventory tab. Your main screen will now display, by default, the person s assigned Position and assessments (Figure 69). If you want to assess a person s Growth Position, click on the Details tab, and choose the Growth Position in the Assigned Positions box. Figure 69 Open a Map by clicking on the + symbols to reveal the Skill Descriptions with the person s assessments (Figure 70). Figure 70 Note the icons in the header above the Maps. You can find detailed descriptions of these icons in the CAT Enterprise Participant Manual, Topic 2: Assessing Your Skills; however, there are a few icons that are unique to you as a Supervisor: 63
67 Concur with self-assessment of the individual Person Level Importance Show High Importance Skill Descriptions Assessing a Person s Skills Once you have a person s Position open, there are different ways you can assess the Skills. It s advised that you assess a person s Skills carefully and attentively; however, because conducting cross-assessments can be time-consuming, there are some methods that will help you complete them more quickly, yet effectively. There are several ways to assess Skills: Conduct a normal assessment Assess an entire skill group Concur with a Person s self-assessment Assess high importance skills first Normal Assessment Review The normal assessment review is assessing each Skill Description individually. This is done by right-clicking on a Skill Description and choosing All, Some, or Few from the popup menu. You can learn more about assessing Skills in this way in the CAT Enterprise Participant Manual, Topic 2: Assessing Your Skills. In the right-click menu, there is also an Open Dialog option also explained in the Participant Manual. The Open Dialog allows you to make assessments, manage Notes, and view the Skill Description s History. Managing Notes As a Supervisor, it is important to have open communication with the people you supervise. As you conduct assessments, you can use the Notes feature to view notes as well as add, edit, and delete your own notes. You may also be given permissions to edit and delete the notes of the people you supervise. Although you can see notes added by people you do not supervise, you will not be able to edit or delete their notes. To access the Notes feature, click on a Skill Description. Click on the Notes tab in the dialog box. You will see the Edit and Delete icons for the notes you are able to edit. To learn more about Notes, refer to the Participant Manual in the Assessment Dialog Box section in Topic 2: Assessing Your Skills. 64


68 Assessing an Entire Skill Group You can also assess a person s Skills by an entire Skill Group. Right click in any Skill Group header, and a popup menu will appear (Figure 71). You can use this feature even if you have already used the Concur option or have made individual assessments they will simply be overwritten. Figure 71 Concurring with a Person s Self-Assessment An efficient way to assess Skills is to concur with all the self-assessments in a Position. This function will change all of the Supervisor s assessments that are set to Not Assessed to match the person s assessments. It is important to begin by individually assessing all the Skills you do not agree with, and then using the Concur function to agree with the remaining Skills. To concur with a person s assessment, click on the Concur with Self-Assessment icon, as shown circled in Figure 72. Figure 72 A dialog box will appear to confirm this decision (Figure 73). Figure 73 65
.")
69 Assessing Skills of High Importance Another way to quickly assess is to begin with the Skills that are set as High Importance. With a Map open, click on the Show High Importance Skill Descriptions icon. This will filter and display only the Skills set to High Importance (Figure 74). You can now give these Skills a careful assessment. After the High Importance Skills have been assessed, click on the Show High Importance Skill Descriptions icon again to view the full Competency Map. Skim through and assess the remaining skills, spending less time reviewing, since they are not as high of a priority or importance. Figure 74 Development Cycle Tracking If the System Owner has this feature turned on, you will see the Development Cycle Tracking chart when you log in. This feature works as it does for the Participant. To learn about the basics of this feature and how it works for the Participant, please refer to the Participant Manual, Topic 2: Assessing Your Skills under Development Cycle Tracking. As a Supervisor, your view of the Development Cycle Tracking chart is based on the number of people you supervise. Each of the four stages, Self-Assessment, Cross-Assessment, Development Planning, and Execution, displays the planned dates along with a count of how many people have completed each stage. For example, if the count says 2/12, this means that two out of the twelve people you supervise have completed this stage. 66

70 Figure 75 When you click on a box, you are redirected to the Search page. You can leave the search field blank and click the search button this will display all the people in that particular stage. Or, you can enter a value in the search field, and it will search within the people in that stage. Setting Stages as Complete Your role as a Supervisor is to confirm that each stage is completed by clicking on the Assessment Complete/Plan Complete button, which looks like a checkmark, found in the header of a person s Competency Inventory and Development Plan. Below you can see how the color of this the checkmark changes: The Participant has not yet completed their self-assessments or their Development Plan. The Participant has indicated to you that their self-assessments or Development Plan is complete. You have completed your cross-assessment or review of a Participant s Development Plan. When you view a person s Competency Inventory, the color of the Assessment Complete button indicates if the Participant has completed their assessments and clicked on the button. If the checkmark is gray, the person hasn t clicked on the button. If the checkmark is red, as shown in 67


71 Figure 76, this indicates that the person has completed their self-assessment and clicked in the button. Also, you can see the date the self-assessment was completed on the bottom-right of the page. Figure 76 When you have completed your cross-assessments, click on the Assessment Complete button it then turns green. You can see in see in Figure 77 that the date the cross-assessment was set as complete is also indicated. Figure 77 Now that the self-assessment and cross-assessment stages are complete, the next stage is Devlopment Planning. This works in the same way as the two previous stages. A checkmark button, called Plan Complete, appears in a person s Development Plan. When you see the checkmark as red, it is time for you to review the person s Development Plan. Figure 78 When you have reviewed the Participant s Development Plan, you can click on the Plan Complete button it will then turn green, and the date the plan was approved will appear. 68

72 Figure 79 The Participant now moves on to the Execution stage, where he carries out his Development Activities. This stage becomes complete when it reaches its planned end date, the end of the calendar year. 69

73 View Historical Comparison of Competency Inventory The Historical Comparison option allows you to view a graphical side-by-side comparison of a person s Position from two different dates. This allows you to see progress or where improvements are needed. A Participant has access to this feature as well. When looking at a Participant s Competency Inventory, you will see the Historical Comparison icon in the header (Figure 80). Clicking on this icon opens the Historical Comparison dialog (Figure 81). Figure 80 Figure 81 The Historical Comparison dialog has two main fields and three options: Left: Indicates the date of the Position status shown on the left-side of the Historical Comparison. Right: Indicates the date of the Position status shown on the right-side of the Historical Comparison. (The current date is selected by default.) Only show differences: Displays only the changes that have occurred in the Position between the two dates. Show only High Importance Skill Descriptions: Shows a comparison for High Importance Skill Descriptions only. Greyscale: Displays the Historical Comparison in grayscale. 70
 4.")
74 To View a Historical Comparison of a Competency Inventory: 1. Click on the Historical Comparison icon. 2. Click on the Left Calendar button and choose a date. 3. Click on the Right Calendar button and choose a date. (The date is already populated with today s date, but you may choose any past date.) 4. (Optional) Select the Only show differences, Show only High Importance Skill Descriptions, and/or the Grayscale checkboxes. 5. Click the OK button. A new browser window opens displaying your historical comparison (Figure 82). Figure 82 Tip: You may reverse the historical comparison dates, so that the current position displays on the left rather than the right. 71

. 3. Choose a date from the popup calendar. 4. Click the OK button.")
75 Show only Assessments as of a Particular Date The Show Only Assessments Of icon gives you the option of viewing Skill Descriptions from before a specified date: To only show assessments of a specific date: 1. Click the Calendar icon in the Competency Inventory header (Figure 83). Figure Click on the Calendar icon in the dialog box (Figure 84). 3. Choose a date from the popup calendar. 4. Click the OK button. Figure 84 After you have specified a date, the assessments appear in a new browser window (Figure 85). 72

76 Figure 85 73


77 Show Only Assessments that Do Not Agree The Show Only Assessments that Do Not Agree icon allows you to view only the Skill Description boxes that have Participant and Supervisor assessments that do not match. For example, Figure 86 is the normal view of assessments; after the icon is clicked, you can see in Figure 87 how only the assessment that doesn t match appears. Figure 86 Figure 87 74
78 You ve reached the end of Topic 5. You can now move on to Topic 6: Setting Skill Importance. 75
79
80 SETTING SKILL IMPORTANCE Topic 6 Setting Skills as High Importance for an Individual Setting Skill Importance for a Group

81 Topic 6: Setting Skill Importance Setting Skill Importance for an Individual As a Supervisor, you may want to set certain Skills to a higher importance than other Skills, so that a person can focus on the Skills that would be most beneficial to his or her development. To set Skills as High Importance for a person: 1. Click on the My Team s Development in the menu. Figure Click on a person s name from the Assigned Groups tree (Figure 89). Figure Click on the Competency Inventory tab (Figure 90). Figure 90 77
. Click in the box again to remove the High Importance Setting.")

82 3. Click on the Person Level Importance icon (Figure 91). Figure Expand a Map with the + symbols and click on the Skill Descriptions you would like to set as High Importance. You will see an icon appear in the box, indicating it the Skill is being set as High Importance (Figure 92). Click in the box again to remove the High Importance Setting. Your settings will be saved automatically, and the person will now see an icon in the Skill Descriptions that have been set as High Importance (Figure 93). Figure 92 Figure 93 High Importance Skills are calculated in the Gap Analysis and Development Plan to help a person develop the Skills and take the appropriate Activities that are most beneficial to his or her development. Setting Skill Importance for a Group You can set certain Skill Descriptions to a higher importance than other Skill Descriptions for all the people that belong to one Group, just as you would for an individual. Note: Skill Descriptions set to High Importance in a Group will be High Importance for its subgroups as well. This can be only changed in the parent Group. 78

83 To set Skills as High Importance for a Group: 1. Click on the My Team s Development in the menu (Figure 94). Figure Expand a group in the Assigned Groups tree, then expand Position and click on a Position from the list. For example, in Figure 95, the Oil and Gas group has been expanded, and the Pipeline Engineer Position has been chosen. The Group Competency Inventory for this Position will now be displayed in your main screen. Figure Expand a Map by clicking on the + symbols. The Group Level High Importance icon is already selected by default (Figure 96). Click once in a Skill Description box to set it as High Importance this will be indicated by an icon. Click on the box again to remove the High Importance setting (Figure 97). 79
. Figure 97 Figure 98 You ve reached the end of Topic 6.")
84 Figure 96 Your changes will be automatically saved, and any people in the selected group and assigned to the selected Position will now see those Skills as High Importance, indicated with the High Importance icon (Figure 98). Figure 97 Figure 98 You ve reached the end of Topic 6. You can now move on to Topic 7: Managing Development Plans. 80
85 MANAGING DEVELOPMENT PLANS Topic 7 Reviewing and Amending a Development Plan
86 Topic 7: Managing Development Plans An important part of your role as a Supervisor is to review a person s Development Plan. This will ensure that the person is on track with taking the Activities that will be most beneficial to his or her Position. Reviewing and Amending a Development Plan Reviewing a person s Development Plan involves: adding (and removing) Development Activities; setting priority of Development Activities; setting dates; uploading documents; adding (and reviewing) notes. You use the Development Plan just like the Participant does. These functions are explained in full detail in the CAT Enterprise Participant Manual, Topic 4: Planning Your Development. You ve reached the end of Topic 7. You can now move on to Topic 8: Managing Groups. 82

87 MANAGING GROUPS Topic 8 Managing a Group Group Competency Inventory Group Gap Analysis Group Activity Profile

88 Topic 8: Managing Groups Part of your role as a Supervisor is to manage your assigned groups. This involves viewing and editing information for the group within Overview, Edit Group Membership, Group Competency Inventory, Group Gap Analysis, and Group Activity Profile. Managing a Group To manage a group: 1. Click on the My Team s Development link (Figure 99) in the menu--this will load the Assigned Groups tree in the left window. Figure Click on a group name in the Assigned Groups tree (Figure 100) this will load a number of navigation tabs in your main screen: Dashboard, Edit Group Membership, Group Competency Inventory, and Group Gap Analysis, and Group Activity Profile (Figure 101). You may also see the Position Assignment tab if you are given the Edit Position Assignment permission. For detailed instructions on how to use Position Assignment, refer to the Administration Manual. Figure 100 Figure 101 The information contained within these tabs is similar to the information of a single person, except that you are viewing or editing this information for all the people who belong to the selected group. 84
89 Dashboard/Overview The Group Overview tab displays information about the members of the selected group as well as the group hierarchy. The Position Status chart shows all the Positions that have been assigned to people in the group and the percentage developed for the people in that group as a whole (Figure 102). The formula to calculate percent developed for a Position: (1 x number of all assessments within the Position + (0.5 x number of some assessments within the Position) / total # of Skill Descriptions within the Position) x 100. Listed under the Position Status are all the Participant members in the Group. The Participant list gives details of Name, Position, Last Login, Last Assessment, % Developed, % Assessed Participant, and % Assessed Supervisor (Figure 102). You may also see the Development Cycle status and a Management list, depending on your permissions. The Participant Details page can be accessed from this page by clicking on the person s name in the Participant list. The Group Hierarchy section displays the group s parent structure. This allows you to see where your assigned group originates. In Figure 102, for example, you can see that a Supervisor has been assigned to manage the United States Group. The Group Hierarchy tree shows the top level or parent group United States. Properties and the History Beside the Overview tab, are the Properties and the History tabs. The Properties tab (Figure 103) displays the group name and the number of main and subordinate groups and group members. By default, Supervisors do not have permission to change this name. The History tab tracks changes related to values for the Properties tab. Information is tracked through Date, Editor, Property, Type of Edit, and Descriptions fields. 85

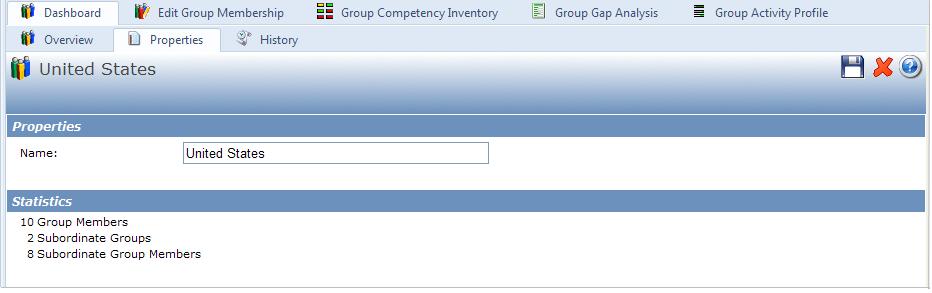
90 Figure 102 Figure


91 Group Competency Inventory The Group Competency Inventory is similar to the Competency Inventory, but it will not allow assessments to be done or notes to be added. This is accessed by first expanding a group in the Assigned Groups tree, then expanding the Position sub-group, and finally choosing a Position, as shown in Figure 104. Figure 104 Choosing a Position from the tree will automatically open the Group Competency Inventory page. In the header below the Position name is the group name and a count of the number of people in the group who have this Position assigned to them. For example, in Figure 105, Oil & Gas is the group name and (2) indicates that there are two people who have been assigned this Position in this group. Positioning your cursor over the group name will display a popup with a list of the people who can be supervised in this group with the Position assigned to them. The people listed will also display their Person Identifier (e.g. Person ID or Employee number) value, if set within the Site Configuration feature. Figure


92 Expanding a Map will display the Status Bar, which gives an average summary of the assessments of the people who are assigned this Position in the Group (Figure 106). You can learn more about the Status Bar in the CAT Enterprise Participant Manual, Topic 2: Assessing Your Skills. Figure 106 As a Supervisor, you have the ability to set Skill importance for a group from this page. This is done by left-clicking on Skill Descriptions, while the Group High Importance icon in the header is selected. This is explained in full detail in this manual under Topic 4: Setting Skill Importance. If a Skill Description has been set as High Importance for the Position, a dialog box will appear (Figure 107), since Position Skill Importance takes precedence over Group Skill Importance. Figure 107 To show High Importance Skills only, click on the Show High Importance Skill Descriptions icon in the right top corner of the header. Expand the Competency Map and Skill Group(s) to show the Skills that have High Importance only. As you can see in Figure 108, only the Skills set as High Importance are displayed, and the remaining Skills are not displayed. 88
.")

93 Figure 108 View Details Right-clicking on a Skill Description will provide the option to View Details (Figure 109). This will open a new window with a list of the Participant and Supervisor s assessments for the people listed in the Position Assigned to: section, as well as information about the Group and the Skill Description. Click on the x in the top right-hand corner to close this window (Figure 110). Figure


94 Figure 110 Group Gap Analysis The Group Gap Analysis is very similar to the regular Gap Analysis for a Participant. The only difference is that the Group Gap Analysis compiles data for an entire group. This is used to determine how a group as a whole is doing towards completing any given Position. To access the Group Gap Analysis, expand a group from the Assigned Groups tree, then rightclick on a Position and choose Group Gap Analysis from the popup menu (Figure 111). This will load the Group Gap Analysis screen for this Position. Figure

95 Viewing the Group Gap Analysis Page Embedded within the Group Gap Analysis page is information that can be viewed by placing your cursor over different parts of the page. The Position header displays the group name and the number of people assigned the Position. For example, in Figure 112, the group Oil & Gas has been assigned (2) people in the Pipeline Engineer Position. When you mouse over the group name, there will be a popup list that displays all the people assigned to the current Position. The list will display <last name, first name middle name, (username)>. The username is determined by the Person Identifier site configuration setting. Each person name will start on a new line within the box. You cannot print this box. You can also mouse over the Skill and Assessment Levels (Figure 112). Shows Skill name. Shows Skill Description and current assessment with percent complete. Figure 112 Viewing Skill Description Assessments When you right-click on a Skill Description, a menu appears with a View Details option (Figure 113). 91

 as well as both the Participant and Supervisor Assessments. At the bottom is the current date and the Dominant Assessment setting.")
96 Figure 113 This option opens a new window (Figure 114) that displays information about the Group Gap Analysis page, including the Skill, Skill Description, and Participants. The main content displays the Person name (Last Name, First Name Middle Name and unique identifier determined by the Person Identifier site configuration setting in brackets) as well as both the Participant and Supervisor Assessments. At the bottom is the current date and the Dominant Assessment setting. The Dominant Assessment will be italicized to distinguish which is dominant. Click on the x in the top-right corner to close this window. Figure


97 Group Gap Analysis High Importance The Group Gap Analysis displays Position and Group High Importance Skill Descriptions this is indicated by black diagonal hash lines through the Skill Description boxes. The icon, Show only High Importance, displays all Skill Descriptions that are set as High Importance at either the Position or Group level. Person level High Importance Skill Descriptions are ignored (Figure 115). Figure 115 Show/Hide Not Required Certain Skill Descriptions may be indicated as Not Required. In the Group Gap Analysis, these Skill Descriptions will not be shown regardless of the Show Positions Not Required site configuration setting. Color Blind Support The Group Gap Analysis will have color blind support like the regular Gap Analysis. To view the Group Gap page in grayscale, click on the Grayscale Icon, as shown in Figure 116. This option is set on a person by person basis. Figure

98 Legend The legend of the Group Gap Analysis will display the color of all assessments as well as the diagonal lines that indicate High Importance. Figure 117 shows the legend in color, and Figure 118 shows the legend in grayscale. Figure 117 Figure 118 Group Activity Profile The Group Activity Profile is a means to determine which Development Activities are most relevant within a Position. It has virtually the same look as the Activity Profile for a Participant, except data is accumulated from multiple persons. Summary of Group Activity Profile features: View Group Activity Profile (Count and breakdown of Development Activity assessments, mouse-over of graph details) Activity Type Filter View Development Activity information Sorting of Development Activities Show/Hide Not Required High Importance Color blind support Unassigned Skill Groups and Skills To access the Group Activity Profile, expand a group and then the Position list, and right-click on a Position. Choose Group Activity Profile from the popup menu (Figure 119): 94

99 Figure 119 Viewing the Group Activity Profile The Group Activity Profile is almost identical as it is for a Participant, except for a few differences: No Add to Development Plan icon The green highlighting of a Development Activity is removed. No mouse-over of the Development Activity name. Added ability of Show only High Importance. This will only display the High Importance and could possibly reorder the Activities. No Excel Version. The count for Number of Skill Descriptions is for all people in the selected group and not for a single person. (In the Person Activity Profile, the bar graph represents the number of Skill Descriptions linked to the associated Development Activity. o The breakdown is the number of Skill Descriptions of each assessment (All, Some, Few, Not Assessed, as well as the ones which are High Importance). o The bar graph represents the number of Skill Descriptions linked to the associated Development Activity for all the persons in the group this takes all the associated Skill Descriptions and the average of all the person assessments of each type. The Position header has been modified to include the group name and the number of Persons assigned the Position. Figure 120 shows the Position Benni Automated Test Position, for the Group BDA Group of Company and in that Group, there are 3 people assigned the Benni Automated Test Position Position. When you mouse-over the Group name, there will be a popup that lists all the people assigned to the current Position, listing their last name, first name middle name, and username. Each person name will start on a new line. You cannot print this box. 95
 as well as every sub-classifier (Activity Type).")
100 Figure 120 Activity Type Filter (Dropdown Menu) The Activity Type Filter works the same as it does for the Participant. The dropdown menu contains the options of Show All (default) as well as every sub-classifier (Activity Type). Viewing Development Activity Information Clicking on the Development Activity name will launch its associated URL in a new window. Development Activities with no associated URL will not be hyperlinked. Sorting of Development Activities The sorting of Development Activities will be identical to the Participant Activity Profile. The first Development Activity will be the one that has the highest number of Skill Descriptions assessed as Few and Not Assessed. Show/Hide Not Required Certain Skill Descriptions may be indicated as Not Required. In the Group Activity Profile, these Skill Descriptions will not be shown regardless of the Show Positions Not Required configuration setting. High Importance Since this is a group report, only Position and Group High Importance will be included. These two types of importance will not be distinguishable. They will both be indicated by the black diagonal lines through the linear bars. The person level High Importance is ignored. Color Blind Support Grayscale colors are supported for color blind people. This is a personal setting for each individual user. Unassigned Skill Groups and Skill Unassigned Skill Groups and Skills will not be directly shown in the Activity Profile; however, unassigned Skill Groups and Skills will still be counted in the number of Skill Descriptions associated with a Development Activity. 96
CAT Enterprise. Reports Manual
 CAT Enterprise Reports Manual Version 1.6 Revised February 2013 NOTICE AND DISCLAIMER The information contained herein (WORK) was prepared by or contributed to by various parties in support of professional
Manager Dashboard User Manual
 Manager Dashboard User Manual Manager User Guide The Manager User Guide is designed to provide a supervisor or a manager with step-by-step instructions for their daily tasks. Although every database will
Microsoft Office: Excel 2013
 Microsoft Office: Excel 2013 Intro to Charts University Information Technology Services Training, Outreach and Learning Technologies Copyright 2014 KSU Department of University Information Technology Services
IBM TRIRIGA Version Getting Started User Guide
 IBM TRIRIGA Version 10.3.1 Getting Started User Guide Note Before using this information and the product it supports, read the information in Notices on page 82. This edition applies to version 10, release
Version /2/2017. Offline User Guide
 Version 3.3 11/2/2017 Copyright 2013, 2018, Oracle and/or its affiliates. All rights reserved. This software and related documentation are provided under a license agreement containing restrictions on
User Quickstart Guide
 User Quickstart Guide November 2015 Page 2 The Two Minute Overview Campus User Quick Start Guide for VeriTime provides a full picture time and attendance by placing absences captured in Aesop alongside
Microsoft Dynamics GP Business Portal. Project Time and Expense User s Guide Release 3.0
 Microsoft Dynamics GP Business Portal Project Time and Expense User s Guide Release 3.0 Copyright Copyright 2005 Microsoft Corporation. All rights reserved. Complying with all applicable copyright laws
Institutional Research & Effectiveness Power BI Quick Start Guide
 Accessing Stetson s Institutional Research Power BI Reports 1. Request Power BI License If you are a new user, you must request a Power BI license. Contact Institutional Research to request a license.
Published by ICON Time Systems A subsidiary of EPM Digital Systems, Inc. Portland, Oregon All rights reserved 1-1
 Published by ICON Time Systems A subsidiary of EPM Digital Systems, Inc. Portland, Oregon All rights reserved 1-1 The information contained in this document is subject to change without notice. ICON TIME
Copyright 2012 NOVAtime Technology, Inc.
 Last Revised: 7/22/2013 Copyright 2012 NOVAtime Technology, Inc. This documentation was first written 7/27/09 by Kevin Nielsen for and is maintained by NOVAtime Technology, Inc. All information contained
Oracle Fusion Applications
 Oracle Fusion Applications Reporting and Analytics Handbook Release 11.1.6 E41684-01 August 2013 Explains how to use Oracle Fusion Applications to perform current state analysis of business applications.
This course explores the options available in the new role-based cockpit available for SAP Business One on HANA.
 This course explores the options available in the new role-based cockpit available for SAP Business One on HANA. 1 At the end of this topic, you will be able to: List the advantages of the new role-based
Supervisor Overview for Staffing and Scheduling Log In and Home Screen
 Supervisor Overview for Staffing and Scheduling Log In and Home Screen On the login screen, enter your Active Directory User Name and Password, and click the Sign-in button. You will then be taken to your
TS-10-ATP Instructions
 TS-10-ATP Instructions TABLE OF CONTENTS Click Section Name A. Definitions to go there A B. Templates Sheet B C. Scheduling Sheet Instructions C D. Payroll Sheet D E. Vacations, etc. Sheet Instructions
Project and Portfolio Management Center
 Project and Portfolio Management Center Software Version: 9.42 Time Management User Guide Go to HELP CENTER ONLINE http://admhelp.microfocus.com/ppm/ Document Release Date: September 2017 Software Release
Introduction to IBM Cognos for Consumers. IBM Cognos
 Introduction to IBM Cognos for Consumers IBM Cognos June 2015 This training documentation is the sole property of EKS&H. All rights are reserved. No part of this document may be reproduced. Exception:
PM Created on 1/14/ :49:00 PM
 Created on 1/14/2015 12:49:00 PM Table of Contents... 1 Lead@UVa Online Training... 1 Introduction and Navigation... 1 Logging Into and Navigating the Site... 2 Managing Notes and Attachments... 9 Customizing
quick start guide A quick start guide inflow support GET STARTED WITH INFLOW
 GET STARTED WITH INFLOW quick start guide Welcome to the inflow Community! This quick start guide includes all the important stuff to get you tracking your inventory before you know it! Just follow along
HR Business Partner Guide
 HR Business Partner Guide March 2017 v0.1 Page 1 of 10 Overview This guide is for HR Business Partners. It explains HR functions and common actions HR available to business partners and assumes that the
Introduction to Cognos Analytics and Report Navigation Training. IBM Cognos Analytics 11
 Introduction to Cognos Analytics and Report Navigation Training IBM Cognos Analytics 11 Applicable for former IBM Cognos 10 report users who access CBMS Cognos to run and view reports March 2018 This training
Notice: Falsification of timesheets, whether submitting or approving, can be grounds for immediate termination.
 Employee Functions Time & Attendance Experience the Workforce system from the employee perspective. Learn Workforce navigation fundamentals and functions related to reporting time, activities, and absences
Wondering if this ebook applies to you?
 CRM Basics Wondering if this ebook applies to you? If your screen looks like this, you re in the right place. The ebook contains the essentials you need to know to get productive quickly. You ll learn
created & maintained by the Vendor & Item Support Team
 Sears Sales (Alex) Reporting Application Overview Guide created & maintained by the Vendor & Item Support Team October 2016 Objectives Sears Sales (Alex) Reporting is a reporting application which provides
Electronic Timesheet System Student User Guide Date Written 30 May 2017 Date Updated
 Electronic Timesheet System Student User Guide Date Written 30 May 2017 Date Updated 2018-09-25 Launching the Timesheet Management System (TMS)... 2 Recording Mentor Details... 3 Recording Hours, Breaks
Taleo Enterprise Fluid Recruiting User Guide Release 17.2
 Oracle Taleo Enterprise Release 17.2 Taleo Enterprise Part Number: E92669-01 Copyright 2017, Oracle and/or its affiliates. All rights reserved Authors: Taleo Information Development Team This software
Quick cards
 Nielsen @Plan Quick Cards Nielsen @Plan Methodology Nielsen @Plan is Nielsen s media planning, buying and selling tool. It provides users with a better understanding of where particular audiences surf
New Degree Day History Screen
 This document describes the various enhancements and modifications to DRM Windows that occurred between versions 9.1.270 and 10.2.280. New Degree Day History Screen This screen compares the current heating
BlackBerry User Guide
 Version 1.0 Copyright 2013, 2017, Oracle and/or its affiliates. All rights reserved. This software and related documentation are provided under a license agreement containing restrictions on use and disclosure
Your Health. Your Safety. Our Commitment. Workplace Violence Risk Assessment Tool. User Guide for Acute Care and Long Term Care
 Your Health. Your Safety. Our Commitment. Workplace Violence Risk Assessment Tool User Guide for Acute Care and Long Term Care Workplace Violence Risk Assessment Tool - User Guide for Acute Care and Long
BI Portal User Guide
 Contents 1 Overview... 3 2 Accessing the BI Portal... 3 3 BI Portal Dashboard... 3 3.1 Adding a new widget... 4 3.2 Customizing an Existing Widget... 8 3.3 Additional Widget Operations... 9 4 Widget Gallery...
Angus AnyWhere. Reports User Guide AUGUST 2012
 Angus AnyWhere Reports User Guide AUGUST 2012 Table of Contents About Reports... 1 Generating a Report... 2 Exporting Reports... 4 Printing Reports... 5 Tenant Request... 6 Labor Utilization... 6 Lists...
Navigating in ADP Workforce Now for Practitioners
 ADP Workforce Now Navigating in ADP Workforce Now for Practitioners Introduction In this self-study, you will learn how to navigate in ADP Workforce Now. The features that you will use depend on your job
BIL201: Manage Progress Billing
 BIL201: Manage Progress Billing CERTIFIED COURSE CURRICULUM SAGE UNIVERSITY IMPORTANT NOTICE This document and the Sage 100 Contractor software may be used only in accordance with the Sage 100 Contractor
One Identity Manager Help Desk Module User Guide
 One Identity Manager 8.0.1 Help Desk Module User Guide Copyright 2018 One Identity LLC. ALL RIGHTS RESERVED. This guide contains proprietary information protected by copyright. The software described in
Electronic Timesheet System Student User Guide Date Written 30 May 2017 Date Updated
 Electronic Timesheet System Student User Guide Date Written 30 May 2017 Date Updated 2018-04-24 Launching the Timesheet Management System (TMS)... 2 Recording Mentor Details... 3 Recording Hours, Breaks
New Features in EnterpriseTrack 16.1
 New Features in EnterpriseTrack 16.1 COPYRIGHT & TRADEMARKS Copyright 2016, Oracle and/or its affiliates. All rights reserved. Oracle is a registered trademark of Oracle Corporation and/or its affiliates.
MANAGE WORKFLOWS JOB AID
 LAST UPDATED / March 13, 2014 MANAGE WORKFLOWS JOB AID TABLE OF CONTENTS Overview 2 1 Access Workflow Reporting Screens 3 2 View Initiated Workflow Segments: All, Completed 6 & Running (In-Progress) 3
Essential Time & Attendance Supervisor Scheduling Basics
 ADP Workforce Now Essential Time & Attendance Supervisor Scheduling Basics Handout Manual Need support after training? To exchange tips and best practices with fellow users, get on The Bridge an online
Taleo Enterprise Fluid Recruiting User Guide Release 17
 Oracle Taleo Enterprise Release 17 Taleo Enterprise Part Number: E90637-01 Copyright 2017, Oracle and/or its affiliates. All rights reserved Authors: Taleo Information Development Team This software and
Business Portal for Microsoft Dynamics GP. Human Resources Management Self Service Suite User s Guide Release 10.0
 Business Portal for Microsoft Dynamics GP Human Resources Management Self Service Suite User s Guide Release 10.0 Copyright Copyright 2007 Microsoft Corporation. All rights reserved. Complying with all
Requisitioning Method of Inventory Control
 Requisitioning Method of Requisitioning Method of Course description: Learn how to use emaint Online for inventory tracking, from establishing your inventory records and generating reorder lists through
SysAid. Service Level Agreement Service Level Management (SLA/SLM)
") SysAid Service Level Agreement Service Level Management (SLA/SLM) Document Updated: 20 June 2010 Contents of SLA/SLM Guide Introduction 3 How to use these help files 4 Creating and modifying SLAs 6 Defining
SysAid Service Level Agreement Service Level Management (SLA/SLM) Document Updated: 20 June 2010 Contents of SLA/SLM Guide Introduction 3 How to use these help files 4 Creating and modifying SLAs 6 Defining
Oracle. SCM Cloud Getting Started with Your Manufacturing and Supply Chain Materials Management Implementation. Release 13 (update 18B)
") Oracle SCM Cloud Getting Started with Your Manufacturing and Supply Chain Materials Management Implementation Release 13 (update 18B) Release 13 (update 18B) Part Number E94278-01 Copyright 2011-2018,
Oracle SCM Cloud Getting Started with Your Manufacturing and Supply Chain Materials Management Implementation Release 13 (update 18B) Release 13 (update 18B) Part Number E94278-01 Copyright 2011-2018,
USER MANUAL. Inventory Manager TABLE OF CONTENTS. Version: 4.0
 USER MANUAL Inventory Manager Version: 4.0 Compatibility: Microsoft Dynamics CRM 2016(v8.0) and above TABLE OF CONTENTS Introduction... 1 Benefits of Inventory Manager... 1 Prerequisites... 2 Installation
QUICKBOOKS 2018 STUDENT GUIDE. Lesson 3. Working with Lists
 QUICKBOOKS 2018 STUDENT GUIDE Lesson 3 Working with Lists Copyright Copyright 2018 Intuit, Inc. All rights reserved. Intuit, Inc. 5100 Spectrum Way Mississauga, ON. L4W 5S2 Trademarks 2018 Intuit Inc.
Lesson 3 Working with Lists
 Q U IC K BOOKS 2017 STUDEN T GUIDE Lesson 3 Working with Lists Copyright Copyright 2017 Intuit, Inc. All rights reserved. Intuit, Inc. 5100 Spectrum Way Mississauga, ON. L4W 5S2 Trademarks 2017 Intuit
Oracle Revenue Management and Billing Product Manager s Workbench. User Guide. Version Revision 1.1. E December, 2018
 Oracle Revenue Management and Billing Product Manager s Workbench Version 2.7.0.0.0 User Guide Revision 1.1 E88591-01 December, 2018 Copyright 2017, Oracle and/or its affiliates. All rights reserved. 1
Oracle Fusion GRC Intelligence. User Guide Release Part No. E
 Oracle Fusion GRC Intelligence User Guide Release 8.6.5.1000 Part No. E52277-01 March 2014 Oracle Fusion GRC Intelligence User Guide Part No. E52277-01 Copyright 2014 Oracle Corporation and/or its affiliates.
Monitoring Oracle Java CAPS Business Processes
 Monitoring Oracle Java CAPS Business Processes Part No: 8 640 March 0 Copyright 008, 0, Oracle and/or its affiliates. All rights reserved. License Restrictions Warranty/Consequential Damages Disclaimer
PAYGLOBAL EXPLORER USER GUIDE
 PAYGLOBAL EXPLORER USER GUIDE Table of Contents Revised March 2002 by Ian Johnson (PayGlobal Pty Ltd) to include changes for rate over-rides and breaks. Revised June 2002 by Ian Johnson (PayGlobal Pty
Lesson 3 Working with Lists
 Q U IC K BOOKS 2017 STUDEN T GUIDE Lesson 3 Working with Lists Copyright Copyright 2017 Intuit, Inc. All rights reserved. Intuit, Inc. 5100 Spectrum Way Mississauga, ON. L4W 5S2 Trademarks 2017 Intuit
BP(A S) Taleo Performance User Guide
 Taleo Performance User Guide") BP(A S) Taleo Performance User Guide January 2008 Confidential Information It shall be agreed by the recipient of the document (hereafter referred to as "the other party") that confidential information
BP(A S) Taleo Performance User Guide January 2008 Confidential Information It shall be agreed by the recipient of the document (hereafter referred to as "the other party") that confidential information
Mobile for Android User Guide
 Version 1.7 Copyright 2013, 2017, Oracle and/or its affiliates. All rights reserved. This software and related documentation are provided under a license agreement containing restrictions on use and disclosure
Sage ERP Accpac Online 5.6
 Sage ERP Accpac Online 5.6 Integration Resource Guide for Sage ERP Accpac And Sage CRM (Updated: December 1, 2010) Thank you for choosing Sage ERP Accpac Online. This Resource Guide will provide important
Oracle Utilities Network Management Business Intelligence
 Oracle Utilities Network Management Business Intelligence Metric Reference Guide Release 2.3.2 E20861-02 May 2011 Oracle Utilities Network Management Business Intelligence Metric Reference Guide E20861-02
V4 SQL Dashboard Features
 V4 SQL Dashboard Features 2000-2016 NECS, Inc. All Rights Reserved. I entrée V4 SQL System Guide Table of Contents Chapter I Contact NECS 1 Chapter II Using Dashboards 2 1 Dashboard... Features 2 2 Inventory...
Business Portal for Microsoft Dynamics GP. Requisition Management Administrator s Guide Release 10.0
 Business Portal for Microsoft Dynamics GP Requisition Management Administrator s Guide Release 10.0 Copyright Copyright 2007 Microsoft Corporation. All rights reserved. Complying with all applicable copyright
Task Control for bpm'online. User Manual
 Task Control for bpm'online User Manual Index of Contents Task Control for bpm'online OVERVIEW 3 Installation 4 Activities form 6 Quick filters at the Activities section 8 Activities control 9 child tasks
Oracle Hospitality Cruise Shipboard Property Management System Maintenance User Guide Release 8.0 E
 Oracle Hospitality Cruise Shipboard Property Management System Maintenance User Guide Release 8.0 E84864-01 November 2017 Copyright 1995, 2017, Oracle and/or its affiliates. All rights reserved. This software
Oracle Order Capture. Concepts and Procedures. Release 11i. August, 2000 Part No. A
 Oracle Order Capture Concepts and Procedures Release 11i August, 2000 Part No. A86136-01 Oracle Order Capture Concepts and Procedures, Release 11i Part No. A86136-01 Copyright 1996, 2000, Oracle Corporation.
Croner Simplify. Croner Simplify. ~ Manager Training Workbook ~ Version 5.0. P a g e 1. January 17
 ~ Manager Training Workbook ~ Version 5.0 P a g e 1 Manager View Managers can see information about themselves and their teams. Their role within Croner Simplify is to complete certain tasks for their
Outline, Gantt, and Task Detail Views
 Get Everything You Need to Know About Your Projects with Outline, Gantt, and Task Detail Views HOW DO OUTLINE, GANTT, AND TASK DETAIL VIEWS WORK? Outline View lists your projects phases, tasks, and resources
Croner Simplify. Croner Simplify. ~ Manager Training Workbook ~ Version 6.0. P a g e 1
 ~ Manager Training Workbook ~ Version 6.0 P a g e 1 Manager View Managers can see information about themselves and their teams. Their role within Croner Simplify is to complete certain tasks for their
Web TimeSheet Integration Manager for Microsoft Project Server. Version 2.6 USER GUIDE
 Web TimeSheet Integration Manager for Microsoft Project Server Version 2.6 USER GUIDE Notices 2004-2006 Replicon, Inc. All rights reserved. All parts of this manual are the property of Replicon Inc. No
Product Portfolio Management User Guide Release 9.3.5
 [1]Oracle Agile Product Lifecycle Management Product Portfolio Management User Guide Release 9.3.5 E52152-02 December 2016 Product Portfolio Management User Guide, Release 9.3.5. E52152-02 Copyright 2013,
SCH202: Manage Schedules
 SCH202: Manage Schedules CERTIFIED COURSE CURRICULUM SAGE UNIVERSITY IMPORTANT NOTICE This document and the Sage 100 Contractor software may be used only in accordance with the Sage 100 Contractor End
One Identity Manager Business Roles Administration Guide
 One Identity Manager 8.0.1 Business Roles Administration Guide Copyright 2018 One Identity LLC. ALL RIGHTS RESERVED. This guide contains proprietary information protected by copyright. The software described
Employee Information
 Employee Information - - - - - - - - - - - - - - - - - - - - - - - - - Add New Employees You can add new employees at any time. All that is required for each employee is a name and what Positions they
CU Careers: Step-by-Step Guide
 CU Careers: Step-by-Step Guide Background Check Process This guide contains information for background check coordinators (BCCs) to run HireRight background checks through CU Careers. Background checks
Performance Management Content and Functionality Overview
 Deltek Vision 7.x* Performance Management Content and Functionality December 11, 2013 * Deltek updates this guide only in the 4th quarter on an annual basis. As a result, the information contained in this
Advantage Mobile Users Guide 06/11/2015
 Advantage Mobile Users Guide 06/11/2015 Updated 06/11/2015 Page 1 of 11 Advantage Mobile Advantage Mobile allows you to access commonly used Webvantage modules from your mobile device. Modules in the first
Oracle Hospitality Suites Management User Guide. Release 3.7
 Oracle Hospitality Suites Management User Guide Release 3.7 E87195-04 February 2019 Oracle Hospitality Suites Management User Guide, Release 3.7 E87195-04 Copyright 2001, 2019, Oracle and/or its affiliates.
Next, switch from your browser to the inflow Cloud for Windows app and log in.
 Table of Contents 1.0 First-time setup...3 2.0 How do I navigate around inflow Cloud?...6 2.1 The inflow Cloud Homepage...6 2.2 inflow Cloud list views...6 2.3 Action toolbar...8 3.0 Where do I enter my
WEB TIME EMPLOYEE GUIDE
 Revised 10/27/2017 WEB TIME EMPLOYEE GUIDE CLIENT RESOURCE PAYLOCITY.COM TABLE OF CONTENTS Web Time... 3 Web Kiosk... 10 Home... 29 My Timesheet... 43 My Pay Adjustments... 57 Employee Time Off Calendar...
Oracle. SCM Cloud Getting Started with Your Manufacturing and Supply Chain Materials Management Implementation. Release 13 (update 17D)
") Oracle SCM Cloud Getting Started with Your Manufacturing and Supply Chain Materials Management Implementation Release 13 (update 17D) Release 13 (update 17D) Part Number E89209-01 Copyright 2011-2017,
Oracle SCM Cloud Getting Started with Your Manufacturing and Supply Chain Materials Management Implementation Release 13 (update 17D) Release 13 (update 17D) Part Number E89209-01 Copyright 2011-2017,
Excel 2011 Charts - Introduction Excel 2011 Series The University of Akron. Table of Contents COURSE OVERVIEW... 2
 Table of Contents COURSE OVERVIEW... 2 DISCUSSION... 2 OBJECTIVES... 2 COURSE TOPICS... 2 LESSON 1: CREATE A CHART QUICK AND EASY... 3 DISCUSSION... 3 CREATE THE CHART... 4 Task A Create the Chart... 4
Fast Start. prorm Fast Start. User Guide. promx AG Nordring Nuremberg
 Fast Start prorm Fast Start User Guide promx AG Nordring 100 90409 Nuremberg E-Mail: sales@promx.net 2 Table of Contents 1. Introduction 5 1.1 About prorm Fast Start 5 1.2 prorm Fast Start Navigation 5
Your inside track for making your job easier!
 Preliminary User Manual User Manual Edition: 3/30/2005 Your inside track for making your job easier! Tenmast Software 132 Venture Court, Suite 1 Lexington, KY 40511 www.tenmast.com Support: (877) 359-5492
Oracle Talent Management Cloud Using Career Development 19A
 19A 19A Part Number F11450-01 Copyright 2011-2018, Oracle and/or its affiliates. All rights reserved. Authors: Sweta Bhagat, Jeevani Tummala This software and related documentation are provided under a
DATABASICS Time User s Guide v3.1
 DATABASICS Time User s Guide v3.1 A Guide to CALIBRE s Time Reporting Website July 2016 CALIBRE 6354 Walker Lane, Suite 300 Alexandria VA 22310 1 Table of Contents Before You Get Started... 3 Accessing
EMPCENTER 9.6 USER GUIDE
 January 2016 Oregon State University EMPCENTER 9.6 USER GUIDE Policy Profile Students/Temps Hourly Table of Contents EmpCenter Overview... 3 Accessing EmpCenter... 3 Employee Dashboard... 3 Employee Timesheet
Fast Start. prorm Fast Start. User Guide. promx GmbH Nordring Nuremberg
 Fast Start prorm Fast Start User Guide promx GmbH Nordring 100 90409 Nuremberg E-Mail: sales@promx.net 2 Table of Contents 1. Introduction 5 1.1 About prorm Fast Start 5 1.2 prorm Fast Start Navigation
Sage (UK) Limited Copyright Statement
 Limited Copyright Statement") Sage (UK) Limited Copyright Statement Sage (UK) Limited, 2009. All rights reserved We have written this guide to help you to use the software it relates to. We hope it will be read by and helpful to lots
Sage (UK) Limited Copyright Statement Sage (UK) Limited, 2009. All rights reserved We have written this guide to help you to use the software it relates to. We hope it will be read by and helpful to lots
Oracle. SCM Cloud Using Demand Management. Release 13 (update 17D)
") Oracle SCM Cloud Release 13 (update 17D) Release 13 (update 17D) Part Number E89175-01 Copyright 2011-2017, Oracle and/or its affiliates. All rights reserved. Author: Nithin Premkumar This software and
Oracle SCM Cloud Release 13 (update 17D) Release 13 (update 17D) Part Number E89175-01 Copyright 2011-2017, Oracle and/or its affiliates. All rights reserved. Author: Nithin Premkumar This software and
Worklist HELP.QMWORK. Release 4.6C
 HELP.QMWORK Release 4.6C SAP AG Copyright Copyright 2001 SAP AG. All rights reserved. No part of this publication may be reproduced or transmitted in any form or for any purpose without the express permission
InterQual View Quick Reference. Change Healthcare Operations LLC Product Support
 InterQual View 2017 Quick Reference Change Healthcare Operations LLC www.changehealthcare.com Product Support 800.274.8374 General Terms: Change Healthcare Operations, LLC and/or one of its subsidiaries
Visual BI Value Driver Tree for SAP Lumira Designer - User Guide -
 Visual BI Value Driver Tree for SAP Lumira Designer - User Guide - 1 Copyright 3 1.1 Trademark Information 3 1.2 Patent Information 3 1.3 SAP Trademarks 3 2 Definitions 4 3 Introduction 5 3.1 Document
Sage ERP MAS. Everything you want to know about Sage ERP MAS Intelligence. What is Sage ERP MAS Intelligence? benefits
 Sage ERP MAS Everything you want to know about Sage ERP MAS Intelligence What is Sage ERP MAS Intelligence? Sage ERP MAS Intelligence (or Intelligence) empowers managers to quickly and easily obtain operations
Version Ticketing Guide for Business Users. Oracle ATG One Main Street Cambridge, MA USA
 Version 10.0.2 Ticketing Guide for Business Users Oracle ATG One Main Street Cambridge, MA 02142 USA ATG Ticketing Guide for Business Users Document Version Service10.0.2 TICKETINGBUSINESSv1 04/15/2011
Oracle. Talent Management Cloud Using Career Development. Release 13 (update 17D)
") Oracle Talent Management Cloud Release 13 (update 17D) Release 13 (update 17D) Part Number E89398-01 Copyright 2011-2017, Oracle and/or its affiliates. All rights reserved. Authors: Sweta Bhagat, Jeevani
Oracle Talent Management Cloud Release 13 (update 17D) Release 13 (update 17D) Part Number E89398-01 Copyright 2011-2017, Oracle and/or its affiliates. All rights reserved. Authors: Sweta Bhagat, Jeevani
Oracle Hospitality Inventory Management Mobile Solutions. Quick Reference Guide
 Oracle Hospitality Inventory Management Mobile Solutions Quick Reference Guide Release 9.1 E94055-01 August 2018 Oracle Hospitality Inventory Management Mobile Solutions Quick Reference Guide, Release
Oracle Hospitality InMotion Mobile. Quick Reference
 Oracle Hospitality InMotion Mobile Quick Reference Release 3.3 E92708-01 June 2018 Oracle Hospitality InMotion Mobile Quick Reference, Release 3.3 E92708-01 Copyright 2014, 2018, Oracle and/or its affiliates.
KRONOS EMPLOYEE TRAINING GUIDE
 KRONOS EMPLOYEE TRAINING GUIDE C o n t e n t s Navigating Through Workforce Central... Lesson 1 Timecard Edits... Lesson 2 Approvals... Lesson 3 Reporting... Lesson 4 Editing & Scheduling PTO... Lesson
A. Locating the Job Requisition:
 Keep in Mind Hiring managers are assigned the role of recruiting screener in Workday, which allows access to review all applicant information. If you do not have access for the job(s) you re hiring for
Reporting and Dashboards
 Reporting and Dashboards Page i Copyrights 2002-2011 Propertyware, Inc. All rights reserved. No part of this publication may be reproduced, transmitted or stored in any archives without the expressed
Gamification in Performance Dashboard
 Cloud Contact Center Software Gamification in Performance Dashboard Administrator s Guide June 2018 Gamification is a motivational tool that enables you to change the behavior of agents to meet the goals