Utah Transportation Asset Management Plan
|
|
|
- Virgil Flynn
- 5 years ago
- Views:
Transcription

1 Utah Transportation Asset Management Plan Utah TAMP January 2016 Table of Contents Table of Contents...1 List of Figures...2 List of Tables...2 Introduction...2 Unified Approach... Asset Management Roadmap...3 Goal and Objectives...3 Implementation Plan...3 Performance Driven Plan...4 Asset Management Tiers...4 Performance Measures and Targets...5 Life-cycle Cost Analysis...6 Minimized Life-cycle Cost Strategy...6 Asset Register...6 Life Cycle Models...6 Risk Management Analysis...8 Risk Identification and Assessment...8 Risk Mitigation Plan...8 Evaluation of Facilities...9 Financial Plan...9 Anticipated Funding Sources...9 Projected Funding Levels...9 Asset Value Sustainability Estimated Annual Costs Investment Strategies Preservation of NHS Performance Influence of Analyses Appendix A - Asset Management Oversight Structure Appendix B - Gap Analysis Process and Results Appendix C - Committee Comments, July Appendix D - Gap Analysis Questions and Voting Results Appendix E - Roadmap Implementation Plan Appendix F - Asset Value and Risk Assessment Utah TAMP 1


2 List of Figures Figure 1 - Strategic Goals... 2 Figure 2 - Asset Management Evaluation Areas... 2 Figure 3 -Gap Analysis Flowchart... 3 Figure 4- Asset Management Roadmap... 3 Figure 5 Integrated Programs... 4 Figure 6 - Performance Management... 4 Figure 7 - Organized & Accessible Data... 4 Figure 8 - Pavement Measure... 5 Figure 9 - Bridge Measure... 5 Figure 10 - Signal connected to ATMS... 5 Figure 11 - Assets with value over $1B... 6 Figure 12 - Assets with value $800-$300 M $800M-$300M... 6 Figure 13 - Assets with value under $80M... 6 Figure 14 - Number of ATMS Devices... 8 Figure 15 - ATMS/Signal Device Lifecycle Approach... 8 Figure 16 - Fiber Optic Network... 8 Figure 17 Risk Matrix... 8 Figure Funding Sources... 9 Figure Funding Sources Figure 20 - Interstate Pavement Condition Forecast Figure 21 - NHS Pavement Condition Forecast Figure 22 - High Volume Pavement Condition Forecast Figure 23 - Low Volume Pavement Condition Forecast Figure 24 - Forecast Conditions for NHS Bridges Figure 25 - Forecast Conditions for State Bridges Figure 26 - Forecast Conditions for Local FA Bridges Figure 27 - End-of-Life Estimates Figure 28 - Five Year Funding Plan Figure 29 - AMSC Membership Figure 30 - AAC Membership Figure 31 - Gap Analysis Flow Chart Figure 32 - Comment Categorization Figure 33 - Gap Analysis Results Figure 34 - Risk Matrix List of Tables Table 1 - Asset Tiers... 4 Table 2 - Simulation of Life Cycle Costs... 7 Table 3 - Risk Analysis for Tier 1 and 2 Assets... 9 Table 4 - Asset Values Table 5 - Integrated Programs Tasks and Risks Table 6 - Performance Management Tasks and Risks Table 7 - Organized and Accessible Data Tasks and Risks Utah TAMP 2 Introduction Utah Department of Transportation (UDOT) is focused on preserving Utah s existing transportation infrastructure; the state s multi-billion dollar investment in roads, bridges and other assets must be maintained for future generations. Keeping Utah s assets in good condition is the most effective way to extend the life of the transportation system. Expanding and preserving the transportation system requires improved efficiency, careful use of resources and close partnering with decision makers. By focusing on the Strategic Goals, UDOT will meet the challenges of an ever growing and changing state. UDOT s Roadmap lays out the mission, vision, Figure 1 - Strategic Goals strategic goals, emphasis areas, and core values. This roadmap is the guidance for asset management. Asset Management is a crucial element of achieving these Strategic Goals. The Asset Management process helps UDOT to be accountable to the public by: Minimizing lifecycle costs Maximizing system performance Supporting an objective decision making process Balancing public expectations with limited funding Unified Approach UDOT is moving toward a unified approach regarding investment decisions to comply with the requirements of MAP-21 and maximize resources. UDOT has well established processes in place for managing pavement and bridge preservation and plan to expand these efforts to other assets. Up to this time, recommendations for the investment of UDOT s resources have been based on each asset funding category and program. To improve the strong efforts already made with bridges and pavement, UDOT is reconfirming existing asset management strategies and providing a com- Figure 2 - Asset Management Evaluation prehensive view of the asset management process. The unified approach includes
 provides UDOT with an integrated, comprehensive and strategic approach to meet transportation needs while keeping the current")


3 evaluation of multiple areas of analysis and structure. Development of the Transportation Asset Management Plan (TAMP) provides UDOT with an integrated, comprehensive and strategic approach to meet transportation needs while keeping the current system in good condition. The strength of this data-driven plan is that it demonstrates results, accountability, and transparency. Decisions are supported by the data generated in UDOT processes, sound engineering judgment and evaluation of transportation needs across Utah. The Utah TAMP provides a systematic framework and answers resource management questions such as: How should each asset be managed and what are the risks involved? What is the funding and performance relationship between different assets? What are the long term implications of asset related decisions made today? What long term funding is needed to maintain least cost asset condition? In order to identify the steps to raise UDOT asset management to a gold standard, the oversight committee structure was revised and a self-assessment gap analysis was completed. The current oversight committee structure is included in Appendix A. The gap analysis process and results are in Appendix B. Committee member comments from the program self-assessment are included in Appendix C. Asset Management Roadmap Goal and Objectives To effectively manage UDOT s assets, the Asset Advisory Committee established a goal to create a unified program that maximizes system performance and funding. Evaluation of the gap analysis results and categorization of program assessment comments resulted in the identification of three areas of focus; integrated programs, performance management, and organized and accessible data. These areas create the framework for the Utah TAMP. The overall goal for the Asset Management Team is to work collaboratively to develop a unified program that maximizes system performance and funding within the next five years. The reorganized AMSC and AAC identified and approved goals and objectives for the purpose of continuous improvement of asset management within UDOT. Objectives for in 1, 3, and 5 year timeframes in each of the three major categories have been identified to reach this goal as shown in Figure 4. The result of the gap analysis and program assessment is a five year roadmap for Figure 3 -Gap Analysis Flowchart UDOT asset management that embraces MAP-21 and UDOT goals of preserving infrastructure with a transparent, performance-based approach. Utah TAMP 3 Implementation Plan Figure 4- Asset Management Each UDOT division and the Committees are working separately and collectively to fulfill the objectives and needed tasks to accomplish the roadmap goal. Following is a summary of work associated with each category and an overview of the roadmap by year.


4 Integrated Programs Consolidating data collection of several individual divisions into a single bi-annual contract was the kick-off to an integrated program. Further collaboration between UDOT divisions is planned and required to develop the ability to prioritize projects irrespective of specific funding categories. This collaboration involves establishing the replacement value of each asset and developing a financial model with life cycle costs for selected high value assets. It also involves completing the information loop of project planning, design, construction and maintenance. Developing this consistent loop of communication will improve Figure 5 Integrated Programs the accuracy and efficiency of each separate process and thereby the overall UDOT program. It will also tie the Long Range Plan process and results to Project Development and the Region s Three Year Plans. Figure 6 - Performance Management Performance Management Management plans currently exist for pavement and bridges and a variety of assets within the Maintenance Management Quality Assurance Plus (MMQA+) programs. The wealth of additional data now available due to the unified and automated collection process allows UDOT to evaluate conditions and develop a performance based plan that includes all assets to the level appropriate to the value and risk associated with each. Within the five years of the TAMP, UDOT will identify risks, performance measures and life cycle costs for numerous assets in a joint effort to better prioritize funding across all funding categories. Organized and Accessible Data The recent influx of data and information provides an opportunity and urgency for UDOT to develop a systematic approach and structure for data storage and access. The ability to import and export data to all existing and future business systems will lead to the ability to create interactive dashboards. Dashboards will be used by decision-makers at multiple levels to maximize system performance and funding. The structured and organized details associated with each data set will allow groups to reference any related data to make better decisions. Figure 7 - Organized & Accessible Data Plan by the year Year 1 - During the first year teams will identify performance measures, define data needs, and initiate development of measures and information required for cross-asset analysis. Utah TAMP 4 Year 3 - By the end of Year 3, models and processes for all programs will be developed and refined to promote collaboration. This will allow decision makers to make data driven decisions that are necessary to prioritize resources across categories. Year 5 The fifth year will include full automation of processes that exchange information from multiple sources and refinement of value definitions that support cross asset analysis. Performance Driven Plan UDOT develops performance management plans annually to link the strategic goals to resources and results. The Assets and Performance category of the roadmap applies performance management principles to UDOT s roadway assets. In order to maximize funding and time, UDOT has developed a tiered system to preserve, rehabilitate and maintain the transportation physical assets. Three tiers have been established and each asset is assigned to a tier based on value and risk. Asset Management Tiers Asset Management tiers range from one to three with tier one being the most extensive management plan for the highest value assets. Tier 1 Table 1 - Asset Tiers Assets in the tier 1 management level are highest value combined with highest risk of negative financial impact for poor management. These are assets that are very important to the UDOT performance plan success and are recommended for a significant separate funding source. Management plans for tier 1 assets include elements such as: Accurate and sophisticated data collection Targets and measures set and tracked Predictive modeling and risk analysis Tier 2 Assets in the tier 2 management level are moderate value and substantial importance to transportation system operation. These assets have a moderate risk of negative impact for poor management or asset failure. They may have a separate funding source. Management plans for tier 2 assets include elements such as: Accurate data collection, less than annually


5 Risk assessment primarily based on asset failure Condition targets Possible spreadsheet management strategy Tier 3 Assets in the tier 3 management level are generally the lowest value assets with the lowest risk of negative impact for poor management or asset failure. Management plans for tier 3 assets include elements such as: Accurate data collection, less than annually Risk assessment primarily based on asset failure General condition analysis Management involving repair or replacement when damaged Performance Measures and Targets The UDOT process requires measures and targets set and tracked for tier 1 assets which are pavement, bridges, and ATMS/Signal devices. This process meets and exceeds the MAP-21 requirements. UDOT Maintenance Division also has established measures and targets for some of the tier 2 and 3 assets and these are set and tracked as part of the Maintenance Management Quality Assurance Program. Pavement UDOT s measure for pavement condition is based on the International Roughness Index (IRI). UDOT translates IRI into a percentage called Ride Index for ease of understanding. Ride index of 0 equates to IRI greater than 250, Ride of 50 equals IRI of 170, Ride of 80 equals IRI of 95 and Ride of 100 equals IRI of 0, as shown below. UDOT has established performance targets for each pavement category to support achievement of national and UDOT goals. The targets for each pavement category are the minimum percentage of lane miles that rate good and the Figure 8 - Pavement Measure maximum percentage of lane miles that rate poor: Interstate, > 80% good and < 1% poor NHS, >70% good and <5% poor High volume, >50% good and <10% poor Low volume, >30% good and <20% poor Bridge MAP-21 requires a state to devote resources to improve the condition of the National Highway System (NHS) until the established minimum is exceeded. The Utah TAMP 5 minimum standard for NHS bridges is that no more than 10 percent of a state s total deck area is on structurally deficient bridges. The bridge inventory in Utah well exceeds this standard. UDOT uses the Bridge Health Index (BHI) as a measure to describe the overall condition of each bridge and is used as a tracking and planning tool. The BHI is calculated at the element level as a ratio of the value of the bridge in the bridge s current condition to the value of the bridge in the best possible condition. The BHI of an entire bridge is calculated as a weighted average of the health indices of the bridge elements, where elements are weighted by the total quantity of the element and relative importance. The BHI assigns weighting factors to each element depending on the relative importance of the element to the rest of the structure. The factors are the product of the element weight and element unit Figure 9 - Bridge Measure replacement costs. The Bridge Health Index is used as a tracking and planning tool for evaluating bridge needs and prioritizing funding. The BHI categories are: Good Fair Poor, 60-0 UDOT has set the following system Bridge Health Index targets. Greater than 85 for the NHS 85 to 80 for the State System 80 to 75 for the Local Federal Aid System More information can be found in the Bridge Management Manual. ATMS and Signal Devices UDOT has set performance measures and targets for the signal system that encompasses operation, maintenance, design, and management. Currently these measures are tracked individually and reported weekly, monthly, or annually depending on the measure. UDOT s intent is to create a single measure for signal health that accumulates and reflects the existing areas of focus. Details of the current performance measures Figure 10 - Signal connected to ATMS can be found in the Traffic Signal Management Plan (TSMP).
6 The traffic signal and ATMS systems rely on preventative maintenance plans for operational efficiency and reliability. The measures established for this objective are based on replacing equipment prior to failure and minimizing the number of emergency maintenance calls, exclusive of those associated with crashes and weather. Specific targets for these measures are in the process of being established for both the signal and ATMS systems. Traffic signal devices connect to the ATMS system to create an efficient system to keep Utah moving. Currently 88% of the UDOT signals and 81% of non-udot signals are connected to the ATMS system. UDOT s goal is to connect 100% of UDOT signals and 90% of non-udot signals to the ATMS system. Life-cycle Cost Analysis Minimized Life-cycle Cost Strategy Rather than a worst first approach to asset management, UDOT uses a more cost-effective approach based on life cycle cost management. The UDOT approach stresses asset preservation. Carefully timed preservation efforts help slow the deterioration and extend the life and value of roadway assets. As an asset s life span is extended, expensive replacement can be pushed further into the future. As a result, preventive maintenance and rehabilitation strategies can drive down the overall cost of ownership and maximize public funding. UDOT s approach to life-cycle cost management varies significantly by asset type. Each approach is developed based on a combination of asset condition, value and risk. UDOT uses the asset value to set the level of management for each asset. The condition is determined by set performance measures and is used to determine annual financial need. Risk is used to prioritize funding available. Asset Register UDOT maintains registers of many assets through routine high-tech LiDAR scanning and maintenance inventories of the state highways. These registers are used to track the quantity and condition of each UDOT asset. UDOT also maintains an extensive database of current unit bid item costs compiled from the advertisement of new construction projects. This database is used to establish the replacement value of the quantified assets. Additional sources of information, such as R.S. Means, are referenced to establish a value for specialty items that are not in the database. A contingency amount is added to each asset value to account for design, construction oversight, traffic control, and mobilization costs. The current quantified assets and their value are located in the following figures. Utah TAMP 6 Figure 12 - Assets with value $800-$300 M Figure 13 - Assets with value under $80M The values shown are based on current costs to replace and construct/install the assets. Life Cycle Models Figure 11 - Assets with value over $1B The process for life-cycle analysis and management of UDOT s tier 1 assets is described below. Pavement Pavement is the highest value UDOT asset due to quantity and complexity. UDOT manages 16,000 lane miles across the state with a mature pavement management system and philosophy of good roads cost less. This life cycle approach means timely, cost-effective treatments minimize long term cost while achieving the performance targets and maintaining pavement value. UDOT has created a tiered system for prioritizing pavements in acknowledgment that current funding levels are not adequate to maintain the entire system at the same condition level. The tiers referred to as Functional Class are: Interstate, High volume (AADT greater than 1,000 and truck volume greater than 200), and Low volume (AADT less than 1,000). Additionally, roadways are divided into section for data collection and analysis. Each section has its own history including when it was originally constructed, traffic volumes, type of facility, biannual distress surveys, and
7 Table 2 - Simulation of Life Cycle Costs Surface Areas Concrete, SY Asphalt, SY Interstate High Volume Low Volume 2, ,400 11,135 4,510 Concrete Life Cycle Treatment Year Treatment $ / SY Interstate High Volume 10 Joint Seal, Spall & Crack Repair $5 $123,552,000 $43,956, Joint Seal, Spall & Crack Repair, Slab Replace, Grind $10 $247,104,000 $87,912, Joint Seal, Spall & Crack Repair, Slab Replacement $8 $197,683,200 $70,329, Joint Seal, Spall & Crack Repair, Slab Replace, Grind $10 $247,104,000 $87,912, Joint Seal, Spall & Crack Repair, Slab Replacement $8 $197,683,200 $70,329, Year Total $1,013,126,400 $360,439,200 schedule of next preservation activity. Biannually the Department s contractors measure the pavement health of each mile of the system. Starting in 2012 contractors driving at highway speeds, using state of the art technologies continuously measure each crack, the depth of each rut, roadway roughness, and concrete faulting. UDOT inputs this data into the Deighton Total Infrastructure Management System (dtims) software model. UDOT has used this model for many years to perform a life-cycle analysis of various treatment strategies on each of the 2,500 roadway sections. The benefit of the life-cycle strategy is balanced against the cost of the strategy (in net present value dollars). The result of this analysis is a plan for every section. The plans specify the preservation, rehabilitation and replacement strategies for each section over a period of years that will provide the highest overall benefit to the system condition within the available funding. Table 2 illustrates examples of timed treatments for concrete and asphalt pavements. Timing of each treatment varies based on the bi-annual data collection and analysis. The timing and cost of treatments maintain pavements in perpetual good condition over a 50 year period. Project recommendations from dtims are provided to UDOT s Region staff which then finalizes which projects to include in the recommendations to the Transportation Commission based on funding and other project priorities. Additional information regarding pavement can be found on the UDOT website in the Asset Management Home page. Bridges An inventory of nearly 1900 bridges with a span of 20 feet or more across the state comprises UDOT s second largest value asset. UDOT uses the Bridge Management System (BMS) to manage the full inventory of bridges. The BMS is a collection of tools and a component of the asset management program that prioritizes projects based on the UDOT strategic direction, objectives, goals, and condition targets. The BMS includes an inventory and condition database, decision support software and additional tools for project prioritization and program development. The BMS assists UDOT, Structures Division and Transportation Commission by prioritizing projects in an approximate order of importance. Bridges are managed with a broad based business approach that links UDOT actions to the established measures and targets. Data collection on bridges is extensive and always expanding, but primarily consists of three types of data: Information on the structure type, number of lanes, functional classification, and administrative items. History of the year/age for the last repair work completed and the last major rehabilitation for each structure. Physical condition data on the bridge. Performance models predict the future condition of bridges and determine the appropriate treatment choice of preservation, rehabilitation, or replacement based on funding and condition. Recommendations are distributed to the UDOT Regions for inclusion in the construction project list. A joint workshop is held to finalize recommendations to be presented to the Transportation Commission that make final funding decisions. Asphalt Life Cycle Treatment Interstate Year Treatment Unit Cost 7 Crack Seal & Resurface $12 $10 $5 $615,859,200 $ 1,058,270,400 $214,315, Crack Seal & Resurface $12 $10 $5 $615,859,200 $ 1,058,270,400 $214,315, Structural Overlay $25 $20 $15 $1,283,040,000 $ 2,116,540,800 $642,945, Crack Seal & Resurface $12 $10 $5 $615,859,200 $ 1,058,270,400 $214,315, Crack Seal & Resurface $12 $10 $5 $615,859,200 $ 1,058,270,400 $214,315, Structural Overlay $25 $20 $15 $1,283,040,000 $ 2,116,540,800 $642,945, Crack Seal & Resurface $12 $10 $5 $615,859,200 $ 1,058,270,400 $214,315,200 Utah TAMP 7 High Volume Unit Cost Low Voume Unit Cost Interstate High Volume Low Volume 50 Year Total $5,645,376,000 $ 9,524,433,600 $ 2,357,467,200 TOTAL 50 Year Preservation $6,658,502,400 $ 9,884,872,800 $ 2,357,467,200 TOTAL 50 Year Preservation/Year $133,170,048 $ 197,697,456 $ 47,149,344 Cost includes 25% for Traffic Control, Mobilization, Striping, etc. & 10% for Engineering


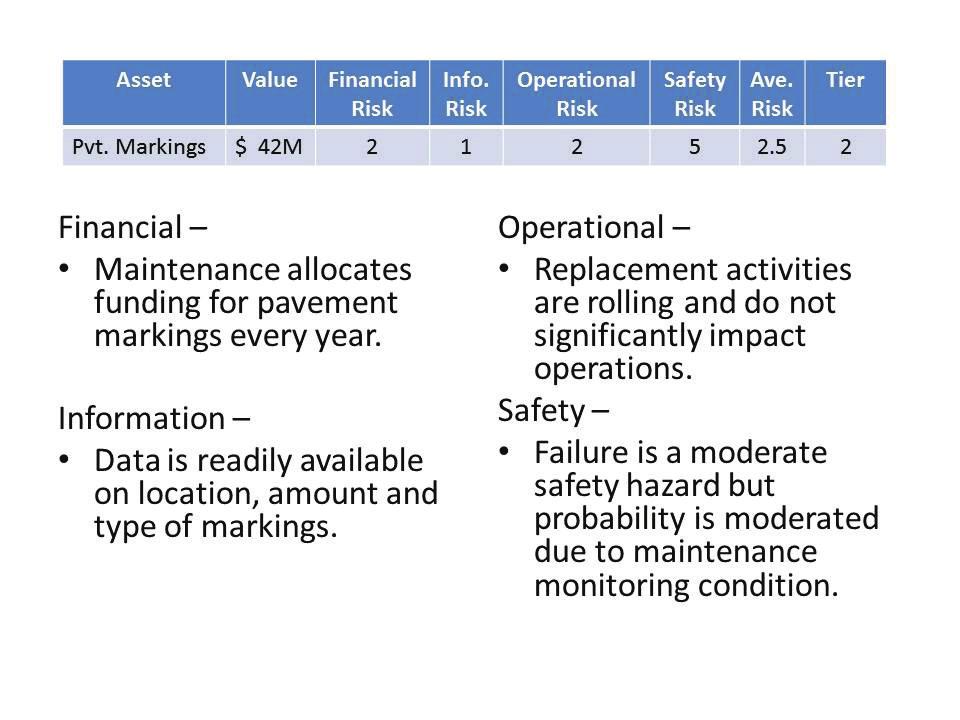
8 ATMS and Signal Devices Devices associated with UDOT s Automated Traffic Management System (ATMS) and Signal System make up the third tier 1 asset. These devices have a short life span relative to the pavement and bridge assets. This is due to rapid changes in technology and exposure of electronics to weather. The fiber optic network and the number and types of ATMS devices has grown rapidly since they were first put in use in The devices installed during the early years of use are now over 10 years old and past their life expectancy. While some of the devices have been replaced as part of roadway construction projects; there are over 200 ATMS devices still in use that are over 10 years old. The Traffic Monitoring Stations, Variable Message Signs, and Roadway Weather Information System are part of this aging device list. UDOT is in the process of instituting a proactive, lifecycle approach to managing ATMS and Signal System devices. This approach requires a funding stream that includes device replacement at the expected end of life as well as initial purchase and installation costs. Utah TAMP 8 Figure 14 - Number of ATMS Devices Figure 15 - ATMS/Signal Device Lifecycle Approach Figure 16 - Fiber Optic Network Risk Management Analysis UDOT has established three tiers of assets based on values and risks. This approach allows resources to be allocated to highest risk assets and risk areas. Pavement, bridges, and ATMS/Signal devices are tier 1 assets with values well above most tier 2 assets. These tier 1 assets also represent the greatest risks if managed poorly. UDOT has established management plans for these tier 1 assets which address all areas of risk. Risk Identification and Assessment In combination with the value each tier 1 and 2 asset is evaluated in four risk areas that were developed by the AAC: Financial analysis of sustainable funding for performance goals Information availability and quality of data needed for long term management Operational analysis of probability and impact of asset failure to the operation of the transportation system Safety analysis of impact to public safety of asset failure or poor condition Risk is assessed for each asset in each of the four risk areas based on the probability of the risk happening and on the consequences. Probability and consequence are assessed separately as high, medium, or low and a risk number is assigned based on the risk matrix depicted: All four risk numbers are averaged for each asset with all four areas of risk being equally weighted. The management tier is assigned based on the average risk factor, the monetary value of the asset, and an assessment of the importance of the asset to UDOT s performance plan and strategic goals. Table 3 depicts the value and risk numbers for each tier 1 and 2 asset. The numbers are based on the risk matrix. Additional information regarding the financial value and risk assessment for each asset in each category of risk can be found in Appendix F. Risk Mitigation Plan Consequences L M H H M L Figure 17 Risk Matrix As shown on Table 3, tier 1 assets have the highest operation risk and average risks. Performance-based management plans are well defined for these assets. History has proven these management plans minimize management costs and emergency repairs. All four categories of risk are monitored with bi-annual detailed inspection and data collection for pavements and bridges. Tier 2 assets have average risks in the range of 5 to 2.5. Specific plans are in prog- Probability

9 Table 3 - Risk Analysis for Tier 1 and 2 Assets Asset Financial Risk Info. Risk Operational Risk Safety Risk Average Risk Value Pavements $24B 1 Bridges $5B 1 ATMS/Signal Devices $793M 1 Pipe Culverts $1B 2 Signs $300M 2 Walls $3.4 B 2 Rumble Strips $6M 2 ADA Ramps $20M 2 Tier Pavements and bridges are inspected every two years as required by UDOT and FHWA policies. The results of these inspections are recorded in databases that maintain history of each pavement section and bridge that captures inspection results, repairs and reconstruction. This regular inspection process identifies repair and reconstruction needs that are incorporated into the Long Range Plan, State Transportation Improvement Plan, Maintenance Program and other relevant programs and plans. This proactive bi-annual process clearly identifies areas for repeated repairs and minimizes the need for emergency repairs by prioritizing needs and assigning them to the appropriate plan. Financial Plan The financial plan relies on the federal funding process, state annual budget process, and distribution decisions by the Transportation Commission. Funding available varies each year depending on the national and state economies and priorities of decision-makers. Anticipated Funding Sources UDOT operates its programs from a combination of federal, state and local funds. Amounts and percentages vary from year to year. Figure 18 includes income percentages from fiscal year Barrier $450M 2 Pvt. Markings $42M 2 * Value of inventoried pipe culverts only, urban area not included ress to address the two tier 2 assets with average risk over 4 and any individual risk category greater than 5. Pipe culverts: Information risk is high due to lack of location and condition information. The culvert committee has established a prioritized list of data to be collected. They have also established a prioritized list of culvert locations. Each UDOT Region has been assigned the responsibility to obtain the top priority data on pipe culverts in the highest risk locations. Signs: Financial risk is high due to the substantial cost of replacing overhead signs and very limited funding currently allocated for sign replacement. The need for replacement of signs and associated structures are anticipated based on the federal requirement for increased lettering size and aging of signs. Sign location, size, and condition data has been collected and is now available in the GIS based data system. This allows signs to be included as project elements in the corridor and project planning phases. Evaluation of Facilities Utah TAMP 9 Figure Funding Sources

10 Figure 19 depicts anticipated percentages from each funding source for FY Projected Funding Levels Figure Funding Sources UDOT, in cooperation with the state s Metropolitan Planning Organizations and Utah Transit Authority compile a Unified Transportation Plan that summarizes major capacity improvements to meet the projected travel demand and also identifies maintenance, preservation and operating needs of existing and newly built infrastructure through The Plan identified a need for a combination of future increases of existing revenue sources and implementation of new revenue sources. Some specific strategies assumed for revenue sources are included in the plan and will likely vary at the discretion of Utah s state and local elected officials. Specific assumptions include: Increase statewide fuel tax or equivalent Increase statewide vehicle registration fee Add local-option taxes More details of projected costs and funding sources can be found in the Utah Unified Transportation Plan on the UDOT website. Asset Value Sustainability UDOT has established sustainability targets for pavements and bridges as required by MAP-21. Targets for ATMS/Signal devices have also been established. Funding needs and strategies are different for each of these assets and are included in this section. Estimated Asset Values Table 4 depicts the replacement value of UDOT assets. This value is based on current construction costs and includes an amount for design, construction oversight, traffic control, and mobilization. Table 4 - Asset Values Asset Type Quantity Value Rumble Strips 26,287,969 FT $6,000,000 Cattle Guards 895 Each $20,000,000 ADA Ramps 14,779 Each $20,000,000 Pavement Markings 26,000 Miles $42,000,000 Fences 1,890 Miles $70,000,000 Signs 96,160 Each $300,000,000 Barrier 7,347,574 FT $450,000,000 ATMS/Signal Devices Lump $793,000,000 Pipe Culverts 16,553 Each $1,000,000,000 Walls 71,820,494 SF $3,400,000,000 Bridges 19,515,339 SF $5,000,000,000 Pavement 172,045,914 SY $24,000,000,000 Estimated Annual Costs Pavement UDOT has set sustainability targets to maintain UDOT pavements within acceptable condition levels that meet or exceed national, state, and UDOT goals. UDOT uses dtims and the data from Operations Management System (OMS) to predict future pavement condition for Interstate, NHS, High Volume and Low Volume pavements. The following figures illustrate predicted pavement conditions based on anticipated funding over a ten year time frame. Utah TAMP 10


11 Interstate pavements Over the past several years interstate pavement condition targets have been exceeded. Therefore funding for interstate pavements will be reduced to maintain interstate pavements within set targets. High Volume Pavements The estimated cost to improve High Volume pavements to the target condition over a ten year period is $46 million per year. This estimate is based on the dtims model using current pavement condition data. Figure 22 depicts the condition forecast of High Volume pavements statewide. Figure 20 - Interstate Pavement Condition Forecast NHS Pavements The estimated cost to maintain NHS pavements at the target condition over a ten year period is $80 million per year. This estimate is based on the dtims model using current pavement condition data. Figure 21 depicts the condition forecast of NHS pavements statewide. Figure 22 - High Volume Pavement Condition Forecast Low Volume Pavements The current level of investment in Low Volume roadways has resulted in the percentage of pavement in good condition gradually declining. Therefore funding levels have been increased and the resulting predicted gradual increase in pavement Utah TAMP 11 Figure 21 - NHS Pavement Condition Forecast Figure 23 - Low Volume Pavement Condition Forecast


12 condition is depicted in Figure 23. Bridges Structures are prioritized for rehabilitation and replacement based on vulnerability and criticality. Vulnerability measures the physical condition and load carrying capacity. The physical condition of the structure is captured by the Bridge Health Index and the load carrying capacity is defined by the operating load rating. Criticality is determined by measuring three distinct parameters: AADT, bypass length, and bridge length. More information on bridge program prioritization process can be found in the Bridge Management Manual. Predicted condition based on current funding resulted in UDOT falling below condition targets set for the NHS, State System, and the Local Federal Aid System, therefore, the legislature approved increased funding. The following figures depict forecasted bridge condition based on funding levels for each system. Figure 25 - Forecast Conditions for State Bridges Figure 24 - Forecast Conditions for NHS Bridges Figure 26 - Forecast Conditions for Local FA Bridges Utah TAMP 12

13 ATMS/Signal Devices UDOT is adopting a complete lifecycle approach to ATMS device management to achieve system reliability. This approach includes the orderly disposition of devices at end-of-life. At the end-of-life each device will be formally evaluated to determine if the device is replaced in kind, upgraded, or decommissioned as no longer needed. The end of life estimates are based on a combination of national experience, manufacturer recommendations, and UDOT experience with each specific device. Transformer Figure 27 - End-of-Life Estimates A five year plan is being put in place to replace devices which have already reached end-of-life or are expected to within the five year plan time frame. Timing of replacement is based on a combination of ease of replacement and consequence of failure. Ease of replacement example CCTV can fail because it can be replaced quickly (within 1 week), compared to a VMS which can take a few months to replace. Consequence of failure example allowing a hub to fail would impact a large number of devices, therefore creating a large negative consequence and indicating they should be replaced prior to failure. Funding for this lifecycle approach is not currently in place. A funding plan has been developed that replaces devices which have already reached end-of-life over the next three years and includes an equal amount for each of five years to replace Utah TAMP 13 Device Type Addressed in Constr. Figure 28 - Five Year Funding Plan Backlog < Variable Message Signs Traffic Management System Closed Circuit Television Camera Express Lanes Road Weather Information Systems Communications Switches Communication Junction Boxes the remaining devices. This plan lessens the impact of the new funding request. Investment Strategies Preservation of NHS Performance UDOT has an established history of combining funding sources to develop projects and programs that: Achieve and sustain a desired state of good repair Improve or preserve the condition of the assets and the performance of NHS Make progress toward achievement of state targets for asset condition Support progress toward achievement of national goals This investment strategy has resulted in Interstate and NHS pavements and bridges maintained within or above state and national targets for condition, public safety, and system mobility. Combining fund sources maximizes the extent each dollar preserves NHS performance. Influence of Analyses Performance gap analysis The performance gap analysis identified processes and tools that UDOT can sharpen and modify to deepen alignment of existing programs, organize data and make it more accessible, and measure asset performance. The five year roadmap that resulted from the gap analysis increases the efficiency with which UDOT supports achievement of state and national goals. The roadmap also develops a greater collaboration among those responsible for all transportation needs. Life-cycle cost analysis IN 2012 UDOT initiated a program of automated data collection across divisions. This biennial effort and the ability to access the data through UGate, a centralized collection of data in GIS format, was a key to the development of a value matrix for roadway assets. Understanding the value of each asset led UDOT to establish a three tier asset system. Pavements represent over 2/3rds of UDOT s asset value and have historically been managed by life cycle costs and predictive modelling. The philosophy of good roads cost less is a life cycle cost approach that minimizes long term costs of achieving performance targets and maintaining asset value. A similar approach has been adopted by the Structures Division and is in the process of implementation. Risk management analysis Risk identification and assessment is a relatively recent addition to UDOT s toolbox. The analysis of probability and consequences allows further refining of prioritizing projects and programs that maintain or improve overall system performance.
14 Anticipated available funding UDOT, in cooperation with the state s Metropolitan Planning Organizations and Utah Transit Authority compile a Unified Transportation Plan that summarizes major capacity improvements to meet the projected travel demand and also identifies maintenance, preservation and operating needs of existing and newly built infrastructure through The current Unified Plan identifies a need for a combination of future increases of existing revenue sources and implementation of new revenue sources. At current funding levels, pavement and bridge preservation will meet state and national targets. UDOT will continue to work closely with other agencies and elected officials to ensure funding levels and sources will preserve existing assets as well as meet the transportation demands of a growing population. APPENDIXES Utah TAMP 14


15 Appendix A - Asset Management Oversight Structure To address Utah s infrastructure challenges and embrace opportunities, this TAMP updates the Asset Management Strategic Plan that has been in place since The updated version includes redefining the structure for asset management that oversees the program funding and implementation of the strategic plan. The purpose of the oversight structure is to provide recommendations to the Transportation Commission for approval that maximize system performance and funding. The structure creates new cross-sectional collaboration between traditionally separate functions of planning, design, construction, maintenance, traffic, and information technology. Collaboration will result in unified program recommendations based on a transparent, data-driven decision-making process. The oversight structure will assist UDOT in careful management of each asset throughout each phase of the asset s life by utilizing program alignment, organized and accessible data, and riskbased asset performance. Providing direction and approving effective policies, programs, and processes, to ensure ongoing improvement of asset management, Evaluating the direction of asset management annually, and Reporting the results of UDOT s Transportation Program measurements. Asset Advisory Committee The Asset Advisory Committee (AAC) has been formed to enhance the communication flow between the strategic work of the AMSC and the boots on the ground technical experts. This committee will implement strategies in a coordinated manner to continually improve the asset management process. The AAC is chaired by the Asset Management Director and consists of designated division leaders. Asset Management Steering Council The Transportation Systems Management Team (TRANSMAT) has been reformed and renamed the Asset Management Steering Council (AMSC). The reformed AMSC is chaired by the Deputy Director and consists of eight members. Figure 30 - AAC Membership Figure 29 - AMSC Membership Specific objectives to include: Ensuring horizontal and vertical communication and integration across the organization relative to asset management, Utah TAMP 15 Specific objectives of the AAC include: Recommending modifications to policies and processes to improve asset management practices to the AMSC, Working together across department boundaries to develop and recommend a unified program to the AMSC that maximizes system performance and funding, and Aligning programs to determine the most cost effective method of addressing asset needs.
16 The enhanced collaboration across functions is expected to lead to synergistic improvements for individual asset performance beyond the level that any one division could achieve. UDOT has shown great success due to collaboration while preparing for the 2002 Olympics, embracing Design/Build and other alternative contracting methods, initiating the use of Accelerated Bridge Construction (ABC), etc. This committee organization engages UDOT leaders to make strategic decisions and also informs and educates employees throughout UDOT regarding the direction of asset management and their critical involvement. Policy Asset Management Oversight Structure UDOT Effective: Revised: June 30, 2014 Purpose To outline the responsibilities of the Utah Department of Transportation (Department) Asset Management Steering Council (AMSC) and the Asset Advisory Committee (AAC). These responsibilities include providing recommendations to the Transportation Commission pertaining to planning, developing, and preserving the investment in Utah s Transportation System and obtaining maximum cost effectiveness from transportation construction, rehabilitation, and maintenance programs. AMSC and AAC activities support the Department strategic goals: 1. Preserve Infrastructure 2. Optimize Mobility 3. Zero Fatalities 4. Strengthen the Economy Policy The AMSC and AAC provide recommendations to preserve the large investment in the State s roadway and transportation systems and provide a strategy to obtain an enhanced system of highways and related transportation modes that continue to meet the needs of Transportation System users. The teams assist the Department in obtaining cost effective solutions for system needs by using program alignment, organized and accessible data, and risk-based asset performance. The council and committee make sure all divisions of the Department are working together to present a unified program recommendation based on a transparent decision-making process. ASSET MANAGEMENT STEERING COUNCIL MEMBERS Deputy Director Chair Program Development Director Project Development Director Operations Engineer Region 1 Director Region 2 Director Region 3 Director Region 4 Director Asset Management Director (Secretary) FHWA Division Administrator or designee ASSET ADVISORY COMMITTEE MEMBERS Asset Management Director Chair Planning Director Traffic Management Engineer Traffic and Safety Engineer Engineering Services Director Structures Chief Engineer Maintenance Director Region 1 Representative Region 2 Representative Region 3 Representative Region 4 Representative FHWA Team Leader or designee Various divisions, sections, and regions provide needed staff support and input to AMSC. AAC members may be invited to participate in AMSC meetings at the chairman s discretion. AMSC is authorized to establish pro tem teams and task forces to assist in accomplishing its responsibilities. AMSC will consider strategic level Transportation Systems Management activities within the Department; make recommendations to the Transportation Commission; improve efficiency of the decision making process; and assure consistent transportation systems management practices at all supervisory levels. Specific responsibilities of the AMSC include: 1. Recommending Department transportation strategies to the Transportation Commission to implement and achieve the Department transportation policies. Utah TAMP 16

17 2. Recommending policies and resource levels that support ongoing improvement of asset management and a unified transportation program. 3. Guaranteeing horizontal and vertical communication and integration across the Department relative to asset management. 4. Reviewing and reporting the results of the Department s Annual Transportation Program to the Transportation Commission and public. 5. Evaluating the direction of asset management annually in a joint meeting with AAC. AAC oversees implementation of the Department s Transportation Systems Management Process. Specific responsibilities of the AAC include: Appendix B - Gap Analysis Process and Results In order to begin the process of evaluating the current situation of Asset Management, the Asset Management Implementation Plan (developed in June 2004 and updated in April 2006) was reviewed. It was noted that many of the actions identified in the plan had been achieved, and UDOT has had great success in regards to managing assets especially bridges and pavements. The document also identified that many of the divisions within UDOT were working towards the goals set forth as a strategic direction by senior leaders at the time. Over the past 8 years, there have been great technological advances and some change in direction in the strategic plan. These events have created new challenges and opportunities that are addressed in this TAMP. In order to identify the steps taken to raise asset management to a gold standard, self-assessments were completed. The assessments results were identified through a process of brainstorming sessions, surveys, and interviews specific to divisions. 1. Recommending to the AMSC modifications to policies and processes to improve asset management practices. 2. Working together across department boundaries to develop and recommend a unified program to the AMSC that maximizes system performance and funding. 3. Aligning programs to determine the most cost effective way of addressing asset needs. 4. Determining the appropriate management level for each asset. Definitions A Transportation Systems Management Process provides a set of various tools or methods to assist decision makers in finding optimum strategies for providing and maintaining the transportation systems in an acceptable condition over a planned period. The process includes analysis programs and related data to include but not limited to the following transportation areas: Pavements, Safety, Structures, Mobility, Design, Construction, Maintenance, and Planning. Utah TAMP 17 Figure 31 - Gap Analysis Flow Chart Self-Assessment and Gap Analysis Specific activities were taken to understand the gaps associated with Asset Management as shown in Figure 31 and described below. Activity 1. The asset Management Steering Councel participated in a facilitated discussion of the purpose of a five year strategic plan and issues currently faced by council members. This discussion in July 2013 resulted in a collection

18 of comments and questions written on pot-it-notes by voting and non-voting council members Activity 2. The discussion facilitators, RiversQuest Consulting and V-I-A Consulting, organized the comments and questions from the July meeting into major categories. The results of the categorization are shown in Figure 32. The percentages presented are based on 79 total post-it notes collected. The actual comments are included in Appendix C. a report for consideration. Senior leaders elected to reorganize TRANSMAT into the Asset Management Organization Structure noted above. Gap Analysis Results The gap between the importance of each statement and the current status of UDOT performance as rated by the TRANSMAT Committee members is depicted in Figure 33. Appendix D contains the details of the voting results. The results show the biggest gaps are in areas related to information technology. As technology rapidly advances much more data is gathered and the challenge comes in gathering the knowledge from each function and making it available to others. Information systems support a coordinated, seamless approach to Asset Management. Figure 32 - Comment Categorization Activity 3. Questions were developed from the comments gathered in Activity 1 and incorporated into a Gap Analysis Survey. The initial questions were fine-tuned and minimized based on individual discussions with senior UDOT leaders. Activity 4. Eleven questions were presented to the TRANSMAT Committee during the November 2013 meeting (See Appendix C). Each statement was rated in two ways. 1. The statement was rated on level of importance to the UDOT program on a scale of 1-5. The scale was defined as 1-very important to 5-unimportant. 2. Next each statement was rated on a scale of 1-5 relative to UDOT s current level of performance with 1-excellent and 5-poor. Twenty-three meeting participants recorded their answers with a handheld device and results which were immediately available for each statement. The meeting facilitators analyzed the results and incorporated the information into Utah TAMP 18 Figure 33 - Gap Analysis Results Further discussion of the gap analysis results led to the identification of three major areas of focus. The three questions related to data show the largest gaps and the highest importance of all the questions. These questions focus on the organization and accessibility of data for business systems across UDOT. Three questions related to asset performance and identified a need to focus on performance measures and different levels of management plans for assets. The remaining questions relate to aligning programs within UDOT and with partners to ensure transparent and data driven decision processes are in place to build and maintain public trust. These major areas of focus became objectives for the five year plan and led to defining the asset management goal.


19 Appendix C - Committee Comments, July 2013 TRANSMAT Committee Comments Regarding Asset Management Plan Utah TAMP 19

20 Comment Provided By Voting Member Voting Member Non-Voting Member Non-Voting Member Non-Voting Member Non-Voting Member Non-Voting Member Voting Member Ideas Responsibility Incorporate risk analysis into asset management Asset Manageprocesses ment Better define our risk analysis / factors What is the program for minor rehab and preservation? Where can it be found? Does it state the treatment type? UPlan is the tool to Use!!! One stop shop = Efficiency Employees need education and training on UPlan and UGate Communication Utah TAMP 20 Risks Project Delivery Risks Asset Management Systems/Data - Education Steering Committee Systems/Data - Education Steering Committee Systems/Data - Education Steering Committee Systems/Data - Education Low trust in the data in UPlan and UGate. Need Steering Comto know the source of the data. mittee We need to educate stakeholders about assets Steering Comdata and UPlan mittee Educate department on what data is available. Consolidate and build systems to make it readily Steering Comavailable. mittee Voting Member Non-VotWhat level of integration is enough to feed asset ing Memmanagement? ber We do a good job with pavement and fund allocation but the data and allocation is about 2 years behind. Example: Core project has made Non-Vot- pavement good in Utah County but won t see ing Mem- funding levels change for 2 to 3 years. Can we ber get data change faster? Non-Vot- Need data collection that is recent and relevant ing Mem- IE: Traffic data needs to be newer then 3 years ber old Voting Continue building business systems that share Member and integrate data Non-VotThe TMD has data that other groups / regions ing Memneed to make better decisions ber Category Systems/Data - Education Systems/Data - Education Systems/Data - Education Asset Management Systems/Data - Integration IT Systems/Data - Integration IT Systems/Data - Integration Systems/Data - Integration Planning Systems/Data - Integration IT

21 Utah TAMP 21
22 Appendix D - Gap Analysis Questions and Voting Results UDOT Asset Management Steering Council Gap Analysis Questions UDOT Systems / Data UDOT has established a quality data information architecture to promote the integration of business systems for unified asset management Business systems are treated as a strategic asset to help make data driven 1. Very Important 1. Excellent 2. Important 2. Above Average 3. Somewhat Important 3. Average 4. Of Little Importance 4. Below Average 5. Unimportant 5. Poor decisions. Necessary data is easily accessible to make data driven cost/benefit deci- 1. Very Important 1. Excellent 2. Important 2. Above Average 3. Somewhat Important 3. Average 4. Of Little Importance 4. Below Average 5. Unimportant 5. Poor sions. 1. Very Important 2. Important 3. Somewhat Important 4. Of Little Importance 5. Unimportant 1. Excellent 2. Above Average 3. Average 4. Below Average 5. Poor UDOT Project Prioritization A clear, well documented state-wide prioritization process is in place. 1. Very Important 1. Excellent 2. Important 2. Above Average 3. Somewhat Important 3. Average 4. Of Little Importance 4. Below Average 5. Unimportant 5. Poor Management plans have been / are being developed for pavements including lifecycle analysis, identification of performance measures, and data required for cross analysis. 1. Very Important 1. Excellent 2. Important 2. Above Average 3. Somewhat Important 3. Average 4. Of Little Importance 4. Below Average 5. Unimportant 5. Poor Management plans have been / are being developed for bridges including lifecycle analysis, identification of performance measures, and data required for cross analysis. 1. Very Important 1. Excellent 2. Important 2. Above Average 3. Somewhat Important 3. Average 4. Of Little Importance 4. Below Average 5. Unimportant 5. Poor Management plans have been / are being developed for other assets including lifecycle analysis, identification of performance measures, and data required for cross analysis. 1. Very Important 1. Excellent 2. Important 2. Above Average 3. Somewhat Important 3. Average 4. Of Little Importance 4. Below Average 5. Unimportant 5. Poor UDOT Funding The types of funding, the uses of funding, and the process to fund projects is transparent. 1. Very Important 2. Important 3. Somewhat Important 4. Of Little Importance 5. Unimportant 1. Excellent 2. Above Average 3. Average 4. Below Average 5. Poor Utah TAMP 22


23 UDOT Performance Measures Asset management performance measures are consistent with the UDOT strategic direction and with the criteria used to set program priorities, select projects, and allocate resources. 1. Very Important 2. Important 3. Somewhat Important 4. Of Little Importance 5. Unimportant 1. Excellent 2. Above Average 3. Average 4. Below Average 5. Poor UDOT Risk Assessment Resource allocation includes assessment of probability and severity of risk associated with each asset. 1. Very Important 1. Excellent 2. Important 2. Above Average 3. Somewhat Important 3. Average 4. Of Little Importance 4. Below Average 5. Unimportant 5. Poor Collaboration UDOT liaison s with local governments share information and knowledge to further the development of asset management in Utah. 1. Very Important 2. Important 3. Somewhat Important 4. Of Little Importance 5. Unimportant 1. Excellent 2. Above Average 3. Average 4. Below Average 5. Poor Gap Analysis Voting Results UDOT Systems / Data Information Architecture #1 Survey Results: UDOT has established a quality data information architecture to promote the integration of business systems for unified asset management. Gap Analysis: #2 Survey Results: Business systems are treated as a strategic asset to help make data driven decisions. Gap Analysis: Utah TAMP 23


24 Necessary Data Available #3 Survey Results: Necessary data is easily accessible to make data driven cost/benefit decisions. Management Plans for Pavements #5 Survey Results: Management plans have been / are being developed for pavements including lifecycle analysis, identification of performance measures, and data required for cross analysis Gap Analysis UDOT Project Prioritization Gap Analysis: Prioritization Process #4 Survey Results: A clear, well documented state-wide prioritization process is in place. Management Plans for Bridges #6 Survey Results: Management plans have been / are being developed for bridges including lifecycle analysis, identification of performance measures, and data required for cross analysis. Gap Analysis: Gap Analysis: Utah TAMP 24


25 Management Plans for Other Assets #7 Survey Results: Management plans have been / are being developed for other assets including lifecycle analysis, identification of performance measures, and data required for cross analysis. UDOT Performance Measures Alignment of Performance Measures #9 Survey Results: Asset management performance measures are consistent with the UDOT strategic direction and with the criteria used to set program priorities, select projects, and allocate resources. Gap Analysis: Gap Analysis: UDOT Funding Funding Transparency #8 Survey Results: The types of funding, the uses of funding, and the process to fund projects is transparent. UDOT Risk Assessment Risk Assessment #10 Survey Results: Resource allocation includes assessment of probability and severity of risk associated with each asset. Gap Analysis: Gap Analysis: Utah TAMP 25


26 Collaboration Local Government Collaboration #11 Survey Results: UDOT liaison s with local governments share information and knowledge to further the development of asset management in Utah. Appendix E - Roadmap Implementation Plan Each division is responsible for completing a variety of tasks specifically focused on ensuring successful completion of the objectives in the roadmap. The tasks are divided into 1, 3, and 5 year sections for each of the three objectives shown on Table 5-Table 7. Risks and the associated risk mitigation are identified for each of the tasks by the responsible division. An assessment of each programmatic risk has been estimated as a combination of the probability and impact as shown in Figure 34. Gap Analysis: Probability Impact L M H H M L Figure 34 - Risk Matrix Utah TAMP 26
27 Table 5 - Integrated Programs Tasks and Risks CATEGORY: INTEGRATED PROGRAMS Year Responsibility Task Description Risk Description Risk Mitigation 1 OBJECTIVE Develop department plans to support unified program Risk Assessment 1 Planning Publish 2015 UDOT Statewide Long Range Plan Model development and new consultant PM Weekly team meetings and weekly project review meetings 3 1 Planning Support MPOs in publishing 2015 Regional Transportation Plans Achieving agreement on project phasing priorities Use UDOT prioritization model as starting point for the process, actively engage regions in decision making process, comment on MPO prioritization process 4 1 Planning Initiate I-15 integrated corridor study to inform Wasatch Front area RTP's 2019 update Unbiased evaluation of potential strategies Partner dialogue about importance of objectivity, tight scope, proper decision making structure, hire right consultant team Actively work with regions to develop a process that adds value to their processes 1 Planning Work with Regions to enhance intermediate-range planning processes Articulating the value of proposed process 6 1 Proj. Dev Put out 3D plans on selected projects Work is in progress, no risks identified Continue to work on implementation plan with Regions 1 1 T & S Complete safety investment plan system System shows unexpected results Testing during development 1 1 Maintenance Refine performance level budget distribution Incomplete historical information Continue to refine factors as history is developed 6 1 Asset Mgt. Develop a value matrix for tangible assets 3 OBJECTIVE Improve/Develop models for specific programs Difficulty in quantifying value of one program vs. another may stop or lengthen efforts Several workshops scheduled this summer with Executives Planning Work with MPO partners and UTA to enhance long-range planning process Agreement on scope of process, joint goals & objectives, On-going partner engagement and discussion about joint performance measures, processes for jointly assessing process and collectively working to improve the process needs and developing strategies to meet identified needs. 6 3 Proj. Dev Modify Asset Management Guidelines as needed to reflect Inability to come to a consensus on which assets need to Continue to work with the AAC and other interested parties program changes be managed and how they will be managed. to complete the guidance documents. 3 3 Proj. Dev Unify Region 3 year plans and complete projects from Work with the AAC and Regions to make sure all projects Inability to implement the usage of the 3 years plans asset management are accurately reflected in the plans. 1 3 Asset Mgt. Develop deterioration curves for pavement condition Lack of quality data may produce inaccurate pavement analysis Re-establish PFES after 2016 data collection 7 3 Asset Mgt. Relate program funding to performance goals Limited ability to explain how funding is allocated between Explore different vendor products programs 7 3 TOC Develop asset management program for ATMS assets Missing data could diminish perceived benefit initially Inform and manage expectations 3 3 TOC Create and fine tune performance goals Lack of consensus on acceptable performance levels Engage senior leaders in process 1 3 T & S Leverage safety funding across all projects Culture unable to adapt, can't reach consensus on value decisions Engage senior leaders in process 2 3 T & S Integrate safety analysis into Project Development processes Culture unable to adapt, negative impact to safety funding Engage senior leaders in process 6 3 T & S Integrate science-based crash analysis into all functional Engage senior leaders and provide education on Methodology appears too complex or burdensome areas methodology 7 5 OBJECTIVE Prioritize projects across all categories 5 Planning 5 Asset Mgt. 5 T & S Utah TAMP 27 Publish 2019 "Performance Based" Statewide Long Range Plan and regional plans Engage multiple departments in collaborative decision making Include science-based crash analysis in funding prioritization No partner agreement on plan goals, objectives and performance measures "Silos of excellence" culture prevent development of a Unified Plan Conduct performance measure workshop with partners and on-going and continuous discussion with partners Explore common goals, make it valuable to all 6 Appears too complex and burdensome to overall process Provide education and training for involve personnel 4 5
28 Table 6 - Performance Management Tasks and Risks CATEGORY: PERFORMANCE MANAGEMENT Year Responsibility Task Description Risk Description Risk Mitigation Risk Assessment 1 OBJECTIVE Refine performance plans for individual assets 1 Structures Define good/fair/poor performance levels Misconception of definition of terms Create clear definitions; communicate performance measures in correct context 2 1 Structures Evaluate funding needs based on established performance Setting justifiable performance levels that maintains the Establish appropriate performance levels and track funding levels integrity of the system levels to maintain performance level 6 3 Structures Create a plan for every structure Inadequate resources to complete Establish a plan to complete and obtain necessary resources 4 1 TOC Automate congestion reporting None N/A 1 1 Asset Mgt. Develop a financial plan with value and risk for tangible Inability to accurately quantify/articulate future financial assets requirements Link PDBS/Asset data 2 1 Asset Mgt. Add deterioration curves to Plan for Every Section analysis Small sample size may produce inaccurate curves Link pavement distress data to sections 2 3 OBJECTIVE Establish data driven performance measures and individual program goals 3 Structures Define bridge needs and establish funding Inability to identify optimal treatments and variability in bridge conditions Work to gain consistency in defining bridge condition data; review past bridge conditions with past funding to develop a trend 7 3 Planning Initiate Performance Based Planning Process for statewide & regional plans 2019 update Internal consensus on implications about how the Final Four and Emphasis areas affect the process of assessing system needs and development of mitigation strategies; integrating performance management into transportation planning; collecting and turning data into information that guides planning decisions; risks with setting specific targets; tools to predict future performance and assess project impacts on performance areas - time lags... Develop measures that make sense; proactive engagement and collaboration with internal and external stakeholders; build on established performance management approaches; good communication of constraints and trade-offs; link planning and programming; Asset Mgt. Refine performance measures to include risk and life-cycle costs Incomplete information skews reporting on performance measures Integrate business systems and data 7 5 OBJECTIVE Prioritize funding across all categories 5 TOC Include mobility in funding prioritization Culture unable to adapt, can't reach consensus on value decisions, lack of confidence in data Engage senior leaders in process 6 5 Structures Define benefits of work completed Insufficient measurement of treatment impacts Perform research to understand the treatment impacts 7 5 Asset Mgt. Create unified plan with funding recommendations Limited ability to explain how funding is allocated between Several workshops scheduled this summer with AAC programs 6 Utah TAMP 28
29 Table 7 - Organized and Accessible Data Tasks and Risks CATEGORY: ORGANIZED AND ACCESSIBLE DATA Year Responsibility Task Description Risk Description Risk Mitigation Risk Assessment 1 OBJECTIVE Identify needs and establish framework to integrate data 1 Proj. Dev Develop push button concept report data collection 1 Proj. Dev 1 Maintenance Develop data warehouse from which departmental financial results can be displayed Finish integration of OMS & dtms to establish system feedback loop This has been set up and regions are testing--risk is that they don't use it. Funding and internal resource availability Continue to work with the regions on improvements to make sure they are comfortable using the tool. Work with PMT and UDOT divisions to secure funding and make sure resources can be dedicated to the effort. Available programing staff Hire consultant to provide programing Maintenance Optimize Mandli data input process to automate incorporation with OMS Data architecture not available and process not developed to store historical data and insert current data Develop data warehouse and fully implement integration process 8 1 Maintenance Hire business analyst to provide increased level of service Create position by optimizing current Central Maintenance Position availability for OMS users resources 7 1 TOC Incorporate traffic asset information into UPlan Lack of resources to complete Hire consultants 6 1 Asset Mgt. Update asset data with Phase 2 data collection Lack of business system integration - OMS/Ugate limits access to historical data Continue to work together on OMS 9 1 T & S Complete GIS crash data analysis system System is not used due to perceived low value, required Communicate value and make continual updating a priority updating is neglected and automated 5 3 OBJECTIVE Establish processes for accurate and up-to-date data 3 Planning Improve recording and reporting of funding & construction of LRP projects Accurate, complete recording of long-range plan information and project information in epm Work with Project Development and DTS to enhance epm to enable LRP cross reference and develop communication process with regions to assess whether project scope meets intent of LRP project 3 Maintenance Develop and implement refined OMS system to include all improvements Availability of programming services Hire consultant and train staff 6 3 Asset Mgt. Ensure asset management business systems share data Business systems unable to share data and produce Develop data warehouse and fully implement integration with other business systems consistent results process 8 3 Proj. Dev Create electronic 3D plans for all projects Unintelligent designs and lost efficiency Create implementation plan and provide training 2 3 Proj. Dev Develop data governance plan Funding availability Continue to work with the PMT 6 5 OBJECTIVE Automate dashboard reports 5 Maintenance Complete integration of OMS system with other UDOT Have consultant provide programming services to Programming resources systems complete integration 5 5 Proj. Dev Automatically load 3-D as-builts into system Struggle to maintain as-built information Develop 3D CADD database and require contractors to submit models that conform with standards 6 5 Proj. Dev Integrate all business systems with data warehouse Lack of financial and personnel resource availability Maintain leadership support 5 4 Utah TAMP 29


30 Appendix F - Asset Value and Risk Assessment Utah TAMP 30


31 Utah TAMP 31

32 Utah TAMP 32

33 Utah TAMP 33
Utah Transportation Asset Management Plan. April 4, 2018
 Utah Transportation Asset Management Plan April 4, 2018 Executive Summary EXECUTIVE SUMMARY INTRODUCTION TO THE UTAH TRANSPORTATION ASSET MANAGEMENT PLAN (TAMP) The Utah Transportation Asset Management
ODOT Asset Management Plan 0
 ODOT Asset Management Plan 0 Table of Contents Executive Summary... 1 ODOT s Experience with Asset Management... 1 A New Way of Doing Business... 2 ODOT s Investment Plans... 3 Moving Forward... 5 1.0
Chapter 9 IMPLEMENTATION AND FUTURE DEVELOPMENTS CHAPTER 9 IMPLEMENTATION AND FUTURE DEVELOPMENTS PAGE 111
 Chapter 9 IMPLEMENTATION AND FUTURE DEVELOPMENTS CHAPTER 9 IMPLEMENTATION AND FUTURE DEVELOPMENTS PAGE 111 This page intentionally left blank. PAGE 112 MINNESOTA GO MNDOT TRANSPORTATION ASSET MANAGEMENT
Pavement Management s Role in an Asset Management World
 Pavement Management s Role in an Asset Management World Kathryn A. Zimmerman, P.E. (Corresponding Author) Prashant Ram, E.I.T. Applied Pavement Technology, Inc. W. Main Street, Suite 00 Urbana, IL 0 Paper
LOU LAMBERT, DEPUTY DIRECTOR BUREAU OF TRANSPORTATION PLANNING
 LOU LAMBERT, DEPUTY DIRECTOR BUREAU OF TRANSPORTATION PLANNING FIVE MAJOR AREAS Evolving Process of Strategic Analysis New Paradigm in Transportation Current Activities in Asset Management Michigan Business
Framework for ADOT Asset Management System. Jean A. Nehme, PhD, PE Arizona Department of Transportation
 Framework for ADOT Asset Management System Jean A. Nehme, PhD, PE Arizona Department of Transportation November 14, 2013 Arizona Pavements/Materials Conference 1 Presentation Overview Brief Intro to Transportation
NOVEMBER 2016 TRANSPORTATION ASSET MANAGEMENT PLAN
 NOVEMBER 2016 TRANSPORTATION ASSET MANAGEMENT PLAN Images on the cover page, counterclockwise from the top left: Interstate 80 at Altoona Council Bluffs Interstate System Improvements U.S. 20 construction
MONITORING IMPLEMENTATION AND PERFORMANCE
 12 MONITORING IMPLEMENTATION AND PERFORMANCE The FAST Act continues the legislation authorized under MAP-21, which created a data-driven, performance-based multimodal program to address the many challenges
ANNUAL REPORT. Pursuant to: Code of Virginia
 ANNUAL REPORT 2015 Pursuant to: Code of Virginia 33.2-232 Virginia Department of Transportation 1401 East Broad Street Richmond, Virginia 23219 November 30, 2015 Table of Contents Executive Summary ii
Introduction. Background
 Example Transportation Asset Management Plan Outline This outline was created using the Transportation Asset Management Plan (TAMP) Builder ( www.tamptemplate.org ), a product of NCHRP Project 8-36/116.
ALDOT Transportation Asset Management Plan (TAMP) February 10, 2016
 February 10, 2016") ALDOT Transportation Asset Management Plan (TAMP) February 10, 2016 What is TAM? A strategic approach to managing transportation infrastructure Focuses on business processes for resource allocation Objective
ALDOT Transportation Asset Management Plan (TAMP) February 10, 2016 What is TAM? A strategic approach to managing transportation infrastructure Focuses on business processes for resource allocation Objective
MAP-21 National Highway Performance Program Asset Management Plan
 MAP-21 National Highway Performance Program Asset Management Plan Federal Highway Administration March 2015 Webcast MAP-21 FHWA Performance Rulemaking Schedule MAP-21: Asset Management 2 Risk-Based Asset
Table of Contents PERMIAN BASIN MPO TIP 2
 Table of Contents Permian Basin MPO Membership and Structure... 3 Mission Statement... 3 Vision Statement... 3 Transportation Improvement Program (TIP)... 4 Year of Expenditure (YOE) Trends... 4 Total
SOUTH DAKOTA DEPARTMENT OF TRANSPORTATION
 SOUTH DAKOTA DEPARTMENT OF TRANSPORTATION PERFORMANCE MEASURE 2018 ANNUAL REPORT Per SDCL 2-6-38 1 PAVEMENT CONDITION Leading up to and during the 2015 Legislative Session, the Department worked with the
Title Subtitle. Mid-Continent Transportation Research Symposium Session 1-D, Asset Management Meeting and Performance Measures I August Date 19, 2015
 Today s Innovation, Tomorrow s Best Practice: FHWA s Notice of Proposed Rulemaking on System Performance Measures Title Subtitle Mid-Continent Transportation Research Symposium Session 1-D, Asset Management
Transportation Improvement Program (TIP) Relationship to 2040 Metropolitan Transportation Plan (MTP) - Goals and Performance Measures
 Relationship to 2040 Metropolitan Transportation Plan (MTP) - Goals and Performance Measures") Mid-Region Metropolitan Planning Organization Mid-Region Council of Governments 809 Copper Avenue NW Albuquerque, New Mexico 87102 (505) 247-1750-tel. (505) 247-1753-fax www.mrcog-nm.gov Transportation
Mid-Region Metropolitan Planning Organization Mid-Region Council of Governments 809 Copper Avenue NW Albuquerque, New Mexico 87102 (505) 247-1750-tel. (505) 247-1753-fax www.mrcog-nm.gov Transportation
The amount of travel on the Michigan state
 Reproduced with permission from TR News, March April 2, Number 219, Transportation Research Board, National Research Council, Washington, D.C., 2. Strategic Planning for Pavement Preventive Maintenance
Transportation Asset Management Plan. July 2014 Draft
 Transportation Asset Management Plan July 2014 Draft Executive Summary EXECUTIVE SUMMARY PAGE i This page intentionally left blank. PAGE ii MINNESOTA GO MNDOT TRANSPORTATION ASSET MANAGEMENT PLAN EXECUTIVE
Transportation Asset Management Plan
 Transportation Asset Management Plan Work Plan - Outline This document offers an outline to develop the State Transportation Asset Management Plan March 8, 2017 Transportation Asset Management Plan Work
South Carolina DOT Asset Management Peer Exchange Louisiana DOTD
 South Carolina DOT Asset Management Peer Exchange Louisiana DOTD Presented by Michael Bridges, P.E. Undersecretary for the Office of Management and Finance February 5 th and 6 th, 2014 1 Contents LADOTD
SOUTH DAKOTA DEPARTMENT OF TRANSPORTATION
 SOUTH DAKOTA DEPARTMENT OF TRANSPORTATION PERFORMANCE MEASURE 2016 ANNUAL REPORT Per SDCL 2-6-38 1 PAVEMENT CONDITION Leading up to and during the 2015 Legislative Session, the Department worked with the
Metropolitan Planning Organization Safety Performance Measures Fact Sheet
 waco mpo Metropolitan Planning Organization Safety Performance Measures Fact Sheet Safety Performance Measures The Safety Performance Management Measures regulation supports the Highway Safety Improvement
TRANSPORTATION PERFORMANCE MANAGEMENT
 MAY 2018 TRANSPORTATION PERFORMANCE MANAGEMENT PAVEMENT PERFORMANCE MANAGEMENT PAVEMENT PERFORMANCE REQUIREMENTS The Federal Highway Administration (FHWA) published in the Federal Register (82 FR 5886)
THE ROAD TO RUIN ARE WORSENING CONDITIONS ON THE HORIZON? STATE HIGHWAY PAVEMENTS: JOHN J. SHUFON
 THE ROAD TO RUIN STATE HIGHWAY PAVEMENTS: ARE WORSENING CONDITIONS ON THE HORIZON? JOHN J. SHUFON This report was authored by John J. Shufon. John has 35 years of experience with the New York State Department
Designing the Future of NMDOT
 Designing the Future of NMDOT NM Infrastructure Finance Conference October 28, 2015 Anne McLaughlin, Statewide Planning Bureau Chief Tamara P. Haas, P.E. Asset Management & Planning Division Director Tamarap.Haas@state.nm.us
SOUTH CAROLINA DEPARTMENT OF TRANSPORTATION. Initial Transportation Asset Management Plan
 SOUTH CAROLINA DEPARTMENT OF TRANSPORTATION Initial Transportation Asset Management Plan April 2018 Table of Contents Letter of Transmittal... 1 Executive Summary... 2 1. Introduction... 9 1.1. Overview...
Metropolitan Planning Organization Safety Performance Measures Fact Sheet
 Metropolitan Planning Organization Safety Fact Sheet Safety The Safety Performance Management Measures regulation supports the Highway Safety Improvement Program (HSIP) and requires State Departments of
Joint Legislative Transportation Oversight Committee January 6, 2016 Maintenance Operations Performance Analysis Report (MOPAR) Kristin Barnes
 Kristin Barnes") Joint Legislative Oversight Committee January 6, 2016 Maintenance Operations Performance Analysis Report (MOPAR) Kristin Barnes Division 4 Staff Maintenance Engineer 1 Legislative Requirements (NCGS 136-44.3)
Joint Legislative Oversight Committee January 6, 2016 Maintenance Operations Performance Analysis Report (MOPAR) Kristin Barnes Division 4 Staff Maintenance Engineer 1 Legislative Requirements (NCGS 136-44.3)
INVESTMENT SCENARIOS CHAPTER Illustrative Investment Approaches Public Outreach 6-1
 CHAPTER 6 As detailed in Chapters 4 and 5, Texas multimodal transportation needs estimated at $21 billion annually (2014 constant dollars) illustrated in Exhibit 4-12 far outstrip the approximately $9.1
USING REMAINING SERVICE LIFE AS THE NATIONAL PERFORMANCE MEASURE OF PAVEMENT ASSETS
 Mack, Sullivan 1 1 2 3 4 5 6 7 8 9 10 11 12 13 14 15 16 17 18 19 20 21 22 23 24 25 26 27 28 29 30 31 32 33 34 USING REMAINING SERVICE LIFE AS THE NATIONAL PERFORMANCE MEASURE OF PAVEMENT ASSETS Word Count
Implementing a Pavement Management System PASER Based City of Omaha, NE
 Implementing a Pavement Management System PASER Based City of Omaha, NE Introductions JESS HASTINGS, PE Project Manager 10 Years of Experience TIM O BRYAN, PE Senior Project Manager 30 Years of Experience
RESOLUTION NO
 RESOLUTION NO. 2018-12 RESOLUTION OF THE SOUTHEASTERN WISCONSIN REGIONAL PLANNING COMMISSION AMENDING THE TRANSPORTATION IMPROVEMENT PROGRAM FOR SOUTHEASTERN WISCONSIN: 2017-2020 WHEREAS, the Southeastern
NEW MEXICO LAND OF ENCHANTMENT
 Bridges CENTENNIAL 1912-2012 NM C - NEW MEXICO LAND OF ENCHANTMENT Las Cruces viaduct; finishing floor. Source: NM Department of Transportation New Mexico Infrastructure Report Card 2012: 34 Overview:
Asset Management Program Plan
 ODOT ASSET MANAGEMENT STAYING AHEAD OF THE CURVE... ODOT Asset Management Program Plan March 19, 2008 This Asset Management Program Plan has been developed to provide interested stakeholders a synopsis
Memo Pavement Investment Guide
 Memo Pavement Investment Guide Date: 03/26/2018 To: District Engineers, Assistant District Engineers for Program Delivery and Maintenance Operations, District Materials Engineers, District Planners From:
Addendum #3 to the Regional Transportation Plan
 Nashville Area Metropolitan Planning Organization Addendum #3 to the Regional Transportation Plan Effective November 21, 2018 Nashville Area Metropolitan Planning Organization 138 Second Avenue North Nashville,
MoDOT s National Highway System Transportation Asset Management Plan
 MoDOT s National Highway System Transportation Asset Management Plan April 2018 Data-driven Decisions for Critical Transportation Assets page ii Missouri s transportation system is a tremendous asset.
THE FIVE GOALS FOR SCDOT S STRATEGIC PLAN ARE: GOAL 1: Improve safety programs and outcomes in our high-risk areas.
 THE FIVE GOALS FOR SCDOT S 2018-2020 STRATEGIC PLAN ARE: GOAL 1: Improve safety programs and outcomes in our high-risk areas. GOAL 2: Maintain and preserve our existing transportation infrastructure. GOAL
Washington State DOT: Pavement and Bridge Performance NPRM Comments for federal docket,
 MAP-21 NPRM for National Performance Management Measures; Assessing Pavement Condition for the National Highway Performance Program and Bridge Condition for the National Highway Performance Program The
I-64 Corridor Study Phase II Pavement Rehabilitation Report December 2002 Materials Division Pavement Design and Evaluation Section TABLE OF CONTENTS
 Materials Division Pavement Design and Evaluation Section TABLE OF CONTENTS INTRODUCTION... 1 STUDY PURPOSE... 2 REVIEW OF PHASE I... 3 Data Analysis... 3 Corridor Segmentation... 3 Maintenance and Rehabilitation
Williamsport Area Transportation Study Metropolitan Planning Organization
 Williamsport Area Transportation Study Metropolitan Planning Organization LONG RANGE TRANSPORTATION PLAN 2018-2038 CHAPTER 1 INTRODUCTION Purpose of a Long Range Transportation Plan Transportation infrastructure
AASHTO Manual for Bridge Evaluation: Section 3, Bridge Management Systems A Practical Tour
 0 0 0 AASHTO Manual for Bridge Evaluation: Section, Bridge Management Systems A Practical Tour Dave Juntunen P.E. Michigan Department of Transportation Bridge Development Engineer Vice-Chair AASHTO SCOBS
Using MAP-21/FAST to Strengthen New Mexico DOT s Transportation Asset Management Program
 Using MAP-21/FAST to Strengthen New Mexico DOT s Transportation Asset Management Program 2016 ITE District 6 Annual Meeting July 13, 2016 Tamara P. Haas, PE Asset Management & Planning Division Director
Congestion Management Process (CMP)
") Congestion Management Process (CMP) Introduction The Congestion Management Process (CMP) is a systematic, data-driven, and regionally accepted approach that aims to improve the performance of the transportation
Congestion Management Process (CMP) Introduction The Congestion Management Process (CMP) is a systematic, data-driven, and regionally accepted approach that aims to improve the performance of the transportation
Staffing Analysis Report for the North Carolina Department of Transportation Division of Highways
 Staffing Analysis Report for the North Carolina Department of Transportation Division of Highways 2014 By the North Carolina Department of Transportation for the NC General Assembly Joint Legislative Transportation
Chapter 7 PERFORMANCE GAPS CHAPTER 7 PERFORMANCE GAPS PAGE 83
 Chapter 7 PERFORMANCE GAPS CHAPTER 7 PERFORMANCE GAPS PAGE 83 This page intentionally left blank. PAGE 84 MINNESOTA GO MNDOT TRANSPORTATION ASSET MANAGEMENT PLAN PERFORMANCE GAPS Overview Asset condition
Performance Management Accountability Meeting Data as of September, 2012
 Performance Management Accountability Meeting Data as of September, 2012 Richard A. Davey, Secretary & CEO Office of Performance Management and Innovation Celia J. Blue, Assistant Secretary October 31,
Quantifying the Benefits of Pavement Management
 Quantifying the Benefits of Pavement Management Smadi, O Research Scientist Iowa State University Ames, Iowa, USA SYNOPSIS Pavement management systems (PMS) have been in operation since the early 1970s
IDOT PERFORMANCE BASED PROJECT METRICS. February 2018
 IDOT PERFORMANCE BASED PROJECT METRICS February 2018 March 5, 2018 2 What is Performance Management? Performance Management of the Federal Highway Program is a systematic approach to making investment
The Evolution of Structures Asset Management in Wisconsin
 Dietsche, J.S. The Evolution of Structures Asset Management in Wisconsin April, 0 Word Count: 0 Joshua S. Dietsche Wisconsin Department of Transportation 0 Sheboygan Avenue, Room 0, Madison, WI 0 Phone:
Stephen Gaj Leader, Asset Management Team Office of Asset Management, Pavements, and Construction FHWA
 Stephen Gaj Leader, Asset Management Team Office of Asset Management, Pavements, and Construction FHWA Asset Management This is how we do business: Manage our assets to minimize their whole life costs.
The Ohio Department of Transportation Asset Management Playbook Plays for Success
 The Ohio Department of Transportation Asset Management Playbook 2017 8 Plays for Success The Ohio Department of Transportation Asset Management Playbook 1 Contents Introduction 2 Challenge 1: Flat Funding
A more detailed description of Transportation, and its programs and initiatives can be found at
 Business Plan 2018 21 Transportation Accountability Statement This business plan was prepared under my direction, taking into consideration our government s policy decisions as of March 7, 2018. original
MAKING THE PAVEMENT MANAGEMENT SYSTEM WORK TO SUPPORT ASSET MANAGEMENT
 MAKING THE PAVEMENT MANAGEMENT SYSTEM WORK TO SUPPORT ASSET MANAGEMENT Andrew Williams Office of Technical Services Andrew.Williams@dot.ohio.gov 1 TODAY S TOPIC How ODOT uses the Pavement Management System
Life Cycle Cost Analysis Pavement Options May 2002 Materials Division / Virginia Transportation Research Council TABLE OF CONTENTS
 Life Cycle Cost Analysis Pavement Options May 2002 Materials Division / Virginia Transportation Research Council TABLE OF CONTENTS I. INTRODUCTION...1 II. III. Purpose...1 What Is LCCA?...1 History of
Transportation Asset Management Webinar Series
 Transportation Asset Management Webinar Series Webinar 34 Integrating PM2 Targets with the TAMP Sponsored by FHWA and AASHTO Webinar 34 October 10, 2018 FHWA-AASHTO Asset Management Webinar Series This
Americans are accustomed to easy mobility
 Highway Infrastructure Preservation Principles of Pavement Preservation Definitions, Benefits, Issues, and Barriers LARRY GALEHOUSE, JAMES S. MOULTHROP, AND R. GARY HICKS 4 Galehouse is Director, National
Federal Highway Administration s Role in Bridge Preservation. Anwar S. Ahmad 1
 Federal Highway Administration s Role in Bridge Preservation Anwar S. Ahmad 1 Abstract The purpose of this paper is to provide a brief overview of the bridge preservation efforts in the United States and
PAVEMENT CONDITION REPORT 2018 UPDATE. Pavement Condition Report. City of Delaware
 2018 Pavement Condition Report City of Delaware Table of Contents Existing Conditions... 2 Pavement Ratings for Council Wards Pavement Ratings for Council Ward I... 3 Pavement Ratings for Council Ward
Washington State Department of Transportation Case Study. Guidelines for the Preservation of High-Traffic-Volume Roadways (R26)
") Washington State Department of Transportation Case Study Guidelines for the Preservation of High-Traffic-Volume Roadways (R26) Background Stretching the time between major rehabilitation projects can save
Washington State Department of Transportation Case Study Guidelines for the Preservation of High-Traffic-Volume Roadways (R26) Background Stretching the time between major rehabilitation projects can save
Transportation Asset Management Plan. Fiscal Years
 Transportation Asset Management Plan Fiscal Years 2018-2027 April 2018 (Page left blank intentionally) 2 P a g e Letter from the Commissioner GDOT has recognized the advantages of strategic investment
Overview of Maintenance and Construction Programs. Mike Holder, PE, Chief Engineer Jennifer Brandenburg, PE, State Asset Management Engineer
 Overview of Maintenance and Construction Programs Mike Holder, PE, Chief Engineer Jennifer Brandenburg, PE, State Asset Management Engineer March 3, 2015 Overview Maintenance and Construction State v.
MONTANA TRANSPORTATION BY THE NUMBERS:
 MONTANA TRANSPORTATION BY THE NUMBERS: Meeting the State s Need for Safe and Efficient Mobility FEBRUARY 2014 202-466-6706 tripnet.org Founded in 1971, TRIP of Washington, DC, is a nonprofit organization
TRANSPORTATION PERFORMANCE MEASURES IMPLEMENTING PERFORMANCE MEASUREMENT INTO R2CTPO PLANS AND PROGRAMS
 TRANSPORTATION PERFORMANCE MEASURES IMPLEMENTING PERFORMANCE MEASUREMENT INTO R2CTPO PLANS AND PROGRAMS River to Sea TPO Presentation September 2018 TRANSPORTATION PERFORMANCE MANAGEMENT (TPM) Intended
Coordinating Minnesota s Transportation Assets and Climate Change and Extreme Weather Vulnerability
 Coordinating Minnesota s Transportation Assets and Climate Change and Extreme Weather Vulnerability Duane R. Hill, PE District Engineer, District One Minnesota Department of Transportation What is a Transportation
Rehabilitation of Highway Pavements an Engineering Challenge
 Rehabilitation of Highway Pavements an Engineering Challenge G eorge W. M ca lpin Transportation Consultant Rye, New Hampshire IN T R O D U C T IO N There is no question that our country is currently confronted
Transportation Asset Management Webinar Series
 Transportation Asset Management Webinar Series Webinar 32: Life Cycle Planning and Management Sponsored by FHWA and AASHTO Webinar 32 June 13, 2018 FHWA-AASHTO Asset Management Webinar Series This is the
SCDOT Needs, Funding Challenges, and Economic Development. Getting to Good (and Staying There ) Robert St. Onge, SCDOT January 2013
 Robert St. Onge, SCDOT January 2013") SCDOT Needs, Funding Challenges, and Economic Development or Getting to Good (and Staying There ) Robert St. Onge, SCDOT January 2013 SCDOT s Mission Mission (Section 57-1-30, SC Code of Laws) The department
SCDOT Needs, Funding Challenges, and Economic Development or Getting to Good (and Staying There ) Robert St. Onge, SCDOT January 2013 SCDOT s Mission Mission (Section 57-1-30, SC Code of Laws) The department
MAP-21 themes. Strengthens America s highway and public transportation systems. Creates jobs and supports economic growth
 MAP-21 themes Strengthens America s highway and public transportation systems Creates jobs and supports economic growth Supports the Department s aggressive safety agenda Simplifies and focuses the Federal
Implementing Asset Management: WSDOT s Experience
 Implementing Asset Management: WSDOT s Experience 6 th National Conference on Transportation Asset Management Aaron Butters, P.E. Systems Analysis and Program Development Manager November 2, 2005 1 Highway
Exhibit A Mn/DOT Contract No
 Exhibit A Mn/DOT Contract No. 98142 SCOPE OF WORK AND DELIVERABLES Preliminary Design Red Wing US 63 Bridge and Approach Roadways State Project (SP) 2515-21 SCOPE OVERVIEW... 2 SCHEDULE... 2 PROJECT TASK
2014 NWPMA Conference
 2014 NWPMA Conference Asset Management The Big Picture Factors contributing to asset management Status of asset management in state DOTs Current TAM initiatives Future trends Presented By: Katie Zimmerman,
TRANSPORTATION PERFORMANCE MANAGEMENT Asset Management and Pavement Performance Measures The 30, mile view.
 TRANSPORTATION PERFORMANCE MANAGEMENT Asset Management and Pavement Performance Measures The 30,000 250 mile view. 1 Transportation Performance Management 2 2 Transportation Performance Management (TPM)
CLA /10.54, PID Project Description:
 Project Description: The proposed project will consist of widening IR 70 to three lanes from Enon Road (SLM 06.75) to the US 68 interchange ramps (SLM 10.55). IR 70 is a component of the Strategic Highway
City of Edmond Department of Public Works STRATEGIC PLAN FY2017/18. Public Services that Work!
 STRATEGIC PLAN FY2017/18 LETTER FROM THE DIRECTOR I am pleased to present our Fiscal Year 2017-2018 City of Edmond Public Works Department Strategic Plan. This living document binds together our multi-faceted
January 31, 2018 Asset Management and Performance Measures for Roads and Bridges Maryland Department of Transportation State Highway Administration
 January 31, 2018 Asset Management and Performance Measures for Roads and Bridges Maryland Department of Transportation State Highway Administration Amy J. Purves, PE Asset Management and Performance Measures
Louisiana Department of Transportation and Development Federal NHS Transportation Asset Management Plan
 Louisiana Department of Transportation and Development 2018 Federal NHS Transportation Asset Management Plan 1 2 3 Table of Contents Table of Contents... 3 List of Tables... 7 List of Figures... 7 1.0
Performance Measures
 Performance Measures PERFORMANCE MEASURES Under the previous transportation act Moving Ahead for Progress in the 21 st Century (MAP-21) and the current transportation act Fixing America s Surface Transportation
IOWA TRANSPORTATION BY THE NUMBERS:
 IOWA TRANSPORTATION BY THE NUMBERS: Meeting the State s Need for Safe and Efficient Mobility MARCH 2013 202-466-6706 www.tripnet.org Founded in 1971, TRIP of Washington, DC, is a nonprofit organization
MINISTRY OF TRANSPORTATION ONTARIO MANAGING OUR ASSETS
 MINISTRY OF TRANSPORTATION ONTARIO MANAGING OUR ASSETS Financial Management Institute of Canada November 19, 2008 Ministry s Assets Mature network - large inventory Over 16,500 km Over 2,800 bridges 8
Michigan Bridge Conference
 Transportation Asset Management Council Update and Bridge Asset Management Guide Steve Warren, Kent County Road Commission Roger Safford, Michigan Department of Transportation Michigan Bridge Conference
BATAVIA S STATE OF STREETS STREET MAINTENANCE PROGRAM REPORT
 BATAVIA S STATE OF STREETS STREET MAINTENANCE PROGRAM REPORT September 2015 1995 1996 1997 1998 1999 2000 2001 2002 2003 2004 2005 2006 2007 2008 2009 2010 2011 2012 2013 2014 2015 Street Area (SY) Street
Let s Keep Moving 2036: Policy Plan
 1 P a g e This Page Intentionally Blank Alaska Statewide Long-Range Transportation Plan September 2016 A MESSAGE FROM THE COMMISSIONER To All Alaskans: The Alaska Department of Transportation and Public
ONE NEVADA TRANSPORTATION PLAN The Nevada Department of Transportation s Long-Range Transportation Plan
 Executive Summary The s Long-Range Transportation Plan SAFETY, INFRASTRUCTURE, MOBILITY, ECONOMY, SUSTAINABILITY, COMMUNITY This Plan is Our Plan! A Transportation Plan by Nevadans, for Nevada How safely,
TELLER COUNTY PUBLIC WORKS
 TELLER COUNTY PUBLIC WORKS DEPARTMENT OF TRANSPORTATION ROAD MAINTENANCE & IMPROVEMENT PLAN TABLE OF CONTENTS SECTION PAGE (S) TRANSPORTATION OPERATIONS.............. 3 OUR MISSION.....................
OKLAHOMA/UTAH PEER EXCHANGE (OKLAHOMA DOT ASSET MANAGEMENT SCAN)
") Oklahoma Department of Transportation October 2015 OKLAHOMA/UTAH PEER EXCHANGE (OKLAHOMA DOT ASSET MANAGEMENT SCAN) A summary of activities and discussions out of the Utah hosted asset management scan.
Oklahoma Department of Transportation October 2015 OKLAHOMA/UTAH PEER EXCHANGE (OKLAHOMA DOT ASSET MANAGEMENT SCAN) A summary of activities and discussions out of the Utah hosted asset management scan.
Iowa s Deficient Bridges
 Iowa s Deficient Bridges Strategies to improve and maintain the condition of Iowa s bridges February 2008 The Road Information Program 1726 M Street, NW, Suite 401 Washington, DC 20036 Phone: (202) 466-6706
Mobility and System Reliability Goal
 Mobility and System Reliability Goal Provide surface transportation infrastructure and services that will advance the efficient and reliable movement of people and goods throughout the state. Background:
Strategic Initiatives 2000 & 2001
 Strategic Initiatives 2000 & 2001 Introduction ODOT has worked in recent years to become more efficient and effective in its use of the public tax dollar. Since the early 1990 s the department has increased
NASCIO 2013 Open Government Initiatives
 NASCIO 2013 Open Government Initiatives 1. Title: Utah s Open Transportation Data in the Cloud with ugate and UPlan 2. Category: Open Government Initiatives 3. Project Initiation and completion date The
Performance Management & Goals
 Management & The Nevada Freight Plan is a performance-based plan, in compliance with Title 23, Highways, of the United s Code, that defines performance measures and targets for each goal and objective
MoDOT s National Highway System Transportation Asset Management Plan
 MoDOT s National Highway System Transportation Asset Management Plan April 2018 Data-driven Decisions for Critical Transportation Assets page ii Missouri s transportation system is a tremendous asset.
National Performance Measure Target Recommendations
 National Performance Measure Target Recommendations March 2018 TC Workshop Review of National Performance Measures PURPOSE: Transportation Commission must adopt National Performance Measure Targets in
T HE V ILLAGE OF N EWBURGH H EIGHTS R OADWAY P AVEMENT M AINTENANCE R EPORT
 T ABLE OF C ONTENTS 1. Executive Summary... 2 2. Background... 3 3. PART I: 2016 Pavement Condition... 8 4. PART II: 2018 Current Backlog... 12 5. PART III: Maintenance & Rehabilitation (M&R) Program...
TABLE OF CONTENTS. Manual Section. Introduction 1. Using This Manual 2-3. Administrative Actions 4-6. Road and Bridge Project Types 7
 ii TABLE OF CONTENTS Manual Section Pages Introduction 1 Using This Manual 2-3 Administrative Actions 4-6 Road and Bridge Project Types 7 Road and Bridge Funding Programs 8-9 Project Planning and Eligible
VIRGINIA CENTRAL REGION ITS ARCHITECTURE IMPLEMENTATION PLAN
 VIRGINIA CENTRAL REGION ITS ARCHITECTURE IMPLEMENTATION PLAN Prepared for: Prepared by: June 23, 2009 i Table of Contents 1 INTRODUCTION... 1 2 USE OF ARCHITECTURE... 1 2.1 Architecture Use for Planning...
MAINE TRANSPORTATION BY THE NUMBERS:
 MAINE TRANSPORTATION BY THE NUMBERS: Meeting the State s Need for Safe and Efficient Mobility OCTOBER 2012 202-466-6706 www.tripnet.org Founded in 1971, TRIP of Washington, DC, is a nonprofit organization
SOUTH DAKOTA DEPARTMENT OF TRANSPORTATION BRIDGE MANAGEMENT SYSTEM IMPLEMENTATION. Todd S. Thompson, PE 1
 SOUTH DAKOTA DEPARTMENT OF TRANSPORTATION BRIDGE MANAGEMENT SYSTEM IMPLEMENTATION Todd S. Thompson, PE 1 ABSTRACT: The South Dakota Department of Transportation (SDDOT) has successfully taken the standard
NEW HAMPSHIRE TRANSPORTATION BY THE NUMBERS:
 NEW HAMPSHIRE TRANSPORTATION BY THE NUMBERS: Meeting the State s Need for Safe and Efficient Mobility February 2013 202-466-6706 www.tripnet.org Founded in 1971, TRIP of Washington, DC, is a nonprofit
Maintenance, Construction & Secondary Roads. Terry Gibson, PE Chief Engineer February 20, 2013
 Maintenance, Construction & Secondary Roads Terry Gibson, PE Chief Engineer February 20, 2013 State versus local responsibility Division structure Allocations Flexibility in funding Implications of not