ADVICE ON SECURING VICTORIA S PORTS CAPACITY
|
|
|
- Mary Houston
- 6 years ago
- Views:
Transcription

1 ADVICE ON SECURING VICTORIA S PORTS CAPACITY

2
3 Contents EXECUTIVE SUMMARY 4 LIST OF FIGURES 6 LIST OF TABLES 7 Glossary and abbreviations 8 OUR TERMS OF REFERENCE 11 OUR ADVICE 12 RECOMMENDATIONS 13 A CONSULTATIVE APPROACH 24 Consultation snapshot 25 Overview of consultation activities 26 Key themes of feedback on the evidence base 28 How consultation on the evidence base influenced our work 29 CHOOSING A NEW PORT 30 The importance of an efficient international port 33 Port capacity factors 36 Victorian commercial ports today 37 DEVELOPING OUR ADVICE 38 EVIDENCE FOR FUTURE DEMAND, CHANNEL CAPACITY AND SHIP SIZES 41 Demand forecasts 42 Channel capacity, including Port Phillip Heads 46 Changing ship sizes 54 WHEN A SECOND PORT WILL BE REQUIRED 67 Port of Melbourne supply chains 67 Port of Melbourne road and rail links beyond the port gate 73 Opportunities to expand capacity at the Port of Melbourne 78 Maximum effective capacity of the Port of Melbourne 88 Environmental and social considerations 90 Calculating the least economic cost 95 Likely development pathways for the Port of Melbourne 98 The interaction between the Port of Melbourne and the Government 105 WHERE A SECOND CONTAINER PORT SHOULD BE LOCATED 110 Hastings port concept technical evidence 114 Bay West port concept technical evidence 128 Economic evidence for where 140 Potential environmental impacts 149 Approvals and offsets 155 Social issues major differentiators 159 Multi-criteria assessment 161 The evolution path and trigger points to investing in Bay West 167 SOURCES 176 ABOUT US 179 3
4 Executive summary In May 2016 the Special Minister of State requested that Infrastructure Victoria provide advice on options to secure Victoria s future ports capacity. This request directed us to consider a number of factors and scenarios, and to consult with the community and stakeholders, in order to develop robust, independent advice on the sequencing, timing and location of investment. Developing this advice has been a complex task that highlighted the inherent challenges of ports planning long lead times, future uncertainty, complicated interfaces and environmental sensitivities. But it has also highlighted the importance of commercial ports to the Victorian economy. There is no doubt ports are an important economic driver that deliver benefits right across the State. They provide access to goods from around the world and facilitate the export of products to international markets. They are critical to Victoria s future economic growth and competitiveness. We have endeavoured to develop our advice and recommendations in a way that provides clear direction but also encourages flexibility and responsiveness to change. There is a great deal of uncertainty in ports planning. Government will need to closely monitor key indicators and stand ready to adapt ports planning, either by bringing decisions and actions forward, or delaying them, according to variations in these areas. Infrastructure decisions need to be based on the best available evidence. Our approach provides, for the first time, a direct comparison of the available options taking account of key criteria. This approach provides rich new data and technical analysis to guide ports planning and investment decisions. In line with our guiding principle of making the most of existing assets, we considered non-build solutions first. We examined the social, environmental and economic benefits and impacts of ports development. This reflects the consultation process which highlighted the increasing community expectation that greater emphasis be placed on achieving good environmental and social outcomes when developing our ports. Land-use conflicts between ports users and communities are likely to increase unless they are actively managed, which will be important to achieve the objectives of this advice. We have identified an optimal capacity of approximately 8 million TEU at the Port of Melbourne. Achieving this will require a holistic approach to ports management and may require the relocation of some existing trades to Victoria s other commercial ports. While some investment in transport upgrades will be required, this should stop short of a dedicated road and rail Freight Link through Fishermans Bend to Webb Dock. Once the Port of Melbourne reaches a capacity of approximately 8 million TEU around 2055, Infrastructure Victoria considers it makes better economic, social and urban planning sense to move some container trade to a new port at Bay West. When assessed against key social, economic and environmental criteria, the Bay West location is preferred over Hastings for a second major container port. This assessment has been made in light of new evidence and analysis now available and published by Infrastructure Victoria. Bay West can initially handle overflow container capacity from the Port of Melbourne, and is also well suited to becoming Melbourne's future container port in the long term. The Port of Hastings will be an important part of Victoria s future commercial port network, and is particularly well suited to handling automotive trade. The ports of Geelong and Portland are not suitable for a large container port, but could increase throughput to support growing volumes of their current trades and emerging supply chains. Stakeholder and community engagement has been a critical component in the development of this advice. Input received through consultation challenged our thinking, identified areas of importance and shaped our recommendations. We thank all those who participated for their valuable contribution to this important piece of work. 4 Infrastructure Victoria ADVICE ON SECURING VICTORIA S PORTS CAPACITY
5 Advice Capacity at Victoria s existing commercial ports should be optimised, having regard to social and environmental factors, before any investment in a second major container port. The Port of Melbourne should be developed to a capacity of approximately 8 million TEU, with some trades relocated to Victoria s other commercial ports at Hastings, Portland and Geelong. Capacity at the Port of Melbourne could be increased to approximately 8 million TEU without building a dedicated road and rail Freight Link through Fishermans Bend to Webb Dock. A second major container port will not be required until the Port of Melbourne reaches approximately 8 million TEU which is likely to be around Detailed development planning for a second major container port needs to begin approximately 15 years prior to the port being required. Based on current analysis and projections, detailed planning for a second major container port should begin around 2040, with the new port to begin operation around Land use planning actions to secure necessary second container port land and transport corridors need to be taken as soon as possible. Bay West is the preferred location for a second major container port. Bay West has strong transport, land use, environmental and amenity advantages, when compared to Hastings. Bay West is a good option for catering to container demand once capacity at the Port of Melbourne has been exhausted and is also well suited to becoming Melbourne's future container port in the long term. To support implementation of our advice, Infrastructure Victoria is making 19 recommendations to the Victorian Government in the following themes: 1. Monitor and publicly report on key port related indicators 2. Optimise the capacity of existing ports 3. Understand the variables that may alter planning timelines 4. Preserve longterm port options Baseline and monitor environmental conditions Optimise governance of Victorian ports 5
6 List of figures Figure 1. Figure 2. Figure 3. Figure 4. Figure 5. Figure 6. Figure 7. Figure 8. Figure 9. Land-bridging cost comparison Methodology overview Forecasts of total container trades volumes (TEU): central, low and high cases Historic demand forecasts for Victorian container demand Extreme high and low scenarios for container trade demand Port Phillip Bay channels Shipping channels through Port Phillip Heads Vessel tracks for successful transits of Port Phillip Heads by 14,000 TEU MSC Daniela in ship simulator Evolution of container ships and typical dimensions Figure 10. Global shipping routes Figure 11. Evolution of the world container fleet Figure 12. Forecast fleet spectrum for the constrained case Figure 13. Forecast fleet spectrum for the unconstrained case Figure 14. Forecast annual trade at Swanson and Webb Dock assuming 50/50 share of Asia trades Figure 15. Import supply chains at the Port of Melbourne Figure 16. Export supply chains at the Port of Melbourne Figure 17. Landside port capacity overview Figure 18. Exports origins by volume Figure 19. Port of Melbourne today Figure 20. Swanson Dock layout and possible capacity enhancement measures Figure 21. Possible capacity enhancements for berth, yard and landside at Swanson Dock Figure 22. Theoretical sequence of possible capacity upgrades at Swanson Dock Figure 23. Webb Dock layout and possible capacity enhancement measures Figure 24. Possible capacity enhancements for berth, yard and landside at Webb Dock Figure 25. Theoretical sequence of possible capacity upgrades at Webb Dock Figure 26. Proposed sequence of capacity upgrades for the Port of Melbourne Figure 27. Port of Melbourne surrounding land use Figure 28. Forecasts of total container trade, volumes (TEU): central, low and high cases Figure 29. Recommended decision pathway for providing additional container capacity in Victoria Figure 30. Existing Port of Hastings and surrounding land use Figure 31. Along shore and dig out concepts for Hastings Figure 32. Hastings concept terminal and port environs Figure 33. Existing channels at the Port of Hastings Figure 34. Hastings concept, elements included in costing Figure 35. Bay West study area and surrounding land use Figure 36. Initial location concepts for Bay West Figure 37. Bay West concept terminal and port environs Figure 38. Bay West concept, elements included in costing Figure 39. Capital cost to expand capacity at Bay West Figure 40. Capital cost to expand capacity at Hastings Figure 41. Change in total movements of heavy commercial vehicles with a full container port move from Melbourne to Hastings (2046) Figure 42. Change in total movements of heavy commercial vehicles with a full container port move from Melbourne to Bay West (2046) Figure 43. Hastings development footprint overlayed on selected habitats and Ramsar site Figure 44. Bay West development footprint overlayed on selected habitats and Ramsar site Figure 45. Chart overlaying demand with new capacity coming on line Figure 46. Approvals timelines for previous projects Figure 47. Theoretical timeline of a Bay West port project 6 Infrastructure Victoria ADVICE ON SECURING VICTORIA S PORTS CAPACITY

7 List of tables Table 1. Table 2. Table 3. Table 4. Table 5. Table 6. Table 7. Table 8. Victorian commercial ports today Port Phillip Bay channels and constraints for various ship sizes Results of navigation simulations Container ships on order, January 2017 TEU capacity Forecast maximum ship size (TEU) by year Number of buildings, area and size categories of buildings within State Significant Industrial Precincts, Metropolitan Melbourne, Current vacant industrial land and proposed industrial land, State Significant Industrial Precincts, Melbourne current and forecast future population distribution (number of people) Table 9. Import supply chain costs (2046) Table 10. Export supply chain costs (2046) Table 11. Table 12. Table 13. Economic costs (Total capital + operational expenditures) to accommodate 5-6 million TEU in different port development scenarios ($ billion, values, discounted using 4% discount rate) Capital costs to deliver capacity at different port locations ($ billion, values, undiscounted) Design vessel characteristics for Hastings and Bay West Table 14. Estimated capital cost for Hastings concept 14,000 TEU design vessel ($ millions, 2017, undiscounted) Table 15. Estimated capital costs for Hastings concept 18,500 TEU design vessel ($ millions, 2017, undiscounted) Table 16. Table 17. Table 18. Table 19. Table 20. Table 21. Table 22. Table 23. Design vessel characteristics for Bay West and Hastings Estimated capital costs for Bay West concept 14,000 TEU design vessel ($ millions, 2017, undiscounted) Estimated capital costs for Bay West concept 18,500 TEU design vessel ($ millions, 2017, undiscounted) Total capital cost estimate for Bay West and Hastings Port traffic cost comparison Total economic cost for Bay West and Hastings ($ billions, present value, discount rate 4 per cent, assuming 2017 start) Total economic cost by discount rate Bay West and Hastings impact on Gross State Product Table 24. Import supply chain costs (2046) Table 25. Export supply chain costs (2046) Table 26. Table 27. Multi-criteria assessment Individual multi-criteria assessment criterion results 7
8 GLOSSARY AND ABBREVIATIONS Term Air draught Beam Berth pocket Break bulk Bridging/landbridging Commonwealth waters Complementary infrastructure Containerised trade Controlled action Development footprint Disruptive technology Draught Dredge material Dredge material ground (DMG): Unconfined sea disposal Dry bulk DWT: Dead Weight Tonnage Externalities Feeder vessel Definition The height of a ship, measured from the waterline to the tallest part of the ship. It determines if a vessel can pass under obstructions such as bridges and power lines. Air draught is not constant but depends on how the vessel is loaded. The maximum width of a ship s hull. A dedicated location alongside a wharf, in which a ship can moor. Cargo that is carried in unitised, palletised, bundled or barrelled form or other non-unitised cargo such as vehicles. A supply chain where goods are brought into one port and then transported by either train or truck to a wide spread of other locations. For example, land-bridging in Australia could involve bringing almost all imports in through the Port of Brisbane, and transporting goods along the east coast by train or truck. The ocean between 3 and 200 nautical miles offshore is classified as Commonwealth waters. Commonwealth, rather than state or territory laws, apply to this area. The road and rail infrastructure necessary for the operation of a port. It does not include the immediate transport connections from the port to the existing network. It does include network upgrades or new links required within the existing network. Transportation of cargo in containers, usually 20 or 40 foot long. Containers can also be refrigerated. An action defined in the Environment Protection and Biodiversity Conservation Act 1999, which includes a project, a development, an undertaking, an activity or a series of activities, or an alteration of any of these things. The area of land a proposed development will cover. An innovation or new technology which disrupts the way an existing market operates. The depth of a ship, measured as the vertical distance between the waterline and the bottom of the hull (including the keel). The maximum or scantling draught is the maximum safe draught the vessel is designed for. Sailing draught is the actual draught of the vessel at any time. Sailing draught is not constant but depends on how the vessel is loaded. Clay, silt, sand or rock dredged from the seafloor. Designated underwater area where dredge material can be placed for disposal. If dredge material is contaminated then a layer of uncontaminated material may be placed on top to cap the DMG this is termed confined sea disposal. Where no capping layer is used it is termed unconfined sea disposal. Cargo that is transported in large, unpackaged quantities and loaded directly into the hold of a ship such as mineral sands, wood chips, grain and alumina. Dead Weight Tonnage measures how much weight a ship can safely carry, not including the weight of the ship. A cost or benefit suffered by a third party and not priced into a financial transaction. A common example of an externality is the environmental or social impact of economic activity that does not incur a financial cost. A smaller container ship, usually less than 4,000 TEU, that is used to service small ports in regional groups. Feeder vessels collect shipping containers from different ports and transport them to central container terminals where they are loaded onto bigger vessels or further transported by truck or rail into the hub port s hinterland. 8 Infrastructure Victoria ADVICE ON SECURING VICTORIA S PORTS CAPACITY
9 Term Freight Link Gross State Product Handling characteristics Harbour master HPFV: High productivity freight vehicle Hyperloop Indented basin dock Intertidal zone Landside capacity Liquid bulk LOA: Length Over All Origin/destination port Quay line Rail marshalling yard Ramsar Reclamation Roll on/roll off Sea pilot Sensitivity analysis Shipping containers Slow steam Definition Proposed high capacity two-lane road and two-track rail link from Webb Dock to the West Gate Tunnel and Dynon rail yards north of the Yarra River. A measure of the total economic output of a state, represented as the total dollar value of all goods and services produced over a specific time period. How well a ship steers. This is influenced by the design of the ship and the depth of water under the ship. An official responsible for enforcing the regulations of a port, to ensure safe navigation, the security of the harbour and the correct operation of the port facilities. A harbour master will usually issue directions as to the size of vessel than can safely visit a port, and the speed at which vessels may travel. Any truck larger than a B-Double. B-Doubles are articulated vehicles capable of carrying three 20 foot containers. HPFV can carry four 20 foot containers. A proposed transport mode for passengers and freight. Still in testing and development, Hyperloop proposes to propel pods through a tube at very high speeds. A three-sided, u-shaped dock, where ships can moor on either side of the dock. The area along the coast that is above the water at low tide and beneath the water at high tide. The ability of land-based transport networks to handle the volume of containers entering and exiting a port. Cargo that is transported in liquid form such as oils, petroleum and chemicals. The length of a ship s hull measured parallel to the waterline. A port where almost all containers handled are export or import containers which leave through the port gate. Edge of wharf separating the land of the container terminal from the berth area where ships tie up. A rail yard used to separate and join trains, or move them onto different tracks, to make the entry and exit of trains from the port more efficient. An international treaty providing a framework for the protection of ecologically important wetlands, focusing on wetlands used by migratory birds. In Australia, Ramsar wetlands are managed under the Commonwealth Environment Protection and Biodiversity Conservation (EPBC) Act Constructing new land within a waterway, using either dredged material or material sourced from land. A cargo ship where vehicles and cargo are able to be driven directly on or off the ship via a ramp. An experienced mariner certified to navigate ships into and within a port. A sea pilot possesses extensive local knowledge of the channels, depths of water, currents and dangers within and around the port for which they are licenced. Used to test a central hypothesis by applying low and high ranges, to understand a range of possible outcomes. Standardised steel boxes designed to be carried on, and easily transferred between ships, trucks, and trains. Standardised shipping containers originated in the 1950s, and are now used for shipping almost all non-bulk cargo, such as manufactured goods, clothing, food or anything that can be packaged and moved on pallets. Operating international cargo ships at significantly less than their maximum speed. Shipping lines may slow steam to save fuel costs, or to time their arrival in ports to match with berth availability or avoid traffic. 9
10 Term Staging STSC: Ship to Shore Crane Stevedore Supply chain SUZ1: Special Use Zone 1 TEU: Twenty foot Equivalent Unit Tidal assist Tidal cycle ebb, flood, slack water Transhipment port Transit only zone Tugs/tug boats Turbidity Turning basin/swing basin Under keel clearance Wharf structure Webb Dock Rail link Definition The process of storing goods in between movements in a supply chain. For instance, goods may leave a port during the night and be taken to a staging area, before being delivered to a store or factory during business hours. A large dockside crane which is used to either load or unload shipping containers from ships. Individual dock worker or firm that employs dock workers to load and unload vessels. How goods move from their origin (this could be farm, factory or mine) to the consumer. Supply chains comprise a combination of nodes, such as airports, ports, or intermodal freight terminals, from which goods are transferred to and from warehouses, distribution centres and shops. Goods are carried between the locations by some combination of ships, trucks, trains, planes or light delivery vehicles. A zone within the Victorian Planning Provision that reserves land for a specific use, as defined in the relevant local planning scheme. Shipping containers come in two sizes, 20 foot and 40 foot long. Both lengths are generally 8 feet 6 inches high and 8 feet wide. Ship or port capacity to handle containers is measured in 20 foot equivalent units (TEU). For instance one 40 foot container is counted as 2 TEU. The process of ships using high tide to access a waterway that would be too shallow or unsafe at other tidal conditions. Waterways connected to the ocean experience tides, regular changes in water level and currents driven by the gravitational attraction of the sun and the moon. The coast of Victoria has a tidal cycle with two high tides and two low tides every day. Flood tide is the part of the cycle when the water level is rising and it may be associated with strong tidal currents. Ebb tide is the part of the cycle where the water level is falling and it may also be associated with strong tidal currents. Slack water is a short period between the flood and ebb when tidal currents are low. A port where containers are unloaded from one ship and loaded onto another ship without leaving the port. A regulated area of water in the vicinity of a commercial shipping channel. Recreational craft may travel through but must not anchor or drift within the transit only zone. A special ship used to manoeuvre vessels either by pulling or pushing them. Tugs are used to help ships navigate into berths. The degree to which water becomes less transparent because of the presence of suspended particles in the water. An area at the end of a channel close to a dock which is deep and wide enough to allow ships to be turned around with the assistance of tugs before they are manoeuvered into a berth. The space between the bottom of a ship s hull and the ocean floor. The structure against which a ship berths. Proposed one-track freight rail link from Webb Dock to Dynon rail yards north of the Yarra River via Lorimer Street. 10 Infrastructure Victoria ADVICE ON SECURING VICTORIA S PORTS CAPACITY
11 Our Terms of Reference The Special Minister of State requested that Infrastructure Victoria provide advice on the preferred sequencing, timing and location of investment in future Victorian container port capacity. We were required to answer two questions: If and when a second container port will need to be built, and what that means for the distribution of trades across Victorian commercial ports. Where a second container port should be located, examining sites at Bay West and Hastings. You can find the Minister s full Terms of Reference on our website: infrastructurevictoria.com.au/second-container-port. Scope of advice The Government wishes to ensure that decisions regarding Victoria s long term port capacity and associated infrastructure are developed in accordance with robust, independent advice, particularly in relation to the sequencing, timing and location of investments. Infrastructure Victoria s advice on options for Victoria s future commercial port capacity should address the following issues: 1. Scenarios for the long term demand for, and capacity of, existing Victorian commercial ports, including: a. when the need for a second major container port is likely to arise and what variables may alter this timeline; b. capacity for containers, bulk and other non-containerised cargo; c. the capability of Victorian channels and existing port infrastructure to handle different scenarios of future changes to the international shipping fleet, cargo handling technologies and changes to the supply chain onshore; and d. potential increases in capacity resulting from investment and improved port management under the Port of Melbourne lease arrangement. 2. Where a second major container port would ideally be located and under what conditions, including the suitability of, and/or barriers to investing in, sites at the Port of Hastings, and the Bay West location, including: a. the indicative costs, risks and benefits of above options, including impacts on metropolitan, regional and interstate (including Tasmanian) supply chains; b. any necessary measures to preserve the long term optionality at these sites including any appropriate relevant planning measure, environmental protections, or land and transport corridor reservations which may be required; c. impacts and requirements that a second major container port would take place on surrounding and supporting infrastructure, and the impacts including the costs to Victorian taxpayers of any complementary infrastructure investments that may need to be considered; and d. the environmental, economic and social impacts of developing a second container port, as well as the environmental, economic and social impacts of the required complementary infrastructure, on existing local communities. 11
12 Our Advice Infrastructure Victoria provides the following advice: 1. Capacity at Victoria s existing commercial ports should be optimised, having regard to social and environmental factors, before any investment in a second major container port. The Port of Melbourne should be developed to a capacity of approximately 8 million TEU, with some trades relocated to Victoria s other commercial ports at Hastings, Portland and Geelong. Capacity at the Port of Melbourne could be increased to approximately 8 million TEU without building a dedicated road and rail Freight Link through Fishermans Bend to Webb Dock. 2. A second major container port will not be required until the Port of Melbourne reaches approximately 8 million TEU capacity which is likely to be around Detailed development planning for a second major container port needs to begin approximately 15 years prior to the port being required. Based on current analysis and projections, detailed planning for a second major container port should begin around Land use planning actions to secure necessary second container port land and transport corridors need to be taken as soon as possible. 3. Bay West is the preferred location for a second major container port. Bay West has strong transport, land use, environmental and amenity advantages, when compared to Hastings. Bay West is a good option for catering to container demand once capacity at the Port of Melbourne has been exhausted and is also well suited to becoming Melbourne's future container port in the long term. 12 Infrastructure Victoria ADVICE ON SECURING VICTORIA S PORTS CAPACITY
13 Recommendations To support implementation of our advice, Infrastructure Victoria is making 19 recommendations to the Victorian Government in the following themes: Monitor and publicly report on key port related indicators Optimise the capacity of existing ports 5. Preserve longterm port options Baseline and monitor environmental conditions 3. Understand the variables that may alter planning timelines 6. Optimise governance of Victorian ports 13
14 1 The Victorian Government should monitor key indicators relevant to all Victorian ports that impact planning and publish a report every five years. This report should be prepared for the purpose of identifying whether the Port of Melbourne has the ability to meet demand for 15 years or more. This reporting will provide regular, transparent monitoring of key indicators which may trigger action to develop additional port capacity or defer investment. The report should indicate whether the most current data and projections impact port capacity plans and assumptions. The indicators reported on should include: a. Container and bulk demand what the current and projected rate of demand growth is for all trades across Victorian ports. b. Container and bulk capacity what the current and planned capacity of Victorian ports is to meet the demand for all trades. c. Port of Melbourne operation key throughput and efficiency measures that are important planning factors, separately reported for Swanson Dock and Webb Dock, including: ship to shore crane rates average TEU per truck percentage of truck movements overnight rail mode share berth occupancy TEU exchange per vessel call. d. Ship size whether the size of ships calling at East Coast ports is increasing more or less than current assumptions, and whether there are changes to international ship size trends. e. Capacity enhancements that have been made at other Australian container ports, especially Brisbane and Sydney, with particular focus on the size limits of ships visiting those ports. f. Local traffic network assessment of the performance of key intersections related to Swanson and Webb Docks. g. Social and environmental conditions the results of air quality and noise monitoring programs by the Environment Protection Agency (EPA) around Port of Melbourne and key freight routes in the inner west of Melbourne (see Recommendation 5). h. Land-use and demographics the demographics and development rate of residential and industrial land around the Port of Melbourne and across the metropolitan area. 14 Infrastructure Victoria ADVICE ON SECURING VICTORIA S PORTS CAPACITY

15 2 To optimise the capacity of the Port of Melbourne before investing in a second port, based upon current information, the following investment pathway is suggested to achieve a capacity of around 8 million TEU per annum: At Swanson Dock: a. To increase capacity from around 3.0 to 3.6 million TEU per year: add an on-dock rail terminal and implement a metropolitan intermodal system (MIS) upgrade the Sims Street/Footscray Road intersection add one ship to shore crane (STSC) and associated straddle carriers. b. To increase capacity from 3.6 to 4.5 million TEU per year: demolish Swanson Dock East quay, widen the basin and rebuild one kilometre of quay line expand the footprint of container stacks within the current terminal footprint add two ship to shore cranes (STSC) and associated straddle carriers. At Webb Dock: c. To increase capacity from around 1.4 to 2.2 million TEU per year: reconfigure Webb Dock East berth three to increase the useable quay line at the Victorian International Container Terminal by 90 metres and add one additional ship to shore crane (STSC) begin progressive relocation of automobile trade from Webb Dock West and convert this area to a container terminal. d. To increase capacity from around 2.2 to 4.0 million TEU per year: upgrade the intersections providing access to and from the West Gate Freeway upgrade the Port of Melbourne Channel, Williamstown Channel and Webb Dock Swing Basin to allow access by vessels of up to 14,000 TEU capacity. 15
16 3 When undertaking future port and freight infrastructure planning the Victorian Government should, in consultation with the Port of Melbourne Lessee, take into consideration the following key factors that will influence capacity: a. Increasing capacity at Webb Dock to accept ships larger than around 7,500 TEU could make it difficult for Swanson Dock s capacity to be fully utilised due to its vessel size restrictions. This may prematurely compromise the viability of Swanson Dock, unnecessarily bringing forward the need to invest in additional capacity. This can be managed through deliberate staging of infrastructure investments at Webb Dock as well as upgrades to navigation infrastructure (channels and swing basins) and changes to regulation of navigation. b. Implementation of a metropolitan intermodal system (MIS) will support metropolitan movement of more containers by rail and increase the capacity of Swanson Dock. The implementation of the MIS requires work within the port area but also on the broader rail system to be viable. It will require collaboration between industry, the Victorian Government, rail managers, the Port of Melbourne and public transport rail operators. c. The Port of Melbourne has identified an option for a rail-only connection using the current Lorimer Street easement to connect Webb Dock with the current rail assets that service Swanson Dock. This is a different, more limited rail access option to the large-scale, road and rail Freight Link option through Fishermans Bend. The Port of Melbourne operator is required to prepare a rail access strategy which the Victorian Government will assess and respond to. If the network were able to handle the increased rail volumes, this could increase the total capacity for the Port of Melbourne by 1 to 1.9 million TEU to a total of more than 9 million TEU. Recommendation of Infrastructure Victoria s 30-year infrastructure strategy called for development of a port rail access strategy for Webb Dock. d. Strengthening the Bolte Bridge and the key access points to the Bolte Bridge for High Productivity Freight Vehicles to at least 77 tonnes and potentially 85.5 tonnes would, if possible, assist in increasing truck efficiency. An upgrade of the Bolte Bridge could yield greater efficiency and would need to address related network access issues so a weight limit restriction nearby does not compromise access. Ensuring new freeway projects are built to 109 tonne standards would also assist in increasing truck efficiency. Recommendation of Infrastructure Victoria s 30-year infrastructure strategy called for upgrades to the road network, particularly bridges, to accommodate heavier axle loads. e. Removal of barriers that limit the expansion of night operations by port related road or rail transport services will be important in achieving potential port capacity enhancements. The process of achieving this would benefit from engagement with local government, the community and freight industry to identify any key barriers to increasing night operations. 16 Infrastructure Victoria ADVICE ON SECURING VICTORIA S PORTS CAPACITY
17 4 When undertaking future port and freight infrastructure planning, the Victorian Government should take into consideration the following key factors that will influence planning timelines: a. Further urban development is likely to hinder capacity enhancement within the existing Port of Melbourne footprint. This can be managed by maintenance of suitable buffers between the Port and other land users. There is also considerable value in maintaining suitable buffers for Portland, Geelong and Hastings, including the key transport links connecting to the ports. Recommendation of Infrastructure Victoria s 30-year infrastructure strategy called for identification of existing and future potential freight precincts requiring planning protection. b. The Western Interstate Freight Terminal and Inland Rail Project have the potential to increase productivity and the rail mode share of Victorian ports while reducing the volume of truck movements in inner Melbourne. They could assist by reducing the amount of non-port rail activity near the port and the number of trains using the key rail junctions near the port. Recommendations and of Infrastructure Victoria s 30-year infrastructure strategy called for further scoping and detailed planning work for these projects. c. It is important to ensure that the amenity impacts of increased capacity at the Port of Melbourne on residents near the port and key transport corridors are managed in a way that retains the Port s social licence to operate. Measures that may assist in managing amenity impacts include noise and emission standards for freight vehicles; designation of key road corridors for port related vehicles; review of permitted land uses in the inner west; and transition of freight and container transport companies to sites with good road and rail transport access and ample industrial land that do not conflict with residential uses. The Victorian Government could commission specific advice on actions to reduce or remove conflicts between residential, port and freight-related land uses in the inner west of Melbourne, particularly along key road corridors. The process of developing this advice could include consultation with the community, industry, port and logistics stakeholders. 5 The Environment Protection Authority (EPA) should remain active in its air quality and noise monitoring programs around the Port of Melbourne and key freight routes in the inner west of Melbourne. Efficient freight routes, especially in the inner west of Melbourne, are a crucial element in the Port of Melbourne s supply chains and capacity. Maintaining the Port s social licence to operate is an important consideration if capacity expansions are to be sustainably achieved. If the amenity impacts of port related freight services are not effectively managed, the Port of Melbourne may be unable to reach its optimal capacity. Air quality and noise monitoring by the EPA will provide evidence on potential port related health and amenity impacts that can inform policy decisions and the community. There may be opportunities to consider the most effective ways to undertake these monitoring programs. The causes of significant breaches of regulatory standards or thresholds should be investigated and reported. 17
18 6 The Victorian Government should ensure that over the 50-year term of the Port of Melbourne lease the robust governance and contract management framework that has been established continues to be maintained. In particular, a strong core technical and policy capability needs to be maintained within the Victorian Government to: a. operate as an active and informed port lessor b. clearly understand the Government s ongoing obligations and powers under the Port of Melbourne lease c. have strong technical skills to be able to respond to the detail of lessee port development plans and port development strategies d. align lease expiration dates with decisions the Victorian Government will need to make on key capacity enhancing infrastructure projects across the Victorian ports, freight and logistics network. 7 The Victorian Government should not enter into any arrangement that restricts the ability to develop a second container port after There is an initial 15 year period in the Port of Melbourne lease legislation where there cannot be a second port built without compensation to the lessee. There is considerable value in the State retaining the unfettered option under the current terms of the Port of Melbourne lease legislation to develop a second container port after 15 years. 8 Detailed planning for development of a second major container port at Bay West should begin approximately 15 years prior to when the Port of Melbourne reaches a capacity of 8 million TEU per annum. Based on current analysis and projections, detailed planning for a second major container port should begin around 2040, with the new port to begin operation around Infrastructure Victoria ADVICE ON SECURING VICTORIA S PORTS CAPACITY
19 9 The Victorian Government should make necessary land use and zoning changes around the proposed Bay West port area as soon as possible. This should include providing for current and future industrial, commercial and residential land to ensure the required land is available when needed in the long term. The Government should confirm whether the Werribee River location option at Bay West is preferred and confirm transport connections to that site. Alternatively, the Government could identify the connections for the three main port location concepts at Bay West and protect all the potential transport corridors. This should involve consultation with Melbourne Water and the Wyndham City Council. Recommendation of Infrastructure Victoria s 30-year infrastructure strategy called for identification of existing and future potential freight precincts requiring planning protection. 10 The Victorian Government should work with Melbourne Water and Wyndham City Council to further define transport corridor requirements and alignments in and around the Western Treatment Plant and the Bay West site. Before planning protections are enacted more detailed transport corridors will need to be identified. The alignments within the Western Treatment Plant need to take into account the plant s current operations, expansion plans and environmental values. Transport corridor planning should be undertaken in light of broader land use and transport planning in the Wyndham area. The Government should confirm whether the Werribee River location option at Bay West is preferred and confirm transport connections to that site. Alternatively, the Government should identify the connections for the three main port location concepts at Bay West and protect all the potential transport corridors. 11 A suitable rail corridor between the Princes Freeway and the Western Freight Line for future port related use should be defined in more detail and protected. Before planning protections are enacted, the Victorian Government will need to identify more detailed transport corridors. The preferred rail corridor north of the Western Treatment Plant needs to be selected and have suitable planning protections put in place. This should involve consultation with Melbourne Water and Wyndham City Council. 19
20 12 The existing Outer Metropolitan Ring Road rail and road reservations should continue to be preserved. The Outer Metropolitan Ring Road and the associated rail corridor will be important transport connections for Bay West. These corridors need to be preserved so they can be built when required. Having these corridors clearly identified allows for the port links within the Western Treatment Plant to be finalised, as there is an interface between the Outer Metropolitan Ring Road alignment and the transport links that will need to be built to the Bay West site. Recommendation of Infrastructure Victoria s 30-year infrastructure strategy called for construction of the Outer Metropolitan Ring Road within years. 13 The Victorian Government and local governments should ensure urban encroachment does not hinder port capacity development at Bay West and that suitable buffers between the Bay West site, its planned transport corridors and other land users are maintained. Urban encroachment could limit the ability to develop Bay West when it is required. Conflicting land uses limit the ability of the port to operate 24 hours a day seven days a week or reduce amenity for the local community. Recommendation of Infrastructure Victoria s 30-year infrastructure strategy called for identification of existing and future potential freight precincts requiring planning protection. 20 Infrastructure Victoria ADVICE ON SECURING VICTORIA S PORTS CAPACITY
21 14 A Victorian Government department or agency should be tasked with baseline evidence gathering and ongoing monitoring of environmental conditions relevant to future port developments. The data from this evidence gathering and monitoring should be published and integrated with the Environmental Management Plans for Port Phillip Bay and Western Port, the Ramsar Wetland Management Plans and other relevant Victorian Government publications. This will create a transparent, long-run evidence base to inform future port project development and approval processes. Factors that are measured and monitored should include: hydrodynamics including water circulation and sediment transport coastal and seabed morphology including response to sea level rise water quality including turbidity, nutrients and nutrient cycling coastal and marine habitats including sea grass, saltmarsh and mangroves flora and fauna including water birds, shorebirds, threatened species and marine mammals. Gathering this data over the long term will reduce project and approval risks and save time once port planning commences. It will also increase community confidence in the quality of the environmental baseline evidence. 15 Establishment of baseline environmental data and ongoing monitoring for the Bay West port site should involve engagement with the community and stakeholders prior to further project definition and in further development of the concept design. The data from evidence gathering and monitoring relevant to Bay West should be published regularly. This working with nature approach should enable a better understanding of relevant natural and social values, and provide an opportunity to identify solutions that enhance these values as well as achieve the project objectives. 16 The Victorian Government should publish a comprehensive Ports Strategy covering the four main commercial ports in Victoria. This strategy should be integrated with a refreshed Victorian Freight Strategy and confirm the roles and objectives of Victoria s commercial ports to ensure they meet the needs of Victorian importers and exporters. The Ports Strategy should identify opportunities for the Victorian Government to influence or support the Port of Melbourne Lessee, Ports of Hastings, Geelong and Portland to accommodate relocated components of the automotive, Bass Strait, break bulk and bulk trades to enable container capacity expansion at the Port of Melbourne. Infrastructure Victoria s view is that Hastings is well suited to handle any relocation of the automotive trade when a new terminal is required in coming decades. 21
22 17 Following further definition of the role of the Port of Hastings in a comprehensive Ports Strategy, the Victorian Government should review the extent of zoning protection and government land holdings necessary for the future role of the Port of Hastings. While Infrastructure Victoria has identified Bay West as the clearly preferred location for a second container port, the Victorian Government should consider the cost (including opportunity cost) of protecting real options at the Port of Hastings and associated transport access corridors for potential future uses, as defined by the Ports Strategy. This review is likely to identify excess land in the Special Use Zone (SUZ1) and within government ownership at the borders of SUZ1 which could be suitable for alternative development uses by industry and residents. 18 The Victorian Government should review the existing legislative framework that administers use of the assets at the Port of Hastings and replace it with a series of contracts or commercial arrangements that enable greater asset utilisation and growth. There is an opportunity to remove legislative and policy constraints that currently limit the ability of the Port of Hastings to attract new customers and increase non-containerised trade volumes. While the Port of Hastings will transfer to State management in mid-2017, the terms between the State and some of the port s customers are still governed by legislation rather than more flexible contracts. This is likely to be an impediment to the Port of Hastings operations and trade in future. 19 Previously collected environmental data on the area around the Port of Hastings should be published and environmental monitoring should be continued to support future development driven by possible relocation of trades from the Port of Melbourne. The data from ongoing environmental monitoring relevant to Hastings should be published regularly. This includes the already compiled hydrodynamic and geotechnical data within Western Port. Comprehensive sea grass mapping of the Western Port Ramsar area will be required. 22 Infrastructure Victoria ADVICE ON SECURING VICTORIA S PORTS CAPACITY

23 23
24 A consultative approach Infrastructure Victoria has consulted throughout the development of this advice to ensure stakeholders and the community had a chance to put forward their views. Infrastructure Victoria endeavoured to undertake a transparent engagement program with the community, industry and other stakeholders. Our program was developed in line with the Terms of Reference which required us to promote a deep, informed discussion, while building consensus on the key issues of public importance, policy priorities, options and trade-offs. Through two phases of consultation, and a rolling program of engagement, we heard views from a broad range of stakeholders and the community. While views on some topics differed, we consistently heard that people appreciated the openness of the process and the opportunity to be involved. The ports page on Infrastructure Victoria s consultation website was visited over 3,300 times during development of the advice and our two ports discussion papers were downloaded a total of over 3,700 times. Through our program, Infrastructure Victoria received substantial feedback on: the key factors necessary for deciding when a second port will be needed, where it should be located, and what should drive these decisions the evidence base underpinning the development of the advice to government, including technical studies. Through a range of consultation activities, we heard the views of: local government port operations and management logistics and freight organisations education, research and policy organisations planning and economic development organisations environmental conservation and protection organisations Victorian Government departments and authorities local and interested residents. Feedback received has helped us to test or confirm our work, understand matters of importance for stakeholders and local communities, and shape our program of technical studies. 24 Infrastructure Victoria ADVICE ON SECURING VICTORIA S PORTS CAPACITY
25 Consultation snapshot 114 Over 3,700 downloads of the ports discussion papers 114 submissions were received during the two consultation phases 3, Over 60 meetings and briefings were held with stakeholders during the consultation program people attended the community drop-in sessions held in March 2017 to discuss the evidence base 114 people in total attended five workshops held in November 2016 to discuss in detail the transport, economic, environment and social factors of planning for a second container port 25
26 Overview of consultation activities Q Consultation on Preparing advice on Victoria s future ports capacity discussion paper Q Consultation on transport, environment, social, and economic considerations Submissions An online feedback process remained open on Infrastructure Victoria s consultation website from 1 September 2016 until 30 September Submitters were asked to provide feedback on the following questions: Have we missed any key factors that may influence demand and capacity at the Port of Melbourne? Which key factors are likely to have the greatest influence on demand and capacity at the Port of Melbourne? What do you view as the key links and interactions between key factors? Do you think we have missed any key factors or issues for assessment of the sites? Do you think there are any constraints to testing the key factors we have identified? Do you have any information to help us build our evidence base? We received over 50 submissions from local councils, peak bodies, environment groups, community groups and individuals. Stakeholder and community workshops To build on the feedback received through submissions, in November 2016 Infrastructure Victoria held five workshops with key stakeholders and local communities in Melbourne, Hoppers Crossing, Hastings and Geelong. The workshops involved detailed discussions to gain the views and perspectives of individuals and organisations from a variety of backgrounds, sectors and communities including local government, industry, planning and economic groups and local residents. In total, 114 attendees participated in the workshops to discuss when a second container port may be needed, where it could be situated and the economic, transport, social and environmental considerations associated with a port development. Q Consultation on Second container port advice evidence base discussion paper Submissions An online submission process remained open on Infrastructure Victoria s website from 7 March until 3 April 2017 to seek feedback on the evidence base. We received 64 submissions during the month long consultation period. Submissions we have permission to publish are available at yoursay.infrastructurevictoria.com.au. Community drop-in sessions We held three community drop-in sessions in Melbourne, Hastings and Hoppers Crossing which were advertised in local papers and through online channels. Attendees discussed the evidence base discussion paper and supporting technical reports with the Infrastructure Victoria project team. In total, there were 70 attendees across the three drop-in sessions. 26 Infrastructure Victoria ADVICE ON SECURING VICTORIA S PORTS CAPACITY
27 Q Q Meetings with stakeholders During the development of the advice, we held a series of meetings with government, industry, environment and community organisations. ANL Avalon Airport Avalon Corridor Planning Australian Logistics Council Bass Coast Shire Council Cardinia Shire Council City of Greater Dandenong City of Greater Geelong City of Kingston City of Melbourne Commissioner for Environmental Sustainability Committee for Geelong Customs Brokers and Forwarders Council of Australia Destination Phillip Island DP World Drewry Environment Protection Authority Fisheries Victoria G21 Geelong Ports Fishermans Bend Taskforce Frankston City Council Hobsons Bay City Council Institute for Supply Chain and Logistics Linfox Maribyrnong City Council Maribyrnong Truck Action Group Melbourne Water Mornington Peninsula Shire Council Patricks Phillip Island Nature Park Phillip Island Tourism and Business Association Plan Melbourne Port Phillip Conservation Society Port of Brisbane Port of Melbourne Corporation Port of Melbourne (lessee) Port of Hastings Development Authority Port of Portland Port Phillip Conservation Council Port Phillip Sea Pilots Ports Australia Preserve Westernport Property Council Rail Freight Alliance Salta Properties Seafood Industry Victoria South East Group of Councils South Gippsland Conservation Society Strategic Maritime Group Transport for Victoria Transport Safety Victoria VicRoads Victorian International Container Terminal Victorian Planning Authority Victorian Ports Corporation (Melbourne) Victorian Regional Channels Authority Victorian Transport Association Victorian National Parks Association Western Distributor Project Team Western Port Biosphere Reserve Western Port Preservation Council Woolworths Supermarkets Wyndham City Council 27
28 Key themes of feedback on the evidence base The main themes that emerged during consultation were: The impact of future ship sizes there was consensus that Melbourne and more broadly Australia need to cater for larger ships in the future. Feedback on the optimal ship size was not consistent. We received some support for our assessment of the need to plan for less than 18,000 TEU ships. This was confirmed with the Port of Brisbane, Port of Melbourne and ANL shipping line. The use of tidal windows by ships to transit Port Phillip Heads was also generally acknowledged as being suitable in the Melbourne context. Future demand for container capacity while feedback differed on the likely future demand for container capacity, many noted the importance of demand projections in shaping our advice. Environmental impacts feedback highlighted that developing a new port at either Hastings or Bay West will have significant environmental impacts. Groups were most concerned with the environmental impacts of a port development closest to their location. There was significant concern raised about widening the shipping channel at the Port Phillip Heads and what impact that could have on beaches on the north-east of the Bay. Freight movement and supply chains There was significant feedback on supply chain issues and how important they are in port planning. Specifically, feedback focused on: the need for rail connections to support efficient future supply chains, both for an expanded Port of Melbourne and a port at either Hastings or Bay West the impact on supply chains if traffic flows around the Port of Melbourne become more congested because of increased freight volumes or a densification of urban development the impact of different port locations on supply chains and costs. Feedback focused on the impact of changed supply chains based on their current warehousing locations. Economic activity feedback from local government and industry peak bodies emphasised the importance of an efficient port and supply chains for a healthy economy. Local government submissions generally advocated for the new port to be closest to their location because of the increased employment and economic activity from a new port and ancillary business activity. Port locations we received feedback on all three of the discussed port locations at the Port of Melbourne, Hastings and Bay West. The most feedback was received about the Hastings option. For Hastings, a large volume of feedback focussed on economic and environmental issues, with an emphasis on potential impacts on tourism and recreation, especially on Phillip Island. Submissions about Bay West focussed less on environmental impacts and more on economic development opportunities. Stakeholders supportive of the Hastings location felt it was unfair to include the cost of Regional Rail East in the Hastings cost estimate. It was proposed that Regional Rail East will be built anyway for public transport so the cost should not be included in the development of Hastings. 28 Infrastructure Victoria ADVICE ON SECURING VICTORIA S PORTS CAPACITY

29 How consultation on the evidence base influenced our work Feedback received on our evidence base highlighted a range of views on the need for a second container port and prompted a debate on the opportunities, challenges, impacts and benefits of the options presented by Infrastructure Victoria. It helped us gain an understanding of priority issues and topics of importance to stakeholders and the community, and enabled us to refine our scope of work. It also provided us with direction on issues that needed to be further tested such as the cost of Regional Rail East and the potential impact on Phillip Island tourism posed by a container port development at Hastings. Feedback highlighted an increasing expectation in the community that the environment be valued and any impacts of ports development on the environment be managed and minimised. The emphasis the community placed on the environment prompted us to do the same. In our multi-criteria assessment we gave environment considerations equal importance with other criteria, consistent with Infrastructure Victoria's general approach. We also considered whether the outcome changed when given environment a higher weighting. Through the formal submissions process following the release of our evidence base in March 2017, the environment was identified as the area most requiring further investigation. We have responded to this by identifying the need to 'baseline and monitor environmental conditions as one of the six categories of recommendations made by Infrastructure Victoria. Three specific recommendations which seek to improve the quality and availability of environmental data sit under this category. We completed a strategic assessment looking for key differentiators between the potential second port sites and issues that would prevent a port being developed at each site. Some stakeholders would have liked to have seen a more detailed environmental review analysis than is typical for a strategic assessment of the kind undertaken by Infrastructure Victoria. Any future project development approval process would need to examine all relevant environmental issues in much greater detail. Stakeholder and community concern about traffic increases from capacity enhancements at the Port of Melbourne influenced our recommendations. It is clear ports need to maintain their social licence to operate and we have made recommendations that seek to address the factors which underlie this. The Port of Melbourne provided a detailed submission on our evidence base. The Port of Melbourne s views generally align with Infrastructure Victoria s work on potential projects to create more capacity at Melbourne, demand projections, the global fleet forecast and our transport network assessment. The Port of Melbourne identified areas that required detailed consideration and proposed a new project to be further reviewed, the potential Webb Dock rail link via Lorimer Street. You can read more about our view of this concept on page 85. Visit yoursay.infrastructurevictoria.com.au to read consultation summary reports for the port advice. 29
30 Choosing a new port It is complex to choose when and where to invest in new port capacity Timing complexity increasing capacity at an existing port becomes progressively more complex. Before deciding to invest in a new container port, there are usually a number of actions the port operator or manager, or stevedores can take to increase capacity at an existing port. These capacity enhancements often start simply and are relatively cheap, and become more complex, costly and time consuming as a port approaches its ultimate capacity. At some point, it is likely to make more sense to invest in a second port, compared to incrementally improving capacity at an existing port. This decision must be made well in advance of needing the extra capacity, because there is a long lag between deciding to build a new port and the port opening. Using national and international benchmarks, it is reasonable to assume that once a decision on a new port location is made, it will take between 10 and 15 years to plan, design, gain approval for, and construct the port. This long lead time means the government must make the decision to begin planning and constructing a new port in a climate of considerable uncertainty. For instance, before the Global Financial Crisis in 2008, Victoria had experienced ten years of very strong growth in container demand, an average of about 7 per cent per year. After 2008, the rate of container demand growth was much less, and has remained low at an average of about 1-2 per cent. The decision a government would make about investing in new port capacity in early 2007 would be very different from the decision it might make in There is also the potential for disruptive change in the maritime or land transport industries. In the 1950s the Port of Melbourne was planning a huge land expansion to provide the amount of space needed for the growing trade. At the time, all cargo was loaded and unloaded using cargo nets and cargo was packed into different sized boxes and barrels, requiring significant space and labour. Ten years later containers started being used to transport goods, and the space and labour required to load and unload a ship were drastically reduced. There is also potential for a disruptive landside transport technology to fundamentally change the economics of long distance freight transport in Australia. If technology such as high speed rail or hyperloop was proven to be technically and commercially feasible in Australia, it could significantly affect the structure of the freight industry. We have tried to consider the uncertainty inherent in long- term planning in calculating our demand forecasts. It is difficult to foresee the timing and specific nature of disruptive change, so when planning port capacity far in advance, government needs to regularly review some key indicators to track the likely point at which it is best to invest in new port capacity. Asset complexity ports are complex to approve and build because they combine different infrastructure, including roads, rail, buildings, bridges, quays, cranes and shipping channels. Ports are built in a sensitive environmental interface (land, intertidal and marine). The combination of these factors increases the complexity of planning and building a port. The task of planning, approving and building a port in a new location could be compared with combining the approval and construction complexity, for example, of the Victorian Desalination Plant, Peninsula Link, Regional Rail Link and channel deepening. Each of these types of individual developments had their own specific characteristics and challenges. Planning and constructing a port at Bay West could be compared to attempting all of these projects together, because it would involve road, rail, marine access and construction in a marine environment. 30 Infrastructure Victoria ADVICE ON SECURING VICTORIA S PORTS CAPACITY

31 Location complexity port location influences the import supply chains, and the ability of Victorian products to reach export markets. The location of a port will shape Victoria s economic competitiveness, and the location of jobs, transport links and housing in Melbourne. Because so much of what people consume comes in through a port, a large amount of warehousing is needed to store and process imports before they end up in our shops, or are transported to factories as an input into manufacturing or some other value-add process. Warehousing companies look for cheap land, close to good transport connections and an international gateway, like a port. This means that a change in the location of a port is likely to influence the distribution of warehousing across metropolitan Melbourne. The port location and transport connections will also affect how easily Victoria s export products can get to market. 31

32
33 The importance of an efficient international port Ports are critical international gateways which help transport our exports to international markets. They allow us to access goods and manufacturing inputs from around the world. Efficient supply chains support economic development, help Victoria maintain its competitiveness and increase its productivity. Most consumer goods pass through the Port of Melbourne. Over 80 per cent of import containers passing through the Port are destined for the Melbourne metropolitan area. Some of these containers hold finished consumer goods that are sold in stores. Other containers hold manufacturing inputs, which Victorian businesses turn into value-added products. Some containers are broken down, repacked and sent to Perth, Adelaide or regional Victoria. For exports and imports, an efficient port is critical to Victoria s economy and supply chains for Victoria, South Australia, southern New South Wales and Tasmania. To maximise the benefit Victoria gains from this key piece of infrastructure we need to ensure it has: efficient transport links, so exporters and importers can easily access the port the ability to respond to demand enough excess capacity to encourage competition between stevedores access to a large nearby market effective price regulation to contain port user fees and charges. An efficient port has benefits beyond the port city and serves as an important trade facilitator for exports and imports. For containerised and non-containerised exporters, such as agricultural and natural resource producers and manufacturers, an efficient port provides reliable and costeffective access to international markets. For containerised and non-containerised importers, such as retail business and manufacturers who need imported inputs, an efficient port keeps the cost of inputs low and reduces supply chain costs for finished goods, which, in turn, benefits Victorian consumers and businesses. While an efficient port benefits all Victoria, operating such a large and busy piece of infrastructure can have negative impacts which tend to be felt more locally. These impacts can include increased transport network congestion, habitat loss, reduced air quality, noise and other amenity impacts. While focusing on making sure Victoria always provides competitive port capacity, the local negative impacts need to be addressed. This means understanding the likely traffic impacts of either an expanded Port of Melbourne or a second port at Bay West or Hastings, and the social, amenity and environmental impacts. We assume Victoria will always seek to provide an efficient port for exporters and importers, with enough capacity to promote competition between stevedores to help keep supply chain costs low. 33
34 Why land-bridging is not viable Land transport costs are much higher than port or shipping costs, which makes it uneconomical to move containers by truck or train from one city to another for import or export. Typically, shipping companies charge a pan-australian rate they charge the same amount for taking a shipping container to any of the Australian east coast ports. This means there is limited price competition between ports. Each major city has one container port with a natural catchment. Port fees and access costs do vary between cities, so there is minor competition where natural catchments overlap. For example, Riverina trade can go to Sydney or Melbourne. Land-bridging is bringing cargo through one port and transporting it to other Australian capitals by train or truck. This is sometimes discussed as an alternative to investing in new port capacity. Land-bridging is considered to be an inefficient solution for the Australian logistics industry for the following reasons: The majority of Australia s population live in capital cities and capital cities are located a long distance from each other. On a per kilometre basis, the cost of shipping is a fraction of road transport costs. Eastern capital cities have located ports near to their city centres, aiming to minimise road transport distances for all import destinations and export origins. Each time a container is handled it adds additional costs. Historically, it has been more cost efficient to ship directly to eastern capital city ports and minimise road transport costs. Figure 1 demonstrates the different costs associated with land-bridging compared to shipping. As the diagram shows, based on current charges and operations, it is at least 25 per cent cheaper to ship directly to Port of Melbourne than land-bridging from Sydney, the closest port. These numbers are an approximation only. This assessment is based on current freight pricing and does not try to anticipate how costs would change if the national shipping industry was restructured. It is also less reliable to load a 5,000 to 6,000 TEU shipment onto rail, which would overload rail lines and result in containers arriving later than if they had been shipped by sea. The proposed inland rail link between Brisbane and Melbourne is not likely to be a viable alternative for an efficient port close to Melbourne. The primary purpose of inland rail will be to support interstate freight movement. It is unlikely to prove more cost effective for international imports which are mostly destined for the metropolitan area. As such, Infrastructure Victoria does not consider that inland rail will replace the need for Victorian port capacity. Infrastructure Victoria assumes that port capacity will always be provided as it is critical to the functioning of the State economy. There is no evidence to suggest this will change. While demand has been growing more slowly, we are unlikely to see negative growth, unless population reduces or there is a significant economic downturn, neither of which seem likely. Land-bridging not only adds significant cost as shown above, it would require massive capital investment in road and rail projects to move the goods. These could end up costing more than a new port, as evidenced by recent rail and freeway projects. Land-bridging requires infrastructure investments over hundreds of kilometres and would vastly increase the amount of trains and trucks required to service the Victorian market, which creates ongoing capital and operational costs that would need to be met. A minor increase in supply chain cost may not be significant for many retail import supply chains due to the value of the cargo being moved. A container with jeans, for example, may have thousands of items in it, so a few hundred extra dollars in supply chain cost may mean only a few cents or less on an item worth tens or hundreds of dollars. This very small increase in unit cost is unlikely to impact on consumption. Many manufactured goods, and most exporters are very sensitive to additional costs due to the low price of some of the goods being moved and because they are subject to more international competition. As a result, any increase in supply chain cost may make marginal businesses unviable. 34 Infrastructure Victoria ADVICE ON SECURING VICTORIA S PORTS CAPACITY
35 Figure 1. Land-bridging cost comparison Port of Shanghai Container Origin $1,000 TEU Container Port Destination Port of Melbourne $450/TEU $540 per TEU (includes staging) Outer West Melbourne DC $1,990 Total per TEU $1,000 TEU Port of Portland $460/TEU $1,300 per TEU (includes staging) $2,760 Total per TEU $1,000 TEU Port of Sydney $480/TEU $1,100 per TEU (includes staging) $2,580 Total per TEU $1,000 TEU Port of Darwin $460/TEU Intermodal terminal $75 per TEU $1,200 per TEU Intermodal terminal $540 per TEU $3,275 Total per TEU $1,000 TEU Port of Brisbane $460/TEU $2,675 Total per TEU Intermodal terminal $75 per TEU $600 per TEU Intermodal terminal $540 per TEU Source: Deloitte, Infrastructure Victoria Second Container Port Advice TEU cost assessment,
36 Port capacity factors Why is this important? Port capacity is influenced by a range of factors. It is important to understand these factors when thinking about ways to increase port capacity, particularly in the context of potential expansion of the Port of Melbourne. Effective vs nameplate capacity Port capacity is often discussed in terms of nameplate capacity and effective capacity. Nameplate capacity is the full theoretical number of containers a port can handle, working at peak operation for 365 days a year. The nameplate capacity does not account for the time berths may be at a lower productivity because of maintenance, or for seasonal variability in demand. Effective capacity is less than the nameplate capacity, and refers to the actual capacity a port operates at, accounting for a range of buffers that reduce capacity below the nameplate capacity. Maintaining an effective capacity lower than the nameplate capacity helps to ensure buffers for: Seasonality and market volatility: trade demand through the port fluctuates during the year; exports peak after harvest and imports peak ahead of busy consumption periods, like Christmas. The Port of Melbourne s peak volume has been up to 15 per cent higher than the annual monthly average. Competition between stevedores: competition drives productivity improvements through incentivising investment in more efficient operations and new capacity. To encourage competition between stevedores, there needs to be some excess capacity so that shipping lines and importers and exporters can change between stevedores, limiting the ability of stevedores and port operators to raise port fees. Maintenance and industrial downtime: ideally terminals would work seven days a week, 24 hours a day for 365 days a year. In reality, the machinery needs downtime for maintenance, there can be unplanned breakdowns, or industrial action. All port capacity numbers in this report are effective capacity. Port capacity factors Port capacity is determined by the interaction of different factors which can be grouped as: Maritime approaches: the capacity of the channels, any constraining features, such as the Port Phillip Heads, limiting the size or number of ships that can access the port. Container terminal: there are three distinct areas that can limit the container terminal: Berth/quay: the length of berths and quay line available for ships to moor at the terminal, and the number of ship to shore cranes (STSC) to load and unload containers. Yard: the space available for container stacks and stacking system. Containers typically spend several days in the yard before leaving the port. Gate: the number and speed of truck (or train) loading bays limit the speed at which containers can be moved into or out of the terminal on the landside. Landside transport networks: the capacity of road and rail transport networks beyond the port gate to move containers to and from the port. 36 Infrastructure Victoria ADVICE ON SECURING VICTORIA S PORTS CAPACITY
37 Victorian commercial ports today Victoria has four commercial ports at Melbourne, Hastings, Geelong and Portland. The Port of Melbourne is Victoria s only container port; the other ports handle a mix of dry bulk, break bulk and liquid bulk. Table 1 describes the characteristics and current trades of each port. The Terms of Reference ask Infrastructure Victoria to examine locating a second container port at Bay West or Hastings. While there is potential to expand activities at some Victorian ports, the Port of Geelong and the Port of Portland face natural constraints that make them unsuitable for a container port. The Port of Portland has a declared channel depth of 12.1 metres, is constrained by surrounding residential land uses, its current port land is fully occupied and is over 350 kilometres away from Melbourne. Although its proximity to agricultural and resources exports in northwestern Victoria may present potential for the port to increase its role as a bulk and break bulk port, it is not suitable as the location of a second container port. We discuss the need and opportunities to redistribute non-containerised trades either within the Port of Melbourne or to other Victorian ports on pages 85 and 105. The Port of Geelong has a long channel with a significant amount of rock, which means major dredging of the channel so it could accept large container ships which would be very costly. There is limited land available for the major expansion required for a large container port. Although the Port of Geelong has the potential to accept relocated trades from the Port of Melbourne and increase volumes in current trades, it is not suitable as the location of a second container port. Table 1. Victorian commercial ports today Port Melbourne Hastings Geelong Portland Owner Leased State Private Private Berths Land 510 hectares Long Island Point: 6.2 hectares 226 hectares 65 hectares Channel depth Maximum vessel draught with tidal assist 15.5 metres to Williamstown 14.6 metres in Yarra Channel 14.7 metres tankers 14 metres container ships Crib Point: 4.8 hectares Stony Point: 1.9 hectares 14.2 metres 12.3 metres 12.1 metres 15 metres 12 metres metres Trades Containers, dry bulk, break bulk, liquid bulk Liquid bulk, break bulk Liquid bulk, break bulk, dry bulk Dry bulk, break bulk Source: Adapted by Infrastructure Victoria based on discussion with Harbour Masters and information in the Deloitte/Aurecon, Victorian infrastructure capability assessments: transport,
38 Developing our advice To recommend a timeframe during which the government should invest in a second port, we used a least economic cost assessment. This assessment compared the cost of increasing the capacity of the Port of Melbourne against the cost of building a second port at either Bay West or Hastings, including externalities and social impacts. This allowed us to determine the point at which it was cheaper to invest in a second port, rather than further expanding the Port of Melbourne. We asked this question at different container demand levels estimated in our demand forecasts. As well as considering the cost of providing extra capacity at either the Port of Melbourne, Bay West or Hastings, we also conducted a number of sensitivity tests to consider the what ifs. We considered what other factors may affect a decision about investing in additional capacity, including the social and environmental impacts, land use and the future availability of road and rail links. To provide advice on where to locate a new port, we assessed the economic, environmental, social and amenity impacts of a new port at either Bay West or Hastings, as well as operational and navigation factors. To support this assessment Infrastructure Victoria proposed a concept port design at each location, undertook economic analysis of the two options including transport modelling and a separate supply chain analysis for each site, and assessed the environmental and social impacts of a port at either location. The economic analysis also considered the regional and state-wide impacts of expanding the container port or changing its location. All of these impacts were assessed together in a multicriteria assessment, a commonly used tool for assessing quantitative and qualitative indicators of environmental, economic, social and amenity impacts. To ensure we understood the effect of different priorities on our results, we also ran the multi-criteria assessment with different weightings, to test whether focusing on a particular factor changed our assessment. An overview of how we prepared our advice is shown in figure Infrastructure Victoria ADVICE ON SECURING VICTORIA S PORTS CAPACITY
39 Figure 2. Methodology overview Whether a second port is required? When will it be required? Where will it be located? Demand Modelling Bay West Hastings Total Demand Market Share Port of Melbourne Capacity Timeframe (range) Options for the future Multi-criteria Assessment developed and agreed The multi-criteria assessment can include a number of discrete criteria such as: Social impacts Economic Environment Cost Cost Effectiveness (Economic Modelling) Multi-criteria Assessment Input Development Environmental and Social Impacts Multi-criteria Assessment Workshop Advice and recommendations Source: Infrastructure Victoria/Deloitte,

40 40 Infrastructure Victoria ADVICE ON SECURING VICTORIA S PORTS CAPACITY
41 Evidence for future demand, channel capacity and ship sizes The Special Minister of State requested that Infrastructure Victoria provide advice on the long-term demand for port capacity, including the capability of Victorian channels and existing port infrastructure to handle future changes, and where to locate new port capacity. To help us understand the potential impact of future changes on Victorian ports, we gathered evidence on the following key factors: Container demand forecasts: the level of future demand drives the decision to invest in additional container capacity, whether it is increasing the capacity of the Port of Melbourne, or deciding to build a second container port at either Bay West or Hastings. We have also considered non-containerised demand forecasts. The capacity of the Port Phillip Heads: what size of ship, and how many ships, can access Port Phillip Bay through the Port Phillip Heads is critical to providing advice on when and where Victoria should invest in new container capacity. Future ship sizes: how ship sizes are changing and what that means for the vessels that want to visit Victoria and Australia influences what ship size Victorian container ports need to accommodate in the future. We are presenting the evidence we gathered on these key factors together, because all three are relevant for: our advice on when we need a second port, because it helps us understand the possible capacity of the Port of Melbourne our advice on where to locate a second port, because it helps us understand the capacity of Bay West to accept large ships, and how much this matters relative to Hastings. 41
42 Demand forecasts Why is this important? To recommend when Victoria should invest in additional port capacity we needed to estimate future demand for both import and export containers. Forecasting demand lets us assess the Port of Melbourne s ability to handle future demand, and whether we should invest in additional capacity at the Port of Melbourne or at a second container port. Demand When we talk about demand, we mean how many TEU the port must handle to satisfy the needs of all port customers. Port capacity needs to stay ahead of demand to avoid restricting trade. Demand is measured by the number of TEU per year that are imported and exported through a port. While demand is measured in the number of TEU, we are really trying to predict how many goods, manufacturing inputs and agricultural products our households, businesses and farms will need to import and export in the future. Predicting economy-wide demand for imports and global demand for Victorian exports is complicated and relies on a range of factors which will change, often in ways we can t predict. Technological changes in production and transportation can have unforeseen impacts on how the freight industry works, and how we produce and consume goods. For instance, consumer products have changed dramatically in the past decades. Many have become smaller, or been combined into one device. Smartphones now perform tasks that used to be performed by multiple devices such as alarm clocks, watches, music players, calendars and cameras. Demand forecasting is not exact but it is a valuable and credible tool in capacity planning and is used all over the world. We recognise that forecasts will almost always be inaccurate. They rely on what has gone before to predict the future, with little (or no) capability to identify shifts in trends. Nevertheless, long-term planning, such as advising on when a second container port will be needed, requires a judgement on the future numbers of containers to be moved based on the best available information. Our demand forecasts Demand for container port capacity is driven by demand for imports and, to a lesser extent in Victoria, the increasing containerisation of exports. Historically, economic and population growth has driven growth in container trade volumes. Changes in the exchange rate also affect demand for imports and exports when the Australian dollar has been more valuable, it made imports relatively cheap, which tended to increase import demand. When the dollar has become less valuable, it drove more demand for Victorian exports, because they became relatively cheap in the global marketplace. Population and economic growth is forecast to continue, which will also result in continued growth in container volumes. The Victorian Government s population forecast, Victoria in Future 2016, predicts a population increase to over 7.7 million in 2031, compared with over 6 million today. The Victorian State Budget also forecasts growth in Gross State Product to continue at between per cent between now and (the Victorian budget only forecasts Gross State Product growth out to ). We developed forecasts for central, high and low demand growth cases. The central case was used as the demand forecast input to other parts of our advice. The high and low forecasts were used to test different scenarios, often referred to as a sensitivity analysis. We developed these forecasts in line with common practice, and the detailed methodology for how we developed the forecasts can be found in Infrastructure Victoria Second Container Port Advice container trade forecasts for Victoria. We also reviewed demand forecasts for non-containerised trades, which predict that these trades will continue growth in the vicinity of 0.5 to 2 per cent out to More information on our review of non-containerised demand forecasts can be found in Infrastructure Victoria Second Container Port Advice container trade forecasts for Victoria. More information on how we developed our demand forecasts can be found in Infrastructure Victoria Second Container Port Advice container trade forecasts for Victoria. 42 Infrastructure Victoria ADVICE ON SECURING VICTORIA S PORTS CAPACITY
43 The results of forecasting the central, high and low cases Figure 3 shows that in the 2031 financial year, total containerised demand will reach 4.3 million TEU under the central case, 4.2 million TEU under the low case and 5.5 million TEU under the high case. Thereafter demand grows notably less under the low case compared to the central and high case. By the 2046 financial year, container demand is expected to reach 6.5 million TEU under the central case, 5.6 million under the low case and 8 million TEU under the high case. This demand forecast provides a guide for when new port capacity is required by comparing a forecast against the capacity of the current assets. Demand forecasts need to be regularly checked as a surge in demand may bring forward the need for a capacity investment and these investments have very long lead times. Figure 3. Forecasts of total container trades volumes (TEU): central, low and high cases 12 M 11 M Forecast 10 M 9 M 8 M TEU 7 M 6 M 5 M 4 M 3 M 2 M 1 M 0 M Historical Central Case Low Case High Case Financial Year Source: Deloitte, Infrastructure Victoria Second Container Port Advice container trade forecasts for Victoria,
44 How we used the demand forecasts The demand forecasts are a key input for many of our other work streams and were used to: Plan and cost Port of Melbourne capacity expansion stages. Infrastructure Victoria's engineering and technical advisors used the demand forecasts to help understand when additional capacity may be required, and how that demand could possibly be met by phasing capacity expansions at the Port of Melbourne. To encourage competitive tension within the port, and access for imports and exports, it is a requirement that the Port of Melbourne capacity should always exceed demand. Model the number of calls and the fleet spectrum of container ships calling on the Port of Melbourne. The demand forecasts were used to inform how often ships would need to visit the Port of Melbourne, and how different levels of demand might affect the ship size shipping companies want to bring to Melbourne. Model the traffic through the Port Phillip Heads. Related to the number of calls and the fleet spectrum analysis, the demand forecasts were used to generate numbers of ships needing access to the Port Phillip Heads. These numbers were modelled alongside the other ships that need access through the heads, such as cruise ships heading to Princes Pier, oil tankers and grain ships heading to the Port of Melbourne and the Port of Geelong, and Trans-Tasman container and cargo ships, to understand whether there would be issues with traffic at the Heads. Historic forecasts for Victorian container demand and extreme high and low scenarios All ports complete regular demand forecasting as part of regular port development plans. Over the last 10 years several demand forecasts have been published for Victoria by the Port of Hastings Development Authority, the Department of Treasury and Finance, and the Bureau of Infrastructure, Transport and Regional Economics. As shown in figure 4, different forecasts have given quite different results. Figure 4 also includes the forecast for our central demand scenario. Figure 4. Historic demand forecasts for Victorian container demand 22 M 20 M 18 M 16 M TEU 14 M 12 M 10 M 8 M 6 M 4 M 2 M M Historical PoHDA (2013) BITRE (2014) DTF (2014) Central Case Financial Year Source: Deloitte, Infrastructure Victoria Second Container Port Advice container trade forecasts for Victoria, Infrastructure Victoria ADVICE ON SECURING VICTORIA S PORTS CAPACITY
45 Before the Global Financial Crisis in 2008, Victoria had experienced ten years of very strong growth in container demand of about 7 per cent on average. After 2008, the rate of growth of container demand was much less, and has remained at a lower rate of about 1 2 per cent on average. For a government, the decision it would have made regarding investment in new port capacity in early 2007 would be very different from the decision it may have made in early A government s view of future demand will vary depending on whether it is forecasting demand in a high or low growth environment. Figure 5 shows how demand forecasts would have looked had the trade continued on the basis of the high growth up to 2007, as well as the low growth post- 2008, and our central, high and low forecasts. This stark difference between the extreme high and low scenarios show why it is important to balance the impact of outlier demand movements in the long-run demand forecasts. Our demand forecasting has done this. Figure 5. Extreme high and low scenarios for container trade demand 20 M 18 M Forecast 16 M TEU 14 M 12 M 10 M 8 M 6 M 4 M 2 M M Historical Central Case Low Case High Case 7.7% p.a. growth 1.7% p.a. growth Financial Year Source: Prepared by Deloitte for Infrastructure Victoria, 2017 Which technical reports should I look at for more information? Deloitte, Infrastructure Victoria Second Container Port Advice container trade forecasts for Victoria,
46 Channel capacity, including Port Phillip Heads Why is this important? What size of ship, and how many ships, can access Port Phillip Bay through the Port Phillip Heads is critical to providing advice on when and where Victoria should invest in new container capacity. For the Port of Melbourne, if the channels are too congested, or if the size of ships that need to visit cannot pass through the Heads, then the potential capacity of the Port may never be realised. The capacity at the Heads is also critical to the viability of a possible future port at Bay West. A new port at either Bay West or Hastings may need to service Victoria for 100 years or more. For any Port of Melbourne expansion and the Bay West option, we need to understand if the Port Phillip Heads has the capacity to accommodate the amount of ships wanting to visit the container port in this timeframe, without compromising cruise ship visits, the Port of Geelong s operations or the Tasmanian trade. Navigating into Port Phillip Bay A system of channels within Port Phillip Bay allows large ships to enter the Bay and navigate to the ports of Geelong or Melbourne. These channels are shown in figure 6. The difficulty of navigating these channels, particularly the entrance to Port Phillip called the Heads, has prompted the Melbourne Harbour Master to require all ships to engage a pilot a mariner with specialist local knowledge and experience of this area. The Harbour Master also restricts the size of vessels that can enter the Bay and under what conditions. A large container ship approaching from Bass Strait must first pick up a pilot at the boarding ground outside the Heads, then navigate through the Heads using one of several channels. Almost all container ships use the Great Ship Channel, the deepest through the Heads. Once inside the entrance, ships must turn right and follow the South Channel to cross the Great Sands, a large shallow area in the southern part of the Bay. At the end of the South Channel close to Rosebud, ships turn around the Hovell Pile and into the deeper area in the centre of the Bay. From the Hovell Pile ships can head north to the Port Melbourne Channel, north-west to the start of the Geelong channel near Portarlington, or to the anchorage on the western side of the Bay. The Port of Melbourne Channel starts at Fawkner Beacon and runs north to Station Pier. Cargo ships heading for the Port of Melbourne turn into the Williamstown Channel which leads to the mouth of the Yarra and Webb Dock. Around Williamstown the ship is joined by one or more tug boats which will assist it manoeuvring to its berth. If calling at Webb Dock, the ship will be swung around in the Webb Swing Basin then dragged backwards by the tugs into its assigned berth in Webb Dock. If the ship is bound for Swanson Dock it needs to continue up the narrow Yarra Channel and under the West Gate Bridge to the Swanson Dock Swing Basin, where it is swung around and then backed into its berth in Swanson Dock. 46 Infrastructure Victoria ADVICE ON SECURING VICTORIA S PORTS CAPACITY


47 Figure 6. Port Phillip Bay channels Swanson Dock Westgate Bridge Yarra Channel Swanson swing basin MELBOURNE! YARRA RIVER MELBOURNE! Bolte Bridge Webb Dock Williamstown Channel Station Pier Î Port Melbourne Channel Webb swing basin Fawkner! Beacon Î Geelong Channel! GEELONG Pilot Boarding Ground! Great Ship Channel South Channel Hovell Pile! Source: Adapted by Infrastructure Victoria from Victorian Ports Corporation (Melbourne), Port Information Guide,
48 The channels in Port Phillip Bay have different dimensions and constraints, as summarised in table 2. Some of these constraints can be relatively easily unlocked (for example by dredging to widen a channel) but others are much harder (for example raising the West Gate Bridge). The capacity and constraints of Webb Dock, the Yarra Channel and Swanson Dock are discussed in the Capacity of the Port of Melbourne section. Table 2. Port Phillip Bay channels and constraints for various ship sizes AREA Old Post Panamax 7,000 TEU Old Post Panamax Plus 8,500 TEU CONTAINER SHIP CLASS Old Post Panamax Plus 9,500 TEU New Post Panamax 14,000 TEU Ultra Large Container Ship 18,500 TEU COMMENT ON EXISTING LIMITATIONS Great Ship Channel (Heads) Width of channel South Channel Port Melbourne Channel Width of channel Williamstown Channel Width of channel Webb Dock Swing Basin Size of swing basin Webb Dock Width of northern section, southern section adequate Yarra River Channel Width of channel West Gate Bridge Air draught Swanson Dock Swing Basin Size of swing basin Swanson Dock Width of basin Source: GHD, Infrastructure Victoria Second Container Port Advice Estimated Capacity of the Port of Melbourne, 2017 Key: Vessel size can operate in channel or through constriction Borderline. Vessel size should be able to operate with minor adjustments or some restrictions Vessel size cannot operate 48 Infrastructure Victoria ADVICE ON SECURING VICTORIA S PORTS CAPACITY


49 Do the Port Phillip Heads limit ship size in Port Phillip Bay? The Heads or the Rip is the entrance to Port Phillip Bay between Point Nepean and Point Lonsdale. The Heads is a notoriously treacherous entrance. It experiences strong tidal currents and is exposed to ocean swell waves. There are two shallow areas, Rip Bank and Nepean Bank, separated by a horseshoe shaped canyon up to 90 metres deep which can cause complex and unpredictable eddies in the current. There are five defined shipping channels through the heads positioned side-by-side. The central and deepest is the Great Ship Channel which has been dredged to give it a declared depth of 17 metres. The width of the Great Ship Channel at 254 metres is narrow for the size of ships using it, which means that only one large ship at a time may enter or leave the Bay. Figure 7 shows the current configuration of the Heads. Large and deep draught vessels can have difficulty maintaining control in strong currents and shallow water through the Heads, in particular across Rip Bank. For safety, the Melbourne Harbour Master currently restricts large container vessels from transiting the Heads when tidal currents are greater than: 5 knots for inbound transits (5 per cent of the time) 5 knots (flood tide) or 4 knots (ebb tide) for outbound transits (18 per cent of the time). Vessel draughts are restricted to 14.0 metres. Deeper draught vessels, up to 14.5 metres, may be brought in during favourable conditions by special arrangement with the Harbour Master. The Heads poses a potential constraint on the size of ships that can enter Port Phillip Bay to call at Melbourne, Geelong or Bay West. As part of this study we conducted a ship simulation exercise to determine the largest class of container ship that could safely transit the Heads. Figure 7. Shipping channels through Port Phillip Heads Source: The Port of Melbourne, Port hydrography poster accessed
50 Ship simulation Port Phillip Heads To better understand the size of ship that could safely access the Heads, our navigation study included a ship simulation at the Australian Maritime College Maritime Simulation Centre in Tasmania. The ship simulation was to determine two things: What size vessel could safely transit the Heads with its current configuration? What channel upgrades would be required to allow some of the largest vessels in the world 18,500 TEU capacity and 400 metres long to safely transit the Heads? The ship simulator is analogous to a flight simulator. It consists of a full size mock-up of a ship s bridge with a wrap-around video screen showing the view forward and to either side and includes all navigation instruments, steering and engine controls. Our simulations were piloted by professional Port Phillip Sea Pilots, who specialise in guiding ships in and out of Port Phillip Bay. These pilots are familiar with the conditions in the Heads and how real ships behave. They are also familiar with the Australian Maritime College simulator and its limitations, for instance the simulator s inability to introduce random currents or sudden failures of a ship s gear. Both of these situations have occurred during transits of the Heads. The pilots are able to consider the simulator limitations when deciding if a simulated transit was a success. We conducted a number of simulator runs to account for different ship sizes and different tidal conditions. In all, 28 transits of the Heads were simulated with three different ship sizes, including at different times in the tidal cycle: in-bound, out-bound, flood tide and ebb tide. Table 3 describes the result of these navigation simulations. The 8,500 vessel could safely transit the Heads using existing channels in low current window around slack water. Slack water is the point in the tidal cycle where the level of water inside the bay and outside the bay are equal, resulting in very low tidal currents. Slack water occurs approximately every six hours. Table 3. Results of navigation simulations Vessel Length (m) Beam (m) Draught (m) TEU Result Ital Cortesia Old Post Panamax plus MSC Daniela New Post Panamax Superium Maersk Ultra Large Container Ship ,500 Vessel could safely transit the Heads using existing channels in low current window around slack water. Current limit: 3 to 4 knots, depending on tide and direction ,000 Vessel could safely transit the Heads using existing channels in low current window around slack water. Current limit: 1.5 to 3 knots, depending on tide and direction ,000 It did not seem feasible for a vessel of this size to safely transit the Heads with the existing channel configuration. Vessel could safely transit the Heads in low current window around slack water with channel widened under water from 245 to 425 metres. Current limit: 3 knots Channel would also require deepening for vessel to operate at full draught (16 metres). Source: AECOM, Infrastructure Victoria Second Container Port Advice Navigation Study, Infrastructure Victoria ADVICE ON SECURING VICTORIA S PORTS CAPACITY


51 The navigation simulations show that vessels up to about 14,000 TEU can safely transit the Heads, if they time their transit for the low current period around slack water. As vessels get larger, the length of the window around slack water that the vessel can safely access the Heads becomes smaller. Figure 8 shows the vessel tracks of the 14,000 TEU ship in the simulator for multiple successful transits of the Heads. A number of simulations were carried out to test the effects of deepening or widening the Great Ship Channel. These showed that enlarging the channel did allow larger ships to transit, but they were still restricted to the low current window around slack water. Given the nature of the Heads we think that even with channel upgrades, access for large ships will always be constrained to certain tidal windows around slack water. On the basis of these simulations, a 14,000 TEU ship would be a reasonable future design vessel for Bay West, although it may be many years before these vessels come to Melbourne see the discussion of ship size and future fleet forecast below. Although access is restricted to certain tidal conditions, this is not unusual. Many ports have similar restrictions including Fremantle and Brisbane, where deep draught ships cannot access the port at low tide. Although we have carried out ship simulations with a deepened and/or widened channel through the Heads, we are not recommending that any dredging in the Heads is required at this stage, and this dredging may never be needed. If in the future the option to expand the channel through the Heads was considered then more detailed studies would be required to assess the environmental and social impact. These issues are discussed further in the Bay West Potential environmental and social impacts section. Figure 8. Vessel tracks for successful transits of Port Phillip Heads by 14,000 TEU MSC Daniela in ship simulator Legend Optional widening of channel toeline for 18,500 TEU Vessels Marine National Parks/Sanctuaries Existing Great Ship Channel Vessel tracks Source: AECOM, Infrastructure Victoria Second Container Port Advice Navigation Study,
52 Capacity How many large ships can navigate through the Heads? Ship simulation established that ships with a capacity up to 14,000 TEU can access the Heads during a limited window around slack water. To understand whether there was sufficient capacity during this window for all container ships, tankers, bulk carriers, car carriers, cruise ships and ferries that may need future access to Port Phillip Bay, we compared a 50-year forecast of all commercial shipping into the Bay with the theoretical number of available slots for ships to transit the Heads and South Channel in suitable conditions. To calculate the theoretical maximum number of available slots we assumed ships travel in one-way convoys with a 15 minute gap between ships, and that the channel was closed due to severe weather for ten per cent of the time. This gives a total of about 31,500 slots per annum, including 10,500 low-current slots in the two hour window around slack water. We also assumed the maximum container ship size is 14,000 TEU and the channels through the heads remain in their existing configuration (i.e. no deepening or widening takes place). We estimated the total number of ship calls to Port Phillip Bay in 2066 would be about 5,900 (there were 3,687 in 2016). This results in 11,800 total transits of the Heads using only 37 per cent of available slots. Of these 3,600 would be large container ships or tankers which can only transit in the low current window around slack water, using 35 per cent of available slots. This high level analysis demonstrates that there is ample capacity up to the year 2066, with less than half of the available slots used. If growth in ship numbers were to continue as forecast then the ultimate capacity, assumed to be 70 per cent utilisation of available slots to maintain flexibility, would not be reached until sometime in the mid-2100s. Vessels transit the heads on a first-come first-through basis. A more active vessel traffic management regime will be required in the future to maximise capacity. This would involve the vessel traffic service (VTS) provider prioritising vessels based on size, cargo and handling characteristics and assigning them a suitable time slot to transit the Heads. As the main limiting factor is tidal currents, suitable slots can be predicted and assigned in advance. This allows ships to slow steam from the previous port, timing their arrival to meet the slot and save fuel. While vessel traffic management systems operate at many ports around the world, congestion increases port costs. As the number of ships increases, the traffic management system will introduce some delays to shipping (usually no more than 6 to 12 hours) and potentially erode the efficiency of port terminals as ships arrive in bunches around slack water rather than spread throughout the day, putting pressure on the ability of cranes, quay lines and terminals to handle an influx of containers. Could an accident block the Heads? Port Phillip Heads is a busy and constricted waterway through which most of Victoria s sea-borne trade flows. As ship numbers increase so may the risk of an accident blocking the shipping channel. In order to better understand this risk we consulted with Captain David Shennan, ex-port of Melbourne Harbour Master. Captain Shennan considered the most likely cause of an accident which blocked the channel would be a ship running aground on a channel edge, due to either human error or mechanical failure. There is a low likelihood of this occurring, due to comprehensive systems to ensure the safety of vessels navigating the Heads, such as: one-way traffic through the Heads Harbour Master s restrictions on vessel size and conditions in which to transit the Heads compulsory pilotage for vessels over 35 metres in length vessel traffic service monitoring all transits and providing warnings of potential conflicts dynamic under keel clearance systems for deep draught vessels survey and maintenance dredging of channels inspections of ships by the Australian Maritime Safety Authority and classification societies to ensure equipment is fit for purpose and properly maintained. In particular, the introduction of safety management systems covering training, maintenance and backup systems, along with auditing, has reduced the risk of accidents. 52 Infrastructure Victoria ADVICE ON SECURING VICTORIA S PORTS CAPACITY

53 If an accident resulted in a ship blocking the Great Ship Channel, a number of strategies could be used to minimise the impact of the restriction: Ships with smaller draught could continue to transit the Heads using one of the adjacent shallower channels. Tugs could be used to move the grounded ship or hold it in a position that allowed other ships to pass. Salvage experts could be called in to refloat and remove the grounded ship. The time taken to clear a blocked channel would depend on the nature of the incident. In an extreme case it could take weeks, but several days is considered far more likely. Which technical reports should I look at for more information? GHD, Infrastructure Victoria Second Container Port Advice Estimated Capacity of the Port of Melbourne, 2017 AECOM, Infrastructure Victoria Second Container Port Advice Navigation Study, 2017 Navigating through the Heads is more complex than the entrance to Western Port. Safety standards are in place at each location to reduce the risk of navigation to acceptable levels. While we were often asked if there was a strong benefit for strategic redundancy of having container ports in separate bays we consider there is a low risk of an incident blocking the Heads. As a result, it was not a key driver in decision making for port location. 53

54 Changing ship sizes Why is this important? The ship size Victorian container ports need to accommodate in the future is influenced by how global ship sizes are changing, and what that means for the size of ships wanting to visit Victoria and Australia. Changes in ship size also affect the cost of importing and exporting cargo, with larger ships generally providing a lower cost per TEU. Likely future ship sizes influenced our advice on how large the Port of Melbourne could be, as well as the suitability of a second container port at either Bay West or Hastings. How have ship sizes changed over time? Container ships and container port terminals are designed to handle large numbers of containers as efficiently as possible. The first container ships in the 1950s were converted tankers or general cargo ships. Dedicated container ships optimised for container capacity and quick loading and unloading soon followed. Prior to containers, it could take weeks to load and unload large cargo ships. The introduction of dedicated container ships, and the associated quay infrastructure of cranes and container stacks, means it is now possible to load and unload a ship within 24 hours. This has resulted in a large reduction in the cost of moving cargo long distances. The size of container ships has steadily increased. Figure 9 shows the general evolution of container ship size. Naming conventions for classes of ships often refer to the physical feature through which they can fit. For instance, some of the ships in figure 9 are named for their ability to fit through the old or new locks on the Panama Canal, a major international shipping route. 54 Infrastructure Victoria ADVICE ON SECURING VICTORIA S PORTS CAPACITY
55 Figure 9. Evolution of container ships and typical dimensions EARLY CONTAINER SHIPS (1956 ) 17 METRES WIDE (BEAM) 20 METRES WIDE (BEAM) 137 METRES LONG 200 METRES LONG 8 METRES DEEP* 8 METRES DEEP* TEU CAPACITY TEU CAPACITY FULLY CELLUAR (1970 ) 20 METRES WIDE (BEAM) 215 METRES LONG 10 METRES DEEP* 1,000 2,999 TEU CAPACITY OLD PANAMAX (1980 ) 32 METRES WIDE (BEAM) 290 METRES LONG 11.5 METRES DEEP* 3,000 4,999 TEU CAPACITY OLD POST PANAMAX (1988 ) 40 METRES WIDE (BEAM) 300 METRES LONG 12 METRES DEEP* 5,000 7,499 TEU CAPACITY Largest ships regularly visiting the Port of Melbourne OLD POST PANAMAX PLUS (2000 ) 43 METRES WIDE (BEAM) 335 METRES LONG 13 METRES DEEP* 7,500 9,999 TEU CAPACITY NEW PANAMAX (2014 ) 49 METRES WIDE (BEAM) 366 METRES LONG 13 METRES DEEP* 10,000 12,999 TEU CAPACITY NEW POST PANAMAX (2006 ) 56 METRES WIDE (BEAM) 397 METRES LONG 13.5 METRES DEEP* 13,000 15,999 TEU CAPACITY ULTRA LARGE CONTAINER SHIP (2013 ) 59 METRES WIDE (BEAM) 400 METRES LONG 14 METRES DEEP* 16,000 22,000 TEU CAPACITY Source: Infrastructure Victoria, 2017 *Typical sailing draught 55
56 The life of a container ship and how they travel to and from Australia The bulk of world container trade occurs on the East West routes between Europe, Asia and North America. Australia, New Zealand, Africa and South America are serviced by the North South routes. Most of Australia s container trade is with ports in Asia. Most container services visiting Australia call at all three east coast ports: Brisbane, Sydney and Melbourne. A ship size restriction in one port becomes a restriction for all. It also means that ships arriving in Melbourne typically load and unload only per cent of their full capacity. The life of a typical container ship is 10 to 30 years. Every five years ships must undergo a major safety inspection required by certification agencies and maritime safety regulators. From about ten years onwards, shipping companies may decide to scrap ships after this inspection, rather than reinvest in refurbishing a ship that is becoming uneconomical due to its size or fuel costs. In practice, most container ships operate for between 15 and 20 years. The newest and largest ships are deployed on global East West routes. As ships get older, and new larger ships are built and deployed, shipping lines seek to redeploy the midlife ships to North South routes, which are the routes servicing Australia, New Zealand, Africa and South America. This is termed the cascade of large ships from East West to North South. Because the maximum life of a container ship is usually about 20 years, most ships currently sailing or on order will likely be scrapped by As such, we can only use forecasts for insight into the size of future ships. Figure 10. Global shipping routes Source: Infrastructure Victoria, adapted from Drewry, Container Ship Fleet Forecast and Maritime Economic Assessment, Infrastructure Victoria ADVICE ON SECURING VICTORIA S PORTS CAPACITY
57 Container ships are getting bigger Container ships at the top end of the size spectrum are getting bigger. Big ships are also becoming a larger percentage of the total ships in the global fleet. Figure 11 shows the evolution of container ship sizes since the 1960s, how many individual ships exist in each size class, and what size ships are being ordered for future deployment. Each grey dot represents a single ship, its year of launch and nominal container capacity. Grey dots are ships that have been launched (many of these have subsequently been scrapped); red dots are ships under construction or on order. Figure 11 clearly shows that ships sizes continue to increase and that this trend is accelerating. As ships become larger, fewer ship calls are needed to provide the same TEU capacity. Figure 11. Evolution of the world container fleet TEU Global container fleet as at January OLD POST PANAMAX, 300 metres Largest ships currently calling at Melbourne Under construction/ on order Year of build Source: Adapted by Infrastructure Victoria from Drewry, Container Ship Fleet Forecast and Maritime Economic Assessment,

58 The global shipping industry is highly competitive, and the move to bigger ships is driven by shipping companies always seeking to reduce the cost per TEU of moving a container (the slot cost ). Over the past decade, the global shipping market has suffered from oversupply. To try and maintain business or win new business, shipping companies have responded to this oversupply by ordering and building even bigger ships, in constant pursuit of lower costs, usually measured in cost per TEU. In open markets this is a strange industry response, with oversupply in an industry typically resulting in a rationalisation of firms. So far the shipping industry has resisted this trend, but we are starting to see more consolidation within the industry. The current oversupply has also led some shipping lines to form alliances, which lets them combine their business and send fewer, bigger ships on the same route. So far this process has been fluid, with alliances ceasing and reforming regularly. The increasing supply of large ships has resulted in some ships being scrapped after only ten years, and also in shipping companies seeking to accelerate the cascade of larger ships from East West to North South routes (for more information on the lifecycle of ship and the cascade effect, see page 56). Table 4. Container ships on order, January 2017 TEU capacity TEU capacity Number of vessels % of total TEU capacity on order 0 3, % 4,000 5, % 6,000 7,999 1 <1% 8,000 11, % 12,000 15, % >16, % Source: Adapted by Infrastructure Victoria from Drewry, Container Ship Fleet Forecast and Maritime Economic Assessment, 2017 Table 4 shows a breakdown of the container ships currently on order around the world. Almost all fall into two categories: small feeder ships of less than 4,000 TEU or large ships of greater than 8,000 TEU. Feeder ships are small ships used to service small ports in regional groups for example some Tasmanian and Pacific Island trade, which is only a small percentage of Port of Melbourne s trade. 58 Infrastructure Victoria ADVICE ON SECURING VICTORIA S PORTS CAPACITY
59 Ships currently visiting Australia The Port of Melbourne is currently the most constrained east coast port in terms of large ship access. The largest container ships regularly visiting the Port of Melbourne can carry a maximum capacity of about 7,000 TEU. These ships are about metres long and 40 metres wide. In the discussion paper Preparing advice on Victoria's future ports capacity, we listed the largest container ship to visit the Port of Melbourne so far as the Pangal, which has a capacity of 6,600 TEU, is 304 metres long, 40 metres wide and 12.5 metres deep. Since then, the largest capacity ship to visit the Port of Melbourne has been the MSC Ningbo, which has a capacity of 7,849 TEU, is 300 metres long, 42.8 metres wide and has a design draught of 15 metres. When it visited Melbourne, the MSC Ningbo sailed at a depth of 13.2 metres. As table 4 shows, very few ships are being built or are on order in this class. Most ships now on order are much larger, 8,000 12,000 TEU or 12,000+ TEU. The Port of Brisbane has already been visited by an 8,500 TEU capacity ship, and Brisbane could be upgraded for 11,000 TEU vessels with a reasonable investment. The length of Brisbane s approach channel is about 90 kilometres, which means that there would be a significant cost to dredge the channel to accept ships larger than 11,000 TEU. Port Botany in Sydney has also accepted an 8,500 TEU vessel. Port Botany can accommodate ships between 8,000 and 10,000 TEU, possibly larger with modest channel modifications. Shipping lines are regularly approaching Australian ports, including the Port of Melbourne, to accept vessels in the 8,000 10,000 TEU range. The Port of Melbourne does not currently service ships of this size. If all east coast ports could accept ships this size, they may become the standard size for east coast ports for the next couple of decades. It is possible that if one or two (Melbourne and Brisbane) ports on the east coast are constrained and one not (Sydney) then instead of running a loop service, shipping lines could shift to a hubbing model where all imports come directly to the hub (Sydney) and are transhipped onto smaller coastal vessels to reach other ports (Melbourne). This possible, but unlikely, scenario would increase the cost of shipping to and from the smaller ports relative to the hub. Current and future ability of ports to accept larger ships Shipping lines will always prefer to send the largest ship they can fill on a weekly basis in an attempt to reduce costs. Port infrastructure, however, limits the size of ships that are able to visit. Significant port investment is required to accept the larger vessels including dredging to deepen and widen channels, upgrading of wharf structures and bigger cranes. Ports may also need to extend or widen their berths. Ports may face financial, environmental or social constraints which stop them from upgrading facilities for larger ships. For example, many ports around the world stopped investing to deepen channels because it was becoming too costly and environmentally damaging. This has acted as a constraint on container ships getting deeper. In response, shipping lines have ordered wider and longer ships, rather than deeper. For instance, in 2000, the largest container ship in the world had an 8,000 TEU capacity with a maximum draught of 14.5 metres. By 2016 the capacity of the largest ship in the world had increased to 18,000 TEU, but its maximum draught was 15.5 metres, only a metre more than the much smaller capacity ship in Even though this ship has a maximum draught of 15.5 metres, its normal operating draught is between 13 and 14 metres. Port infrastructure and structural constraints also exist for vessel length and beam, which could limit the expansion of container ships in the future. For example, the length of ships transiting the Bosphorus Strait in Turkey is limited to 300 metres. Constraints such as these mean there will always be a need for smaller and mid-size ships in the global container fleet. Large ships may suit the shipping lines in isolation but given the supply chain costs and capital required to service large ships, they are not the most efficient or lowest cost option for supply chains moving in and out of Australia. 59
60 Shipping lines also seek to maintain market share and service frequency, and there may not be enough local cargo demand in the Australian east coast market to fill larger ships and maintain weekly or bi-weekly services. Lower costs per TEU is one of the main drivers for shipping lines to use large ships. To achieve savings, ships need to be almost full, with Drewy's assessment report suggesting this lower slot cost is only achieved if a ship is 88 per cent full or more. There may not be savings in the Australian market if there is insufficient cargo demand to fully utilise vessel capacity. Deploying larger ships could result in higher costs due to increased shipping costs driven by sub-optimal vessel capacity utilisation and/or higher infrastructure charges driven by the infrastructure upgrades required to handle very large vessels. Whilst much larger container vessels may suit shipping lines, this does not mean they will offer the most efficient, lowest cost option to the supply chain servicing international sea freight moving into and out of Australia. Draught of container ships visiting Melbourne At most ports dredging of channels and berths is needed so large ships can access the port. This is expensive and can have significant impacts on the environment so it is important to understand the draught of ships visiting the port to avoid unnecessary dredging. The design or maximum draught of a ship is the vertical distance from the waterline to the bottom of the hull when the ship is fully loaded with its maximum safe load. Container ships visiting Australian ports are never fully loaded and they carry a large number of empty containers so their actual draught at any time, termed the sailing draught, is less than the maximum draught. An analysis of container ships visiting Port of Melbourne, in AECOM's Navigation Study, shows that sailing draught is at most 80 to 90 per cent of the design draught. This means that ships are often sailing into Melbourne at 1 metre or more shallower than their design draught. On this basis we have used the typical sailing draught rather than the design draught to plan future port development. What size ship do we need to plan for? Does Victoria need to respond to shipping line requests to bring ever increasing ship sizes to Australia? We have considered two scenarios. Unconstrained scenario Governments, port operators and stevedores continuously upgrade port infrastructure at all three east coast ports to allow the largest and most efficient vessels to meet demand. This results in low shipping rates but requires significant capital investment in port infrastructure and an acceptance of the environmental and social impacts associated with infrastructure upgrades. Constrained scenario Melbourne and Victoria is a significant market for container imports and source of exports. If Port of Melbourne infrastructure is not upgraded, shipping lines will continue to service our market. Shipping lines may use older, smaller ships, or they may build a specific class of vessel to suit the Port of Melbourne. This is likely to increase supply chain costs for imports and exports passing through the Port of Melbourne. In the constrained scenario port infrastructure is progressively upgraded to accept an optimal size ship for the east coast of Australia, balancing demand and the world container fleet against the cost and impacts of infrastructure upgrades. Because ships call at all three east coast ports, the port with the lowest size constraint constrains all three. Matching the capacity at the three east coast ports would allow shipping lines to continue to offer efficient services with a pan-australia rate. In this scenario the growth of ship size visiting Melbourne is constrained to keep the older facilities at Swanson Dock commercially viable for international trade. If this is not done there is a risk of large trade volumes jumping quickly to Webb Dock because it can take larger vessels. We discuss Swanson Dock constraints in the Capacity of the Port of Melbourne section. Under this scenario ship sizes expand gradually up to a maximum of 14,000 TEU the largest sizes that can safely navigate through Port Phillip Heads with the existing channels. 60 Infrastructure Victoria ADVICE ON SECURING VICTORIA S PORTS CAPACITY
61 Future fleet forecasts Fleet forecasts have been prepared for the constrained and unconstrained scenarios taking into account current trade routes, forecast trade growth, the possibility of consolidation among shipping lines and the limitations of navigating into the Port of Melbourne. The forecast fleet spectrums are given in figures 12 and 13, and the maximum ship size in the forecasts is summarised in table 5. For more information on the fleet forecasts refer to the GHD Estimated capacity of the Port of Melbourne technical report. The constrained and unconstrained scenarios represent possible slow and rapid growth in ship size, respectively. Actual growth will likely be between these scenarios, depending on trade growth, Australian port regulation and infrastructure investment, and the evolution of the world container fleet. Cascading of container ships in the global fleet means that shipping lines want to bring larger ships, up to 10,000 TEU capacity, to Australia now if possible. The very largest ships in the global fleet, however, are unlikely to call in Australia in the next couple of decades. To achieve economies of scale, ships need to be close to full and without significant industry consolidation there is not enough demand to fill 18,000 TEU vessels for Australian services for decades. Table 5. Forecast maximum ship size (TEU) by year Year Constrained Unconstrained ,000 6, ,000 10, ,000 18, ,000 18, ,000 18, ,000 18,000+ Source: Adapted by Infrastructure Victoria from GHD, Infrastructure Victoria Second Container Port Advice Estimated Capacity of the Port of Melbourne, 2017 Melbourne and Victoria is a significant market for container imports and a source of exports. Shipping companies will continue to service this market with the largest ship they can. If the ship size is constrained, this may increase supply chain costs for imports and exports passing through the Port of Melbourne. Figure 12 shows that without service consolidation we are unlikely to see 18,000 TEU capacity ships before Figure 13 shows that with consolidation shipping companies may want to bring 18,000 TEU capacity ships as soon as Victoria does not necessarily need to respond to shipping company requests at that time. 61
62 Figure 12. Forecast fleet spectrum for the constrained case Victorian Ports Container Ship Size Spectrum by number of Victorian port calls Port of Melbourne Constrained/Equal Dock Use (no service consolidation) 3,000 2,500 2,000 Ship calls 1,500 1, <2,000 TEU Ship Size 6,000-7,999 TEU Ship Size 12,000-13,999 TEU Ship Size 18,000 & over TEU Ship Size ,000-3,999 TEU Ship Size 8,000-9,999 TEU Ship Size 14,000-15,999 TEU Ship Size ,000-5,999 TEU Ship Size 10,000-11,999 TEU Ship Size 16,000-17,999 TEU Ship Size Source: Adapted by Infrastructure Victoria from GHD, Infrastructure Victoria Second Container Port Advice Estimated Capacity of the Port of Melbourne, 2017 Figure 13. Forecast fleet spectrum for the unconstrained case Victorian Ports Container Ship Size Spectrum by number of Victiorian Port Calls Unconstrained (with service consolidation on north and east Asia and south-east Asia routes) 2,500 2,000 Ship calls 1,500 1, <2,000 TEU Ship Size 6,000-7,999 TEU Ship Size 12,000-13,999 TEU Ship Size 18,000 & over TEU Ship Size ,000-3,999 TEU Ship Size 8,000-9,999 TEU Ship Size 14,000-15,999 TEU Ship Size ,000-5,999 TEU Ship Size 10,000-11,999 TEU Ship Size 16,000-17,999 TEU Ship Size Source: Adapted by Infrastructure Victoria from GHD, Infrastructure Victoria Second Container Port Advice Estimated Capacity of the Port of Melbourne, Infrastructure Victoria ADVICE ON SECURING VICTORIA S PORTS CAPACITY
63 Ship size and trade split between Swanson and Webb Docks At the Port of Melbourne, international containers are handled at Swanson Dock and Webb Dock. The size of container ships that can access Swanson Dock is limited to about 7,500 TEU by the West Gate Bridge, Yarra Channel and width of the dock, as discussed in the Capacity of the Port of Melbourne section. These restrictions do not apply to Webb Dock. With relatively minor works Webb Dock could accept ships up to 14,000 TEU. Shipping lines prefer to use the largest ship they can fill on a given route. This means that without constraining the size of ships allowed to visit Webb Dock, there is a risk that larger ships will drive a rapid shift in trade from Swanson to Webb Dock, potentially leaving Swanson Dock underutilised. This is not in the interest of the state, the port lessee or the current stevedores as it brings forward in time extensive capital investments with little benefit for most in the freight and logistics sector, except for shipping lines. To maximise the capacity of the Port of Melbourne, reasonable constraints could be imposed to limit the size of ship able to visit the port. Imposing reasonable constraints on the size of ships visiting the Port of Melbourne ensures that the State leverages the significant sunk cost invested in the Port of Melbourne and supporting transport networks, and delays the need for a significant capital investment at Webb Dock or a second port. Figure 14 presents the forecast trade split between Swanson and Webb Docks, assuming that reasonable constraints on ship size are put in place in order to maintain trade share in Swanson Dock. Figure 14. Forecast annual trade at Swanson and Webb Dock assuming 50/50 share of Asia trades TEU 12,000,000 11,000,000 10,000,000 9,000,000 8,000,000 7,000,000 6,000,000 5,000,000 4,000,000 3,000,000 2,000,000 1,000, Webb Dock Swanson Dock Source: Adapted by Infrastructure Victoria from GHD, Infrastructure Victoria Second Container Port Advice Estimated Capacity of the Port of Melbourne,
64 In the constrained ship size scenario shipping routes and number of services to Melbourne initially remain as they are, with ship size gradually increasing as demand increases up to a point where the preferred optimum ship size can no longer access Swanson Dock. In our scenario this would occur about In 2029 the trade on the high volume Asia routes is split evenly, with ships of 7,500 TEU or less calling at Swanson Dock accounting for about 50 per cent of trade and ships of greater than 7,500 TEU calling at Webb Dock accounting for the other 50 per cent. Which technical reports should I look at for more information? GHD, Infrastructure Victoria Second Container Port Advice Estimated Capacity of the Port of Melbourne, 2017 Drewry, Container Ship Fleet Forecast and Maritime Economic Assessment, 2017 Infrastructure Victoria considers this a reasonable scenario because both the new operator of the Port of Melbourne and the existing Swanson Dock stevedores are likely to seek maximum returns on their respective investments by ensuring Swanson Dock remains highly utilised in the future. This scenario can be achieved through a combination of: strategic pricing by the operator across different terminals, based on the relative merits and drawbacks of each terminal staging the creation of additional container capacity at Webb Dock to match organic demand growth to avoid the creation of large tranches of excess capacity not allowing Swanson Dock stevedores to bid for new terminal space at Webb Dock. This approach would be consistent with the bidding parameters for the recently completed Port Capacity Project at Webb Dock. Given a relatively balanced shipping service supply and demand situation on Australian trades, the shipping lines are likely to be able to pass on the costs of deploying smaller than optimal container ships to Swanson Dock to exporters and importers on Asian trades. It is possible that there is enough trade to enable Australian east coast multi-port calling services from Asia to fragment into direct Swanson Dock smaller ship services, while also continuing with Australian east coast multi-port calling at Webb Dock with larger ships. This would mean that only Victorian Swanson Dock Asian trade importers and exporters pay the additional costs passed on by shipping lines. 64 Infrastructure Victoria ADVICE ON SECURING VICTORIA S PORTS CAPACITY
65 Recommendation 1 The Victorian Government should monitor key indicators relevant to all Victorian ports that impact planning and publish a report every five years. This report should be prepared for the purpose of identifying whether the Port of Melbourne has the ability to meet demand for 15 years or more. This reporting will provide regular, transparent monitoring of key indicators which may trigger action to develop additional port capacity or defer investment. The report should indicate whether the most current data and projections impact port capacity plans and assumptions. The indicators reported on should include: a. Container and bulk demand what the current and projected rate of demand growth is for all trades across Victorian ports. b. Container and bulk capacity what the current and planned capacity of Victorian ports is to meet the demand for all trades. c. Port of Melbourne operation key throughput and efficiency measures that are important planning factors, separately reported for Swanson Dock and Webb Dock, including: ship to shore crane rates average TEU per truck percentage of truck movements overnight rail mode share berth occupancy TEU exchange per vessel call. d. Ship size whether the size of ships calling at East Coast ports is increasing more or less than current assumptions, and whether there are changes to international ship size trends. e. Capacity enhancements that have been made at other Australian container ports, especially Brisbane and Sydney, with particular focus on the size limits of ships visiting those ports. f. Local traffic network assessment of the performance of key intersections related to Swanson and Webb Docks. g. Social and environmental conditions the results of air quality and noise monitoring programs by the Environment Protection Agency (EPA) around Port of Melbourne and key freight routes in the inner west of Melbourne (see Recommendation 5). h. Land-use and demographics the demographics and development rate of residential and industrial land around the Port of Melbourne and across the metropolitan area. 65

66 66 Infrastructure Victoria ADVICE ON SECURING VICTORIA S PORTS CAPACITY
67 When a second port will be required The Special Minister of State requested that Infrastructure Victoria provide advice on the capacity of Victoria s commercial ports. Managing the use of, and improving, assets we already have is often a more efficient and cheaper option than investing in new infrastructure. We used this principle of improving the existing asset of the Port of Melbourne as the starting point for gathering evidence on when a second container port is required. The need for additional port capacity will be driven by the growth in container trade. The evidence we have gathered on when a second container port will be needed is presented below. The key factors we considered and gathered evidence on are: landside supply chains that service the port, including road and rail links to the port possible improvements to increase container capacity within the Port of Melbourne environmental and social considerations other triggers for deciding when a second container port is needed. We then present our economic analysis and recommended development pathway for the Port of Melbourne. Port of Melbourne supply chains Why is this important? Before examining the potential capacity of the Port of Melbourne, we needed to understand how supply chains work to deliver or remove containers from the Port. This helped us understand whether the supply chains beyond the port gate can handle the number of containers that need to leave and arrive at the Port. Port of Melbourne supply chains Export and import commodities are transported to and from the Port to places where they are produced and consumed. Commodities are transported in containers by truck and by rail. The supply chains supporting the Port also have to organise the repositioning of empty containers. On the basis of our investigations, we recommend a second major container port is unlikely to be required before

68 Import supply chains Melbourne is an import-dominated port so import supply chains drive investment and land use decisions. Most containerised imports are manufactured products. They are either ready to use or parts that come to Victoria for a value-add process prior to use. The import supply chain commences with an overseas manufacturer or company selling to an Australian buyer. The Australian buyer arranges to have the goods delivered, culminating in the arrival of the goods at their final destination, and the return of the empty container. Often transport companies do not deliver to the client or distribution centre directly from the port but stage the box in a transport depot first. About 70 per cent of import boxes are staged in greater metropolitan Melbourne. Staging is common because the port and transport companies work 24 hour, seven day operations but many factories, wholesalers and distribution centres are only open five days a week during business hours. Night operations are likely to increase as port volumes increase, as trucks seek to avoid increasingly congested peak periods and volumes require containers to be moved through the port gate 24 hours a day, seven days a week to meet demand. Over 80 per cent of imports through the Port of Melbourne are delivered within metropolitan Melbourne. A substantial number go via a facility where full shipments are broken into smaller packages, especially for delivery to retail. The place where this occurs is called a distribution centre or warehouse. Our supply chain analysis examined the following import scenarios: Scenario 1: container originates at a port, interim move to a staging facility, unpacked at a distribution centre, proceed to a factory for processing, final destination is a retailer or an empty container park. In this scenario the container may also move from the container port straight to the distribution centre without being staged. Scenario 2: container originates at a port, interim move to a staging facility, unpacked at a distribution centre and the final destination is a retailer or empty container park. In this scenario the container may also move from the container port straight to the distribution centre without being staged. Scenario 3: container originates at a port, interim move to a staging facility, proceed to a factory for processing, final destination is a retailer or an empty container park. In this scenario the container may also move from the container port straight to the distribution centre without being staged. 68 Infrastructure Victoria ADVICE ON SECURING VICTORIA S PORTS CAPACITY
69 Figure 15. Import supply chains at the Port of Melbourne 1. Port imported Full container Staging facility Full container Full container direct to distribution centre Distribution centre for unpacking Pallets Empty container Factory for processing Empty container park Shop 2. Port imported Full container Staging facility Full container Full container direct to distribution centre Distribution centre for unpacking Pallets Empty container Shop Empty container park 3. Port imported Full container Staging facility Full container Full container direct to distribution centre Source: Deloitte, Infrastructure Victoria Second Container Port Advice supply chain assessment methodology, 2017 Factory for processing Pallets Empty container Shop Empty container park 69
70 Export supply chains Port of Melbourne The export supply chain is a reverse of the import supply chain, with some key differences. Because Melbourne is import dominated, shipping lines compete for back loads of empty containers to help cover the costs of ships travelling back to their origins. Empty containers are moved at the shipping line s cost. Shipping lines compete aggressively for export containers, because even at a discounted rate they generate more revenue than empty containers. Export supply chains are less Melbourne-centric. 46 per cent of exports are packed in regional Victoria or interstate. Exports are also staged less than imports. We assume that the supply chains for a second port location should aim to avoid cost increases for Victorian exporters where possible. Exporters are particularly sensitive to increasing supply chain costs as they are competing in global markets, are subject to currency changes and many of the commodities are bulky and have low profit margins. Our supply chain analysis examined the following export scenarios: Scenario 1: empty container moves to commodity origin for packing, moves to intermodal terminal(s), final destination port. Scenario 2: empty container and commodity move to distribution centre or factory for processing, move to intermodal terminal(s), final destination port. Scenario 3: empty container moves to port, final destination. Figure 16. Export supply chains at the Port of Melbourne 1. Empty container park Empty container Origin for packing Full container Intermodal terminal for mode transfer Full container Full container Intermodal terminal for mode transfer Full container Port export 2. Origin for processing Pallets Empty container Distribution centre for packing OR Full container Intermodal terminal for mode transfer Full container Full container Intermodal terminal for mode transfer Full container Port export Empty container park Factory processing 3. Empty container park Empty container Port export Source: Deloitte, Infrastructure Victoria Second Container Port Advice supply chain assessment methodology, Infrastructure Victoria ADVICE ON SECURING VICTORIA S PORTS CAPACITY
71 Land use To help understand the possible location of industrial facilities that import and export products, we used the data on current and planned industrial land prepared by the Department of Environment, Land, Water and Planning s Urban Development Program and Plan Melbourne data. Freight flows to each precinct are weighted according to the precinct s size and employment estimates for manufacturing-oriented industries (i.e. manufacturing, transport and warehousing, and wholesale trade). The transport and freight industry considers a number of key criteria when making location choices: cheap industrial land that is preferably flat and without residents nearby good access to transport links optimal distance to customers and the supply chain centre of gravity (balancing the distance between where goods are picked up and where they need to be delivered). Table 6 presents all the industrial buildings across Melbourne by number and total area. This shows that the north, west and south all have significant areas of industry but that the west has the largest buildings of the type commonly used by warehousing and distribution facilities. This data indicates that the west and north are significant freight hubs. Future land availability is likely to continue this trend. Table 7 shows land that is currently zoned for industry and land that will be zoned for industry in future Precinct Structure Plans. Table 7 shows that the west and north of Melbourne are likely to have more land available that suits freight industry needs. Table 6. Number of buildings, area and size categories of buildings within State Significant Industrial Precincts, Metropolitan Melbourne, State significant industrial precincts (SSIP) 0 to 1,000 m 2 1,000 to 5,000 m 2 5,000 to 10,000 m 2 10,000 to 25,000 m 2 25,000 m 2 plus Total Number Area (m 2 ) Number Area (m 2 ) Number Area (m 2 ) Number Area (m 2 ) Number Area (m 2 ) Area (m 2 ) West 3,614 1,303,000 1,238 2,731, ,582, ,755, ,006,600 10,378,600 Inner , , , , ,000 1,044,600 North 5,162 2,012,000 1,237 2,531, , ,125, ,100 7,343,900 South 5,095 1,776,600 1,514 3,217, ,376, ,479, ,500 8,583,400 Pakenham/Officer , , , , ,000 Hastings , , , , , ,100 TOTAL SSIPs 15,103 5,456,500 4,266 9,115, ,905, ,598, ,962,400 28,038,600 Source: Department of Environment, Land, Water and Planning Urban Development Program, State Significant Industrial Precincts 2016 Table 7. Current vacant industrial land and proposed industrial land, State Significant Industrial Precincts, West State Significant Industrial Precinct North State Significant Industrial Precinct South State Significant Industrial Precinct Pakenham/Officer State Significant Industrial Precinct Hastings State Significant Industrial Precinct Vacant Land (Ha) Proposed Industrial (Ha) Vacant Land (Ha) Proposed Industrial (Ha) Vacant Land (Ha) Proposed Industrial (Ha) Vacant Land (Ha) Proposed Industrial (Ha) Vacant Land (Ha) Proposed Industrial (Ha) 1,857 1,605 1,024 1, Source: Department of Environment, Land, Water and Planning Urban Development Program, Metropolitan Melbourne
72 How is population growth changing the shape of Melbourne? After a long period of steady growth in Melbourne s east and south-east, growth is increasing in Melbourne s west and north. What does this mean for the shape of Melbourne and the location of a second container port? The government s most recent population forecast, Victoria in Future 2016, predicts that Melbourne s west will continue to accommodate significant growth. The historical shape of Melbourne, however, is skewed. In the south-east there is solid urban development out to areas like Pakenham, Cranbourne and Officer, which are all over 50 kilometres from the city and continue to grow. In the west, areas like Rockbank, Wyndham Vale and Tarneit are only about kilometres from the city, with much less density between them and the city. The current and forecast population distribution is shown in table 8. As Melbourne s population spread becomes more balanced, there will be significant freight demand across the metropolitan area. This means regardless of deciding to locate a port at either Bay West or Hastings, we will need to plan for significant cross-city movements as goods travel between the port, warehouses and retail locations. A port at Hastings will generate more warehousing and container unpacking in the south-east. This will create significant east to west movements from these warehouses to industry and population in the west, especially as retail demand grows to service the growing population in the north-west. A port at Bay West will generate significant west to east movements as warehousing consolidates in the west and north. This means cargo from unpacked containers will need to be moved east to service the significant population and retail centres in the south-east. In either case, planning for increased cross-city movements will be an important part of planning a second container port. Table 8 demonstrates that even with the north-west growing at nearly twice the rate of the south-east, the historical distribution of Melbourne s population means the south-east is growing from a much larger base, and so the geographical population centre of Melbourne will remain in the south-east. Table 8 shows, however, that the population spread of Melbourne is forecast to become more balanced over time. Table 8. Melbourne current and forecast future population distribution (number of people) Region Annual percentage change North-west Melbourne % South-east Melbourne % Difference Source: Adapted by Infrastructure Victoria from Victoria in Future 2016 data. 72 Infrastructure Victoria ADVICE ON SECURING VICTORIA S PORTS CAPACITY
73 Port of Melbourne road and rail links beyond the port gate Why is this important? We needed to model key intersections and the broader traffic network to understand whether supply chains and the transport network outside the port gate would be able to handle capacity increases at the Port of Melbourne. Contrary to public perception, freight vehicles contribute little to congestion. Freight vehicles are less than 20 per cent of metropolitan traffic, and port trucks are an even smaller percentage of this. Even in intersections directly outside port gates, during the busiest times of the day, port trucks account for about 10 per cent of the traffic. Overnight port traffic is proportionally more (above 50 per cent) but only 10 per cent of the total traffic volumes occur at night. Microsimulation of the local road network We have modelled key intersections for Swanson and Webb Docks to understand whether the road network outside the port can handle capacity increases within the port. Figure 17 provides an overview of the landside port capacity. Webb Dock Our modelling demonstrates Webb Dock can operate at a maximum of 4.9 million TEU per year with the existing road network, assuming 50 per cent night operations and some minor upgrades to West Gate Freeway onramps (with a capital cost of about $100 million). At this level the network is at total capacity and is close to flow disruption or network breakdown at all times. This is not a viable long-term position, based on the assumption that the mix of port and non-port traffic remains the same. Congestion factors start to become an issue around 3.2 million TEU at Webb Dock. We think a realistic volume for Webb Dock with expanded night operations prior to a freight link is about 4 million TEU. The two key intersections for trucks accessing Webb Dock are Todd Road/Cook Street and Todd Road/Webb Dock Drive which provide access to and from the West Gate Freeway. Running a microsimulation of traffic flows through these intersections indicates it is possible for the landside network at Webb Dock to handle the traffic flows, provided that there are increases in truck night operations and upgrades to local interchanges and onramps. VicRoads uses a Level of Service qualitative measure to assess the quality of traffic flows, based on the significance of congestion delays. Level of Service is measured using letters A through F. A represents free flow conditions, F represents a complete breakdown. The VicRoads target for a road or intersection is a minimum threshold of Level of Service D during peak hours. Level of Service D refers to a traffic state close to the limit of stable flow and approaching unstable flow. All drivers are severely restricted in their freedom to select their desired speed and to manoeuvre within the traffic stream. The general level of comfort and convenience is poor, and small increases in traffic flow will generally cause operational problems. At the moment, in peak periods, traffic levels for the key Webb Dock intersections accessing the West Gate Freeway are approaching or beyond Level of Service D. There is, however, excess capacity at night at the local intersections. With 50 per cent of truck movements occurring overnight, these intersections could have a theoretical capacity of 4.5 to 4.9 million TEU per year. This maintains a level of operation that is close to the limit of stable flows 24 hours a day. At this level, incidents would result in delays for port and non-port traffic through the day. This is not a viable long-term position and we assume that 4 million TEU should be used as the practical upper limit. We are assuming that 50 per cent night operations is a maximum upper limit achievable by the freight industry. It represents a significant change in current supply chain arrangements that would likely take time and possibly require direct or indirect government intervention to achieve. Should night operations only account for 24 per cent of movements, local intersections would only be able to accommodate about 2 million TEU capacity at Webb Dock and maintain Level of Service D. If night operations increased up to 30 per cent of movements, then local intersections could accommodate about 3.2 million TEU capacity at Webb Dock and maintain Level of Service D. 73
74 Swanson Dock The West Gate Tunnel is likely to provide a substantial boost to road capacity at Swanson Dock. The completion of the West Gate Tunnel and a minor upgrade to the Sims Street/Footscray Road interchange and underpass (with a capital cost of about $70 million) means Swanson Dock can grow up to a 4 million TEU capacity without increasing truck night operations. Based on the VicRoads Level of Service D standard, an achievable overnight increase for Swanson Dock from the current 28 per cent up to 50 per cent maintains enough intersection capacity to accommodate a capacity increase at Swanson Dock of about 6 million TEU. The social impacts of a possible increase in night operations at Webb and Swanson Dock would need to be considered. To support greater truck efficiency, which is the average amount of TEU carried on each truck trip, there may need to be more investments on the road network to allow High Productivity Freight Vehicles (HPFV). HPFVs are not suitable for all parts of the supply chain, especially the last mile delivery to retail centres, but are very good for either the export move to a port or the first move from a port to a staging area or distribution centre. Figure 17. Landside port capacity overview Swanson Dock 2.2m 3.0m 4.4m 6.4m 28% 10,400 Medium Construction of West Gate Tunnel 28% 11,300 Medium Sims Street upgrade, overnight % 35% 15,900 High Major shift to overnight transport and efficiency 50% 22,500 High 10% 10% 10% 10% Webb Dock 0.3m 2.0m 3.2m 4.0m 8.0m 10% 2,600 Medium VICT, 1.5 TEU per truck 24% 7,600 High WGF ramp upgrades, truck volumes distributed more evenly 0% 0% 0% 0% 10% 30% 10,800 Extreme Large overnight % 50% 15,500 High Freight Link to West Gate Tunnel 50% 21,000 High TEU million/year Overnight movements Daily trucks Traffic congestion Rail mode share percentage Possible transport changes to meet demand prior to considering the economic, social and environmental impacts. Source: Deloitte/Jacobs, Infrastructure Victoria Second Container Port Advice port landside transport modelling, Infrastructure Victoria ADVICE ON SECURING VICTORIA S PORTS CAPACITY
75 Port of Melbourne supply chain costs For metropolitan importers and exporters, the Port of Melbourne is forecast to have lower supply chain costs in 2046 than if the port was to move to either Bay West or Hastings. We have used 2046 to model our supply chain costs because that is the last year detailed traffic projections are available in the State s transport model. We have used this modelling to understand the relative difference in supply chain costs. We consider that the relative difference is likely to remain similar over the period to For most regional exporters and importers, it is cheaper to access Bay West than the Port of Melbourne or Hastings. The current road and rail configuration in Victoria means that all regions except for Gippsland are closer to Bay West or have a less congested trip to Bay West then they do to the Port of Melbourne. Supply chain costs are heavily influenced by distance. Because Hastings is further away from established supply chains than either the Port of Melbourne or Bay West, it incurs higher supply chain costs. Table 9. Import supply chain costs (2046) Port of Melbourne Bay West Hastings Avg. Cost per TEU Avg. Cost per TEU Avg. Cost per TEU Metropolitan $450 $500 $640 Regional $1,035 $918 $1,011 Source: Deloitte, Infrastructure Victoria Second Container Port Advice. Supply chain assessment methodology, 2017 Table 10. Export supply chain costs (2046) Port of Melbourne Bay West Hastings Hastings Minimum rail Avg. Cost per TEU Avg. Cost per TEU Avg. Cost per TEU Metropolitan $266 $387 $501 $501 Regional $606 $572 $610 $817 Avg. Cost per TEU Note: The different options for providing rail access at Hastings are discussed in the section about where a second container port should be located. Source: Deloitte, Infrastructure Victoria Second Container Port Advice. Supply chain assessment methodology,
76 This is consistent with our transport modelling that shows Port of Melbourne has a lower overall impact on the entire transport network than either of the alternative port locations. This can be explained by the port s proximity to the CBD, the fact that the Port of Melbourne is an import dominated port, and that well over 80 per cent of imports are destined for the metropolitan area. Melbourne CBD is the largest activity centre in Victoria and is the largest consumer of finished imported goods. This reduces total average kilometers and time travelled in supply chains. Moving the port to Bay West reduces kilometres and time travelled for the significant number of exporters located in Victoria s north and west, and makes Bay West a cheaper location for most exporters compared to the Port of Melbourne and Hastings. It is also worth noting that the current and likely future road and rail access to the Port of Melbourne for exporters in Hume is across the top of the city and in through the west. These exporters would also benefit from a port at Bay West relative to Hastings. Infrastructure Victoria recognises, however, that a Bay West port location would disadvantage exporters in Latrobe-Gippsland, and that this region would be better serviced by a Port at Hastings, compared to the Port of Melbourne or Bay West. Figure 18. Exports origins by volume SA4 Region By export volume (TEUs) ,000 to 500, ,000 to 300, ,000 to 200,000 50,000 to 100,000 North North West West Shepparton Shepparton Bendigo Bendigo Hume Hume Hume Ballarat Ballarat Melbourne Melbourne -- Inner Inner Warrnambool Warrnambool and and South South West West Latrobe -- Gippsland Gippsland Latrobe Geelong Geelong Source: Deloitte, Infrastructure Victoria Second Container Port Advice supply chain assessment methodology, Infrastructure Victoria ADVICE ON SECURING VICTORIA S PORTS CAPACITY 20,000 to 50,000 10,000 to 20,000 0 to 10,000
77 Rail access The main rail services at or adjacent to the Port of Melbourne include: regional intermodal trains grain trains some steel train operations associated locomotive provisioning and maintenance movements. Victoria s main interstate rail facilities are located at Dynon, just north of Swanson Dock. Port rail facilities are linked to Dynon where there is a mix of port and non-port rail freight operations. Rail mode share at the Port of Melbourne is about 10 per cent. Currently there is no significant movement of containers around metropolitan Melbourne on rail. The amount of network capacity available for more port freight trains in the future depends on growth in the public transport system and in interstate and regional freight trains. Trains to the south-east have to use the broad gauge system mainly used by public transport. Trains to the west and north use the standard gauge network mainly used by freight. A key interface point and potential network constriction is the Sim Street Junction just north of Footscray Road and the port. This junction is an interface for freight trains to and from the port, interstate freight trains to the Dynon Terminals and interstate passenger trains to Southern Cross. The implementation of the metropolitan intermodal system or rail port shuttle operations has been the subject of significant planning, although minimal services currently operate to the port. Current capacity to the west of Melbourne on standard gauge can provide for about eight (one way) daily trips and at least this capacity is also available on the broad gauge to the south-east of Melbourne, providing capacity for 300,000 to 400,000 TEU in the short term and the period to about Key issues for scheduling of port rail shuttle trains on the existing networks involve avoidance of peak periods and agreed schedules around passenger and potential higher priority trains. The capacity available on the networks is likely to provide some challenges in the future. If the port rail shuttle system can be established, however, projects to increase capacity may be viable when demand for services nears capacity limits. We believe that an important part of increasing capacity at Swanson Dock requires the establishment of the Metropolitan Intermodal System, also known as the Port Rail Shuttle. Rail should become part of the network that moves containers around metropolitan Melbourne. Which technical reports should I look at for more information? Deloitte, Infrastructure Victoria Second Container Port Advice supply chain assessment methodology, 2017 GHD, Infrastructure Victoria Second Container Port Advice Estimated Capacity of the Port of Melbourne, 2017 Jacobs, Infrastructure Victoria Second Container Port Advice port landside transport modelling,
78 Opportunities to expand capacity at the Port of Melbourne Why is this important? Understanding the current capacity at the Port of Melbourne is critical to be able to provide advice about when Victoria will need a second container port. In providing advice we have considered evidence on: how port capacity could be increased how much these capacity increases would cost whether any capacity increases would affect supply chain costs and transport networks how residents and the environment would be affected. The Port of Melbourne today The Port of Melbourne is Australia s largest container port, handling 2.64 million TEU in By comparison, in Port Botany handled 2.3 million TEU and the Port of Brisbane 1.1 million TEU, while the ports in Fremantle and Adelaide are much smaller. Port of Melbourne land is shown in figure 19. The Port of Melbourne has a number of precincts which handle different types of cargo, including international containers, Tasmanian trade, dry bulk, break bulk and liquid bulk. The remaining Port of Melbourne land is used for other portrelated activities such as truck and rail arrival and loading areas, container storage, administration, maintenance and staff facilities. As we gathered our evidence, we considered other trades which could be moved to provide more space for handling international containers. For instance, we considered the potential to relocate trades such as automotive or Tasmanian trades, either within the Port of Melbourne s existing land or to another Victorian commercial port. This paper is focused on container capacity. To determine whether other trades can be relocated from the Port of Melbourne to increase container capacity we need to understand the capacity at the other Victorian ports and their supporting supply chains. The key trades of liquid bulk, bulk break and automobiles, along with the Bass Strait trade, all have modest rates of growth similar to the growth indicated in our TEU demand forecasts. More information on our review of non-containerised demand forecasts can be found in the Deloitte Container trade forecasts for Victoria report. Portland, Geelong and Hastings all have the capacity to increase the volumes of their current trades. They all also have capacity to take new trades, especially Hastings and Geelong. There is also substantial capacity for the Port of Melbourne to handle more bulk trades at its specialised bulk terminals. Overall, Victoria is well served with bulk port capacity and so all trades can be serviced for decades. The Port of Melbourne currently occupies 510 hectares of land. Our concept designs for possible new ports at Bay West or Hastings only require about 240 hectares of land. This difference is mostly because we have focused on international container terminals to supplement or replace capacity at the Port of Melbourne, rather than a transfer of all Port of Melbourne activities to a new port. Our main focus is on the container terminals which are located at Swanson Dock (East and West), and Webb Dock East, where a new international container terminal opened in January The Port of Melbourne s current container handling capacity is about 5 million TEU per year, split between the capacity to handle about 3-4 million TEU a year at Swanson Dock East and West (depending on the yard equipment each stevedore chooses to use) and the ability to handle about 1.4 million TEU per year at the new Webb Dock terminal. 78 Infrastructure Victoria ADVICE ON SECURING VICTORIA S PORTS CAPACITY
79 THE STRAND Figure 19. Port of Melbourne today CREEK STON Y PILGRIM STREET STONYCREEK HYDE STREET YARRA RIVER MARIBYRNONG RIVER KENZIE ROAD MAC COODE ROAD SWANSON DOCK YARRA RIVER FOOTSCRAY ROAD LORIMER STREET TURNER STREET WEST GATE FREEWAY CITYLINK CITYLINK MOONEE PONDS CREEK LORIMER STREET YARRA RIVER HALL STREET WEST GATE WEBB DOCK DRIVE TODD ROAD FREEWAY PLUMMER STREET PORT MELBOURNE BAY STREET WEBB DOCK YARRA RIVER NORTH ROAD THE STRAND WILLIAMSTOWN ESPLANADE LEGEND Urban Area Freeway Legend Arterial Port of Melbourne Existing Uses Meters Map Projection: Transverse Mercator Horizontal Datum: GDA 1994 Grid: GDA 1994 MGA Zone 55 Coode Island / Maribyrnong (Bulk Liquid) Holden Dock (Bulk Liquid) Newport Precinct Urban Areas Appleton Dock Precinct - Freeway (Break Bulk & Grain) Arterial Paper Size A ,000 Port of Melbourne Existing Uses South Wharf Precinct (Break Bulk Cement Tugs) Station Pier (Passengers) Appleton Dock Precinct (Break Bulk & Grain) Coode Island / Maribyrnong (Bulk Liquid) Holden Dock (Bulk Liquid) Newport Precinct G:\31\34508\GIS\Maps\Deliverables\ A4P-BulkMapper.mxd [KBM: 43] Job Number Revision B Date 09 Feb Whilst every care has been taken to prepare this map, GHD (and DATA CUSTODIAN) make no representations or warranties about its accuracy, reliability, completeness or suitability for any particular purpose and cannot accept liability and responsibility of any kind (whether in contract, tort or otherwise) for any expenses, losses, damages and/or costs (including indirect or consequential damage) which are or may be incurred by any party as a result of the map being inaccurate, incomplete or unsuitable in any way and for any reason. Data source: DELWP, VicMap, 2016; GHD, 2016 Created by: savenables Swanson Dock - East (Containers) Swanson Dock - West (Containers) Swanson/Appleton/Victo... Dock Precinct Victoria Dock (General Cargo) Webb Dock - East (Containers) South Wharf Webb Dock Precinct - East (Bass Strait) (Break Bulk Cement Tugs) Station Pier (Passengers) Swanson Dock East (Containers) Webb Dock - West (Automobiles) Webb Dock Precinct Breakwater & Gellibrand Piers (Bulk Liquid) Yarraville Berths (Bulk) Yarraville Precinct Infrastructure Victoria Ports Advice Webb Dock East (Containers) Webb Dock East (Bass Strait) Webb Dock West (Automobiles) Swanson Dock West (Containers) Port of Melbourne Land Webb Uses Dock Precinct Figure Lonsdale Street Melbourne VIC 3000 Australia T F E melmail@ghd.com W Swanson/Appleton/ Breakwater & Gellibrand Victoria Dock Precinct Piers (Bulk Liquid) Victoria Dock Yarraville Berths (Bulk) (General Cargo) Yarraville Precinct Source: Adapted by Infrastructure Victoria from GHD, Infrastructure Victoria Second Container Port Advice Estimated Capacity of the Port of Melbourne,
80 Possible capacity improvements at the Port of Melbourne Capacity at the Port of Melbourne can be progressively increased with infrastructure investments in the channels, terminals and transport networks, and improvements in operating procedures. The sequence and timing of these upgrades will depend on future trade growth, vessel sizes, transport network development and congestion levels. We have identified a number of possible options to further increase container capacity at the Port of Melbourne. Identifying possible options helped us answer the first part of our question when are we likely to need a second container port in Victoria? While all of the capacity expansion options we have identified are possible, we are not recommending that they should all be done. This first phase of our work was about identifying all the investments that could be made to expand Port of Melbourne capacity, recognising that we should first explore options to get the most out of our existing infrastructure. Port capacity is determined by the interaction of different factors which can be grouped as: maritime approaches terminal operations (including berth, yard and gate capacity) landside transport networks. All the possible capacity enhancements have a cost to complete, some of them incurring significant capital costs, while others are operational and increase costs in the supply chain. Some of these costs will be borne by the port operator and stevedores and some will be borne by government or the logistics industry because they relate to the transport network outside the port gate. The cost of capacity enhancement may provide a trigger for deciding to invest in a second port. We estimated the capital costs of the possible capacity enhancements in line with the Department of Treasury and Finance's high value/high risk guidelines. The guidelines set out a four stage process for approving projects with a total estimated investment of over $100 million. The first stage of the guidelines, 'conceptualise', require cost estimates to be made within an order of magnitude of -40/+60. This order of magnitude has been applied to our cost estimates and means that the actual cost could be between 40 per cent less or 60 per cent more than our cost estimate. This certainty range is a commonly accepted practice for our level of study. We recognise that these estimates are high level and would need significant re-examination prior to starting a project. We have used the same methodology for developing cost estimates for a new port at either Bay West or Hastings. We are confident these cost estimates are robust enough to be used for comparison. Cost estimates in this section are capital cost only, not including operational costs. The capital costs are in 2017 dollars with no discounting applied. For detailed descriptions and costs of potential capacity enhancements refer to the GHD Estimated Capacity of the Port of Melbourne technical report. Swanson Dock constraints Swanson Dock is an indented dock on the north side of the Yarra River, upstream of the West Gate Bridge. Built between 1966 and 1972, it was Melbourne s first dedicated container dock. Swanson Dock is about 900 metres long and 210 metres wide. Two stevedores operate the container terminals Patrick operates three berths at Swanson Dock East and DP World operates three berths at Swanson Dock West. The largest vessels calling at Swanson Dock are Post Panamax ships with a capacity of between 5,000 and 7,500 TEU. Swanson Dock is serviced by road and rail. Each terminal has its own truck waiting and loading areas. Trucks are required to book slots to enter the port and are given one hour windows for pick up or deliveries. Slots are booked to help manage workload over the day and to reduce the number of trucks waiting to enter the port to avoid queuing congestion. The main rail yards are located to the north of Footscray road in the Dynon precinct, with rail sidings servicing Swanson West, East and Appleton Dock. Rail sidings in the port cater for trains up to 1,500 metres, however, they need to be broken up as existing sidings are a minimum length of 560 metres. About 10 per cent of Port of Melbourne trade is moved by rail - essentially all of it trade from regional Victoria, South Australia or southern New South Wales. Rail does not handle any metropolitan freight. Further details of the terminals and analysis of capacity is given in the technical report GHD Estimated Capacity of the Port of Melbourne technical report. 80 Infrastructure Victoria ADVICE ON SECURING VICTORIA S PORTS CAPACITY
81 Maritime approaches Swanson Dock s major constraints relate to maritime approaches, rather than terminal infrastructure or transport connections, such as crane capacity and space for stacking containers. Width the dimensions of Swanson Dock, particularly its width, constrain the number of large ships that can be berthed in the Dock at once. To use all three berths on both sides, there needs to be room for a ship to be moored on either side of the dock, and room for a ship to pass in between with its tug boats. Tug boats are compulsory for all ship movements in and out of Port of Melbourne terminals. Under its current configuration, Swanson Dock can operate with six 5,000 TEU ships at berth. It is possible to fit larger ships of about 7,500 TEU, but accommodating these ships reduces the availability of the other berths, limiting the number of ships that can be serviced. Swing basin the Swanson Dock swing basin is limited to ships about 320 metres long, equivalent to about 7,000 to 8,000 TEU ships. The West Gate Bridge the air draught of the West Gate Bridge is 50.1 metres at Highest Astronomical Tide. This air draught is not a constraint at the moment, but will ultimately prevent access to Swanson Dock for ships with a capacity of greater than about 9,000 TEU. Speed and beam restrictions in Yarra Channel the width and depth of the Yarra River means ships with a capacity greater than about 7,500 TEU can generate large pressure waves as they travel up the channel. Pressure waves travel ahead of the ship and can be a hazard to infrastructure and other vessels up river. There are significant constraints to widening or deepening the Yarra to reduce the impact of pressure waves. Existing onshore infrastructure restricts widening opportunities, while multiple service and pipeline crossings below the river make deepening difficult. Furthermore, the channel is one way, which limits the number of ships that can transit each day. The height of the West Gate Bridge and the width and depth of the Yarra Channel are hard constraints that cannot be easily overcome, and we assume no further change to either constraint. As a result, even with the possible enhancements described in the next section, we assume the practical limit to ship size in Swanson Dock is about 7,500 TEU. Terminal operations The maritime approaches limit Swanson Dock s ultimate capacity. At the moment, we expect Swanson Dock s capacity is limited to about 3 million TEU per year by the yard capacity, which uses straddle carriers to stack containers over a total stack area of 51 hectares. Berth capacity is estimated at 3.4 million TEU per year, limited by the berth length the quay lines are too short to fit three ships of 300 metres each and by the number of ship to shore cranes. These constraints could be lifted to increase capacity to about 4 million TEU per year with further investment in operating equipment to improve land and berth productivity. Gate capacity is not a limiting constraint on the capacity of Swanson Dock, and can be increased readily if required. Landside transport network The transport networks outside the port gate should continue to function well up to about 3 million TEU per year, assuming the construction of the West Gate Tunnel. Our modelling shows that beyond about 3 million TEU per year, additional trucks accessing the port would need to progressively shift to night operations and there would need to be some intersection enhancement to service trucks heading east from Swanson Dock. On-dock rail currently handles about 10 per cent of containers for Swanson Dock. Swanson Dock possible enhancements There are a number of enhancements to the berth, yard and landside transport network capacity at Swanson Dock which could increase capacity up to about 5 million TEU per year, if there was enough trade on ships in the 5,000 to 7,500 TEU range to fill this capacity. The layout of Swanson Dock and possible enhancements are shown in figure 20. Berth capacity increase the number of ship to shore and straddle carriers (capital cost about $20 million per crane) improve the productivity of ship to shore cranes lengthen the basin 100 metres to the north ($165 million) and add five additional ship to shore cranes ($100 million) 81
82 Salmon St Yard capacity expand footprint of container stacks to full area available in terminal ($70 million) add on-dock intermodal rail terminal ($70 million) and implement Melbourne Intermodal System (rail port shuttles to suburban terminals) switch container stacking system from straddle carriers to higher productivity system Landside network capacity upgrade Sims Street/Footscray Road intersection ($70 million) increase proportion of truck night operations Figure 20 shows the location of each enhancement that could increase the capacity of the berth, yard or landside transport network. All of these enhancements would be needed to reach the ultimate capacity. Swanson Dock could also be widened and the swing basin enlarged so the dock could handle six 7,500 TEU ships at once ($640 million to widen the dock by 70 metres and rebuild the quay and terminal at Swanson Dock East, including yard modification). This would not provide a major increase in the theoretical capacity, but would allow Swanson Dock to achieve higher berth occupancy and remain competitive with Webb Dock for longer in a market with increasing ship size. The maximum ship size accessing Swanson Dock would still be constrained by the Yarra Channel. We have identified a possible sequence of enhancements and an investment pathway to reach a theoretical capacity of 5 million TEU per year shown in figure 22. This is a theoretical exercise and is not the only plausible sequence. It is likely that other factors, such as the limits on marine approaches or environmental and social impacts, will prevent Swanson Dock from reaching this theoretical capacity. Figure 20. Swanson Dock layout and possible capacity enhancement measures Dynon Rd yde St istow St Napier St Moreland St 1 Dahlenb u rg St Sims St 3 Coode Rd 5 Dock Link Rd 4 Footscray Rd 1. Connect to Western Distributor 2. Expand footprint of container stacks/ switch to alternative yard system/ add additional cranes 3. Upgrade Sims Street Footscray Road intersection 4. Add intermodal rail terminal 5. Close Coode Road and extend basin 100 metres to the north 6. Widen Dock by 70 metres on west side Whitehall St Appleton Dock Rd Docklands Dr Wurundjeri Way La Trobe St ackenzie Rd M Citylink Harbour Esp Bourke St Lorimer St Collins St Ingles St Todd Rd Turner St Legend Appleton Dock Bulk Grain Coode Island Chemical Storage Facility Swanson Dock East (Patrick) Operational Limit Swanson Dock West (DPW) Operational Limit Victoria Dock Source: Adapted by Infrastructure Victoria from GHD, Infrastructure Victoria Second Container Port Advice Estimated Capacity of the Port of Melbourne, Infrastructure Victoria ADVICE ON SECURING VICTORIA S PORTS CAPACITY
83 Figure 21. Possible capacity enhancements for berth, yard and landside at Swanson Dock Swanson Dock CAPACITY (TEU/Year) 1 Million 2 Million 3 Million 4 Million 5 Million 6 Million Berth capacity Existing arrangement 'As is' with productivity gain Extend berths with 5 extra STSC Add 3 extra STSC Productivity gain range Yard without on-dock rail Existing arrangement Expansion of existing yard system to full lease area Yard with on-dock rail Existing arrangement Alternative yard system on existing yard areas Add Intermodal Terminal Capacity enhancement range based on dwell time reduction Alternative yard system on expanded yard areas Expansion of existing straddle carrier system to full lease area Capacity enhancement range based on dwell time reduction Alternative yard system with rail on existing yard areas Landside capacity Existing arrangement Sims Street upgrade + overnight operation increase Major shift to overnight operations West Gate Tunnel Source: GHD, Infrastructure Victoria Second Container Port Advice Estimated Capacity of the Port of Melbourne, 2017 Figure 22. Theoretical sequence of possible capacity upgrades at Swanson Dock CAPACITY (TEU/Year) 1 Million 2 Million 3 Million 4 Million 5 Million 6 Million On-dock rail upgrade Sims Street intersections Widen dock Expand yard Add 2 STSC Extend basin 100 million Add 2 STSC Add 1 STSC Increase overnight operations Major shift to overnight operations Source: GHD, Infrastructure Victoria Second Container Port Advice Estimated Capacity of the Port of Melbourne,
84 Webb Dock constraints Webb Dock is an indented basin dock at the mouth of the Yarra River. It has been developed progressively from the 1960s and for much of its life has primarily served the Bass Strait trade. Today, there are three terminals at Webb Dock. Toll services the Bass Strait trade at Webb Dock East berths one and two; the recently opened Victorian International Container Terminal services the international container trade at Webb Dock East berths three, four and five; and the Melbourne International Roll-on/Roll-off Automotive Terminal occupies Webb Dock West. Webb Dock does not have a rail connection, so all cargo arrives and leaves the precinct by truck. Much of the truck traffic can use the West Gate Freeway (the West Gate Bridge), the Burnley Tunnel or the Bolte Bridge. Load limits on the West Gate (68.5 tonne) and Bolte Bridges limit larger trucks. Large trucks have to use Lorimer Street to Wurundjeri Way to access Footscray Road or Tullamarine Freeway. There is currently some volume of trade movements between Webb Dock and the Swanson/Dynon Precinct, mostly related to Tasmanian trades. Maritime approaches The new Victorian International Container Terminal at Webb Dock East can handle larger ships than Swanson Dock. It is downstream of the hard limits imposed by the West Gate Bridge and the width and depth of the Yarra River. The Dock is wide enough to handle the largest ships that can access the Port Phillip Heads at 14,000 TEU per year. Accommodating ships this large would require upgrades to the wharf structure, swing basin and approach channel. Terminal operations Berth capacity along the 660 metres of quay line at the Victorian International Container Terminal limits Webb Dock capacity to about 1.4 million TEU per year. The yard capacity at the Victorian International Container Terminal is close to 2 million TEU per year and the Webb Dock precinct has room to further expand its terminal, yard and gate capacity. Landside transport network High volumes of non-port related traffic around the port, specifically the intersections where trucks enter the West Gate Freeway, may constrain Webb Dock capacity in the future. With easily achievable operational measures, such as an average of 1.5 TEU per truck and 10 per cent of truck movements overnight but no infrastructure upgrades, we estimate the capacity of the local network for port traffic is about 2 million TEU per year. Webb Dock possible enhancements There are a number of possible enhancements to the maritime approaches, berth capacity, quay and transport networks at Webb Dock, which could increase capacity up to about 8 million TEU per year. The Webb Dock layout and possible enhancements are shown in figure 23. Maritime approaches: upgrade Port of Melbourne and Williamstown channels and Webb Dock swing basin to allow access for 14,000 TEU ships (capital cost about $60 million) Berth capacity: reconfigure quay at Webb Dock East berth three to give 90 metres additional quay length to the Victorian International Container Terminal and add an additional ship to shore crane ($60 million) relocate automobile trade, extend basin 100 metres to create about 1,100 metres of quay line and convert Webb Dock West to an international container terminal ($500 million including cranes and yard equipment) relocate Bass Strait trade, realign and extend quay line 100 metres north and convert Webb Dock East berths one and two to an international container terminal ($880 million including cranes and yard equipment) create Webb Dock South reclamation which extends Webb Dock East 750 metres south into Port Phillip Bay to create two new container berths, plus yard area ($1.5 billion including cranes and yard equipment) Landside transport network: shift to truck night operations to avoid peak congestion upgrade intersections providing access to/from West Gate Freeway ($100 million) build Freight Link a new dedicated road and rail connection from Webb Dock to the Tullamarine Freeway and West Gate Tunnel ($3.5 billion) Figure 23 shows the location of possible enhancements to the capacity of the berth, the yard and the landside transport network which could increase the overall capacity of Webb Dock, noting that all would need to be increased to reach the ultimate capacity. Progressively increasing night operations and upgrading intersections should provide network capacity for 3.2 to 4.0 million TEU per year from Webb Dock. By the time Webb Dock reached this level of throughput around the 2050s key intersections allowing port traffic to access the West Gate Freeway, and the West Gate and Bolte Bridges, are predicted to be severely congested for large parts of the day making freight movement unreliable. These issue are discussed in the section Port of Melbourne road and rail links beyond the port gate and the Deloitte/Jacobs Landside transport modelling report. 84 Infrastructure Victoria ADVICE ON SECURING VICTORIA S PORTS CAPACITY
85 There are two proposals for additional transport connections to Webb Dock: Freight Link and Webb Dock Rail Link. They offer very different capacities and have different limitations. Understanding the differences is important in the context of the overall capacity at the Port of Melbourne. Freight Link Freight Link is a dedicated freight corridor linking Webb Dock to the West Gate Tunnel (Western Distributor) and the Tullamarine Freeway north of the Yarra. It would likely consist of a two lane road and two rail tracks on an elevated structure through Fishermans Bend and a new high level bridge over the Yarra River close to the Bolte Bridge. The Fishermans Bend Task Force is considering freight connections in the master plan for the area currently being developed. Freight Link needs to bypass the West Gate and Bolte Bridges due to congestion and weight restrictions preventing them from carrying High Productivity Freight Vehicles. High Productivity Freight Vehicles, which can carry four or more TEU, are needed to increase port efficiency by moving more containers per truck, especially at night. Freight Link could also increase the number of containers moving in and out of the port by rail, reducing pressure on the local road network. Constructing Freight Link could deliver an additional 5 million TEU per year of network capacity, allowing total Webb Dock capacity to increase to 8 to 9 million TEU per year. Constructing Freight Link, however, would require a very significant investment of about $3.5 billion. Webb Dock Rail Link In its submission to Infrastructure Victoria, the Port of Melbourne proposed the Webb Dock Rail Link to connect Webb Dock to the rail network north of the Yarra. This would involve a single track at grade on an existing rail easement along Lorimer Street and a new low-level bridge across the Yarra close to the Bolte Bridge. The new bridge would need to be some sort of opening bridge to preserve access for yachts and other tall vessels to the Docklands marinas upstream. The technical, operational and economic feasibility of this link need to be tested, including the impact on river traffic and ground traffic in Fishermans Bend. Given the potential constraints of the alignment and network capacity it could deliver additional transport capacity of about 1 million TEU per year. Webb Dock Rail Link is not an alternative to Freight Link, but a way to move some of Webb Dock s container traffic onto rail in the short to medium term. Assuming the Webb Dock Rail Link had a capacity of 1 million TEU per year it would delay the need for Freight Link by about five years. Trade relocation Relocating the Bass Strait and automotive trades currently at Webb Dock would allow a large increase in container capacity of the precinct. Converting these areas to international container terminals could increase the capacity by about 1.9 million and 2.5 million TEU per year respectively. It would be possible to relocate the Bass Strait trade and automotive trade within the Port of Melbourne or to the Port of Hastings, which has a large area of land zoned for port use, or the Port of Geelong, although Geelong is more constrained than Hastings in terms of available land. Infrastructure Victoria considers that Hastings appears to be the best site for future relocation of the automotive trade. Within the Port of Melbourne, the Victoria Dock and Appleton Dock precincts located in the older sections of the port upstream of the West Gate Bridge could be redeveloped to house relocated trades. However this area is subject to constraints on ship size imposed by the West Gate Bridge and Yarra Channel. For efficient supply chains to Tasmania the Bass Strait terminal would ideally to be located close to Melbourne s distribution centres and the international container port. As the ships used on the Bass Strait trade are much smaller than international container ships this trade is well suited to relocation up the river at the Port of Melbourne. Car carriers - the ships used by the automotive trade - are large vessels with a substantial air draught. Large car carriers currently visiting Melbourne are within a few metres of the air draught limit of the West Gate Bridge. If the size of car carriers visiting Victoria in the future increases, relocating the automotive terminal upstream of the West Gate Bridge may not be viable. The amount of land available in the Appleton/Victoria Dock area is limited and may not be sufficient for efficient operation of the automobile trade. For example, there is unlikely to be sufficient room to accept Victoria s full automobile trade and provide pre-delivery inspection services in the precinct, as is currently done at Webb Dock. 85
86 D The Port of Geelong or the Port of Hastings may be viable options for the automobile trade. Of these, Hastings appears to be the best option because of the large area of land available and the supply chain would be suited to Hastings, as rail access is not required and a majority of car dealerships are expected to remain located in the south-eastern suburbs. Further work would be required to understand the feasibility, cost, economic and environmental impacts of each site before a final decision is made. The Port of Portland is not considered a viable option for either trade because of the lack of available land and its distance from Melbourne. The grain terminal at Appleton Dock could be relocated from Melbourne to make room for trades currently at Webb Dock. Geelong or Portland would be the logical ports to take this trade because they already handle grain and have good rail connections to the grain producing areas in Victoria s north and west. This would require detailed supply chain assessments to understand the impact of this sort of change on competition within the industry. Figure 23. Webb Dock layout and possible capacity enhancement measures 5 SALMON STREET DOUGLAS PARADE WEST GATE FREEWAY 7 TODD ROAD 6 2 WEBB DOCK DRIVE 3 1 NORTH ROAD THE STRAND DOUGLAS PARADE Reconfigure Webb Dock East berth 3 to give 90 metres additional quay line to VICT 2. Relocate automobile trade from Webb Dock West, extend basin 100 metres to north and convert to container terminal 3. Relocate Bass Strait trade, realign quay and convert to container terminal 4. Extend Webb Dock East 750 metres south into Port Phillip Bay to create Webb Dock South 5. Upgrade intersections to/from West Gate Freeway 6. Construct Freight Link to Western Distributor on north side of river (route not defined) 7. Construct intermodal rail terminal 8. Upgrade swing basin and channels Legend VICT Bass Strait Automotive Terminal Off Dock Terminal/Empty Container Park Source: Adapted by Infrastructure Victoria from GHD, Infrastructure Victoria Second Container Port Advice Estimated Capacity of the Port of Melbourne, 2017 These possible expansion plans were completed for the purpose of analysis. We do not recommend the expansion of Webb Dock further into Port Phillip Bay or construction of the dedicated road and rail Freight Link. 86 Infrastructure Victoria ADVICE ON SECURING VICTORIA S PORTS CAPACITY
87 Figure 24. Possible capacity enhancements for berth, yard and landside at Webb Dock Berth capacity Webb Dock CAPACITY (TEU/Year) 1 Million 2 Million 3 Million 4 Million 5 Million 6 Million 7 Million 8 Million 9 Million Modify WDE* Existing berth 3 to add arrangement 90 metres Relocate automobiles Extend Webb Dock basin & occupy Webb Dock West Productivity gain range Extend Webb Dock basin & occupy Webb Dock East berths 1 and 2 Productivity gain range Add 2 berths to the southern end of Webb Dock East Productivity gain range Yard without on-dock rail Existing arrangement Extend Webb Dock basin & occupy Webb Dock West Occupy Webb Dock East berths 1 and 2 Yard with on-dock rail Existing arrangement New rail terminal and rail link to Dynon (Freight Link) Landside capacity Existing arrangement Begin shift to night operation Interchange upgrade + overnight operation increase Major shift to overnight operation New road freight link to Western Distributor (Freight Link) * Webb Dock East Source: GHD, Infrastructure Victoria Second Container Port Advice Estimated Capacity of the Port of Melbourne, 2017 We have identified a possible sequence of enhancements, and an investment pathway, to reach a theoretical capacity of about 9 million TEU per year as shown in figure 25. This is a theoretical exercise and is not the only plausible sequence. Figure 25. Theoretical sequence of possible capacity upgrades at Webb Dock CAPACITY (TEU/Year) 1 Million 2 Million 3 Million 4 Million 5 Million 6 Million 7 Million 8 Million 9 Million Modify WDE* berth 3 to add 90 metres to VICT # Upgrade Westgate interchange Freight Link road & rail connections Webb Dock South reclamation Begin to progressively relocate Autos; extend & occupy WDW** Channel modifications Relocate Bass Strait Trade & occupy WDE 1 & 2 * Webb Dock East ** Webb Dock West # the Victorian International Container Terminal Source: GHD, Infrastructure Victoria Second Container Port Advice Estimated Capacity of the Port of Melbourne,
88 Maximum effective capacity of the Port of Melbourne Infrastructure Victoria considers the maximum effective capacity of the Port of Melbourne to be about 8 million TEU per year. This capacity is split between about 4 million TEU at Swanson Dock and 4 million TEU at Webb Dock. As discussed, Swanson Dock faces the maritime approach constraints of the height of the West Gate Bridge and the width and depth of the Yarra Channel. With these constraints on ship size we consider it unlikely that Swanson Dock will achieve an effective capacity of greater than million TEU per year due to the trend of increasing ship sizes, even under the constrained fleet scenario. Webb Dock faces land transport network constraints as throughput approaches million TEU. Our demand forecasts and constrained shipping fleet scenario indicate that this constraint is likely to occur in the 2050s. At this time the road and rail links supporting the port are under significant pressure. As described in the Port of Melbourne road and rail links beyond the port gate section, we have also assumed a move to 50 per cent night operations for truck movements is necessary to achieve a capacity of million TEU per year at Webb Dock. To increase Webb Dock capacity beyond 4 million TEU per year it would be necessary to build Freight Link, a dedicated road and rail corridor linking Webb Dock with the West Gate Tunnel (Western Distributor) and the rail network north of the Yarra. Freight Link, along with expanding Webb Dock container terminals, could increase the capacity of Webb Dock up to 8-9 million TEU per year. However, due to the social, environmental and economic considerations discussed in the following section, Infrastructure Victoria considers it preferable to build a second port rather than expand Webb Dock capacity beyond 4 million TEU per year. There are many competing and inter-related options to upgrade container capacity at the Port of Melbourne. Infrastructure Victoria has identified the following logical investment sequence to achieve a capacity of around 8 million TEU per annum: At Swanson Dock: a. To increase capacity from around 3.0 to 3.6 million TEU per year: add an on-dock rail terminal and implement a metropolitan intermodal system (MIS) upgrade the Sims Street/Footscray Road intersection add one ship to shore crane (STSC) and associated straddle carriers. b. To increase capacity from 3.6 to 4.5 million TEU per year: demolish Swanson Dock East quay, widen the basin and rebuild one kilometre of quay line expand the footprint of container stacks within the current terminal footprint add two ship to shore cranes (STSC) and associated straddle carriers. At Webb Dock: c. To increase capacity from around 1.4 to 2.2 million TEU per year: reconfigure Webb Dock East berth three to increase the useable quay line at the Victorian International Container Terminal by 90 metres and add one additional ship to shore crane (STSC) begin progressive relocation of automobile trade from Webb Dock West and convert this area to a container terminal. d. To increase capacity from around 2.2 to 4.0 million TEU per year: upgrade the intersections providing access to and from the West Gate Freeway upgrade the Port of Melbourne Channel, Williamstown Channel and Webb Dock Swing Basin to allow access by vessels of up to 14,000 TEU capacity. This sequence is not the only possible sequence or pathway that could be implemented. 88 Infrastructure Victoria ADVICE ON SECURING VICTORIA S PORTS CAPACITY
89 Figure 26. Proposed sequence of capacity upgrades for the Port of Melbourne CAPACITY (TEU/Year) 1 Million 2 Million 3 Million 4 Million 5 Million Swanson Dock Webb Dock Add on-dock rail terminal. Upgrade Simms Street intersections. Add 1 STSC Widen dock, rebuild 1km of quay. Expand container yard. Add 2 STSC Modify Webb Dock East berth 3 to add 90m to Victorian International Container Terminal and add 1 STSC Begin progressive relocation of automobile trade and convert Webb Dock West to container terminal. Upgrade West Gate Freeway interchanges. Modify Hobsons Bay channels for larger ships. Source: Infrastructure Victoria 2017 Which technical reports should I look at for more information? GHD, Infrastructure Victoria Second Container Port Advice Estimated Capacity of the Port of Melbourne, 2017 AECOM, Infrastructure Victoria Second Container Port Advice Navigation Study, 2017 Deloitte/Jacobs, Infrastructure Victoria Second Container Port Advice port landside transport modelling, 2017 Deloitte, Infrastructure Victoria Second Container Port Advice container trade forecasts for Victoria, 2017 Deloitte, Infrastructure Victoria Second Container Port Advice economic advice, 2017 Deloitte, Infrastructure Victoria Second Container Port Advice supply chain assessment methodology,
90 Environmental and social considerations Why is this important? Considering the social and environmental impacts of increasing capacity at the Port of Melbourne, alongside the economic costs, is critical to ensure our advice is comprehensive and balanced. We recognise this is a significant issue for nearby communities, which was reflected in the submissions we received on our September 2016 discussion paper Preparing advice on Victoria s future ports capacity. Social There are several social factors related to increasing Port of Melbourne capacity. These factors are not hard constraints on development, but should be considered, assessed and potentially mitigated as part of any future development. We recognise that if social factors are not mitigated or managed appropriately, they may influence a decision about whether to increase capacity at the Port of Melbourne or invest in a second port. Traffic, amenity and health Without significant investment in landside transport networks, the Port of Melbourne operating at 2-5 times its existing capacity would place significant pressure on transport infrastructure and reduce amenity for those living near the port. We heard during consultation that some local residents feel the Port of Melbourne s operation is not complementary with surrounding land uses, and has a social impact on nearby residents. The Port of Melbourne generates significant truck traffic, with close to 90 per cent of containers entering or leaving the port on trucks. Trucks can impact on residential areas through noise and vibration, the potential health impacts of diesel fumes, and safety concerns about heavy vehicles driving on suburban streets. The main interaction between port related trucks and residential areas is in the inner west. As the international terminal container at Webb Dock becomes busier there could be more interaction between trucks and residential areas around Port Melbourne. In the west, some truck traffic travels through residential areas in Footscray, Yarraville and Seddon to access transport yards and empty container parks in the inner west. There are increasing competing land use demands between the Port and residential uses. Both have been there for over 100 years and have developed together, but it is not sustainable to substantially increase the number of trucks servicing the Port without addressing these land use issues. The Environment Protection Authority measured major air pollutants associated with motor vehicle emissions on Francis Street, Yarraville in The final report of this monitoring program indicates the air quality and noise levels in Francis Street are worse than surrounding areas. Increasing rail mode share may be part of the solution, but even 30 per cent rail mode share (an aggressive target) will still not stop an increase in Port capacity from also increasing truck numbers. 90 Infrastructure Victoria ADVICE ON SECURING VICTORIA S PORTS CAPACITY
91 Health and amenity impacts of ports Ports are large pieces of economic infrastructure which deliver significant benefits to the wide region they serve, either through access to imports for domestic markets, or access to international markets for domestic producers. As a meeting point of maritime and land transport supply chains, however, they can generate localised negative impacts. Some localised impacts may manifest as health issues for the communities living near the port or on key transport routes used by port related transport. Many of the trucks travelling in Melbourne are moving general freight and are not port related, including trucks travelling near the port. As a result, there needs to be a general freight industry solution not an isolated port solution. Summary of international literature findings A review of the recent international literature by Deloitte for Infrastructure Victoria on the health impacts associated with port related activity shows that: Port related truck movements generate nitrogen oxide emissions and particulate matter. At the port of Los Angeles, although port trucks account for approximately 5 per cent of total truck moves, they contribute over 30 per cent in nitrogen oxide emissions and between per cent of particulate matter. Nitrogen oxide emissions and particulate matter may be a significant factor in a range of health issues, particularly for those living in close proximity to port entry and exit roads. The health issues associated with nitrogen oxide emissions and particulate matter from diesel fuelled trucks include: impaired lung growth in children cardiovascular problems increased asthma, coughs, bronchitis and other respiratory problems. Particulate matter and nitrogen oxide emissions worsen asthma in children with the condition and double the prevalence of bronchitis in children. Particulate matter and nitrogen oxide emissions may also increase the risk of asthma in children with no pre-existing condition increased lung cancer mortality from exposure to Elemental Carbon seen in particulate matter, after taking account of other socio-economic factors Limitations The studies considered in the international literature review demonstrate correlation, but not causation. These studies do not necessarily replicate the same operating and environmental conditions that exist around the Port of Melbourne. Implications for our advice Infrastructure Victoria is unaware of conclusive studies demonstrating causation of adverse health on nearby residents by trucks servicing the Port of Melbourne. However, studies demonstrating correlation with adverse health impacts and reduced amenity mean that it is prudent to take active steps to reduce potential impacts on residents. In 2013, the Environment Protection Authority conducted a monitoring program on Francis Street, Yarraville. Nitrogen oxide and particulate matter guidelines were exceeded three times during the study. At the time, these guidelines allowed for up to five days in excess of the standards per year. During consultation we often heard the Port of Melbourne s location near residential land use is incompatible and unsustainable. Some stakeholders advocate that the port should move to a new location in an industrial precinct. As the Port of Melbourne expands, failure to adequately manage its potential health and amenity impacts could risk the community rejecting its presence. This may increase the pressure for a premature move from the Port of Melbourne, even though our economic modelling demonstrates it is the most efficient location for a port for many decades. Moving the Port of Melbourne may reduce the localised concentration of nitrogen oxide and particulate matter but the economic appraisal of the different port scenarios demonstrates that at the metropolitan level, relocating the port to either Bay West or Hastings would worsen the problem. Moving the port away from the Port of Melbourne would result in an increase in vehicle kilometres and hours travelled, which increase land transport costs and externalities. This means increased costs for the whole community from greenhouse gas and air pollution, and water, noise and air pollution. A solution may be to move the industry based close to the port, to avoid a high volume of truck movement in residential streets. Source: Deloitte, Infrastructure Victoria Second Container Port Advice social amenity impacts of port-related freight movement,

92 Land use and community acceptance The Port of Melbourne is surrounded by a mix of industry, parkland and increasingly residential and commercial areas, shown in figure 27. Increasing densification, urban renewal and changing demographics surrounding the Port may, in time, lead to increased community advocacy to reduce port activities or to relocate the Port. Expanding Port of Melbourne container capacity beyond 8 million TEU is not expected to require an increase of the Port s footprint on land except for the possible reclamation at Webb Dock East. New and upgraded transport links, however, could directly impact on surrounding areas by reducing the amenity of adjacent properties though noise, pollution or reduced community connections (i.e. forming a barrier through the middle of a community). Visual amenity The possibility to extend Webb Dock East 750 metres south into Port Phillip Bay is the enhancement likely to have the most visual amenity impact. While possible, Infrastructure Victoria does not recommend such a Webb Dock East extension. The extension would be visible on the eastern foreshore of the Bay from Sandridge to St Kilda. It would also be visible from the Williamstown foreshore and obscure the view of the city from Gem Pier and Commonwealth Reserve. Changes to port activities within the existing port footprint are not likely to have major visual impacts on surrounding areas. 92 Infrastructure Victoria ADVICE ON SECURING VICTORIA S PORTS CAPACITY
93 Figure 27. Port of Melbourne surrounding land use MARIBYRNONG RIVER LANGS ROAD MOONEE PONDS CR E EK CITYLINK STREET OAK THE AVENUE FOOTSCRAY CITYLINK S TONY CREE K SEDDON SIMS STREET COODE ROAD DYNON RD TIDAL CANAL FOOTSCRAY ROAD YARRAVILLE Port of Melbourne CITYLINK LORIMER STREET WEST GATE FREEWAY HYDE STREET Port of Melbourne TODD ROAD WEST GATE FREEWAY PLUMMER STREET PORT MELBOURNE YARRA RIVER CITY ROAD NEWPORT KOROROIT CREEK WILLIAMSTOWN ESPLANADE LEGEND Urban Area Freeway Legend Highway Land Use types Residential Commercial Arterial Mixed Urban Areas Channels Residential/Commercial Land Use types Port of Melbourne Wharf Industrial Freeway Residential Area Park or Open Space Highway Commercial Paper Size A Arterial 750 1,125 1,500 Mixed Residential/Commercial Channels Meters Industrial Map Projection: Transverse Mercator Horizontal Port Datum: of GDA Melbourne 1994 Park or Open Space Grid: GDA 1994 MGA Zone 55 G:\31\34508\GIS\Maps\Deliverables\ A4P-BulkMapper.mxd Source. Prepared by GHD for Infrastructure [KBM: Victoria 61] based on VicMap planning zones data, 2017 Job Number Revision B Date 21 Feb 2017 Figure Whilst every care has been taken to prepare this map, GHD (and DATA CUSTODIAN) make no representations or warranties about its accuracy, reliability, completeness or suitability for any particular purpose and cannot accept liability and responsibility of any kind (whether in contract, tort or otherwise) for any expenses, losses, damages and/or costs (including indirect or consequential damage) which are or may be incurred by any party as a result of the map being inaccurate, incomplete or unsuitable in any way and for any reason. Data source: DELWP, VicMap, 2016; GHD, 2016 Created by: savenables Infrastructure Victoria Ports Advice Port of Melbourne Land Uses 180 Lonsdale Street Melbourne VIC 3000 Australia T F E melmail@ghd.com W 93
94 Heritage Heritage issues are not likely to be a major consideration within most of the port area as the area has been constantly modified to maintain capacity. Each project proposal would have to be independently assessed for heritage issues but it is unlikely to be a major inhibitor to upgrades. There is low potential for Aboriginal or historic heritage to present a major constraint to port development due to the significantly disturbed nature of areas around the Port of Melbourne. This issue is considered in the GHD Environment and Social Advice report. Environmental Key for any development of the Port, in particular the extension of Webb Dock East, are: potential impact on terrestrial and marine environments through direct habitat loss or indirect effects such as turbidity from dredging potential impact on threatened species, such as the Australian Grayling management and disposal of potentially contaminated sediment dredged from the Yarra or Webb Dock. The Port of Melbourne area is highly disturbed and has been modified for over 100 years. There are limited natural values but all potential projects would need a complete environmental assessment consideration to determine what sort of approval is required. There are significant species, such as the Australian Grayling, that do interact with port waters. While appropriate work would be required for any upgrade project, there are not likely to be any issues to which no suitable solution exists. Which technical reports should I look at for more information? Deloitte, Infrastructure Victoria Second Container Port Advice social amenity impacts of port-related freight movement, 2017 GHD, Infrastructure Victoria Second Container Port Advice Environment & Social Advice, 2017 Infrastructure Victoria consultation summary paper, 2017 The Channel Deepening Project and Port Capacity Project successfully managed these risks and provide a precedent for how these issues could be managed for any future development. This includes existing capacity within dredge material disposal grounds within Port Phillip Bay. As a result, these issues are unlikely to present a major constraint on further development at the Port. We acknowledge that noise and air quality issues need to be considered as part of any increased capacity at the Port of Melbourne, and we have considered them as part of our discussion on social amenity on pages 90 and Infrastructure Victoria ADVICE ON SECURING VICTORIA S PORTS CAPACITY
95 Calculating the least economic cost From an economic perspective, the best option for society is the one with the lowest total economic cost. Economic cost includes more than the capital and operating costs of locating a port at a different location. Economic cost includes: construction, operating and maintenance costs supply chain and transport network costs externalities social and environmental costs, including the costs of accidents and greenhouse gas emissions. Construction, operating and maintenance costs Building, operating and maintenance costs are the costs for expanding capacity at each of the three locations, based on the time they occur. Supply chain and transport network costs The Port of Melbourne is a key node in supply chains for Victorian imports and exports. The Port of Melbourne has been Victoria s main port for over a century and supply chains and transport networks have evolved around the location of the current port. A key part of assessing the total economic cost of developing a second port at either Bay West or Hastings is estimating the supply chain costs associated with each location. Supply chain costs are calculated based on total distance travelled by port related vehicles (vehicle kilometres travelled), and the total time spent travelling (vehicle hours travelled). Transport network costs and costs imposed on the community are also calculated based on vehicle kilometres and hours travelled. Costs are imposed on the wider community because changing the port location changes the routes travelled by port related vehicles, which impacts the broader transport network. Trucks associated with port activity represent a small amount of total vehicles and rarely cause congestion across the system. However, the re-routing of heavy commercial vehicles associated with moving the port or creating a second port can increase localised congestion in parts of the network. Car travellers may change their travel behaviour by reducing trips, changing routes or switching to public transport. The result of any behaviour change is represented in a change in total kilometres and time travelled for the entire network. Externalities social and environmental costs The social and environmental costs associated with different port locations have been referred to as externalities in our work. Over the 49-year modelling period, costs recur annually and are significant. They are an important part of assessing total economic cost. Externalities are impacts that unintentionally affect another party and are not reflected in a market price. A relevant example of an externality is air pollution. Currently, air pollution is not priced, even though air pollution imposes a cost on the environment and the community. As per standard economic modelling practice, we have estimated the cost of externalities and included them in our economic modelling. Using the approach recommended by the Australian Transport Assessment and Planning Guidelines 2016, we have estimated a proxy value of the following externalities caused by a container port and the supply chain to include in our modelling: greenhouse gas emissions water, noise pollution and air pollution habitat loss, loss of natural vegetation reduction in visual amenity. 95
96 Comparing options To properly compare the total economic cost of port options at the Port of Melbourne, Hastings and Bay West, we calculated them in terms of present value. Calculating the present value of impacts makes it possible to compare options that have different construction and operating costs, and time profiles (the years when costs are incurred), in today s dollars. To determine the present value we used the commonly accepted practice of applying a discount rate. Using a discount rate is based on the principle that a dollar today is worth more than having the same dollar in the future. The further out in time a dollar is earned or spent, the less valuable it is, or the more compensation needs to be offered to forego being able to spend the dollar today. This is referred to as the time preference principle. It is standard practice to test the value of this time preference at 4 per cent, 7 per cent, and 10 per cent. Discounting costs allows us to understand whether the cost effectiveness of the different port options changes based on when the costs are realised in time. In our analysis, the application of the three different discount rates did not change the ranking of options. For a more detailed description of our approach to modelling the least economic cost see the Deloitte, Economic advice, report. Economic modelling approach The Special Minister of State asked for advice on when the need for a second container port is likely to arise, and variables that might alter this timeline. To help answer this question we have assessed the following factors: the optimal capacity of the Port of Melbourne the time, based on projected demand, this optimal capacity is likely to be exhausted. A key principle of Infrastructure Victoria's 30-year infrastructure strategy, and overall approach, is that the use of existing infrastructure should be maximised before building new assets. The Port of Melbourne has benefited from significant investment within the port and surrounding transport links. Our starting position is that it would be a more efficient, cheaper and better option to improve and better use the Port of Melbourne before building a second port. Therefore we have assumed that capacity at the Port of Melbourne will be expanded up until the point where it is cheaper to provide additional capacity at a new port, unless there is a compelling non-economic reason to move early. No triggers for a very early move have been identified. To provide advice on when the need for a second container port is likely to arise, we prepared development paths and costs for: expanding the Port of Melbourne building a second port at Bay West building a second port at Hastings. The investment for each of these three options falls at different points in time. To estimate the best place to provide additional capacity, we needed to compare the cost of additional capacity at each location. First we assessed the best option to deliver about 8 million TEU capacity, the point just before a dedicated Freight Link would be required to service growth at Webb Dock. Second, given our recommendation on the location for providing up to around 8 million TEU capacity, we assessed which of the three locations was best for providing additional capacity beyond about 8 million TEU. For both of these considerations we looked for the least total economic cost option to provide additional capacity. 96 Infrastructure Victoria ADVICE ON SECURING VICTORIA S PORTS CAPACITY
97 Assessing the best location to deliver about 8 million TEU capacity We found that expanding the Port of Melbourne is the least total economic cost option for providing additional capacity of up to about 8 million TEU per year. We examined the present value capital and operating costs of providing capacity of about 8 million TEU. We estimate it would cost about $6.8 billion to increase the capacity of the Port of Melbourne from 4.4 million TEU (current capacity) to around 8 million TEU per year. We compared this cost with the present value of the capital and operating costs of providing similar capacity at Bay West, which was $10.4 billion, or at Hastings, which was $15.7 billion. Clearly, a comparison of the total present value capital and operating costs confirms our initial hypothesis that expanding the Port of Melbourne is the most cost-effective option to provide capacity of about 8 million TEU per year. The present value capital and operating costs, however, are only part of our analysis. To determine the total least economic cost option, we modelled the transport and externality costs of the three options to give a total economic cost. The modelling of total economic costs also confirms our hypothesis that expanding the Port of Melbourne is most cost effective, as it has the lowest total economic cost for providing additional capacity up to about 8 million TEU. Total economic cost estimates show that providing the capacity by expanding the Port of Melbourne is $18.7 billion cheaper over the 49 year modelling period than providing the same capacity at Hastings and $8.5 billion cheaper over the 49 year modelling period than providing the capacity at Bay West. This is due to the fact that for many supply chains the Port of Melbourne is closer to end destinations than other port options so overall there are less kilometres travelled on the network. The results of our modelling are described in detail in Deloitte, Infrastructure Victoria Second Container Port Advice economic advice, Our least cost economic modelling demonstrates that expanding the Port of Melbourne is the most cost effective option for providing about 8 million TEU capacity per year. Based on our central demand forecast, 8 million TEU per year capacity at Port of Melbourne is likely to be exhausted around Figure 28. Forecasts of total container trade, volumes (TEU): central, low and high cases 12 M 11 M 10 M Victorian container trade (in TEU) 9 M 8 M 7 M 6 M 5 M 4 M 3 M 2 M 1 M 0M Financial Year Low Case High Case Central Case Source: Adapted by Infrastructure Victoria from Deloitte, Infrastructure Victoria Second Container Port Advice Container trade forecasts for Victoria,
98 Likely development pathways for the Port of Melbourne As discussed in the Port capacity factors section, port capacity is determined by the interaction of different factors, including maritime approaches, container terminals (berth/quay, yard, gate) and landside transport networks. Figures 22 and 25 set out a theoretical logical development sequence for Swanson Dock to reach a possible capacity of around 5 million TEU per year and Webb Dock to reach a possible capacity of about 8-9 million TEU per year. As we discussed in the Opportunities to expand the capacity at the Port of Melbourne section, just because it is possible to reach a capacity of about 12 million TEU at the Port of Melbourne, does not mean that 12 million TEU is the port s optimal capacity. Before the Port of Melbourne reaches about 8 million TEU per year, with Webb Dock at a capacity of about 4 million TEU, a significant decision will need to be made about the best way to provide additional container capacity. To provide the additional capacity at the Port of Melbourne, the main option is to invest in a dedicated road and rail Freight Link and continue to expand capacity at Webb Dock. The capital cost for Freight Link is estimated at $3.5 billion. Freight Link could allow Webb Dock capacity to expand to a potential capacity of 8 to 9 million TEU per year. For Webb Dock to fully realise the additional capacity created on the road and rail network by Freight Link, significant investment is required within the Webb Dock terminal area by the port. The quay length and yard capacity would need to be progressively expanded by: i. Relocating Bass Strait Trade and reconfiguring Webb Dock East berth 1 and 2 for large container ships ($880 million) This total additional capital cost of approximately $5.9 billion would provide an additional 4 to 5 million TEU per year capacity to give a total Victorian container capacity of million TEU per year at the Port of Melbourne. The costs shown here are capital costs only, represented in 2017 dollars with no discount rate applied. Separate to the dedicated road and rail Freight Link, the Port of Melbourne has proposed a concept to reconnect the Webb Dock rail alignment along Lorimer Street. This would require a low level opening bridge across the Yarra River. The technical and economic feasibility of this link needs to be further investigated. Depending on constraints and rail network capacity, a Lorimer Street rail link could deliver between 1 and 2 million TEU capacity. Assuming a capacity of 1 million TEU per year were moved on the rail line, this would delay the need to decide whether to commit to building a dedicated road and rail Freight Link or to invest in a second port by about five years and take the total Port of Melbourne capacity to 9-10 million TEU. The Fishermans Bend Taskforce is considering freight connections in the master plan for the area currently being developed. While we do not consider a dedicated road and rail Freight Link through Fishermans Bend is necessary to achieve 8 million TEU throughput at the Port of Melbourne, or is the best investment to create container capacity in Victoria beyond 8 million TEU, the Taskforce will need to consider what freight connection options should be provided for in a master plan which accounts for future uncertainty. The Fishermans Bend Taskforce will also need to consider the optimal use of the Lorimer Street rail corridor in light of the different possible freight and public transport roles it could serve. ii. Extending Webb Dock East to the south creating two new berths on a reclamation ($1.5 billion). 98 Infrastructure Victoria ADVICE ON SECURING VICTORIA S PORTS CAPACITY

99 After the Port of Melbourne reaches about 8 million TEU capacity, where should the next tranche of capacity be located? After establishing that expanding the Port of Melbourne up to about 8 million TEU per year was the least total economic cost option, we needed to establish, beyond about 8 million TEU capacity, whether it was a lower total economic cost to continue to expand the Port of Melbourne, or to invest in a second port at either Bay West or Hastings. In 2065 total Victorian container demand is estimated at between 8 to 11.5 million TEU. Our central demand case is 10.5 million TEU per year. We modelled three options to meet this demand: further expand Port of Melbourne by 5 million TEU per year to around 11 million TEU maintain Port of Melbourne operating around 6-8 million TEU per year with additional 5-6 million TEU capacity met by a second container port at Bay West maintain Port of Melbourne operating around 6-8 million TEU per year with an additional 5-6 million capacity met by a second container port at Hastings. Because port investment is more cost effective when delivered in large tranches, capacity becomes available before it is required. Our capital cost estimates for the new ports were developed in 3 million TEU capacity tranches. To ensure demand could be met in 2065, two tranches of investment were assumed at Bay West and Hastings (i.e. operating at 6 million TEU capacity). Depending on future demand there may be extra capacity in the system at this time. Table 11. Economic costs (Total capital + operational expenditures) to accommodate 5-6 million TEU in different port development scenarios ($ billion, values, discounted using 4% discount rate) Present value of total capex/opex Port of Melbourne Bay West Hastings $8.0 billion $8.7 billion $11.7 billion Source: Deloitte, Infrastructure Victoria Second Container Port Advice, economic advice,
100 To increase the capacity of the Port of Melbourne beyond about 8 million TEU, a significant investment is required in a dedicated road and rail Freight Link and new terminal capacity at Webb Dock. The cost of this investment means that further expanding the Port of Melbourne is no longer significantly the cheaper option to provide additional capacity as shown in table 12, below. Comparing undiscounted capital costs at this point shows that it is cheaper to build 6 million TEU capacity at Bay West for $5.1 billion compared to an additional 5 million TEU capacity at the Port of Melbourne for $5.9 billion. These costs are compared in table 12. Comparing total economic cost (capital costs, operating costs, transport costs and externalities) for the Port of Melbourne beyond 8 million TEU, and Bay West up to 6 million TEU, it is difficult to choose between the two locations based solely on the results of our economic analysis. Bay West s capital expenditure is less than Port of Melbourne's but the total economic cost is slightly higher as Bay West generates more truck kilometres on the network due to its non-central location. What this shows is that economic reasons alone will not be the key decision factor. For more information on economic costs see the Deloitte, Economic costs, report. By the time a decision on Freight Link is required at the Port of Melbourne, city shaping pressures may impact the Port of Melbourne site. Investing $5.9 billion in Freight Link and extending Webb Dock East further into the Bay would mean extending the life of the Port of Melbourne well beyond 2065, likely up until the end of the century. Having the sole or primary container port in the heart of the Melbourne CBD in 2099 and beyond may not match the strategic vision for Melbourne that far into the future. Considering all factors, we do not recommend building the dedicated road and rail Freight Link or extending Webb Dock further out into Port Phillip Bay. Neither of these investments is required for the Port of Melbourne to handle about 8 million TEU. Table 12. Capital costs to deliver capacity at different port locations ($ billion, values, undiscounted) Scenario 0-6 M TEU 6-8 M TEU Beyond 8 M TEU Port of Melbourne without Freight Link Port of Melbourne with Freight Link and Webb Dock extension $0.88 billion $0.91 billion Not possible without Freight Link $0.88 billion $0.91 billion $5.9 billion will provide around 12 million TEU capacity Bay West $5.09 billion $1.05 billion The previous capital investment of $1.05 billion can deliver 9 million TEU capacity Hastings $11.56 billion $1.32 billion The previous capital investment of $1.32 billion can deliver 9 million TEU capacity Source: Adapted by Infrastructure Victoria from Deloitte, Infrastructure Victoria Second Container Port Advice economic advice, Infrastructure Victoria ADVICE ON SECURING VICTORIA S PORTS CAPACITY
101 We assume the second container port at Bay West would initially function as an overflow port, with the Port of Melbourne continuing to handle close to its maximum optimal capacity of about 8 million TEU per year. In time the capacity of the Port of Melbourne may reduce as older sections of the port are redeveloped for other land use purposes. For this to occur the second container port may need to quickly ramp up capacity. Our recommended investment pathway for providing Victoria s long-term container capacity is shown in figure 29. To determine the optimal size for the Port of Melbourne and where the second port should be located we have used a number of tools and models in our economic analysis. All of these models show that the economic evidence alone will be not be a key decision driver. The economic work is one of the critical considerations but balanced decisions will be based on a combination of factors. Bay West performs better overall in all key economic comparisons, especially supply chain costs. This is covered in detail in the economic evidence for Bay West and Hastings section of this paper. Figure 29. Recommended decision pathway for providing additional container capacity in Victoria Current Port of Melbourne capacity 4.4 million TEU Port of Melbourne Capital cost $2.0 billion Average supply chain cost $615/TEU Bay West Capital cost $6.1 billion Average supply chain cost $614/TEU Hastings Capital cost $12.9 billion Average annual supply chain cost $721/TEU Hastings without rail Capital cost $7.9 billion Average annual supply chain cost $747/TEU Total Port of Melbourne capacity = 8 million TEU Port of Melbourne with freight link Capital cost $5.9 billion Average supply chain cost $623/TEU Bay West (overflow) Capital cost $5.1 billion Average supply chain cost $624/TEU Hastings with rail (overflow) Capital cost $11.6 billion Average supply chain cost $744/TEU Hastings without rail (overflow) Capital cost $6.6 billion Average supply chain cost $771/TEU Total Victorian Capacity 14 million TEU Port of Melbourne = 8 million TEU Bay West stages = 6 million TEU Recommended pathway Not preferred pathways Source: Infrastructure Victoria
102 Other triggers to invest in a second container port Considering all of the economic, social and environmental reasons that influence where we should invest in second container port capacity is important to provide some context to the outcome of our least cost economic modelling. To provide capacity beyond 8 million TEU per year, our economic modelling shows a very similar economic cost between further expanding the Port of Melbourne or investing in a second port at Bay West. Beyond the economic cost, there are a number of other reasons that could influence the decision about when and where to invest in new capacity. Changes in demand Using our central demand case we forecast 8 million TEU per year capacity through the Port of Melbourne would be exhausted in the mid-2050s. If demand is higher or lower than expected, capacity could be exhausted ten years earlier or later. Swanson Dock and ship size Swanson Dock is likely to be closed and the land converted to other uses long before Webb Dock. As noted previously, Swanson Dock is constrained in terms of the ship size that can access the dock. As trade volumes grow and ships sizes increase it will be harder for Swanson Dock to remain fully utilised and continue to compete with Webb Dock or a second port. Even if the dock and swing basin are widened, the constraints of the Yarra Channel and Westgate Bridge remain. We have developed a plausible ship size and trade split scenario that will keep Swanson Dock fully utilised for the next 50 years. This would assist in the capacity, value and efficiency of Swanson Dock being utilised for as long as possible. However there is uncertainty about predictions that far out. If ship sizes grow faster than expected then Swanson Dock may struggle to remain fully utilised and compete with Webb Dock. If Swanson Dock could not meet a market need and its capacity was underutilised or redundant, it would be necessary to replace this capacity with new capacity, bringing forward a need to expand Webb Dock or a second container port. Swanson Dock is also located closer to the city where land has a higher value for redevelopment than Webb Dock. There is sufficient other land available for urban renewal close to the city to last many decades, but looking at patterns of development from all around the world it seems inevitable that the oldest sections of the existing port, including Swanson Dock, will eventually be redeveloped for other uses. If Swanson Dock was to lose a significant proportion of its trade, or be entirely closed for redevelopment in the next 30 years it would bring forward the decision point for the investment in Freight Link or the second container port. Due to the long lead time on the construction of a second port, the viability of Swanson Dock needs to be monitored closely. If Swanson Dock utilisation was to decline rapidly, for whatever reason, and capacity needed to be rapidly created at an alternative location, the State might be forced to proceed with Freight Link and the expansion of Webb Dock. Changing opportunity cost of using the Port of Melbourne site By 2065, for reasons other than those valued in our economic modelling, it is likely to be preferable to begin the transfer of container demand to a port in Bay West. One important reason is the opportunity cost of the Port of Melbourne site. There are a number of central city redevelopment sites identified in Plan Melbourne, the Government s strategic planning document. These sites include completing Docklands, Fishermans Bend Urban Renewal Area, City North, E-Gate, Arden-Macauley, the Dynon corridor and the Flinders Street to Richmond Station corridor. Fishermans Bend alone is anticipated to accommodate 80,000 people and provide 60,000 jobs by In total, the urban renewal areas already under consideration are likely to provide sufficient residential and commercial land in the vicinity of the central city for many decades, which is likely to reduce the pressure to redevelop the Port of Melbourne land. These sites are available and less complex than the Port of Melbourne site. By 2065 it is possible however, that these sites will have been exhausted and the Port of Melbourne site is under pressure to be redeveloped. 102 Infrastructure Victoria ADVICE ON SECURING VICTORIA S PORTS CAPACITY

103 Transport network impacts Key intersections near the Port may become so inefficient that the ultimate technical capacity of the Port may be impossible to achieve. This may be compounded by congestion on the West Gate/Monash corridor which serves as a main south-east,km to west transport corridor running through the Port of Melbourne area. Freight vehicles are less than 20 per cent of metropolitan traffic, of which port related trucks are a fraction. Commuter and other freight growth may create too much congestion for port related freight networks to work efficiently. It is also difficult to accurately predict the impact of future regulatory changes, such as transport network pricing, may have on the network. If transport network pricing was introduced in the future, its potential to reduce congestion near the Port would need to be assessed in more detail at the time. Social amenity The possibility of the Port of Melbourne operating at two to five times its existing capacity would place significant pressure on transport infrastructure and reduce amenity for those living near the port. If not managed appropriately, the negative congestion, noise and air quality issues of port related truck traffic may influence the decision about when to invest in a second port. For further discussion on this issue see our case study on the health and amenity impacts of ports. Ability to achieve a return on investment The Port operator or stevedores will consider whether there is sufficient time to achieve a return on investment from increasing capacity at the Port of Melbourne. In cases where the Government is the investor, there will need to be sufficient time to realise expected benefits that flow from costs incurred in increasing capacity around the Port. Making a substantial investment is less attractive if the Port is unlikely to operate long enough to generate enough revenue (or benefits) to cover project costs. If the Port of Melbourne eventually moves completely, major investments close to that point in time, for example Freight Link, are unlikely to make sense. Potentially this could impact the effective capacity of the Port and bring forward investment in a second port. 103
104 Disappearing river ports Historically, ports have been a catalyst for large cities. London, New York and Rotterdam all started as trading posts, and well-located ports helped them grow to towns and cities. These port cities were usually located upriver from the ocean. Rivers provide natural harbours and cities grew around these harbours where sea and overland trade routes (now called supply chains) meet. As cities grew, so did the size of the port needed to support the city and its hinterland. As land in major cities became more scarce, the commercial and residential activities of cities became less compatible with the industrial activity of a large port. Many cities have chosen to move the port and its associated traffic and warehousing out of the city, to help improve amenity and realise the value of land close to the centre. Cities have also moved ports because ships are getting bigger and they need deeper and wider access channels, which are easier to achieve closer to the river mouth and away from the central city. These factors have caused many cities to move their ports downstream, sometimes right out of the river onto the adjacent coast. This global trend includes: Port of Brisbane has moved 20 kilometres from the city centre to Fisherman Island, a reclaimed (man-made) island at the mouth of the Brisbane River in Morton Bay. London commercial shipping has moved from the centre of London to the new London Gateway port located 40 kilometres downstream on the River Thames and to the Port of Felixstowe located 100 kilometres from London on the North Sea coast. Rotterdam Europe s largest port covers 30 kilometres of the New Meuse river. Most of the upstream 10 kilometres of the port, in the city centre, has been redeveloped for residential and office use. The newest section of the port is the Maasvlakte reclamation at the rivermouth on the North Sea. In Melbourne, our major port continues to be located on a river. Most of the Port of Melbourne s commercial berths are located on the lower reaches of the Yarra River. The Port of Melbourne and the city were founded together and have grown together. The small sailing ships that brought the first European settlers and supplies to Melbourne navigated up the river to the pool below a small waterfall located where Queen Street Bridge in the CBD stands today. As Melbourne grew the river was widened and deepened, and eventually straightened, to allow larger ships to reach the city. As ship size increased and land in central Melbourne became more valuable, the commercial port has moved further downstream, to Victoria Dock (now Docklands), then Swanson Dock, and now Webb Dock which is located right at the mouth of the Yarra. For the time being the Port of Melbourne is viable in its current location because it services a relatively small market, which limits the size of ship seeking to visit. There is significant existing investment in the transport networks that support intra- and inter-state supply chains. There is not significant demand to use the Port land for residential or commercial uses, because of the availability of other redevelopment sites such as Docklands, Fishermans Bend, Arden-Macauley and E-Gate. Long term, as some of the factors around the Port of Melbourne change it is likely that, as in other cities, Melbourne s major port will move away from the Yarra completely. Other cities are currently deciding how to manage ports capacity close to centrai cities. In Hamburg, Germany, the upriver port is facing a challenge with the development of the new deep water Eurogate facility at Wilhelmshaven, about 200 kilometres away and on the coast. Hamburg must decide whether to deepen the shipping channel in the river and develop existing platforms or to accept a new, less prominent role in the industry in the future. 104 Infrastructure Victoria ADVICE ON SECURING VICTORIA S PORTS CAPACITY
105 The interaction between the Port of Melbourne and the Government The Port of Melbourne has been leased for 50 years, with the lease commencing in late The lessee is responsible for long-term port planning and the activities that occur within the port boundary and access channels. Over time, creating additional port capacity will need investment beyond the port gate, as ports require good transport links to allow for efficient supply chains. This means that over the life of the lease there is likely to be co-investment between Government and the Port of Melbourne to increase capacity over the lease term. Under the lease legislation, the Port of Melbourne needs to seek the Minister s permission for major upgrades within the Port. The private lessee is responsible for managing and improving the Port's operations to move goods efficiently. Future development will depend on the investment and productivity of the leaseholder, stevedores and other tenants. Any future development by the leaseholder will be subject to relevant planning and environmental approvals. Infrastructure Victoria's recommendations regarding Port of Melbourne development have been made in this context. Given the Port of Melbourne lessee s responsibilities, when we discuss trade relocation it is in the context that the Port of Melbourne is willing to work with the Government to relocate a trade, for the purpose of providing additional container capacity at the Port. The lease does not provide the Government with the ability to direct trade relocation. Infrastructure Victoria assumes that the Port of Melbourne lessee and the Government will collaborate to optimise trade allocation across the Victorian ports in a way that is suitable for all the ports and Victorian objectives. It is in the interests of the private lessee to work with the Government to achieve trade relocations which maximises the higher value container trade at the Port of Melbourne. Not doing so may bring forward the need for a second container port, which is not in the interests of the lessee. The Delivering Victorian Infrastructure (Port of Melbourne Lease Transaction) Act 2016 does not prevent the State of Victoria from developing a second port. There is, however, a 15-year period in the Port of Melbourne lease arrangements in which a second port cannot built without compensation to the lessee. There is considerable value to the State in retaining the unfettered option under the current terms of the Port of Melbourne lease to develop a second container port after 15 years. Any change to these current arrangements would require legislative amendments. If a second State-sponsored port is eventually developed, it will be subject to competitive neutrality pricing overseen by the Essential Services Commission. This ensures a level playing field to allow ports to compete head-to-head without the distortion of State subsidies and will provide investors with confidence on likely outcomes. As a result of the lease transaction, the Victorian Ports Corporation (Melbourne) (VPCM) was created by the Victorian Government. Beginning operations on 1 November 2016, VPCM is a statutory authority responsible for the State-retained business and activities resulting from the lease of the port. The VPCM s responsibilities include: management of commercial shipping in Port Phillip waterside emergency and marine pollution response management of Station Pier as Victoria s premier cruise shipping facility the critical role of the Harbour Master. Who funds investments? It is likely that Government would not be solely (or even primarily) responsible for service delivery or funding Port of Melbourne expansion or a second container port. Ports are examples of economic infrastructure, where the application of user charges is widely accepted and expected. User charges, for example road tolls or stevedore rents, ensure those that use and benefit from infrastructure contribute to its cost. General government funding is justified where there are benefits for the broader economy, the cost of which should be shared by the community. An example is a transport link where port related freight users may only be one group of users and there are significant benefits for the broader transport network. Partial funding for this type of complementary infrastructure with general government revenue may be justified. Irrespective of how a project is funded there may be benefit in involving the private sector to finance or procuring the infrastructure or service. Partnering with the private sector can deliver significant benefits for the government through cost savings, better risk and contract management, and higher operating and maintenance standards. Government has recognised this potential benefit and appointed a lessee to manage the ongoing operations of the existing Port of Melbourne for 50 years. It may be that a second container port would be developed and managed by a private party. There are many services from a second container port that could be delivered and managed by a private party and funded by user charges. The likely outcome is aspects of port expansion or development of a new port would be funded through a combination of user charges and general government revenue. 105
106 Recommendations 2 To optimise the capacity of the Port of Melbourne before investing in a second port, based upon current information, the following investment pathway is suggested to achieve a capacity of around 8 million TEU per annum: At Swanson Dock: a. To increase capacity from around 3.0 to 3.6 million TEU per year: add an on-dock rail terminal and implement a metropolitan intermodal system (MIS) upgrade the Sims Street/Footscray Road intersection add one ship to shore crane (STSC) and associated straddle carriers. b. To increase capacity from 3.6 to 4.5 million TEU per year: demolish Swanson Dock East quay, widen the basin and rebuild one kilometre of quay line expand the footprint of container stacks within the current terminal footprint add two ship to shore cranes (STSC) and associated straddle carriers. At Webb Dock: c. To increase capacity from around 1.4 to 2.2 million TEU per year: reconfigure Webb Dock East berth three to increase the useable quay line at the Victorian International Container Terminal by 90 metres and add one additional ship to shore crane (STSC) begin progressive relocation of automobile trade from Webb Dock West and convert this area to a container terminal. d. To increase capacity from around 2.2 to 4.0 million TEU per year: upgrade the intersections providing access to and from the West Gate Freeway upgrade the Port of Melbourne Channel, Williamstown Channel and Webb Dock Swing Basin to allow access by vessels of up to 14,000 TEU capacity. 106 Infrastructure Victoria ADVICE ON SECURING VICTORIA S PORTS CAPACITY
107 3 When undertaking future port and freight infrastructure planning, the Victorian Government should take into consideration the following key factors that will influence capacity: a. Increasing capacity at Webb Dock to accept ships larger than around 7,500 TEU could make it difficult for Swanson Dock s capacity to compete and be fully utilised due to its vessel size restrictions. This may prematurely compromise the viability of Swanson Dock. This can be managed through deliberate staging of infrastructure investments at Webb Dock as well as upgrades to navigation infrastructure (channels and swing basins) and changes to regulation of navigation. b. Implementation of a metropolitan intermodal system (MIS) will support metropolitan movement of more containers by rail and increase the capacity of Swanson Dock. The implementation of the MIS requires work within the port area but also on the broader rail system to be viable. It will require collaboration between industry, the Victorian Government, rail managers, the Port of Melbourne and public transport rail operators. c. The Port of Melbourne has identified an option for a rail-only connection using the current Lorimer Street easement to connect Webb Dock with the current rail assets that service Swanson Dock. This is a different, more limited, rail access option to the large-scale, road and rail Freight Link option through Fisherman s Bend. The Port of Melbourne operator is required to prepare a rail access strategy which the Victorian Government will assess and respond to. If the network were able to handle the increased rail volumes, this could increase the total capacity for the Port of Melbourne by 1 to 1.9 million TEU to a total of more than 9 million TEU. Recommendation of Infrastructure Victoria s 30-year infrastructure strategy called for development of a port rail access strategy for Webb Dock. d. Strengthening the Bolte Bridge and the key access points to the Bolte Bridge for High Productivity Freight Vehicles to at least 77 tonnes and potentially 85.5 tonnes would assist in increasing truck efficiency. An upgrade of the Bolte Bridge could yield greater efficiency and would need to address related network access issues so a weight limit restriction nearby does not compromise access. Ensuring new freeway projects are built to 109 tonne standards would also assist in increasing truck efficiency. Recommendation of Infrastructure Victoria s 30-year infrastructure strategy called upgrades to the road network, particularly bridges, to accommodate heavier axle loads. e. Removal of barriers that limit the expansion of night operations by port related road or rail transport services will be important in achieving potential port capacity enhancements. The process of achieving this would benefit from engagement with local government, the community and freight industry to identify any key barriers to increasing night operations. 107
108 4 When undertaking future port and freight infrastructure planning, the Victorian Government should take into consideration the following key factors that will influence planning timelines: a. Further urban development is likely to hinder capacity enhancement within the existing Port of Melbourne footprint. This can be managed by maintenance of suitable buffers between the Port and other land users. There is also considerable value in maintaining suitable buffers for Portland, Geelong and Hastings, including the key transport links connecting to the ports. Recommendation of Infrastructure Victoria s 30-year infrastructure strategy called for identification of existing and future potential freight precincts requiring planning protection. b. The Western Interstate Freight Terminal and Inland Rail Project have the potential to increase productivity and the rail mode share of Victorian ports while reducing the volume of truck movements in inner Melbourne. They could assist by reducing the amount of non-port rail activity near the port and the number of trains using the key rail junctions near the port. Recommendations and of Infrastructure Victoria s 30-year infrastructure strategy called for further scoping and detailed planning work for these projects. c. It is important to ensure that the amenity impacts of increased capacity at the Port of Melbourne on residents near the port and key transport corridors are managed in a way that retains the Port s social licence to operate. Measures that may assist in managing amenity impacts include noise and emission standards for freight vehicles; designation of key road corridors for port related vehicles; review of permitted land uses in the inner west; and transition of freight and container transport companies to sites with good road and rail transport access and ample industrial land that do not conflict with residential uses. The Victorian Government could commission specific advice on actions to reduce or remove conflicts between residential, port and freight-related land uses in the inner west of Melbourne, particularly along key road corridors. The process of developing this advice could include consultation with the community, industry, port and logistics stakeholders. 5 The Environment Protection Authority (EPA) should remain active in its air quality and noise monitoring programs around the Port of Melbourne and key freight routes in the inner west of Melbourne. Efficient freight routes, especially in the inner west of Melbourne, are a crucial element in the Port of Melbourne s supply chains and capacity. Maintaining the Port s social licence to operate is an important consideration if capacity expansions are to be sustainably achieved. If the amenity impacts of port related freight services are not effectively managed, the Port of Melbourne may be unable to reach its optimal capacity. Air quality and noise monitoring by the EPA will provide evidence on potential port related health and amenity impacts that can inform policy decisions and the community. There may be opportunities to consider the most effective ways to undertake these monitoring programs. The causes of significant breaches of regulatory standards or thresholds should be investigated and reported. 108 Infrastructure Victoria ADVICE ON SECURING VICTORIA S PORTS CAPACITY
109 6 The Victorian Government should ensure that over the 50-year term of the Port of Melbourne lease the robust governance and contract management framework that has been established continues to be maintained. In particular, a strong core technical and policy capability needs to be maintained within the Victorian Government to: a. operate as an active and informed port lessor b. clearly understand the Government s ongoing obligations and powers under the Port of Melbourne lease c. have strong technical skills to be able to respond to the detail of lessee port development plans and port development strategies d. align lease expiration dates with decisions the Victorian Government will need to make on key capacity enhancing infrastructure projects across the Victorian ports, freight and logistics network. 7 The Victorian Government should not enter into any arrangement that restricts the ability to develop a second container port after There is an initial 15 year period in the Port of Melbourne lease legislation where there cannot be a second port built without compensation to the lessee. There is considerable value in the State retaining the unfettered option under the current terms of the Port of Melbourne lease legislation to develop a second container port after 15 years. 109
110 Where a second container port should be located The Special Minister of State requested that Infrastructure Victoria provide advice on the optimal location of a second container port, and under what conditions, specifically identifying the potential suitability of sites at Bay West or Hastings. We gathered the best available evidence to undertake a comparison of Bay West and Hastings at a strategic level. The following section summarises our work on the Bay West and Hastings concepts including designs for each site and an assessment of the associated transport, environment, social and economic considerations. On the basis of our investigations we recommend Bay West as the location for a second container port. Considerations in planning a second port If a new port is needed at either Bay West or Hastings, the proponent would need to complete significant additional work to fully develop a preferred option. For both sites, we investigated what it would take to develop and operate the port, from deep water in Bass Strait, through to existing and planned transport links outside the port gate. For each site we have examined: port location, taking into account surrounding land use, social and environmental considerations channel design dredging required to create channels, swing basins and berths reclamation the creation of land in areas that are currently water in order to locate container terminals and port facilities terminal design and configuration terminal operations transport connections beyond the port gate potential environmental and social impacts, and approvals risk. We estimated the capital and operating costs of the two port concepts in line with the Department of Treasury and Finance s high value/high risk guidelines. The guidelines set out a four stage process for approving projects with a total estimated investment of over $100 million. The first stage of the guidelines, conceptualise, require cost estimates to be made within an order of magnitude of -40/+60 per cent. This order of magnitude has been applied to our cost estimates and means the actual cost could be between 40 per cent less or 60 per cent more than our cost estimate. This certainty range is a commonly accepted practice for our level of study. We recognise that these estimates are high level and would need significant re-examination prior to starting a project. We have used the same methodology for developing cost estimates for expansions to the Port of Melbourne, and building a new port and the necessary complementary infrastructure at either Bay West or Hastings, and we are confident these cost estimates are robust enough to be used for comparison. Why have we chosen a total capacity of 9 million TEU? We developed concept designs for a second port at Bay West and Hastings with an ultimate capacity of 9 million TEU per year, which can be delivered in three stages: 3 million, 6 million and 9 million. 9 million TEU is a very large port for Australia. Today, the Port of Melbourne handles about 2.6 million TEU and all Australian ports handle about 8 million TEU in total. We think 9 million TEU per year is sufficient for detailed planning because it is likely to meet Victoria s container demand for decades. We also chose this number because we think it most likely the decision to invest in a second port will be as part of a gradual shift of international container capacity away from the Port of Melbourne. 110 Infrastructure Victoria ADVICE ON SECURING VICTORIA S PORTS CAPACITY
111 We don t know what future technology will mean for the freight industry how much more manoeuvrable ships will be, or whether some disruptive technology will fundamentally change land or sea freight. We think planning for a capacity of 9 million TEU is sufficient to provide future decision makers with flexibility. Even so, we considered the ability for either location to expand to become much larger, perhaps handling million TEU. Second port design assumptions For each site we assume the port: is an origin/destination port, rather than a transhipment port. The Port of Melbourne operates as a origin/ destination port, which is unlikely to change has a land-backed quay the berth, container stacks and transport connection are all together has a customs and quarantine facility. We also made a number of assumptions related to terminal design and operation, road and rail transport access, and supply chains. Terminal design and operation To have an ultimate capacity of 9 million TEU, the port needs a quay line length of between kilometres; a terminal immediately behind the quay line 600 metres deep to accommodate the container stacks, truck loading and rail terminal; and an area of about 240 hectares to be able to hold 18,000 TEU in container stacks. The GHD Estimated capacity at the Port of Melbourne report describes our planning benchmarks in more detail. The Port of Melbourne is a historic river port with most wharves and terminals located along the banks of the Yarra River or indented basins such as Swanson Dock. New ports look quite different to this with terminals more commonly located on reclamations built out from the coast or on detached islands. The benefit of these arrangements are lower dredging volumes and the size of ships visiting the port is not constrained by the river or basin width. A good example of the island terminal arrangement is Fisherman Island in the Port of Brisbane which accommodates three container terminals as well as coal, grain and automobile terminals. The island is connected to the mainland by a four lane road bridge and two track rail bridge. Khalifa Port in Abu Dhabi is a recent example of a port constructed offshore from dredge material and connected to the mainland by a bridge. Webb Dock and London Gateway are examples of ports that are built out from the shore and connect directly to the land. Wherever the port is located it needs to be designed to cope with the impacts of climate change, particularly sea level rise over its design lifetime of 50 to 100 years. The port concepts are also configured so that the port does not limit the ability of surrounding ecosystems to adapt to climate change, for example by constructing a hard barrier that prevents the landward migration of intertidal habitats. The port terminal with all the elements described above can be located on land on the coast, on reclaimed land built out from the coast, or on an island detached from the coast with transport links back to land. 111
112 Transport access Rail Rail freight access is a critical requirement for a second container port at either Bay West or Hastings. As roads become more congested, it will be important to move a proportion of import containers out of the port by rail. Rail access is also critical for exporters in Victoria s regional areas to make sure they continue to have efficient access to international markets. Rail marshalling yards efficient rail access requires a rail marshalling yard near or at the port to break up and assemble long regional and interstate trains. Our rail marshalling yards are designed to accommodate regional trains between 1,200 metres and 1,500 metres which deliver exports to the port and may grow to up to 1,800 metres long to allow for interaction with interstate trains. The marshalling yards will also be able to accommodate metropolitan freight trains starting at about 600 metres, and contemplating future lengths of as long as about 900 metres. These specifications are consistent with ongoing planning for the Melbourne Intermodal System, designed to move rail freight around metropolitan Melbourne to terminals in the west (Altona and Truganina), north (Somerton) and south-east (Lyndhurst). In our analysis, we assume that the estimated upper level of mode share for the Melbourne Intermodal System is 30 per cent on rail. On-dock rail terminal we designed both ports with an on-dock rail terminal, capable of handling containers equal to 30 per cent of mode share, or about 3 million TEU per year once the port reaches an ultimate capacity of 9 million TEU. To achieve this, each port design includes a six-track rail terminal 100 metres wide, running the length of the port terminal. Road Moving containers in and out of the port by truck is likely to be the dominant transport mode for the foreseeable future, due to cost-effectiveness and flexibility. We have designed both ports with the capacity to handle a 90 per cent road mode share out of the container terminal ports at each stage. Transport connections consideration Port planning requires significant emphasis on transport infrastructure as a port is not an end destination in itself but part of a broader supply chain. All imports or exports have a land transport link as part of their supply chain. For the Port of Melbourne to grow and for a second port to function there will need to be significant investment in road and rail links. We identified all the transport infrastructure required and then assessed whether the links would be built due to general growth or whether a new port was the main reason for investment. As outlined in Infrastructure Victoria s 30-year infrastructure strategy general economic and population growth is the investment driver for North-East Link (recommendation ) and the Outer Metropolitan Ring Road (recommendation ). These roads will provide significant functionality to the freight industry and this makes them more attractive investments, however freight is not the main project driver. The Western Interstate Freight Terminal (WIFT) (recommendation ) and Inland Rail (recommendation ) are likely to be built to support interstate trade. Port connections are not the main project drivers of WIFT or Inland Rail, even though there may be benefits to port supply chains. For these reasons, none of these projects were included in any of the port concept costings. Regional Rail East (recommendation ) is likely to involve the addition of two extra tracks on the Dandenong corridor. Infrastructure Victoria s 30-year infrastructure strategy stated that this link is very costly. It may be required but demand drivers need to be better understood. Other investments such as new trains, longer trains, operational and signalling changes are expected to provide the necessary capacity to meet metropolitan passenger rail demand on this corridor to mid-century. Our work and the consultation process showed that it is not viable to have a large container port that is not connected to rail. Rail will be an increasing part of the metropolitan freight system in the future and is also critical for a number of export supply chains. If extra tracks were constructed for metropolitan public transport and V/Line services, then there would not be enough freight pathways to service a large port. Therefore we included the cost of Regional Rail East in the Hastings concept so there are dedicated freight pathways for the large amount of freight trains generated by a large port. As the cost of Regional Rail East is so large, we commissioned a second cost assessment which, concluded that a cost estimate of $5-6 billion for the City to Dandenong rail freight line is realistic for strategic assessment purposes. In addition to Regional Rail East, a short, two-direction link between the Hastings and Gippsland lines would be required. This link has not been scoped or costed. 112 Infrastructure Victoria ADVICE ON SECURING VICTORIA S PORTS CAPACITY
113 To ensure that Hastings was not unfairly burdened with this cost, a scenario was also run where an extra rail line was not built. The overall supply chain cost in this Hastings scenario is also very high due to the long distance trucks need to travel for many supply chains. The strong demand in south-east Melbourne does not offset the greater distance travelled by all trucks not headed to Gippsland or south-east Melbourne. For more information, see the GHD Regional Rail East costing report. Consequence of port decentralisation In supply chain modelling and assessment a significant input to cost is the distance trucks and trains need to travel. The time to make each trip is a key input, and the amount of time spent in congestion can make this difficult to predict. The current Port of Melbourne is in a central location compared to the central city and surrounding suburbs. All the supply chains are orientated to this location. Both Bay West and Hastings are away from the central city location and hence in either scenario some supply chains are shortened and less congested while others get longer. The orientation of the regional road and rail networks in Victoria mean that all the regions except for Gippsland will have a slightly shorter or less congested supply chain with Bay West than with the current Port of Melbourne. The opposite is true in a Hastings scenario. Gippsland is a significant export generator with about 6 per cent of the Victorian regional exports generated from the east (see the Port of Melbourne and Dynon Rail terminals: 2009 container logistics chain study full report). Even the Hume region, which has some orientation to the east, is effectively closer to Bay West due to the orientation of the Hume Freeway and the use of the Western Ring Road. The future Outer Metropolitan Ring Road will support this even further. South-east Melbourne and the central city have a similar situation where they will be further from a port located at Bay West compared to the location of the Port of Melbourne. Destinations in the west and north will be closer or relatively neutral. This means that new port planning for Bay West needs to include significant transport planning to not unreasonably increase supply chain costs, especially for Gippsland. By the time Bay West opens in 2055 the orbital and cross city freeway network would have to have been enhanced with new capacity projects complete. All new freeway projects should be built to the 109 tonne standard to support HPFV access to help increase supply chain efficiency. The Port of Melbourne cannot grow indefinitely. For urban renewal reasons it is expected to eventually close to avoid major industrial activity adjacent to the CBD. As the port shifts from a centralised location transport investments that support the whole of Victoria will need to be made to maintain our efficient freight and logistics sector for both imports and exports. Environmental and social impacts For each site we have undertaken a review of the environmental and social values, focusing on the key differentiators in environmental value and impact between the two sites. Which technical reports should I look at for more information? GHD, Infrastructure Victoria Second Container Port Advice Concept options Bay West and Hastings,
114 Hastings port concept technical evidence Why is this important? To compare the Bay West and Hastings locations, we had to develop a concept design for a port at each site. Based on the best available information, we have adopted a port terminal to the north of Long Island Point. Our concept, described in more detail below, has been designed at a strategic level, and is not the only possible concept for a container port at Hastings. Should the government decide to build a second container port at Hastings, significant further work would need to be completed to evaluate and recommend a design that best responds to the conditions and objectives at the time. Context History Western Port has been used for port related activities since the early 1900s. The town and port of Hastings are located in the North Arm on the western side of Western Port, about 60 kilometres south-east of Melbourne. The commercial Port of Hastings was developed in the late 1960s and early 1970s to export oil from Bass Strait oil fields. At the time, the government of the day identified and zoned further land in Hastings for port related industrial uses, to preserve the state s ability to further develop the port at Hastings. This land is reserved as Special Use Zone 1 (SUZ1) in the local planning scheme, and covers about 3,500 hectares. SUZ1 is divided into two areas, as shown in figure 30: about 3,000 hectares north of Long Island Point about 500 hectares at Crib Point. The Port of Hastings The Port of Hastings does not currently handle any container trade. The Port is an important asset for Victoria s import and export of bulk liquid commodities including refined fuel, oil and gas. The Port receives about vessels each year. The Port s bulk liquid capacity is significantly underutilised. During the peak of oil exports in the 1970s and 1980s the Port accepted over 600 ship visits a year. Existing port operations are spread over four areas, across 8 kilometres of coastline, as shown in figure 30: Long Island Point hosts one bulk liquid berth, used by Esso to export a proportion of the crude oil and gas from its platforms in the Bass Strait. The remaining crude oil is transferred to the Altona and Geelong Refineries via the Western Port Altona Geelong (WAG) pipeline. Trucks transport the remaining gas for domestic consumption. A separate pipeline transfers the ethane to chemicals industries in Altona. The steel producer BlueScope is located to the north of the Esso plant at Long Island Point and has one general cargo berth used to export steel product. There is one disused roll-on/roll-off berth, previously used to bring in steel product from the BlueScope foundry at Port Kembla. Stony Point caters for tugs, passenger ferries, naval training vessels, the fishing industry and port administration and services. Crib Point is the location for two bulk liquids berths (one inactive) operated by United Petroleum, used to import refined petroleum products (petrol, diesel). The products are piped to United s Long Island Point terminal for distribution to its retail network throughout Victoria. As a result of the land set aside in the 1970s, the Port of Hastings has been considered the possible location for a second container port for a number of years, appearing in several government documents, including the Port Strategic Framework (2004), Victorian Freight and Logistics Plan (2013), and Plan Melbourne (2014). 114 Infrastructure Victoria ADVICE ON SECURING VICTORIA S PORTS CAPACITY
115 Stony Point Jetty, Crib Point Jetty and Long Island Point Jetty are owned by the State of Victoria through the Port of Hastings Development Authority. The Port of Hastings Development Authority is a public entity established under the Transport Integration Act The land adjoining the State owned jetties is Crown land vested in the Port of Hastings. BlueScope Steel owns the steelworks jetties and adjoining land. The Victorian Regional Channels Authority (VRCA) is responsible for port waters. The control arrangements for these assets are governed by legislation, not by contracts. As a consequence the Port Manager has difficulty getting new customers established as the mechanisms for change are not simple to instigate. The main acts are: Western Port (Steel Works) Act 1970 Western Port (Crib Point Terminal) Act 1963 Western Port Development Act 1967 This arrangement is an impediment to port development, establishing new customer operations and expanding trade. Simplification of control arrangements would create a more flexible asset for the State. Hastings has the deepest channels of all the Victorian commercial ports at 14.8 metres. The large tidal range in Western Port further increases the size of ships that can access the port using tidal assist transiting the channel at high tide. Hastings can take ships larger than all the other Victorian commercial ports. Current use As well as the existing port and industrial facilities a variety of land uses and protected areas around Hastings constrain port development, as shown in figure 30: HMAS Cerberus, a Royal Australian Navy training facility, occupies a large parcel of land from Stony Point to Sandy Point an unused refinery site exists within SUZ1 at Crib Point the Esso Plant, the BlueScope Plant and the United Terminal, are all located at the southern end of SUZ1 to the north of Long Island Point agriculture activities and a small number of residences use the balance of SUZ1 north of Long Island Point residential or rural-residential areas include the townships of Hastings, Tyabb, Bittern, Cribb Point, Somers and Balnarring two boat harbours for recreational and fishing boats exist at Yaringa and Hastings coastal reserves extend from Stony Point to Hastings and around Yaringa a Marine National Park exists north of Yaringa and on the north side of French Island. The biggest ships to visit Victoria were bulk liquid tankers that visited Hastings in the 1980s: The Amazon Maru called in November It carried 132 kilotonnes of cargo, had a Dead Weight Tonnage of 165 kilotonnes, had a 300 metre LOA and a 14.9 metre draught. The BP Achiever called in January 1986, and had a 15.5 metre draught. 115
116 Coolart Rd Boes Rd Figure 30. Existing Port of Hastings and surrounding land use Derril Rd Mornington - Tyabb Rd Fwy Peninsula Link BALCOMBE CREEK Eramosa Rd West SOMERVILLE Olivers Creek Bushland Reserve Jones Rd Grant Rd TYABB Eramosa Rd East Frankston - Flinders Rd Tyabb Bushland Reserve Bungower Rd Dandenong - Hastings Rd WATSON CREEK Tyabb - Tooradin Rd MORNINGTON PENINSULA CASEY Yaringa Marine National Park North Western Port Nature Conservation Reserve Yaringa Boat Harbour Warneet Iluka St Bushland Reserve Warneet Balaka St Bushland Reserve BlueScope Facility Marine Pde French Island Marine National Park Devilbend Natural Features Reserve Graydens Rd Bittern Bushland Reserve United Facility Esso Facility Bayview Rd BlueScope Jettybreak bulk Stumpy Gully Rd WARRINGINE CREEK Hodgins Rd HASTINGS High St Warrengine Creek Streamside Reserve Long Island Dr Western Port Marina Long Island Point Jetty - liquid bulk Balnarring Rd Myers Rd Bittern - Dromana Rd Disney St Hendersons Rd RED BILL CREEK Buckley Nature Conservation Reserve WoolleysRd Stony Point Rd TheEsplanade Crib Point Jettyliquid bulk French Island National Park FRENCH ISLAND BALNARRING Stanleys Rd Balnarring G96 Bushland Reserve Balnarring Beach Rd TU LUM CREEK Coolart Historic & Cultural Features Res. MERRICKS CREEK Sandy Point Rd Parklands Av South Beach Rd SOMERS Tas man Rd Crib Point G229 Bushland Reserve STONY POINT Stony Point Jettyport services French Island N.P. (addition) National Park French Island G230 Bushland Reserve HMAS Cerberus Sandy Point LEGEND River/Creek United Hastings Terminal Legend Railways Local Government Jetty Boundary Facility Existing Shipping Marine National Channel Reserves BlueScope Steel Existing Shipping Channel Existing Port Esso/BHP Billiton Existing Waters Port HMAS Cerberus Special Use Zone 1 (SUZ1) Paper Size A4 Infrastructure Victoria Job Number Revision B Source: Adapted by Infrastructure Victoria from GHD, Infrastructure Victoria Second Container Ports Advice Port Advice - Environmental Concept and Social options Bay West and Hastings, 2017 Date 15 Feb 2017 Kilometers Map Projection: Transverse Mercator Horizontal Datum: GDA 1994 Grid: GDA 1994 MGA Zone 55 Surrounding Landuses Figure G:\31\34583\GIS\Maps\Deliverables\ _000_A4P_BulkMapper.mxd [KBM: 15] 180 Lonsdale Street Melbourne VIC 3000 Australia T F E melmail@ghd.com W Whilst every care has been taken to prepare this map, GHD (and DATA CUSTODIAN) make no representations or warranties about its accuracy, reliability, completeness or suitability for any particular purpose and cannot accept liability and responsibility of any kind (whether in contract, tort or otherwise) for any expenses, losses, damages and/or costs (including indirect or consequential damage) which are or may be incurred by any party as a result of the map being inaccurate, incomplete or unsuitable in any way and for any reason. Data source: DELWP, VicMap, 2016; GHD, 2016 Created by: savenables SUZ1 - Zoned for Port Related Uses Coastal and Marine Parks and Reserves All Other Parks and Reserves Urban Areas Coastal and Marine Parks and Reserves All Other Parks and Reserves Urban Areas 116 Infrastructure Victoria ADVICE ON SECURING VICTORIA S PORTS CAPACITY
117 Site and concept selection Site selection The site and concept selection process for Hastings involved a desktop review of previous studies including the Port of Hastings Container Expansion Project (2014), Victorian Freight and Logistics Plan (2013), and the Port Strategic Framework (2004). Our site selection focused on the area between Stony Point and Yaringa on the western shore of the lower North Arm of Western Port. This area contains the existing port facilities, including shipping channels, and land zoned for port development. Two parcels of land zoned SUZ1, at Crib Point and north of Long Island Point, present the best opportunities for port development. We think the land north of Long Island Point more suitable for a port development because: more land is available, allowing room for port related industrial and logistics development and buffers from residential areas and popular coastal reserves transport corridors would be about 10 kilometres shorter and would not pass through or around the townships of Hastings, Bittern or Crib Point. The main advantage of the Crib Point site is that it is closer to deep water and would require less dredging, however there is much less land available, and the potential site is much closer to residential areas. We did not consider the area south of Stony Point suitable because of limited land availability and the exposure of this part of Western Port to ocean waves. We did not consider the area past Yaringa suitable because the upper North Arm of Western Port is very shallow and contains significant areas of valuable habitat including two marine national parks. Further information on our assessment of different port locations at Hastings is provided in the the GHD Concept Options Bay West and Hastings report. Concept selection At the selected location north of Long Island Point, we considered two container port options: a dig out option and an along shore option, shown in figure 31. Both options have the same stage one with a terminal and quay running north south in the area between Long Island Point and BlueScope. The two options differ after stage one: Along shore: subsequent stages run north east from BlueScope with the terminal on reclaimed land detached from the coast. This option aims to minimise dredging volumes. Dig out: an indented dock basin is cut into the land north of BlueScope. This option aims to minimise the footprint on intertidal and marine habitat (but still has a substantial footprint). This option requires a lot more excavation, which increases cost. The indented dock is less flexible for future operations than the strait quay, especially to accommodate ships larger than currently exist. The Port of Hastings Container Expansion Project (2014) considered several variations of the along shore option, with the terminal positioned either further in or further out from the land, in an attempt to find solutions that minimise both cost and footprint on sensitive habitat. While some of the further out variations have less direct impact on seagrass in the footprint, the seagrass and intertidal habitat would still be at high risk from indirect impacts related to hydrodynamic changes and turbidity from dredging. No solution has yet been identified that avoids a substantial impact on the sensitive habitat and a large footprint on the Ramsar site. These variations all require a higher volume of dredging and/or reclamation, and hence have higher costs and increased dredging-related environmental impacts during construction. Both options described above and numerous variations are technically possible. We have selected the along shore option as shown because it is more cost effective and has more flexibility for terminal operation and accommodating larger ships. More information comparing these options is available in the GHD Concept Options Bay West and Hastings report. 117


118 -3,004,000-3,003,000-3,002,000 Dandenong - Hastings Rd Dandenong - Hastings Rd 10,001,000 Figure 31. Along shore and dig out concepts for Hastings 10,001,000 Tyabb - To oradin Rd Tyabb - To oradin Rd SOMERVILLE SOMERVILLE TYABB TYABB Mornington - Tyabb Rd 10,000,000 10,000,000 Frankston - Flinders Rd Frankston - Flinders Rd Mornington - Tyabb Rd HASTINGS HASTINGS Legend Legend Legend Port Related Uses Port Related Uses Railway Port related Uses Possible Future Rail Existing Shipping Channel Quay Line Existing Shipping Channel Terminals Reclaimed AlongContainer the Shore Option Terminal Footprint Along Shore Option Quay Line Indicative Extent of Dredging for Navigational Infrastructure Possible Future Road / Rail Links 30m Rail Corridor; 30m RailCorridor Reclaimed Container Railway Possible Future Rail Terminals Reclaimed Container Terminal Footprint Dig Out Option Extent Quay Line Dig Option Indicative ofoutdredging and/or Indicative Extent of Excavation for Navigational Dredging and/orinfrastructure Possible Future Road / Rail Links 30m Rail Corridor; 30m RailCorridor excavation for Navigational Infrastructure 9,999,000 9,999,000 70m Road Corridor FootprintSecond Container Port Advice Concept options Source: GHD, Victoria Bay West and Hastings, m Road CorridorInfrastructureTerminal DRAFT Design vessel The Hastings concept has been developed for an 18,500 TEU reference vessel, with dimensions based on the Maersk shipping line s triple E class, one of the largest container ships in the world today. The vessel used was the MV Maersk McKinney Moller, triple E class, 18,270 TEU capacity, 400 metres LOA, 59 metre beam, and 14 metre sailing draught. -3,004,000 The western entrance to Western Port is wide and deep enough that only minor modifications are necessary to allow entry into Western Port of the largest container vesselspaper in Size the world today (ultra large container ships, A3 18,500+ TEU), or even larger vessels. Client Geotechnical investigations in 2014 identified a low risk of rock in this area and determined sediments could be easily dredged. This means there is no structural limit to the channel size that can be created, although the incremental environmental impacts of dredging would need to be assessed. The ability to accept very large vessels is one of the key advantages of the Hastings option it is effectively unconstrained with respect to the channels that can be created to accommodate increases in ship size. Substantial dredging, however, would still be required at the port site, as discussed later. -3,003,000 Client Name -3,002,000 Job Number XX Revisionof Aa slightly WeProject havename also considered a second scenario Date 02 Feb 2017 Logo smaller, 14,000 TEU ship, to allow a direct comparison Figure Description1 At the entrance to the Western Port, dredging of about Figure withfigure Bay West. Dredging volume for the smaller ships1 is Description2 Morwell VIC 3840 Australia T F E mwlmail@ghd.com W million cubic metres is required to allow largehazelwood shipsdrive (cnr Lignite Court) marginally lower, but all other elements of the port are to travel up the channel from around Sandy Point to the the same. proposed site at Long Island Point. Table 13 shows the vessel characteristics for the two scenarios we considered Metres Map Projection: Transverse Mercator Horizontal Datum: GDA 1994 Grid: GDA 1994 MGA Zone 55 G:\31\34583\GIS\Maps\Deliverables\ _003_AlongShore_DigOut_Options_A3P.mxd Whilst every care has been taken to prepare this map, GHD (and DATA CUSTODIAN) make no representations or warranties about its accuracy, reliability, completeness or suitability for any particular purpose and cannot accept liability and responsibility of any kind (whether in contract, tort or otherwise) for any expenses, losses, damages and/or costs (including indirect or consequential damage) which are or may be incurred by any party as a result of the map being inaccurate, incomplete or unsuitable in any way and for any reason. Data source: Data Custodian, Data Set Name/Title, Version/Date. Created by:lrsmith 118 Infrastructure Victoria ADVICE ON SECURING VICTORIA S PORTS CAPACITY
119 Table 13. Design vessel characteristics for Hastings and Bay West SCENARIO 1: SCENARIO 2: 14,000 TEU New Post Panamax Based on MCS Daniela 366 metre LOA 51.2 metre beam 13.5 metre sailing draught 18,500 TEU Ultra Large Container Ship Based on Maersk, triple E vessel 400 metre LOA 59 metre beam 14.0 metre sailing draught Source: Infrastructure Victoria 2017 Hastings concept design Terminal location The proposed location in the Upper North Arm of Western Port is characterised by a deep channel (naturally 10 to 15 metres deep) and extensive shallows and intertidal areas. The quay line is positioned on the edge of the deep channel to minimise both dredge volumes in front of the quay and reclamation volumes for the terminal behind the quay. Stage one of the terminal and quay is partially built on the old Tyabb reclamation and partially on newly reclaimed land running north south in the area between the Long Island Point and BlueScope jetties. The quay and terminal is attached to the land and has a quay length of about 1.5 kilometres, a land area of about 90 hectares and the capacity to handle about million TEU per year. Stages two and three extend the terminal and quay further north from BlueScope. In the middle of stage two the quay line angles to the north-east and continues in a straight line approximately parallel to shore. The terminal follows the quay line on a 600 metre wide reclamation separated from the shore. The port concept at Hastings does not impact the industrial facilities of either BlueScope or Esso. The port needs to be designed in a way that maintains suitable marine access for both sites. The level of service they have will remain but the physical assets may change. The full development has total quay length of about 4.25 kilometres, covers 250 hectares and has the capacity to handle 9 million TEU per year. Figure 32 shows all stages of the development. 119
120 Boes Rd Figure 32. Hastings concept terminal and port environs Eramosa Rd West Jones Rd Grant Rd Mornington - Tyabb Rd Frankston - Flinders R d Eramosa Rd East Road Corridor Bungower Rd Dandenong - Hastings Rd Port Precinct Rail Corridor Rail Terminal Tyabb - Tooradin Rd Special Use Zone 1 Container Terminal 600m Wide Port Precinct Stage 3 Graydens Rd Barclay Cr BlueScope Steel Bayview Rd Stage 2 Quay line 4.1km Marine Pde Esso Long Island Dr Stage 1 Berths, swing basin and manouvering area Hodgins Rd Hendersons Rd HASTINGS High St United Source: Adapted by Infrastructure Victoria from GHD, Infrastructure Victoria Second Container Port Advice Concept options Bay West and Hastings, Infrastructure Victoria ADVICE ON SECURING VICTORIA S PORTS CAPACITY
121 Transport corridors Road and rail transport corridors to the port follow the Western Port Highway north to join the South Gippsland Freeway (road) and Cranbourne line (rail) at Lyndhurst, just south of Dandenong. We considered a corridor alignment running west to join with Peninsula Link. This is possible for the road connection, but was not suitable because the area is too hilly for an efficient rail connection, and there are significant benefits from a combined corridor having less footprint and fewer impacts. Road An upgrade of the north part of the Western Port Highway, north of Cranbourne-Frankston Road, to freeway standard is already planned due to population growth in the next few decades. The Western Port Highway south of Cranbourne- Frankston Road would need to be progressively upgraded to freeway standard, including service roads, to serve port traffic as the Port at Hastings expands. Rail The immediate rail link from the port to the existing network involves a rail terminal up to 5 kilometres long positioned in the northern part of SUZ1 and a dual track along the median of the upgraded Western Port Highway to join the Cranbourne Line at Lyndhurst, just south of Dandenong. Beyond Lyndhurst there is an issue with limited capacity for freight on the existing network. Many of the import containers would need to travel across Melbourne to destinations in the north and west of the city, and most of the export containers come on rail from the west and north of Victoria, so need to cross the city in the other direction to reach the port. The Melbourne Dandenong Cranbourne rail corridor, primarily used for metropolitan and regional passenger services, currently has limited capacity for additional freight movements, primarily in off peak times. It is expected that this capacity will reduce in future as other traffic increases and be effectively zero by about To accommodate a 10 per cent rail mode share at Hastings an additional one track with passing loops would be required from Dynon, through Melbourne, to Dandenong and Lyndhurst. To accommodate 30 per cent rail mode share an additional two tracks would be required. This possible upgrade was generally described in Infrastructure Victoria s 30-year infrastructure strategy as Regional Rail East, with commentary that this is a particularly high cost solution and further network planning is required. The main driver for Regional Rail East is the freight capacity required for a port at Hastings. There would also be the additional benefit of more access for regional train services from Gippsland. As a primary driver of a new connection, the cost of providing rail to Hastings from the city is part of our Hastings concept. The corridor is very constrained and adding additional tracks would be expensive and disruptive. Indicative solutions could be: East of Oakleigh: the corridor has similar complexity of the brown field construction of Regional Rail Link. Oakleigh Caulfield: build new tracks between elevated rail lines, demolish stations on the inside of tracks and rebuild them on the outside of tracks. Caulfield South Yarra: modify heritage stations for one track or tunnelling for two tracks. Through the CBD: enlarge the viaduct between Flinders Street and Southern Cross to add tracks. Regional Rail East is a very complex proposal and there are several possible operating concepts. Dandenong passenger services would need to move underground between Caulfield and Southern Cross to free up space for two new freight tracks on the surface. A major difference in operating concepts is whether any underground stations are required. A concept without underground stations would cost about $5 billion but a concept with new underground stations would cost about $6.5 billion. The operational concept selected would depend on conditions at the time. Given that Regional Rail East may not be required for more than 40 years, conditions and cost at the time of any construction may be very different from today. We have selected the simplest operating concept, without underground stations, as it is suitable for a strategic assessment of this type. There is significant uncertainty when looking at an asset of this type so far into the future that has to interact with a dynamic public transport system. 121

122 We considered two alternative options for a freight rail corridor across the city, but neither presents a better option than Regional Rail East: The Frankston line: a very constrained corridor, which faces the same challenges as the Dandenong corridor from Caulfield to Dynon. A new line following East Link and the Eastern Freeway: a much longer route which requires significant tunnelling. Estimated to cost four times as much as Regional Rail East. Refer to the Raylink Consulting Regional Rail East and Hastings Rail Link and GHD Concept Options Bay West and Hastings reports for more information on all of the options we considered to provide the necessary rail access to Hastings and the GHD Regional Rail East costing. Port precinct There are a number of port services that must be located close to the terminal, such as maintenance, administration and staff facilities, and customs and quarantine stations. There is enough room for all these facilities within the 3,000 hectares reserved as Special Use Zone 1 (SUZ1) north of Long Island Point. As described previously, this area has been reserved for port use or industrial use related to the port since the 1970s. The SUZ1 area also has ample room for a port-centred logistics precinct at Hastings, providing warehousing, distribution centres, empty container parks, as well as broader industrial development that could benefit from proximity to the port. The size of SUZ1 also allows for the necessary buffers from the coastline and residential areas, and the protection of pockets of remnant vegetation that exist within the zone. 122 Infrastructure Victoria ADVICE ON SECURING VICTORIA S PORTS CAPACITY
123 Figure 33. Existing channels at the Port of Hastings PEARCEDALE MORNINGTON WARNEET SOMERVILLE TYABB MOUNT MARTHA Eagle Rock Crawfish Rock Beacon BALCOMBE HASTINGS Nort h Arm FRENCH ISLAND l STONY POINT BALNARRING Chann e CRIB POINT SOMERS POINT LEO SHOREHAM COWES RHYLL Alternate Pilot Boarding Ground FLINDERS es W te rn C ha nn el VENTNOR NEWHAVEN Pilot Boarding Ground LEGEND Jetty SUZ1 - Zoned for Port Related Uses Layer Legend Anchorage Navigation Aids SUZ1 Zoned for Port Related Uses Existing Shipping Channel Existing Port Waters Existing Shipping Channel Existing Paper Size A4Port Waters Infrastructure Victoria Ports Advice - Environmental and Social Kilometers Job Number Revision Date Map AECOM, Projection: Transverse Mercator Source: Second Container Port Advice Navigation Study, 2017 Horizontal Datum: GDA 1994 Grid: GDA 1994 MGA Zone 55 G:\31\34583\GIS\Maps\Deliverables\ _000_A4P_BulkMapper.mxd Port of Hastings Approach Channel [KBM: 18] 180 Lonsdale Street Melbourne VIC 3000 Australia T F E melmail@ghd.com A 17 Feb 2017 Figure W Whilst every care has been taken to prepare this map, GHD (and DATA CUSTODIAN) make no representations or warranties about its accuracy, reliability, completeness or suitability for any particular purpose and cannot accept liability and responsibility of any kind (whether in contract, tort or otherwise) for any expenses, losses, damages and/or costs (including indirect or consequential damage) which are or may be incurred by any party as a result of the map being inaccurate, incomplete or unsuitable in any way and for any reason. Data source: DELWP, VicMap, 2016; GHD, 2016 NearMap imagery dated , extracted Created by: savenables 123
124 Channel, swing basins and berths Access to the Hastings port location is via the existing Western Channel and North Arm Channel. There is also an anchorage in the East Arm north of Phillip Island. The current configuration of channels in Western Port is shown in figure 33. Channels previous navigation simulations undertaken by the Port of Hastings Development Authority have shown that the channels into the Port of Hastings only need minor modifications to accept the design vessel of 18,500 TEU. At the entrance to Western Port, the Western Channel needs to be slightly realigned. Over the 30 kilometres of channel there is 2.6 million cubic metres of dredging required to make it suitable for ultra large container ships. Port area the port area needs a turning basin, so that ships entering the port could be swung around to face seaward with the assistance of tugs before being berthed. The turning basin is positioned in front of the stage one area between Long Island Point and BlueScope. Due to the high tidal currents experienced in Western Port the swing basin needs to be an oval shape, rather than a circle, as the ships will move with the tide as they are swung. Once swung around, ships are berthed in the stage one/two area or dragged backwards by tugs to berths further north in the stage three area. Proposed swing basins and berth pockets, as shown in figure 32, involve a dredge volume of about 21.6 million cubic metres. Dredging and reclamation The total dredging required to the channels and the port area is about 24 million cubic metres. The dredging is split between some minor dredging in the channels and more significant dredging around the port area. Geotechnical investigations found that the soil profile in the port area consists of a surface layer of soft marine clays over firmer soils consisting of layers of mixed silts, clays and sands. These investigations found no rock at depths that would affect dredging in the port area. Ideally the material dredged to create the channels and manoeuvring areas would be reused in the creation of the reclamation. Due to the nature of the material to be dredged and constraints of the site this does not seem possible at Hastings. If this material was dredged conventionally and pumped up as slurry to the reclamation, it would take a very long time before the material could be sufficiently compacted to build on. If this material was dredged by backhoe it could be kept in solid form with less compaction required, but would require double or triple handling to place in the shallow water of the reclamation site, incurring excessive costs. This means an alternative source of material is needed to form the reclamation. A desktop review did not identify any suitable sources of reclamation material in the Hastings area, either onshore or in Western Port, however there is likely to be significant quantities of suitable and accessible sand in Bass Strait. Under any of the dredging and reclamation scenarios considered at Hastings, excess dredge material would need to be disposed of. No suitable sites for dredge material grounds were identified within Western Port, as most of Western Port is either too shallow or experiences high currents which would remobilise any placed material. As a result, the dredging and reclamation methodology proposed is to dredge sediments from the port area and take them about 50 kilometres offshore to Bass Strait for unconfined sea disposal. After discharging, the dredger would reload with sand from the seafloor of Bass Strait for the return trip to Hastings, to be used to build the island reclamation. Although the turnaround time for a dredger traveling 100 kilometres per cycle is long, this method is preferred because it is less risky to build the reclamation out of sand than poor quality silt and clay materials. The proposed dredge method also seeks to minimise turbidity and environmental impact. To construct the reclamation about 5 million cubic metres of soft surface sediment needs to be dredged from the reclamation footprint, and about 18 million cubic metres of sand brought in from Bass Strait. 124 Infrastructure Victoria ADVICE ON SECURING VICTORIA S PORTS CAPACITY
125 This means the total dredge volume for the Hastings concept is about 47 million cubic metres, made up of 24 million cubic metres for the channels and port area, 5 million cubic metres for the reclamation footprint and 18 million cubic metres for the sand dredged from Bass Strait to build the reclamation. These dredging volumes are to accommodate a 18,500 TEU ship. About 45 million cubic metres of dredging would be required to accommodate a 14,000 TEU ship. Staging and construction The Hastings concept can be built in a number of stages. We have considered three stages of 3, 6 and 9 million TEU per year for the purpose of comparison with Bay West. Stage one at Hastings, located between the existing Long Island Point and BlueScope jetties, requires the least dredging and reclamation of all the stages. Significant investment in the road corridor will be required to connect to the existing network at stage one. Costs are outlined in tables 14 and 15, and are in 2017 dollars with no allowance for contingency or risk. The cost of land acquisition is not included in the estimates because our transport corridor design is not sufficiently detailed to allow a robust estimate of how many properties would need to be acquired. This may be significant at Hastings as there is a need to acquire residences within SUZ1 and along the Western Port Highway. Further detail of the cost estimates can be found in the GHD Concept Options Hastings and Bay West report. Regional Rail East is included in our cost estimates because we consider the main driver for the project to be the freight capacity required for a port at Hastings. We have assumed that the very high cost of Regional Rail East and the rail corridor would be delayed until stage two. However, if rail access is a priority when the port is developed these costs may need to be brought forward to stage one. Cost estimate We have prepared a cost estimate for the Hastings concept as set out in figure 34. Some of the elements shown on this figure, such as North-East Link, are not included in the costing. The main driver for building North- East Link would not be due to a port at Hastings. The cost benefit analysis for North-East Link is positive, as discussed in Infrastructure Victoria s 30-year infrastructure strategy, before even considering a port at Hastings. For the basis of the assessment, we assumed it will likely be built independent of the decision on the future port location. The target accuracy of our cost estimate is -40 per cent to +60 per cent, in accordance with Department of Treasury and Finance s high value/high risk guidelines for the conceptualise phase. 125
126 Figure 34. Hastings concept, elements included in costing Dynon Rail Yard MELBOURNE North-East Link (Not included in costs, route indicative only) Regional Rail East DANDENONG Upgrade of Western Port Highway North (Not included in costs) Hastings Rail Corridor Hastings Road Corridor Western Port Highway South Rail Terminal HASTINGS Port Terminal Upgrade Channel The cost estimate for the Hastings concept includes: dredging of channels and manoeuvring areas reclamation to create land for container terminal construction of quay and container terminal road corridor to the Western Port Highway and upgrade of the Western Port Highway to the Cranbourne-Frankston Road two track rail corridor to Lyndhurst Regional Rail East two new freight tracks from Dynon to Lyndhurst along the Dandenong corridor. Legend Railways Roads Indicative Extent of Dredging for Navigational Infrastructure Reclaimed Container Terminal Footprint Indicative 30 metre wide Rail Corridor Indicative 70 metre wide Road Corridor Possible Future Rail Terminal Upgrade Rail Network Upgrade Road Network Source: Adapted Infrastructure Victoria from GHD, Second Container Port Advice Concept options Bay West and Hastings, Infrastructure Victoria ADVICE ON SECURING VICTORIA S PORTS CAPACITY
127 Table 14. Estimated capital cost for Hastings concept 14,000 TEU design vessel ($ millions, 2017, undiscounted) STAGE 1: STAGE 2: STAGE 3: TOTAL 3 million TEU 6 million TEU 9 million TEU Dredging and reclamation $625 $693 $477 $1,795 Port terminal and quay $1,399 $1,190 $837 $3,426 Road and rail connections (to existing network) $1,032 $1,541 $2,573 Sub total $3,056 $3,424 $1,314 $7,794 Regional Rail East (upgrade to network, Dynon to Lyndhurst) $5,000 $5,000 TOTAL $3,056 $8,424 $1,314 $12,794 Source: Adapted by Infrastructure Victoria from GHD, Infrastructure Victoria Second Container Port Advice Concept options Bay West and Hastings, 2017 Table 15. Estimated capital costs for Hastings concept 18,500 TEU design vessel ($ millions, 2017, undiscounted) STAGE 1: STAGE 2: STAGE 3: TOTAL 3 million TEU 6 million TEU 9 million TEU Dredging and reclamation $692 $709 $486 $1,887 Port terminal and quay $1,399 $1,190 $837 $3,426 Road and rail connections (to existing network) $1,032 $1,541 $2,573 Sub total $3,123 $3,440 $1,323 $7,886 Regional Rail East (upgrade to network, Dynon to Lyndhurst) $5,000 $5,000 TOTAL $3,123 $8,440 $1,323 $12,886 Source: Adapted by Infrastructure Victoria from GHD, Infrastructure Victoria Second Container Port Advice Concept options Bay West and Hastings,
128 Bay West port concept technical evidence Why is this important? To compare the Bay West and Hastings locations, we developed a concept design for a port at each site. Based on the best available information, for Bay West we chose an island port terminal to the south of the Werribee River and in front of the 115 East treatment ponds at the Western Treatment Plant. Our concept, described in more detail below, has been designed at a strategic level, and is not the only possible concept for a container port at Bay West. Should the government decide to build a second container port at Bay West, significant further studies and work would need to be done to evaluate and recommend a design that best responds to the conditions and objectives at the time. Context The study area for the Bay West site is on the north-west coastline of Port Phillip Bay between Point Lillias and Point Cook as shown on figure 35. The study area has a number of current and past uses but is less developed than much of the Port Phillip Bay coastline. History and current use The Melbourne Water Western Treatment Plant occupies a significant part of the study area, 10,568 hectares between the Werribee River and Point Wilson. The Plant treats 52 per cent of Melbourne s sewage (about 500 mega litres per day). The Plant has a mix of conservation ponds and lagoons dedicated to sewage treatment, generally in the eastern half of the site, and agribusiness, generally located in the western and northern parts of the site. The entire Plant is included in the Port Phillip Bay (Western Shoreline) and Bellarine Peninsula Ramsar Site. The Plant provides vital sewage treatment services to Melbourne as well as high value habitat for many protected species. One of our key considerations in developing the Bay West concept is to minimise impacts on the Plant s operations (both current and future) and environmental values. There are a range of other uses within the study area, as shown in figure 35, including: Australian Department of Defence site at Point Wilson: the site has been an explosives facility since the early 1960s and covers 325 hectares. The site contains four explosive handling and storage buildings, and a 2.7 kilometre jetty constructed in the late 1950s and used to load and unload explosive ordinance. The jetty is not in use after the Victorian Regional Channels Authority Harbour Master deemed the jetty unsafe. Point Cook Royal Australian Air Force Base: the base was the first military aviation base in Australia and features an extensive complex of military aviation buildings. The base is registered on the National Heritage List and houses a Royal Australia Air Force museum. Werribee Irrigation District: the area north of the Werribee river has been used for irrigated agriculture since the late 1800s. The district is located on the flood plain of the Werribee River and is bounded by the river, Port Phillip Bay, Point Cook and the Princes Freeway. Residential areas: within or adjacent to the study area are the town of Werribee and suburb of Point Cook, and the smaller communities of Werribee South and Wyndham Cove, all located east of the Werribee River. Werribee Park Tourism Precinct: an area on either side of the Werribee River south of the Princes Freeway including the Werribee Open Range Zoo, Werribee Mansion, National Equestrian Centre, a winery and golf club. Werribee River Boat Ramp: a large, multi-lane facility for recreational fishing and boating on the Werribee River at Werribee South. Avalon Airport: located towards the southern end of the study area, Avalon Airport covers an area of 4,333 acres slightly inland from Port Phillip Bay and was founded by the Commonwealth in The Commonwealth sold the airport to transport and logistics company Linfox in The airport hosts domestic commercial flights and holds a biennial air show. Quarry: the Mountain View Quarry is a basalt quarry between the old Cheetham Saltworks, Avalon Airport and Point Wilson. The quarry is operated by the Barro group. The Spit Wildlife Reserve: located on the coast between Point Wilson and Kirk Point, the reserve has high environmental value intertidal sand spits, saltmarsh and mudflats. It is used by migratory birds and is part of the Port Phillip Bay (western shoreline) and Bellarine Peninsula Ramsar site. Point Lillias: a thin peninsula at the very west of the site which abuts the former Cheetham Saltworks. Point Lillias is listed as a wetland of international importance under the Ramsar convention as part of the Port Phillip Bay (western shoreline) and Bellarine Peninsula Ramsar site. Werribee Regional Park: A relatively new park on the western shore of the Werribee River managed by Parks Victoria. 128 Infrastructure Victoria ADVICE ON SECURING VICTORIA S PORTS CAPACITY

129 129
130 Figure 35. Bay West study area and surrounding land use Queen St Morris Rd Tarneit Rd Heaths Rd Ballan Rd Little River Coastal Reserve Werribee Regional Park Point Cook Coastal Park Railway Av Bolton Rd MOORABOOL DRAFT Werribee Tourism Precinct Bulban Rd Avalon Airport Western Treatment Plant RAAF Base Point Cook Point Cook Aviation Rd Duncans Rd Diggers Rd CREEK HOVELLS WERRIBEE RIVER GREATER GEELONG Princes Fwy Werribee Irrigation District (Market Gardens) Farrars Rd Bacchus Marsh Rd LITTLE RIVER Branch Rd Princes Hwy Old Melbourne Rd Forest Rd North LARA LITTLE RIVER WYNDHAM WERRIBEE WYNDHAM HARBOUR WERRIBEE SOUTH LAVERTON HOBSONS BAY Kirk Point Quarry Avalon Coastal Reserve (ex Salt Works) Point Lilias Point Wilson The Spit Wildlife Reserve Defence Explosive Facility Shell Pde LOVELY BANKS CORIO Wharf Rd Cox Rd Anakie Rd NORLANE NORTH SHORE PORTARLINGTON Dunn St Hood Rd Geelong Channel GEELONG Geelong Ring Rd Legend Existing Shipping Channels under Control of VRCA Coastal Reserves Western Treatment Plant Avalon Airport Marine Sanctuary Urban Areas Melbourne to Geelong railway line Source: Adapted by Infrastructure Victoria from GHD, Infrastructure Victoria Second Container Port Advice Concept options Bay West and Hastings, Infrastructure Victoria ADVICE ON SECURING VICTORIA S PORTS CAPACITY
131 Site and concept selection The Bay West port location has not previously been precisely defined. We undertook a two-stage site selection process within our study area to select a representative Bay West location and concept to compare with the Hastings port concept. The first stage was a broad desktop review of the major technical, land use, environmental and social considerations within the study area. Our initial assessment ruled out the area east of the Werribee River because of: the difficulty of locating road and rail corridors through this area the proximity of residential areas such as Point Cook, Wyndham Cove and Werribee South valued social/recreational assets such as the Point Cook Coastal and Marine Reserve, Wyndham Harbour, Werribee South Boat Ramp and the foreshore between Werribee South and Point Cook Royal Australian Air Force base incompatible existing land uses such as the Werribee Irrigation District, Wyndham Cove, and the Werribee Park Tourism Precinct. We also ruled out the area to the west of Point Wilson, due to the difficulty and cost of dredging an access channel. The particular issues with creating a channel to this area, as opposed to the area east of Point Wilson, are significantly: higher dredge volumes larger amount of dredge material to be disposed of more time, cost and environmental impact of dredging basalt (likely to require blasting). The north-western part of Port Phillip Bay is relatively shallow and extensive dredging would be required to create a shipping channel to access a port in the Bay West study area. The initial review identified marine geotechnical conditions, specifically the presence of rock, as a major knowledge gap. The presence of significant rock presents a constraint on dredging, because it is slow and expensive to dredge, typically more than ten times the cost of dredging sands, silts or clay. Hard basalt rock is known to occur in the study area in outcrops along the coast; there is a basalt quarry on Point Wilson and basalt occurs in the Geelong Channel south-east of Point Wilson. To fill this knowledge gap we commissioned a geophysics survey of the sea bed to map the extent of shallow basalt (for more information refer to the Port Phillip Bay Geophysics Survey technical report). The geophysics survey found shallow basalt at each end of the study area, an extensive area south and east of Point Wilson, and a smaller area extending offshore of Point Cook. The area in the middle, about 7 kilometres either side of the Werribee River mouth, has less rock and where rock is present it is deeper and close to shore. The extent of basalt in the study area is shown in figure 36. Ruling out the areas east of the Werribee River and west of Point Wilson narrowed our focus to the area in front of the Western Treatment Plant and the Spit Wildlife Reserve. In the second stage of the site selection process, we developed three location concepts for the Bay West port as shown in figure 36. All three concepts feature a quay and container terminal located on a reclaimed island in Port Phillip Bay, with a road and rail link back to the shore on a bridge or causeway. We proposed this arrangement because: Locating the port closer to deep water reduces dredging volumes, costs and associated environmental impacts. Reusing the material dredged from the channels to construct the reclamation, if suitable, may reduce the cost and environmental impact of disposing of dredge material elsewhere. There is reduced impact on the coastline and existing land users along the coast, especially the Western Treatment Plant. The Werribee River option consists of a 4.1 kilometre island terminal with a strait quay located south of the Werribee River mouth, offshore of the Western Treatment Plant. The transport corridor crosses the coast to the west of the Werribee River then heads north and west around the Western Treatment Plant treatment lagoons to the future Outer Metropolitan Ring Road junction with the Princes Freeway. The access channel heads straight for deep water in the middle of the bay. 131
132 d Morris Rd Derrimut Rd Farrars Rd Branch Rd Riv er St LITTLE RIVER ne d Ol ur bo el M Rd Little River Rd 160 South R Cornwall Rd Point Cook Rd d d Aviation Rd Duncans Rd You Yangs Rd wy sf Sneydes R Diggers Rd e inc Pr nr Dunnings Rd St ee ri b d er R W ain M er Little Riv Rd - Ripley lba Bu ry LAVERTON Q u ee n S t e St Ch er Maidston Bolton Rd WERRIBEE F o r s y th Rd ER Boa Bvd rdw alk R Fitzgera ld Rd Tarneit Rd n Heaths Rd E RIV Kororoit Creek Rd Bladin St Sayers Rd Hogans Rd Somerville Rd e iev Gr e Pd lla Ba LITT L Park West Dr Mille Rd rs Station Rd Western Ring Rd G Bacch Hopkins Rd Robinsons Rd DERRIMUT Dohertys Rd Figure 36. Initial location concepts for Bay West Wright St t Wes Dr Park Boundary Rd Ballarat Rd Tilbu rn Rd SUNSHINE Ex h B ea c Rd d n te to f a sh l lo w ba sa lt Werribee River location (red) es inc y Pr Hw LARA Kirk Point terminal (green) and corridor Point Wilson terminal (purple) and corridor LEGEND ng elo Ge d R PORTARLINGTON DRAFT Source: Adapted by Infrastructure Victoria from GHD, Infrastructure Victoria Second Container Port Advice Concept Options Bay West and Hastings, 2017 Possible Future Road / Rail Western Treatment Plant Links Indicative 30m Rail Avalon Airport Corridor The Spit Wildlife Reserve Indicative 70m Road Corridor Urban Area OMRR Corridor Freeway Highway Arterial River Railway Paper Size A ,400 2,800 4,200 Possible Future Rail Terminals Terminal Options Kirk Point Option Point Wilson Option Werribee River Option Infrastructure Victoria Ports Advice 5,600 Job Number Revision Date Meters Map Projection: Transverse Mercator Horizontal Datum: GDA 1994 Grid: GDA 1994 MGA Zone 55 G:\31\34508\GIS\Maps\Deliverables\ A4P-BulkMapper.mxd Bay West - Terminal Options [KBM: 54] 180 Lonsdale Street Melbourne VIC 3000 Australia T F E melmail@ghd.com A 10 Feb 2017 Figure W Whilst every care has been taken to prepare this map, GHD (and DATA CUSTODIAN) make no representations or warranties about its accuracy, reliability, completeness or suitability for any particular purpose and cannot accept liability and responsibility of any kind (whether in contract, tort or otherwise) for any expenses, losses, damages and/or costs (including indirect or consequential damage) which are or may be incurred by any party as a result of the map being inaccurate, incomplete or unsuitable in any way and for any reason. Data source: DELWP, VicMap, 2016; GHD, 2016 Created by: savenables 132 Infrastructure Victoria ADVICE ON SECURING VICTORIA S PORTS CAPACITY
133 The Point Wilson and Kirk Point options have similar terminal locations on the eastern edge of the Point Wilson basalt flow. The terminal and quays are broken into two parallel islands due to the restricted area available between the basalt and the existing channel to Geelong, and the desire to minimise the wave shadow impact on the Spit Wildlife Reserve and the Western Treatment Plant discharge mixing zones. For both these options the channel alignment with the least dredge volume is to follow and enlarge the existing Geelong Channel. The Kirk Point and Point Wilson options feature different transport corridor alignments: Kirk Point: the corridor heads north from the terminal, crosses the shoreline around Kirk Point and heads north across the agricultural zone of the Western Treatment Plant to the future Outer Metropolitan Ring Road junction. Point Wilson: the corridor heads west from the terminal and crosses the coast on the undeveloped land owned by the Mountain View Quarry, in between the Point Wilson Defence site and the Spit Wildlife Reserve. It then heads north between the Western Treatment Plant and Avalon Airport to join the Princes Freeway south of Little River. The Point Wilson transport corridor alignment is 12 kilometres longer than either of the other options for the majority of road freight to and from Melbourne. It does however offer the advantage of a substantial area of industrial land located closer to the port. For the other options, the closest available land may be north of the Princes Freeway due to the location of the Western Treatment Plant. The Werribee River option was selected as the best representative concept for comparison with Hastings. We considered all of the options possible, and other options may exist in the area between Werribee River and Point Wilson. The location assessment should be revisited in the future if conditions change or more information is available. Details of the evaluation are provided in the GHD Concept Options Bay West and Hastings report. Our reasons for selecting the Werribee River location are: It has the lowest chance of impact on Western Treatment Plant discharge mixing zones. The highest value environmental areas occur on the western part of the Western Treatment Plant and in the Spit Wildlife Reserve. The Werribee River location largely avoids these areas. The coastline behind the Werribee River location is experiencing erosion and has been armoured to protect treatment lagoons. Locating the port offshore would protect this area from further wave attack. The transport corridor crosses the treatment-focused eastern half of the Western Treatment Plant, not the more conservation-focused western half crossed by the Kirk Point corridor. It has the shortest road transport corridor to Melbourne. It has the smallest channel dredging volumes and therefore least cost and lower environmental impact. Lower risk of encountering rock offshore mean there is greater flexibility in the location of the reclamation, which gives greater opportunities to reduce dredging volume or to balance cut and fill, reducing the need to dispose of dredge material elsewhere in the bay. 133
134 Design vessels For the Bay West concept we have considered two design vessels. The first is a 14,000 TEU vessel, the largest vessel that can transit the existing channels through Port Phillip Heads, as established by navigation simulations carried out at the Australian Maritime College. The second scenario is a larger 18,500 TEU vessel, included for direct comparison with Hastings. Navigation simulations indicated that for vessels of this size to safely transit the heads it would be necessary to widen the Great Ship Channel. This option is included for comparison purposes, at this stage we are not proposing any further dredging of the Great Ship Channel at the Port Phillip Bay Heads. Table 16 shows the vessel characteristics for the two scenarios we modelled. Bay West concept design Terminal location In the selected Werribee River concept the container quay and terminal are located on a reclaimed island in Port Phillip Bay, south of the Werribee River mouth and about 1.5 kilometres offshore of the Western Treatment Plant. There is a 4.1 kilometre strait quay line backed by a 600 metre deep terminal area, providing about 250 hectares of land and a capacity of 9 million TEU per year. The terminal area includes ship to shore cranes, a container stacking area and road and rail loading and unloading. The island also accommodates some port services and maintenance functions. Figure 37 shows the terminal location. Table 16. Design vessel characteristics for Bay West and Hastings SCENARIO 1: 14,000 TEU Constrained by existing channel through Port Phillip Heads 14,000 TEU New Post Panamax Based on MCS Daniela 366 metre LOA 51.2 metre beam 13.5 metre sailing draught SCENARIO 2: 18,500 TEU Channel through Port Phillip Heads widened, not deepened 18,500 TEU Ultra Large Container Ship Based on Maersk, triple E vessel. 400 metre LOA 59 metre beam 14.0 metre sailing draught Source: Infrastructure Victoria Infrastructure Victoria ADVICE ON SECURING VICTORIA S PORTS CAPACITY
135 Figure 37. Bay West concept terminal and port environs FTRail terminal Outer Metropolitan Ring Road EK CHERRY CRE Ballan Rd Bulban Rd Princes Hwy Heaths Rd Tarneit Rd Synnot St Railway Av WERRIBEE Princes Fwy Diggers Rd Morris Rd East bound road corridor Duncans Rd Princes Fwy Sneydes Rd Palmers Rd Aviation Rd CHEETHAM CREEK Queen St LITTLE RIVER West and north bound road and rail corridors Princes Fwy Rail Sidings WE RRIBEERIVER Beach Rd WERRIBEE SOUTH Road & rail bridge Princes Hwy Port services Container terminal 600m wide Stage 3 Stage 2 Stage 1 Berths, swing basin and manouvering area Quay line 4.1km long New channel Source: Adapted by Infrastructure Victoria from GHD, Infrastructure Victoria Second Container Port Advice Concept options Bay West and Hastings, 2017 Transport corridors A bridge or causeway carrying road, rail and services connects the terminal island to the shore west of the Werribee River. The main road and rail transport corridor then heads north and west around the current Western Treatment Plant treatment lagoons and planned future treatment areas to join the future Outer Metropolitan Ring Road junction with the Princes Freeway. We have not included the cost of the Outer Metropolitan Ring Road in our cost estimates. The Outer Metropolitan Ring Road is likely to have a positive project cost benefit analysis without considering Bay West, as discussed in Infrastructure Victoria s 30-year infrastructure strategy. We assume that population and business growth in Melbourne s west will drive the road s construction, independent of a future port location. A second possible road alignment runs north to join the Princes Freeway south of Werribee, saving about 10 kilometres for traffic heading east on the Princes Freeway. We have discussed both alignments with Melbourne Water, and the alignments have been designed to minimise the impact on the Western Treatment Plant s current and future operations. The rail line follows the main corridor and links with the Regional Rail Link (Geelong-Melbourne line) at the future Outer Metropolitan Ring Road junction. The future Outer Metropolitan Ring Road proposal includes a rail line to the proposed Western Interstate Freight Terminal at Truganina. A rail yard up to 3 kilometres long to break up long trains into shorter units is located to the west of the future Outer Metropolitan Ring Road alignment. We have assumed that the longest interstate trains will be broken up at the Western Intermodal Freight Terminal proposed for Truganina. This means that the Bay West rail terminal can be smaller than the proposed Hastings terminal. This rail terminal is about 17 kilometres from the port, so for efficient operations another set of 600 metre sidings is required at the coast where trains can wait to access the port terminal. The possible road and rail alignments, the rail terminal and the additional rail sidings are all shown in figure
136 Port precinct There are a number of port services that must be located close to the terminal, such as maintenance, administration and staff facilities, and customs and quarantine stations. These critical port services would be located on the island reclamation. Other port related logistics tasks such as warehousing, distribution centres, and empty container parks would need to be located further away, to avoid disrupting operation of the Western Treatment Plant. The closest potentially available land is north of the Princes Freeway, 13 or more kilometres from the port gate. There is also ample suitable land along the Princes Freeway and the Outer Metropolitan Ring Road between the port and its markets. Much of the logistics industry is already based in the western suburbs and may choose to remain in their current locations, as there is suitable vacant industrial land, which could host port related businesses. Channel, swing basins and berths For ships to reach the port at Bay West, dredging is required to create a deep access channel, a turning basin and berth pockets where ships sit alongside the quay. Ships accessing Bay West would use the existing channels through the Port Phillip Heads. Once in Port Phillip Bay the conditions for navigating up the Bay West channel and manoeuvring onto the berth are relatively benign, as the north-western part of the Bay does not experience strong currents or large waves. Extreme winds may impact vessel handling, as at many other ports. The berth and manoeuvring areas in front of the quay are 250 metres wide and there is a turning basin in the middle of the quay about metres wide (for the 14,000 and 18,500 TEU design vessels). From the swing basin there is a one-way channel about 10 kilometres long, which heads east to the deep water in the middle of the Bay. This channel has a declared depth of 14.5 metres for the 14,000 TEU design vessel or 15 metres for 18,500 TEU design vessel. Widening of the Great Ship Channel If access for 18,500 TEU ships was required then it may be necessary to widen the Great Ship Channel through the Heads. This has been included and costed as an option to allow direct comparison with the Hastings concept. As noted in the discussion of future ship sizes above, we do not believe that Victoria will need to cater for these ships for a very long time, if at all. In the future the effects of sea level rise and improvements in ship navigation and control may mean that further dredging of the Heads will never be required. The modification we have considered in this option is an increase in width of the Great Ship Channel from 245 metres to about 425 metres. The channel would be widened on the east side to avoid marine national parks. This would involve deepening of the shallower eastern ship channel over Rip Bank and Nepean Bank to make the channel the same depth as the Great Ship Channel as shown in figure 7. The volume of dredging required for this modification is 100,000 cubic metres. This would comprise less than 1 per cent of the total dredging volume required to accommodate 18,500 TEU vessels at Bay West. Dredging and reclamation The dredge volume to create channels, turning basin and berths is estimated at 19 million cubic metres for the 14,000 TEU design vessel or 20 million cubic metres for the 18,500 TEU design vessel. The dredge material is likely to consist of a small amount of soft surface sediments, and a larger amount of underlying stiff to hard material to be confirmed by further geotechnical investigations. The Bay West concept offers greater flexibility in the reuse of dredge material than Hastings. Adjusting the position of the reclamation into deeper or shallower water allows the volume of material to be dredged to be balanced with the volume of material required for reclamation. The low current conditions and relatively deep water at the reclamation site also mean that, if required, large floating plant can dredge and place soft clays in a way that is suitable for the construction of the reclamation. On this basis we have assumed reuse of all dredge material. 136 Infrastructure Victoria ADVICE ON SECURING VICTORIA S PORTS CAPACITY
137 Although we propose reusing dredge material in the reclamation, an additional 9 million cubic metres of sand would need to be dredged from elsewhere in Port Phillip Bay to construct the reclamation. Much of this material could be sourced from existing spoil grounds and the ongoing maintenance dredging of channels in the southern part of Port Phillip Bay by the Port of Melbourne. There is an opportunity to reduce the complexity and cost of the Bay West construction by stockpiling suitable sand from ongoing maintenance dredging operation in a location where it can be easily accessed for the future construction of the reclamation. Given the volume of sand required, this stockpiling should begin in the short term. This means the total dredge volume for the Bay West concept is about 28 million cubic metres, made up of 19 million cubic metres for the channels and port area and 9 million cubic metres of sand dredged from elsewhere in Port Phillip Bay to build the reclamation. These dredging volumes are to accommodate a 14,000 TEU ship. About 29 million cubic metres of dredging would be required to accommodate a 18,500 TEU ship. Staging and construction The Bay West concept can be built in a number of stages. We considered three stages of 3, 6 and 9 million TEU per year for the purpose of comparison with Hastings. Stage one of the potential Bay West development has a relatively large capital expenditure, because the full channel and turning basin must be constructed to begin operating the port. Cost estimate We prepared a cost estimate for the Bay West concept as set out in figure 38. Costs are outlined in tables 17 and 18, and are in 2017 dollars with no allowance for contingency or risk. Further detail of the cost estimates can be found in the GHD Concept Options Hastings and Bay West report. We have not included the cost of the Outer Metropolitan Ring Road. The Outer Metropolitan Ring Road is likely to have a positive project cost benefit analysis without considering Bay West, as discussed in Infrastructure Victoria s 30-year infrastructure strategy. The Outer Metropolitan Ring Road is included in the Victorian Integrated Transport Model (VITM) 2046 Reference Case, and we assume that population and business growth in Melbourne s west will drive the road s construction, independent of a future port location. The target accuracy of our cost estimate is -40 per cent to +60 per cent, in accordance with Department of Treasury and Finance s high value/high risk guidelines for the conceptualise phase. The exact timing of rail network upgrades will depend on the capacity of the existing network when stage one is developed and the extent to which the Port of Melbourne is operating with rail access at that time. Similarly, widening of the shipping channel through the Heads may not be required but it is a possible option that could be activated. 137
138 Figure 38. Bay West concept, elements included in costing Dynon Rail Yard Upgrade Rail Line to Dynon Outer Metropolitan Ring Road (Not included in costs, route indicative only) Rail Terminal WERRIBEE Bay West Road Corridor MELBOURNE Port Terminal Bay West Rail Corridor New Channel GEELONG Possible widening of Great Ship Channel (Option only) The cost estimate for the Bay West concept includes: dredging of channels and manoeuvring areas reclamation to create land for container terminal construction of quay and container terminal north and west-bound corridor to the Princes Freeway Outer Metropolitan Ring Road junction rail corridor to the Geelong-Melbourne line Outer Metropolitan Ring Road junction east-bound road corridor to Princes Freeway south of Werribee a rail terminal west of the Outer Metropolitan Ring Road upgrades to the existing rail network to provide two freight tracks from Outer Metropolitan Ring Road junction to Dynon. Legend Railways Roads Indicative Extent of Dredging for Navigational Infrastructure Reclaimed Container Terminal Footprint Indicative 30 metre wide Rail Corridor Indicative 70 metre wide Road Corridor Possible Future Rail Terminal Upgrade Rail Network Upgrade Road Network Source: Adapted by Infrastructure Victoria from GHD, Infrastructure Victoria Second Container Port Advice Concept options Bay West and Hastings, Infrastructure Victoria ADVICE ON SECURING VICTORIA S PORTS CAPACITY
139 Table 17. Estimated capital costs for Bay West concept 14,000 TEU design vessel ($ millions, 2017, undiscounted) STAGE 1: STAGE 2: STAGE 3: TOTAL 3 million TEU 6 million TEU 9 million TEU Dredging and reclamation $1,221 $181 $119 $1,521 Port terminal and quay $1,680 $952 $919 $3,551 Road and rail connections (to existing network) $746 $23 $13 $782 Sub total $3,647 $1,156 $1,051 $5,854 Upgrade to existing rail network, Dynon to Werribee $290 $290 TOTAL $3,647 $1,446 $1,051 $6,144 Source: Adapted by Infrastructure Victoria from GHD, Second Container Port Advice Concept options Bay West and Hastings, 2017 Table 18. Estimated capital costs for Bay West concept 18,500 TEU design vessel ($ millions, 2017, undiscounted) STAGE 1: STAGE 2: STAGE 3: TOTAL 3 million TEU 6 million TEU 9 million TEU Dredging and reclamation $1,281 $181 $119 $1,581 Port terminal and quay $1,736 $952 $919 $3,607 Road and rail connections (to existing network) $746 $23 $13 $782 Sub total $3,763 $1,156 $1,051 $5,970 Upgrades to existing rail network, Dynon to Werribee $290 $290 Widening of Great Ship Channel option $160 $160 TOTAL $3,763 $1,606 $1,051 $6,420 Source: Adapted by Infrastructure Victoria from GHD, Second Container Port Advice Concept options Bay West and Hastings,
140 Economic evidence for where Cost effectiveness evaluation To evaluate how cost effective locating a new port at Bay West or Hastings would be, we started by estimating the total economic cost of meeting Victoria s total container demand at either location, in combination with the Port of Melbourne s likely remaining capacity, until To make sure our evaluation was comprehensive we assessed the total economic cost, rather than only the cost of building and operating the port itself. For our evaluation, included in the total economic cost was: building the infrastructure (capital costs) operating and maintaining the infrastructure (operating costs) changes in transport network costs, including impacts on freight and logistics supply chain costs broader social and environmental costs including emissions and vehicle accident costs. The Hastings port concept and Bay West port concept sections present our preferred port concepts and the sequence of port investments and complementary infrastructure required to meet total demand up to 9 million TEU at either site. To be able to compare the port options at Bay West and Hastings, we estimated the present value of the total economic cost for each location, which takes the costs incurred over the life of the development, and turns the costs into today s dollars. To determine the present value we used the same national guidelines, modelling techniques, inputs and parameters used in traditional cost benefit analysis. This modelling is completed to allow for a comparison and to see relative results. The modelling period begins in 2017 and has an operating period out to These dates have been used for comparative modelling purposes only. In reality a second port is likely to be constructed around 2050 and operate for 100 years or more. The modelling dates can be changed but we do not consider this would change the relative difference in comparing possible ports at Hastings and Bay West. The timing and size of investments at Bay West and Hastings are different. For instance, the first stage of a port at Bay West would require more dredging than Hastings, because a Bay West port would need to be developed on a greenfield site, while the Hastings stage one can leverage the existing Port of Hastings. Another example is the significant cost of providing rail access to the Port of Hastings, which would need to be made at stage one or two of the development. Providing full rail access to Hastings requires a new rail line from Hastings to Lyndhurst ($1.5 billion) and an upgrade of the existing network from Lyndhurst to Dynon. This upgrade is known as the Regional Rail East project, and would cost around $5 billion. At Bay West, we have assessed the required existing network upgrade to cost only around $290 million. To determine the degree to which the rail cost influences the outcome of the evaluation, we have tested two Hastings scenarios which provide bookends i.e. best and worst case scenarios for rail costs. These scenarios allow like for like comparison but do not represent our recommended development sequence at either location, where the cost of the rail infrastructure may be in stage one or two. Table 19. Total capital cost estimate for Bay West and Hastings TOTAL ($, millions) Hastings Hastings (minimum rail) Bay West Dredging and reclamation 1,795 1,795 1,500 Port terminal and quay 3,426 3,426 3,551 Road and rail connections (to existing network) 2,573 1, Sub total 7,794 6,294 5,854 Upgrades to existing rail networks 5, TOTAL 12,794 6,294 6,144 Present value capex (assuming 2017 start, 4 per cent discount rate) 9,800 4,100 4,600 Source: Adapted by Infrastructure Victoria from GHD, Infrastructure Victoria Second Container Port Advice concept options - Bay West and Hastings, Infrastructure Victoria ADVICE ON SECURING VICTORIA S PORTS CAPACITY
141 Economic evaluation scenarios: Bay West design for 14,000 TEU ships. No upgrade of channel through the Heads. Required upgrades to the existing rail network completed in stage one. Hastings design for 14,000 TEU ships, including rail connections and with Regional Rail East constructed in stage one. Hastings minimum rail design for 14,000 TEU ships. The port uses the existing rail connection via the Stony Point and Frankston line. The new line from Hastings to Lyndhurst and Regional Rail East are not constructed. As a result, rail capacity is severely limited by the constraints of the existing network. Figure 39. Capital cost to expand capacity at Bay West $1,600 M 16M $1,400 M $1,200 M In no situation does actual investment need to start in 2017 but to support comparison, economic modelling commences in Actual project costs would be incurred later in time. 14M 12M Cost (in $M) $1,000 M $800 M $600 M $400 M Stage 1 Stage 2 Stage 3 10M 8M 6M 4M Capacity (in TEU) $200 M 2M $0M 0M Financial Year Total Capex Bay West capacity Source: Deloitte for Infrastructure Victoria Figure 39 and 40 show the tranches of capacity expansion and capital cost profile for the economic evaluation scenarios at Bay West and Hastings. Figure 40. Capital cost to expand capacity at Hastings $1,600 M 16M $1,400 M $1,200 M Stage 1 In no situation does actual investment need to start in 2017 but to support comparison, economic modelling commences in Actual project costs would be incurred later in time. 14M 12M Cost (in $M) $1,000 M $800 M $600 M $400 M Stage 2 Stage 3 10M 8M 6M 4M Capacity (in TEU) $200 M 2M $0M 0M Financial Year Total Capex Hastings Total Capex Hastings with minimum rail Hastings capacity Source: Deloitte for Infrastructure Victoria 141
142 Transport costs A port is a long-lived asset, and a port at either Hastings or Bay West will service Victoria for over one hundred years. Ports are also a gateway for goods entering and leaving Victoria, so the port location will generate significant road and rail traffic to and from the port over its life. As a result, the capital and operating costs of the port itself are only part of the costs we need to consider when we evaluate the economic cost of locating a port at either Hastings or Bay West. Because of the significant road and rail journeys that will be generated to and from a new port at either Bay West or Hastings, we need to examine the likely transport costs of either option. For the statewide economy, the most significant impact on economic costs of moving the port from its current location is transport costs. In Victoria, travel time for commuters and business is not explicitly costed through road pricing. It is commonly acknowledged, however, that there is an economic cost to the time it takes to travel from an origin to a destination. This is particularly true in the freight and logistics industry, where time is explicitly costed and priced in the operation of the industry, which is either absorbed by transport operators or passed on to consumers. We used the VITM to measure the total kilometres travelled by all vehicles and total travel time for a 9 million TEU port at either Bay West or Hastings. These measures cover passenger, port and non-port related freight vehicles. We then took the total kilometres travelled and time travelled and used an economic model to convert these transport costs to an economic cost for each year of the port s operations. The economic cost of transport also includes a cost for broader social and environmental costs, for example emissions and road accident costs, based on national parameter values. For a more detailed explanation of the transport modelling process and outcomes see the Deloitte/Jacobs, Port strategic transport modelling, 2017 report. Figure 41 shows how heavy commercial vehicle traffic patterns change when moving the port to Hastings from Melbourne, operating at its full size of 9 million TEU per year. Figure 42 shows how heavy commercial vehicle traffic patterns change when moving the port to Bay West from Melbourne, operating at its full size of 9 million TEU per year. To measure differences in changes for transport network costs we used the VITM to model the changes in road trips that would happen if we moved the port. 142 Infrastructure Victoria ADVICE ON SECURING VICTORIA S PORTS CAPACITY
143 Figure 41. Change in total movements of heavy commercial vehicles with a full container port move from Melbourne to Hastings (2046) Daily Truck Volume Difference Volume decrease Volume increase Port of Melbourne Inset Truck volume daily difference Source: Deloitte/Jacobs, Infrastructure 2046: Victoria C1 (all Second at Port of Ports Melbourne) Advice - C2B Port (all at strategic Hastings) transport modelling, 2017 report. Figure 42. Change in total movements of heavy commercial vehicles with a full container port move from Melbourne to Bay West (2046) Daily Truck Volume Difference Volume decrease Volume increase Port of Melbourne Inset Truck volume daily difference Source: Deloitte/Jacobs, Infrastructure 2046: Victoria C1 (all Second at Port of Ports Melbourne) Advice - C3B Port (all strategic Bay West) transport modelling, 2017 report. 143
144 Table 20 describes the heavy vehicle travel time and distance associated with the proposed Hastings and Bay West port locations, operating at their full size of handling 9 million TEU a year. Bay West is the preferred option on both measures. Total transport costs, including environmental and social externalities are provided in table 21. Bay West has the lowest transport cost. Table 20. Port traffic cost comparison Measure Difference per day, per TEU Hastings Bay West Heavy Commercial Vehicle kilometres travelled per TEU, per day Heavy Commercial Vehicle hours travelled per TEU, per day kms/TEU/day mins/TEU/day Source: Source. Deloitte/Jacobs, Infrastructure Victoria Second Container Port Advice port strategic transport modelling, 2017 Cost effectiveness results Table 21 shows the results of the cost effectiveness evaluation for the period 2017 to The cost effectiveness evaluation demonstrates that a port at Bay West has a lower total economic cost than a port at Hastings. It costs around $10 billion less to build and operate a port at Bay West than Hastings. Even without the cost of Regional Rail East, Bay West still costs $9 billion less than Hastings, because greater vehicle kilometres travelled significantly adds to transport costs for a Hastings port option. 144 Infrastructure Victoria ADVICE ON SECURING VICTORIA S PORTS CAPACITY
145 Table 21. Total economic cost for Bay West and Hastings ($ billions, present value, discount rate 4 per cent, assuming 2017 start) 2017 dollars Bay West Hastings Hastings minimum rail Capital cost 4.6 B 9.8 B 4.1 B Operating cost 5.8 B 6 B 5.8 B Total capital and operating cost 10.4 B 15.7 B 9.9 B Total transport cost including environmental and social cost of travel B B B TOTAL B B B Source: Deloitte, Infrastructure Victoria Second Container Port Advice economic advice, These costs show that over our modelling period it will always be more costly to operate Hastings compared to Bay West. The operating and transport costs would be incurred every year of the ports operation over 100 years or more. Therefore, supply chain costs can have a significant economic impact. In our analysis, the capital and transport costs are both differentiators between Hastings and Bay West. Bringing future cash flows to a present value to compare them requires applying a discount rate. Total costs will be different depending on the discount rate used. In cost benefit analysis rates of 4 per cent, 7 per cent and 10 per cent are often used to test the impact of a change in discount rates on total economic costs. Table 22 shows the total economic costs for each location using discount rates of 4 per cent, 7 per cent and 10 per cent. Changing the discount rate does not change the ranking of the options. Bay West always has the lower total economic cost, including against Hastings without rail. Table 22. Total economic cost by discount rate TOTAL ECONOMIC COST Discount rate Bay West Hastings Hastings minimum rail 4 per cent B B B 7 per cent 1051 B B B 10 per cent B B 745 B Source: Deloitte, Infrastructure Victoria Second Container Port Advice economic advice,
146 Impact on Gross State Product and employment Ports are critical international gateways for the import and exports of goods. Efficient supply chains support economic growth, help Victoria to maintain its competitiveness and increase its productivity. Gross State Product is the measure of Victoria s overall economic output. It is the sum of the market value of all final goods and services produced by industries within Victoria. We assessed how moving the port to either Hastings or Bay West impacted Victorian Gross State Product relative to the investment required to build the port at these locations. The numbers presented were estimated against a base case of continuing to satisfy demand at the Port of Melbourne. Results Our modelling estimates that for every dollar of capital expenditure in a new port at Hastings there is an increase in Gross State Product of 44 cents. This is not an economically efficient investment, as the increase in Gross State Product is 56 cents less than the capital investment in the new port. For an economic asset such as a port, every dollar of capital expenditure would be expected to contribute more than a dollar in Gross State Product. By comparison modelling estimates that for every dollar of capital expenditure on a new Bay West port there in an increase in Gross State Product of $1.06. The impact of Bay West on Gross State Product is of marginal benefit, but it is much greater than Hastings. Table 23 summarises these results. Deciding to build a second port will affect state employment. The total level of state employment is impacted by the oneoff investment during planning and construction of a port. There is also a long-term employment impact from changes in operating efficiency and traffic flows. Building a new port at either location will create around 2,000 direct jobs. In both locations, the ongoing operation of the port and related industries would attract thousands of jobs to the region the port is located in. Although our analysis demonstrated overall net job creation is not a significant differentiator between locations. See GHD Concept Options Bay West and Hastings, Deloitte, Economic Advice, 2017, and Deloitte, Multi-criteria assessment (MCA), 2017 reports for further information. Table 23. Bay West and Hastings impact on Gross State Product Bay West Victoria Hastings Victoria Incremental capital expenditure ($ billion, PV) 3.30 B 7.73 B Impact on Gross State Product relative to investment required Source: Deloitte, Infrastructure Victoria Second Container Port Advice economic advice, Infrastructure Victoria ADVICE ON SECURING VICTORIA S PORTS CAPACITY

147 Supply chains Ports are key gateways for commodities entering and exiting Victoria. They play a role in larger global and national supply chains. These supply chains are price sensitive. Any change in cost may affect the ability of Victorian producers to reach export markets or raise the cost of imported goods. To compare the suitability of locating a port at either Bay West or Hastings, we had to investigate the likely impact of locating a port at either location on import and export supply chains. Our supply chain analysis assessed the change in supply chain costs from moving the port to a new location. We also assessed whether the port locations had a different impact on importers and exporters and whether the impact is different for travel to and from metropolitan or regional areas. We identified a number of generic supply chains to estimate freight movement patterns, and allow us to test how moving the port is likely to impact supply chain costs. We have considered the following factors to estimate our supply chain costs: whether a commodity is an export, an import or an empty container whether the commodity is a finished or an intermediate good the origin and destination of a commodity, and the distance it travels Supply chains are structured according to a number of different factors, which vary from business to business. Nevertheless, locating a second container port at either Bay West or Hastings would change the shape of supply chains. The key port related drivers that may influence the shape of freight movement patterns are: the requirement to get containers away from the port as soon as possible to limit dwell time at the port the restricted access to distribution centres, factories, retail sites and the like, which are not open 24 hours per day congestion on the road network adjacent to the port - particularly during the morning and afternoon peak geographic distance of the port from the centres of activity such as distribution centres, retail centres, and manufacturing the requirement to locate distribution centres and warehousing on relatively low cost land adjacent to key transport links. A detailed assessment of these factors is available in the Deloitte Supply chain assessment methodology report. For comparison, our supply chain model determined the average supply chain costs for different port options. Each port location required a slightly different set of supply chains to account for the differences in land available within 0-15 kilometres of the port for staging of containers. Currently at the Port of Melbourne, about 70 per cent of import containers are staged. It is assumed a high level of staging would continue at both Hastings and Bay West. This is due to the level of congestion likely to be present in 2046, the fact that ports are 24/7 operations but many final deliveries are due during business hours, and because many customers do not take full container loads so containers need to be unpacked before final delivery. Full information on the supply chain modelling and staging breakdown is available in the Deloitte Supply chain assessment methodology report. 147
148 Supply chain impact results Locating a port at Hastings or Bay West would prompt supply chains to adapt over time. For Bay West, much of the staging and warehousing activity already occurs in the west. The scale of these activities in the north and the west is likely to increase over time with a port located at Bay West. For both ports, the change in supply chains is likely to be most evident for staging, the first move of the container after it is collected from the port. Table 24. Import supply chain costs (2046) Bay West Avg. cost per TEU Hastings Avg. cost per TEU Metropolitan $500 $640 Regional $918 $1,011 Source: Deloitte, Infrastructure Victoria Second Container Port Advice supply chain assessment methodology, 2017 Table 25. Export supply chain costs (2046) Bay West Hastings Hastings minimum rail Avg. cost per TEU Avg. cost per TEU Avg. cost per TEU Metropolitan $387 $501 $501 Regional $572 $610 $817 Source: Deloitte, Infrastructure Victoria Second Container Port Advice supply chain assessment methodology, Infrastructure Victoria ADVICE ON SECURING VICTORIA S PORTS CAPACITY
149 The final destination of imported intermediate goods and the origin of exports are not sensitive to a port location. Their supply chains are unlikely to adapt if the port is relocated. See the Supply chain assessment methodology report for further information. For this reason export origins and the destination of imported intermediate goods does not change depending on the location of the port. We have modelled these origins and destinations as they currently occur and are measured by the Port of Melbourne and Dynon Rail terminals: 2009 container logistics chain study full report. To fully understand the supply chain cost impact, table 25 also includes results for the Hastings supply chain with minimal rail access provided for regional export rail. We considered Bay West and Hastings with full rail access, and Hastings with minimum rail. In the minimum rail scenario Regional Rail East is not built and port freight uses the limited capacity on the existing Frankston and Stony Point lines. In the minimum rail scenario the supply chain cost for exporters increases by over $200 per TEU because a significant volume of regional exports are transported from the north and west of Victoria. Many of these exports are also currently transported to the port by rail. Even with a rail link, bringing exports from the north and west of Victoria to a potential port at Hastings imposes an additional cost. This additional cost is very significant for a Hastings port without rail. Overall, Hastings supply chains cost more for most parts of Melbourne and for all regions except for Gippsland. This is to be expected as distance travelled is a significant cost input and Hastings adds further distance to most supply chains. While this additional cost may not be significant for many retail import supply chains due to the value of the cargo being moved, many manufacturing supply chains (and likely most exports) are sensitive to additional costs. This is because of the lower value of goods being moved and because they are subject to greater international competition. Potential environmental impacts We have undertaken a desktop review of existing environmental, heritage and social assets, values and uses to identify issues that are likely to be differentiators between the Bay West and Hastings sites. We considered issues identified by our specialist consultants and those raised by community members and stakeholders during consultation. Our assessment considered the risks posed by the development footprint, construction and operation of the port. Our assessment is based on available data and current understanding of issues. We did not collect any new data for this study. More data collection, better understanding of issues and more design work to mitigate the identified risks could change the risk profile of the Hastings or Bay West proposals. Below we discuss the issues we consider to be major differentiators between the Bay West and Hastings concepts. For more detail on these and other issues considered, and the risk assessment methodology, see the GHD Environment and social advice report. The footprint of our Hastings and Bay West concepts are overlayed on key vegetation types and Ramsar site boundaries in figures 43 and 44 respectively, to give an indication of the habitat directly impacted. 149
150 Hendersons Rd Boes Rd Bayview Rd Long Island Dr Figure 43. Hastings development footprint overlayed on selected habitats and Ramsar site Jones Rd Mornington - Tyabb Rd Frankston - Flinders Rd TYABB Dandenong - Hastings Rd Graydens Rd Marine Pde OLI VERS C REEK KINGS CREEK Hodgins Rd HASTINGS High St WARRINGIN ECRE EK Legend Western Port Ramsar Wetland Bare Intertidal Sediment Seagrasses 140 Mangrove Shrubland 9 Coastal Saltmarsh Source: Adapted by Infrastructure Victoria from GHD, Second Container Port Advice Environment & Social Advice, Infrastructure Victoria ADVICE ON SECURING VICTORIA S PORTS CAPACITY
151 LITTLE RI VER Figure 44. Bay West development footprint overlayed on selected habitats and Ramsar site T Bolton Rd Ballan Rd Heaths Rd Tarneit Rd Railway Av Morris Rd Sneydes Rd Dunnings Rd CHEETHAM CREEK Bulban Rd Cottrell St WERRIBEE Point Cook Rd CHERRY CREEK Princes Fwy WE RRIBEE RIVER Dig gers Rd Duncans Rd Aviation Rd River St LITTLE RIVER Little River Rd Beach Rd Princes Hwy Legend Port Phillip Bay (Western Shoreline) and Bellarine Peninsula Ramsar Wetlands Seagrasses Coastal Saltmarsh/Mangrove Shrubland Mosaic Mangrove Shrubland/Coastal Saltmarsh/Berm Grassy Shrubland/Estuarine Flats Grassland Mosaic Coastal Saltmarsh Source: Adapted by Infrastructure Victoria from GHD, Infrastructure Victoria Second Container Port Advice Environment & Social Advice,
152 Environmental issues major differentiators In conjunction with our environmental consultants, we assessed the risk of 24 significant environmental issues, of which nine were assessed as major differentiators between the two locations: 1. Seagrass Seagrass is a cornerstone habitat providing shelter and food for marine animals, plants and some birds. At Hastings there are high quality seagrass meadows within the port development footprint that would be lost, and other seagrass areas would be at high risk of impacts from turbidity generated during construction. Seagrass is listed as a critical ecosystem component of the Western Port Ramsar site. At Bay West there is no significant seagrass identified within the development footprint. There are some scattered and sparse areas of seagrass close to the shore, but these are remote from the development and we have assessed the risk of indirect impacts from turbidity during construction as low. 2. Saltmarsh Saltmarsh is listed as a vulnerable ecological community under the Commonwealth Environment Protection and Biodiversity Conservation (EPBC) Act 1999 and impacts to saltmarsh would also need to be assessed under the Victorian Biodiversity Assessment Guidelines. It provides roosting and foraging habitat for shorebirds including the Orange Bellied Parrot. At Hastings the development footprint contains some areas of saltmarsh and we have assessed the risk of impact as medium. At Bay West the development footprint does not contain any known saltmarsh and we have assessed the risk of impact as negligible. 3. Mangroves Mangrove stands on the shoreline provide several environmental services including filtering pollutants, trapping sediments, protecting the shoreline from erosion and providing habitat for a number of species. At Hastings the development footprint contains some areas of mangroves and we have assessed the risk of impact as low to medium. At Bay West the development footprint and surrounding area do not contain any known mangroves. 4. Shorebirds and waterbirds The coastal areas of Western Port are an important habitats for shorebirds and waterbirds that roost and feed in the various habitats of the intertidal zone, including the saltmarsh, mangroves and mudflats. These habitats are recognised as critical ecosystem components in the Western Port Ramsar site. Port development at Hastings could impact directly on shorebirds through loss of habitat in the development footprint and through disturbance by noise and light associated with construction and operation of the port. We have assessed the risk to shorebirds from the Hastings concept as high. The western coast of Port Phillip Bay contains important habitats for shorebirds and waterbirds that roost and feed in the various habitats of the intertidal zone, including saltmarsh and mudflats. At Bay West, the Western Treatment Plant and intertidal zone west of the proposed development is an important habitat for shorebirds including threatened species such as the Orange Bellied Parrot, Fairy Tern and Australian Painted Snipe. Waterbirds, invertebrates living in the mudflats, and the intertidal mud flats themselves are recognised as a critical ecosystem component in the Port Phillip Bay and Bellarine Peninsula Ramsar Wetland. The port development footprint is removed from the intertidal zone, saltmarsh and freshwater lagoons used by birds so there would be little or no direct impact. There may be some disturbance by noise and light associated with construction and operation of the port. We assessed the risk as low to medium for footprint and operation but high during construction. 152 Infrastructure Victoria ADVICE ON SECURING VICTORIA S PORTS CAPACITY
153 5. Orange Bellied Parrot The Orange Bellied Parrot is listed as critically endangered under the Commonwealth Environment Protection and Biodiversity (EPBC) Act 1999 and threatened under the Victorian Flora and Fauna Guarantee Act The parrot spends most of the year in Tasmania and migrates to southern Victoria for a few months over winter, which it spends in coastal saltmarsh habitat. Although the Orange Bellied Parrot has not been recorded in the Hastings area for many years, the Hastings concept does impact on the parrot s potential saltmarsh habitat. On this basis we assessed the risk at Hastings as medium. The last Orange Bellied Parrots in the wild were recorded using saltmarsh in the Western Treatment Plant as their winter habitat. The development footprint of the Bay West location avoids this area, but due to their conservation status we assess the overall risk as high. 6. Fish Western Port has a high diversity of fish linked to habitat diversity and is an important breeding/nursery ground for some recreationally and commercially valuable species. Fish are listed as a critical ecosystem component of the Western Port Ramsar site. Fish may be impacted by habitat loss in the development footprint and by turbidity during construction. We have assessed the risk of impact on fish as high for the Hastings concept. Port Phillip Bay has 11 protected species/groups of fish. Some of these species could be impacted through habitat loss within the footprint or turbidity during construction. We have assessed the risk as low, as the Bay West footprint is not important habitat for listed species and has low habitat diversity. 7. Penguins The Bay West area in Port Phillip Bay is used as feeding grounds by penguins from St Kilda and Phillip Island rookeries. Penguin feeding habitats could be impacted by noise or turbidity, but these impacts can be managed by choice of construction techniques and use of silt curtains. The area that could be impacted is a very small proportion of the feeding grounds and overall risk to penguins from the Bay West proposal is assessed as low. Little Penguins nest in Western Port, with the largest rookery on Phillip Island being a significant tourism drawcard. These penguins feed mainly in Bass Strait, and to a lesser extent in Western Port and Port Phillip Bay. Impacts from turbidity during construction on penguins are potentially larger at Hastings than for Bay West because the high currents in Western Port make it much harder to contain turbidity with silt curtains. Disposal of dredge material and dredging of sand in Bass Strait, as proposed in the Hastings concept, could also impact on penguin feeding. The proportion of the penguin feeding area impacted would be very small and the risks to penguins from the Hastings concept is assessed as medium. 8. Marine mammals Several species of marine mammals including dolphins and seals are present in Port Phillip Bay and may be impacted by vessel strikes or noise from piling during construction. The risk to marine mammals from the Bay West proposal is assessed as low due to the distance of the project site from important feeding and breeding areas. The largest colony of Australian Fur Seals in the world is located at Seal Rocks at the entrance to Western Port. Several species of dolphins are also recorded in Western Port and whales make occasional visits. Marine mammals may be impacted by vessel strikes or noise from piling during construction. The proposed port location in the upper north arm is not commonly used by marine mammals. Impacts are more likely from vessel traffic past the seal colony or dredging operations in Bass Strait. Overall the risk to marine mammals from the Hastings proposal is assessed as medium. 9. Blue carbon Coastal and shallow marine vegetation including saltmarsh, mangroves and seagrass are some of the most efficient carbon sinks in the natural world. The carbon captured and stored in these systems is known as blue carbon. The impact on blue carbon should be proportional to the area of these vegetation types lost in the development footprint. At Hastings, saltmarsh, mangroves and seagrass are all present within the development footprint and we assessed the risk as high. At Bay West, very little of this vegetation occurs within the development footprint and we assessed the risk as low. 153
154 Hydrodynamics and geomorphology We conducted a high level review of the potential for both the Bay West and Hastings concepts to impact on hydrodynamics (water movement) and coastal morphology (land forms). Both concepts would result in changes to local water flows around the reclamation and changes to the adjacent shoreline. For both sites the potential to impact on bay-wide circulation is uncertain. At Bay West the impact on mixing of treated effluent discharged from the Western Treatment Plant needs to be investigated. At Hastings the impact on water and sediment circulation by tidal currents needs further investigation. Due to lack of certainty we do not consider that impacts on hydrodynamics or geomorphology to be major differentiators between the sites at this stage. For more information on hydrodynamics and geomorphology see the following technical reports: Infrastructure Victoria Second Container Port Advice Environment & Social Advice Infrastructure Victoria Second Container Port Advice Hydrodynamics study Infrastructure Victoria Second Container Port Advice Geomorphology Enlarging shipping channels at Port Phillip Heads As an option in the Bay West case we have considered the possibility of widening the Great Ship Channel through Port Phillip Heads from 245 to 425 metres, so that larger ships can access Port Phillip Bay. Such a widening would require 100,00 cubic metres of dredging, which is less than 1 per cent of the total dredging volume required to accommodate 18,500 TEU vessels at Bay West. Widening of the shipping channel through the Heads may not be required, but it is a possible option that could be activated. It would be possible to accept ships up to 14,000 TEU at Bay West without modifying the Heads at all. If the channels through the Heads were to be widened under water, there are a number of environmental and social issues that would need to be considered in more detail: Possible impacts on beaches surrounding the Heads inside the Bay: any enlargement of the channel in this area could allow more wave energy to enter the Bay from Bass Strait, which could lead to changes on nearby beaches. Preliminary modelling of the channel widening considered for this project indicated that there would be a small increase in wave energy entering the Bay and reaching some of the beaches inside the Heads. The area most at risk would be Observatory Point on the Bay side of Point Nepean. Before any works on the shipping channel in the Heads were undertaken, more detailed assessments would be required to properly quantify the impact on surrounding beaches and identify mitigation measures to limit impacts. Possible impact on the reef habitat and sponge communities in the Heads: this includes in the canyon which runs across the Great Ship Channel. Impact on tidal range within Port Phillip Bay: any enlargement of the channel in this area will allow more water into the Bay on a flood tide and increase peak water levels in the Bay. Modelling of the channel widening considered for this project indicated it could lead to a rise in high tide levels by 6 to 8 millimetres. To put this in context, the current (2016) rate of sea level rise measured at Williamstown is 2.4 millimetres per year. The predicted rise due to modifying the Channel through the Heads is equivalent to about three years of sea level rise at current rates. For more information on the environmental issues associated with enlarging the shipping channels through the Heads see the following technical reports: Infrastructure Victoria Second Container Port Advice Environment & Social Advice Infrastructure Victoria Second Container Port Advice Hydrodynamics study Infrastructure Victoria Second Container Port Advice Geomorphology 154 Infrastructure Victoria ADVICE ON SECURING VICTORIA S PORTS CAPACITY
155 Approvals and offsets Approvals We have reviewed the approval requirements for the Hastings and Bay West proposals, based on current legislation. While the list of approvals required is broadly similar, there are a number of key differences in the complexity of attaining those approvals at either site. We discuss the key differences below. For further information on approvals that could be required refer to the GHD Infrastructure Victoria Second Container Port Advice Environment & Social Advice report. Both Bay West and Hastings would likely require approvals under the following legislation: Assessment/approval through an Environment Effects Statement under the Victorian Environment Effects Act 1978 or Comprehensive Impact Statement under the Victorian Major Transport Project Facilitation Act Environment Protection and Biodiversity Conservation Act (EPBC) 1999 a container port at Hastings or Bay West would likely be deemed a controlled action and thus require approval under the Act due to the potential to impact on Matters of National Environmental Significance, in particular Ramsar sites. A Cultural Heritage Management Plan under the Victorian Aboriginal Heritage Act 2006 if required by the Victorian Aboriginal Heritage Regulations 2007 Coastal Management Act Consent under the Victorian Coastal Management Act 1995 for works on coastal Crown land Planning Scheme Amendment to reserve and enable the use and development of land for development of the port, transport corridors and to develop associated infrastructure and port precincts, and for native vegetation removal under the Victorian Planning and Environment Act Development of a port within a Ramsar site, or impacting on a Ramsar site, would require approval of the Commonwealth Environment Minister under the Act. The presence of a Ramsar site does not mean development cannot occur, but it does make it more complicated to get a development approved. The key factor is that the development does not significantly impact on the ecological character of the Ramsar site. If the development does impact on some elements of the ecological character then approval may require the provision of offsets, such as recreating similar habitat, so the overall character is maintained. Offsets Offsets are likely to be required at both sites to gain approval under the Environment Protection and Biodiversity Act (EPBC) 1999, due to the impact on Ramsar sites. Offsets may also be required under Victoria s Native Vegetation Framework for clearing of native vegetation, based on assessed risk to biodiversity. Offsets involve protection or improvement of an area of similar size and value to that impacted by the development. More than 90 per cent of the offsets must be direct offset which involve the protection and/or improvement of equivalent habitat. Up to 10 per cent of the offsets can be indirect offsets which include targeted research and education. To be acceptable the offset package must deliver an overall conservation outcome that improves or maintains the viability of the aspect of the environment that is protected. For example, if the project required the removal of 3 hectares of mangroves then a direct offset could be revegetation of a 1.5 hectare area with mangroves and protecting a further 2 hectares of existing mangroves. The Ramsar Convention on Wetlands of International Importance The Ramsar Convention on Wetlands of International Importance is an international treaty providing a framework for the protection of ecologically important wetlands, focusing on wetlands used by migratory birds. In Australia, Ramsar wetlands are managed under the Commonwealth Environment Protection and Biodiversity Conservation (EPBC) Act Each Ramsar site has an ecological character description which defines the critical ecosystem components and the limits of acceptable change as a basis for management of the wetland. 155
156 Hastings approvals Gaining approval for the port development at Hastings would present significant challenges due to the level of impact on the Western Port Ramsar site. The Western Port Ramsar site includes most of the intertidal and sub-tidal area of Western Port, including the proposed terminal and port dredging areas as shown on figure 43. The critical ecosystem components of the Western Port Ramsar site include: wetland bathymetry supports a range of distinct marine habitats including intertidal mudflats geomorphology and sedimentation natural turbidity and sedimentation processes seagrass four species of seagrass in intertidal and subtidal areas saltmarsh and mangrove communities waterbirds high numbers including migratory and threatened species marine invertebrates high diversity supporting waterbirds and fish species fish high diversity of species. A container port at Hastings has the potential to have a significant impact on several of the critical ecosystem components, mainly through direct loss of habitat in the development footprint within the Ramsar site in the order of 10 square kilometres. Indirect impacts elsewhere in the Ramsar site are also possible, for example from ship generated waves. To gain approval under the Environment Protection and Biodiversity Act (EPBC) 1999, it would be necessary to demonstrate that loss of habitat had been avoided and minimised where possible and residual losses would need to be offset, including saltmarsh, seagrass and mudflats. We considered several alternative concepts at Hastings with the terminal positioned further out, or with the basin dug into the land, but none of these would avoid a substantial footprint on the Ramsar site. Potential offsets within Western Port are not readily identifiable, as equivalent habitat is in public parks, reserves or Crown land and therefore already protected. There may be suitable sites for revegetation within Western Port, but more work is needed to identify them. Creation of new habitat on private land adjacent to the Ramsar site or offsets in other Ramsar sites, such as Port Phillip Bay or Corner Inlet, could be considered but negotiations with the Commonwealth Department of Environment and Energy would be required to determine if these were acceptable. Where offsets involve revegetation or creation of new habitat the offset needs to be developed in advance of the port development to demonstrate it is effective and sustainable. Establishing this type of offset could add additional time, up to several years, to the development timeframe. Dredging and disposal of dredge material in Bass Strait as proposed for Hastings would in addition require approval under the Commonwealth Environment Protection (Sea Dumping) Act This approval would not be required for the Bay West proposal. 156 Infrastructure Victoria ADVICE ON SECURING VICTORIA S PORTS CAPACITY

157 Bay West approvals The Port Phillip Bay and Bellarine Peninsula Ramsar Wetland includes several discrete areas on the western shoreline of Port Phillip Bay. The Avalon area of the Ramsar site includes the Western Treatment Plant and the coast of Port Phillip Bay to a depth of 2 metres, as shown on figure 44. The critical ecosystem components of the Port Phillip Bay and Bellarine Peninsula Ramsar site include: geomorphic intertidal mudflats, the Spit and tidal lagoon hydrology tidal regime and maintained water levels in freshwater lagoons primary production high biomass in lagoons and near shore areas vegetation seaweed, seagrass, saltmarsh, mangrove, freshwater vegetation invertebrates worms, shellfish and snails on intertidal flats, invertebrates in freshwater, including threatened species fish freshwater and estuarine species, including threatened species waterbirds 105 species including migratory and threatened species. The proposed terminal and channels for Bay West are located more than 1 kilometre outside the Ramsar site. The transport corridor enters the Ramsar site at the coast in a location where there are little or no intertidal mudflats, seagrass or saltmarsh, and travels for about 10 kilometres through the Ramsar site to the northern boundary at the Princes Freeway, with a total footprint in the Ramsar site in the order of 1 square kilometre. There is a potential for some impact on critical ecosystem components along the corridor, but we expect these could be successfully minimised and offset, as demonstrated by Melbourne Water s continued development of sewage treatment infrastructure in this part of the site. Potential offsets within the Western Treatment Plant are readily identifiable and could include measures such as installation of predator proof fencing to protect threatened species. Overall, we assess that gaining approvals for the port development at Bay West would be easier than gaining approvals for Hastings, due mainly to the smaller impacts on sensitive habitat and Ramsar sites. It should be stressed however that the Bay West project would be one of the largest marine infrastructure projects ever undertaken in Victoria and the approval process would also be very long and complex. 157
158 Working with Nature A new approach to port development Working with Nature is a best-practice project philosophy developed by PIANC the World Association for Waterborne Transport Infrastructure. Working with Nature aims to identify and implement win-win solutions for port projects that deliver project objectives as well as protecting or enhancing the environment. Working with, rather than against, natural processes can result in more sustainable and cost effective longterm solutions. To be effective, Working with Nature needs to be implemented early in the project when flexibility is still possible. When delivered effectively, this approach has reduced stakeholder opposition and improved environmental outcomes. Environmental impact assessment of projects generally happens after, or parallel with, the development of a project concept design. Proponents then attempt to minimize or mitigate the assessed impacts to gain environmental approvals. This approach is becoming untenable for large port and dredging projects because it is difficult to assess cumulative impact, and stakeholders feel left out of the process or are critical of the small amount of time available to respond to technical information provided for comment during the approvals process. Working with Nature re-orders the traditional approvals process and aims to identify scenarios that achieve positive project, as well as environmental, outcomes. The principal steps are: establish project needs and objectives; understand the environment; meaningfully engage with stakeholders to identify win-win options; and then prepare project proposals/design to achieve project objectives and benefit nature. Solutions which deliver project objectives as well as protect, or ideally enhance, the environment could include the beneficial reuse of dredge material to create intertidal seagrass or saltmarsh habitat. Other solutions may include offset type activities to enhance the ecosystem, but that are not directly connected with the port development, such as protecting an already eroding shoreline, or works to improve water quality. Early engagement by the proponent with stakeholders, including independent experts, focuses on environmental values, perceived threats and project concerns. These values and concerns help inform option development and feasibility investigations. For example, stakeholders who value fishing will be interested in developing options that seek to protect or enhance critical fish habitat. Stakeholders are an ongoing part of the process through participating in data collection, analysis and the selection of preferred options. The benefit of early stakeholder engagement means stakeholders are more likely to see their ideas and concerns addressed in a meaningful way, building confidence in the process and outcomes. This makes them more likely to accept the result, even if it is not their preferred outcome, and lowers project risk from community opposition. For further information and case studies on Working with Nature, see workingwithnature.php. Working with Nature focuses on achieving project objectives in an ecosystem context. For example, for a port project at Bay West, the whole of the Port Phillip ecosystem would be considered to identify its natural values, the ecosystem services it provides, and stressors and threats to the system. This assessment would include the potential impact of the project as well as other sources, for instance the impact of urban water runoff, habitat loss or climate change. 158 Infrastructure Victoria ADVICE ON SECURING VICTORIA S PORTS CAPACITY
159 Social issues major differentiators Land acquisition, land access and impact on surrounding land use The port terminal at Hastings is remote from residential areas and important community facilities such as parks and reserves. However, major impacts on surrounding uses are expected to arise from the development of the transport corridors. Upgrade of the Western Port Highway is likely to involve acquisition of land on at least one side of the corridor and cause some disruption to residences, businesses and community facilities on both sides of the corridor. The port precinct development within SUZ1 would also require acquisition of land from BlueScope and several smaller land holders, including some residences. At Bay West the terminal is offshore and the transport corridor is located mainly within the Western Treatment Plant which is already owned by the State. The transport corridor has been designed to have minimal impact on the current and future operations of the Plant. Some private rural land would need to be purchased for the rail marshalling yard located west of the future Outer Metropolitan Ring Road alignment, but the impact on surrounding land use in this area is expected to be relatively small due to its rural character. Most of the land identified for Bay West transport links is currently undeveloped. This presents an opportunity to put planning protections in place now, as doing so would have a limited impact on the community and would preserve the Bay West option by ensuring the preferred transport corridors are available. In line with our recommendations, the most appropriate corridors should be defined, in consultation with relevant parties such as Melbourne Water, Wyndham City Council and landowners, and then the necessary planning process undertaken to apply the correct zoning. Tourism The major tourism area in the vicinity of the Bay West port site is the Werribee Park Tourism Precinct, an area on either side of the Werribee River south of the Princes Freeway including the Werribee Open Range Zoo, Werribee Mansion, National Equestrian Centre, a winery and golf club. The proposed east-bound transport corridor is within 1 to 2 kilometres of this precinct, but impacts are expected to be small and manageable by measures such as landscaping and noise walls. Phillip Island in Western Port is a major tourism destination, with nature based attractions including the penguin parade, seal colony, surf beaches on the south of the island and sheltered beaches on the north. The Phillip Island and San Remo Visitor Strategy 2035 by Bass Coast Shire Council states that the tourism economy on Phillip Island provides 3,100 direct full time jobs and is responsible for 40 per cent of the Bass Coast s gross regional product. Development of a container port at Hastings has the potential to impact on the tourism industry at Phillip Island directly through visual amenity and noise from increased ships numbers in the channel or anchorage. Construction of the port could also impact on penguins and seals as discussed in the environment section above, although the risk is not high. The extent to which any of these factors would actually impact on Phillip Island tourism is unknown, but these issues warrant thorough investigation if the Hastings proposal was to progress, given the industry s critical importance to the local economy and community. Congestion Although port traffic is only a small proportion of metropolitan traffic it does impact on congestion and on other road users. The findings of our VITM traffic modelling for both locations are discussed in the Economic evidence section. Locating the port at Hastings leads to a greater number of truck kilometres and truck hours for port related traffic than Bay West. 159
160 Recreational fishing The North Arm of Western Port around Hastings is a popular area for recreational fishing and the proposed port expansion footprint at Hastings includes a valued recreational fishing location known as Tyabb Bank. Currently at the Port of Hastings fishing is allowed in the port waters and in shipping channels (anchoring is prohibited in the channels) but not in the exclusion zones around jetties. If a container port were developed there would be an increase in commercial shipping traffic and the channels would likely become transit only zones similar to the channels in Port Phillip Bay where fishing is effectively restricted. Fishing should still be allowed in port waters outside the channels, as it is in Port Phillip Bay. The waterway area that may be lost to fishing due to container port development is estimated at about 2,100 hectares, or 5 per cent of the low tide area of Western Port. Port Phillip Bay is a very popular waterbody for recreational fishing, but the Bay West site itself is not thought to be a particularly valued fishing ground. There is a large boat ramp at Werribee South, and the proposed port could increase travel times from this ramp to the fishing grounds of Corio Bay. This impact could be mitigated by providing additional boat launching facilities to the west of the port. The waterway area that may be lost to recreational fishing is estimated at about 880 hectares, or less than 1 per cent of the area of Port Phillip Bay, consisting of the Bay West terminal, exclusion zone and the new Bay West Channel. Existing channels in Port Phillip Bay are not included as they are already transit only zones where anchoring and drifting are not allowed, effectively restricting fishing. Aboriginal and historic cultural heritage There is potential for disturbance of items of Aboriginal cultural significance at both Hastings and Bay West. A larger number of significant items and sites have been identified at Bay West but further disturbance of the most important known sites can be avoided. Overall risk to heritage could be managed and we do not consider it a major differentiator between the two locations. Which technical reports should I look at for more information? GHD, Infrastructure Victoria Second Container Port Advice Concept Options Bay West and Hastings, 2017 GHD, Infrastructure Victoria Second Container Port Advice Environment & Social Advice, 2017 Cardno, Infrastructure Victoria Second Container Port Advice Hydrodynamics, 2017 AECOM, Infrastructure Victoria Second Container Port Advice Navigation Study, 2017 Baggerman Associates, Ports Planning Advice Engineering Services Dredging and Reclamation, 2017 Environmental Geosurveys, Infrastructure Victoria Second Container Port Advice Geomorphology, 2017 Raylink Consulting, Regional Rail East and Hastings Rail Link Concept of Operations Report, 2017 Guy Holdgate and Associates, Bay West Preliminary Geotechnical Investigation, 2016 GHD, Bay West Project Geophysical Investigation, 2016 Deloitte, Infrastructure Victoria Second Container Port Advice supply chain assessment methodology, Infrastructure Victoria ADVICE ON SECURING VICTORIA S PORTS CAPACITY
161 Multi-criteria assessment Recommending the location of Victoria s second container port Based on the outcomes of our multi-criteria assessment of two port options at either Bay West or Hastings, Infrastructure Victoria recommends Bay West as the most suitable location for a second container port. Infrastructure Victoria recommends Bay West on the basis that it is preferred to Hastings, and also because it is a good location for a second container port independent of the comparison with Hastings. Bay West is an attractive site because it is close to current and planned transport links, has ample and growing industrial land in the north and the west of Melbourne, is proximate for exporters in the north and the west of Victoria, and presents the ability to manage environmental impacts. The size of ships able to access Bay West is sufficient given the size of the Australian market. At Bay West, we have assessed an island port, connected to land via a causeway, just south of the Werribee River, as shown in figure 37. This is one of a number of possible options within the Bay West study area. Government and a future project proponent will need to consider the exact configuration and location of the Bay West port closer to the time at which the port is required. More immediately, there is a need for the Government to decide whether it wishes to confirm a single Bay West site as the preferred location or leave more than one location option open. This decision will have implications for land use and zoning changes which need to take place as soon as possible to reflect the port area footprint, transport corridors and broader land use planning in the Wyndham area. The Special Minister of State s Terms of Reference requested that Infrastructure Victoria consider the environmental, economic and social impacts of locating a second container port at either Hastings or Bay West, including the impact of complementary infrastructure on existing local communities. To be able to fulfil this request, we have had to evaluate quantitative, as well as qualitative or non-monetised impacts for both locations. We used a multi-criteria assessment tool, because it allowed us to integrate quantitative and qualitative criteria into our evaluation of economic, technical, environmental and social impacts of a second container port at either Hastings or Bay West. Another approach we could have taken was a traditional cost benefit analysis, based on monetised impacts alone. This approach was not used because it would not give appropriate weight and consideration to nonmonetised impacts, particularly social and environmental costs, which stakeholders emphasised during consultation as being very important. Scoring the multi-criteria assessment The multi-criteria assessment was conducted during a workshop attended by the Infrastructure Victoria officers and experts in navigation, port engineering, hydrodynamics, the environment, social amenity, transport and commercial evaluation from AECOM, Cardno, GHD and Deloitte. During the workshop the key findings were presented by the relevant expert for evidence-based assessment of each criterion in selecting a preferred second container port location. Following the presentation and discussion of each criteria group, attendees were asked to score each port location against the relevant criteria presented. 161
162 Multi-criteria assessment We assessed the two locations against 19 criteria, grouped into 4 categories. The summary results shown in table 26 demonstrate Bay West achieved a higher score in all categories than Hastings, based on equal weighting of the criteria. Table 26. Multi-criteria assessment Criteria Hastings Bay West Percentage difference Economic % Technical % Environmental % Social % TOTAL % Source: Deloitte, Infrastructure Victoria Second Container Port Advice multi-criteria assessment (MCA), 2017 Of the 19 criteria, Hastings only scored significantly higher than Bay West on one, marine accessibility and operability. For four other criteria the Hastings and Bay West scores were very close: hydrodynamics and coastal geomorphology, aboriginal and historic heritage, amenity (lifestyle impacts) and amenity (commercial). On all other criteria Bay West scored higher than Hastings. Adjusting criteria weightings does not change the multi-criteria assessment result because Bay West was assessed as neutral, preferred, or strongly preferred in every category and all but one criterion. For Hastings to be assessed as the preferred location it would be necessary to only evaluate marine accessibility in the multi-criteria assessment. Even so, while Bay West was not assessed as favourable as Hastings on this one criteria, Bay West is still feasible and would operate with restrictions that are common at other large ports globally. You can find more information on the sensitivity testing of different weightings in the Deloitte, Multi-criteria assessment report. Table 27 describes the economic, technical, environmental criteria we assessed, as well as the result and justification for each result. For more detail on the multi-criteria assessment process, expert opinion on each criteria, and the different sensitivities we applied to test the result see the Deloitte Multi-criteria assessment report. 162 Infrastructure Victoria ADVICE ON SECURING VICTORIA S PORTS CAPACITY
163 Table 27. Individual multi-criteria assessment criterion results Criteria Description and assessment methodology MCA result Summary justification Economic Cost effectiveness Estimate the total economic cost of providing container capacity at either location. Considers not only upfront capital and operating costs, but also supply chain and transport costs, and environmental and externality costs of transport. Bay West preferred Bay West has lower total operating costs than Hastings for transport and externality costs, mainly due to the shorter transport trips needed for most customers to use Bay West compared to Hastings. Tested with different discount rates 4, 7 and 10 per cent. Hastings is considered with and without rail, to understand if this significant capital cost affects the assessment. Gross State Product (GSP) GSP is the measure of a state s overall economic output. It is the market value of all final goods and services made within the state in a year. This is used as an indicator within the economic analysis and was calculated using Computable General Equilibrium modelling of each port option. Bay West preferred Bay West returns an increase in GSP over the capital investment in a new port at this location. Developing a port at Hastings results in a decrease to GSP. Supply chain impact Supply chain costs are the costs associated with the movement of freight. This is quantified as an average cost per container for transport between port and point of consumption (imports) or origin (exports). Bay West strongly preferred Average supply chain costs were smaller at Bay West than Hastings for all average supply chains assessed. For the purpose of this analysis, supply chain costs include landside freight transport costs (road and rail) for each of the port options (Hastings and Bay West) at Costs were assessed for metropolitan and regional import and export supply chains. Origins (exports) and destinations (imports) were fixed, but interim steps such as staging and distribution centres varied between port options. Employment A decision to build a second port will have an effect on the state s employment. This will occur during the planning and construction of the new port as well as sustained change in employment due to improved productivity and port related activity. This was calculated using Computable General Equilibrium modelling of each port option. Bay West preferred Building a new port at either location will create around 2000 direct jobs and thousands more in the region. Bay West increases total job numbers annually statewide while Hastings slightly reduces statewide job numbers due to supply chain inefficiencies. Technical Scalability The flexibility of development staging at each location. Can the staging be easily adjusted to meet demand, so the state does not over or under invest? Assessed at 3 million, 6 million and 9 million TEU per year capacity. Bay West preferred At Bay West the island construction and dredging are all carried out in stage one. Once these are in place it is relatively easy to modify, advance or defer tranches of capacity. Consider the ability to bring forward or defer stages to mirror demand. Is each capacity tranche stand alone, both efficient and able to be operated if no further stages were delivered? Hastings scored lower because each stage requires additional dredging and significant environmental approvals. Also the creation of Regional Rail East to provide freight rail access to Hastings is a very large investment that cannot be staged. 163
164 Criteria Description and assessment methodology MCA result Summary justification Long-term flexibility Whether the second port has the ability to become the State s primary port in the future and whether each option has the capacity to expand to meet long-term demand and accommodate alternative trades. Bay West preferred Bay West scored higher because there is more room to expand port footprint and good transport connections which allow a much larger ultimate container capacity as well as room for other trades if required. We considered whether there was flexibility to: expand capacity beyond 9 million TEU (to 12 or 15 million TEU) allow changes to the port location and layout in design development phase (to mitigate impacts) adapt to unforeseen changes /new technologies readily accommodate a world class intermodal (rail) facility readily accommodate large areas of land for logistics and other port related uses. Hastings does have more land available close to the port for logistics use, but it would be difficult to expand the terminal beyond 9 million TEU. Marine accessibility and operability The flexibility and reliability of marine access to the port site, including the ability to accept very large ships in the future. We considered the ability of the location to accommodate very large ships in the future up to 26,000 TEU capacity with a length of 460 metres and a beam of 63 metres. Hastings preferred Hastings scored higher because the channel can readily accommodate vessels up to 18,000 TEU and can be expanded for much larger vessels. Navigation to the port is lower risk than entering Port Phillip Bay. Port Phillip Heads limit the size of ships accessing Bay West to 14,000 TEU. Widening the channel through the heads for larger vessels is feasible. Even with the widened channel navigation through Port Phillip Heads, while safe, is still more complex than navigating the channel to Hastings. Ability to connect the future rail network Identify current restrictions and enabling works required to connect both port options to the future rail network.we considered the complexity of enabling rail capacity to each port option, including capital cost, network upgrades and level of disruption to the existing network. Bay West strongly preferred Bay West scored higher because it has a shorter corridor to the existing rail network, as well as good connection to the proposed Western Intermodal Freight Terminal and Inland Rail system. Rail access at Bay West can be staged (first one track then two). Hastings requires very costly and disruptive upgrades to add two tracks to the Dandenong corridor. This work is difficult to stage because the solution for one track is very different to two tracks. Ability to connect the future road network Identify current restrictions and enabling works required to connect both port options to the future road network (sources include the Victorian Integrated Transport Model project reference case). Bay West strongly preferred Bay West scored higher because it has a shorter corridor to the existing freeway network and multiple links to the future freeway network (Princes Freeway and Outer Metropolitan Ring Road, West Gate Tunnel). We considered the complexity of enabling road capacity to each port option, including capital cost, network upgrades and level of disruption to the existing network. The Hastings corridor has links to one major freeway, the Monash, which already has capacity constraints. 164 Infrastructure Victoria ADVICE ON SECURING VICTORIA S PORTS CAPACITY
165 Criteria Description and assessment methodology MCA result Summary justification Alignment with Government s land policies (e.g. Plan Melbourne) Identify the alignment with current land use policies both now and in the future. In particular we made a qualitative assessment of available industrial land (for manufacturing and logistics) based on forecast population growth patterns and planned land use, for both port options locations. Bay West preferred Bay West scored higher because it is closer to industrial precincts in the western suburbs, northern suburbs and Geelong. These precincts all have ample room to grow. Hastings is closest to the major industrial precinct at Dandenong south but this precinct has limited land availability for further growth. Environment Environmental approvals The key environmental approvals identified including assessment process, key values, environmental offsets and the time expected for the approval process. Bay West preferred Although the approvals required at each site are very similar and would be complex, Bay West scored higher because it has less environmental impact on sensitive habitats and Ramsar sites so obtaining approvals is likely to be simpler. Hastings has a larger impact on the Ramsar sites and there is uncertainty about the ability to create suitable offsets, making approvals very challenging. Hastings also requires additional Commonwealth approvals for disposal of spoil and dredging of sand from Bass Strait. Risks to ecological character Assessment of each component of the ecological character for both Ramsar sites based on port footprint and construction and operation impacts. Bay West strongly preferred Bay West scored higher because impacts on the ecological character are relatively small and there is more potential to avoid critical elements through design. Consider loss of habitat and species impacted. Impacts outside of the Ramsar site are included in the Marine or Terrestrial assessment. At Hastings impacts on ecological character are significant and cannot be avoided. Marine impacts Potential impacts to inshore waters and surrounding port. Assessment of proportion of habitat loss in Port Phillip Bay and Western Port Bay from footprint. Also consider risk of indirect impact from construction activities, e.g. noise, turbidity. Bay West strongly preferred Bay West scored higher because it has very little or no impact on seagrass, saltmarsh or mangroves. Bay West was also assessed as having lower risk of impact on penguins, marine mammals and fish. Hastings has greater impact on seagrass, mangroves and saltmarsh, and a higher risk of impacts on penguins, marine mammals and fish. Terrestrial impacts Potential impacts to terrestrial habitats, flora and fauna, including the proportion of habitat loss for associated species in land areas within or adjacent to footprint, or the construction impact (temporary or permanent loss) on breeding/ roosting sites. Bay West preferred Bay West scored higher because impacts on important terrestrial habitat and species can be largely avoided. Hastings has greater impact on habitat for shore birds and migratory birds. 165
166 Criteria Description and assessment methodology MCA result Summary justification Hydrodynamic/ coastal geomorphology Changes to coastal geomorphological processes from footprint that impact values and uses. We assessed areas of likely change. Magnitude of change was not assessed. Neutral Hastings scored higher, although the scores are very close. At both sites there would be significant changes to water flow and the shoreline close to the port. There would need to be a very detailed assessment if the channel through the heads was widened as part of the Bay West project to ensure impacts to beaches close to the heads are managed. There would be small changes in water levels within the bay. Social Land use impacts and impacts on private property These are the impacts of land acquisition, changes in land zoning and planning controls. This may also include other industry consequences. Bay West preferred Bay West scored higher because it does not require any acquisition of residences. It would have some impact on the Western Treatment Plant including temporary occupation of land during construction. The Hastings transport corridors require significant private land acquisition including residences and businesses. Amenity (lifestyle impacts) Proximity to the port option locations, and port triggered infrastructure and its impact on amenity and lifestyle of the area. Neutral Bay West scored higher, although the scores are close. Both port options would reduce the waterway area available for recreational fishing, but the area lost at Hastings is thought to be more valuable. The Hastings port and transport corridors are closer to residential areas. Aboriginal and historic heritage This criteria relates to the risk of impact on Aboriginal, cultural and historical heritage at each site. Neutral Score is the same for both sites. There are more identified Aboriginal and heritage sites identified in the Bay West area, but these can be avoided. Amenity (commercial) Proximity to the port option locations, and port triggered infrastructure and its impact on tourism/commercial activities in the surrounding areas, e.g. aquaculture. Neutral Bay West scores higher, although the scores are close. Bay West will have some impact on the Western Treatment Plant. There is low risk of impact to the Werribee Tourism Precinct. The Hastings option has the potential to impact on greater number of businesses, primarily along the transport corridor. There is also the potential for impacts to the tourism industry of Phillip Island from passing ships. 166 Infrastructure Victoria ADVICE ON SECURING VICTORIA S PORTS CAPACITY
167 The evolution path and trigger points to investing in Bay West As discussed previously, it is assumed that Victoria will always seek to provide port capacity when demand requires it due to the strong economic benefit provided by ports. Port planning does not happen in isolation but decisions are made in the context of supply chains. Ports are not the destination for freight. Freight moves though ports as part of supply chains that get freight to its final destination. Supply chains are a means to an end to get our goods to market and to where we want to use them. The businesses of Victoria s exporters are particularly sensitive to supply chain cost increases as they compete in global markets against other suppliers with different cost drivers. Supply chain costs are a key driver in port planning decisions. While demand fluctuates and can have peaks and troughs, in the long term it tends to follow gradual growth. Much port capacity is provided by large capital projects which create large tranches of capacity that may not be fully utilised for years. Port managers are always seeking to balance the issue of demand to capacity. Figure 45 shows the pattern of an indicative investment pathway across the port of Melbourne and Bay West. Figure 45. Chart overlaying demand with new capacity coming on line Capital Cost (in $M 2017, undiscounted) $3,000 M $2,700 M $2,400 M $2,100 M $1,800 M $1,500 M $1,200 M $900 M $600 M $300 M $0M 0M Capex Swanson Dock Capex Bay West Capacity Bay West Financial year Throughput Webb Dock and Swanson Dock Victorian container demand Source: Deloitte, Infrastructure Victoria Second Container Port Advice economic advice, 2017 Capex Webb Dock M 14M 13M 12M 11M 10M 9M 8M 7M 6M 5M 4M 3M 2M 1M Capacity/Throughput (in TEU per year) Capacity Webb Dock and Swanson Dock Throughput Bay West Total capacity (Webb Dock, Swanson Dock, Bay West) 167
168 Government should allow 15 years for planning, approvals and construction of a second container port. We need to understand how long it is likely to take to plan, approve and construct a new port to support our analysis of when a second port will be needed. We consider that it will take about 15 years between the decision to invest in a second port and the port opening. Our view is based on the concept procurement and construction program developed for Bay West and benchmarking against similar projects in Australia and overseas. Developing a second container port at Bay West would be a large and complex task involving dredging, reclamation and construction of land transport connections. The complexity of developing a Bay West port can be compared to combining the Port Botany Expansion or Channel Deepening Project with the EastLink road project. From government announcement to completion these projects took between 8 and 12 years with some feasibility studies occurring before this period, as shown in figure 46 below. The design development, planning and environmental approvals phase for the Channel Deepening Project and Port Botany Expansion took five to six years, which reflects the complexity of impact assessments and granting of approvals for projects in the marine environment. Environmental approvals for both projects had various delays, which contributed significantly to the length of the approvals period. Figure 46. Approvals timelines for previous projects Year Channel Deepening Project (VIC) EastLink (VIC) Port Botany Expansion Project (NSW) Maasvlakte 2 (Netherlands) Project Operational Government announces project Feasibility and options assessment Design development, planning and environment approvals Procurement, construction and commissioning Source: Infrastructure Victoria, Infrastructure Victoria ADVICE ON SECURING VICTORIA S PORTS CAPACITY
169 Assessment and approval of a second container port at Bay West is likely to take a similarly long time. The project s interaction with sensitive coastal habitat and the Western Port Phillip Bay and Bellarine Peninsula Ramsar wetland is likely to lead to an extended and complex approvals phase. Infrastructure Victoria recommends a Working with Nature approach to the possible future Bay West port development, to try and improve environmental outcomes and reduce approvals risk. The Working with Nature approach is explained on page 158. Taking a Working with Nature approach would increase the length of the feasibility and options assessment phase due to increased early stakeholder involvement. The addition of time early in the project should be recovered by shortening the length of the environmental approvals phase by avoiding delays and would provide improved environmental and social outcomes. The length of the feasibility stage could be reduced by ongoing environmental monitoring to provide a robust understanding of the natural systems before the project commences. Figure 47 below sets out an indicative time line for stage one of the Bay West project, assuming a Working with Nature approach. Figure 47. Theoretical timeline of a Bay West port project Years until port opens Ongoing baseline monitoring Establish project team Feasibility and options assessment with stakeholder involvement Design development, planning and environmental approvals Procurement, construction and commissioning Source: Infrastructure Victoria,
170 A hypothetical look back on how Bay West could be delivered It is now mid-century. Demand has grown at a slow steady rate of 2-3 per cent. Growth rates from before the Global Financial Crisis have not re-occurred, although there have been fluctuations in demand. Freight optimisation has continued so more cargo is moved in each container. The Port of Melbourne and stevedores have continued to invest incrementally to provide greater efficiency and more capacity. Ships visiting Melbourne have grown with vessels in the 8,500-14,000 TEU range calling at Webb Dock and ships up to 7,500 TEU calling at Swanson Dock. The use of technology and HPFVs has seen average TEU per truck at the port increase from 1.2 to 1.5 TEU per truck. Half of truck movements are now at night to maximise road capacity. Most truck moves are staged through transport yards. Investment in metropolitan rail freight has occurred and there are intermodal terminals at Lyndhurst, Somerton and Altona. Empty containers are also held at those terminals to provide a more efficient back load system. The Western Interstate Freight Terminal has been built and linked to the Inland Rail Project and Dynon Intermodal Terminal is now only used for port related rail freight. Freeway network investment has progressed and beyond 2046 there is a full orbital and cross city freeway network. The Outer Metropolitan Ring Road, North-East Link and cross city capacity have been built. All are built to 109 tonne standards to allow HPFV use to support supply chain efficiency. The Outer Metropolitan Ring Road has particularly attracted much industrial development along this corridor, including warehousing given the direct link to Bay West. Freight Link will not be built and investment in Bay West has been determined as the next container port. This was decided 15 years prior to Freight Link being required. Bay West opens as an overflow port and the closure of the Dynon rail precinct and Swanson Dock is now planned. This area will be used for urban renewal as Fishermans Bend is now developed. Coode Island facilities need to move to Bay West or Hastings to allow Swanson Dock redevelopment. The other trades that are handled further up the Yarra will move to Bay West, Geelong, Portland and Hastings, depending on their supply chain requirements at the time. Early planning for Bay West to eventually become the container port for Victoria commences. The West Gate Tunnel is complete and land use conflicts in the inner west streets have been resolved by implementing a range of measures, including noise and emission standards for freight vehicles; designation of key road corridors for port related vehicles; review of permitted land uses in the Inner West; and transition of freight and container transport companies to sites with good road and rail transport access and ample industrial land that does not conflict with residential uses. Swanson Dock now handles about 4 million TEU per year and Webb Dock rail has been built and is now handling just over 5 million TEU. The automobile trade has moved to Hastings and Bass Strait trade has moved from Webb Dock up river to Swanson or Appleton Dock. 170 Infrastructure Victoria ADVICE ON SECURING VICTORIA S PORTS CAPACITY

171 171
172 Recommendations 8 Detailed planning for development of a second major container port at Bay West should begin approximately 15 years prior to when the Port of Melbourne reaches a capacity of 8 million TEU per annum. Based on current analysis and projections, detailed planning for a second major container port should begin around 2040, with the new port to begin operation around The Victorian Government should make necessary land use and zoning changes around the proposed Bay West port area as soon as possible. This should include providing for current and future industrial, commercial and residential land to ensure the required land is available when needed in the long term. The Government should confirm whether the Werribee River location option at Bay West is preferred and confirm transport connections to that site. Alternatively, the Government could identify the connections for the three main port location concepts at Bay West and protect all the potential transport corridors. This should involve consultation with Melbourne Water and the Wyndham City Council. Recommendation of Infrastructure Victoria s 30-year infrastructure strategy called for identification of existing and future potential freight precincts requiring planning protection. 10 The Victorian Government should work with Melbourne Water and Wyndham City Council to further define transport corridor requirements and alignments in and around the Western Treatment Plant and the Bay West site. Before planning protections are enacted more detailed transport corridors will need to be identified. The alignments within the Western Treatment Plant need to take into account the plant s current operations, expansion plans and environmental values. Transport corridor planning should be undertaken in light of broader land use and transport planning in the Wyndham area. The Government should confirm whether the Werribee River location option at Bay West is preferred and confirm transport connections to that site. Alternatively, the Government should identify the connections for the three main port location concepts at Bay West and protect all the potential transport corridors. 11 A suitable rail corridor between the Princes Freeway and the Western Freight Line for future port related use should be defined in more detail and protected. Before planning protections are enacted, the Victorian Government will need to identify detailed transport corridors. The preferred rail corridor north of the Western Treatment Plant needs to be selected and have suitable planning protections put in place. This should involve consultation with Melbourne Water and Wyndham City Council. 172 Infrastructure Victoria ADVICE ON SECURING VICTORIA S PORTS CAPACITY
173 12 The existing Outer Metropolitan Ring Road rail and road reservations should continue to be preserved. The Outer Metropolitan Ring Road and the associated rail corridor will be important transport connections for Bay West. These corridors need to be preserved so they can be built when required. Having these corridors clearly identified allows for the port links within the Western Treatment Plant to be finalised, as there is an interface between the Outer Metropolitan Ring Road alignment and the transport links that will need to be built to the Bay West site. Recommendation of Infrastructure Victoria s 30-year infrastructure strategy called for construction of the Outer Metropolitan Ring Road within years. 13 The Victorian Government and local governments should ensure urban encroachment does not hinder port capacity development at Bay West and that suitable buffers between the Bay West site, its planned transport corridors and other land users are maintained. Urban encroachment could limit the ability to develop Bay West when it is required. Conflicting land uses limit the ability of the port to operate 24 hours a day seven days a week or reduce amenity for the local community. Recommendation of Infrastructure Victoria s 30-year infrastructure strategy called for identification of existing and future potential freight precincts requiring planning protection. 14 A Victorian Government department or agency should be tasked with baseline evidence gathering and ongoing monitoring of environmental conditions relevant to future port developments. The data from this evidence gathering and monitoring should be published and integrated with the Environmental Management Plans for Port Phillip Bay and Western Port, the Ramsar Wetland Management Plans and other relevant Victorian Government publications. This will create a transparent, long-run evidence base to inform future port project development and approval processes. Factors that are measured and monitored should include: hydrodynamics including water circulation and sediment transport coastal and seabed morphology including response to sea level rise water quality including turbidity, nutrients and nutrient cycling coastal and marine habitats including sea grass, saltmarsh and mangroves flora and fauna including water birds, shorebirds, threatened species and marine mammals. Gathering this data over the long term will reduce project and approval risks and save time once port planning commences. It will also increase community confidence in the quality of the environmental baseline evidence. 15 Establishment of baseline environmental data and ongoing monitoring for the Bay West port site should involve engagement with the community and stakeholders prior to further project definition and in further development of the concept design. The data from evidence gathering and monitoring relevant to Bay West should be published regularly. This working with nature approach should enable a better understanding of relevant natural and social values, and provide an opportunity to identify solutions that enhance these values as well as achieve the project objectives. 173
174 16 The Victorian Government should publish a comprehensive Ports Strategy covering the four main commercial ports in Victoria. This strategy should be integrated with a refreshed Victorian Freight Strategy and confirm the roles and objectives of Victoria s commercial ports to ensure they meet the needs of Victorian importers and exporters. The Ports Strategy should identify opportunities for the Victorian Government to influence or support the Port of Melbourne Lessee, Ports of Hastings, Geelong and Portland to accommodate relocated components of the automotive, Bass Strait, break bulk and bulk trades to enable container capacity expansion at the Port of Melbourne. Infrastructure Victoria s view is that Hastings is well suited to handle any relocation of the automotive trade when a new terminal is required in coming decades. 17 Following further definition of the role of the Port of Hastings in a comprehensive Ports Strategy, the Victorian Government should review the extent of zoning protection and government land holdings necessary for the future role of the Port of Hastings. While Infrastructure Victoria has identified Bay West as the clearly preferred location for a second container port, the Victorian Government should consider the cost (including opportunity cost) of protecting real options at the Port of Hastings and associated transport access corridors for potential future uses, as defined by the Ports Strategy. This review is likely to identify excess land in the Special Use Zone (SUZ1) and within government ownership at the borders of SUZ1 which could be suitable for alternative development uses by industry and residents. 18 The Victorian Government should review the existing legislative framework that administers use of the assets at the Port of Hastings and replace it with a series of contracts or commercial arrangements that enable greater asset utilisation and growth. There is an opportunity to remove legislative and policy constraints that currently limit the ability of the Port of Hastings to attract new customers and increase non-containerised trade volumes. While the Port of Hastings will transfer to State management in mid-2017, the terms between the State and some of the port s customers are still governed by legislation rather than more flexible contracts. This is likely to be an impediment to the Port of Hastings operations and trade in future. 19 Previously collected environmental data on the area around the Port of Hastings should be published and environmental monitoring should be continued to support future development driven by possible relocation of trades from the Port of Melbourne. The data from ongoing environmental monitoring relevant to Hastings should be published regularly. This includes the already compiled hydrodynamic and geotechnical data within Western Port. Comprehensive sea-grass mapping of the Western Port Ramsar area will be required. 174 Infrastructure Victoria ADVICE ON SECURING VICTORIA S PORTS CAPACITY

175
176 Sources Infrastructure Victoria publications Infrastructure Victoria, Preparing advice on Victoria s future ports capacity discussion paper, 2016 Infrastructure Victoria, Second container port advice consultation summary paper, 2017 Infrastructure Victoria, Victoria s 30-Year infrastructure strategy, 2016 Advice to Infrastructure Victoria AECOM, Infrastructure Victoria Second Container Port Advice Navigation Study, 2017 Baggerman Associates, Ports Planning Advice Engineering Services Dredging and Reclamation, 2017 Cardno, Infrastructure Victoria Second Container Port Advice Hydrodynamics Study, 2017 Deloitte, Infrastructure Victoria Second Container Port Advice container trade forecasts for Victoria, 2017 Deloitte, Infrastructure Victoria Second Container Port Advice economic advice, 2017 Deloitte, Infrastructure Victoria Second Container Port Advice supply chain assessment methodology, 2017 Deloitte, Infrastructure Victoria Second Container Port Advice social amenity impacts of port-related freight movement, 2017 Deloitte, Infrastructure Victoria Second Container Port Advice multi criteria assessment (MCA), 2017 Deloitte/Jacobs, Infrastructure Victoria Second Container Port Advice port strategic transport modelling, 2017 Deloitte/Jacobs, Infrastructure Victoria Second Container Port Advice landside transport modelling, 2017 Drewry, Container Ship Fleet Forecast and Maritime Economic Assessment, 2017 Environmental Geosurveys, Infrastructure Victoria Second Container Port Advice Geomorphology, 2017 GHD, Infrastructure Victoria Port Phillip Bay Geophysics Survey, 2016 GHD, Infrastructure Victoria Second Container Port Advice Concept Options Bay West and Hastings, 2017 GHD, Infrastructure Victoria Second Container Port Advice Estimated Capacity of the Port of Melbourne, 2017 GHD, Infrastructure Victoria Second Container Port Advice Environmental & Social Advice, 2017 Guy Holdgate and Associates, Bay West Preliminary Geotechnical Investigation, 2016 Raylink Consulting, Regional Rail East and Hastings Rail Link Concept of Operations Report, 2017 RPS, Workshop summary report, 2016 RPS, Second container port advice - evidence base - Submissions summary report, 2017 Victoria University Institute for Supply Chain and Logistics, Indicative Estimates of Commodities and Truck Volumes from Container Destinations in Melbourne, 2017 Documents prepared for Port of Hastings Development Authority and used by Infrastructure Victoria AECOM, Land Use Planning Desktop Assessment, 2014 AECOM/GHD, Channel Design for Construction Stage 1 Preliminary Recommendations for Dredging Tolerances and Batter Slopes, 2014 AECOM/GHD, Initial Berth Alignment and Terminal Footprint, 2014 AECOM/GHD, Vessel Clearances and Safety Zones at Long Island Point, 2014 Andrew Long + Assoc for GHD/AECOM, Aboriginal Cultural Heritage Desktop Assessment, 2014 Andrew Long + Assoc for GHD/AECOM, Aboriginal Cultural Heritage Predictive Model Report, 2015 Aurecon, Marine Geophysics Survey Final Interpretative Report, 2014 Biosis for GHD/AECOM, Port of Hastings: SUZ1 and Land Transport Corridor Desktop Flora and Fauna Assessment, 2014 Biosis for GHD/AECOM, Port of Hastings: Flora and Fauna Assessment of Crown land and BlueScope Steel property (within SUZ1), 2014 Biosis for GHD/AECOM, Waterbirds desktop review and study design, 2014 Capire for GHD/AECOM, Preliminary Desktop Studies Social Desktop Assessment, 2014 Cardno, Port of Hastings 2013 Description Report Hydrodynamics, 2013 CEE for GHD/AECOM Seagrass desktop review and study design, 2014 Deakin University for GHD/AECOM, Benthic Habitat Mapping in Western Port desktop review and study design, 2015 GHD, Port of Hastings Container Expansion Project Ecology Description Final Report, Infrastructure Victoria ADVICE ON SECURING VICTORIA S PORTS CAPACITY
177 GHD/AECOM, Basis of Design, 2015 GHD/AECOM, Channel Design for Navigation Report, 2015 GHD/AECOM, Concept Channel Design & Channel Development Strategy, 2015 GHD/AECOM, Dredging & Reclamation Ground Improvement, 2015 GHD/AECOM, Interim Structural Design Options Assessment Report, 2015 GHD/AECOM, Port Precinct and Environs Preliminary Planning Concepts, 2015 GHD/AECOM, Preliminary Review and Analysis of recreation, Amenity and Heritage Issues, 2013 GHD/AECOM, Real Time Navigation Simulation Report, 2015 GHD/AECOM, Services & Utilities Assessment, 2015 GHD/KPMG, Review of Preliminary Container Demand Work, 2014 Lovell Chen for GHD/AECOM, HSUZ1 Area and Land Transport corridor Historical Heritage Desktop Assessment, 2014 Raylink Consulting & John Hearsch, Rail-Port Interface Facility Preliminary Concept Investigation, 2014 Raylink Consulting, Frankston Stony Point Rail Corridor Suitability for Container Freight to the Proposed Hastings Container Port, 2014 Raylink Consulting, Hastings Rail-Port Interface Facility Preliminary Cost Estimate, 2014 Report Royal HaskoningDHV, Dredging History in Western Port, 2015 Royal HaskoningDHV, An Alternative Port Concept Design, 2015 Royal HaskoningDHV, Constraints and Opportunities Mapping in Marine Areas for Dredge Material Management Purposes, 2015 Royal HaskoningDHV, Dredging and Reclamation Options Report, 2015 Royal HaskoningDHV, Early Hydrodynamic Modelling Report, 2014 Royal HaskoningDHV, Hydrodynamic Input for 2D Vessel Simulations, 2015 Royal HaskoningDHV, Preliminary Siltation Analysis Western Port Shipping Channel and Berth Pockets, 2014 University of Melbourne for GHD/AECOM, Marine Fish desktop review and study design, 2014 WorleyParsons, Factual Report on Marine Geotechnical Investigation, 2014 Victorian Government documents Department of Treasury and Finance, High Value/High Risk Guidelines, Last accessed February 2017 Environment Protection Authority, Francis Street Monitoring Program Final report December 2013, gov.au/~/media/publications/ 1546%201.pdf. Last accessed February 2017 KPMG, Project Blue Scoping Study, 2014 file:///c:/users/ QSH/Downloads/KPMG-Scoping-Study.pdf. Last accessed February 2017 Port of Melbourne Corporation, Port of Melbourne and Dynon Rail terminals: 2009 container logistics chain study full report, work/ ?selectedversion=nbd Last accessed February 2017 VicRoads, Supplement to Austroads Guide to Traffic Management Part 3: Traffic Studies and Analysis, published October 2015, traffic.../temvolume1part23agtm3traffic. Last accessed February Victorian Government, Fishermans Bend Urban Renewal Project, Last accessed February 2017 Victorian Government, Plan Melbourne, 2014, www. planmelbourne.vic.gov.au/home. Last accessed February 2017 Victorian Government, State Budget, Budget paper 2. Strategy and Outlook, May gov.au/bp2_ _strategyandoutlook.pdf. Last accessed May Victorian Ports Corporation (Melbourne), Harbour Master s Directions, 2015 Victorian Ports Corporation (Melbourne), Port Information Guide, 2016 Commonwealth Government documents BITRE, Research report 138. Maritime, Containerised and non-containerised trade through Australian ports to , 2014 Department of Defence, Point Wilson, Victoria information sheet, VIC/1315PointWilsonVic.pdf, Last accessed February 2017 Other Bass Coast Shire Council, Phillip Island and San Remo Visitor Economy Strategy 2035 Growing Tourism, Strategy_2035, Last accessed April 2017 Brooke, Jan (2013), PIANC s Working with Nature philosophy:an introduction and case studies, Keynote address, Australasian Coasts and Ports Conference, Sydney OECD, Competitiveness of Global Port Cities Synthesis Report, 2014 PIANC Position Paper Working with Nature October 2008; revised January
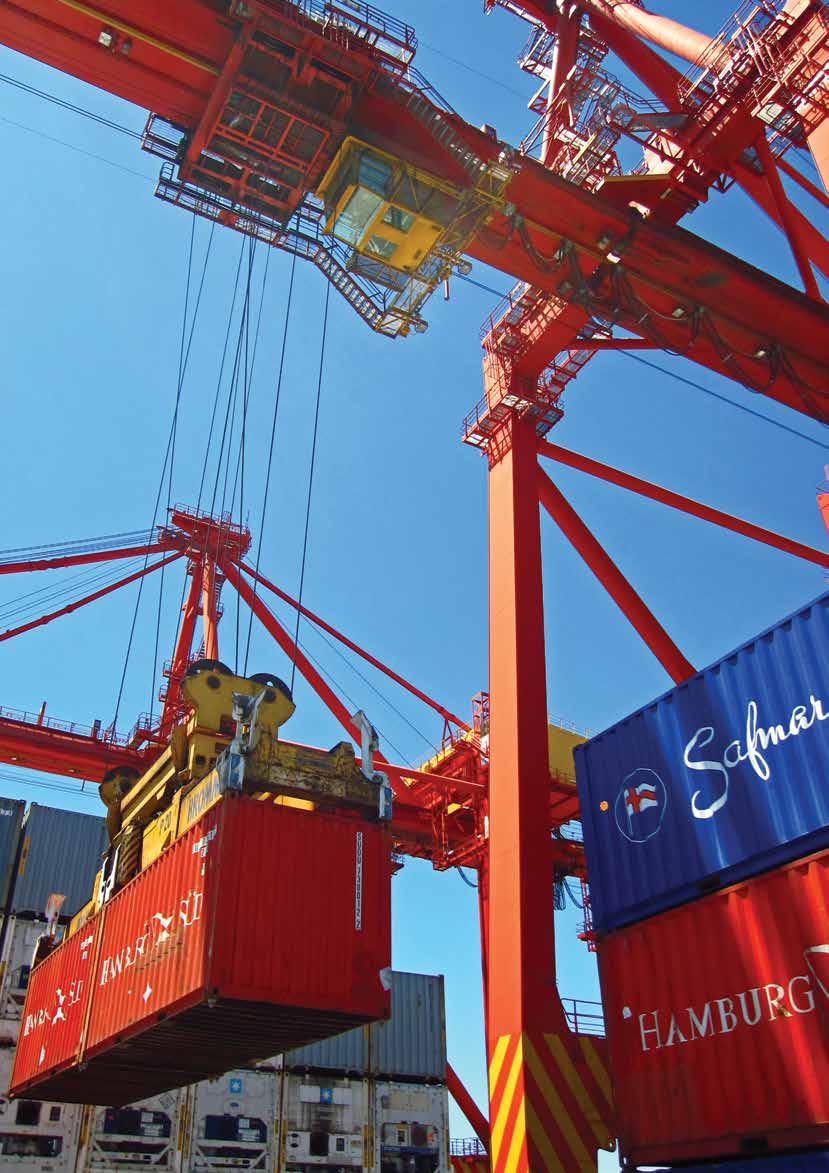
178
179 About us Infrastructure Victoria is an independent advisory body, which began operating on 1 October 2015 under the Infrastructure Victoria Act It has three main functions: preparing a 30-year infrastructure strategy for Victoria, to be refreshed every three to five years providing written advice to government on specific infrastructure matters publishing original research on infrastructure-related issues. Infrastructure Victoria will also support the development of sectoral infrastructure plans by government departments and agencies. The aim of Infrastructure Victoria is to take a long-term, evidence-based view of infrastructure planning and raise the level of community debate about infrastructure provision. Infrastructure Victoria will not directly oversee or fund infrastructure projects. Photo credit: HiVis Pictures/Peter Glenane/Port of Melbourne Corporation/Melbourne Water/Neville Rosengren, Museums Victoria - Dr Julian Finn, Museums Victoria - David Paul, istock - Ymgerman, istock - Dan_prat, Shutterstock - Javen. 179

180 This publication may be of assistance to you, but the State of Victoria and its employees do not guarantee that the publication is without flaw of any kind or is wholly appropriate for your particular purposes and therefore disclaims all liability for any error, loss or other consequence that may arise from you relying on any information in this publication. You should seek appropriately qualified advice before making any decisions regarding your particular project. Printed by Infrastructure Victoria May 2017 Copyright State of Victoria 2017 Except for any logos, emblems, trademarks, figures and photography, this document is made available under the terms of the Creative Commons Attribution 3.0 Australia licence. It is a condition of this Creative Commons Attribution 3.0 licence that you must give credit to the original author, who is Infrastructure Victoria. This document is also available in PDF and accessible Word format at ISBN
City of Greater Geelong. Response to Infrastructure Victoria s Second Container Port Advice evidence base discussion paper
 City of Greater Geelong Response to Infrastructure Victoria s Second Container Port Advice evidence base discussion paper March 2017 Tim Ellis Manager Enterprise Geelong and Events City of Greater Geelong
SECOND CONTAINER PORT ADVICE Consultation summary
 SECOND CONTAINER PORT ADVICE Consultation summary 2 Advice Contents Introduction 4 What we did 6 Feedback and submissions 6 Stakeholder meetings 7 Workshops 8 What we heard 9 Key themes from feedback and
Illawarra Business Chamber/Illawarra First. Submission on NSW Draft Freight and Ports Plan
 Illawarra Business Chamber/Illawarra First Submission on NSW Draft Freight and Ports Plan Illawarra Business Chamber A division of the NSW Business Chamber Level 1, 87-89 Market Street WOLLONGONG NSW 2500
Infrastructure Victoria. Second Container Port Advice Estimated Capacity of the Port of Melbourne
 Infrastructure Victoria Second Container Port Advice Estimated Capacity of the Port of Melbourne May 2017 GHD Report for GHD - Victoria Second Container Terminal Port Advice, 31/34508/ i Table of contents
ALC Brief Inquiry into National Freight and Supply Chain Priorities 18 May 2018
 The Federal Government today released the Final Report from the Inquiry into National Freight and Supply Chain Priorities (the Inquiry). You can view the Final Report here. The Final Report was released
Submission Cover Sheet Fishermans Bend Planning Review Panel
 Submission Cover Sheet Fishermans Bend Planning Review Panel 122 Full Name: Organisation: Affected property: Attachment 1: Attachment 2: Attachment 3: Comments: Ken and Zan Anderson Anderson_Submis Request
AT A GLANCE. Cairns Shipping Development Project. Revised Draft Environmental Impact Statement Fact Sheet July 2017.
 Cairns Shipping Development Project Revised Draft Environmental Impact Statement Fact Sheet July 2017 AT A GLANCE > An additional 70 cruise ships into Port of Cairns each year by 2031 > Project design
The Victorian Transport Plan (Department of Transport, 2008).
.") 18 TRANSPORT Planning should ensure an integrated and sustainable transport system that provides access to social and economic opportunities, facilitates economic prosperity, contributes to environmental
18 TRANSPORT Planning should ensure an integrated and sustainable transport system that provides access to social and economic opportunities, facilitates economic prosperity, contributes to environmental
Intermodal Logistics Centre at Enfield Environmental Assessment CHAPTER 1 INTRODUCTION
 Intermodal Logistics Centre at Enfield Environmental Assessment CHAPTER 1 INTRODUCTION October 2005 Contents 1. 1-1 1.1 Background 1-1 1.1.1 The Applicant 1-1 1.1.2 Growth in Container Trade 1-1 1.1.3
Far North Queensland Ports Corporation Limited PORT OF MOURILYAN
 Far North Queensland Ports Corporation Limited PORT OF MOURILYAN LAND USE STRATEGY August 2009 Contents 1.0 INTRODUCTION...1 1.1 The Port of Mourilyan... 1 1.2 Strategic Port Land... 1 1.3 About the Land
Trade Supply Chain. Developing Rail and Sea Access. Peter Keyte PBPL
 Trade Supply Chain Developing Rail and Sea Access Peter Keyte PBPL Port of Brisbane key economic enabler Queensland s largest port $50 billion worth of trade handled annually equivalent to c. 20% of Qld
PORT OF NEWCASTLE CONTAINER TERMINAL PRESENTATION FEBRUARY 2018
 PORT OF NEWCASTLE CONTAINER TERMINAL PRESENTATION FEBRUARY 2018 WHAT WE DO Port of Newcastle has 89 employees. Our functions include: Trade and port development. Management of 792 hectares of port land.
Improving access to Victoria s key commercial ports
 Roads Australia Annual Victorian Industry Forum Improving access to Victoria s key commercial ports 28 August 2014 David Hodgett MP Minister for Ports Minister for Major Projects Minister for Manufacturing
Avalon Airport Rail Link. Community and Stakeholder Issues and Ideas Report Understanding what s important. December 2011
 Avalon Airport Rail Link Community and Stakeholder Issues and Ideas Report Understanding what s important 6 December 2011 1. 1. Introduction The Victorian Government committed $3 million in the 2011-12
Fishermans Bend Integrated Transport Plan Peer Review John Kiriakidis, GTA Consultants 28/03/2018
 Fishermans Bend Integrated Transport Plan Peer Review John Kiriakidis, GTA Consultants 28/03/2018 GTA creating transport that works 01 Preliminaries GTA creating transport that works Review scope : Review
Safety and Environment Management Plan
 PORT OF HASTINGS DEVELOPMENT AUTHORITY Safety and Environment Management Plan Revision number: 0 POH-HSE-PLN-002 Date: 25 May 2017 Glossary and Abbreviations AMSA AQIS AS/NZS 4801:2001 Ballast water Bilge
Berth 9 Quay Extension Environmental Statement Non-Technical Summary
 Berth 9 Quay Extension Hutchison Ports UK Ltd July 2013 Final Report 9Y0150 CONTENTS Page 1 PROJECT BACKGROUND 1 2 NEED FOR THE PROPOSED SCHEME 4 3 DESCRIPTION OF THE CONSTRUCTION PHASE 4 4 DESCRIPTION
GLOBELINK A STRONG PLAN FOR REAL CHANGE 1
 GLOBELINK A STRONG PLAN FOR REAL CHANGE 1 We re ready. Over the last four years, we ve been working hard developing our vision for the future of South Australia. Not just policies, but a series of achievable
Port of Chickasaw. For Sale. 750-F Viaduct Road N., Chickasaw, AL
 Overview Land Info / Site Plan General Specs Tenant Summary Location For Sale Property Information Income producing 13.52 ± acres 3 office trailers 14,000 SF ± warehouse Natural edge 4 spud barges 800
General comment relating to matters presented in the Strategic Infrastructure Plan for South Australia Discussion Paper are as follows:
 Attachment A General comment relating to matters presented in the Strategic Infrastructure Plan for South Australia- 2010 Discussion Paper are as follows: It is apparent to SAFC that in the Discussion
Build it but will they come?
 A Technical Report, 26 August 2014 supporting Build it but will they come? A pre-mortem analysis of the Port of Hastings Development Project Dr Hermione Parsons and Mr Peter Van Duyn The Institute for
Study on the Plan of Taipei Port
 Third Chinese-German Joint Symposium on Coastal and Ocean Engineering National Cheng Kung University, Tainan November 8-16, 2006 Study on the Plan of Taipei Port Chi-Chi Chen UNION-TECH Engineering Consultants
Port Feeder Barge. Floating infrastructure for container ports.
 Port Feeder Barge Floating infrastructure for container ports Page 2 Floating infrastructure for container ports Although tremendous efforts have been made in worldwide port development following issues
Accommodating Mega-Ships at Existing Wharves
 Accommodating Mega-Ships at Existing Wharves Presented by: Kevin P. Abt, P.E. The Virginia Port Authority and Bruce Lambert U.S. Army Corps of Engineers February 22, 2006 National Cargo Trends U.S. Cargo
Community Consultation Report December 2016
 Community Consultation Report December 2016 Project Background The City of Greater Geelong, Wyndham City and the Department of Environment, Land, Water and Planning are working together to deliver the
House Select Committee on Strategic Transportation and Long Term Funding Solutions. November 6, 2017
 House Select Committee on Strategic Transportation and Long Term Funding Solutions November 6, 2017 1 Welcome to N.C. Ports Fast Facts Two locations serving the Carolinas Over 350,000 teus Over 4 million
Although tremendous efforts have been made in worldwide port development following issues are still on the agenda in many (container) ports:
 ports:") Page 1 Port Feeder Barge: Floating infrastructure for congested (container) ports Although tremendous efforts have been made in worldwide port development following issues are still on the agenda in many
Page 1 Port Feeder Barge: Floating infrastructure for congested (container) ports Although tremendous efforts have been made in worldwide port development following issues are still on the agenda in many
Understanding the State Planning Policy July 2017 Changes to state interest statements, policies and assessment benchmarks
 Understanding the State Planning Policy July 2017 Changes to state statements, policies and assessment benchmarks This fact sheet outlines the key policy changes to the state statements, policies and assessment
CITY OF VANCOUVER ADMINISTRATIVE REPORT. General Manager of Engineering Services in consultation with the Director of Current Planning
 CITY OF VANCOUVER ADMINISTRATIVE REPORT Date: September 1, 2005 Author: Dale Bracewell Phone No.: 604.871.6440 RTS No.: 5291 CC File No.: 8203 Meeting Date: September 20, 2005 TO: FROM: SUBJECT: Standing
Once known as warehousing and distribution, the process
 Map III-2.3 Proposed Agile Port Industrial Area AGILE PORT INDUSTRIAL AREA PLAN Once known as warehousing and distribution, the process of moving goods to market has evolved dramatically. No longer is
A BRIEFING NOTE ON THE PORT SECTOR IN BANGLADESH. February 15, 2007
 Public Disclosure Authorized Public Disclosure Authorized Public Disclosure Authorized Public Disclosure Authorized A BRIEFING NOTE ON THE PORT SECTOR IN BANGLADESH 1. CURRENT SITUATION February 15, 2007
BACKGROUNDER #6: Moving Goods & Services
 BACKGROUNDER #6: Moving Goods & Services Introduction The Metro Vancouver region plays a critical role as Canada s Pacific Gateway providing the network of roads, waterways, rail facilities, and air and
GLOBE LINK CONNECTING SOUTH AUSTRALIA TO THE WORLD
 GLOBE LINK CONNECTING SOUTH AUSTRALIA TO THE WORLD 2036 WILL MARK OUR STATE S BICENTENARY By the time our State turns 200 years old, I want South Australia to be a place of prosperity. Planning and delivering
Freight Action Plan Summary. A Catalyst for Change The Regional Transport Strategy for the west of Scotland
 Freight Action Plan Summary A Catalyst for Change The Regional Transport Strategy for the west of Scotland 2007-2021 Strathclyde Partnership for Transport Contents Purpose...2 Issues, Constraints and Opportunities...2
The Operating Concept Peter Beamish, MA MICE Technical Director, Royal HaskoningDHV
 TEN-T Project 2011-IT-94006-S Implementation study to prepare a Public Private Partnership (PPP) to improve the capacity of the port of Venice and related logistics system Venice Offshore Onshore Port
Process for Port Master Planning
 Process for Port Master Planning Presented by Kerry Simpson, P.E. Vice President, Marine Terminals AAPA Port Executive Management Seminar Merida, Mexico December 2014 Moffatt & Nichol Founded in 1945 in
Draft Submission to the Inquiry into National Freight and Supply Chain Priorities. August 2017
 Draft Submission to the Inquiry into National Freight and Supply Chain Priorities August 2017 KEY POINTS Local government welcomes the government s development of a new freight and ports plan and looks
Infrastructure Victoria Second Container Port Advice Container trade forecasts for Victoria
 Infrastructure Victoria Second Container Port Advice Container trade forecasts for Victoria 13 February 2017 1 Contents Glossary 5 1 Purpose and overview 7 1.1 Container trade in Victoria 7 1.2 This report
For personal use only
 Disclaimer Page 2 Page 3 Share Price (13 July 2012 ) $ 0.085 Shares On Issue m 160.1 Market Capitalisation $m 13.6 Cash (30 June 2012) $m 4.7 Convertible Note $m 5.0 Enterprise Value $m 13.9 (For further
F5. Coastal Minor Port Zone
 F5. Coastal Minor ort Zone F5.1. Zone description Auckland has a range of water transport facilities in addition to the city centre port that are important for business and industry. Maintaining such sites
Port of Philadelphia Port Advisory Board
 Port of Philadelphia Port Advisory Board JULY 7, 2016 Meeting Overview: Natural flow of port development arising from the channel being deepened to 45 feet. Channel Deepening Project The Channel Deepening
Hub port strategy positions Port of Tauranga for continued growth
 20 August 2015 Hub port strategy positions Port of Tauranga for continued growth FINANCIAL RESULTS FOR THE YEAR ENDED 30 JUNE 2015 Highlights: Trade volumes up 2% to 20,179,078 tonnes Container throughput
APPENDIX 8-A. Valued Component Selection Rationale
 APPENDIX 8-A Valued Component Selection Rationale This page is intentionally left blank A list of candidate s was compiled based on issues identified through the scoping process described in Section 8.1.2
Qube Holdings Limited. Presented to. Challenges & Efficiencies Presentation to AmCham May 2015 Maurice James Managing Director
 Qube Holdings Limited Presented to XYZ Sydney s Company Freight Challenges & Efficiencies Presentation to AmCham May 2015 Maurice James Managing Director Disclaimer Important Notice ABN 141 497 230 53
Information Paper. Moorebank Intermodal Terminal Project. October 2011 Moorebank Project Office
 Information Paper Moorebank Intermodal Terminal Project October 2011 Moorebank Project Office Contents Introduction...3 Background...4 What is an Intermodal Terminal...4 Establishment of Intermodal Study...4
I202. Central Wharves Precinct
 I202. Central Wharves Precinct I202.1. Precinct description The zoning of the land within the Central Wharves Precinct is the Business City Centre Zone and the underlying zoning of the part of the Central
WEB BASED OPERATIONAL SYSTEM FOR OPTIMIZING SHIP TRAFFIC IN DEPTH CONSTRAINED PORTS by
 WEB BASED OPERATIONAL SYSTEM FOR OPTIMIZING SHIP TRAFFIC IN DEPTH CONSTRAINED PORTS by Simon B. Mortensen 1, Franz Thomsen 1, Alex Harkin 1, Senthil Kumar Shanmugasundaram 1, Claus Simonsen 2 and Robert
Water Quality in Cleveland Bay. Frequently Asked Questions
 Water Quality in Cleveland Bay Frequently Asked Questions 1 NATURAL WATER QUALITY IN CLEVELAND BAY What is turbidity and how does it relate to water quality? Turbidity is caused by particles suspended
Navigating the Future NSW PORTS 30 YEAR MASTER PLAN
 Navigating the Future NSW PORTS 30 YEAR MASTER PLAN OCTOBER 2015 PORT BOTANY: THE NEXT 30 YEARS CONTENTS MESSAGE FROM THE CHAIRMAN 3 EXECUTIVE SUMMARY 4 INTRODUCTION 6 OUR PORTS AND INTERMODAL TERMINALS
Infrastructure Victoria. Second Container Port Advice Concept Options - Bay West and Hastings
 Infrastructure Victoria Second Container Port Advice Concept Options - Bay West and Hastings May 2017 GHD Report for Infrastructure Victoria Second Container Ports Advice - Engineering, Dredging and Reclamation,
SEARs project justification and conclusion
 31 Project justification and conclusion This chapter presents a justification for the project and a conclusion to the environmental impact statement (EIS). The justification is based on the strategic need
The Infrastructure Challenge: Perspectives on the Road Ahead
 The Infrastructure Challenge: Perspectives on the Road Ahead Halifax, August 8, 2011 Mary R. Brooks, 2011 Gamechangers Infrastructure Investment Captures Attention Heartland Corridor (streamlining a complex
Issues in measuring and managing changes to the ecological character of the Western Port Ramsar Site as a result of climate change
 presenter: Shelley Heron Issues in measuring and managing changes to the ecological character of the Western Port Ramsar Site as a result of climate change Western Port Bay Where is it? Ecological character
Measure 43: Intermodal Loading Units and freight integrators First page:
 Measure 43: Intermodal Loading Units and freight integrators First page: Policy package: 5: Intermodal Measure 43: Propose by 2003 a new Community framework for the development of the profession of freight
National Transport Commission Submission to Infrastructure Victoria
 National Transport Commission Submission to Infrastructure Victoria Automated and zero emission vehicles March 2018 Submission outline 1 Introduction 3 1.1 The purpose of this submission 3 About the NTC
GETTING THE SUPPLY CHAIN RIGHT
 GETTING THE SUPPLY CHAIN RIGHT BUILDING THE ECONOMY THROUGH EFFICIENT AND SAFE SUPPLY CHAINS SUMMARY GET THE STRUCTURE RIGHT GET PLANNING RIGHT GET RAIL RIGHT GET ROAD PRICING RIGHT GET ROAD SAFETY RIGHT
AAPA Harbors, Navigation and Environment Seminar Vancouver, B.C.
 AAPA Harbors, Navigation and Environment Seminar Vancouver, B.C. Estimating Emissions From Container Cargo Operations Using a Comprehensive Container Terminal Model June 7, 7, 2006 Moffatt & Nichol MN
ANNEX 2: PRIORITY "PRE-IDENTIFIED PROJECTS ON OTHER SECTIONS OF THE CORE NETWORK (RAILWAYS, INLAND WATERWAYS, ROADS, MARITIME AND INLAND PORTS) "
") ANNEX 2: PRIORITY "PRE-IDENTIFIED PROJECTS ON OTHER SECTIONS OF THE CORE NETWORK (RAILWAYS, INLAND WATERWAYS, ROADS, MARITIME AND INLAND PORTS) " The overall objectives and priorities are set out in chapter
ANNEX 2: PRIORITY "PRE-IDENTIFIED PROJECTS ON OTHER SECTIONS OF THE CORE NETWORK (RAILWAYS, INLAND WATERWAYS, ROADS, MARITIME AND INLAND PORTS) " The overall objectives and priorities are set out in chapter
Summary Report - Terminal 2 (T2) Trade-Off Process and Outputs Container Capacity Improvement Program
 Trade-Off Process and Outputs Container Capacity Improvement Program") Summary Report - Terminal 2 (T2) Trade-Off Process and Outputs Container Capacity Improvement Program February 2012 Executive Summary Overview This summary report documents concept design and planning
Summary Report - Terminal 2 (T2) Trade-Off Process and Outputs Container Capacity Improvement Program February 2012 Executive Summary Overview This summary report documents concept design and planning
Fishermans Bend. Integrated Transport Plan Victorian Planning Panels. Cccc Eco City World Summit July Neal Giles, Fishermans Bend Taskforce
 Fishermans Bend Cccc Eco City World Summit July 2017 Integrated Transport Plan Victorian Planning Panels Neal Giles, Image: Lensaloft Aerial Photography Key Challenges The network needs to change The framework
THE UK PORTS INDUSTRY:
 THE UK PORTS INDUSTRY: Forecasting Growth & Developing Capacity by MDS Transmodal 205024_presentationv5 1. AGENDA Past trends, 1965-2004 Ports & Public policy - History and forthcoming review Forecasting
PORT MASTER PLAN AMENDMENT NO. 26 LA WATERFRONT LAND USE ADDITIONS, MINOR FILLS, AND NEW HARBORS
 PORT MASTER PLAN AMENDMENT NO. 26 LA WATERFRONT LAND USE ADDITIONS, MINOR FILLS, AND NEW HARBORS BACKGROUND The Port Master Plan for the Port of Los Angeles (Port) was certified by the California Coastal
COMPETITIVE ACCESS AND SERVICE ARRANGEMENTS OF CONTAINER MOVEMENTS: PORT BOTANY CASE
 COMPETITIVE ACCESS AND SERVICE ARRANGEMENTS OF CONTAINER MOVEMENTS: PORT BOTANY CASE Mihailo Cvetojević a* a Vessel Operations Group, DP World Australia Sydney Abstract: The paper analyses New South Wales
Bottlenecks and Priority Issues for the Development of Shipping and Ports in North-East Asia
 III. Bottlenecks and Priority Issues for the Development of Shipping and Ports in North-East Asia 3.1 Bottlenecks to Shipping and Port Development in North-East Asia National experts were requested to
Draft State Planning Policy Road and Rail Noise
 Submission December 2017 Draft State Planning Policy 5.4 - Road and Rail Noise Submission to the Western Australian Planning Commission Contact Caroline Cherry C.Cherry@cmewa.com The Chamber of Minerals
Hume Regional Development Australia Committee. Freight Directions in the Hume Region Summary Report
 Hume Regional Development Australia Committee Freight Directions in the Hume Region Summary Report This report: has been prepared by GHD for Hume Regional Development Australia and may only be used and
Stakeholder Consultation Outcomes
 City of Hobart TRANSPORT STRATEGY 2018-2030 Consultation Phase MODULE 1 FREIGHT, PORT AND AIR Stakeholder Consultation Outcomes November 2016 in association with T ABLE OF C ONTENTS 1. Background 2. Consultation
PIANC Commission Working Group Report Reviews
 PIANC Commission Working Group Report Reviews EnviCom Working Group report details Initial review: conclusion * If identified as potentially sensitive, please highlight the particular areas of potential
Growth In Container Volumes
 US GDP and TEU Trade: 1980-2005 600 Recession Total US TEUs 500 US GDP 400 300 200 100 0 1980 1981 1982 1983 1984 1985 1986 1987 1988 1989 1990 1991 1992 1993 1994 1995 1996 1997 1998 1999 2000 2001 2002
TEU & GENERAL FREIGHT MOVEMENTS
 SUPPLY CHAIN PERSPECTIVE TEU & GENERAL FREIGHT MOVEMENTS Overview TEU (containers) A large range of product and materials imported to and exported from Australian ports are transported in shipping containers.
TRB - Annual Meeting
 TRB - Annual Meeting NATIONAL DREDGING NEEDS STUDY PHILLIP J. THORPE Institute for Water Resources 16 January 2002 AGENDA Background Information Historical Perspective Global and US Trade World and US
NEW SOUTH WALES INTERMODAL FORUM. August 2017
 NEW SOUTH WALES INTERMODAL FORUM August 2017 1 PACIFIC NATIONAL AT A GLANCE A summary of Pacific National s performance from the last financial year: TEUs HANDLED 0.8m (INTERMODAL) 57 BILLION NTKs REVENUE
Technical Memorandum 3 Executive Summary Existing Conditions and Constraints Presentation. March 22, 2006
 Technical Memorandum 3 Executive Summary Existing Conditions and Constraints Presentation March 22, 2006 MCGMAP Overview Develop a: Goods Movement Action Plan M A X I M I Z E S Mitigation of communities'
Conversion of Kurnell refinery to a fuel import terminal
 Conversion of Kurnell refinery to a fuel import terminal Dr Jos Kusters 1 May 2014 AGENDA Background Kurnell site conversion Management of environmental and community impacts Operation as a terminal 2
Driving Future Fleet Management Conference. Speech by Michael Kilgariff, ALC Managing Director
 Driving Future Fleet Management Conference Speech by Michael Kilgariff, ALC Managing Director Good morning ladies and gentlemen. It is a pleasure to be here today to talk about driving the economy through
Submission to Infrastructure Victoria Second Container Port Advice
 Submission to Infrastructure Victoria Second Container Port Advice The Rail Freight Alliance is made up of rural, regional and metropolitan Councils across Victoria. The Alliance membership has a strong
Port of Portland. Presentation to the Rail Freight Conference Challenges and Opportunities Today 10 October 2014 Grand Hyatt Melbourne
 Presentation to the Rail Freight Conference Challenges and Opportunities Today 10 October 2014 Grand Hyatt Melbourne By Jim Cooper, Chief Executive Officer, Port of Portland 1 Overview 2 Berths 320 ships
CALL FOR PROPOSALS FOR MAKING AREAS AVAILABLE AT THE TRADING PORT OF SÈTE WITH A VIEW TO OPERATING A CONTAINER AND GENERAL CARGO YARD.
 CALL FOR PROPOSALS FOR MAKING AREAS AVAILABLE AT THE TRADING PORT OF SÈTE WITH A VIEW TO OPERATING A CONTAINER AND GENERAL CARGO YARD Specifications Preamble Ownership of the ports of Sète and Frontignan
NZCPS 2010 Guidance note Policy 9: Ports
 NZCPS 2010 Guidance note Policy 9: Ports Contents Policy 9...1 Overview of the policy... 2 Rationale... 3 Related objectives, policies and provisions...4 NZCPS 2010... 4 Resource Management Act 1991...
Part 2 Strategic Plan
 Part 2 Strategic Plan 25 BRISBANE PORT LAND USE PLAN 2015 2.1 Context 2.1.1 Statutory Context Under the TIA, this LUP is required to include a strategic plan for the Brisbane core port land which: (a)
Alternatives. Summary of key outcomes: CHAPTER 5
 Summary of key outcomes: The high economic and environmental cost of transporting containers from alternative intrastate or interstate locations, together with the strong trend in international shipping
The Hong Kong Container Port a regional logistics hub
 The Hong Kong Container Port a regional logistics hub Hong Kong Container Port a brief history Container Traffic first introduced into Hong Kong in 1970 s Container Terminals started operations in 1972
Qube Holdings Limited
 Qube Holdings Limited Freight & Logistics Council WA 31 May 2018 1 Disclaimer Important Notice ABN 141 497 230 53 The information contained in this Presentation or subsequently provided to the recipient
Freight transport policy and measures in Norway
 PIARC meeting and seminar 13-15 June 2005 in Ouagadougou Freight transport policy and measures in Norway Senior Adviser Hans Silborn, Norwegian Public Roads Administration Norway is a sparsely inhabited
Intermodal Terminal Developments - Benefits to the South East Region
 Intermodal Terminal Developments - Benefits to the South East Region Presented by Sam Tarascio A brief background of Salta Properties Privately owned business started 43 years ago. Completed $2 billion
TEN THINGS YOU NEED TO KNOW ABOUT A FCSTT (Floating Container Storage & Transhipment Terminal)
") TEN THINGS YOU NEED TO KNOW ABOUT A FCSTT (Floating Container Storage & Transhipment Terminal) 1) Explain the concept of a "floating port"? The Floating Container Storage & Transhipment Terminal, or FCSTT,
TEN THINGS YOU NEED TO KNOW ABOUT A FCSTT (Floating Container Storage & Transhipment Terminal) 1) Explain the concept of a "floating port"? The Floating Container Storage & Transhipment Terminal, or FCSTT,
Miami River Freight Improvement Plan Financial Management Number:
 Miami River Commission January 8, 2018 Miami, FL Carlos A. Castro, District Freight Coordinator Miami River Freight Improvement Plan Financial Management Number: 437946-1-22-01 Agenda Study Background
Gateway Infrastructure Development Programs in Urban Centers on the west coast of North America
 November 16, 2011 Gateway Infrastructure Development Programs in Urban Centers on the west coast of North America Capacity Improvements Congestion & Air Emissions Mitigation & Community Amenities Mark
SUSTAINABILITY PLAN 2015
 SUSTAINABILITY PLAN 2015 Printed on 100% recycled paper. B NSW PORTS SUSTAINABILITY PLAN CONTENTS A MESSAGE FROM THE CHAIRMAN 2 NSW PORTS ENVIRONMENT POLICY 3 NSW PORTS: A SUSTAINABLE BUSINESS 4 FOCUS
Rail Freight Terminal
 Rail Freight Terminal One of a series of background topic papers prepared by db symmetry in support of a public consultation on proposals for a strategic rail freight interchange in Blaby district, to
KOGI REPORTS BARGING STUDY COMPLETED
 ASX ANNOUCEMENT & MEDIA RELEASE 14 October 2013 KOGI REPORTS BARGING STUDY COMPLETED Highlights Niger River Barging Study Completed by Prestedge Retief Dresner Wijnberg (Pty) Ltd Five barging scenarios
Welcome. For more information:
 Welcome Thank you for attending Port Metro Vancouver s open house about the South Shore Corridor Project. The purpose of this open house is to: Share project information Answer your questions and hear
VICTRACK S MANAGEMENT OF DYNON RAIL FREIGHT TERMINAL
 s management of Dynon Rail Freight Terminal VICTRACK S MANAGEMENT OF DYNON RAIL FREIGHT TERMINAL AUSRAIL 2015 Ben Needham General Manager, Property Group,, Victoria s second largest land owner, discusses
CONTAINER PORT GOALS 10-2
 ten CONTAINER PORT CONTAINER PORT GOALS GOAL CP 1 Identify the core port and port-related container industrial area and protect the long-term function and viability of this area (see Figure 41, Core Area).
A more detailed description of Transportation, and its programs and initiatives can be found at
 Business Plan 2018 21 Transportation Accountability Statement This business plan was prepared under my direction, taking into consideration our government s policy decisions as of March 7, 2018. original
Greater Golden Horseshoe Transportation Plan
 Greater Golden Horseshoe Transportation Plan Transportation Profile Executive Summary October 2017 PREPARED BY Urban Strategies Inc. and HDR for the Ministry of Transportation TRANSPORTATION PROFILE -
Submission Cover Sheet Fishermans Bend Planning Review Panel
 Submission Cover Sheet Fishermans Bend Planning Review Panel 170 Full Name: Organisation: Affected property: Attachment 1: Attachment 2: Attachment 3: Comments: Request to be heard?: Precinct: General
Significant prevention measures in place for each LNG carrier *
 Safe shipping About LNG Canada LNG Canada is a joint venture company comprised of four global energy companies with substantial experience in liquefied natural gas (LNG) Shell, PetroChina, KOGAS and Mitsubishi
FREIGHT CORRIDORS AND GATEWAYS: DEVELOPMENT APPROACH AND EVALUATION CRITERIA COMPARISON IN NORTH AMERICA AND THE EUROPEAN UNION
 FREIGHT CORRIDORS AND GATEWAYS: DEVELOPMENT APPROACH AND EVALUATION CRITERIA COMPARISON IN NORTH AMERICA AND THE EUROPEAN UNION Juan Carlos Texas A&M Transportation Institute Introduction International
American Association of Port Authorities Harbors & Navigation Committee September 27, 2018
 American Association of Port Authorities Harbors & Navigation Committee September 27, 2018 Lauren K. Brand, PPM Associate Administrator Ports & Waterways Maritime Administration 1200 New Jersey Ave., SE