Institutional Assessment of UNICEF Supply Division s Forecasting Process Final Report
|
|
|
- Clifford Gallagher
- 6 years ago
- Views:
Transcription


1 Institutional Assessment of UNICEF Supply Division s Forecasting Process Final Report Completed November
2 ACKNOWLEDGEMENTS We would like to thank the many people who have contributed their time, efforts and thoughts to this institutional assessment of UNICEF Supply Division s Forecasting Processes. Special thanks go to UNICEF s Country Office staff in Bangladesh, Democractic Republic of Congo, Egypt, Ethiopia, Mozambique, Nigeria, Pakistan, Rwanda and South Sudan; Regional Office staff in Bangkok and Nairobi; Programme Division staff in New York; as well as Partners and Suppliers for supporting and participating in this assessment. The Reference Group led by Doreen Mulenga, Deputy Director Supply Division, provided valuable insights and guidance to the assessment. The Reference group consisted of: Heather Deehan Bervery Chawaguta Peter Ellison Robert Matthews Jan Komrska Valentina Buj Christos Kasapantoniou Edward Addai Rudolf Schwenk Last but certainly not least, we would like to acknowledge the valuable contribution of UNICEF Project Manager Ashley Wax, whose support throughout the assessment was very much appreciated. This assessment report represents the views of the assessment team from Deloitte Consulting, whose members were: Maureen Hughes Jurgen Hoppenbrouwers Jim Lee Robert Jan van Schuppen Ann Allen Kelly Pender The purpose of publishing all evaluation reports is to fulfil a corporate commitment to transparency. The reports are designed to stimulate a free exchange of ideas among those interested in the topic and to assure those supporting the work of UNICEF that it rigorously examines its strategies, results, and overall effectiveness. The content of the report does not necessarily reflect the policies or views of UNICEF. The text has not been edited to official publication standards and UNICEF accepts no responsibility for error. The copyright of this report is held by the United Nations Children s Fund,
3 TABLE OF CONTENTS EXECUTIVE SUMMARY... 6 INTRODUCTION & APPROACH WHAT ARE THE DEMAND PLANNING PROCESSES AND OBJECTIVES WITHIN UNICEF SD? What are the different demand planning processes and what are their purposes? To what extent is there clarity in the purpose, process, roles and responsibilities of demand planning within UNICEF? Does SD provide the right amount of [demand planning] support to COs? To what extent is product forecasting informing ITU planning and activities? WHAT ARE THE QUALITY AND EFFECTIVENESS OF CURRENT DEMAND PLANNING PROCESSES? What is the accuracy and bias of the forecast? What are the internal and external drivers that affect forecast accuracy? Has SD adequately adjusted its forecasting methods to respond to changes in partnership demands and processes? To what extent is SD forecasting the appropriate products using the appropriate method? To what extent is SD using available intelligence in the demand planning processes? To what extent is SD taking on the right amount of risk [in their stock strategy] and doing enough to mitigate risk? To what extent are the current demand planning processes, tools, and methods well suited [effective]? WHAT IS THE EFFICIENCY OF CURRENT DEMAND PLANNING PROCESSES? To what extent is UNICEF correctly staffed to manage demand planning? WHAT IS THE IMPACT OF CURRENT DEMAND PLANNING PROCESSES? To what extent has demand planning enabled SD to deliver supplies at the right price, right place, and right time? What are the consequences of poor or no forecasts? What is the impact of forecasting on influencing markets? SUMMARY OF FINDINGS & RECOMMENDATIONS ASSESSMENT LIMITATION & AREAS FOR FURTHER ASSESSMENT ANNEXES
4 Annex 1: Abbreviated Methodology Annex 2: Process Maps Annex 3: Overview of Demand Planning Documentation Annex 4: Support to Country Offices Annex 5: Detailed Forecast Analysis Annex 6: LTA analysis Annex 7: Forecasting Framework Annex 8: Terms of Reference Annex 9: Country Office Summaries Annex 10: PS Forecast Process by Commodity Group Annex 11: Consultancy Team Profiles List of figures REFERENCES
5 LIST OF ACRONYMS APICS American Production and Inventory Control Society ARV Antiretroviral BMGF Bill and Melinda Gates Foundation BU Business Unit CCE Cold Chain Equipment CHAI Clinton Health Access Initiative CMAM Community Management of Acute Malnutrition CO Country Office CoV Coefficient of Variation DP Divisional Procedure ECU Emergency Coordination Unit EPI Extended Programme on Immunization ERP Enterprise Resource Planning ESARO East and Southern Africa Regional Office ESL Emergency Stock List EVM Effective Vaccine Management FTE Full Time Equivalent Gavi Global Alliance for Vaccines and Immunization Gavi SDF Gavi Strategic Demand Forecast HIV PoC HIV Point-of-Care (Rapid testing) HTC Health Technologies Centre IAEH kit Inter-Agency Emergency Health Kit ITU International Transport Unit LLIN Long Lasting Insecticide Net LTA Long-term Agreement MENA Middle East and North Africa MFSDU Market Analysis, Finance & Data Unit MNC Medicines and Nutrition Centre MoH Ministry of Health MRP Material Requirements Planning NGO Non-Governmental Organization OMP Office Management Plan PATH Program for Appropriate Technology in Health PC Procurement Centre PD Programme Division PO Purchase Order PSC Procurement Services Centre PS Procurement Services RDT Rapid Diagnostic Test RFP Request for Proposal RO Regional Office RUTF Ready-to-use Therapeutic Food SAM Severe Acute Malnutrition SIA Supplementary Immunization Activities SCOR Supply Chain Operations Reference SD Supply Division SKU Stock Keeping Unit SO Sales Order TAD Target Arrival Date UNDP United Nations Development Programme UNICEF United Nations International Children s Fund VC Vaccine Centre WSEC Water, Sanitation, Education Centre WB World Bank WCARO West and Central Africa RegionalOffice WHO World Health Organization WH Warehouse Unit 5
6 EXECUTIVE SUMMARY UNICEF Supply Division (SD) has an important role in coordinating procurement and supply of strategic and essential commodities for UNICEF programmes, and on behalf of governments and partners. It is a key player within a complex ecosystem of governments, donors, partners, suppliers, and their own country offices (COs). SD coordinates a major part of the end-to-end supply chain, from supplier to the port of entry of the receiving country, and supports COs on the downstream aspects of the supply chain. As in any complex supply chain, the links are highly interdependent, thus aligning supply with demand is inherently challenging. The current context that SD operates in can be characterized by a number of key developments or attributes affecting demand planning, such as: The increasing number of new or transitioning vaccines The availability of new funding mechanisms through Gavi, the Vaccine Alliance and other donors The emergence of new, innovative technologies, particularly for cold chain equipment The graduation of countries from the Gavi programme and their transition to self-procurement Growing awareness of the importance of effective vaccine management and improvements of in-country supply chains The increasing frequency and severity of natural disasters To gain insight into future needs, and be able to fulfill these needs in a timely, efficient and cost-effective manner, SD has set up a number of different category-specific demand planning processes. Demand planning plays a critical role in ensuring that supplies reach the right place, at the right time, in the right quantity and at the right price. Given the criticality of these processes, SD has requested this assessment to understand the current demand planning processes, ensure effectiveness and efficiency, and examine ways to mitigate risks and identify options for further optimization. The assessment was structured around the following four primary questions, followed by a set of conclusions and recommendations: Q1. What are the demand planning processes and objectives within SD? Q2. What are the quality and effectiveness of current demand planning processes? Q3. What is the efficiency of the current demand planning processes? Q4. What is the impact of the current demand planning processes? The assessment leveraged multiple methodologies to address the questions provided by SD, and to support the conclusions and recommendations. Desk review of over 150 separate documents including, but not limited to: annual reports, existing policies and guidelines, forecasting tools, procurement strategies, previous reviews and audits Semi-structured interviews with approximately 50 individuals within SD, 42 within 9 in-scope COs, 1 within the ESARO Regional Office (RO), 5 within Programme Division (PD), 16 with key external partners and suppliers, and 5 with external supply chain experts in the sector, totaling to 119 interviews Quantitative analysis of complete product portfolio, forecast performance for all CO forecasts and selected tenders and LTAs, analysis of delivery reliability, lead time, and stock cover as well as time and effort estimation 6
7 SUMMARY OF FINDINGS Throughout this Report, we use the term demand planning, as defined by the Supply Chain Operations Reference model (SCOR), to describe the process of aggregating demand and incorporating market intelligence to generate a demand plan. There are several different planning processes within SD, each with different objectives, planning characteristics (horizon, level of detail, etc.), and involving different stakeholders. These planning processes fall within the categories shown below. Category Objective(s) UNICEF Processes Strategic Planning / Annual Budgeting Product Demand Planning Strategic Product Demand Planning Tactical Inventory and Replenishment Planning Project handling fee receipts that are collected to offset the cost of providing procurement services and detect trends that could impact required SD & CO staff necessary to manage orders from COs or governments Define required products and related volumes that feed into procurement strategies and are used for tender forecasts (Y1+) Provide suppliers with latest information on demand in order to increase production efficiency (<Y1). Provide COs and partners with the latest information on supply (<Y1) Facilitate distribution planning Define appropriate stock levels Define the timing and quantity of replenishment orders Procurement Services Forecast Tender Forecasts Annual CO forecasts including for vaccines, injection devices, cold chain equipment (CCE); long lasting insecticide Net (LLIN), rapid diagnostic tests and nutrition supplies Inventory Planning for the Health Technologies Centre (HTC), Medicines and Nutrition Centre (MNC), Water, Sanitation and Education Centre (WSEC), and Replenishment Planning (Warehouse Forecast) The main findings and key recommendations per demand planning process are summarised below. 1. PROCUREMENT SERVICE FORECAST SD makes projections of the expected value of upcoming non-gavi Procurement Services (PS) per commodity group twice a year. The total non-gavi forecast accuracy across commodity groups was relatively good in 2013 and 2014, ranging from 81 to 87 per cent. The four top value commodity groups: Anti-retrovirals, new vaccines, oral polio vaccine, and traditional EPI vaccines represented, on average, 89 per cent of the total PS procurement value and had, with the exception of new vaccines, good forecast performance. Given that the portion of non-gavi PS value is less than half of total PS value, and no evidence could be provided when the non-gavi PS forecast did not meet its objectives, the effectiveness of this forecast is sufficient. There should also be an understanding that product demand planning improvements will logistically translate into an improved PS forecast. There is room, however, to increase the efficiency and rigor of the PS forecast process. The majority of the commodity groups leverage existing demand planning processes. For the remaining commodities (approximately 11 per cent of PS value) that do not have demand planning processes in place, PS Centre (PSC) coordinates the PS country and partner forecast process. The CO inputs provided through this process gives limited insight to different SD Business Units (BU) 1 when generating the PS forecast, and may instead cause confusion and inefficiency. Global partner input, on the other hand, is an important component, and United Nations Development Programme (UNDP) forecast accuracy is measured through the bilateral scorecard. There is no documentation on the steps taken by SD Procurement Centres (PCs) to produce the PS forecast. There is limited critiquing of the forecast by PSC, and no clear description of the quantitative impact of assumptions on 1 Business Units are the unit below the Procurement Centre, i.e. Essential Medicines or Nutrition 7
8 the forecast. There is no obvious link between narratives accompanying the forecast, and the low, realistic, and high scenarios of demand. 1.1 Recommendations Enhance Procurement Service forecast process To increase efficiency, SD should consider alternative ways of determining the forecast for product categories that are of very low value or are not part of an existing demand planning process, as well as discontinue the Country Forecast exercise triggered by PSC. One option is to utilize statistical forecasting techniques, supplemented by follow-up with key countries and partners. Another option would be to combine the request for high value nonforecasted products (i.e. ARVs) into the Annual CO Forecast. Each BU should clearly document considerations or follow a check list to arrive at the PS forecast. This should be documented and updated as the demand planning environment evolves to ensure continuity between contract managers. Efforts should be made to improve the rigor and link between the PS forecast figures and the associated narrative. It should clearly explain the drivers of demand. BUs should show a clear breakdown of how the final forecast figures for each demand scenario (low, realistic and high) were calculated based on the drivers factored into the calculation. The PSC-coordinated forecast should include a forecast of quantity and value to easily monitor the demand planning performance drivers. In terms of governance, it makes sense to consolidate the PS forecast performed outside of the individual PCs as currently structured. However, given that PSC is unable to play a critiquing role, and that the Market Analysis, Finance & Data Unit (MFSDU) has become a part of the process, it would be more efficient for consolidation to involve as few manual steps as possible (e.g. with PCs entering both quantity and value forecast with clearly described assumptions in an online portal), and the challenging/critiquing role could be picked up solely by MFSDU. A potential alternative is to assign one person to the role in a newly formed Global Service Centre to perform this role. 2. PRODUCT DEMAND PLANNING Product demand planning occurs on both a strategic and tactical level. At the strategic level, longer-term demand projections (1+ year) inform procurement strategies and tender forecasts. At the tactical level, in the short- to medium-term, demand planning allows SD to provide suppliers with the most current information on demand in order to increase production efficiency. It also provides COs and partners with the latest information on supply to help facilitate distribution planning. The tactical demand planning typically covers a horizon of less than a year. Our analysis indicates that the time spent on demand planning is on par with benchmark companies for a similar number of Stock Keeping Units (SKUs). However, there are opportunities for SD to better utilize existing capacity, as well enhance SD s skill set in specific areas, particularly in generating longer-term forecasts. A shared service model could increase efficiency by centralising certain demand planning activities, assist in setting standards and supporting PCs. The organizational structure chosen will have an impact on the capacity and skill sets necessary within individual BUs. SD lacks an overall demand planning strategy consisting of a structured approach to determine its demand planning requirements, and a suitable demand planning process (i.e. which products to forecast, which technique to use, and the necessary characteristics for the forecast, such as timeframe or level of granularity). An ABC-XYZ analysis performed as part of the assessment indicated the appropriateness of current demand planning methods. Generally, SD forecasts products with a suitable demand profile. Given the high Coefficient of Variation (CoV) of most products (high variability of demand), and the variety of demand drivers, demand planning requires significant involvement and intelligence from contract managers. That is, relying solely on a statistical forecast is inappropriate for the majority of SD s products. Exploring mechanisms to reduce the reliance on the forecast is advisable. Suppliers and COs recognize that UNICEF s operational environment makes a certain degree of inaccuracy in forecasting inevitable. To mitigate the reliance on a forecast, and improve response times, COs saw the 8
9 opportunity for SD to increase the number of LTAs at a regional or local level, and assist COs to build up the local supplier base. Suppliers saw the value in product standardization (which allows suppliers to pool demand and reduces risk of making to stock), reduced requirements for shelf life (which also reduces the risk of suppliers producing to stock, and the cost of an inaccurate forecast), and maintaining good relationships (which increases suppliers' confidence to produce based on 'unconfirmed' information). Both immunization devices and LLINs provide good examples in this regard. The accuracy necessary for the device forecast is lower due to the interchangeability of the devices (0.5 syringe), the standardization of products (suppliers produce the same specifications for other markets), and the good relationship between suppliers and SD. Additionally, SD is looking to address the challenge of different shipment lead times for devices and vaccines, and in their most recent tender, have requested a bundled solution from suppliers. For LLINs, the repercussions of low demand planning performance are mitigated by SD s emphasis on product standardization, as well as their longstanding good relationship with suppliers. The Assessment measured the demand planning performance for the products and categories that are currently forecasted by SD by applying two primary measures: forecast accuracy (the inverse of forecast error) and forecast bias. Each of SD s demand planning processes uses a slightly different method of measuring demand planning performance. This makes it difficult to understand and compare performance across SD. Therefore, the results of this assessment may differ from previously reported figures by SD. The effectiveness and suitability of the demand planning processes were determined based on the performance of the forecast, as well as the impact of the forecast and whether the demand planning process allowed SD to meet its objectives. The impact of the forecast was primarily assessed through interviews with suppliers and key partners. 2.1 Tender Forecast (Strategic) The overall objective of the tender forecast is to provide an update to industry to facilitate a healthy market and obtain competitive bids from suppliers. The objective of the Long-term Agreements (LTAs) vary depending on the product s procurement strategy. The LTA may be driven by the need to guarantee capacity in a constrained market, or to lower prices and establish more competitive terms and conditions in non-constrained markets. The tenders selected for this assessment covered routine and non-routine vaccines, devices and Ready-to-Use- Therapeutic Food (RUTF). For routine vaccines, tender forecast accuracy was quite high, with minimal adjustments to LTA quantities. For new vaccines and vaccines undergoing a product shift or used in campaign (supplementary) related activities, the tender forecast was considerably lower, and the LTA quantities were more frequently modified. As devices are bundled together with vaccines, the lower accuracy is partially explained by the low vaccine forecast accuracy, as well as unexpected Warehouse (WH) demand. The RUTF tender forecast is based on historical off-take, and has good quality with per cent accuracy. For vaccines and immunization devices, suppliers perceive the tender forecast and industry consultations hosted by SD as useful indicators of upcoming demand, and a source of information for strategic decision-making. Suppliers of new and transitioning vaccines, as well as vaccines used in campaigns (i.e. MMR, HPV, DTP, OPV, IPV, TT/TD, and Pentavalent), expressed that more clarity and alignment with key partners on the one-year forecast, as well as the longer range two- to three-year forecast, would be helpful. They expressed that a separate forum for more in-depth alignment between UNICEF, key suppliers and partners (i.e. Gavi) on the forecast would be beneficial. The RUTF tender forecast has allowed SD to largely meet their objective of ensuring market capacity and helping increase the supplier base. The forecast accuracy for LTAs, given the expanded supplier base, is more challenging and generally has lower accuracy. Suppliers agreed that a quarterly outlook of demand, perhaps even a minimum quantity for each quarter, would allow smoothing of the erratic peaks and more efficient production planning. The process for producing a tender forecast varies depending on the nature of the product, but generally utilizes existing sources of intelligence effectively. For some products, the tender process requires additional input and 9
10 alignment with key partners, while for other products the Annual CO Forecast or historical off-take is the primary input. For products held in inventory, the process and owner of the tender forecast are not clear. Interviewees internal and external to SD commented that the timeline between commencing a tender and finalizing the LTA were quite lengthy (up to 12 months), and often not completed in a timely manner. Some suppliers commented that earlier finalization of LTA awards would facilitate more efficient and cost-effective supplier planning (i.e. in the procurement of raw materials). In addition, while recognizing that the time required to formally amend LTA awards may be inevitable in certain cases, suppliers also indicated that there was room to improve the process and timeliness of LTA amendments and extensions. In general, the LTA quantities provide an indicator of the portion of demand that a particular supplier will receive, informing their production planning, and, in varying degrees, their procurement of raw material, intermediate goods and procurement of required packaging. Most suppliers use the awarded quantity as an input in their own planning, often incorporating other sources of intelligence such as historical demand in addition to SD s quantities. The low demand planning performance for new and transitioning vaccines, as well as vaccines used in campaigns, which results in poor LTA forecasts, continues to be a challenge, and negatively affects suppliers ability to deliver in a timely and cost-efficient manner. 2.2 Vaccines & Immunization Devices (Tactical) For the majority of vaccines and immunization devices, the Annual CO Forecast feeds into the longer-term strategic forecast informing the procurement strategy and tender quantities. For some commodities (i.e. vaccines used in the eradication of polio), the Annual CO Forecast is not the main source of intelligence. For vaccines, the overall demand planning objective is to smooth demand throughout the year to better match supplier (and country) capacity, and ultimately to achieve UNICEF s objectives of vaccine security. For devices, the aim is to achieve lower prices without compromising quality or market, and where possible shorten lead-times. The annual forecast accuracy of the Annual CO Forecast for vaccines used to cover routine demand is generally quite high. In it was 86 per cent and in 2014, 87 per cent. Demand for supplementary use (such as campaigns) had a lower forecast accuracy at 78 per cent in 2013 and 82 per cent in The analysis showed that stable products with a high percent of routine demand over the two-year period are not necessarily better forecasted than new vaccines or vaccines undergoing a switch. This is due to a number of countries that submitted a forecast for a significant amount of vaccines (e.g. Pentavalent, Pneumococcal), but did not order, e.g. Bangladesh, India, Mongolia, Kenya, Morocco, Nepal, Philippines, and Rwanda. On a monthly basis, the difference in performance between the forecast for routine demand and supplementary demand was negligible, indicating that countries have more difficulty predicting the timing of demand in the year, regardless of the vaccine. The monthly forecast made for routine demand was 37 per cent in 2013 and 41 per cent in 2014, while supplementary monthly forecast accuracy was very similar at 37 and 43 per cent in 2013 and 2014 respectively. Annual forecast accuracy for the top five immunization devices varies considerably, with significant fluctuations throughout the year. The analysis shows an improvement in the routine forecast from 2013 to 2014 when aggregated, however supplementary demand forecast accuracy decreased significantly. For both years, we see a tendency for the forecast to exceed demand, as there is a forecast bias of 30 per cent in 2013 and 70 per cent in The forecast for immunization devices closely follows the forecast for vaccines, although not all countries that procure vaccines through UNICEF will procure the accompanying devices. For both routine and supplementary forecasting, a country s ability to forecast the timing of the coming year s demand (per month) is quite low. This requires frequent follow-up by SD with COs, as well as partners, donors, and suppliers to match demand with supply. The repository for the most up-to-date demand intelligence is the Allocation Table. Based on the Allocation Table, monthly Supplier Reports are generated and shared with LTA holders to provide more reliable information on short- to medium-term demand, which suppliers responded to favourably. The most common reason for deviations between forecast and actual demand is the availability and timing of funding. For vaccines and devices specifically, alignment with Gavi processes is critical. A delay in Gavi Decision 10
11 Letters, additional release of campaign funding mid-year, or a delay in the release of funds, have a significant impact on UNICEF s demand planning performance. Other common explanations for forecast inaccuracy were: countries not including their demand in the UNICEF forecast, but procure through UNICEF due to a challenge in their own procurement process; changes in programmatic strategy or underlying assumptions; unmet programmatic objectives; delays in new product introductions; the inability of the supplier market to provide needed quantities; and, disease outbreaks or disaster (conflict or natural). SD makes considerable effort to gather available intelligence to understand demand drivers. Nevertheless, it is uncertain that all available intelligence is incorporated into demand planning in a meaningful way and historical data fully optimized. This is partly explained by the demand planning tools themselves. Currently the forecast and day-to-day management of supply and demand are done in Excel, and are not linked with the global ERP/VISION system. Information is captured in Excel spreadsheets and shared via . This process does not facilitate analysis, and is not always consistent with Master Data. Forecast accuracy reports do not contain root-cause analysis, which means that incorporating this intelligence into subsequent demand planning processes is inconsistent. The repository for demand intelligence (the Allocation Table) is written over as demand, and the forecast evolves over time and does not capture longer-term intelligence if available. 2.3 Cold Chain Equipment (Tactical) CCE demand planning aims to support sustainable supply in a context of expanded demand and product transitions. The forecast accuracy of the Annual CO Forecast for CCE is quite low. Between 2012 and 2014, forecasts for BPS systems, cold boxes, vaccine carriers and icepacks, compression refrigerators and freezers, and SDD systems, all had a similar forecast accuracy of between 47 and 55 per cent, on average. Absorption refrigerators and freezers had an average 34 per cent accuracy. Spares and accessories, and temperature monitoring devices had the lowest performance with 1 per cent and 18 per cent accuracy respectively. Due to the low forecast accuracy, SD has shifted from target value to time bound LTAs. Throughout the year, there is ad hoc communication with suppliers, but monthly supplier reports are not shared with the suppliers. Demand for CCE is partly driven by new vaccine introductions, although as durable goods, they have a different demand pattern than consumables. The main demand drivers identified by SD s Health Technology Centre (HTC) are the replacement of existing cold chain equipment, future capacity expansion needs, the pricing of CCE, the probability of funding (into which countries often lack complete visibility), and, in the longer-term, the supply chain design in country. With new available Gavi funding earmarked for new, innovative cold chain technologies, UNICEF and other partners are preparing themselves for market disruption. It is essential that demand planning within this new environment involves very close collaboration with Gavi, combined with close collaboration with countries on how they plan possible expansion and upgrading of their cold chain capabilities. In this regard, SD will be required to work closely with the Country Readiness Working Group. Additionally, SD must have a thorough understanding of the products, and the interchangeability with other products, throughout the transition period in order to meet demand. The current CCE demand planning process is no longer suitable, which limits its effectiveness, especially given the changing environment. 2.4 LLIN Forecast (Tactical) The overall aim of the LLIN demand planning process is to achieve lower prices and smooth demand, as well as contribute to the global forecast. The LLIN landscape has been changing in the last few years, as there has been increasing centralization of procurement by The Global Fund and the US President s Malaria Initiative (PMI). This has resulted in an overall decrease in UNICEF s share of global procurement to approximately 14 per cent in The current LLIN CO Forecast provides insight into only ~30 per cent of SD s procurement value, as the majority of LLIN procurement is done on behalf of partners, primarily UNDP. Given individual country preferences, SD does not 11
12 benefit from offsetting one country s under forecast with another country s over forecast. Even those countries who submit a forecast and procure have a very low accuracy. In 2013, of the 15 countries that provided a forecast for LLINs, only ten of these procured. The forecast accuracy of those ten countries was 25 per cent on average. In that same year, 60 per cent (or ~94.8 million USD) of total shipped value to 27 countries was not forecasted by COs. A lighter process that focuses on the 10 highest malaria burden countries and key partners (e.g. UNDP) would be more suitable. Funding uncertainty, and who will fund which needs, drives much of the forecast inaccuracy. The process should also focus on alignment with Global Fund and PMI, and on leveraging the work of WHO and Roll Back Malaria Harmonization Working Group for malaria commodities. For the first time in 2015, PMI, Global Fund and UNICEF will produce a joint demand forecast. This alignment is critical to avoid overlap and provide clarity to suppliers about the logic and assumptions made in the forecast. 2.5 Nutrition Forecast (Tactical) The RUTF bid forecast is based on historical off-take and has good accuracy ranging from 85 to 97 per cent. The RUTF forecast has been instrumental in increasing the supplier base, but now faces the challenge of awarding the right LTA quantities across suppliers, and increasing the visibility of order timing throughout the year to ensure the forecast enables timely delivery of the right quantity at the right price. SD does not currently circulate supplier updates during the year. Suppliers noted that a better quality forecast, or more visibility of upcoming demand (i.e. in the form of quarterly outlooks) from SD, would result in higher delivery reliability and lower prices. SD also conducts an annual demand planning process for Community Management of Acute Malnutrition (CMAM) commodities, including RUTF, via an online platform - NutriDash. The annual accuracy of the RUTF forecast has increased from 54 per cent in 2012 to 74 per cent and 93 percent in 2013 and in 2014 respectively. The forecast for CMAM commodities could not be measured for accuracy, as the products are also demanded outside of CMAM programmes, and demand could not be categorised. The CMAM forecast is a useful crosscheck in the creation of the bid forecast. COs struggle to predict the timing of demand, and the current investment of time and effort in this process does not justify its value. To improve the CMAM demand planning performance, the CO forecast could be more effectively mined, however the BU currently lacks the capacity to do so. Within the CMAM demand planning process, there may be room for further efficiency to prevent delays before the country office receives the forecast form. 2.6 Recommendations Define demand planning requirements and strategy Apply a set of generic guidelines, as described in the Forecasting Framework (Annex 7), to structurally define the demand planning requirements, including the most efficient and effective demand planning process that addresses both strategic and tactical needs. SD Procurement Centres should review their product portfolio annually to evaluate and justify which products should be forecasted and at which level. Mechanisms that reduce the reliance on the forecast should be explored if and when possible. For suppliers, examples include product standardization (which allows suppliers to pool demand and reduces the risk of producing stock), or reduced requirements for shelf life (which also reduces the risk of suppliers producing stock, or the cost to suppliers of an inaccurate forecast). Maintaining open and good relationships with suppliers also increases the willingness of suppliers to act flexibly, and increases confidence to produce based on 'unconfirmed' information. For COs and partners, SD should also consider increasing the number of LTAs at a regional or local level, assisting COs to build up the local supplier base to mitigate the reliance on a forecast and increase response times Refine demand planning organizational structure Consider the creation of a central demand planning unit responsible for setting standards and assisting PCs with longer-term forecasts as well as activities such as data cleaning, master data management, statistical forecasting, reporting and identification of attention points. Alternatively, SD could consider further decentralizing the demand planning process by creating a role at the regional level focused on consolidating and challenging CO forecasts. A 12
13 Regional Forecast would then be submitted to SD for review. A stronger regional supply presence can also serve as an extension of SD in providing support to COs. Based on the organizational structure, SD should then determine gaps in individual staff members capacity so that contract officers and managers can receive the necessary training on demand planning methodologies Implement structured and focused drum beat to balance demand and supply Identify the key countries, products, donors, partners, and drivers of forecast inaccuracy. Implement a structured communication approach for high impact countries with designated inputs and outputs, and clear documentation for changes in demand projections. Continue to mine all available intelligence from key partners, and consider a forum with key partners and suppliers to discuss in further depth the longer-term forecast. Given the necessity of updating the forecast throughout the year, a more rigorous, focused, and proactive approach to gathering insights for key products from key COs, partners and donors would result in a better demand planning performance by ensuring demand signals are systematically incorporated in the demand planning process Implement one web-based source of the truth linked with ERP Implement a web-based demand planning system linked with the global ERP system that allows contract managers and relevant country counterparts to more efficiently and directly exchange feedback with greater access to past forecasts, historical procurement figures, root-cause analysis of forecast inaccuracy and other intelligence. A webbased system can also leverage existing initiatives (such as VIVA) and potentially extend to include data sources outside of UNICEF, such as Gavi Decision Letter quantities. In addition, we recommend cleaning up the material master as indicated in Step 1 of the process for demand planning in the Forecasting Framework ensuring that only the master data team can change core fields. If SD decides against a fully integrated system, we recommend a defined planning hierarchy that is consistently referred to across PCs (i.e. forecasting tools, allocation tables, ERP) and the use of material numbers in the Forecasting Tool, to ensure clarity on the product that is requested Standardize performance metrics and conduct root-cause analysis Standardize the metrics used to report on forecasting performance. Recommended metrics are described in the Forecasting Framework. Conduct a root-cause analysis for demand planning inaccuracies and clearly document reasons for deviation on a quarterly basis. Demand planning performance metrics and explanations for deviations should be shared with Management Team/Directors Office, COs and any other relevant stakeholders quarterly Improve alignment with Gavi SD should place a high priority on improving the alignment of the Gavi Secretariat and SD processes. This will help to mitigate a significant portion of uncertainty within the demand planning process. For CCE, it will be essential to understand Gavi s processes and the implications of the co-investment funding model. Throughout all processes, data systems should facilitate the dynamic flow of information that goes back and forth and feeds into decisionmaking processes in both organizations to whatever extent possible. 3. INVENTORY AND REPLENISHMENT PLANNING SD currently warehouses stock in four locations. The analysis focused on the Copenhagen warehouse, as there is little to no inventory planning outside of Copenhagen. The Demand and Supply Unit within WH coordinates and conducts the analysis for safety stock levels, which are agreed between the PCs (excluding VC). The calculation of safety stock is based on historical demand (average and standard deviation) and lead-time (average and standard deviation). Additionally, ECU designates a fixed emergency stock level for items on the Emergency Supply List (ESL) based on an estimated target population of 250,000. This stock is theoretically separate from the safety stock, although the system does not differentiate between the two stocks. There is currently no demand planning process for items on the ESL. 13
14 The recent evaluation of SD s emergency response found that the ESL is currently updated on an ad hoc basis without any formal process of determining which items should be added or removed, and how stock levels should be adjusted accordingly. The method of calculating ESL stock levels puts UNICEF at risk of not providing timely and appropriate emergency response, and due to the overlapping product portfolio with regular safety stock, it may also have an adverse effect on SD s ability to serve regular demand in a timely manner. In 2014, WH began piloting Smoothie - a statistical forecasting tool, but it is not currently linked to the SAP database. A forecast is generated for approximately 85 products that feeds into replenishment planning. In the absence of CO intelligence, WH uses historical actuals in order to better anticipate demand and get a sense of larger trends. The forecast is updated in the system quarterly, and feeds into Material Requirements Planning (MRP) replenishment logic with the ultimate aim to improve WH service levels (avoid stock outs, reduce lead times to countries and increase delivery reliability & capacity). WH has established a replenishment policy that does not designate a re-order point separate than the safety stock level. This policy is based on a perceived financial ceiling of USD $50-55 million in inventory, although this number was not confirmed by all interviewees. The current replenishment policy, and confusion over the existence of a financial limit, increases the likelihood of overstocking on certain items and stocking out on others. The forecast for select non-esl items has no discernible impact on service level (per WH s own analysis) in part due to the following factors that play a more significant role in WH s ability to conduct demand planning and forecasting: The system set-up does not allocate stock properly to SOs which results in a skewed view of available stock The system is not able to properly roll up the components of a kit and be seen on the kit level The system planning functionality does not always adjust the forecast properly based on actual demand The overall WH policy is to consolidate orders, which significantly reduces delivery reliability Given high CoV of products, increasing stock levels and/or increasing flexible supplier arrangements may be more effective and suitable (and require less investment of time) The current process, tool(s) and methods are not suited for the purpose intended, and require extensive time and effort to manually manipulate data. There is a need for appropriate stock and replenishment policies facilitated by the appropriate system. 3.1 Recommendations Define global stock strategy Define a global inventory strategy and appropriate stock and replenishment policies for both ESL and regular safety stocks. This should include a clearly defined financial limit, if applicable, and clear roles and responsibilities. Defining stock levels cannot be completed by WH alone, and will require a multi-stakeholder approach, with leadership involvement. Re-evaluate the logic of maintaining separate stocks especially when the two stocks contain overlapping products and cannot be separately managed in the system. Our recommendation would be to designate a desired service level per product. When establishing the strategic impact of the product, take into account if the item will be used in emergency response. Explore alternatives to increase the delivery reliability/capability and reduce lead time such as setting up more regional LTAs, investing in local suppliers, or increasing the strategic use of warehouses outside of Copenhagen, in a holistic assessment of the supply chain network. Clearly define roles and responsibilities for adjustments to service level/stock level, determining kit contents, decisions regarding allocation of stock in case of shortages, and decisions regarding the phase-in and/or phase-out of products. These roles and responsibilities should be agreed by management and shared across SD Resolve warehouse system challenges A detailed analysis and comparison of the SAP system set-up and the functionality of the external forecasting/planning system (Smoothie) should be done to decide whether the forecasting is better supported in the SAP system or external system. Based on the decision on where to execute the forecasting/planning, the COs 14
15 should be provided with access to either the SAP or the external system forecasting and planning functionality. If Smoothie is to be continued, integrate Smoothie as a regular tool interfaced with VISION. Analysis should be done on the impact of changing the system set-up in order to support the desired forecast consumption. Based on the results of the analysis develop a strategy to implement the corrections. An analysis should be done to investigate whether the missing part functionality meets the business requirements Implement structured warehouse demand planning process Define a mechanism that incorporates available early intelligence of COs and PCs into planning. Increase the focus on large potential upcoming education projects, identify countries procuring large volumes of largest water and sanitation supplies, and transfer intelligence of typical demand for emergencies. Consider the World Food Program Forward Purchase Facility (FPF) model that procures commodities in anticipation of requests from individual projects. Conduct monthly meetings between WH and PCs to show current and forecasted stock levels, incorporate PC intelligence, and agree on replenishment proposal (on the precondition that system issues are solved). With system fixes (stock properly allocated in the correct sequence), a dashboard of stock availability should be made available to PCs (and possibly also to COs). 4. CROSS-CUTTING CO interviews and feedback from Vaccine Centre s annual survey of COs often cited that additional support from SD would be beneficial. The support requested ranged from general capacity building and education in terms of demand planning within the CO and in-country counterparts, to specific guidance on the forecasting tool itself. COs also highlighted the need to demonstrate and sensitize people to the strategic importance of the forecast, and emphasizing the link between a good forecast and delivery reliability and capability. In order to increase responsiveness, and reduce the reliance on the forecast, SD could also assist COs to build the local supplier base and increase regional or local LTAs. Given SD s reliance on COs in the demand planning processes, it is important that there is clear ownership within the CO, incorporated into the relevant staff member s Job Description. This is currently lacking. Improving the capacity of COs and their country counterparts in demand planning will increase the efficiency and effectiveness of both in-country supply chains and the entire upstream supply chain. To support this, UNICEF s objective is to move away from their more traditional service delivery role, and act as a strategic partner providing capacity development support to governments. Nevertheless, it was not clear what SD s approach would be, and there were questions raised about whether SD and/or COs should play a more challenging/critiquing role throughout a country s demand planning process to increase impact. Some Programme Division colleagues and partners expressed that oversupplying the market was also an issue. The question about the role and responsibility of UNICEF in this regard was raised, as were questions about whether SD s measurement of success should be further down the supply chain. Feedback also indicated that there is very little (if any) incentive for COs (or country governments) to accurately forecast due to unplanned demand still often being met by the requested delivery date, with no or little repercussion for the COs. Given this reality there was an open question about how to incentivize COs, as well as governments, to have greater ownership of the forecast and quality of the forecast. There are good existing efforts to increase capacity and educate key countries and partners, within both PCs and the Supply Chain Strengthening Unit. Better alignment of these initiatives across SD, and a cohesive strategy to address the areas of greatest need, would reinforce current efforts and increase impact. 2 UNICEF 2020 ambitions: Excellence in Direct Delivery focused on fragile states and emergency response, Innovation and influencing markets as important drivers, Supply Community and Optimised UNICEF supply chain as hallmarks, Capacity Development and strengthening supply chains emerged, Procurement services continued for health but expanded in nutrition & new products 15
16 Significant efforts have been made to better integrate Programme and Supply functions, especially as related to the nutrition forecasts. These are undertaken in close collaboration with programme colleagues through an integrated web-based platform. Continuing to strengthen and institutionalise this approach is key to successful demand planning. 4.1 Recommendations Invest in capacity building Clarify the role of SD and CO to have accountability for strengthening country s demand planning processes. Develop a cross-cutting strategy for high impact countries by linking efforts made within SD (with the Supply Chain Strengthening Unit and PCs), as well as other external initiatives in a coherent approach to improve the aspects of demand planning that pose the most challenges. Clearly indicate an owner of the forecast exercise by commodity area within COs, and incorporate demand planning in the respective staff member s Job Description Maintain and increase involvement between SD and Programme SD should maintain and increase their presence in programme-related discussions in order to highlight possible supply issues/constraints at the earliest possible stage, as well as integrate this intelligence when reviewing country forecasts. A few concrete recommendations in this regard would be to: Increase programme involvement in key steps of generating a procurement strategy Ensure consistent representation at industry meetings Ensure that CO programme is included in SD training opportunities Create a forum where programme and supply can discuss high risk countries and projected supply scenarios Maintain close alignment in determination of kits and kit contents 16
17 INTRODUCTION & APPROACH UNICEF Supply Division s mission is to provide essential supplies to fulfill children s rights. Supporting child survival and development programmes around the world, UNICEF-procured supplies are critical in providing for children s health, education and protecting them from abuse, exploitation, and neglect. Supply Division (SD) has two primary focus areas: to ensure the global availability of essential supplies through influencing markets for life saving commodities such as vaccines, essential medicines and health products; and to implement a range of supply chain models to ensure these supplies are delivered to children (UNICEF 2015). SD has an important role in coordinating procurement and supply of strategic and essential commodities for UNICEF programming and on behalf of governments and partners. SD manages a major part of the end-to-end supply chain, from supplier to the port of entry of the receiving country, and support Country Offices (COs) on the downstream aspects of the supply chain. SD is a player within a complex ecosystem of governments, donors, partners, suppliers, and their own country offices. As in any complex supply chain, the links are highly interdependent, and aligning supply with demand is inherently complex. In order to get insight into the future needs and be able to fulfill these needs in a timely, efficient, and cost-effective manner, SD has set up a number of different category-specific demand planning processes that play a critical role in ensuring that supplies reach the right place, at the right time, and at the right price. Given the criticality of these processes, SD aims to ensure effectiveness and efficiency, and examine ways to mitigate risks and identify options for further optimization. This assessment will specifically address the following questions: 1. What are the demand planning processes and objectives within UNICEF SD? 2. What are the quality and effectiveness of current demand planning processes? 3. What is the efficiency of the current demand planning processes? 4. What is the impact of the current demand planning processes? In addition, the assessment provides a set of recommendations that are forward-looking, focused on operational learning and practical adaptation. It is understood that UNICEF SD will take ownership of the recommendations given, and outline the path towards their implementation as part of their management response. The Institutional Assessment was conducted in two phases, the Inception phase and the Assessment phase. The purpose of the Inception phase was to gain an initial understanding of UNICEF s demand planning processes and provide a concrete action plan for completing the assessment. This phase included an informal desk review of secondary information, and semi-structured interviews with selected SD staff. The Inception Report designated the period of 2012, 2013 and 2014 in-scope as well as the following Country Offices (COs) and regions: Bangladesh, Democratic Republic of Congo, Egypt, Ethiopia, Mozambique, Nigeria, Pakistan, Rwanda and South Sudan. The related Regional Offices (RO) in-scope are East and Southern Africa Regional Office (ESARO), West and Central Africa Office (WCARO) and Middle East and North Africa (MENA). The Assessment phase leveraged multiple methodologies utilizing both quantitative and qualitative analysis to address the assessment questions. It included additional desk review of documentation provided by SD; as well as semi-structured interviews with numerous stakeholders from SD, and representatives from different Business Units (BU) 3 from above in-scope COs, as well as Regional Supply Officers, and representatives from different sections within Programme Division (PD). It also included quantitative analysis of forecast, order, stock, and shipment data. Further details on the methodology are included in Annex 1. The findings from the qualitative and quantitative analysis, as well as the recommendations, are documented in this Final Report. Separately, a Forecasting Framework (Annex 7)further elaborates the recommendations and describes ways to make the demand planning process more efficient and effective. 3 Business Units are the unit below the Procurement Centre, i.e. Essential Medicines or Nutrition 17
18 1. WHAT ARE THE DEMAND PLANNING PROCESSES AND OBJECTIVES WITHIN UNICEF SD? Institutions, public and private organizations apply different terms and definitions when they talk about projecting demand. Some use the term forecasting, while others talk about demand planning and they are often used interchangeably. Throughout this report we use the term demand planning, as defined by the Supply Chain Operations Reference model (SCOR), which refers to a process of projecting future demand by incorporating and analysing a variety of factors such as historical demand, market trends, new product introductions, seasonal factors, etc. in order to arrive at an accurate demand plan (Deloitte's Supply Chain Assessment Toolkit). 1.1 What are the different demand planning processes and what are their purposes? Within SD there are several different planning processes, each with different objectives, different planning characteristics (horizon, level of detail, etc.), and the involvement of different stakeholders. These planning processes fall within different categories, with product demand planning processes having both a tactical and strategic purpose as shown in the figure below. Within UNICEF SD, the term forecasting is predominately used to describe all processes, and the wording of the assessment questions may reflect SD s own terminology. It is important to note that UNICEF COs and national governments play a significant role in the demand planning process as their input often forms the basis of the forecast used by UNICEF SD. The assessment covers all planning processes. Figure 1 Planning Categories and Objectives Category Objective UNICEF Processes Strategic Planning / Annual Budgeting Product Demand Planning Strategic Product Demand Planning Tactical Inventory and Replenishment Planning Project handling fee receipts that are collected to offset the cost of providing procurement services and detect trends that could impact required SD & CO staff necessary to manage orders from COs or governments Define required products and related volumes that feed into Procurement Strategy and are used for tender forecasts (Y1+) Provide suppliers with latest information on demand in order to increase production efficiency (<Y1). Provide COs/partners with latest information on supply (constraints, extra supply) (<Y1). Facilitate distribution planning Define the timing and quantity of replenishment orders Procurement Services Forecast Tender Forecasts Annual CO Forecast including Vaccines, Injection Devices, & CCE; LLIN Forecast, RDT Forecast, Nutrition Forecast Inventory Planning for HTC, MNC, WSEC and Warehouse Forecast (Replenishment) Each process is further described in the following pages, supplemented by the process maps in Annex 2. 18
19 Figure 2 Supply Division Planning Processes Strategic Planning / Annual Budgeting PS Forecast Owner Frequency Horizon UoM Scope Input Output PSC Demand Planning - Strategic Linked with OMP, Annually + midyear update OMP horizon Value All products procured on behalf of partners Forecasted on a Commodity Group level Annual CO Forecast for Vaccines, Devices, LLIN Historical procurement values Country & Partner Forecast (for select commodity groups) Input from global partners (UNDP & UNFPA) Projected Handling fee receipts Trends that could affect operational structure Procurement Strategies are created for products that are designated as Strategic Essential Products (and other select products). The procurement strategy defines the procurement approach given the current market situation and overall objectives and mandate of SD and UNICEF. The strategy also contains an annual demand forecast with a description of underlying assumptions and the source and methodology of the forecast as well as risks to the demand forecast and an assessment of the likelihood of that risk to be realized. Tender Forecast - Vaccines Tender Forecast - Devices Tender Forecast - CCE Tender Forecast - LLIN Tender Forecast Essential Medicines Tender Forecast - Nutrition Owner Frequency Horizon UoM Scope Input Output VC Per bid calendar 3-5Y Volume HTC Per bid calendar 2Y Volume HTC Per bid calendar 3-5Y Volume HTC Per bid calendar 2Y Volume Vaccines (except for certain vaccines that are purchased ad hoc) Annual CO Forecast IRC Meeting and Gavi DLs, Donors /Partners (MoH, WHO), Historical data Gavi SDF and the Gavi Roadmap Annual CO Forecast IRC Meeting and Gavi DLs, Donors /Partners (MoH, WHO), Historical data Annual CO Forecast Donors /Partners, Historical data LLIN Forecast Donor / PS partners, Historical data Industry update Competitive bids from suppliers Industry update Competitive bids from suppliers Industry update Competitive bids from suppliers Industry update Competitive bids from suppliers MNC Per bid calendar 2Y Volume ACTs, ARVs Historical data Competitive bids from suppliers MNC Per bid calendar 1Y Volume RUTF, F-75, F-100 Donors /Partners (MoH, WHO), Historical data On hand stocks, Cross-check with CO forecast in NutriDash Industry update Competitive bids from suppliers RUTF: Discussions with investors on sites 19
20 Demand Planning Tactical Owner Frequency Horizon UoM Scope Input Output Annual CO Forecast LLIN Forecast (in parallel with above) VC (HTC) Once per year 5Y Volume HTC Once per year 2Y Volume RDT Forecast 4 HTC Once per year 1Y Volume Nutrition Forecasts (NutriDash) MNC Once per year 1Y Volume ~120 CO (All COs) Vaccines, CCE, injection devices ~120 CO (All COs) (but only 24 responses ) ~15-20 CO RDTs Malaria, HIV PoC Diagnostics ~74 CO SAM, MNP, Vitamin A Annual CO Forecast IRC Meeting and Gavi DLs, Donors /Partners (MoH, WHO), Historical data Annual CO Forecast Donor / PS partners, Historical data Annual CO Forecast Donors /Partners (MoH, CHAI) Annual CO Forecast Provisional plans for Cos Monthly Updates to Suppliers from Allocation Table Distribution plans for suppliers Provisional plans for Cos Distribution plans for suppliers Provisional plans for Cos Distribution plans for suppliers Inventory Planning Copenhagen Warehouse 5 Owner Frequency Horizon UoM Scope Input Output HTC MNC WHU WHU Intended monthly, but not consistent; in practice every 3 months 1Y Volume Select HTC items All essential medicines, select nutrition items WSEC WHU WASH, Education Items and Kits Emergency ECU Volume ESL (Emergency Supply List) Replenishment Planning Copenhagen Warehouse Historical offtake Fixed level of stock based on target population of 250,000 Defined inventory levels (safety stocks) Defined inventory levels Owner Frequency Horizon UoM Scope Input Output WH Forecast WHU Monthly 12M Volume ~85 MNC, WSEC, ECU items Historical offtake Replenishment Orders Projection of staff required for pick, pack, and ship 4 As this process has just begun in 2015 no analysis will be performed 20


21 PS FORECAST (STRATEGIC) On behalf of a diverse client base, SD offers Procurement Services (PS), providing this service in addition to UNICEF Programmes to leverage their unique buying position in the marketplace. When offering Procurement Services, UNICEF charges a handling fee, but does so only to defray the associated costs, not to earn a profit. The objective of the forecast is articulated in DP133: The overall objective of preparing and regularly updating the Procurement Services Forecast is to increase predictability of future Procurement Services volumes, and specifically of the handling fees that can be expected as a result, as these have a direct effect on Procurement Services and Gavi budgets. Equally, accurate forecasting allows SD to plan the resources needed to effectively deliver the PS operation in a timely manner (PSC, DP 133 Creating, monitoring and updating the Procurement Services Forecast 2014). As a percentage of total shipped value in , PS shows a decline, however in absolute value, PS has been growing slightly during the past three years. Across product categories, the split between UNICEF Programme and Procurement Services differs, however the Office Management Plan (OMP) predicts that there will be an increase % of PS driven by a number of key product families. The Vision for UNICEF Supply Division puts forth a 2020 ambition that PS are continued for health but expanded in nutrition and new products. Figure 3 PS vs Programme Procurement % : Shipped Value (Billion USD) Note: These figures exclude procurement of Programme / PS related services as well as local procurement of supplies Figure 4 PS vs Programme Procurement % : % of total spend For both Gavi and non-gavi procurement the objective of the PS forecast is to obtain insights into the trends from year-to-year. There are two separate mechanisms in place to defray costs for Gavi and non-gavi procurement. Procurement through Gavi is based on a flat handling fee arrangement, while non-gavi is based on a percentage handling fee, thus requiring a projection of procurement value and associated handling fee receipts. 21
22 The Gavi handling fee is a fixed fee agreed as part of the negotiation process with Gavi, and is based, among other inputs, on seven pre-agreed workload drivers. Annually these workload drivers are analysed (compared to a baseline) to ascertain whether a review of the handling fee is warranted. This process is referred to as the Gavi trigger model. Gavi s Adjusted Demand Forecast is the framework that provides the data inputs for the seven drivers that feed the model, and the outcome is what determines whether a significant change in workload is expected for subsequent years, and whether new budget needs and handling fees will be required. The performance of this forecast will not be measured. For non-gavi procurement a PS forecast in terms of USD value expected to be procured is made on an annual basis and updated mid-year. The duration of the forecast is linked to the OMP cycle (approximately every 4 years). The forecast is included within the OMP as well as a narrative describing high, low and realistic scenarios by commodity area (e.g. ARVs, laboratory supplies, pharmaceuticals). The inputs for the PS forecast are provided by the PCs in a process coordinated by the PSC. The projections made by the PCs are based on historical procurement values, their own intelligence, conversations with donors and other key partners or countries, and previous forecasts among other sources of intelligence. As an additional source of input for PCs, annually the PSC distributes a Country and Global Partner Forecast Sheet to select countries. A table containing the available information on how individual PC process to arrive at the PS value forecast is included in Annex 10. At mid-year the PSC coordinates an update to the forecast. A budget submission will be informed by the latest available forecast update. The forecast is monitored quarterly (as part of quarterly PS Key Performance Indicator reviews), and on a monthly basis the status of the forecast for the ongoing year is updated and made available on a shared drive. If there are significant deviations, the PSC may reach out to the relevant PC for explanations. PROCUREMENT STRATEGY (STRATEGIC) The formal development of Procurement Strategies is a relatively new procedure for SD that is led by the PCs. MFSDU supports the development by providing an outside view and may act as a sparring partner especially for data analysis. In 2013, SD implemented Divisional Procedure 087 Developing and Documenting Procurement Strategies, which was a requirement for Strategic Essential Products, as well as products or services exceeding a certain value or designated as requiring attention. The objectives of the Procurement Strategy are: Document the objectives of procurement activity for a specific product or service over a specified duration Describe planning steps and schedule of key milestones to execute Procurement Strategy Document rationale for taking key procurement decisions and describe link with SD and UNICEF s broader objectives and mandate Establish a set of criteria that support the achievement of strategic goals against which future activities can be subsequently evaluated Provide a conduit to engage key participants in the procurement process and convey other important information to both internal and external stakeholders The Procurement Strategy contains an annual demand forecast accompanied by a description of underlying assumptions and source / methodology as well as risks to the demand forecast and an assessment of the likelihood of the risk being realized. In some ways the development of the Procurement Strategy acts as a trigger for BUs to think strategically about the demand forecast. As one interviewee said, When you update the Procurement Strategy you deep-dive into country forecasts, big countries, partnerships, and you also have a project pipeline. Having defined the objectives of procurement activity, as well as the steps and schedule to execute the Procurement Strategy, SD is in a position to launch the tender process. 22
, the procurement reference group, a global partnership or Programme Division are also consulted.")
23 TENDER FORECAST (STRATEGIC) For VC, forecasts for tenders typically cover a 3-year horizon, but are dependent on the duration of the LTA. The forecast is generated using the Annual CO Forecast as the primary input, combined with additional market intelligence. Depending on the vaccine, other reference points (e.g. Gavi quantity ADF), the procurement reference group, a global partnership or Programme Division are also consulted. SD also shares its longer-term demand projections through annual industry consultations, which give suppliers an opportunity to understand the future market and trends affecting demand for vaccines and immunization devices. For HTC, the projected volumes of immunization devices included in the tender are based on the Annual CO Forecast supplemented with a detailed market analysis (owned by BU manager) and input from global partners and initiatives. LTAs for LLINs cover 12 months with an option to extend by 12 months and immunization devices are for 24 months. For Nutrition, the tender forecasts are based on historical off-take because the timing does not align with the CMAM and MNP CO Annual Forecast. SD sets up two types of Long-term Agreements (LTAs) with suppliers; time-bound and target value or quantitybound. Time-bound LTAs do not include a forecast, while target value LTAs contain a forecast of demand during the period of the LTA. Currently SD establishes target bound LTAs in the following product categories 6 : Vaccines (All), Immunization Devices (AD Syringes, Disposable, RUP Syringes & Needles), LLINs, and Ready-to-se Therapeutic Food (RUTF). Throughout the lifecycle of the LTA, updates are provided based on market intelligence and quantities allocated may be amended upwards. Depending on the Procurement Strategy the objective of the LTAs varies. The LTA may be driven by the need to guarantee capacity in a capacity constrained market or in non-constrained markets, the objective may be lower price and more competitive terms and conditions. ANNUAL CO FORECAST: VACCINES, DEVICES, COLD CHAIN EQUIPMENT (TACTICAL) The Annual CO Forecast exercise gathers the quantity and timing of expected demand for vaccines, devices, and cold chain equipment through an Excel based tool. The products forecasted within this exercise account for roughly 59% of total SD procurement value in the period Figure 5 Procurement Value within Annual CO Forecast Vaccines (56%) Cold Chain (1%) HIV/AIDS & Malaria (6%) Malaria Prev/Diag (6%) Other (8%) Nutrition (7%) Cold Chain (1%) Education (3%) Essential Medicines (4%) HIV/AIDS & Malaria (6%) Immunization Devices (2%) Malaria Prev/Diag (6%) Medical Devices & Lab (3%) Nutrition (7%) Other (8%) Vaccines (56%) WASH (4%) 6 Until 2013 SD also created quantity bound LTAs for Cold Chain Equipment, however because no reliable forecast figures were available they have since moved to time bound LTAs 23
24 COs are requested to provide a forecast for five years with the first year split into monthly buckets, the second year in quarterly buckets, and the remaining three in annual buckets, further divided into Routine and Supplementary activities. The forecast also collects information on funding source and procurement mechanism. Included in the forecast are certain assumptions on wastage rate, target population, estimated coverage, and number of doses/tabs per person. Although SD reviews these assumptions, they are primarily defined by COs, national governments and partners. The intelligence gained through contact with donors and partners is incorporated into the forecast review and into updates during the year (within the Allocation Tables), as further explained in question 2.5. The forecast is considered final between October and December for the following CY and will not be amended again during the year, though there is continuous follow-up throughout the year with COs. Updates are made within the Allocation Table, which forms the basis of monthly Supplier Reports to contracted suppliers (as mentioned above). In case there are supply issues, ad-hoc root-cause analysis will be performed. The information gathered through the forecasting exercise serves a number of purposes. In the broadest sense, the forecast, subsequent pooled procurement, and knowledge gained through close contact with suppliers and countries, play a role in overcoming market shortcomings and ensuring vaccine/supply security (in collaboration with Gavi). In the short- to medium-term, the forecast plays a critical role in balancing expected demand with supplier capacity, as well as managing distribution planning. LLIN FORECAST The LLIN annual forecasting exercise is launched with the Annual CO Forecast exercise and used to forecast demand through UNICEF Programmes. COs provide a forecast separately for Routine and Campaign activities and have the option to provide their forecast at different levels of detail. When the forecast is not provided at the lowest level of product specifications, SD will determine which LLIN to deliver given historical procurement and knowledge of country preference as well as availability. For LLINs, approximately 70% of demand is through Procurement Services, while the remaining 30% is for UNICEF Programmes. Procurement Services demand is projected based on a forecast obtained from UNDP, intelligence from other partners/donors and inputs received from the Annual CO Forecast. The overall aim of the LLIN forecast is to contribute to a broad supply base (by allocating forecasted quantities across a number of suppliers through a competitive bidding exercise) and smooth demand throughout the year. RDT FORECAST In 2015, HTC launched an annual forecasting process for malaria Rapid Diagnostic Tests (RDT). The forecast process aims to obtain information on malaria RDTs demand from a selection of COs (15-20), including information on funding and delivery schedules in order to ensure timely and efficient programme implementation. The forecast will serve as a tool in developing procurement strategies and forms the basis for SD to contract malaria RDT manufacturers. HIV PoC decided to piggy-back off of the malaria RDT process, as the opportunity existed to gather additional information with low incremental effort for COs. Although CHAI is driving the demand planning process for 7 countries, SD sees the advantage to be able to communicate better with suppliers to avoid delays especially in the case of new technologies 7. ESSENTIAL MEDICINES As opposed to Malaria RDTs and HIV PoCs, there is no demand planning process for Malaria and HIV medicines (mainly procured through PS). Given UNICEF s low volumes, SD relies on the working groups such as Global ARV and Global Antimalarial initiative (technical knowledge) and UNDP (grants review), and more predominantly the governments and NGOs. The Roll Back Malaria Harmonization Working Group is also working with countries to accurately quantify needs, areas already financed and remaining gaps. 7 Conventional HIV diagnostics have been in place for a long time, and spend in this area is very small. Suppliers are well established and there are no issues buying due to the low volumes procured. 24
25 Currently the tender for ARVs includes 2 years of historical data per purchased product as well as the total number of packs expected for current bids (combining the different presentations per product). For ACTs, SD also provides 2 years of historical data within the tender. UNICEF has recently begun sharing demand projections for ARVs and ACTs to LTA holders on a quarterly basis for the upcoming 2-3 quarters. NUTRITION FORECAST For Nutrition products collecting demand input from COs for CMAM and MNPs products is done through a webbased system with a simple, user friendly interface, developed by PD called NutriDash. The Vitamin A forecast is currently Excel-based, as other forecasts were initially, but will be integrated into NutriDash with 2016 forecast. Vitamin A falls within this group of products, however the objective of the Vitamin A forecast is slightly different as it aims to determine the needs primarily from countries eligible for the Canadian government donation (through The Micronutrient Initiative). Approval is then provided for forecasted quantities. Due to the fact that the timing of NutriDash-driven process does not align with tender periods, a second forecast process is in place based on historical off-take, and is used to inform tenders. For anthropometric equipment and pharmaceuticals, the CMAM forecast serves as a source of information on demand evolution, however these products are also used by other programmes, therefore the data collected is only used for informational purposes. For RUTF, the bid forecast is instrumental to support strategic decisions on the RUTF supplier base, and plan for bidding exercises. For Therapeutic Milk and Micronutrient Power, the bid forecast supports the current strategy to expand the supplier base for these products. Lastly, the PS forecast is made through an analysis of historical procurement values (not using information from the country PS forecast, nor the PSC s Country and Global Partner Forecast Sheet), combined with follow-up with the World Bank as the largest portion of nutrition PS transactions are generated by the World Bank project. INVENTORY PLANNING FOR COPENHAGEN WAREHOUSE SD currently holds stock in four locations. The vast majority is held in Copenhagen, but it also holds stock in Dubai, Shanghai and Panama. The analysis focuses on the Copenhagen warehouse as there is little to no inventory planning performed at other warehouses. In Copenhagen, SD held an average stock value of 50.1 million USD between 2012 and On average, between 2012 and 2014, Copenhagen throughput represented roughly 8% of total SD annual spend. According to the WH, theoretical safety stock and ESL stock levels amount to 20 million USD (with 5-6 million USD based on the Emergency Supply List (ESL)), although at any given time the total value of available safety stock and ESL stock is much lower. The remaining million USD of inventory is allocated to confirmed SOs but remains in the warehouse due to the policy of consolidation. Items stocked in the warehouse are mainly related to Water Sanitation (kits) 8, Education (kits) 9 and Essential Medicines 10 and are meant to serve both emergency and non-emergency demand. Between 2012 and 2014 around 1,550 different items were stocked or handled in one of the SD warehouses and approximately 130 of these were emergency items. The warehouse team coordinates and conducts the analysis for safety stock levels which are agreed between the HTC, WSEC and MNC. The calculation of safety stock is based on historical demand (average and standard deviation) and lead time (average and standard deviation). Additionally, ECU designates a fixed emergency stock level for items on the ESL based on an estimated target population of 250,000. This stock is theoretically separate from the safety stock, although the system does not differentiate between the two stocks. Currently there is no forecast involved with designating these stock levels. The 8 Water Sanitation consists mainly of emergency items. There is no demand planning process in place within the PC. 9 Three kits make up the majority of Education volume: School in a Box, Early Childhood Development (ECD) and Recreation Kit. There is no demand planning process in place within the PC. 10 The vast majority of Essential Medicines flow through the warehouse and many of them are components of Health Kits and/or on the ESL 25
26 recent Evaluation of SD Emergency Response found that the ESL is currently updated on an ad hoc basis without any formal process for determining what should be added or removed, and how stock levels should be adjusted. REPLENISHMENT PLANNING FOR COPENHAGEN WAREHOUSE The Demand and Supply Planning Unit at WH develops a forecast for a selection of products monthly in order to feed into replenishment planning. Approximately 85 SKUs are forecasted. These forecasted products amount to roughly 3.4% of total SD value (average ) and 44% of warehouse shipped value (average ). The choice of what to forecast and why is not clearly documented. According to interviews, the choice of forecasted products is based on previous experience of demand patterns, especially with products that were difficult to source (in the past), as well as inputs for country specific kits. In 2014, WH began piloting Smoothie as a statistical forecasting tool, although it is not currently linked to the database (SAP). In the absence of CO intelligence, WH reviews historical actuals in order to better anticipate demand and understand larger trends. The forecast for select items is fed into the MRP, where purchase requisitions are generated based on the MRP-logic in SAP, otherwise referred to within UNICEF as VISION. In order to comprehend the role this forecast plays in replenishment planning, it is useful to understand the logic of how replenishments are triggered. A replenishment order is triggered if demand (confirmed Sales Orders) results in the stock level falling below the designated safety stock level. The rationale for the current policy hinges primarily on the perceived financial ceiling of million USD in inventory, as designating a re-order point increases stock levels, and exceeds this amount. The role of the forecast within this process is to anticipate demand and trigger a replenishment order sooner. To measure the appropriateness of stock levels, WH measures service level, which is defined as the percentage of time that there is more inventory than demand. The forecast, in this case, is a means to increase the percentage of time that inventory levels exceed orders, given the replenishment policy as explained above. There are weekly meetings with PCs (with the exception of ECU) led by WH to gather intelligence on large projects planned by PCs, as well as to address Minimum Order Quantities and upcoming order expeditions. Emergency Stock List (ESL) stocks are monitored weekly by two people from the ECU. In the past, WH initiated a once a month planning meeting to review inventory, but without data to support these meetings they experienced limited success. System limitations play a substantial role in replenishment and inventory planning for the warehouse. There are three primary areas. First, SOs are not consuming the forecast in the SAP system, which produces a skewed and inaccurate picture of actual demand versus forecast. For example, if demand exceeds the forecast made in January it would consume the forecast in subsequent months, meaning that even with a perfect forecast the suggested replenishment orders from the MRP may be skewed. Secondly, the allocation of stock to SOs is not working as expected, meaning that stock can be stolen from orders resulting in a situation where delivery dates cannot be met. Kit demand (in the form of SOs) triggers (dependent) demand for components that go into a large pool of stock, but go unallocated elsewhere. They will remain in that pool for 2 months on average (kits waiting for final item to be completed). This presents a distorted picture of available stock. Furthermore, there is low visibility on missing components for assembling kits, which makes strategic expedition of missing components difficult or impossible. 1.2 To what extent is there clarity in the purpose, process, roles and responsibilities of demand planning within UNICEF? Based on the outcomes of the interviews with stakeholders in SD, there is a good understanding within SD of the demand planning process in terms of roles and responsibilities, timing and milestones, as well as the value and benefits of a good forecast. Interviewees within the different PCs were aware of the characteristics of the demand planning processes (e.g. aggregation level, horizon, time buckets, and performance measures). There was also an understanding of the purpose of the forecast as a major input to the Procurement Strategy and tender process, including the link between the forecast and SD s strategy to overcome market limitations for a particular product category. However, this link was typically limited to the individual s focus area. For example, the PSC was aware of 26
27 the high-level process used to generate the PS forecast, but unaware of the process that individual BUs followed to generate the PS forecast, as this is outside of the PSC s responsibility. Some interviewees in SD lacked an understanding of the demand and inventory planning process for WH. Although some documentation exists, it does not currently reflect reality causing some confusion about the roles and responsibilities of WH versus HTC, WSEC and MNC regarding replenishment planning and decisions for stock levels. Also, management of the ESL and safety stock was not clear, particularly with regard to determining the appropriate stock level of the IAEH Kit, which contains items from multiple PCs. Lastly, there was not clarity on the role of WH in the tender process. The role and responsibility of the MFSDU in the PS forecast process is still being defined. Based on interviews with PD representatives in Immunization, Health, Nutrition, Water Sanitation and Education; it can be concluded that PD also has a good understanding of the purpose and the process of demand planning. In terms of phase-in or phase-out of new products, there is room to reemphasis the role and responsibility of the PD versus SD especially for kits and kit contents held in stock. As indicated in process documentation, the role of ROs is limited, which was confirmed by the interviews with representatives of the COs and ROs themselves. Across COs, the understanding of demand planning processes varied, with some COs stressing the need for more education, while others conveyed that all stakeholders involved with the process understood and saw the benefits. Among the existing forecast processes, COs primarily expressed the need for more support for the Annual CO Forecast exercise particularly for vaccines. As one interviewee put it, There is need for more education about the importance of vaccine forecast to SD the fact that vaccines are not sitting on the shelf of a supplier. What makes the vaccine supply chain unique is not well understood and they are seen as any other commodity. There is often a misunderstanding within government counterparts but also more broadly. There were some questions raised in interviews about whether COs are playing the right role as facilitator of the forecast process with national counterparts. Further, the extent to which both the COs and SD should play a more critical role in the forecasting processes. Some suppliers felt that there was not enough challenging of the country forecast, which resulted in a less reliable short- to medium-term forecast. The opinion expressed by some Partners and PD was that oversupplying the market was an issue, and the question was raised about the role and responsibility of UNICEF in this regard, and whether SD s measurement of success should be further down the supply chain. These conversations also mentioned that there is very little, if any, incentive for COs (or to some extent country governments) to forecast well. Given this reality, there is an open question about how to incentivize COs, as well as country governments to have greater ownership of the forecast and quality of the forecast. Objectives, roles and responsibilities, and high-level timelines and milestones are documented for the demand planning processes for vaccines, immunization devices, cold chain equipment and LLINs, although this documentation is missing for Essential Medicines, HIV/Aids & Malaria, and Nutrition (MNC) and Medical devices and laboratory (HTC). Though there is high-level documentation on the development of the PS forecast, there is no documentation within PSC or for individual PCs on how to build up the forecast for Procurement Services. Annex 10 provides a table with the information gleaned through this assessment and could be used as a starting point by SD. Within all the documented demand planning processes, there is limited documentation concerning performance monitoring. A summary of available demand planning documentation is provided in Annex 3. SUMMARY: In general, there is clarity on the purpose, process, roles and responsibilities at SD level, although certain clarifications in terms of inventory and replenishment planning processes are necessary. Additional documentation on the development of the PS forecast and forecasting done outside the Annual CO Forecast may be necessary. At the CO level, some COs stressed the need for education about the importance of the forecast to Supply Division, while others conveyed that all stakeholders understood and saw the benefit in the process. PD understood the purpose and the process of demand planning, but raised a question regarding SD s measurement of success and whether it should be further down the supply chain. As well as the role that SD and COs should play to challenge the forecast to prevent oversupplying the market, especially for vaccines. 27
28 1.3 Does SD provide the right amount of [demand planning] support to COs? COs had varying opinions about whether SD provided the right amount of support. Slightly over half of the COs held the opinion that some form of additional support in terms of demand planning from the SD would be beneficial, as indicated by the quotes below: More support could be provided by the SD to increase the capacity of our government counterparts. There is no formal forecasting process led by SD for HIV/AIDS, however we would like to have guidance. Would be good if people from SD come down and visit from time-to-time to check on how we are conducting our forecasting and offer support. SD should provide more support in building skills and capabilities for forecasting. SD should better demonstrate the purpose of the forecasting exercise as there is limited understanding at CO/MoH why the process is set-up. Neither the purpose of the process, nor the reason why the input is required is explained. SD provides presentations at regional /global meetings, but should focus more on CO. More training from SD could be helpful; awareness of the importance of the forecast could start with Reps. Have to make sure CO has the capacity to estimate need / requirement, so they can in turn strengthen the national systems to develop an accurate forecast of the need. This was also supported by feedback from the results of the online survey of the 2015 forecast exercise that is conducted by SD, as indicated by the quotes below: The forecast exercise is a very useful tool. However, the counterpart needs to improve their knowledge and training for them is necessary. We would benefit from technical support on interpreting some areas on the forecasting tool and involvement of the supply personnel during the training, as well as other Ministry staff such as the EPI officers and stores personnel in order to build capacity to more people. Actually our partners from Government have better capacity than we do in this exercise. Nobody from the health section was trained or prepared for the exercise. All knowledge is coming from instruction and communication with partners. Most COs said that they did not receive any demand planning support from the RO (but that it was not necessary or expected), but some COs claimed to receive technical guidance from the RO when needed. PD also indicated that SD could be more involved in supporting COs to determine their needs for contingency stocks on the ground and develop supply scenarios hand-in-hand with programme. COs indicated that more support would be useful to increase the local supply base. This was also supported by the Emergency CO in-scope, who said, A lot of issues would be mitigated by an increased supplier base, more LTAs at regional level, and geographically if Dubai could play a bigger role in reducing freight times to locations such as East Africa. Annex 4 summarizes the view of the COs in terms of SD support. Within the CO Summaries in Annex 8 additional areas for improvement from the CO perspective are also shared. SUMMARY: Between CO interviews and VC s own survey, quite a few COs expressed that additional support from SD would be beneficial. The support requested ranged from general capacity building and education (in demand planning) within the CO and in country counterparts, to specific guidance on the Annual CO Forecast exercise itself, or support for demand planning products that are not formally forecasted by SD. To mitigate the reliance on the forecast and increase response times, COs also requested that SD increase the number of LTAs at a regional or local level, and assist COs to build up the local supplier base. PD also indicated that SD could play larger role to developing supply scenarios, including decisions on which stock to hold where. 1.4 To what extent is product forecasting informing ITU planning and activities? There are two areas where product forecasting could be used to inform transportation planning and activities. The first is tendering and setting up contracts with freight forwarders. The second area where it may be useful is for optimizing the transportation itself, both shipments direct from suppliers and from the warehouse. 28
29 For the first area, ITU typically does not use the BU forecasts to inform transport needs, but uses instead ITU s own historical data. It was not clear to ITU whether a better forecast of transport volumes would be beneficial to the freight forwarders. ITU gets involved for larger or complex projects for products such as syringes and cold chain that need to be aligned with vaccines, and can be prepositioned. ITU may also get a heads up from a BU of an upcoming large project and meet with the PC to discuss, and then with the 3 rd Party Logistics provider (3PL). The forecast allows ITU to address potential limitations in documentation, consolidation and receipt of the upcoming shipment. Although generally, since the CO determines the freight forwarders, and mode of transport, ITU is not given the responsibility to determine the most cost-effective means to meet a Requested Delivery Date. To optimize regular transportation in VC, there are shipping colleagues who translate the forecast into a shipment plan. However as most is airlifted, and given the lower volumes, the perception is that information on upcoming shipments is less critical, and thus not communicated to 3PLs in advance. Meaning that the carrier is not aware of an upcoming shipment until they receive a PO. It is often very beneficial for freight forwarders and 3PLs to know in advance upcoming shipments, so that capacity can be secured at the most competitive rates. Through interviews, suppliers shared that the time lag between when goods are ready and when they are picked up by the 3PL can be long. Goods that are not shipped in a timely fashion may be expedited by air to meet the requested delivery date. Suppliers also mentioned that there was no forum to discuss these issues, and recommended that industry consultations may also be an opportunity to discuss with 3PLs opportunities for improvement. SUMMARY: Feedback from ITU, BUs and suppliers suggests that the extent to which product forecasting is informing ITU planning and activities is limited. Typically, it only takes place when there is a major project. Allowing 3PLs to have more visibility on upcoming POs will likely reduce the lead time and decrease costly shipment expeditions. 29
30 2. WHAT ARE THE QUALITY AND EFFECTIVENESS OF CURRENT DEMAND PLANNING PROCESSES? This section elaborates on the quality of different forecasts. The forecast quality is described by the forecast accuracy and bias. Subsequent questions will address the different demand drivers, the suitability and adaptability (to changes in partnership demands and processes) of demand planning processes, as well as the appropriateness of the level of risk SD takes (in its stock strategy). 2.1 WHAT IS THE ACCURACY AND BIAS OF THE FORECAST? The demand planning performance was measured for the products and categories that are currently forecasted by SD. Further explanation on determining which products to forecast and using what method is included in the Forecasting Framework. As indicated before, in order to have an understanding of the quality of the forecasts two primary measures will be applied: forecast accuracy (the inverse of forecast error) and forecast bias. A full description of these metrics is also available in the Forecasting Framework. There are various types of forecast error metrics, each with their own advantages or disadvantages, as well as different levels of complexity. For our analysis we chose the inverse of the mean absolute percentage error (MAPE), the forecast accuracy. This metric is a commonly used metric across industries. The accuracy of the forecast is measured by taking the absolute difference between actual demand and forecasted demand in a period (month or year) for a product and divided by the actual demand in the same period 11. This number is multiplied by 100% to obtain the forecast error in a percentage. The forecast accuracy is the inverse of the forecast error and is derived by taking 100% minus the forecast error. The bias is a measure that indicates whether demand was over or under forecasted and is measured by taking the forecasted demand then subtracting actual demand, before dividing by actual demand and multiplying by 100%. The measurements as described above are consistently applied across the following sections. Currently each of the demand planning processes uses a slightly different method of measuring Example: Forecast for January = 40 Demand in January = 60 A-F /A with maximum value of 1 * 100% to obtain forecast error (( )/60)) * 100% = 33% forecast error 1-forecast error = forecast accuracy 1 33% = 67% accuracy If the actual demand is zero and forecast equals zero, then the accuracy is 100% If the actual demand is zero and the forecast non-zero, then the accuracy is 0% the performance of their forecasts as shown in the figure below. This variation makes it difficult to understand and compare performance across PCs. Therefore, the results may differ from previously reported figures by SD. 11 This quotient will have maximum value of 1. 30
31 Figure 6 Current Measurement of Demand Planning Performance PC Dimension, aggregation level Measurement of Demand Planning Performance PS Commodity Group PSC measures the forecast attainment by Actual divided by the Forecast. VC & HTC (Devices) HTC MNC WH PS FORECAST Product Group by year (e.g. Pentavalent) Top-10/20 products (total) by year Top-10 countries by year Routine / Supplementary by year Total by year Product by year Country by year Product by country for specific period PO/procured quantity for the year is compared with the original forecasted demand and shows it as a percentage. Effectively (A- F)/F. Where this figure is negative, it shows the Year End actual demand has been less than the original forecast figure. If it is positive, it shows the actual demand has been higher than the original forecast. (UNICEF Vaccine Centre, 2014) For LLINs there is no specific report available on demand planning performance. LLIN Allocation Table includes a report in which the Placed Orders and Forecasted Orders are compared to LTA quantity per supplier. This is similar for CCE. For RUTF, F-75, F-100, and ReSoMal performance is measured by dividing the Actual by the Forecast. Though it is referred to as accuracy, the measure indicates forecast attainment. WH is tracking demand planning performance. The performance reporting gives the planned and ordered quantities per country per material. Gavi procurement represented approximately 61% of total procured value in 2013 and 2014, while non-gavi procurement amounted to approximately 37% in 2013 and Contracting, services and other represents 2%. Figure 7 Per cent of Total PS Procurement Value % GAVI non-gavi 61% The Gavi handling fee is a fixed-fee agreed as part of the negotiation process with Gavi. It is based, among other inputs, on seven pre-agreed workload drivers. Gavi s Adjusted Demand Forecast is the framework that provides the data inputs for the seven drivers that feed the model, but given the limited role of this forecast the performance will not be measured. The PS Forecast performance was measured for 2013 and For 2013, the annual forecast made at the end of 2012 (V1) and mid-year update (V1.5) were compared with PSC measured 2013 procurement value (not actual shipped value from VISION). The same analysis was done for 2014, taking the annual forecast made at the end of 2013 (V2), and the mid-year update (V2.5) compared with 2014 procured value as reported by the PSC. The aggregate forecast accuracy figures below represent the total procured value compared to the total forecasted value. Although different commodity groups have different handling fees, it is still reasonable to assume that under forecasting in one category will compensate for over forecasting in another. Forecast accuracy ranges from 81% to 87%. We also find that there is a slight tendency to over forecast. 31

32 Figure 8 PS Forecast Accuracy (left) and Bias (right) In 2013 and 2014 the three highest value commodity groups were PS OPV, anti-retrovirals, and PS New Vaccines 12. Figure 9 PS Forecast Accuracy Top 4 value commodity groups Figure 10 Forecast Bias - Top 4 value commodity groups PS New Vaccines had, by far, the lowest forecast accuracy, which can be explained primarily by programmatic and planning issues. For Rota and PCV, there were issues with country readiness due to vaccine implementation requiring significant training certification for roll-out delaying the introduction dates (resulting in a forecast being higher than demand). For HPV rollout, there were a number of programmatic and planning issues. Specifically, it was mentioned that HPV is administrated in schools and that the forecast did not take into account out-of-school girls, meaning that cohort numbers were misleading. Furthermore, programme underestimated the requirement to sensitize countries to the new vaccine (nationally and sub-nationally), which resulted in a prolonged rollout period and a forecast that exceeded demand. 12 Within non-gavi PS all commodity groups do not have the same handling fee %, so it is also illustrative to look at forecast accuracy per commodity group as the effect on actual handling fee receipts will vary. 32
33 In 2014, it was noted that there was a new team working on New Vaccines and a different forecast methodology was used. It was assumed that co-financing obligations would be met, however, many did not come through. In 2015, they revised the approach and took a more conservative approach that looks at country trends (i.e. if country X had not met their co-financing obligation in 2013, 2014 on time SD decreased the quantity for 2015). In contrast, the success of PS Traditional EPI Vaccines can be explained by the fact that these are vaccines that are a part of a country s routine vaccination schedule, which typically remains constant and is easier to forecast. SD has also been supplying these particular vaccines for a long time and thus can use the experience to better forecast. PS OPV remained relatively constant in 2013 and Based on the analysis of the LTAs for OPV, we can deduce that the forecast inaccuracy and negative forecast bias in 2013 were due to a significant increase in demand mainly related to high intensification of activities in Nigeria and Pakistan. Additional activities in high risk countries in West Africa (as described in the CRC submission) also impacted these results. The forecast was also impacted by one supplier s inability to supply due to limited capacity, which hampered supply to Bangladesh, Ethiopia and Mali. Additionally, both the 2013 and 2014 forecasts were impacted by an intensification of activities to stop transmission of wild poliovirus by the end of 2014, an outbreak in the Horn of Africa since June Continued outbreak response activities and additional demand in high risk countries in West Africa impacted the forecast. The performance of the antiretroviral forecast declined sharply in According to representatives in PSC and MNC, this decline was related to underestimation of the Zambia and Zimbabwe ARV procurement. The assumption for the V1.5 and 2.0 forecast was that the uptake for the new, high value regimen introduced through UNDP would be slower than what took place. UNDP approached SD in late 2013 to supply large volumes for these two countries. At this time, MNC would have had a general PSM Plan from UNDP with general budget information, but no information about timing of procurement. Since then, the input from UNDP has improved. UNDP now provides Global Partner Input, which are procurement plans for 12 months designating which procurement partners will supply the inputs. Of course this forecast will only be as good as the input from UNDP country offices, however it is an improvement. UNICEF now monitors the forecast accuracy for UNDP in the bilateral scorecard. SUMMARY: The total non-gavi forecast accuracy across commodity groups is relatively strong. The four top value commodity groups represent an average 89% of total value during this time period. Three of the top four value commodity groups have performed well, while New Vaccines had low forecast accuracy. It is important to note that improvements made to the individual product forecasts will translate into an improved PS forecast. Lastly, given that the portion of non-gavi PS value is less than half of total procured value, and that no evidence could be provided of when the PS forecast did not meet its objectives, the accuracy of the forecast is sufficient. TENDER FORECAST In order to measure the accuracy of the quantities allocated in Long-term Agreements (LTAs) a number of tenders along with corresponding LTAs were selected for analysis. Nine (9) tenders and the associated 51 LTAs were chosen to provide insight into the quality of the forecast (in terms of accuracy) and the effectiveness of the process 13. The tenders selected were target-bound and (partly) covering the period , although one tender was mislabeled and was in fact time-bound. The below table summarizes the forecast accuracy of the LTAs. A detailed description of the tenders and the amendments made to the LTAs can be found in Annex A more comprehensive analysis would have exceeded the time available due to the fact that the data and information resides in a significant number of separate documents in different formats. 33
34 Figure 11 Overview of selected tenders and main reasons for adjustments in award quantities VC RFP nr Tender Reference # LTAs Opening Date Award Date Commodity LTA Duration(s) Forecast Accuracy (%) Explanation for LTA deviations RFP-DAN RFP-DAN RFP-DAN RFP-DAN April June April April 12 July 2012 Aug 12 May 2012 Oct 2012 BCG-20, DTP-10, DT- 10, Td-10, TT, and HepB Measles Containing Vaccines IPV OPV LTA 3 years LTA 4 years (evaluated until present) LTA 24 months LTA 1-5 years BCG-20: 94%, DT-10: 99%, DTP-10: 46%, HepB-1: 81%, HepB-10: 99%, Td-10: 0% TT-10: 85%, TT-20: 38% Measles: 36% in 2013, 32% in 2014 MR-10: 62% in 2013, 94% in 2014 MMR-1: 48% in 2013, 34% in 2014 MMR-5: 50% in 2013 MMR-10: 70% in 2013, 16% in % 71% consumed on 67% of LTA duration Slower transition from TT to Td had a significant impact on the demand of each of the vaccines in the period For Measles vaccine, the increase in demand was primarily from countries who typically do not procure through UNICEF and due to additional funding approvals from Gavi. The only amendment for IPV was due to the transfer of the WHO pre-qualification of IPV to the supplier s new legal entity. Amendments made in April 2013 mainly due to intensification of activities in Nigeria and Pakistan. Supplier s limited capacity, hampered supply to Bangladesh, Ethiopia, and Mali. Amendments of 416 million doses in July 2013 due to intensification of activities to stop transmission of wild poliovirus by end of Continued outbreak response activities and additional demand in high risk countries in West Africa also contributed. 34
35 HTC ITB nr Tender Reference # LTAs Opening Date Award Date Commodity LTA Duration(s) Forecast Accuracy (%) Explanation for LTA deviations ITB-DAN ITB-DAN ITB-DAN May Oct Oct 2013 Sep 12 Dec 13 Dec 13 Test strips, urinan.,gluc/prot AD Syringes Disposable, RUP Syringes & Needles LTA months LTA 24 months (evaluated until present) LTA 24 months (evaluated until present) 26% 86% consumed on 71% of LTA duration Not calculated This LTA is labeled as target value but is in fact time-bound. WH forecast included in tenders usually assumes a 10% increase of historical procurement. Likely procurement in the previous year(s) was low, resulting in a correspondingly low forecast. Increases in the forecast levels of campaigns and un-forecasted demand from large countries were the key contributors. The increase in LTA quantities were due to the demand (not forecasted) for health kits, unforecasted campaigns, and emergency response, particular for the Syria and Ebola responses. MNC RFP nr Tender Reference # LTAs Opening Date Award Date Commodity LTA Duration(s) Forecast Accuracy (%) Explanation for LTA deviations 8 RFP-DAN Oct 2012 Dec 12 RUTF LTA 12 months 63% Challenges with local suppliers meeting product specifications. Additional increases in LTA quantities due to unanticipated orders funded by DFID. 9 RFP-DAN Nov 13 Dec 13 RUTF LTA 12 months 82% No explanation available for deviation from LTA quantities. SUMMARY: The accuracy of the tender forecasts selected for this assessment ranged considerably across products. For routine vaccines, the tender forecast accuracy was quite high, with minimal adjustments to LTA quantities. While for new vaccines and vaccines undergoing a product shift or used in campaign (supplementary) related activities, the tender forecast was considerably lower and the LTA quantities were more frequently modified. As devices are closely linked to vaccines, the lower accuracy is partially explained by the low vaccine forecast accuracy, as well as unexpected WH demand. The RUTF tender forecast which is based on historical off-take has good quality with an accuracy ranging from 85% to 97%. The forecast accuracy for LTAs, given the expanded supplier base, is more challenging and generally less accurate. ANNUAL CO FORECAST: VACCINES The forecasted demand used in the measurement of both monthly and annual forecast accuracy was the forecast from the CO shipment plans for Y1 in monthly buckets. Subsequent years were not measured for their accuracy. The forecast was then compared to the actual shipped quantity within VISION using the time-stamp of actual shipment end date. Our data set included Sales Order data for the period in-scope, 2012 through However, as we use the actual shipment date and shipped quantity in our calculations, measurements of 2012 forecast accuracy and bias would be skewed by Sales Orders placed in 2011 but for delivery in 2012 their corresponding shipment lines would not have been included. Therefore, forecast accuracy and bias for vaccines are measured for 2013 and
36 It should be noted that by using the shipped quantity and the actual shipment end date, the measurement of forecast accuracy might include factors that are not within the control of COs and/or national governments. For example, the CO may have submitted an order for delivery in a month that is exactly in line with their forecast, but only part of this order may be delivered due to supplier capacity issues or may be delivered later than specified. In addition, the analysis does not capture substitutions made by SD. For example, if a forecast was made for MR-5 but the equivalent amount of MR-10 was shipped, one could claim that the forecast was accurate and demand was met. As previously explained the Annual CO Forecast Exercise contains a forecast for routine and supplementary activities. As the table below shows, certain vaccines are used predominately for routine or supplementary activities while others can be used in both. The overall annual vaccine forecast accuracy for both routine and supplementary in 2013 was 87 per cent, and in 2014 was 90 per cent. The forecast accuracy for vaccines used to cover routine demand only, was high at 86 per cent in 2013 and 87 per cent in Demand for supplementary use had a lower forecast accuracy at 78 per cent for 2013 and 82 per cent for Demand for supplementary activities can be more difficult for countries to forecast, especially when phasing in or out a new product. This will be further discussed under the drivers of demand variability. Figure 12 Demand profiles per vaccine Vaccine SD Categorization Type of Demand Demand Profile BCG Routine All Routine No change bopv Polio All Supplementary Product Switch DT-10 Routine All Routine No change DTP Routine All Routine No change HepB Routine All Routine No change HPV New Vaccines All Routine New Product IPV Polio Mixed Routine & Supplementary Product Switch Japanese Encephalitis New Vaccines Mixed Routine & Supplementary New Product Measles Campaign Mixed Routine & Supplementary Gradual Product Switch Meningococcal A Campaign All Supplementary No change MMR Campaign Mostly Routine Gradual Product Switch MR Campaign Mostly Supplementary Gradual Product Switch Pentavalent New Vaccines All Routine No change Pneumococcal New Vaccines All Routine No change Rotavirus New Vaccines All Routine No change TD Campaign Mixed Routine & Supplementary Product Switch topv Polio Mostly Supplementary Product Switch TT Campaign Mostly Routine Product Switch Yellow Fever Campaign Mixed Routine & Supplementary No change The below figure shows the average forecast accuracy for vaccines in 2013 and 2014, the percentage of demand that is classified as routine and whether the product is new or undergoing a switch, as a main driver of variability is the phase-in and/or phase-out of products. The analysis showed that stable products with a high percent of routine demand over the two-year period are not necessarily better forecasted than new vaccines or vaccines undergoing a switch. This is due to a number of countries that submitted a forecast for a significant amount of vaccines (e.g. Pentavalent), but did not order (e.g. Bangladesh, India, Mongolia, Kenya, Morocco, Nepal, Philippines, and Rwanda). 36

37 Figure 13 Average forecast accuracy for vaccines in 2013 and 2014 On a monthly level, the performance of the routine vaccine forecast was much lower, 37% in 2013 and 41% in Supplementary monthly forecast accuracy was very similar at 37% in 2013 and 43% in Countries, it seems, have much more difficulty in predicting the exact timing of demand throughout the following year. The figure below provides Deloitte benchmark figures, which represent accuracy on monthly product level, across a number of sectors. Figure 14 Benchmark Monthly Forecast Accuracy Figures Sector Company nr Forecast Accuracy Consumer Products Company 1 86% Consumer Products Company 2 84% Consumer Products Company 3 72% Beverage Company 4 75% Beverage Company 5 60% Household and Personal Care Company 6 72% Pharmaceutical Company 7 65% Pharmaceutical Company 8 70% Compared to the benchmark figures, the monthly forecast accuracy from the Annual CO Forecast is low. However, though the forecast is not formally updated, updates are made throughout the year within the Allocation Table and a rolling forecast is shared in the form of a Supplier Report incorporating the latest intelligence on a monthly basis. The assessment did not measure the accuracy of these monthly reports. However, feedback from suppliers indicated that the monthly Supplier Reports are an important source of information allowing the supplier to plan production, distribution, and assess regulatory implications. As one supplier indicated, the monthly Supplier Reports are invaluable in keeping an ongoing dialogue to match availability with requirements. A detailed breakdown of the vaccine demand planning performance for in-scope countries, as well as root-causes of deviations between forecast and actual shipped quantity (where available) are provided in Annex 5. A comprehensive summary and explanation of the root-causes of forecast inaccuracy gathered through interviews with SD and COs are included under 2.2. SUMMARY: Forecast accuracy varies significantly among the vaccines, and can be traced to different causes. Understanding the key drivers of variability for each vaccine is key to improving overall performance. The majority of suppliers rely on UNICEF s projections, both in the short- to medium-term and long-term to increase the efficiency of production planning and achieve other efficiencies. However, for vaccines that are undergoing a switch or used in non-routine programmes the lower annual forecast accuracy has had an adverse effect on production efficiency. 37


38 ANNUAL CO FORECAST: IMMUNIZATION DEVICES The forecasted demand used in the measurement of both monthly and annual forecast accuracy was the forecast from the CO shipment plans for Y1 in monthly buckets. Subsequent years were not measured for their accuracy. The forecast was then compared to the actual shipped quantity within VISION using the time-stamp of actual shipment end date. As previously explained for Vaccines, due to the time stamp used to define our data set, the analysis focuses on 2013 and The procurement value of immunization devices in is mainly driven by 6 products, that were all used to meet both routine and supplementary demand in with the exception of the RUP Syringe.2ml. Overall accuracy for top products is shown in the figure below, and in-scope country performance is included in Annex 5. On an aggregate level, the analysis shows an improvement in the routine forecast from 2013 to 2014, however for supplementary demand the forecast accuracy decreased from 98% in 2013 to 0% in For both years we see a tendency for the forecast to exceed demand, as there is a forecast bias of 30% in 2013, and 70% in Figure 15 Forecasting Performance for top immunization devices Figure 16 Forecasting Performance for top immunization devices (split routine vs. supplementary) The forecast for immunization devices aligns closely with the forecast for vaccines, though not all countries that procure vaccines via UNICEF procure the accompanying devices. All Gavi supported vaccines, however, do include the relevant quantity of AD syringes which includes 25% buffer stock. As the AD 0.5 ml syringe can be used universally with all injectable vaccines, there is a degree of flexibility. Given that vaccines and devices are so closely related, the forecast must also take into account that devices are shipped by sea, while vaccines are sent by air. A main cause of forecast inaccuracy is the delay in the release of donor funds, specifically Gavi. Countries request injection devices early in the year to ensure availability and enable timely in country distribution. Country demand schedules for injection devices are brought forward in the year to compensate for long shipment lead times and manufacturers produce based on these indicated forecasts. However, in reality demand occurs later in the year due to a delay in funds release. The impact of this variable has been investigated in depth by the HTC themselves, and further explored as a main driver of demand variability under question

39 Similar to vaccines, updates in the forecast are made throughout the year within the Allocation Table and on a monthly basis a rolling forecast is shared in the form of a Supplier Report. The assessment did not measure the accuracy of these monthly reports, however feedback from suppliers indicated that production and stock management are dependent on the UNICEF forecast, which is in general quite reliable and consistently reach 70-80% of LTA quantities. SUMMARY: The annual forecast, and regular updates to suppliers, allow UNICEF to meet their objectives. Though the delay in issuance or receipt of funding has an adverse effect on demand planning. The relationship between devices and vaccines means that improvements to the vaccine forecast will also have a positive effect on the device forecast. ANNUAL CO FORECAST: COLD CHAIN EQUIPMENT Although all product categories require effort to map between Annual CO Forecast and VISION (ERP) data, the mapping for Cold Chain Equipment (CCE) proved to be the most challenging. Most products in the Annual CO Forecast file do not match with the description in VISION and mapping products on a group level was not possible as there was no standard classification of the products. After consultation with HTC the decision was made to leverage previous work done through a consultancy by Hany Abdallah, who in May 2015 completed a project that aimed to improve the forecasting of CCE demand and provide visibility into future CCE markets. The first step in her process was an extensive manual exercise to map the CCE (from approximately 200 product items to 13) resulting in a standardized UNICEF data Master File. The exercise Hany Abdallah conducted mapped the different product descriptions to the product segment, using manual lookups in the Product Information Sheets /Performance Quality Safety catalogue to discover more about the product itself. Drawing on her analysis we have made computations of forecast accuracy using the same standard definition as applied to other products. The results of this analysis are presented below. Figure 17 CCE Forecast Accuracy
40 Figure 18 CCE Forecast Bias In general, the forecast accuracy for CCE is quite low. The three-year average for BPS systems, cold box and vaccine carriers and icepacks, compression refrigerators and freezers and SDD systems had a forecast accuracy between 47% and 55%. Absorption refrigerators and freezers have an average of 34% accuracy, which declined from year-to-year. Spares and accessories, as well as temperature monitoring devices were lowest with a 1% and 18% accuracy respectively. Given the long timeframe between the initial forecast and the time that demand is met, it was suggested to measure forecast accuracy over a two to three-year horizon. Nevertheless, when forecasts and actuals were summed up for the time period forecast accuracy remained low as shown in the table below. Figure 19 Cold Chain Forecast Accuracy over entire period Product Segment Forecast Accuracy Forecast Bias Absorption refrigerators and freezers 32% 68% BPS systems 0% 134% Cold box and vaccine carriers and icepacks 55% -45% Compression refrigerators and freezers 38% -62% SDD systems 59% 41% Spares and accessories 0% -100% Temperature monitoring devices 15% -85% Demand for cold chain equipment is partly driven by new vaccine introductions, although as non-consumable, durable goods, they have a different demand pattern than consumables. The main demand drivers identified by HTC are the replacement of existing cold chain equipment, future capacity expansion needs, the pricing of cold chain equipment, the probability of funding, and in the longer-term the supply chain design in country. In their March 2015 Markets Dashboard SD has identified four particular markets of focus, which highlight the need to improve funding visibility and the forecast in order to secure a healthy market. Figure 20 Current strategy / Intervention per Product Segment Product Segment SDD Solar Direct Drive Refrigeration Systems Solar Refrigerator Systems (with batterypower storage) Compression refrigerators and freezers Walk-in Cold and Freezer Rooms Current Strategy / Intervention Establish multiple LTAs for shorter lead-times, improve pricing. Currently collecting performance data, working towards global implementation. Increase competition per product sub-category Ensure sustainable supply while supporting a phase out of battery based technologies and move towards battery free systems, improved funding visibility Ensure sustainable supply and support for areas with a reliable grid; work with partners to develop better funding / planning forecasts Working towards increasing the supplier base and minimum three LTA holders. Partner collaboration to improve funding visibility To quantify demand, the approach recommended by Hany is one that mines the evaluation of approaches/ data/ assumptions used by UNICEF and other partners, blending & modelling heuristics with best available data. This 40
41 seems especially apt considering the recent new funding available through the Equipment Optimization Fund, in addition to Gavi s Health System Strengthening Fund, and surprise funding from KFW to India. With the announcement of new funding, the availability of new innovative technologies, and specifically funding earmarked for these new cold chain technologies, UNICEF and other partners are preparing themselves for market disruption. It is essential that demand planning within this new environment involves very close collaboration with Gavi, as addressed in 1.4. It also requires a very close connection with how countries plan to react to the possibility to expand and upgrade their cold chain capabilities. In this regard, SD will need very close collaboration with the Country Readiness working group. Additionally, SD will need to have a thorough understanding of the products themselves and the interchangeability of products will need to be thoroughly understood throughout the transition period in order to meet demand. SUMMARY: Forecast accuracy of cold chain equipment through the Annual CO Forecast is low. Moreover, given the recent developments within the cold chain space, an alternative approach to cold chain equipment forecasting is required to meet demand planning objectives. LLIN FORECAST As mentioned before, countries plan their demand on different levels of details. Where some countries are very specific in their forecast, others might give a more general forecast. The SD will then have to determine which exact specifications should be sent. In the ERP material master the product names are generalized, for example the product LLIN,100d,w/b/g,190x180x150cm LxWxH is a generalized material name for multiple colors, where the shipped color is determined by UNICEF SD (considering country preference). Given this reality, the appropriate forecast accuracy measure was discussed with the HTC team. It was agreed that matching up exact materials does not add value. In addition, given that countries do indeed have different preferences or requirements for specifications, measuring forecast accuracy on an aggregate level would not reflect a country s tendency to forecast without purchasing. It cannot necessarily be offset by a country that does not forecast who decides to procure (which would show more favorable results). Thus, the analysis takes a country focus and examines the forecast accuracy of countries who do submit a forecast, as well as the number of countries who procure but do not forecast. In 2013, out of the 15 countries that provided a forecast for LLINs, 10 of those countries procured. The average forecast accuracy of those 10 countries was 25%. Figure Forecast Accuracy for countries who forecasted & However, 60% (or ~94.8 million USD) of total shipped value was not forecasted. This was due to 27 countries which did not provide a forecast, yet procured. Significant demand for Cote D Ivoire and Chad, which was not forecasted, had the biggest impact on overall forecast accuracy. According to SD, for Cote D Ivoire, the huge unexpected peak in demand was due to the fact that procurement should have been done through the Global Fund. However, the unit price and lead time of the UNICEF offer was better. For Chad, procurement was also likely meant to go through Global Fund, however as UNICEF was a sub-recipient, it went through UNICEF (previously UNDP performed all of Chad s Global Fund procurement for LLINs through UNICEF). A graph of all countries Forecast vs. Procurement Quantities for 2013 and 2014 is included in Annex 5. 41
42 In 2014, out of the 17 countries that provided a forecast for LLINs, 10 countries procured. The average forecast accuracy of those countries was 30%. 15 countries did not provide a forecast yet procured 32% (or 7.25 million USD) of total shipped value. Cote d Ivoire and Chad both significantly over forecasted. The over forecast was likely due to a lack of funding after the large procurement in Ethiopia under forecasted in 2014 as they expected that the procurement would be done by the Ministry of Health. When it failed, and they realized they would not have nets for the start of the rainy season, the MoH requested UNICEF to procure on their behalf. Through interviews with CO Ethiopia we learned that, while it is not a very difficult forecast generally (as it is based on the country government s annual planning exercise), the uncertainty is in terms of who is going to fund what. SUMMARY: Overall forecast accuracy for LLINs is very low. Given individual country preferences SD does not benefit from offsetting one country s under forecast with another country s over forecast. Even countries that forecast have a very low accuracy. The forecasting process is no longer suitable, especially giving the changing LLIN landscape. NUTRITION FORECAST For a subset of nutrition products, an annual forecast is provided by COs in NutriDash. Given the mismatch in timing, a separate forecast is made based on historical off-take to inform tenders and LTAs. Certain products used for SAM management such as Albendazole or Mebendazole are forecasted through NutriDash and procured for nutrition programmes, but also procured outside of nutrition programmes and in that case not forecasted. As there is no indicator within the VISION data to separate non-nutrition orders, the forecast accuracy for these products could not be accurately measured. The analysis instead focuses on RUTF which is the largest procured nutrition product in terms of value (amounting to 244 million USD between 2012 and 2014) and has been forecasted annually since The analysis below presents SAM CO forecast accuracy and bias on an annual basis for RUTF. Figure 23 RUTF NutriDash Forecast Accuracy & Bias Year Responding countries Forecasted Quantity Ordered Quantity (MT) Forecast Accuracy Forecast Bias ,100, ,049 13% 87% ,845,979 1,499,296 77% 23% ,959,971 1,967, % 0% ,058,122 2,100,420 54% 46% ,268,694 2,432,297 66% 34% ,043,452 2,205,827 93% -7% Figure Forecast Accuracy for countries who forecasted & In 2012, the Nutrition Unit conducted an analysis of forecast performance for RUTF, F-75, F-100 and ReSoMal where they identified countries that provided a forecast without ordering, and those ordering without a forecast. The analysis also identified the countries that over and under forecasted for each product category and possible explanations for demand planning performance. As the timing and availability of funds drives demand, MNC (with PD will strengthen ties with a number of COs (pilot) to understand their reasoning behind provided forecasts. The forecast accuracy for tenders based on historical off-take averages 91%. This is a better accuracy than the CO forecasts that are submitted through NutriDash which average 78% accuracy during the same period ( ). Given the expanded RUTF supplier base, the challenge then becomes allocating demand across suppliers (local and offshore) within LTAs, especially in situations with a negative forecast bias. 42
43 Figure 24 Bid Forecast RUTF Ordered Year Bid Forecast (MT) Quantity (MT) Forecast Accuracy Forecast Bias ,000 27,154 88% -12% ,000 28,986 97% -3% ,000 33,566 95% -5% ,000 30,441 85% 15% In 2014, for the first time, demand was less than bid forecast. The timing of demand was severely impacted by a 6- month delay in funding from ECHO, the largest donor for RUTF. To deal with the peak in demand in the second half of the year when ECHO funding was finally released, LTA award quantities had to be reallocated and adjusted. According to interviews with SD, ECHO is aware of the implication of their delay yet it seems that again in 2015 funding will be delayed. SUMMARY: The tender forecast, based on historical off-take, is of good quality with an accuracy ranging from 85% to 97%. It is effective as it has allowed SD to largely meet their objective to ensure market capacity and increase the supplier base. The forecast accuracy for LTAs generally has a lower accuracy according to the LTA analysis above. REPLENISHMENT PLANNING FOR COPENHAGEN WAREHOUSE Given the very limited role of the forecast combined with system limitations measurements of accuracy will not be a good indicator of performance. During validation sessions with the warehouse team, several examples were given for products with a high negative forecast bias, yet a very high stock coverage. Nevertheless, the forecast accuracy for each individual product by BU is presented in Annex 5. Within WSEC there is one person involved with warehouse replenishment, and within MNC two people. VISION generates replenishments (purchase requisitions) for review by WH team and PCs. Limited real-time insight into actual stock on hand makes it difficult for the person in the PC responsible for replenishments to determine timing and quantity. SUMMARY: The warehouse forecast has a very limited role in current replenishment planning, which means that forecast accuracy cannot be linked directly with service level. 2.2 WHAT ARE THE INTERNAL AND EXTERNAL DRIVERS THAT AFFECT FORECAST ACCURACY? The majority of the drivers that affect forecast accuracy are external to SD and COs. The key external cause of deviations between the forecast and actual demand is the availability (and timing) of funding, from both donors and country governments. According to the VC, their own analysis on country stock outs revealed that approximately 70% were due to a lack of or delay in funding. The decisions made by key donors such as Gavi, BMGF, Global Fund, ECHO, etc. and the mechanism chosen for procurement have an impact across almost all product categories. The following is a list of primary drivers of demand variability gleaned from numerous conversations with SD, COs, and PD, as well as review of CRC submissions and other documentation. 43

44 Timing of funds release Description The timing of fund release by donors or country governments was the number one reason cited for deviations between originally forecasted quantities and timing with actual procurement. This was specifically mentioned regarding funds from GAVI, World Bank, Global Fund, ECHO and country governments. Examples HTC has found that delays in funding release had an impact on both GAVI and non-gavi demand, though the GAVI supported element had a greater impact as funding was anticipated. This resulted in overstocking at manufacturers creating bottlenecks for production, rehandling of goods and large swings in demand. The timing of RUTF demand was severely impacted by a 6-month delay in funding from ECHO, the largest donor for RUTF. For ARVs there are often delays in the funding from Global Fund, as well as gaps in supply generally that UNICEF covers. Funding Availability Description The availability of funding is one of the main drivers of demand variability. This is especially applicable for Cold Chain Equipment, RUTF, new vaccines and supplementary vaccination campaigns. Over 50% of UNICEF's funding now falls into the category of "project based funding" which makes it difficult to plan. Examples DRC mentioned that (GAVI) funding is one of the largest drivers of demand (variability) for Cold Chain Equipment. For RUTF in order to improve the quality of the forecast, MNC together with PD are piloting an effort to strengthen ties with a number of COs by having in-depth review of the drivers and rationale behind the CO forecast, specifically the timing and quantity of funding. Winterization project: 1 million EUR of clothing was ordered in advance from China and arrived on time. This is what sure funding looks like. Misalignment with Gavi processes Description GAVI does not always issue the Decision Letters prior to UNICEF s Annual CO Forecast Exercise, which means that country governments are making a projection of demand with uncertain funding. GAVI also has additional funding windows for new vaccine introductions and one-off campaigns throughout the year which is not in sync with UNICEF s demand planning process. Examples UNICEF will experience a peak in demand when GAVI makes it possible for countries to apply for additional funding for a campaign. If GAVI issues decision letters early enough then the process is secure. The problem is that GAVI often doesn t do that in a timely way. Particularly for campaigns it is not the programme driving the funds release, it is the funds release driving the programme. Delays in new product introduction Description Delays in new production introduction were a frequently cited reason for mismatches in demand and forecasted quantities. The mismatch was typically due to a country s readiness in terms of political and social preparation. Other reasons include excess stock of a product to be phased out, in which case the country chose to delay introduction of a replacement product. Example Pneumococcal introduction was delayed due to insufficient programmatic readiness and political and social preparation. The HPV programme underestimated the requirement to sensitize country to the new vaccine (nationally and subnationally), which meant a prolonged rollout period and a forecast that exceeded demand. 44
45 Unsuccessful country government procurement Description This driver is especially applicable for MICs, which typically procure on their own, and certain countries (i.e. Pakistan), who are obliged to follow their own procurement rules for routine immunization funded by the government (meaning they conduct their own tenders). Typically, in these situations if and when the country is unsuccessful they will reach out to UNICEF for procurement services. In other instances, the government may not have the capacity to properly quantify demand, and UNICEF may not have visibility into actual procured quantities until there is already a shortage. Examples For Measles vaccines, the government initially planned to self-procure but procured via SD. Ethiopia under forecasted in 2014 as they expected procurement via the Ministry of Health. When it failed, and they realized they would not have nets for the start of the rainy season, the MoH requested UNICEF to procure. For devices, the Nigeria government self-procures (with the exception of campaigns and GAVI funded New Vaccines) which does not give UNICEF visibility to monitor quantities are appropriate. Programmatic objectives not met Description Demand variability can be also caused by lower than expected programmatic coverage. This is especially relevant for GAVI funded vaccines. The SD forecast is based on the GAVI Decision Letter (and APRs) that reflect the original programmatic objectives, however when there is lower than expected programmatic coverage it is not necessarily reflected in the Decision Letters. Low coverage results in higher stock levels. For Expanded Programme on Immunization (EPI) vaccines some forecasted quantities are then postponed or carried over to the next year. Examples The SD forecast for Pentavalent in 2015 is based on GAVI DL, but no delivery of 2015 allocation has so far been made, despite the fact that we are six months into the calendar year. Another example of not achieving programmatic objectives is Polio. The forecast was based on an assumption of eradication during a certain time frame. When eradication was not achieved, the forecast was significantly affected. Changes in Programme strategy or underlying assumptions Description In situations where global demand exceeds global supply forecasted demand may only be partially met. In addition, countries that do not normally procure through UNICEF may procure through UNICEF due to challenges of procuring the necessary quantities independently. Examples The forecast for Nigeria exceeded actual shipments due to global shortage of BCG. Insufficient Market Capacity Description Changes in programme strategy or underlying assumptions are a cause of forecast inaccuracy. These parameters could include: target population, coverage rates, wastage rates, etc. Examples Particularly for OPV, the changes in SIA strategy have enormously driven variability in demand. For pneumococcal, the forecast was inaccurate due to the fact that the projection was made based on old census data on target population. HPV forecast did not take into account the number of outof-school girls, which meant that cohort numbers were misleading. 45
46 Outbreaks Description Differences between forecast and actual demand can also be explained by outbreaks (i.e. polio, Yellow Fever, Measles, Cholera). Examples The forecast accuracy for 2013 was low due to a serious measles outbreak which started in 2012 and used routine stock. The LTA quantities for OPV were increased due to an outbreak in the Horn of Africa since June 2013, continued outbreak response activities and additional demand in high risk countries in West Africa. Conflict & Natural Disasters Description In conflict situations programmatic plans may no longer be feasible, resulting in forecasts that are higher than demand. In addition, extreme weather may also drive an increase in demand. Examples Sudan was to implement MNTE campaign (three doses at an interval of one weeks) for Women of Child Bearing Age in all states. The implementation process was hampered by conflict in three states. Therefore, it was impossible to bring in routine TT vaccine as the campaign stock was approaching the shelf life expiry date. The need for RUTF will change based on the seasonal rain performance. The food security of Ethiopia is heavily dependent on rains. A failure or poor performance of rain of one season could bring huge change and vice versa. Other drivers of variability not listed above include; a mismatch in timing between the Annual CO Forecast and the country government s planning cycle, and last minute shifts in procurement through a different agency, as well as the timing of WHO approval and policy recommendations for routine use. Internally, a number of key drivers influence the variability of demand. At the CO level, programmatic decisions both in terms of regular and emergency interventions can drive demand variability, especially without early supply involvement. Efforts have been made to increase the presence of supply in programmatic interventions. Demand variation can also be caused by a shift by COs towards procuring a certain product locally or regionally versus through SD. The inverse may also be true, as COs may face local supplier challenges and be forced to procure through SD, which happened in the past when local RUTF manufacturers were unable to deliver. As SD does not discourage non-standard requests for non-standard products nor modifications to existing products (kits), these non-standard requests can also drive demand variability. 2.3 HAS SD ADEQUATELY ADJUSTED ITS FORECASTING METHODS TO RESPOND TO CHANGES IN PARTNERSHIP DEMANDS AND PROCESSES? As the quality of the forecast is heavily impacted by the availability and timing of funding release (discussed in 2.2), alignment with changes in partnership demands and processes is an important component of SD demand planning. UNICEF s main partner (in terms of procurement value) is undoubtedly Gavi, who comprises approximately 35% of SD procurement value. Gavi is a major player in vaccine demand aggregation, policy and market shaping for the vast majority of vaccines procured through UNICEF. More recently it provides funding for cold chain equipment, particularly in innovative solutions. It is crucial that there is alignment between Gavi and UNICEF to achieve both efficiency and effectiveness. Through interviews it was clear that the landscape, for Gavi and immunization supplies in particular, has changed over the last few years. UNICEF s forecast process has remained largely the same. 46
47 One change is that Gavi does not always issue the Decision Letters prior to UNICEF s Annual CO Forecast Exercise, which means that country governments make a projection of demand without certainty of funding. According to one interviewee, The challenge is that the BU has to wait a long time to receive the decision letters from Gavi, sometimes the decision for the amount of vaccines comes halfway through the year. UNICEF then must use information from the previous year to make an estimation [of demand]. In addition, Gavi has changed their process to allow additional funding windows for new vaccine introductions and one-off campaigns throughout the year, which is not in sync with UNICEF s annual forecasting process. While some individuals stated that UNICEF should be much closer to Gavi during this period, and adjusted its demand planning methods. Others stated that UNICEF has remained in sync with Gavi and could not have prevented the misalignment. Currently, both organizations are committed to addressing areas for better collaboration. The three ongoing improvement initiatives for immunization aim to: 1. Optimize the process for communicating and authorization 2. Improve the Operational Forecast 3. Improve the efficiency of device procurement Over the past years, efforts have been made to align the forecasts made by key actors in the CCE space (i.e. Gavi, PATH, CHAI, BMGF), and reach a common understanding of what is being forecasted, and how that forecast is built up. Very recently, there have been substantial developments in the CCE landscape. Particularly, the announcement of additional funding from Gavi earmarked for innovative cold chain technologies starting in January 2016 lasting 5 years. SD recognizes that it is critical to stay close to Gavi and other partners, and improve collaboration. One of the three working groups established focuses specifically on understanding Gavi processes and the implications of the co-investment funding model. SUMMARY: Alignment with changes in partnership demands and processes is a very important component of SD demand planning. Considering the large percentage of Gavi funded demand, there is a strong interdependency between SD and Gavi. Both organizations should remain aware of the impact of changes in demands and processes on the other. 2.4 TO WHAT EXTENT IS SD FORECASTING THE APPROPRIATE PRODUCTS USING THE APPROPRIATE METHOD? In order to assess the effectiveness and quality of the current demand planning processes, it is important to address the question of which products should be forecasted. If so, by means of statistical forecasting based on historical data or through in-depth consideration and incorporation of latest programme and category intelligence into the forecast? One of the most useful starting points to address this question is to analyze the demand variability, as reflected in the Coefficient of Variation (CoV) 14, and the procurement spend in an ABC-XYZ analysis. An in-depth explanation is included in the Forecasting Framework. The figure below shows the CoV and Sales Order (SO) value of all products procured by SD in the time period Green circles depict that the product is currently forecasted either through a formal forecasting process or by the warehouse while the blue circles indicate that the product is not a part of a formal forecast process. The size of the bubble depicts the shipped quantity of the particular product. In the context of UNICEF, the impact of a product does not necessarily correlate with its value, so further analysis should account for the categorization of the product in terms of its strategic nature. We can see that the high procurement value (>10mUSD), low CoV products (<1) that should be forecasted, are forecasted by SD as well as high CoV (>1) products. Given the volume and value of these products forecasting is critical. Although given the high CoV demand planning requires increased scrutiny, and the triangulation of additional intelligence. There is a mix of products that are forecasted and not forecasted within the low value (<10 million USD), low CoV (<1) quadrant. Typically for low value, low CoV products, statistical forecasting techniques are appropriate 14 Demand variability is the standard deviation of monthly demand divided by the average monthly demand. 47
48 given the low demand variability. Lastly, a significant number of low value high CoV products are not forecasted, which is appropriate given the high demand variability. Figure 25 ABC - XYZ Analysis SUMMARY: UNICEF SD forecasts the high value products with low CoV, and the vast majority of the high value products with high CoV as well. In fact, for some products SD may be better off increasing flexibility through supplier agreements or increasing stock levels. Given SD s product portfolio and demand patterns there are only a limited number of materials that are suitable for statistical forecasting, and most of the products have a high CoV, which require significant intelligence from contract managers to forecast. 2.5 TO WHAT EXTENT IS SD USING AVAILABLE INTELLIGENCE IN THE DEMAND PLANNING PROCESSES? Through qualitative interviews it was clear that effort is made to utilize available intelligence. The following nonexhaustive list of regular contact points are an illustration of this: For measles and Injection Devices monthly calls and an annual meeting in Copenhagen for review of country plans with Gavi, SD and Measles Rubella Initiative partners; weekly meetings between SD and PD For polio, quarterly calls with global partners (e.g. WHO) to discuss progress of running programs and adjustments to running and/or upcoming program activities With Gavi, bi-weekly calls to discuss different progress of programs and new activities / programs; depending on the vaccine also WHO, PATH, BMGF participate For HTC, specifically Cold Chain, monthly Cold Chain Supply Chain HUB meetings between WHO, UNICEF PD, and UNICEF SD to align on work plan to further develop the Cold Chain supply chain For HIV Aids and Malaria, quarterly calls / meetings with The Global Fund (and WHO) 48
49 For immunization programs, annual EPI meetings at regional level with EPI country managers, WHO, and UNICEF PD and SD The intelligence gained through contact with donors and partners is incorporated in the forecast review as well as in updates throughout the year (within the Allocation Tables). However, without historical forecasts documenting the layered contribution of different sources of intelligence, it is not certain that all available intelligence is incorporated in a meaningful way. Moreover, given that forecasted and actual procurement amounts are captured in separate tools, combined with challenges collating and manipulating historical data, it is plausible that limitations in data could prevent certain analysis. Further, it may require significant time and effort to arrive at useful information. The current method of monitoring the forecast and procurement data in the allocation table provides a good indicator of forecast performance with relatively low effort. However, forecast accuracy reports do not contain root-cause analysis, so incorporating this intelligence in subsequent forecasts is unlikely to occur consistently. In the creation of the PS forecast PCs provide a low, realistic, and high scenario of demand. The intelligence is not properly incorporated into different forecast scenarios (in the form of a quantitative assessment of risk or probability). For VC, the low and high scenarios are +/- 10% of the realistic scenario. The PSC could also consider additional sources of intelligence including Gavi co-financing default rates to increase the robustness of their forecast. Although we learned that most countries met their co-financing obligations, the timing was typically later than forecasted. Closer follow-up with key donors may glean additional insights into probability and timing of funds release. Given the long history of the Annual CO Forecast exercise, SD has amassed an enormous amount of historical demand information. It could not be confirmed that the potential of that intelligence is currently utilized. There is an opportunity for SD to increase the accuracy of forecasts through the triangulation of data and through additional challenging of the CO Forecast. This could be achieved using not only intelligence of historical off-take, but by cross checking with wastage rate, coverage, dose requirements, etc. In particular, comparisons across PCs (VC and HTC) and BUs is an area where triangulation across product groups may lead to additional insights, especially in key countries. Currently SD does not employ mathematical models to predict vaccine requirements, which may be the most suitable and efficient method for certain vaccines especially for campaigns and outbreaks as well as emergency stockpiles. There may be an opportunity to leverage intelligence of programmatic experts and epidemiologists such as the Global Polio eradication initiative, the Measles Rubella Initiative, the Global Cholera working group, and International Coordinating Group for Meningitis Vaccines. According to interviews with PD there are also opportunities to leverage the work of the WHO and the Roll Back Malaria Harmonization Working group, who capture malaria commodity needs across a wide spectrum. In particular, they have a gap analysis tool capturing their malaria related needs for a three-year cycle. In order to define proper stock levels as well as conduct replenishment planning WH would benefit from better insight in the upcoming major projects, especially for health. Despite the fact that UNICEF operates on a global ERP, there is no mechanism for countries to input projected demand. According to the Supply Manual all COs should provide an annual demand / shipment plan, but these are not systematically submitted and COs do not necessarily have an incentive to do so. The flexible planning functionality in SAP should allow COs to provide their planning and support UNICEF s needs. Depending on whether forecasting will continue to be executed in an external system, or through SAP itself, COs could be given access to either SAP or the external system forecasting and planning functionality. SUMMARY: Through qualitative interviews it was clear that effort is made to utilize available intelligence. However, it is not certain that all available intelligence is being incorporated meaningfully into the forecast, nor that historical data is being used to the full potential. In particular, triangulation of intelligence across product groups may lead to additional insights, especially for key countries. As forecast accuracy reports do not contain root-cause analysis, incorporating this intelligence in subsequent forecasts is unlikely to occur consistently. SD does not employ mathematical models to predict vaccine requirements, which may be the most suitable and efficient method for certain vaccines especially for campaigns and outbreaks as well as emergency stockpiles. There 49
50 may be an opportunity to leverage intelligence of programmatic experts and epidemiologists such as the Global Polio eradication initiative, the Measles Rubella Initiative, the Global Cholera working group, and International Coordinating Group for Meningitis Vaccines as well as the work of WHO and Roll Back Malaria Harmonization Working group for malaria commodities. Lastly, WH would benefit from better insight into upcoming demand, either through annual demand / shipment plans from COs, or making use of SAP s flexible planning functionality. 2.6 TO WHAT EXTENT IS SD TAKING ON THE RIGHT AMOUNT OF RISK [IN THEIR STOCK STRATEGY] AND DOING ENOUGH TO MITIGATE RISK? The primary risk to understocking is not being able to meet the demand, or not being able to meet demand in a timely manner. The latter is critical for UNICEF s emergency response operations. In addition, there is also a reputational risk associated with being unable to respond in a timely and appropriate manner, although this could not be taken into account for this analysis. SD does not have a defined inventory strategy with targets that are globally aligned across the different SD warehouses. The inventory and replenishment policy for the Copenhagen warehouse is intended to maximize the percentage of time that inventory exceeds demand [1] within a perceived limit of 54 million USD. However, there were different views within SD regarding a limit to the total value of stock. Currently, by the warehouse s own analysis, between 80% and 85% of the time inventory is sufficient to meet demand. As mentioned before, the inventory consists of items on the Emergency Supply List (ESL) meant to respond to emergency demand, and items that are held as non-emergency safety stock. In theory these two stocks are considered separately, although there is overlap in the products, and they are not managed separately in the system. The stock level for the ESL is a static amount of stock that does not account for standard variables for safety stock (historical demand and order lead time). The fixed level of emergency stock for the ESL items is not systematically reviewed, and findings from the recent Evaluation of SD Emergency Response suggest that the logic used to set stock levels is no longer valid. The provision of timely and appropriate emergency response via supplies and supply expertise is one of SD s eight strategies within SD s OMP However, the outdated ESL logic puts UNICEF at risk of not fulfilling this objective. Due to the overlapping product portfolio with regular safety stocks, an inappropriate level of ESL stock may also adversely affect SD s ability to serve regular demand in a timely manner. For non-esl items a safety stock level is calculated using historical demand and demand variability as well as historical lead time and lead time variability. However, it does not take into account a formally agreed service level. Ideally the service level would reflect the varying levels of impact and criticality of UNICEF s products. The safety stock levels are reviewed bi-annually. For the majority of the SKUs in the Copenhagen warehouse no forecast is inputted into the MRP. For these SKUs a replenishment order is not triggered until amount of stock on hand minus the confirmed orders is less than the safety stock level. Within standard supply chain practice, a reorder point is designated so that forecasted demand during the lead time can be covered, as depicted by the figure below. Without a reorder point designated (separate from the safety stock level), there is a much higher risk of stock out (and backorders), especially for items that have a long order lead time. [1] This is referred to as service level, but differs from the typical definition which is the expected probability of not having a stock out. 50


51 Figure 26 Inventory level over time using a Reorder Point For approximately 85 items, a forecast (generated in Smoothie) updated every 3 months is input into the MRP and serves to trigger a replenishment order. In a typical replenishment model, a forecast of demand during lead time is added to the safety stock level to determine the reorder point. However, in this case a forecast is used to compensate for the fact that there are no designated reorder points. During interviews with WH we learned that the current inventory replenishment policy was in place for three primary reasons. First, no reorder point was designated because this would increase stock levels beyond the acceptable financial limit. It was also believed that the impact of the increase in stock would not have impact on service level that would be expected due in part to the policy of consolidation. Secondly, the forecast has low accuracy, and there is not a mechanism through which intelligence on coming demand from the COs or PCs can be fed into replenishment planning. Thirdly, significant increases of stock in the Copenhagen warehouse would likely exceed the capacity. Since measurement of the metric began in February 2014, average weekly pallet utilization has been 87%. The analysis of delivery reliability showed extremely low performance across regular and emergency orders. From , only an average of 47% of warehouse orders (regular and emergency) met the agreed target arrival date (TAD). Average lead time for Emergency warehouse orders was 38 days, and Regular warehouse orders was 83 days. According to PSC, stock availability also has a major impact for PS customers and SD s ability to offer what was agreed in the cost estimate by the Target Arrival Date. In general, low reliability and long lead times suggests that SD is not taking on enough risk in their stock strategy (i.e. by not holding enough stock), but generally point to the need for the development of an overall inventory strategy combined with appropriate stock and replenishment policies facilitated by the appropriate system. Figure 27 Average Delivery Reliability and Lead Time The primary risks to overstocking are the cost of obsolesce or expiry, as well as the opportunity cost of the space that the overstock occupies (in a space constrained situation more appropriate goods could have been stored), and any additional storage and handling costs. The value of write offs between 2012 and 2014, and an analysis of slow moving stock were used to get a sense of the current situation. The analysis of write offs showed that in 2012 and 2013, approximately 2.1% and 1.3% of total stock value was written off (806 thousand USD and 523 thousand USD). In 2014 this figure was 2.9% of total stock value (1,238 51
52 thousand USD). Compared to industry benchmarks, SD s percentage of obsolete inventory consistently puts it at the lower end of the spectrum. Figure 28 Benchmark of Obsolete Inventory (% of Total) Industry segment Sub segment 10% 25% 50% 75% 90% Consumer Products Apparel 1,0 2,0 5,0 8,4 13,8 Life Sciences Medical Devices 2,0 2,8 7,0 15,5 23,0 Life Sciences Biotechnology 2,0 5,0 5,0 6,0 8,4 Life Sciences Pharmaceuticals 0,5 1,0 2,5 4,0 6,5 Divisional Procedure 041 Reviewing slow-moving stock materials explains the regular process WH triggers to make recommendations on slow-moving stock to relevant material owners. As new products are launched on a regular basis, this is an essential process to mitigating the risk of maintaining an inappropriate stock portfolio. The analysis of Slow Moving and Obsolete Stock (SLOB) showed that from , approximately 18% (283 out of 1,553) of warehouse items were held in stock without demand in the period, amounting to a value of 6,703 thousand USD. A certain percentage could be explained by the product having been newly introduced and stock being held in anticipation of demand, the remaining stock was obsolete / rarely demanded. Considering that average weekly pallet utilization has been 87%, we can assume that there is an opportunity cost to stocking these low turnover items. For every write off submission there is a committee that meets to discuss the explanations for the write off. It should be noted that given current system limitations the committee is unable to see an accurate picture of stock on hand over time. The analysis is recorded in separate documents, and no evidence was provided that the learnings from the investigations were used to inform future stock decisions. SUMMARY: SD puts itself at unnecessary risk by not defining a global inventory strategy. Specifically, the current ESL logic puts UNICEF at risk of not providing timely and appropriate emergency response. Due to the overlapping product portfolio, regular safety stocks may also have an adverse effect on SD s ability to serve regular demand in a timely manner. The current replenishment policy and confusion over a possible financial stock limit increase the likelihood of overstocking on certain items and stocking out on others. Low reliability and long lead times suggest that SD is not taking on enough risk in their strategy. In general, there is a need for the development of an overall inventory strategy, and appropriate stock and replenishment policies facilitated by the appropriate system. 2.7 TO WHAT EXTENT ARE THE CURRENT DEMAND PLANNING PROCESSES, TOOLS, AND METHODS WELL SUITED [EFFECTIVE]? Based on an understanding of the current processes, tools and methods, as well as the forecast performance, the below table summarizes the overall effectiveness and suitability of the different demand planning processes given the overall purpose(s). In order to evaluate whether a particular demand planning process achieved its intended purpose some key findings have been incorporated from question 4 which addresses in more detail the impact of the forecast. 52
53 Figure 29 Effectiveness and Suitability of Forecast Processes Purpose Effectiveness Suitability PS Forecast Project handling fee receipts (non-gavi) and detect trends Inform PCs (CO, RO) as they seek to properly size their team to meet upcoming demand Tender Forecast Annual CO Forecast: Vaccines Provide an update to industry to facilitate a healthy market Facilitate competitive bids from suppliers Smooth demand throughout the year and better match with supplier (and country) capacity Provide short to medium-term outlook to suppliers to facilitate efficient production planning (through Monthly Supply Updates and LTAs) Total non-gavi forecast accuracy across commodity groups was relatively good in 2013 and 2014 ranging from 81% to 87% and had a positive forecast bias between 13% and 19% indicating that there was a slight tendency to over forecast during this time period The four top value commodity groups represent on average, 89% of total value. Three of the top four value commodity groups have a good performance, while New Vaccines had low forecast accuracy No evidence could be provided of when the PS forecast did not meet its objectives The tender forecast is perceived as a useful indicator of the demand and is typically one source of information used by suppliers for strategic decision making Most suppliers use LTA awarded quantity as an input in their own planning, often incorporating other sources of intelligence such as historical demand on top of SD s quantities The low performance for new and transitioning vaccines, as well as vaccines used in campaigns, results in poor LTA forecasts continues to be a challenge. It has a negative impact on suppliers ability to deliver in a timely and cost-efficient manner For both routine and supplementary, a country s ability to forecast the timing of the following year s demand (per month) is quite low For some commodities (i.e. vaccines used in the eradication of Polio), the Annual CO Forecast is not the main source of intelligence Both factors necessitate follow up with COs, partners, donors and suppliers to match demand and supply The repository for the most up-to-date demand intelligence is the Allocation Table. Based on the Allocation Table, monthly Supplier Reports are generated and shared with LTA holders in order to provide more reliable information on short- to medium-term demand, which suppliers appreciated Given that the portion of non-gavi PS value is less than half of total PS value, and no evidence could be provided when the non-gavi PS forecast did not meet its objectives, the effectiveness of the forecast is sufficient Product demand planning improvements (specifically for New Vaccines) will logistically translate into an improved PS forecast There is room, however, to increase the efficiency and rigor of the PS forecast process The process to produce a forecast for tenders varies depending on the nature of the product, but generally utilizes existing sources of intelligence effectively in a suitable process For some products, the tender process requires additional input and alignment with key partners, while for other products the Annual CO Forecast or historical off-take is the primary input. For products that are also held in inventory, the process, the owner of the tender forecast was not clear Interviewees internal and external to SD commented that the timeline between commencing a tender and finalizing the LTA, was quite lengthy, up to 12 months at times, and often not done in a timely manner Although the time spent to formally amend LTA awards may be inevitable, suppliers indicated that there was room to improve the process and timeliness of LTA amendments The inability of COs to forecast timing of demand throughout the year means that contract managers must follow up with COs, partners and donors frequently For some products the Annual CO Forecast is not a suitable process to gather intelligence SD does not employ mathematical models to predict vaccine requirements which may be the most suitable and efficient method for certain vaccines, especially for campaigns and outbreaks as well as emergency stockpiles SD makes considerable effort to gather available intelligence, and understand the drivers of demand. Nevertheless, it is not certain that all available intelligence is being incorporated into the demand planning process, nor that historical data is being used to its full potential Currently the forecast and day-to-day management of supply and demand is done in Excel and not linked with the global ERP, VISION. Information is captured in different Excel sheets and s, which does not facilitate analysis, and is not always consistent with Master Data Forecast accuracy reports do not contain rootcause analysis meaning that incorporating this intelligence in subsequent demand planning processes is unlikely to occur consistently 53
54 Annual CO Forecast: Immunization Devices Annual CO Forecast: Cold Chain LLIN Forecast Nutrition Forecasts Achieve lower prices without compromising quality or time to market and potentially shorter lead times Provide short- to medium-term outlook to suppliers to facilitate efficient production planning (through Monthly Supply Updates and LTAs) Support sustainable supply in a context of expanded demand and product transitions Forecast used as an input to generating global picture CCE need (and demand) Achieve lower prices and smooth demand Contribute to global forecast Ensure adequate market capacity (through bid forecast) Cross-check bid quantities (CMAM) The tender forecast has been effective in lower prices. A 10 % price reduction was achieved within AD and SB markets in the last tender round For both routine and supplementary, a country s ability to forecast the timing of the following year s demand (per month) is quite low Like vaccines, this requires follow-up with COs, partners, donors and suppliers to match demand with supply The repository for the most up-to-date demand intelligence is the Allocation Table. Based on the Allocation Table, monthly Supplier Reports are generated and shared with LTA holders to provide more reliable information on short- to medium-term demand, which suppliers appreciated Annual forecast accuracy for cold chain equipment is very low, which means timebound LTAs are used Historically there has been a heavy reliance on the Annual CO Forecast, although funding has an enormous impact on what need will be realized. COs are often not in the best position to know about potential funding HTC aims to generate a global picture of CCE need and demand, although the effectiveness could not be measured Due to low visibility of upcoming demand, no regular updates are provided to suppliers The majority of procurement (70%) is on behalf of partners. As such the current forecasting method sheds insight into only ~30% of demand, which is often not specified on the level of detail that suppliers require The current capacity on the market combined with SD s push for standardization, and good reputation in the market reduces the need for a highly accurate forecast, and typically allows supplies to be delivered at the right place and at the right time. As indicated previously this situation is not likely to continue which indicates that the repercussions for a poor forecast will shift with new market dynamics The RUTF forecast has been instrumental in increasing the supplier base, but now faces the challenge of awarding the right LTA quantities across suppliers and increasing the visibility of the timing of orders throughout the year to ensure that the forecast enables The repository for demand intelligence (the Allocation Table) is written over as the demand and forecast evolve over time and does not capture longer-term intelligence if available Given that the forecast (performance) for devices is closely linked to the forecast of vaccines, the current process which combines the two product categories is suitable, and the limitations mentioned above also apply for vaccines The inability of COs to forecast timing of demand means that contract managers must follow up with COs, partners and donors throughout the year In 2015, HTC will review the forecast from the top 20 countries and accept as is the remaining 80 forecasts. They have also planned sessions with key countries, and key partners to understand their annual plans Considering the evolving landscape of CCE (new funding, the availability of new innovative technologies, and specifically funding that is earmarked for these new cold chain technologies) the forecasting purpose could be achieved through alternative processes and methods To achieve the objectives requires a method to triangulate and leverage historical procurement data plus outside data sources (PATH, EVM, CCE assessments) and mine country data only if and when necessary An effective and suitable process must involve improved collaboration with Gavi (to understand the funding model used) and other CCE partners The forecast also relies on close alignment with countries to follow the decisions that are made in response to available funds, new technologies, and redesign of in-country supply chains The forecasting process is no longer suitable, especially given the changing LLIN landscape (Global Fund pooling procurement) A lighter process that focuses on the 10 highest malaria burden countries and key partners (UNDP) would be more suitable The process should also focus on alignment with Global Fund and PMI. This alignment is critical to avoid overlap and provide clarity to suppliers about the logic and assumptions made in the forecast The forecasting process, tool and method are largely suitable Although the CMAM forecast is a useful crosscheck in the creation of the bid forecast, COs struggle to predict the timing of demand, and the current investment of time and effort in this process does not justify its value 54
55 WH Forecast Vitamin A: to collect needs for product by eligible countries For safety stock (non-esl stock) the forecast feeds into MRP replenishment logic with the ultimate aim to improve WH service levels (avoid stock outs, reduce lead times to country and increase delivery reliability & capacity) timely delivery of the right quantity at the right price Currently no supplier updates are sent throughout the year and suppliers noted that a better quality forecast, or more visibility of upcoming demand (i.e. in the form of quarterly outlooks) from SD would result in higher delivery reliability and lower prices SD also conducts an annual demand planning process for CMAM commodities, including RUTF, via an online platform, NutriDash The forecast for select (non-esl) items has no discernible impact on service level (per the Warehouse s own analysis) in part due to other factors that play a more significant role in the warehouse s ability to conduct demand planning and forecasting o System set up does not allocate stock properly to SOs, nor properly roll-up kits, nor consume the forecast correctly. o Overall WH policy is to consolidate orders which significantly reduces delivery reliability Given high CoV of products increasing stock levels and/or increasing flexible supplier arrangements may be more effective and suitable (and require less time investment) WH would benefit from better insight into upcoming demand, either through annual demand / shipment plans from COs, or making use of SAP s flexible planning functionality The forecasting tool is currently not linked with SAP. SAPS s functionalities are not fully utilized To improve the CMAM demand planning performance the CO forecast could be better mined, however the BU currently lacks the bandwidth The current process, tool(s) and methods are not suited for the purpose intended. There is a need for appropriate stock and replenishment policies facilitated by the appropriate system The method of calculating ESL stock levels puts UNICEF at risk of not providing timely and appropriate emergency response, and due to the overlapping product portfolio with regular safety stocks may have an adverse effect on SD s ability to serve regular demand in a timely manner The current replenishment policy, and confusion over the existence of a financial stock limit, increase the likelihood of overstocking on certain items, and stocking out on others More flexible supplier agreements, an increase in regional LTAs, and an increase in strategically held safety stocks would likely result in a higher service level to both Programme and PS recipients 55
56 3. WHAT IS THE EFFICIENCY OF CURRENT DEMAND PLANNING PROCESSES? Having established the quality and effectiveness of the demand planning processes within UNICEF SD, the assessment also addresses the efficiency of these processes. 3.1 TO WHAT EXTENT IS UNICEF CORRECTLY STAFFED TO MANAGE DEMAND PLANNING? In order to quantify the time spent on forecasting, and the appropriateness of the level of staff, PCs were requested to provide a rough estimation of time spent on the following forecasting and demand planning processes. The figure below summarizes the data collected. Figure 30 Time Estimation of SD Forecasting Processes (Hours) Business Unit # SKUs Annual CO Forecast Forecast for WH items Forecast for tenders PC forecast for PS PS 218 Annual review ESL and SS Management of Allocation Tables Vaccines Immunization devices Cold Chain Equipment Malaria Prev/Diagnostics Medical devices and Lab 594 Essential Medicines HIV/Aids & Malaria 182 Nutrition Education 149 Water Sanitation WH Total In total, 26,624 hours are spent on forecasting and demand planning. Assuming 220 working days per year and 8 hours per day, this equals roughly 15 Full Time Equivalent (FTE). Of the 1,993 SKUs, approximately 200 are part of a formal forecasting process. The core product demand planning (Annual CO Forecast and Forecasting for tenders), amounts to 8,551 total hours or 4.8 FTE, bringing UNICEF into the range of benchmarks provided below. Typically, at benchmark companies, the demand planning processes are conducted for customers with demand planners working directly with 5-10 account managers (Figure 29). Within UNICEF the line is blurred between demand planning and supplier management as the Allocation Table serves as both the repository for the latest demand intelligence, and the tool through which suppliers are regularly updated. Figure 31 Benchmark Figures on # Demand Planning FTE Organization # SKUs # FTE Demand Planning Consumer Business company Consumer Business company Beverage company Beverage company Consumer Business company The table below from the Fritz Institute s Review of UNHCR s Supply Chain Organization makes a comparison of supply chain personnel across a number of humanitarian organizations. It shows that UNICEF, which has 73% of annual budget is in terms of procurement activities has only 7% supply chain personnel (Fritz Institute, 2015). Interestingly, this comparison gives a rough indication that at least compared to other humanitarian organizations, for their spend, UNICEF has relatively low percentage of supply chain management personnel organization wide. 56
57 Figure 32 Comparison of Supply Chain Personnel ICRC IFRC MSF-OCB Oxfam GB UNHCR UNICEF WFP Annual Budget (USD M) Total Procurement (USD M) (% of annual budget) 340 (28%) 220 (25%) 90 (25%) 303 (50%) 953 (29.5%) 2839 (73%) 1600 (36%) HQ vs Local Procurement 45 / / / / / / / 59 Total Number of Personnel Supply Chain Management Personnel (% of total personnel) Note: Figures are from 2013 data 800 (7%) 125 (7%) 400 (5%) 350 (7%) 391 (4.5%) Qualitative interviews have suggested that in certain areas increased capacity would allow UNICEF to improve demand planning effectiveness, specifically in areas such as building capacity in country and better analysis and documentation of root-cause for forecast performance. To some extent, the additional capacity can be found internally through more focused attention on priority countries, partners, and targeted efforts to mitigate drivers of forecast inaccuracy. For VC and HTC, less time spent on low impact forecasts would allow time for more comprehensive cross checks and deep diving into high impact country forecasts, mining partner intelligence, participation with Programmatic discussions, as well as triangulation of data across BUs and across PCs (vaccines drive demand for devices and cold chain yet are separated in different PCs). For WH considerable time is spent overcoming system limitations, and manually transferring data between systems. With certain system fixes and a smoother interface, WH would have more time to spend on value-add analysis, bring more value to regularly scheduled interactions with the PCs, and potentially glean more insights on demand from key countries. The decentralized structure of the demand planning function, leads to some duplication of effort, and requires individuals to cover a broad range of demand planning tasks, which ultimately lowers both efficiency and effectiveness. In organizations with a large variety of products, like UNICEF, certain demand planning activities such as data cleansing, statistical forecasting, master data management, reporting, and identification of attention points are orchestrated from a shared service center. For certain areas, however, the capacity will need to be expanded. Through interviews it was noted that SD lacked the capacity to generate longer-term forecasts (5+ years), and often relied on Gavi s SDF for this purpose. A longerterm forecast may require a different profile, and different methodology, than the one to which SD contract managers are accustomed. Projections of demand for new products (where SD lacked historical demand) was seen as another particularly challenging area, where SD s skill sets could be enhanced. This was supported by Partners, who saw the potential for UNICEF to own the long-term forecast, specifically within the Cold Chain space, but saw limitations in the current profile of the team. They generally saw it as a challenge to move from the operational short-term lens to a longer more strategic view of the market. SUMMARY: Our analysis indicates that the amount of time spent on core demand planning processes is on par with benchmark companies for a similar number of SKUs 15. There are opportunities for SD to better utilize existing capacity, as well as areas where SD s skill set could be enhanced. There is also an opportunity to consider a shared service model that would assist in setting standards and supporting across the PCs. The organizational structure chosen will also have an impact on the capacity and skill sets necessary within individual units. 876 (7%) 3000 (21%) 15 A refinement of the analysis above would include a more detailed breakdown of forecasting and demand planning activities as well as clear guidelines to ensure consistency between respondents. In addition, as the complexity of different product categories is not captured in our analysis, and the number of SKUs is an incomplete measure of workload or ultimate impact, additional measures could be used to supplement the number of SKUs. 57
58 PS FORECAST More than half of the value of the PS is through Gavi. Costs for providing service to Gavi are recovered through a flat fee that is calculated based on seven workload drivers. Currently there are efforts underway to streamline the process of defining the appropriate fees. Of the approximately 40% of non-gavi value, the current process makes a good effort to leverage existing forecasting processes within the PCs, but still contains a room for further efficiencies. Approximately 29% of the 40% non-gavi value is based on the Annual CO Forecast. To cover the remaining ~11% for commodity groups lacking an existing formal forecasting process, the PSC sends out their own Country and Partner Forecast sheet. The accuracy of the input provided through this process is currently not measured, and qualitative evidence suggests that it may be used as a starting point, but that it is not a critical input. For Nutrition, information collected by PSC is not used at all. Given the very low percentage of total value that these commodity groups represent, it may be more efficient to generate a forecast based on historical offtake, as is currently the process for WSEC and CC commodities. Moreover, the PSC Country and Global Partner forecast sheet is known to create confusion in COs, as some countries go through the effort of providing Immunization related Procurement Services forecasts (usually already captured through the Annual CO Forecast exercise), and/or Global Fund Procurement Services (captured through UNDP forecasts) resulting in further inefficiencies. This confusion is understandable since there is also some overlap between the Country and Partner Forecast sheet and the Annual CO Forecast (i.e. for cold chain equipment where a forecast is requested via both processes). Global Partner input (i.e. UNDP) remains an important component of the PS forecast, and the improvements made including monitoring of forecast accuracy for UNDP in the bilateral scorecard should be continued with documented root-cause analysis of deviations between procurement plans and actual procurement so that learnings can be incorporated in the next forecast. SUMMARY: The PS Country and Partner Forecast process, coordinated by the PSC attempts to capture approximately 11% of PS value from COs. Unfortunately, it provides limited insight to BUs when generating the PS forecast, and may instead be a source of confusion and inefficiency. Global Partner input, on the other hand, is an important component and UNDP forecast accuracy is measured through the bilateral scorecard. ANNUAL CO FORECAST: VACCINES Currently a forecast is requested by UNICEF SD from ~120 COs and all forecasts undergo a review process. An effort is made to streamline the communication with COs by funneling correspondence through one point of contact in the VC Planning Unit. Every Tuesday and Thursday, the Planning Unit distributes a batch of country forecasts (Excel) received to relevant contract specialists (vaccines, devices and cold chain) over . Contract specialists have a one-week review period and then the input is consolidated centrally in the Excel sheet by the Planning Unit and returned to the CO. Effort is made to ensure that the feedback is kept within the forecast sheet, that said qualitative evidence from COs suggested that it was not uncommon for information to be captured in the exchange instead. To increase efficiency VC could focus review efforts on the top countries for each product and accept as is the remaining country forecasts. The VC is currently providing an empty forecast sheet to the COs with the request to fill out the demand plan. To increase efficiency, it may be possible to generate a baseline forecast based on SD s intelligence, that COs and/or governments could, at a minimum, use as a reference point. Some basic checks are included in the forecast sheet itself (i.e. quantity forecasted should equal total in shipment plan, etc.). However, the process relies on the contract specialists to review and sanity check forecasted amounts. They are expected to account for their knowledge of product shifts and other qualitative information, however the exact process for reviewing the forecast is not clearly documented, varies by product, and may not always be the most efficient, especially when there is staffing turnover of contract managers. Given the numerous contract managers in both VC and HTC that play a role in reviewing the forecast, it would be more efficient for individual contract managers to access a web-based system, ideally linked with VISION (and associated relevant reporting to gain the full benefit from a global system), and review forecasts as they are received. 58
59 This would reduce the amount of time the VC planners spend on tracking and monitoring status of the CO forecasts. On the CO side, both Supply and relevant Programme responsible would also be able to access and see when feedback was available. To increase efficiency further, the web-based tool could include past forecasts, historical data on sales and purchase orders, and shipments, and root-cause analysis for forecast inaccuracy. It could also flag deviations. If deemed necessary, the web-based system could include the option for countries to provide additional PS related forecasts for commodity groups outside of the Annual CO Forecast exercise. A web-based system could also leverage or link with existing initiatives such as VIVA, or country Supply Chain dashboards and potentially extend to include data sources outside of UNICEF such as Gavi Decision Letter quantities. Country governments may engage in a number of different exercises that involve creating a projection of demand. This may be in the form of an annual budgeting exercise (or the comprehensive Multi-Year Plan (cmyp)), and then again for the purposes of securing Gavi funding, or reporting on progress through the Gavi s Annual Progress Reports. From a high-level perspective, there may be an opportunity to increase efficiency by reducing the duplication inherent in these parallel processes. In particular, gaining a better understanding of the information that is already collected by Gavi and leveraging that information could reduce the effort made by governments, COs, and SD alike. While finalizing this assessment, agreement was reached with Gavi to modify their process and communicate the final approved quantities for the following year by September (in advance of the country forecasting exercise). With this information, not only is the uncertainty taken out of the CO forecast, but Gavi approval quantities could be used to prepopulate country forecast sheets where applicable. SUMMARY: Currently a forecast is requested by UNICEF SD from ~120 COs and all forecasts undergo a review process, despite the quantity or value of the forecast. The process is highly manual and involves the transfer of Excel sheets which limits visibility and does not include links to other sources of data. The process relies on contract specialists to review and provide a sanity check of forecasted amounts, but these checks are not clearly documented. From a highlevel perspective, there may be an opportunity to increase efficiency by aligning the data requested with other existing processes such as the CMYP or the Gavi decision letters. ANNUAL CO FORECAST EXERCISE: IMMUNIZATION DEVICES In addition to the key points made above for Vaccine Centre, the SD and Gavi have also identified an opportunity to improve efficiency in the funding of injectable devices, and shift to a model that would allow procurement on forecast (feasible given the 5-year shelf life and flexibility to use the.5 variety across multiple vaccines). Although this represents a very small percentage of Gavi value throughput, it currently constitutes an enormous burden in transactional paperwork, and improvements could result in efficiency gains within both organizations. SD and Gavi have established a working group aimed to review potential efficiency gains in device procurement. In 2015, HTC decided to review the forecast from the top 20 countries and accept as is the remaining 80 forecasts. They have also planned sessions with key countries, and key partners to understand their annual plans. ANNUAL CO FORECAST EXERCISE: COLD CHAIN As Cold Chain is currently piggy backing off of the VC Annual Forecast Exercise, the incremental time and effort is relatively low, nevertheless given the low forecast accuracy, the efficiency of collecting demand forecasts from all COs is questionable. An alternative approach, as described in question 2, would increase both the efficiency and effectiveness of the Cold Chain forecast. LLIN FORECAST Given the relatively small percentage of demand that is forecasted through the LLIN Forecast sheet, it could be more efficient to look at historical off-take and key countries rather than engaging in a comprehensive country forecast exercise, and leverage the extensive on the ground presence within the malaria community. Alternatively, more efficient methods to forecast should be considered especially in light of the low forecast accuracy. 59
60 NUTRITION FORECAST As mentioned, the mismatch between the timing of the annual forecast (NutriDash) and forecast for tender and LTA quantities means that the bid forecast is made based on historical off-take and the annual forecast is used as a crosscheck only. This results in two parallel and time consuming processes. According to time estimates submitted by each BU, Nutrition spends 1,079 hours annually on the annual forecast in NutriDash, as well as 1,001 hours on forecasting for tenders. Although the CMAM forecast via NutriDash forecast provides limited value given current timing limitations, there is room for further efficiency in the process of launching the forecast exercise, as there are multiple handoffs that can result in delays before the forecast form arrives at the CO Nutritionist. The approach that has proved to be beneficial for the Vaccine Centre Annual CO Forecast exercise to assure buy-in may not be necessary given that NutriDash is already a PD driven tool, and may instead result in lower overall efficiency. Qualitative evidence suggested that there could be further incremental value extracted from NutriDash that would enhance the forecast performance, however this could not be currently pursued given bandwidth within the BU. Furthermore, given that forecasts provided by COs within the PSC s Country & Partner forecast are not used in the calculation of the PS forecast, discontinuing this process would save time and energy in-country. SUMMARY: Until the data collected can provide value, the efficiency of collecting a forecast from COs through NutriDash, as well as producing a forecast based on historical off-takes in order to inform industry could be questioned. If the information collected through the PSC forecast is not useful it is inefficient to continue collecting it. TENDER FORECASTS The process to produce a forecast for tenders uses available information efficiently, although the timelines between commencing a tender and finalizing the LTA are relatively long (sometimes up to 12 months) and are often not completed in a timely manner. According to one vaccine manufacturer, Discussions for review and extension should start 2 years before end of contract given the fact that UNICEF has to consult with other stakeholders. UNICEF often has difficulty to conclude these on time, and the visibility and predictability would allow us to still give manufactures enough time to prepare production. Although the time spent to formally amend LTA awards may be inevitable in some cases, conducting the process sufficiently early will result in a more efficient process. In one example for RUTF, the LTA amendment (and extension) took between 2 and 4 weeks and required the supplier to wait on production. In another, one supplier shared that even prior to being awarded an LTA, a PO was placed and requested to have pre-warning of the products awarded prior to the PO, so that there was sufficient time for proper planning. Due to the manner in which the forecast is represented in the tender and LTA, the process for capturing modifications, and the mismatch between material names and codes with VISION data, monitoring LTA usage is performed through the allocation tables. A more efficient method to trace between tender quantities, LTA awarded quantities, LTA usage, and reasons for deviations would facilitate analysis going forward. SUMMARY: There appear to be opportunities to streamline the tender process to reduce the total timeline and complete the process in a timely manner facilitating supplier planning. INVENTORY PLANNING WH currently calculates the level of safety stock based on historical data of demand (average and standard deviation) and lead time data (average and standard deviation). Large orders as well as the start or conclusion of a programme make forecasting based on historic demand difficult. Currently, WH is cleansing the data from large orders when making the calculations for safety stock levels. The overall process to review the safety stock levels is timeconsuming and requires the warehouse team to piece together a number of data sources. Ideally there is a bi-annual review of these stock levels, driven by WH. However, given the Ebola crisis and other parallel L3s the review of stock levels has not been conducted on-time. 60
61 In general, the amount of kits, and the increasing customization of kits, also reduces the efficiency of warehouse operations. A rough estimation based on VISION data shows that there are 107 kits. There was demand in 2012 for 50 kits, in 2013 for 71 kits and in 2014 demand for 92 kits. SUMMARY: The process of setting and reviewing safety stock levels requires considerable manual manipulation of data that decreases the efficiency of the process. The increasing customization of kits within inventory reduces the overall efficiency of warehouse operations. REPLENISHMENT PLANNING Creating the forecast for replenishment planning is performed in Smoothie, which is then manually fed into the MRP as there is no interface between the two. This is time consuming and prone to errors. Further inefficiency is caused by the system limitations as described in question 1. SUMMARY: The process of creating the forecast for replenishment planning requires considerable manual manipulation of data that, combined with system limitations, decrease the efficiency of the process. 61
62 4. WHAT IS THE IMPACT OF CURRENT DEMAND PLANNING PROCESSES? The impact of SD s current demand planning processes is assessed primarily qualitatively, through interviews conducted with COs, PD, ROs, and suppliers. The impact of the PS Forecast is excluded from this question. 4.1 TO WHAT EXTENT HAS DEMAND PLANNING ENABLED SD TO DELIVER SUPPLIES AT THE RIGHT PRICE, RIGHT PLACE, AND RIGHT TIME? This question addresses the extent to which SD s demand planning processes have enabled SD to deliver supplies at the right price, right place and right time. However, it leaves out the question to which extent UNICEF s forecast should also play a role in delivering not just the requested quantity but the right quantity. As mentioned above in question 1.2, interviews with partners and PD revealed that countries often face significant challenges to quantify demand, and risk both severely over and under stocking as a result. In general, although the assessment focuses on SD s own demand planning processes, there is a heavy reliance on the inputs coming from COs, country government counterparts, and other in-country partners. SD s ability to meet its objectives for healthy markets, and deliver supplies at the right price, right place, right time, and in the appropriate quantity will be limited by the quality of the inputs received from the downstream supply chain and cannot be ignored. Currently within the Supply Chain Strengthening Unit efforts are made to improve in-country supply chains, working with both governments and partners. During interviews, members of the PCs were very clear that strengthening country supply chains would have a positive impact on the SD forecasting processes. As described in question 1.3, interviewees expressed the need for more support and capacity building both within the CO and with their government counterparts. Within UNICEF s own Programmes, the ability to quantify demand at the CO level was also hampered by visibility of need. According to one interviewee, it is essential to have a clear picture of what is going on where we are implementing so we can get accurate figures on consumption which is of course fed back into forecasting. If we are going to be good at forecasting, we have to be able to do that a lot better than we are doing now. ANNUAL CO FORECAST EXERCISE: VACCINES AND IMMUNIZATION DEVICES The extent to which the forecast enables SD to deliver supplies at the right price, right place, and right time varies depending on the product characteristics and the market situation and does not stay static. UNICEF and Gavi s longer-term demand projections provided in tender documents, industry consultations and market updates were perceived by suppliers as valuable information on the total size of the market. These projections can be used to support suppliers longer-term strategic decisions regarding staying or entering the market, or adjusting capacity. Suppliers of new and transitioning vaccines (MMR, HPV, DTP, OPV, IPV, TT/TD, and Pentavalent) expressed that more clarity on the 1 year forecast, as well as the longer range 2-3 year forecast would be helpful in short the current forums did not permit discussions in enough detail. A suggestion was made by certain vaccine suppliers to have a joint meeting with UNICEF and Gavi to review assumptions and come to a better forecast together. The LTA quantities provide an indicator of the portion of demand that a particular supplier will receive, and will inform their production planning, as well as procurement of raw material, intermediate goods and packaging procurement to varying degrees. Most of the suppliers mentioned that they do not rely only on the allocated LTA quantities for decision making, but incorporate their understanding of the historical trends of SD s LTAs. As one supplier said, For new suppliers it probably isn t so easy but we have many years of experience not only for the syringes, but also supplying other departments of UNICEF. We have learned over many years how to act and behave, of course the forecast is important but if they need 10K boxes over the next quarter we will produce 20K. Or as another supplier said, Typically UNICEF provides a forecast in their LTA that is half of what they will actually procure. We are used to this and I tell my production to double it because we expect it. Generally, we plan based on history because there is no other yardstick to use. Or lastly, A forecast is important for any manufacturer or supplier, but you have to understand the inconsistency of UNICEF's requirements. We understand that UNICEF is trying to 62
63 improve, but feel that there is limited space for improvement because they depend on requirements in country and donors and at this point cannot do much better. A short- to medium-term forecast is absolutely critical for manufacturers to optimally plan production, assess regulatory implications and manage distribution planning. SD plays a critical role in short-term supply and demand management, which is both recognized and appreciated by the other actors in the immunization supply chain (COs, suppliers, and partners). Their unique position and strong link with COs means that they can be very reactive to changes in demand and communicate these changes upstream to suppliers. Nevertheless, the forecast is not the only enabler of SD delivering supplies at the right price, place and time. In conversations with suppliers it became apparent that there are other mechanisms that build in flexibility and compensate for what many suppliers saw as unavoidable differences between forecasted and actual demand 16. One of these factors is the standardization of specifications/products which reduces the risk for suppliers to produce to stock, thereby increasing the likelihood that unanticipated demand can be met. As one supplier said, We are serving UNICEF with identical products that are supplied to EU community clients. This is a big plus and reduces the necessity of UNICEF preciseness of forecast. For special non-standard items there is definitely a cost element, but of 20 codes this only happens with 1 code. In general, the good relationships that SD nurtures with their suppliers, and the quick and efficient communication are also key enablers to deliver at the right price and right time. In the words of one supplier, We are motivated to be a supplier to UNICEF, and feel that the chemistry is good with the people we speak to, and they should continue in this way. A number of suppliers also mentioned that they were willing to go the extra mile to meet unexpected requests from UNICEF due to the nature of UNICEF s work. We see UNICEF as more than a commercial aspect for us, but reputation and character. Any colleague is running full speed for any request from UNICEF. Or as another supplier phrased it, We know the UNICEF situation, they are non-profit, and so we always would like to give the fastest delivery for their orders. The good relationship combined with standardization create an environment where suppliers are flexible and also in many cases able to meet unexpected demand. One additional way to decrease the reliance on the forecast (both in terms of quantity and timing) and increase flexibility would be to decrease the requirements for product shelf life, especially for certain problematic products. Suppliers mentioned this as a key area where the risk is disproportionately borne by suppliers. Especially when the delay is not on the supplier s side (funds not transferred soon enough by the country, etc.) and goods are no longer accepted by countries. The strong perception is that UNICEF, working with Gavi, can do more to influence countries to accept products with a shorter shelf life, especially when demand forecasts indicate the product will be used prior to expiry. (There are currently ongoing discussions about the feasibility of reducing the shelf life requirement.) SUMMARY: For vaccines and devices, the tender forecast is an important component of suppliers strategic decision making. The LTA is a useful indication of the portion of the total market demand that could be expected, and suppliers use the awarded quantity as a baseline in their own planning, often incorporating other sources of intelligence such as historical demand on top of SD s quantities. The ability to plan based on LTA quantities and knowledge of UNICEF s demand patterns allow suppliers to offer a lower price. Ways to increase flexibility and decrease the reliance on the forecast are seen as equally important factors in the demand planning process. SD s role in balancing supply and demand in the short to medium-term plays a key role in ensuring that supplies are delivered at the right place and the right time. ANNUAL CO FORECAST EXERCISE: COLD CHAIN EQUIPMENT The assessment did not find a relationship between UNICEF s Annual CO forecast accuracy and their ability to deliver at the right place, right price, and right time. Nevertheless, SD has been making efforts to quantify the global market for cold chain equipment, which will certainly help suppliers to invest in the necessary capacity to deliver. Especially 16 UNICEF SD has also invested time to share the challenges of the forecasts which results in more understanding from suppliers about unexpected demand. 63
64 with the surge of demand expected given new available funding streams. Currently, SD enters into time-bound LTAs for cold chain equipment, which are key to reducing response times and increasing price stability and transparency. LLIN FORECAST The LLIN landscape has been changing in the last few years as there has been increasing centralization of procurement by The Global Fund and the US President s Malaria Initiative (PMI). These initiatives have resulted in an overall decrease in UNICEF s share of global procurement to approximately 14% in In the past, according to one supplier who worked with UNICEF for the past 10 years, UNICEF s forecast provided indications on demand that were unavailable from any other source. However, within the current environment the Global Fund and PMI also produce a forecast, meaning that the focus shifts to aligning the forecasts presented to industry, and suppliers are seeking a better understanding of what is included in the UNICEF forecast as opposed to the Global Fund forecast. This year for the first time a joint demand forecast will be made between PMI, Global Fund and UNICEF. In the past, SD has shared with LTA holders a planned allocation of orders throughout the year. Although these are not contractually binding, one supplier indicated that experience showed these projections are reliable and makes reservations in capacity based on this information. However, for SD was unable to do so. SD s proactive follow-up with countries throughout the year is also instrumental to meeting demand in a timely manner. SD s ability to deliver at the right place, right time and right price are driven primarily by three aspects; the capacity of the market, their reputation in the market, and the level of standardization of products. Over the last years the supplier market has moved from 2 big players and 3-4 smaller players, to 10 suppliers, half with significant production capacity. According to HTC, the capacity on the market has allowed them to respond to large quantities of unexpected demand typically within the requested delivery date. Conversations with LLIN suppliers support this observation. In 2010, it would not have been possible to meet the requirements for orders between 2 and 10 million nets, but today it is possible. Although the current market does not punish a poor forecast, suppliers were also dubious about whether the current trend was sustainable. There is much more production capacity than before, but [I] wouldn t count on it to be the same 3 years from now. With margins and prices going down there isn't enough demand to sustain all of those players. UNICEF s reputation in the market also plays a key role in allowing SD to deliver at the right place, right time and right price. According to one supplier, even a large unexpected order from UNICEF will be made a priority, and due to sufficient production capacity demand is typically met within the requested delivery time. The third aspect, standardization, was mentioned as key to suppliers ability to deliver products in a timely manner as it allows suppliers to produce to stock with limited risk, thereby increasing the likelihood that even un-forecasted demand can be met. As one supplier said, UNICEF really vets customization requests and tries to convince countries to take as standard as possible, which reduces lead times considerably. The dialogue that UNICEF has with countries in this regard is very valuable and allows us to keep in stock certain standard products that UNICEF requires. SUMMARY: Given the recent changes in the LLIN landscape, SDs forecast plays less of a role in enabling SD to deliver LLINs at the right price, time and place. The current capacity on the market combined with SD s push for standardization, and good reputation in the market reduces the need for a highly accurate forecast, and typically allows supplies to be delivered at the right place and at the right time. RUTF FORECAST For Nutrition supply, specifically RUTF, SD s forecast based on historical off-take presented in tender documents has been a key enabler of delivering supplies at the right price, right place, and right time. The forecast has been 64
65 instrumental in achieving affordable and locally available RUTF to support the MTSP objective to source 50% of RUTF from manufacturers located in programmatic countries by Currently market capacity exceeds demand, and the challenge for UNICEF is to allocate demand across a broad supplier base. One supplier indicated that a more realistic original LTA quantity would have resulted in a lower price, as raw material prices could have been renegotiated. Another supplier indicated that the LTA awarded was very low compared to production capacity, and they would be willing to quote a better discount for higher volumes. Suppliers agreed that a quarterly outlook of demand, perhaps even a minimum quantity for each quarter, would allow them to smooth the erratic peaks and to more efficiently plan production. In order to compensate for the variability and fluctuations of demand, suppliers have had to adapt. UNICEF has a very difficult job; it is difficult to forecast the RUTF requirements when you have emergencies that are not anticipated. To overcome this problem, we plan based on the LTA quantity plus 25% as a buffer, and though it is a bit of a gamble it is a calculated risk that is paying off. SUMMARY: The RUTF forecast has been instrumental at increasing the supplier base, but now faces the challenge of awarding the right LTA quantities across suppliers and increasing the visibility of the timing of orders throughout the year to ensure that the forecast enables timely delivery of the right quantity at the right price. INVENTORY & REPLENISHMENT PLANNING In order to measure the impact of the forecast that is made by the WH and updated once per quarter in the system, it would be necessary to look at products that have been forecasted and their service level. Time and data limitations prevented this analysis, however, according to the WH s own analysis whether or not a product is forecasted does not have an effect on the service level. The impact in terms of delivery reliability and capability for products that are forecasted versus products that are not forecasted is negligible. SUMMARY: Currently the forecast made by WH does not play a key role in enabling supplies to be delivered at the right time, place and price. 4.2 WHAT ARE THE CONSEQUENCES OF POOR OR NO FORECASTS? The consequences of a poor or no forecast differ according to the product characteristics and the capacity of the market thus, they do not remain static. Answering this question requires an understanding of the need to conduct forecasting or demand planning in the first place. The impact of a poor or no tender forecast has been included within the relevant product categories where applicable. PROCUREMENT SERVICES In theory, a poor or no projection of PS handling fees may lead to insufficient income to cover budget allocations. However, no example could be provided of when poor forecast accuracy had a negative effect on SD s ability to deliver their commitments to PS Partners, and ultimately beneficiaries. A poor or no projection of PS handling fees could also mean that major trends and developments are not detected in a timely manner. No example was provided of when a trend was detected within the PS forecast and corrective action was taken. However, for specific projects such as UNITAID, SD was able to take into account capacity needs to facilitate the additional workload and hire the appropriate staff. 17 As a result, the quantitative analysis shows that while Delivery Reliability decreased between 2013 and 2014 from 85% to 65% order lead time also decreased on average from 89 days to 61 days. 65
66 VACCINES UNICEF plays a unique role in the vaccine market in pooling procurement. For most vaccines UNICEF and Gavi s forecast plays a key role in allowing manufacturers to efficiently plan production and allocate capacity. No forecast for the majority of the vaccines would directly lead to higher prices paid on the market, as well as lower availability and reliability, although the impact would differ by product. In the words of one of UNICEF s primary suppliers, For any large manufacturer removing uncertainty in volumes allows you to plan in an optimal manner, which has a direct impact on price. According to a second key supplier, a poor or no forecast has significant repercussions across numerous areas, from product prioritization and development in terms of new vaccines and devices, to production planning, capacity development, regulatory requirements, financial implications, and even engagements to support countries planning to introduce new vaccines. Currently some of the consequences to lower forecast accuracy are mitigated through other factors as described in 4.1, including standardization of product specifications, historical performance that gives suppliers the confidence to build up buffer stock, and goodwill towards UNICEF and their mandate. The number and size of amendments to the LTAs reviewed, indicate that allocated quantities are typically adjusted throughout the course of the LTA, although the impact is mitigated through regular supplier updates and communication. Nevertheless, more accurate LTA projections could improve prices for some products. Particularly for new and transitioning vaccines, as well as vaccines used in campaigns. The poor demand planning performance, results in poor LTA forecasts and continues to be a challenge having a negative impact on suppliers ability to deliver in a timely and cost-effective manner. IMMUNIZATION DEVICES The link between immunization devices and vaccines means that a poor or lack of forecast would impact the ability of countries to execute vaccinations at the appropriate time. Especially since devices are shipped by sea and have long shipment times while associated vaccines are shipped by air. In general, suppliers expressed that production and stock management are dependent on forecasts. Decisions to procure the raw material, means that the production of intermediate goods and finished goods is dependent on a forecast. As there is a reasonable realization of the forecast provided by SD in the LTAs suppliers are able to plan production accordingly. However, a poor forecast would require waiting for an order resulting in longer lead times, and potentially higher costs. COLD CHAIN EQUIPMENT A poor forecast or lack of forecast of need and demand (need likely to be fulfilled via funding) jeopardizes the sustainability of supply, especially for new technologies, leading to longer lead times and higher prices paid. In the current situation where demand is expected to outstrip supply this is especially relevant. The forecast challenges would also not allow SD to secure bridge financing, which is necessary to secure more competitive prices. Given the current low performance of the cold chain demand planning process, and the lack of visibility of upcoming demand, SD faces pressure to ensure the appropriate HR structure in HTC for timely and error free procurement. Due to the complexity of cold chain equipment, inadequate resources may lead to costly errors, and a bottleneck to process cost estimates and create Purchase Orders. Unfortunately, this would create a situation where consultancy support in HTC would be required to help bridge the gap. Moving forward, funding and new technologies dynamics will impact forecasting, making it more challenging to meet demand in a timely manner. LLINS As described in question 4.1, due to the overall capacity of the LLIN market, SD s poor forecast has not had a significant impact on their ability to deliver. As one supplier said, There is no problem with the current way of 66
67 working. We could meet all requirements. UNICEF is one of the most important clients for us, so UNICEF's order we always make a priority. Even for large orders we are able to meet the delivery time at a good price because we have sufficient production capacity. This situation is not likely to hold, which indicates that the repercussions of a poor forecast will shift based on new market dynamics. A second supplier indicated that it would be very helpful if UNICEF would provide the same quarter per quarter update that Global Fund currently provides on the order volumes placed with all suppliers per country. ESSENTIAL MEDICINES, ARVS, ACTS Although the market share of UNICEF SD in terms of essential medicines is limited, the lack of forecast puts SD in a position where it is largely reactive to country requests. These often come in the form of large orders, and SD is unable to make reliable agreements with suppliers. According to suppliers, when production capacity is tight and unexpected orders are received, they will try to provide UNICEF the requested lead time (even for small quantities), because of the work that UNICEF does. However, at times it is not possible due to other requirements from NGOs. SD s market share of ARVs is also quite limited. Nevertheless, SD currently provides 2-year historical data per purchased product as well as the total number of packs expected for current bids (combining the different presentations per product). This information is very helpful for production planning, and pricing. Without this information we would be completely in the dark. No one could fulfill an order for 1 million packs in 4 weeks, but at least if we have advance knowledge we can plan the raw materials and packing materials and suggest good pricing. SD has also begun sharing projections of ARV demand for the upcoming 2-3 quarters. Although suppliers receive a global forecast from Supply Chain Management System (SCMS), they find that the UNICEF projections are helpful. Although UNICEF makes up a small volume of ACT procurement, particularly for artesunate injection, one supplier informed us that the forecast provided in the tender from UNICEF was used to block capacity. Due to the fact that the demand for injectable ACTs outstrips current market capacity, there is little risk to UNICEF s forecast as any remaining quantities will be used to meet demand elsewhere. However, for other products such as the noninjectable ACTs, suppliers may arrange a batch for the product. If UNICEF is unable to procure the entirety of the batch the supplier may be left holding stock with a declining shelf life. Recently UNICEF has also begun sharing its projections of ACT demand for the upcoming 2-3 quarters with LTA holders. Suppliers perceived this as useful in order to calculate anticipated future sales and perform necessary management of product adjustment. RUTF For Nutrition the demand plan has the most impact for RUTF and Vitamin A as UNICEF SD aggregates global demand for both products. As mentioned, specifically for RUTF, SD s forecast has been a key enabler of delivering supplies at the right price, right place, and right time. A lack of a forecast would have made these objectives difficult or impossible to achieve. Suppliers are pushing for more visibility in terms of the timing of short-term demand, at a minimum in the upcoming 2-3 months. Due to funding uncertainty, it has been difficult to provide especially when dealing with a much larger supplier base. Better insight into demand would allow manufacturers to more efficiently procure raw materials and perhaps reduce the need to store raw materials in bulk. RUTF is included on the ESL and about 20% of all orders are for Emergency Response. Nevertheless, it was noted in the 2015 Procurement Strategy that the ESL quantity in particular for emergency response was inadequate at 1,467 cartons, while monthly emergency orders reached over 19,000 cartons in 2013 (with the average order size of 3,625 cartons more than double the ESL quantity). Without a solid forecast of demand buffer, stock levels at suppliers have been inadequate to meet emergency demand without delay. WATER, SANITATION & EDUCATION The current consequences of a lack of forecast for Water Sanitation or Education products is that demand cannot always be met, or cannot be met in a timely manner especially for emergency response. Currently the calculation of safety stock levels and replenishment orders is made based on historical data, and not based on any intelligence 67
68 coming from COs. As previously discussed, there are also inherent risks in the replenishment policy, which does not designate a reorder point separate from the safety stock level. For regular programmes in country, this did not seem to have significant repercussions. However, for emergency missions, interviewees expressed that there is a need to increase stock levels for strategic WASH products in Copenhagen. Water and Sanitation supplies are a challenge to get but Copenhagen hasn t been able to deliver [from their stock] so they had to go as far as Bangladesh. For Education kits, which have long lead times and are bound by branding and international procurement standards, a forecast made based on historical purchases may not be sufficient to meet demand that is increasingly based on project based funding. Even with early intelligence, until there is a willingness to incorporate it into planning parameters, the consequence will remain the same, demand will not always be able to be met or will not be met in a timely manner. INVENTORY & REPLENISHMENT PLANNING A poor or lack of forecast may not necessarily negatively impact service levels due to replenishment logic, the consolidation policy (an entire order may be delayed waiting for missing products), as well as the current system (does not properly project the forecast). Moreover, the high variability of demand for warehouse items also brings the suitability of forecasting into question. As one interviewee stated, We often feel like we are buying against a moving target. Despite reviewing safety stock level and setting up LTAs, etc. there is still the need to do crash procurement with higher prices from wholesalers, etc. More flexible supplier agreements, an increase in regional LTAs, and an increase in strategically held safety stocks would result in a higher service level to both Programme and PS recipients. Currently, there is no forecast made for ESL items. The consequence is that regular safety stocks are consumed by emergency orders, resulting in lower service levels for regular programmes. In addition, the Evaluation of SD Emergency Response found that the effectiveness of SD in delivering the needed supplies to support COs on time and in the right quantity fell consistently short of meeting UNICEF targets and commitments established in the CCCs. Our data analysis supports this claim, as the total average lead time for Emergency Orders between 2012 and 2014 was 38 days from SO Creation Date to Actual PGI Date. It should also be noted that there is a difference between how average lead time was calculated in our analysis and the way that SD calculates their KPIs. 4.3 WHAT IS THE IMPACT OF FORECASTING ON INFLUENCING MARKETS? In order to further understand the impact of their forecasting processes, SD requested insight into the specific impact that their forecast has on influencing markets. Taken at its broadest level, this question asks to what extent UNICEF SD s forecasting maximizes public health impact. This assessment focused on UNICEF s influence specifically for vaccines, and utilizes the framework developed in USAID s Healthy Markets for Global Health: A Market Shaping Primer which categorizes the market shaping intervention options. According to the Primer market shaping interventions typically use three types of levers. 1. Reduce transaction costs 2. Increase market information 3. Balance supplier and buyer risks UNICEF SD utilizes all three of these levers in their market shaping interventions. As the below figure illustrates the market shaping intervention options that address these main root-causes are varied. It can be argued as well, that although not included below, SD reduces supplier risks in the short to medium-term through their monthly Supplier Reports and other ad hoc communication. 68

69 Figure 33 Market Shaping Intervention Options POOLED PROCUREMENT The primary mechanism through which UNICEF SD s forecast has an influence on the market is in pooled procurement and coordinated ordering. Through pooled procurement and coordinated ordering UNICEF reduces overall costs (product and transaction costs) and increases market information (through a publically accessible database of prices paid). The SD s market shaping objectives are outlined in a comprehensive Procurement Strategy document. As one interviewee remarked, The Procurement Centers push the market shaping through the Procurement Strategy. Through the release of Market Landscape Reports and Influencing Markets Reports, they increase market information and contribute to balancing supplier and buyer risks. INDUSTRY CONSULTATIONS UNICEF also hosts industry consultations. Suppliers and partners unanimously expressed that they were a valuable exercise and an opportunity for suppliers to gain insight into upcoming demand. Suppliers and partners do not see the industry consultations as an opportunity to engage in pointed questions, or detailed discussions on assumptions within the forecast. To this end, additional bilateral sessions were recommended, as well as the continuation of the annual bilateral meetings between Gavi Secretariat, Gates, and SD. SUPPLIER MANAGEMENT Although not included in the figure of Market Shaping Intervention Options above, UNICEF also plays a role in the shorter term balancing of supply and demand with suppliers. UNICEF s critical role in supplier management was recognized and valued by their partners. Many expressed that UNICEF s day-to-day perspective and understanding of manufacturers challenges was invaluable. Suppliers also recognized the value of the UNICEF forecast and most indicated that the monthly Supplier Reports were critical to short to medium-term decision making. SHAPING DEMAND DOWNSTREAM UNICEF s forecast could play a larger role in shaping the market downstream. As market shortcomings can also be caused by a lack of awareness among end users, providers and influencers, UNICEF SD is certainly in a position through their presence and interaction with countries to influence the transition to new products. With a structured process in place to address innovation in the market SD could play a larger role in shaping demand through the forecast exercise and educating countries to understand the tradeoffs. SUMMARY: UNICEF SD plays a key role in influencing the vaccine market. They achieve this primarily through their pooled procurement mechanism, industry consultations and tender forecasts, as well as the valuable role they play in balancing short-term supply and demand. UNICEF SD could play a more proactive role in shaping demand and influencing the market downstream by educating countries on product transitions, which would also improve the performance of the forecast itself. 69
70 SUMMARY OF FINDINGS & RECOMMENDATIONS The findings that are summarized in the figure below have been translated into a number of key areas for improvement. To address these gaps, 12 concrete and actionable recommendations to improve the demand planning processes within SD are provided. Per request of SD, the recommendations are not prioritized, and also contain different options for consideration. Figure 34 Summary of Findings per Assessment Question Q1. What are the demand planning processes and objectives within UNICEF SD? Planning process Cross- Cutting Findings The different planning processes are categorized as: Strategic Planning/Annual Budgeting, Product Demand Planning (Tactical and Strategic), and Inventory and Replenishment Planning In general, there is clarity on the purpose, process, roles and responsibilities at SD level, although clarification of the inventory and replenishment planning processes is necessary, as well as, further documentation on the development of the PS forecast, and forecasting done outside the Annual CO Forecast At the CO level some COs stressed the need for more education regarding the importance of the forecast to Supply Division, while others conveyed that all stakeholders understood and saw the benefit in the process PD has a good understanding of the purpose and the process of demand planning, but raised the question about whether SD s measurement of success should be further down the supply chain. In addition, the role of SD and COs can play in challenging the forecast to prevent oversupplying the market was raised PD also indicated that SD could play a larger role to develop supply scenarios for high risk countries, including decisions on what stock to hold where Additional support from SD was requested for general capacity building and education in terms of demand planning within the CO and in country counterparts, particularly for the Annual CO Forecast tool (Immunization) Support was also requested for demand planning for products that are not formally forecasted by SD To mitigate the reliance on the forecast and increase response times, COs also requested that SD increase the number of LTAs at a regional or local level, and assist COs to build up the local supplier base Feedback from ITU, BUs and suppliers suggests that the extent to which product forecasting is informing ITU planning and activities is limited, and typically only takes place when there is a major project. Allowing 3PLs to have more visibility on upcoming POs will likely reduce the lead time and decrease costly shipment expeditions Q2. What are the quality and effectiveness of current demand planning processes? Planning process Cross- Cutting PS Forecast Findings There is currently not a process in place to structurally identify what to forecast, on what level, and using what method. Generally, products with a suitable demand profile are forecasted by UNICEF. Given the high CoV most products forecasted require significant involvement and additional intelligence from contract managers Inconsistent forecast performance metrics across PCs make it difficult to understand and compare performance. As forecast accuracy reports do not contain root-cause analysis, incorporating this intelligence in the subsequent forecasts is unlikely to occur in a consistent manner The most common reason for deviations between forecast and actual demand cited was the availability and timing of funding Other common explanations for forecast inaccuracy were due to: misalignment with Gavi or other partner processes; countries that do not include their demand in the UNICEF forecast, but procure through UNICEF because they are unable to self-procure; programmatic objectives not met; changes in programmatic strategy or underlying assumptions; delays in new product introductions; the inability of the supplier market to provide needed quantities; disease outbreaks or disaster (conflict or natural) Through qualitative interviews it was clear that SD makes considerable effort to gather available intelligence. However, it is not certain that all available intelligence is being meaningfully incorporated into the forecast, nor that historical data is being used to the full potential Alignment with changes in partnership demands and processes is an important component of SD demand planning, and considering the large percentage of Gavi funded demand, there is a strong interdependency between SD and Gavi A more suitable demand planning tool would increase effectiveness by linking the forecast with the ERP, and consolidating information currently captured in different Excel sheets and s, which would facilitate easier data analysis (with consistency in Master Data) as well as leverage the reporting capabilities of a (global) ERP The total non-gavi forecast accuracy across commodity groups was relatively good in 2013 and 2014 ranging from 81% to 87% and had a positive forecast bias between 13% and 19% which indicates that during this time period there was a slight tendency to over forecast The four top value commodity groups represent on average in this time period 89% of total value. Three of the top four value commodity groups have good performance, while New Vaccines had low forecast accuracy It is important to recognize that improvements made to the demand planning of individual products will logically translate into an improved PS forecast 70
71 Tender Forecast Annual CO Forecast (Vaccines, Devices, CCE) Given that the portion of non-gavi PS value is less than half of total procured value, and no evidence could be provided of when the PS forecast did not meet its objectives, the process, tool (Excel) and method is suitable for the purpose intended, and the accuracy of the forecast is sufficient The tender forecast is perceived as a useful indicator of the demand and is typically one source of information used by suppliers for strategic decision-making Most suppliers use LTA awarded quantity as an input in their own planning, often incorporating other sources of intelligence such as historical demand on top of SD s quantities The weak performance of new and transitioning vaccines, as well as vaccines used in campaigns, resulting in poor LTA forecasts continues to be a challenge having a negative impact on suppliers ability to deliver in a timely and cost-efficient manner The number and size of amendments to the LTAs reviewed, especially for vaccines, indicate that allocated quantities are typically adjusted although the impact is mitigated through regular updates and good communication Suppliers view the LTA quantities as a guide, but often will make their own planning assumptions based on past experience with UNICEF, and typically view an increase in LTA quantities very favourably. Most suppliers indicated that UNICEF came very close to meeting, if not exceeding LTA quantities The process to produce a forecast for tenders varies depending on the nature of the product, but generally utilizes existing sources of intelligence effectively in a suitable process For some products, the tender process requires additional input and alignment with key partners, while for other products the Annual CO Forecast or historical off-take is the primary input. For products that are also held in inventory the process, and owner of the tender forecast was unclear In addition to industry consultations there is room for a forum where more in depth alignment between UNICEF, key suppliers and Partners (Gavi) on the forecast can take place For both routine and supplementary, a country s ability to forecast the timing of the following year s demand (per month) is quite low For some commodities (i.e. vaccines used in the eradication of Polio), the Annual CO Forecast is not the main source of intelligence Both factors necessitate follow up with COs, partners, donors and suppliers to match demand and supply The repository for the most up-to-date demand intelligence is the Allocation Table. Based on the Allocation Table, monthly Supplier Reports are generated and shared with LTA holders in order to provide more reliable information on short- to medium-term demand, which suppliers appreciated The inability of COs to forecast timing of demand throughout the year means that contract managers must follow up with COs, partners and donors throughout the year For some products the Annual CO Forecast is not a suitable process to gather intelligence SD does not employ mathematical models to predict vaccine requirements which may be the most suitable and efficient method for certain vaccines, especially for campaigns and outbreaks as well as emergency stockpiles There may be an opportunity to leverage intelligence of programmatic experts and epidemiologists such as the Global Polio eradication initiative, the Measles Rubella Initiative, the Global Cholera working group, and International Coordinating Group for Meningitis Vaccines SD makes considerable effort to gather available intelligence, and understand the drivers of demand Nevertheless, it is not certain that all available intelligence is being meaningfully incorporated into the demand planning process, nor that historical data is being used to the full potential Currently the forecast and day-to-day management of supply and demand is managed in Excel and not linked with the global ERP, VISION. Information is captured in different Excel sheets and s which does not facilitate analysis, and is not always consistent with Master Data Forecast accuracy reports do not contain root-cause analysis which means that incorporating this intelligence in subsequent demand planning processes is unlikely to occur in a consistent manner The repository for demand intelligence (the Allocation Table) is written over as the demand and forecast evolve over time and does not capture longer-term intelligence if available Given that the forecast (performance) for devices is closely linked to the forecast of vaccines, the current process which combines the two product categories is suitable, however CCE less so Annual forecast accuracy for cold chain equipment is very low, which means time-bound LTAs are used Historically there has been a heavy reliance on the Annual CO Forecast, although funding has an enormous impact on what need will be realized and COs are often not in the best position to know about potential funding HTC aims to generate a global picture of CCE need and demand, although the effectiveness could not be measured Due to low visibility of upcoming demand, no regular updates are provided to CCE suppliers Considering the evolving landscape of CCCE (new funding, the availability of new innovative technologies, and specifically funding that is earmarked for these new cold chain technologies) the forecasting purpose could be achieved through alternative processes and methods To achieve the objectives requires a method to triangulate and leverage historical procurement data plus outside data sources (PATH, EVM, CCE assessments) and mine country data only if and when necessary An effective and suitable process must involve close and improved collaboration with Gavi (particularly to understand the funding model used) and other CCE partners 71
72 LLIN Forecast Nutrition Forecast Inventory & Replenishment Planning The CCE demand planning process also relies on very close alignment with countries to follow the decisions that are made in response to available funds, new technologies, and redesign of in-country supply chains Annual forecast accuracy for cold chain equipment is very low, which means time-bound LTAs are used Historically there has been a heavy reliance on the Annual CO Forecast, although funding has an enormous impact on what need will be realized and COs are often not in the best position to know about potential funding HTC aims to generate a global picture of CCE need and demand, although effectiveness could not be measured Due to low visibility of upcoming demand, no regular updates are provided to suppliers The forecasting process is no longer suitable, especially giving the changing LLIN landscape (Global Fund pooling procurement) A lighter process that focuses on the 10 highest malaria burden countries and key partners (UNDP) would be more suitable The process should also focus on alignment with Global Fund and PMI. This alignment is critical to avoid overlap and provide clarity to suppliers about the logic and assumptions made in the forecast The RUTF forecast has been instrumental in increasing the supplier base, but now faces the challenge of awarding the right LTA quantities across suppliers and increasing the visibility of the timing of orders throughout the year to ensure that the forecast enables timely delivery of the right quantity at the right price Currently no supplier updates are sent throughout the year. Suppliers noted that a better quality forecast or more visibility of upcoming demand (i.e. in the form of quarterly outlooks) from SD would result in higher delivery reliability and lower prices SD also conducts an annual demand planning process for CMAM commodities, including RUTF, via an online platform, NutriDash The forecasting process, tool and method are largely suitable Although the CMAM forecast is a useful cross-check in the creation of the bid forecast, COs struggle to predict the timing of demand, and the current investment of time and effort in this process does not justify its value To improve the CMAM demand planning performance the CO forecast could be better mined, however the BU currently lacks the bandwidth The forecast for select (non-esl) items has no discernible impact on service level (per the Warehouse s own analysis) in part due to other factors that play a more significant role in the warehouse s ability to conduct demand planning and forecasting o System set up does not allocate stock properly to SOs, nor properly roll up kits, nor consume the forecast correctly o Overall WH policy is to consolidate orders which significantly reduce delivery reliability Given high CoV of products increasing stock levels and/or increasing flexible supplier arrangements may be more effective and suitable (and require less time investment) WH would benefit from better insight into upcoming demand, either through annual demand / shipment plans from COs, or making use of SAP s flexible planning functionality The forecasting tool is currently not linked with SAP. SAP s functionalities are not fully utilized The current process, tool(s) and methods are not suited for the purpose intended. There is a need for appropriate stock and replenishment policies facilitated by the appropriate system The method of calculating ESL stock levels puts UNICEF at risk of not providing timely and appropriate emergency response, and due to the overlapping product portfolio with regular safety stocks may have an adverse effect on SD s ability to serve regular demand in a timely manner The current replenishment policy, and confusion over the existence of a financial stock limit, increase the likelihood of overstocking on certain items, and stocking out on others More flexible supplier agreements, an increase in regional LTAs, and an increase in strategically held safety stocks would likely result in a higher service level to both Programme and PS recipients Q3. What is the efficiency of current demand planning processes? Planning process Cross- Cutting PS Forecast Tender Forecast Findings Our analysis indicates that the amount of time spent on core demand planning processes is on par with benchmark companies for a similar number of SKUs There are opportunities for SD to better utilize existing capacity, as well as areas where SD s skill set could be enhanced There is also an opportunity to consider a shared service model that would assist in setting standards and supporting across the PCs. The organizational structure chosen will also impact the capacity and skill sets necessary within individual units The PS Country and Partner Forecast process, coordinated by the PSC attempts to capture approximately 11% of PS value from COs, but provides limited insight to BUs when generating the PS forecast, and may instead be a source of confusion and inefficiency. Global Partner input, on the other hand, is an important component and UNDP forecast accuracy is measured through the bilateral scorecard There appear to be opportunities to streamline the tender process to reduce the total time line and complete the process in a timely manner that facilitates supplier planning Interviewees internal and external to SD commented that the timeline between commencing a tender and finalizing the LTA, were quite lengthy, up to 12 months, and often not done in a timely manner 72
73 Annual CO Forecast (Vaccines, Devices, CCE) LLIN Forecast Nutrition Forecast Inventory Planning Replenishment Planning Although the time spent to formally amend LTA awards may be inevitable, suppliers also indicated that there was room to improve the process and timeliness of LTA amendments A web-based system linked with VISION would allow contract managers and relevant country counterparts to more efficiently exchange feedback directly with greater access to past forecasts, historical procurement figures and other intelligence Targeting top countries forecast for review and accepting the remaining forecasts as is would increase efficiency likely without impact to overall forecast accuracy There may be opportunities to increase efficiency within vaccine and device demand planning by leveraging existing demand projections within a country s own plans, and improving the alignment of the timing of Gavi Decision Letters, which are currently consulted but are often issued by Gavi very late in the process. Gavi decision quantities may then be used to pre-populate the country forecast sheet UNICEF SD has recognized an opportunity to increase efficiency through better alignment of current processes and easier exchange of data between UNICEF SD and the Gavi Secretariat SD and Gavi have established a working group aimed to review potential efficiency gains in device procurement In 2015, HTC will review the forecast from the top 20 countries and accept as is the remaining 80 forecasts. They have also planned sessions with key countries, and key partners to understand their annual plans An alternative approach to quantifying demand, as described in question 2, would increase both the efficiency and effectiveness of the Cold Chain forecast Alternative, more efficient methods to forecast LLINs, and creating close link with other groups (e.g. Roll Back Malaria Harmonization Working Group) that are closely tracking country LLIN needs should be pursued especially in light of the low forecast accuracy Until the data collected can provide value, the efficiency of collecting a forecast from COs through NutriDash, as well as producing a forecast based on historical off-takes in order to inform industry is limited. If the information collected is not useful for developing the PSC forecast, it is inefficient to continue collecting it Within NutriDash there may be room for further efficiency in the process to launch the forecast exercise, as there are multiple handoffs which can result in delays before the forecast form arrives at the CO Nutritionist The process of setting and reviewing safety stock levels requires considerable manual manipulation of data that decreases the efficiency of the process The increasing customization of kits within inventory reduces the overall efficiency of warehouse operations The process of creating the forecast for replenishment planning requires considerable manual manipulation of data that, combined with system limitations, decreases the efficiency of the process Q4. What is the impact of the current demand planning processes? Planning process Annual CO Forecast (Vaccines, Devices, CCE) LLIN Forecast Nutrition Forecast Findings For vaccines and devices, the tender forecast and industry consultations are an important component of suppliers strategic decision making The LTA is a useful indication of the portion of the total market demand that an individual supplier can expect to receive, and suppliers use the awarded quantity as a baseline in their own planning, often incorporating other sources of intelligence such as historical demand on top of SD s quantities. The ability to plan based on LTA quantities and knowledge of UNICEF s demand patterns allows suppliers to offer a lower price A short- to medium-term forecast is critical for manufacturers to optimally plan production, and the quality of the forecast has a direct influence on the price that the suppliers are able to offer UNICEF. For certain commodities (select non-routine vaccines, LLINs and RUTF), suppliers noted that a better quality forecast, or more visibility of upcoming demand (i.e. in the form of quarterly outlooks) would result in higher delivery reliability and lower price Ways to increase flexibility and decrease the reliance on the forecast such as standardization, reduced shelf life requirements, and good communication are seen as equally important factors in the demand planning process SD plays a key role in influencing the vaccine market. They achieve this through their pooled procurement mechanism, industry consultations and tender forecasts, as well as the role they play in balancing short-term supply and demand. Their strong link with Country Offices means that they can be very reactive to demand signals SD could play a more proactive role in shaping demand and influencing the market downstream by educating countries on product transitions, which would also improve the performance of the forecast itself Given the recent changes in the LLIN landscape, UNICEF s forecast plays less of a role in enabling SD to deliver LLINs at the right price, time and place. However, the current capacity on the market combined with SD s push for standardization reduces the need for a highly accurate forecast, and typically allows supplies to be delivered at the right place and at the right time The RUTF forecast has been instrumental in increasing the supplier base, but now faces the challenge of awarding the right LTA quantities across suppliers and increasing the visibility of the timing of orders throughout the year to ensure that the forecast enables timely delivery of the right quantity at the right price 73
74 Inventory & Replenishment Planning Currently the forecast made by WH does not play a key role in enabling supplies to be delivered at the right time, place and price Having a poor or non-existent forecast may not necessarily have a negative impact on service levels given the replenishment logic, the policy of consolidation, and the current system which does not properly consume the forecast, nor allocate stock properly Moreover, given the high variability of demand for warehouse items it is questionable whether forecasting is suitable Inappropriate ESL stock levels may mean that regular safety stocks are consumed by emergency orders, resulting in lower service levels, low delivery reliability and long lead times for both emergency and regular programmes 74
75 RECOMMENDATION 1: DEFINE DEMAND PLANNING REQUIREMENTS AND STRATEGY Conclusion: SD lacks an overall demand planning strategy consisting of a structured approach to determine their demand planning requirements, and a suitable demand planning process (i.e. which products to forecast, which technique to use, and the necessary characteristics for the forecast such as timeframe, or level of granularity). Recommendations Apply a set of generic guidelines as described in the Forecasting Framework to structurally define the demand planning requirements and the most efficient and effective demand planning process that addresses both strategic and tactical needs. On an annual basis PCs should review their product portfolio to evaluate and justify which products should be forecasted at what level. Mechanisms that reduce reliance on the forecast should be explored if and when possible. For suppliers examples include product standardization (which allows suppliers to pool demand and reduces risk of making of stock), or reduced requirements for shelf life (which also reduce the risk of suppliers producing to stock, or the cost to suppliers of an inaccurate forecast). Maintaining relationships with suppliers also increases the willingness of suppliers to exhibit flexibility, as well as their confidence to produce based on 'unconfirmed' information. For COs and partners, to mitigate the reliance on a forecast and increase response times, SD should also consider increasing the number of LTAs at a regional or local level, and assisting COs to build up the local supplier base. RECOMMENDATION 2: REFINE DEMAND PLANNING ORGANIZATIONAL STRUCTURE Conclusion: Currently within SD, demand planning activities are decentralized within the individual PCs, and for some PCs within individual BUs. For the most part, considering the high-level of involvement necessary from contract managers, as well as the current demand planning processes which are facilitated through separate Excel tools, this is logical. As SD moves towards a unified planning tool accessible by all and a more deliberate focus by contract managers on key demand drivers, there is an opportunity to consider a shared service model that would assist in setting standards and supporting across the PCs and different units. It would also contain specific expertise in areas where SD is currently lacking such as generating long-term or new product forecasts. Recommendations Consider the creation of a central demand planning unit responsible for setting standards and assisting PCs with longer-term forecasts as well as activities such as: data cleansing, master data management, statistical forecasting, reporting, and identification of attention points. SD could also consider further decentralizing the demand planning process by creating a role at the regional level focused on consolidating and challenging CO forecasts. The Regional Forecast would then be submitted to SD for review. A stronger regional supply presence can also serve as an extension of SD in providing support to COs. Based on the organizational structure, SD should then determine gaps in individual staff members capacity so that contract officers and managers can receive the necessary training on demand planning methodologies. RECOMMENDATION 3: IMPLEMENT STRUCTURED AND FOCUSED DRUM BEAT Conclusion: The qualitative and quantitative evidence gained through the assessment, as well as the identification of key drivers of forecast inaccuracy, made it clear that a significant portion of SD s demand has high variability and requires ongoing efforts to incorporate intelligence from multiple sources. To most effectively and efficiently structure the demand planning process, SD needs to focus efforts on the most critical dimensions (i.e. country, donor, partner, or product), and reduce time spent on low value activities. HTC and Nutrition are leading the way in this area and can be taken as an internal best practice HTC Immunization Devices has identified top 5 countries (in terms of demand) and devote extra time and attention to these countries, including face to face meetings to discuss importance of the forecast. They also piggy back off of SC Strengthening team in order to train and sensitize people on the importance of forecasting. Additionally they have bundled solution through a combined product RFP based on mapping of historical demand and supplier products and more in line with programmatic needs and are exploring how industry could offset long lead times with local stock piles 75
76 Recommendations Identify the key countries, products, donors, partners, and drivers of forecast inaccuracy. Implement a structured communication approach for high impact countries with designated inputs and outputs and clear documentation for changes in demand projections. Continue to mine all available intelligence from key partners, and consider a forum with key partners and suppliers to discuss in further depth the longer-term forecast. Given the necessity of updates to the forecast throughout the year, a more rigorous, focused, and proactive approach to gathering insights for key products, from key COs, partners and donors would result in a better demand planning performance by ensuring demand signals are systematically incorporated in the demand planning process. RECOMMENDATION 4: IMPLEMENT ONE WEB-BASED SOURCE OF THE TRUTH LINKED WITH ERP Conclusion: The primary demand planning tool within SD is Excel (i.e. the Immunization Forecast Sheet, LLIN Forecast Sheet, PS Forecast Tool, Provisional Plans, Allocation Tables, and Country Forecast vs. Actual Demand Report). Although there are efforts to piggy-back off of the existing Annual CO Forecast, the process remains a highly manual, inefficient, and ultimately less effective tool to support the demand planning process within SD. The Annual CO Forecast tool may change hands as many as 35 times throughout the entire process from initiation until finalization of the forecast. Countries wishing to refer to historical data are forced to look through multiple documents (and s) as there is no single source of the truth. Recommendations Implement a web-based demand planning system linked with the global ERP that allows contract managers and relevant country counterparts to more efficiently and directly exchange feedback with greater access to past forecasts, historical procurement figures, root-cause of forecast inaccuracy and other intelligence. A web-based system can also leverage existing initiatives (such as VIVA) and potentially extend to include data sources outside of UNICEF such as Gavi Decision Letter quantities. In addition, we recommend to clean up the material master as indicated in Step 1 of the process for demand planning in the Forecasting Framework and ensure that only the master data team can change core fields. If SD decides against a fully integrated system we recommend a defined Planning Hierarchy that is consistently referred to across PCs (forecasting tools, allocation tables, ERP) and the use of material numbers in the Forecasting Tool, to ensure clarity on the product that is requested. RECOMMENDATION 5: STANDARDIZE PERFORMANCE METRICS AND CONDUCT ROOT-CAUSE ANALYSIS Conclusion: Inconsistent forecast performance metrics across PCs make it difficult to understand and compare performance. There is a duplication of effort across PCs as each calculates their own forecast performance. Moreover, forecast accuracy reports do not contain a root-cause analysis making learning from past sources of inaccuracy difficult. Even if root-causes analysis has been conducted, without a system to document this information, it is often kept in individual documents and not fed into future forecasts. Forecast accuracy (root-cause) reports are not shared regularly with Management Team/Directors Office or relevant stakeholders. Recommendations Standardize the metrics used to report on forecasting performance. Recommended metrics are described in the Forecasting Framework. Conduct a root-cause analysis for demand planning inaccuracies and clearly document reasons for deviation on a quarterly basis. Demand planning performance metrics and explanations for deviations should be shared quarterly with the Management Team/Directors Office, COs and any other relevant stakeholders. RECOMMENDATION 6: IMPROVE ALIGNMENT WITH GAVI Conclusion: As the quality of the forecast is heavily impacted by the availability and timing funding, alignment with changes in partnership demands and processes is a very important component of SD demand planning. UNICEF s main partner (in terms of procurement value) is undoubtedly Gavi, who not only makes up approximately 35% of SD procurement value, but also plays a major role in vaccine demand aggregation, policy and market shaping 76
77 for the vast majority of vaccines procured through UNICEF. More recently, it has provided funding for cold chain equipment, particularly innovative solutions. Currently, both organizations are committed to addressing areas for better collaboration, and ultimately more effective and efficient processes. The three ongoing improvement initiatives for immunization aim to: 1. Optimize the process for communicating and authorization 2. Improve the Operational Forecast 3. Improve the efficiency of device procurement While finalizing this assessment agreement was reached with Gavi to modify their process and communicate the final approved quantities for the following year by September (in advance of the Annual CO Forecast exercise), which will help to mitigate a significant portion of uncertainty within the demand planning process. Very recently, there have also been substantial developments in the CCE landscape that have an impact on the approach for demand planning CCE. Gavi has announced a pool of additional funding commencing in 2016 for a period of 5 years earmarked for innovative cold chain technologies. This alone is anticipated to cause a significant market disruption. SD recognizes that it is absolutely critical to stay very close to Gavi and other partners, and increase the collaboration between the CCE players. One of the three working groups that has been set up focuses specifically on understanding the Gavi processes, and the implications of the co-investment funding model. Recommendations SD should continue to place a high priority on optimizing the process for communication and authorization for the immunization forecast. Given the recent agreement with Gavi to provide final approved quantities by September, SD should consider prepopulating country forecast sheets where applicable. For CCE it will be essential to understand Gavi s processes and the implications of the co-investment funding model. Throughout all processes, to the extent possible, data systems should facilitate the dynamic flow of information and feeds into decision making processes in SD and the Gavi Secretariat. RECOMMENDATION 7: ENHANCE PROCUREMENT SERVICE FORECAST PROCESS Conclusion: There is room to increase the efficiency and rigor of the PS forecast. The CO and Partner forecast exercise (which attempts to capture approximately 11% of total PS spend) provides limited value. There is no clear documentation on steps that PCs take to produce the PS forecast. There is limited challenging of the forecast (by PSC) and no clear description of the quantitative impact of assumptions. There is no clear link between narratives accompanying the forecast and low, realistic and high scenarios. Lastly, there is misalignment between PSC s planning and budgeting and the timing of key inputs from the Annual CO Forecast. Recommendations One option to increase efficiency is to use statistical forecasting techniques to determine the forecast for product categories that are very low value and are not part of a formal demand planning process (and discontinue the Country Forecast exercise triggered by PSC). Another option would be to combine the request for high value currently non-forecasted products (i.e. ARVs) into the Annual CO Forecast. Each PC should clearly document considerations or a check list that is followed to arrive at the PS forecast, and this document should be updated as necessary. Annex 10 provides a starting point in this regard. Efforts should be made to improve the rigor and link between PS forecast figures and the associated narrative, and clearly explain the drivers of demand. PCs should show a clear breakdown of how final forecast figure for each demand scenario (low, realistic, and high) was calculated based on the drivers mentioned. The PS forecast made by the PCs should include a forecast of quantity and value in order to more easily monitor the drivers of forecast performance. In terms of governance, it makes sense to have consolidation of the PS forecast performed outside of the individual PCs as it is currently. Given that the PSC is unable to play a challenging role and that MFSDU has become a part of the process, it would be more efficient for consolidation to involve as few manual steps as possible (with PCs entering both quantity and value forecast with clearly described assumptions in an online portal), and the challenging role is 77
78 picked up solely by MFSDU. The alternative would be to assign one person who would sit in the potential "to be" shared service center, to play this role. RECOMMENDATION 8: DEFINE GLOBAL STOCK STRATEGY Conclusion: SD puts itself at unnecessary risk by not defining a global inventory strategy, and appropriate stock and replenishment policies facilitated by the appropriate system. Specifically, the current ESL logic puts UNICEF at risk of not providing timely and appropriate emergency response. The overlapping product portfolio with regular safety stocks may have an adverse effect on SD s ability to serve regular demand in a timely manner. The current replenishment policy and confusion over the existence of a financial stock limit increase the likelihood of overstocking on certain items and stocking out on others. This is reflected in the low delivery reliability and long lead times from the warehouse. In the absence of a global stock strategy, and compounded by system limitations that make it difficult to see accurate stock levels. There is a need for more clarity in terms of roles and responsibilities of the PD, PCs, and WH related to inventory management. Recommendations Define a global inventory strategy, and appropriate stock and replenishment policies for both ESL and regular safety stocks, with a clearly defined financial limit, if applicable, and clear roles and responsibilities. Defining stock levels will require a multi-stakeholder approach, with leadership involvement, and cannot be done by WH alone. Re-evaluate the logic of maintaining separate stocks especially when the two stocks contain overlapping products and cannot be separately managed in the system. Our recommendation would be to designate a desired service level per product. When establishing the strategic impact of the product, take into account if the item will be used in emergency response. Explore alternative ways to increase the delivery reliability/capability and reduce lead time such as setting up more regional LTAs, investing in local suppliers, or increasing the strategic use of warehouses outside of Copenhagen, in a holistic assessment of the supply chain network. Clearly define roles and responsibilities for adjustments to service level/stock level, determination of kit contents, decisions regarding allocation of stock in case of shortages, and decisions regarding the phase-in and/or phase-out of products. These roles and responsibilities should be agreed by management and shared with SD. RECOMMENDATION 9: RESOLVE WAREHOUSE SYSTEM CHALLENGES Conclusion: Currently only the key commodities are planned and the forecasting is executed outside the SAP system (in Smoothie). The results of the forecasting/planning are imported into the flexible planning component of the SAP system. The COs are not providing any input into the planning process. Safety stock planning is not optimal. In general, SAP is able to execute forecasting. Basic forecast models are available (constant model, trend model, seasonal model, seasonal trend model) in SAP. Furthermore, the different COs could be given access to the flexible planning functionality in SAP to provide their planning. The flexible planning component in the SAP system is quite powerful and is able to support many standard business scenarios. Sales orders are not consuming the forecast in the SAP system. Standard SAP is able to consume the forecast. Therefore, it seems the system setup is not correct. Kit products are following the make to order strategy. This means that based on the sales order a production order is created. The production order should reserve the stock required to assemble the kit in the warehouse. It seems the allocation of the stock to the sales orders/deliveries and production orders is not working as expected. Stock can be stolen from orders resulting into a situation where confirmed dates to the customers cannot be met. Furthermore, there is low visibility on the missing components for assembling kits. SAP has standard missing part functionality in production planning called the missing parts information system. SAP ERP's Missing Parts Information System is a reporting tool that alerts planners of component or spare parts shortages that could block production or maintenance. Before proceeding with production, planners can use the Missing Parts Information System to gain comprehensive visibility of the missing components that may lead to production slowdown or stoppage. 78
79 Recommendations A detailed analysis and comparison of the SAP system setup and the functionality of the external forecasting/planning system (Smoothie) should be done to decide whether the forecasting is better supported in the SAP system or the external system. Based on the decision, where to execute the forecasting/planning the other COs can be given access to either the SAP or external system forecasting and planning functionality. If Smoothie is to be continued, integrate Smoothie as a regular tool interfaced with VISION. Analysis should be done on the impact of changing the system setup in order to support the desired forecast consumption. Based on the results of the analysis develop a strategy to implement the corrections. An analysis should be done to investigate whether the missing part functionality meets the business requirements. RECOMMENDATION 10: IMPLEMENT STRUCTURED WAREHOUSE DEMAND PLANNING PROCESS Conclusion: Currently there is no mechanism to incorporate CO demand projections into the warehouse demand planning process. Although, PCs can enter planned deliveries into the MRP. Previous attempts to implement a Sales and Operations Planning cycle were ineffective due to the lack of information used to support decisions, and a pilot to approach COs for information were unsuccessful as it did not focus on key countries. A defined inventory strategy, with clear rules and responsibilities, as well as the necessary improvements in the system configurations will allow the warehouse to share the necessary information for decision making. Recommendations Define a mechanism to gain better insight into upcoming demand, either through annual demand / shipment plans from COs or making use of SAP s flexible planning functionality. Increase the focus on large potential upcoming Education projects, top Water Sanitation procuring countries, and transferring intelligence of typical demand for emergencies. Consider the WFP Forward Purchase Facility model that procures commodities in anticipation of requests from individual projects. Conduct monthly meetings between WH and PCs to show forecast, current stock position, incorporate PC intelligence, and agree on replenishment proposal (on the precondition that system issues are solved). With system fixes (stock properly allocated in the correct sequence) dashboard of stock availability should be made available to PCs (and possibly also to COs). RECOMMENDATION 11: INVEST IN CAPACITY BUILDING Conclusion: There is no doubt that improving the capacity of COs and their country counterparts will increase the efficiency and effectiveness of both in country supply chains and the entire upstream supply chain. To support this, UNICEF s objective is to move away from their more traditional service delivery role, and act as a strategic partner providing capacity development in-country. However, it was unclear what SD s approach would be, and there were questions raised about whether SD and/or COs should play a more challenging (read: critical) role throughout a country s demand planning process to increase impact. In CO interviews and VC s own survey COs often expressed that additional support from SD would be beneficial. The support requested ranged from general capacity building and education in terms of demand planning within the CO and in country counterparts, to specific guidance on the tool itself. COs also saw the need to demonstrate and sensitize people to the strategic importance of the forecast and the link between a good forecast and delivery reliability and capability. Given the heavy reliance of SD on the COs within the demand planning processes, it is important that there is clear ownership at the country level and this responsibility is incorporated into the Job Description. There are good existing efforts to increase capacity and educate key countries and partners within SD, however these efforts are fragmented, and do not form part of a cohesive strategy to address the areas of greatest need. 19 UNICEF 2020 ambitions: Excellence in Direct Delivery focused on fragile states and emergency response, Innovation and influencing markets as important drivers, Supply Community and Optimised UNICEF supply chain as hallmarks, Capacity Development and strengthening supply chains emerged, Procurement services continued for health but expanded in nutrition & new products 79
80 Recommendations Clarify the role of SD and CO to have accountability for strengthening country s demand planning processes. Develop a cross-cutting strategy for high impact countries by linking efforts made within SD (with the Supply Chain Strengthening Unit and PCs) as well as other external initiatives in a coherent approach to improve the aspects of demand planning that pose the most challenges. Clearly indicate an owner of the forecast per commodity area within COs and incorporate demand planning/forecasting in the Job Description. RECOMMENDATION 12: MAINTAIN AND INCREASE INVOLVEMENT BETWEEN SD AND PROGRAMME Conclusion: Significant efforts have been made to better integrate Programme and Supply, especially as related to the Immunization Forecast, or Nutrition that has very close collaboration with Programmatic side through an integrated web-based platform. Continuing to strengthen and institute this link is key to successful demand planning. One suggestion from PD was to focus on certain high risk countries and have a programmatic and supply discussion of implications of projected supply scenarios. Using a risk based scenario SD can then decide how to meet the demand. Currently there is no forum for these kind of discussions. Another suggestion from COs was for SD to work more closely with CO programme especially for trainings. Recommendations SD should maintain and increase their presence in Programmatic discussions in order to bring supply constraints into the discussions at the earliest possible stage, as well as integrate this intelligence when reviewing country forecasts. A few concrete recommendations in this regard would be to: Increase Programme involvement in key steps of generating a Procurement Strategy Ensure consistent representation at industry meetings Ensure that CO programme is included in SD training opportunities Create a forum where programme and supply can discuss high risk countries and projected supply scenarios Maintain close alignment in determination of kits and kit contents 80
81 ASSESSMENT LIMITATION & AREAS FOR FURTHER ASSESSMENT For vaccines and devices, the measurements of forecast accuracy and bias compared the Y+1 forecast to actual shipments within the same year. Although this does provide an indication of the quality of the forecast at that point of time or the ability of countries to forecast the exact timing of demand throughout the year (which feeds into the tender forecast) it does not provide a good indication of the quality of the tactical demand planning and updates received by suppliers. The repository for demand intelligence gathered throughout the year (the Allocation Table) is written over as the demand and forecast evolve. It is this file that forms the basis of the monthly Supplier Reports that are provided to vaccine and immunization device LTA holders. The assessment was unable to measure the accuracy of these demand projections throughout the year, but relied on the qualitative input of suppliers to ascertain their value. The quantitative assessment of demand planning performance does not capture product substitutions. For example, if a forecast was made for MR-5, but the equivalent amount of MR-10 was shipped, one could claim that the forecast was accurate and demand was met. How demand planning and forecasting can be better used to support emergency preparedness and response, and specifically the role that SD could play, was not explored in this assessment. It would be an interesting area for SD to explore further to gather additional insight. There are several areas for further assessment that fall outside the boundaries of demand planning, but are included in the recommendations as they impact demand planning processes. One area in particular pertains to the creation of a global stock strategy. Currently SD is not strategic in the stock that it holds in its warehouses, and lacks clear inventory and replenishment policies. As was noted under question 1.4, feedback from ITU, BUs and suppliers suggests that the extent to which product forecasting is informing ITU planning and activities is limited. Typically, it takes place only when there is a major project. Further assessment about how to increase the visibility on upcoming POs to logistics service providers would likely reduce the lead time and decrease costly shipment expeditions. Another area for further assessment relates to tenders themselves. Both suppliers and partners indicated that having a more diverse and tailored tender approach and format could be appropriate going forward. 81
82 ANNEXES ANNEX 1: ABBREVIATED METHODOLOGY The Institutional Assessment was conducted in two phases, the Inception phase and the Assessment phase. The purpose of the Inception phase was to gain an initial understanding of UNICEF s demand planning processes and provide a methodology for addressing the assessment questions. The Assessment phase leveraged multiple methodologies utilizing both quantitative and qualitative analysis, which is briefly summarized below. For the full methodology please refer to the Inception Report. The qualitative element consisted of: 1. Desk review of key documents: a. UNICEF Strategic Plan b. Supply Division OMP c. Integrated Budget d. Annual Reports (UNICEF, SD) e. 1 page Vision for UNICEF s supply function f. The Supply Manual g. Relevant Division Procedures h. Support documents developed for immunization forecast i. Select tender and LTA documentation j. Procurement Strategies k. Previous Assessments (i.e Evaluation of UNICEF Supply Function, Procurement Services Consultancy Report) 2. Semi-structured interviews with numerous stakeholders (full list provided below) from Supply Division (SD), its Procurement Centres (PC), Procurement Services Centre (PSC), and the Warehouse (WH) during two visits to the SD office in Copenhagen to: a. Obtain a detailed understanding of SD s forecasting processes, including activities, methods and tools, and roles and responsibilities b. Understand of how commodities are used programmatically c. Gather insights into internal and external demand drivers d. Gather contextual background into selected Country Offices (COs) 3. Semi-structured interviews with representatives from different Business Units (BUs) from selected in-scope COs (full list provided below), as well as Regional Supply Officers, and representatives from different sections from PD to: a. Gather insight in their understanding of SD s forecasting processes b. Obtain an understanding of their roles and responsibilities in this process, and their view on the effectiveness, efficiency, and impact of the process 4. Semi-structured interviews with stakeholders from Gavi and BMGF with the aim to understand the level of collaboration between Gavi, BMGF, and UNICEF SD in the forecasting process and the impact of SD s forecast on the market. 5. Semi-structured interviews with suppliers (vaccines, devices, LLINs, RUTF, ARV, ACTs) to get an understanding of the value and impact of UNICEF s forecast The quantitative portion consisted of: 1. Extensive data collection and analysis of forecast, order, stock, and shipment data (if available) for all PCs, PSC, and WH 82
83 2. Data validation sessions with VC, HTC, WH, and the data team to understand the collected data and validated assumptions 3. Consolidation of the data in one tool and subsequent calculation of demand planning performance on different dimensions and different aggregation levels using aligned performance metrics 4. Data collection and analysis of the time involved with the different demand planning processes 5. Data collection and analysis of tenders and associated LTAs to gather insight into the performance of the forecast within the LTAs Figure 35 List of CO Interviewees Country Interviewee Position Bangladesh Democratic Republic of Congo Egypt Ethiopia Mozambique Nigeria Carlos Neira Farhana Huq Pascal Villeneuve Erinna Dia Eric Alain Ategbo Rija Andriamihantanirina Karl Friedrich Stahl Maryline Orsini Magdy el Sanady Nevine Essam Allam Srikanth Srinivasan Dereje Muluneh Tariku Berhanu Sirgut Mulatu Kidist Negash Yalda Momeni Jan Debyser Onei Andre Uetela Iris Uyttersprot Dr. Aboubacar Kampo Bervery Chawaguta Kannan Nadar Chief ICT section Supply & Logistics Specialist CO Rep Education Specialist Health and Nutrition Specialist Immunization Specialist Logistics Specialist Supply Specialist Head of the YCSD section Health Specialist EPI focal point Supply & Logistics Specialist Health Specialist Malaria Health Specialist Vaccine and Cold Chain Logistics Specialist Nutrition & Food Security Unit CMAM Programme Procurement Specialist Supply & Logistics Manager Immunization Specialist Education Specialist Chief of Health Supply Specialist Chief of Wash Pakistan Anahitta Shirzad Procurement Services Specialist Rwanda South Sudan Denis Mupenzi Josephinne Kayumba Carl Howorth Saidi Kagaba Lillian Okwirry Ketema Bizunzeh Joy Kenyi Supply & Procurement Specialist Nutrition Specialist Supply & Logistics Manager Supply & Logistics Specialist Head of Wash Chief of Health Health Specialist PHC Figure 36 List of suppliers interviewed Category Supplier Vaccines Sanofi Vaccines Intervax Vaccines GSK Vaccines Serum Institute Devices KD Medical Devices Helm LLIN Vestergaard LLIN Tanjin Yorkool 83
84 RUTF RUTF RUTF ARV ACT Compact India Diva Nutritional Products Nutriset Mylan International Guilin Pharmaceuticals Co. Ltd. Figure 37 List of SD interviewees Name Unit Ashley Wax SD Helene Moller HTC Robert Mathews HTC Jorgen Kofoed HTC Annika Salovaara HTC Julia Behr HTC Ignacio Gimenez HTC Lama Ramzi Suleiman HTC Irene Ayako HTC Dragana Galic HTC Ignacio Gimenez HTC Lama Ramzi Suleiman HTC Jane Moley HTC Heather Deehan VC Stephane Arnaud VC Myungsoo Cho VC Jesus (Jay) Barral-Guerin VC Jennifer Rubin VC Ian Lewis VC Isabelle Cantin VC Hans Christensen VC Raju Shrestha WH Peter Ellison WH Rudolf Schwenk PSC Jon Blasco PSC Taylor Roland PSC Yasuyo Yamaguchi PSC Christos Kasapantoniou FMAC Patrick Van der Laan FMAC Francisco Blanco MNC Jan Komrska MNC David Muhia MNC Alok Sharma MNC Shanelle Hall DO Doreen Mulenga DO Clair Jones DO Regine Weber SC Optimization Sharon Forbes SC Optimization Elena Trajkovska ITU Laurent Schmuziger ITU Mounir Bouazar ITU Johannes Pappenreiter ITU Jean-Cedric Meeus ECU Chris Cormency WSEC Lene Hansen WSEC Hani El-Jadaa WSEC Joselito Nuguid DD Gemma Orta-Martinez MFSDU Rodolfo Mascarenas MFSDU 84
85 ANNEX 2: PROCESS MAPS PSC.pdf VC HTC Annual CO Forecast.pdf HTC LLIN.pdf Nutrition.pdf Tender Forecast.pdf WHU.pdf ANNEX 3: OVERVIEW OF DEMAND PLANNING DOCUMENTATION Figure 38 Overview of Demand Planning Documentation PC Documents Description SD PSC PSC VC Supply Manual (chapter 3 Supply Planning) DP 133 creating, monitoring, and updating the PS forecast Annex 1 PSC Forecast Generic timeline UNICEF SD Immunization Forecast Overview Description Country Programme Action Plans, Work Plans, reference to Annual CO Forecast for Vaccines, Immunization Devices, Cold Chain products, LLINs and insecticides, Vitamin A No reference to Nutrition forecasting Purposes, key milestones (in months), roles and responsibilities, performance monitoring Although in the PS process documentation the process and responsibilities of how the PCs create the PS forecast is not extensively described (only briefly for vaccines and LLINs) the assumptions made in terms of volume and value are described in the narrative of the PS forecast. Timeline for annual forecast and midyear update Objective, use of the forecast, roles, supporting tools, recommended budget prices related to Immunization products Timing and milestones are communicated through cover letters and s Description of forecast review process, countries to be reviewed, review forms, roles and responsibilities and performance monitoring VC Vaccine Center Forecast Review Procedure VC DP 113 Annex 3 Vaccine forecast Scope, horizon, time buckets of forecast, timing and milestones of demand planning process HTC DP 113 Annex 4 LLIN forecast Timing and milestones (in months) of demand planning process. High-level (LLIN) roles and responsibilities HTC (Malaria RDTs) MNC (Vitamin A) Warehouse Malaria RDT Forecast 2015_ Preamble Forecasting for Vitamin A needs Monthly forecasting of standard stock materials (TLC-CP ) Materials Requirements Planning and expediting (TLC-CP ) No performance monitoring Objective, use of the forecast, roles, supporting tools No timing and milestones, No performance monitoring High-level description of process steps and roles and responsibilities and clear milestones Performance monitoring not applicable as all approved forecasted quantities will be supplied Not a reflection of current process on hold due to anticipated changes in VISION, and anticipated linkages with procurement strategies that are still under discussion 85
86 ANNEX 4: SUPPORT TO COUNTRY OFFICES Figure 39 Support to country offices Country BU / Supply SD Support RO Support Country 1 Country 2 Country 3 Country 4 Country 5 Country 6 Country 7 Country 8 Supply HIV AIDs/ Malaria LLINs VC / HTC Health LLIN Supply / VC Health Water Sanitation VC / CEE Supply Nutrition Supply / Nutrition / Medicines Supply / VC VC / PS Smooth communication between CO and SD. SD could provide CO more information on product use, to identify whether the product is fit for purpose. End user monitoring could help to get better insight on what is going on at the project to feed into forecasting. A lot of issues would be mitigated by an increased supplier base, more LTAs at regional level, and geographically if Dubai could play a bigger role in reducing freight times to locations such as E Africa. Water Sanitation supplies are a challenge to get Copenhagen hasn t been able to deliver so they had to go as far as Bangladesh No formal forecasting process led by SD for HIV/AIDS, however CO would like to have guidance. Would be good if people from SD come down and visit from time to time to check on how they are conducting their forecasting and offer support. Better communication from SD in terms of lead times would be welcome More support from SD would be helpful More support could be provided by the SD to increase the capacity of their government counterparts The frequency of SD s annual forecasting exercise for LLIN is sufficient but they also have very frequency communication with the LLIN contact in SD throughout the year, so the communication is very smooth Filling out the forecast table is labor intensive (1 full week). Getting the data is not straightforward, e.g. CCE stock data. Gavi decisions have major impact and often require adjustments to forecast later on. There is a CO forecast, Gavi decision letter, Gavi shipment plan, SD provisional plan. SD could limit the request to CO with number and timing of shipments. SD could also take Gavi figures as starting point. SD issues an annual forecast vs. actual report. Useful, but not easy to read. No (root-cause analysis) explanation of error or distinction between supplier capacity and inaccuracy in CO forecast. SD should provide more support in building skills and capabilities for forecasting. SD should demonstrate the purpose of the forecasting exercise -limited understanding at CO/MoH why process is set-up. The purpose of the process is not explained. SD provides presentations at regional /global meetings, but should focus more on CO. Programme people are not involved in training. SD works with PD HQ and WHO, but less with CO programme. SD could provide more information in terms of stock available in the market. Link between CO and SD in terms of monitoring stock outs could be improved. Quarterly report that SD sends to the CO is good for general issues Generally, SD is able to respond to demand, and is quite good. Possibly could identify the countries who had the most regular demand and could focus on that selection of countries SD provides feedback on submitted forecast More training from SD could be helpful; awareness of the importance of the forecast could start with Reps. Have to make sure CO has the capacity to estimate need / requirement, so they can in turn strengthen the national systems to develop an accurate forecast of the need No comment made on SD support Yes, sufficient training provided by SD when needed by CO, e.g. when new forecasting tool was introduced, there was sufficient training of CO and MoH staff. The forecasting tool is very user-friendly and SD is very responsive SD gives fair amount of feedback on the first submission of forecast, as well on previous forecasting performance but so far limited as typically pretty accurate. SD sends survey for feedback, well received by CO and used as well Working directly with SD on forecasting, and the support provided by them is more than sufficient Country 9 Health We are happy with the support we get from SD We get support from the RO in terms of technical knowledge Regional Office not involved with forecasting. EPI advisor from RO involved but mainly for technical expertise and knowledge of stock management tool The CO is better equipped to do Supply Planning for CO then RO No involvement of the RO RO supports in data collection process No involvement of RO in programme or PS forecast There is no support from the RO, and no need for it 86

 The forecast accuracy and bias of these top vaccines are shown below, followed by a summary of forecast performance")
87 ANNEX 5: DETAILED FORECAST ANALYSIS VACCINES & IMMUNIZATION DEVICES As indicated vaccines have a large share of SD s procurement spend, averaging 55% of total shipped value in the time period Within the Vaccine Centre the shipped value is mainly driven by 10 vaccine presentations (7 vaccines) that represent 89% of shipped value in Figure 40 Top Vaccines procured (Cumulative) The forecast accuracy and bias of these top vaccines are shown below, followed by a summary of forecast performance for each of the 9 in-scope countries, as well as root-cause analysis where available. Figure 41 Annual Forecast Accuracy & Bias of Top Vaccines
88 BANGLADESH In 2014, the accuracy of all routine vaccines is relatively high, ranging from 67% to 100%. The low forecast accuracy of MR 10 dose and Measles 10 dose can be explained by the submission of a forecast for the 5 dose presentation, yet received the 10 dose instead. If this had been taken into account, the overall forecast performance would improve. In the Annual CO Forecast file two presentations were provided as options: the Measles 5 dose and the Measles 10 dose. However, when a country forecasted the 5 dose the following explanation was given: Please take note that 5-dose vial was given as a choice in order to determine the demand for this presentation. However, this presentation is not available. The vaccine will be supplied in 10-dose vial presentation. The Measles 10 dose forecast was not adjusted, and thus the forecast accuracy of Measles 10 dose will be skewed by this. However, the accuracy of supplementary activities is low, particularly for the polio vaccines. In 2013, this can be explained by the fact that although 54,000,000 doses of bopv 20 dose vials for supplementary activities were forecasted, as per National Polio Technical Committee decision, Bangladesh received topv instead of bopv. In 2014, 54,000,000 doses of topv 20 dose vials for supplementary activities were forecasted, however the supplementary activity did not take place as per recommendation of WHO, therefore no shipment of topv was received. Figure 42 Bangladesh Forecast Performance of Vaccines 88


89 CONGO, DEMOCRATIC REPUBLIC DRC s performance improved from 2013 to 2014 overall, from 59% accuracy to 80% accuracy. Explanations were not provided on the root-cause by the CO. Figure 43 Congo, Democratic Republic Forecast Performance of Vaccines Figure 44 Congo, Democratic Republic Forecast Performance of Devices 89


90 EGYPT For all the vaccines the accuracy is low in 2014 (0%), due to the fact that nothing was forecasted. Explanations were not provided on the root-cause by the CO. Figure 45 Egypt Forecast Performance of Vaccines Figure 46 Egypt Forecast Performance of Devices 90
 this was due to delayed shipments meant to arrive in 2012, but arrived late as a result of a lengthy PS process resulting in high stock at the start of")

91 ETHIOPIA In 2013 several vaccines and devices were poorly forecasted. For OPV-10 routine (13m forecast, 5m shipped) this was due to delayed shipments meant to arrive in 2012, but arrived late as a result of a lengthy PS process resulting in high stock at the start of For Pneumococcal vaccine the forecast accuracy in 2013 was 39% (10m doses forecasted and 6m shipped). The CO explained that this was due to a denominator problem as the projection was made was based on old census data on target population and carryover stock. In 2014 the accuracy improved to 63%. In general, the forecast accuracy in 2014 is much better for all routine vaccines with values ranging from 63% to 96%. Only for YF (no forecast: only procured for travelers, not part of routine immunization programme) the accuracy is low in Figure 47 Ethiopia Forecast Performance of Vaccines The forecast performance for AD Syringes in 2013 is especially low. According to the CO, this was due to the fact that for the Measles catchup planned the Supplementary Immunization Activities (SIA) was limited to children age 9-59 months. Figure 48 Ethiopia Forecast Performance of Devices 91
 for the first time in its immunization schedule in 2013.")

92 MOZAMBIQUE In general, vaccine forecast accuracy is quite high. The following explanations were provided: Mozambique introduced Pneumococcal vaccines (PCV) for the first time in its immunization schedule in Due to all aspects of programmatic readiness and political and social preparation, it is highly common to have variability during the introduction year from the originally planned date. This also explains the high accuracy in 2014; i.e. Second year of introduction whereby programmatically the vaccine is included in routine immunization schedule and financially funded by Gavi. Same applies for DTP-HepB-Hib which is another Gavi funded routine vaccine, introduced since 2009 and hence the high forecast accuracy rate. HPV also supported and fully funded by Gavi was introduced in 2014, in a Demonstration project i.e.; in 3 districts in one province. The MoH decided to add two more districts to have more geographical variety and gather better demonstrative data. Measles and topv for routine demand are self-financed and procured by the MoH, and therefore not included in UNICEF forecast. Only supplementary activities, funded by partners are procures through UNICEF. Figure 49 Mozambique Forecast Performance of Vaccines For routine demand, forecast accuracy of immunization devices is also quite high, this can be partially explained by the fact that the AD 0.5 ml syringes are universally used across all injectable vaccines (Measles, Penta, PCV, BCG etc.) As explained by the CO, Often the quantity of Ads forecasted for each vaccine type includes the buffer amount, however in reality each shipment that arrives is used interchangeably between different vaccines. Therefore, as the program progresses toward the year end, the actual requirements get adjusted to the number of vaccine administered. This often results in either over forecast or over stock, and one way or another inaccuracy of forecast vs shipped. Figure 50 Mozambique Forecast Performance of Devices 92

 was over forecasted.")
93 NIGERIA Nigeria s overall forecast performance has remained steady from 2013 to 2014, although for routine demand there was a significant improvement in In 2013, the forecast for BCG exceeded the actual shipments due to the global shortage of BCG vaccines. In 2014, Pentavalent had a forecast accuracy of only 60%, this was due to the decision by the government to delay the expansion of the Pentavalent introduction because of remaining in country DTP stock. In 2013, the Measles vaccine (for routine use) was over forecasted. The CO explains that there was a serious measles outbreak that started in 2012, and previous responses had used routine stock. In addition, a major campaign took place in Figure 51 Nigeria Forecast Performance of Vaccines The forecasting performance for Immunization Devices is quite low. The explanation provided by the CO was that syringes are generally procured by the Government not by UNICEF except for the new vaccines and campaigns which does not give UNICEF visibility to monitor if quantities are appropriate. Figure 52 Nigeria Forecast Performance of Devices 93
94 PAKISTAN It is important to note that the forecasting exercise is a joint exercise with the Government of Pakistan (GOP) and Programme, and the vast majority falling under Procurement Services (>95%). For Pneumococcal the forecast accuracy improved over time from 71% in 2013 (17m forecasted, 13m shipped) to 95% in 2014 (20m forecasted, 21m shipped). Typically, government s programmatic projections are at the high-end, and UNICEF is not able to change what is jointly agreed between WHO and UNICEF from a programmatic perspective. Also, the introduction of Pneumococcal was delayed. The forecast accuracy of bopv is high, with 97% in 2013 and 80% in 2014, which was due to over forecasting and was caused by multiple changes in SIA strategy. topv for routine shows low forecast accuracy (0%) in 2013 due to the fact that nothing was forecasted for 2013 (to be procured through UNICEF). The accuracy in 2014 improved to 87%. For Measles, the accuracy for routine activities was 0% in 2013, as the GOP initially planned to self-procure but in the end procured via UNICEF SD. In 2014, the accuracy was 13%, as the forecasted quantity was much higher than the actual shipments. For Measles supplementary activities the accuracy was low with 13% in 2013 and 38% in The forecast (for Measles) is a governmental projection, which is typically at the high end. Also, Measles campaigns were delayed which negatively impacted the forecast accuracy. For DTP-HepB-Hib the accuracy was 46% in 2013 and 98% in In summary, there are three main themes that describe the major source of deviations between forecasts and actuals: OPV for SIAs the issue related to the lack of forecast reliability was the frequent changing of SIA strategy (both Q and type of antigen) and subsequent OPV mapping not reflected in the SD forecast. As mentioned, for the GoP, WHO and UNICEF the regularly updated forecast is the OPV mapping. So when at one point in time the SD forecast is submitted and multiple subsequent times the OPV mapping is revised, this will evidently lead to differences in the SD forecast vs. actual Gavi funded vaccines for those we mentioned that the SD forecast is based on the Gavi DL s & APR incl. for multi-year forecast. So one key reason for the difference between SD forecast and actual, is programmatic. Low coverage continues, but is not necessarily reflected in the DLs. So if the coverage was as per programmatic expectation, then the forecasted quantities to be delivered based on Gavi DL would also match better. But as the low coverage results in higher stock levels remaining at Fed. EPI, some forecasted quantities are then postponed and/or carried over to next year. A good example is also this year. The SD forecast for 2015 is based on Gavi DL, but no delivery of 2015 allocation has so far been made for Penta, despite the fact that, at the time of writing, we are six months into the calendar year. So there will evidently be significant discrepancies between SD forecast and actual For RI (GoP funded) we explained that the GoP has to follow their own procurement rules, which means conducting their own tenders. Thus when they are unsuccessful they will reach out to UNICEF procurement services. This is thus not known up front, but often only at a late stage. Furthermore, we explained about the court cases and which constraints and restrictions this puts on the GoP as well to approach UNICEF up front for procurement. The potential procurement of traditional RI antigens is thus very difficult to forecast due to the points listed above and this impacts evidently the reliability of the forecast 94


95 Figure 53 Pakistan Forecast Performance of Vaccines Figure 54 Pakistan Forecast Performance of Devices 95


96 RWANDA One key factor that explains the cases with relatively low forecasting accuracy is that the government s financial calendar is not in sync with UNICEF SD s planning cycle. This presented challenges in shipment plans being timely and efficiently implemented. TT, YF, HepB, Meningitis and IPV are not for routine immunization and not part of the immunization forecast. Additional explanations for root-cause forecast performance have not been provided. Figure 55 Rwanda Forecast Performance of Vaccines Figure 56 Rwanda Forecast Performance of Devices 96


97 SOUTH SUDAN South Sudan s overall forecast performance was 96% in 2013, and 83% in For bopv the forecast accuracy is relatively high in ranging from 65% to 100%. The same applies for topv routine. For DTP-HepB-Hib, there was a lot of over forecasting in 2013, but the accuracy in 2014 was much better: 86%. The implementation of DTP-HepB-Hib that was to start nationally as of the beginning of 2014, started effectively in July 2014 and was not implemented to all counties due to a delayed process of training and access to conflict states. For Measles routine the accuracy is relatively low, due to significant under forecasting. Though, for Measles supplementary the forecast accuracy was high with 91% in For TT vaccine routine and supplementary there was a significant amount of over forecasting in South Sudan was to implement MNTE campaign (three doses at an interval of one weeks) for Women of Child Bearing Age in all states. The implementation process was hampered by conflict in three states. Therefore, it was impossible to bring in routine TT vaccine as the campaign stock was approaching expiry of shelf life. Figure 57 South Sudan Forecast Performance of Vaccines Figure 58 South Sudan Forecast Performance of Devices 97
98 LLIN Figure 59 LLIN Forecast vs. Procured
99 Figure 60 LLIN Forecast vs. Procured 2014 NUTRITION (RUTF) Figure 61 Top 5 RUTF Procuring Countries
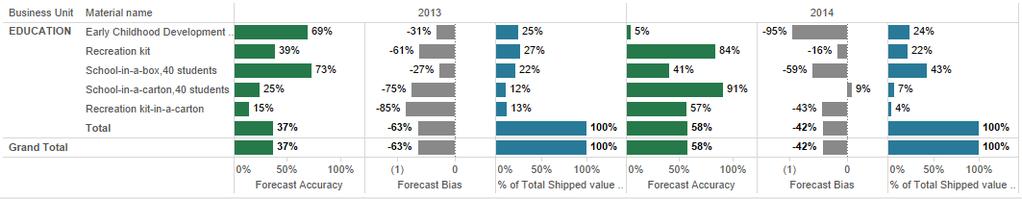
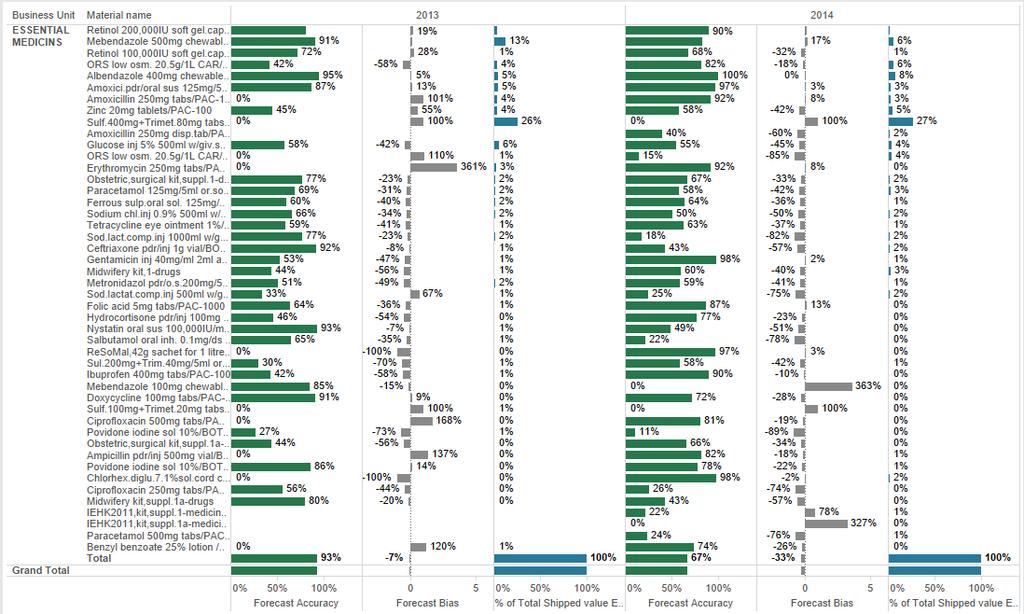
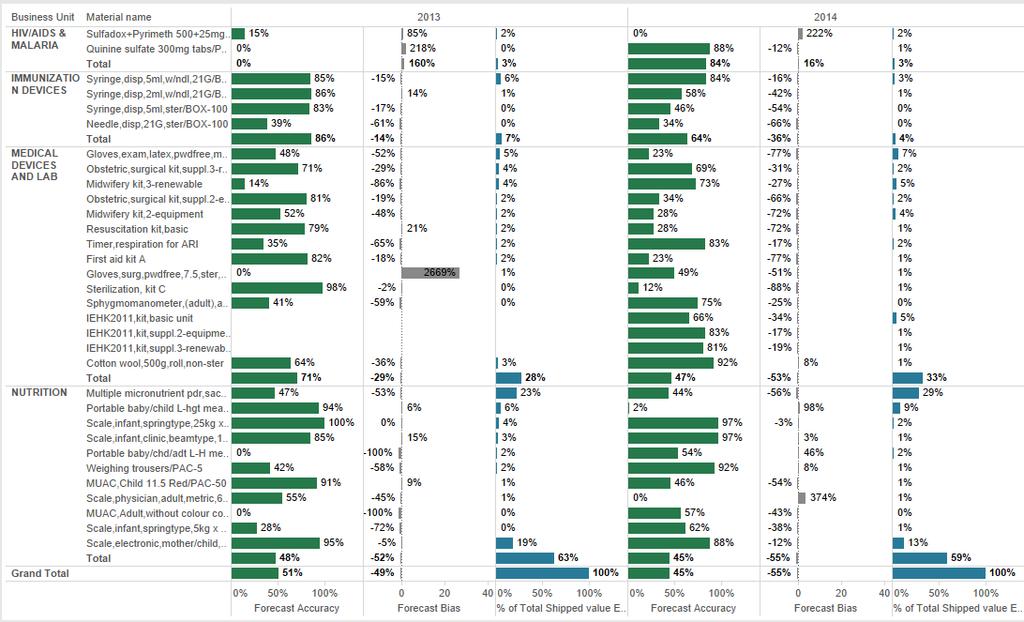
100 REPLENISHMENT PLANNING Figure 62 Warehouse Forecasts for Business Units 100
101 ANNEX 6: LTA ANALYSIS RPF-DAN MULTIPLE VACCINES Tender RFP-DAN covers BCG-20, DTP-10, DT-10, Td-10, TT-10/20, and HepB-1/10 for the period Eight suppliers were contracted for this tender. Figure 63 Overview of LTA amendments for RFP-DAN Awarded (million doses) Vaccine Supplier Amendments Total CO Forecast Total Tender Forecast Intervax million doses increase in 2015 Japan BCG-ampoule No amendments BCG-20 SII No amendments SSI No amendments Total LTA Total PO Accuracy (LTA) 94% million doses of on PO were shipped in 2013, in 2014 DT-10 Total CO Forecast Total Tender Forecast Intervax adjustments made with a total amount of 175K doses SII No amendments Total LTA Total PO The amount on the PO has also been shipped Accuracy (LTA) 99% CO Forecast Tender Forecast DTP-10 Biofarma PO Accuracy (LTA) 46% CO Forecast Tender Forecast Additionally, 0.1 million doses were ordered from SII in million doses of the 4.9 million on PO in 2014 were shipped HepB-1 LG Life Sciences No amendments PO Accuracy (LTA) 81% 1.4 out of 1.8 million doses on PO in 2013 were shipped, 1.1 in
102 Figure 64 Overview of LTA amendments for RFP-DAN Awarded (million doses) Vaccine Supplier Amendments CO Forecast Tender Forecast HepB- 10 Crucell No amendments LG Life Sciences No amendments Total LTA Total PO Accuracy (LTA) 99% 18.6 million out of 21.1 million doses in 2013 were shipped Total CO Forecast Total Tender Forecast Biofarma No amendments Td-10 Intervax No amendments SII No amendments Total LTA Total PO million out of 17.2 on PO were shipped in 2013 Accuracy (LTA) 0% TT-10 Total CO Forecast Total Tender Forecast Biological E Bio Farma Intervax amendments in 2013, 4 amendments in 2014 for TT/Td, increasing USD value with 17%, mainly due to slow switch from TT to Td, decreasing need for Td and increasing need for TT (e.g. in Somalia TT-10, Kenya TT- 20, and Ethiopia) 2 amendments in 2013, 3 in 2014, 3 in 2015 for TT/Td, increasing USD value with 7%, mainly due to slow switch from TT to Td, increasing demand for TT-10 from Nigeria 5 amendments in 2013, 3 in 2014 for TT/Td, increasing USD value with 8%, mainly due to un-forecasted demand from Pakistan, Afghanistan, and Malawi for TT- 20, additional demand from Somalia and Egypt for TT- 10 Shantha amendment in 2013 increasing USD value with 17% SII SII stopped supply of TT-10/TCV Total LTA Total PO out of 82.9 million doses on PO were shipped in 2013, 59.4 in In million doses were ordered from Biofarma and 4.2 million from Shantha Accuracy (LTA) 85% 102


103 Figure 65 Overview of LTA amendments for RFP-DAN Awarded (million doses) Vaccine Supplier Amendments Total CO Forecast Total Tender Forecast Biological E Increase in 2013 of 4.0 TT-20 Intervax amendments in 2013 of 8.0 and 8.5 million doses SII amendments in 2013 of 2.7 and 5.0 million doses Total LTA Total PO Accuracy 38% 53.7 million doses out of 64.5 on PO were shipped in 2013, 59.0 in 2014 DTP-20 was forecasted for 0.22, 0.31, and million doses in 2013, 2014, and 2015 respectively, but was not incorporated in the LTAs. The same applies for HepB -2 and -6 totaling 0.88, 0.88, and 0.94 million doses in 2013, 2014, and From the table above it can be concluded that the slower switch from TT to Td had a significant impact on the demand of each of the vaccines in the period The accuracy of the original LTA quantities for the period compared to the PO quantities for these vaccines is low with 0% for Td-10 and 38% for TT-20. The accuracy of TT-10 is good with 85%. The forecast accuracy for TT-10/20 is high in 2013 with 94% accuracy but significantly lower in 2014 with 47% in accuracy and significant over forecasting. The forecast accuracy for TD-10 was quite low in both 2013 and 2014, with a forecast that significantly exceeded the amount procured (323% in 2013 and 91% in 2014). Figure 66 TT-10/20 Forecast Accuracy Figure 67 Td-10 Forecast Accuracy
104 Except for DTP-10, the other vaccines from the tender show relatively good accuracy for the period , ranging from 81%-99%. RPF-DAN MEASLES VACCINES The Measles vaccine quantities in the LTAs related to RFP-DAN , signed with three suppliers, show multiple upward adjustments. The tender forecast is based on the Gavi Strategic Demand Forecast (SDF) 5.0 and is further informed by UNICEF's annual 5-year forecast exercise with countries and with the Global Measles Initiative. The quantity for Measles in the LTA with Serum Institute ( ) for 2013 is adjusted from 87 million doses to million due to increased age group of supplementary campaigns in large countries, un-forecasted demand from countries which traditionally do not procure their routine needs through UNICEF, and continuing outbreaks of Measles. The LTA with Biofarma ( ) for Measles show adjustments of 22.5 million doses, from 89 million to million doses due to an overall increase in demand. The LTA with GSK is adjusted from 1.89 million to 2.19 million doses. The LTA with Serum Institute covers also MMR-1, MMR-5, MMR-10, and MR-10 vaccines. The forecast in the tender of 22 May 2012 is as follows. The total awarded quantity to the three suppliers for the period amounts to million doses, which is 72.7 million doses more than in the tender. Figure 68 Forecast for RFP-DAN Grand total Measles monovalent MR MMR Grand total ,167.8 Figure 69 Overview of LTA Serum Institute Vaccine Year Original Awarded PO Measles MR-10 Accuracy (LTA) Bias (LTA) % -64% % -68% % -38% Driver Increase in age group of supplementary campaigns, demand from countries for routine typically not procured through UNICEF Increase in age group of supplementary campaigns, demand from countries for routine typically not procured through UNICEF, caused by Gavi approvals Demand increase in Bangladesh, Philippines, Pakistan and Nigeria % -6% Un-forecasted demand in Iraq MMR % -52% Un-forecasted demand in Kosovo % -66% Un-forecasted demand in Azerbaijan MMR % 50% Various reasons MMR % -30% Un-forecasted demand in Lebanon, Kyrgyzstan, Uzbekistan % -84% Demand increase in Iraq Without the amendments made to the LTA for Measles containing vaccines the accuracy of the original LTA is rather low, typically below 50% except for MR-10 in 2014 and MMR
105 RPF-DAN IPV Tender RFP-DAN for Inactivated Polio Vaccine (S359225) resulted in an LTA ( ) with one supplier for the amount of 600k single dose vials for the period 11 th June 2012 to 31 st December The quantity in the RFP amounted to 23m doses for supplementary immunization activities (SIA) and routine immunization needs in Lebanon and Occupied Palestinian Territories of 650k doses for the period. There was one amendment made to this LTA due to the transfer of the WHO pre-qualification of IPV to the supplier s new legal entity. In the above mentioned period (based on PO/STO final release date) the total quantity on PO amounted to 494k doses. The accuracy of the tender and original LTA quantity for the mentioned period is thereby 68% and 79% respectively. The same amount was shipped to the countries. RPF-DAN TOPV AND BOPV Tender RFP-DAN for topv and bopv resulted in seven LTAs (December 2012), which were amended multiple times. Both the bivalent Polio vaccine (bopv, bivalent type 1+3, vial of 20 doses) and the Oral Polio Vaccine (OPV) are used to respond to supplementary demand. OPV has also been used to meet some routine demand as well (30% of shipped value within was classified as routine demand). The polio vaccine forecast is unique as it is predominately forecasted at a central level in support of the Global Polio Emergency Action Plan, with the goal of eradicating wild and vaccine-related polioviruses. The Vaccine Supply Task Team (Programme and Supply) sit together quarterly with the WHO to discuss quantities of the vaccine on contract and how the epidemiology has evolved to assess both short- and medium-term requirements. (Advance planning has been difficult because of budget. Until June 2015, they could not confirm requirements for 2016.) As the forecast itself is based on an assumption of eradication within a certain timeframe, as this timeframe shifts there are enormous implications on demand. SD uses the outcome of these meetings and applies their own intelligence based on historical demand patterns to arrive at a forecast that is used in tender documents. As an example, SD knows that they will have to build up a buffer in Q4 to prepare for Q1 demand as capacity does not exist to meet demand in Q1 and manufacturers have a minimum of 6-12 months lead time. However due to supplier constraints, from 2014 to 2017 UNICEF SD contracted suppliers total capacity so did not operate off of a forecast. The forecast accuracy is calculated by taking the amount given in the tender document compared to the actual PO quantities during the same time period. This resulted in an overall forecast accuracy of 73% in 2013 and 59% in LTA quantities however, were adjusted and forecast accuracy for LTA quantities versus PO quantities in 2013 were 74% and in 2014 were 78%. 105
106 Figure 70 Overview of LTA amendments for RFP-DAN LTA Supplier Duration Amendments (in millions doses) Haffkine (in millions doses) LTA Amendments Bio Farma Novartis GSK Sanofi SII LTA Amendments 6 30 LTA 35 - Amendments 94 LTA Amendments 45 LTA Amendments - 50 LTA Amendments m CO Forecast 1,19 1,437 Tender Forecast 1, LTA 1,276 1,27 Totals Amendments PO (b/mopv, OPV) 1,714 1,625 Accuracy (Tender) 73% 59% Accuracy (LTA) 74% 78% What are the key drivers of demand variability? The upward amendments made in April 2013, (additional 140 million doses of bopv and 70 million doses of topv), were due to a significant increase in demand for OPV, mainly related to high intensification of activities in Nigeria and Pakistan and additional activities in high risk countries in West Africa (as described in the CRC submission). Also, an amendment was made due to one of the supplier s inability to supply the requested product due to limited capacity, hampering supply to Bangladesh, Ethiopia, and Mali. Additional amendments of 416 million doses were made in July 2013 for 2013 and 2014 due to intensification of activities to stop transmission of wild poliovirus by the end of 2014, an outbreak in the Horn of Africa since June 2013, continued outbreak response activities and additional demand in high risk countries in West Africa. At the time of writing, Afghanistan, Pakistan and Nigeria are the three remaining endemic countries, so it is not surprising to see that they are the three highest recipients of bopv and OPV. Outbreaks will certainly have a huge impact on demand, and as countries move closer and closer to eradication there will be bigger responses to outbreaks. 106
107 ITB-DAN TEST STRIPS The sole LTA ( ) related to tender ITB-DAN , although recorded as a target value LTA, was in fact a time-bound LTA. Figure 71 Contract Awards for September 2012 The forecast for the ITB quantity was made by the WH for 40,000 test strips, urinan.,gluc/prot/pac-100 (S ) over a 24-month period ( ). In that period the actual quantity ordered amounted to 152,537 which results in a forecast accuracy of 26% and forecast bias of -74%. The explanation for the deviation provided was that the WH forecast included in tenders usually assumes a 10% increase of historical procurement (but no other intelligence). Likely procurement in the previous year(s) was low, resulting in a correspondingly low forecast. ITB-DAN AD SYRINGES Tender ITB-DAN for AD Syringes for the period had numerous adjustments for all four LTAs. The original quantities of the 4 LTAs totalled 1,295m syringes. The tender forecast for 2014 amounts to million pieces and for million pieces. The amendments that have been made for all four LTAs add up to 118m syringes. The PO quantity as of start of June 2015 amount to 1,116m syringes. In 17 months (71% of duration) 86% has been consumed. ITB-DAN NEEDLES AND DISPOSABLE SYRINGES Tender ITB-DAN resulted in five LTAs for 16 different needles and disposable syringes totaling 1.39m boxes for the period Four LTAs have been amended in January 2015 with an amount of 334k boxes (one box contains 100 devices). The increase in LTA quantities was due to demand (not forecasted) for health kits, unforecasted campaigns, and emergency response, particular for the Syria and Ebola responses. The aim to have an equal offtake amongst the LTA could not be fulfilled given the proximity of some suppliers to the Copenhagen warehouse and suppliers availability at the time of the request, and variances in delivery lead times. RFP-DAN RUTF Tender RFP-DAN for RUTF to replace fourteen LTAs ending on 31 December 2012 resulted in LTAs with eleven suppliers to fulfill the need for 32,000 MT (2.3 million cartons) in 2013, of which 22,000MT was anticipated to be procured via SD, the rest locally. The tender forecast was developed by UNICEF SD and PD including the needs for countries that have already introduced community management of severe acute malnutrition and also estimated needs for countries yet to introduce it. The LTAs originally covered 19,250MT out of 22,000MT. 2,750MT was unallocated for further allocations among bidders. According to MNC, the total LTA quantity was deliberately under-allocated, and then LTAs values were increased purposely, especially for companies they wanted to strengthen. As described in the CRC submission, during 2013 local suppliers faced challenges in meeting product specifications (local suppliers contracted by UNICEF COs) leading to local orders being shifted toward offshore purchases (Ethiopia, Malawi, Niger). At the end of April 2013 less than 5% of contracted volume with Compact, Societe JB, Tabatechnik, and Insta was consumed due to QA challenges, leading to an increase in LTA quantities of Nutriset, Power Foods Industries, and Mana Nutritive Aid Products. Combined with an additional order from Nigeria (funded by CIFF), there was an additional increase in 5 separate LTA quantities. Orders funded by DFID of 1,435MT for Central African Republic and Niger, and from Nigeria and Yemen (1,260MT) required an increase in the LTA quantity of Nutriset at end of November. (The PO quantity in 2013 is based on the PO/STO final release date and the PO quantity.) 107
108 Figure 72 Overview of LTA amendments for RFP-DAN Supplier LTA quantity (MT) Amendments PO quantity (2013) NutriVita Foods Compact India 2 1,018 Societe JB Diva Nutritional Products Vitaset Nutriset 10 5,000+1,500+2,070 18,389 Edesia ,68 Power Foods Industries Tabatechnik Fine Foods 1 2 2,818 Mana Nutritive Aid Products ,000 1,693 Insta Products Total 19,25 30,543 RFP-DAN RUTF The LTA ( , Nutriset) for 826,087 cartons of RUTF (S000240) for 2014 related to tender RFP-DAN of September 2013 with total quantity of 2,540,000 cartons (13 LTAs) has been amended three times. According to MNC, in 2014 they were more confident about projections and distributed the whole quantity from the beginning. First, in October 2014 an increase with 72,464 cartons to meet peak demand purchases of RUTF (supplier is able to respond to spikes in demand). Second, in November 2014 an increase with another 72,464 cartons to cover the year-end peak. Third, to extend the duration of the LTA to 2015 with 1,014,493 cartons. The total quantity for all 12 remaining LTAs in 2015 amounts 1,840,587. The total PO quantity in 2014 amounts 2,555,778 cartons, with 1,007,000 cartons order from Nutriset, which is higher than the original LTA quantity, resulting in an accuracy of 82%. 108
109 ANNEX 7: FORECASTING FRAMEWORK Forecasting Framework.pdf ANNEX 8: TERMS OF RE FERENCE Final ToR - Institutional Assessm ANNEX 9: COUNTRY OFFICE SUMMARIES Bangladesh Congo Egypt Ethiopia Mozambique Nigeria Pakistan South Sudan Rwanda 109
110 ANNEX 10: PS FORECAST PROCESS BY COMMODITY GROUP PC Commodity Group (as per HF) Mosquito Nets & Insecticides Considerations for PS Forecast Historically represents between 8 and 10% of total PS value Method to move from quantity to value Weighted average of LTA prices Diagnostics Historically represents between 2 and 3% of total PS value Laboratory Historically represents between 1 and 3% of total PS value HTC Syringes & Waste disposal Historically represents between 1 and 3% of total PS value Weighted average of LTA prices for Y1, and based on volumes make a judgment call on subsequent years Medical equipment/kits Historically represents between 1 and 3% of total PS value Cold Chain Historically represents between 1 and 3% of total PS value Historically represents between 16 and 23% of total PS value MNC Antiretrovirals The forecast takes into account: 1. Who has been buying and type of funding used for this procurement; 2. Indication of any trend of change in funding: part of partnership intelligence 3. Changes in the treatment guidelines; accordingly movement of select drugs by specific countries; interdependencies of the drugs to be seen as part of regulatory intelligence; 4. Availability of patented drugs to Access countries at lower prices; either through MPP licensing system or part of initiative between a patent holder and generic manufacture; part of market intelligence 5. Continuous price reduction of specific drugs, which are brought in large quantities by bigger market actors, each year Historically represents between 2% of total PS value Use ZPOX2 report to know historical value; ZSOS report often provides us higher value therefore weighted average of prices of various LTA used is required Nutrition Essential Medicines (Pharmaceuticals) Use analysis of ZSOS report to produce PS forecast, combined with follow up with WB as the largest portion of nutrition PS transaction is through WB. Country PS forecast is not useful for nutrition unit. Historically represents only ~3% of total PS value VISION ZSOS Report Historically represents between 1 and 5% of total PS value MNC Antimalarials Forecast is based on three-year average and made conservatively. There is no straight-line trend for Anti Malaria medicines as it depends on various factors; 1. Rainy season in countries, where UNICEF partner depend on UNICEF procurement 2. Countries stock situation; unlike ARV antimalarial drugs are not continued treatment, it is seasonal treatment, therefore the stocks are not required each year. 3. Unlike ARV medicines, private market exist; therefore do not depend entirely on the common procurement process 4. Shift in country funding and procurement agency system Use ZPOX2 report to know historical value; ZSOS report often provides us higher value therefore weighted average of prices of various LTA used is required. 110
111 PC VC Commodity Group (as per HF) PS New vaccines PS OPV PS Traditional EPI Vaccines PS IPV Steps in Forecast The PS forecast (in value) is prepared by contracts staff members of VC. The forecast is accompanied by a narrative (in MS Word and MS Excel). This narrative describes the key assumptions and major changes compared to the previous forecast submission including quantities, price, countries, campaigns, and financing. The PS forecast considers the latest information such as supply situations, country introduction plans, Gavi ADF data and other relevant data. The tender forecast is typically the starting point for the biannual VC PS forecast submission by the VC. For New Vaccines the PO and forecast values from the Allocation Table flatfile are typically used for the current year as the Allocation Table has the most updated information about a projected value. The projected demand of New Vaccines for the following years is based on expressions of interest from countries, multi-year country forecasts, as well as unforecasted procurement requests that have been received from countries and have been extrapolated into the future. For other vaccines the applied methodology differs per vaccine and per forecasted year. Method to move from QTY to VALUE The WAP (Weighted Average Price) is used to translate the volume forecast into value. The WAP is typically based on the current or new awarded price for the LTA or target price, but there are also other concepts applied (e.g. Tail Price). WSEC WASH Education/Printing Historically represents between 0 and 1% of total PS value Historically represents between 0 and 1% of total PS value Annex 10 provides a table with the information gleaned by Deloitte, and can be used as a starting point for SD to develop guidance on how PCs can build their PS forecast. 111

112 ANNEX 11: CONSULTANCY TEAM PROFILES Contact information Curriculum Vitae Maureen Hughes is Partner at Deloitte Consulting, having 32 years experience in project management of large scale, international supply chain transformation and automation projects in multinational organizations Maureen used to be both global and EMEA leader for Deloitte s supply chain practice Maureen Hughes Partner Maureen has an Engineering degree from London University and her postgraduate study was in biochemical engineering Deloitte Consulting B.V. Contact details Gustav Mahlerlaan LA Amsterdam The Netherlands Mobile maureenhughes@deloitte.nl Web Summary of relevant experience Maureen has managed large scale business transformations with substantial project teams across geographical locations in Europe, the USA, Africa and the Far East and is extensively experienced in implementation of projects with complex change management issues spanning global systems in a variety of cultural environments She has led both global and European supply chain transformation projects for some of the world s largest companies in Consumer Business, High Tech, Telecom, Media and Process industries Selected Clients Apple, Activision, Asics, Black & Decker, Canon, Coca-Cola Enterprises, Coca-Cola Hellenic, Disney, EA Games, Ericsson, Heinz, LGI, Mattel, NIKE, Nikon, Paramount, Philips, SAB Miller, Sony, Warner Bros, Whirlpool 112

113 Contact information Curriculum Vitae Jurgen Hoppenbrouwers is Director at Deloitte Consulting, leads the global Logistics & Distribution practice and co-leads to EMEA Supply Chain practice Jurgen has over 22 years experience with Supply Chain Management. He is specialized in large global Supply Chain transformations and worked for many companies in Life Science, Pharma, Consumer Business and Government Jurgen Hoppenbrouwers Director Jurgen has a degree in both Computer Science and Supply Chain Management from the University of Eindhoven (the Netherlands). He is Certified in Production and Inventory Control (CPIM) from APICS and has a master s degree in Management Consultancy (VU Amsterdam) Deloitte Consulting B.V. Contact details Gustav Mahlerlaan LA Amsterdam The Netherlands Mobile jhoppenbrouwers@deloitte.nl Web Summary of relevant experience EMEA Supply Chain transformation for Chr. Hansen (Nutrition products and Food ingredients) - Project Director Supply Chain Transformation (production footprint, warehouse structure, production and logistics planning, KPI dashboard, etc.) for DLG (Agricultural) - Project Director Production and distribution network optimization Coca-Cola - Project Manager Supply Chain Assessment and Working Capital Reduction for DSM (Pharma, Nutrition, Food Specialties) - Quality Assurance and SME European distribution model and outsourcing strategy for Mead Johnson Nutrition - Project Director European Supply Chain footprint design for Weber-Stephen (barbeque manufacturer) - Project Director EMEA distribution network design and outsourcing logistics (inbound, warehousing, distribution) for Nikon - Project Manager 113

114 Contact information Curriculum Vitae Jim Lee is a Senior Manager at Deloitte Consulting and leads Deloitte s Supply Chain practice for international development He has over 16 years experience delivering supply chain advisory services to clients across high-tech, humanitarian, public, and retail & distribution sectors Jim Lee Senior Manager Jim has a degree in Mechanical Engineering from the University of Maryland. He is a Certified Supply Chain Professional (CSCP) from APICS and Supply Chain Operations Reference Professional (SCOR-P) from the SCC Deloitte Consulting LLP Contact details 1919 N. Lynn St. Arlington, VA USA Mobile jimlee@deloitte.com Web Summary of relevant experience Jim has led assessments for private sector companies and international organizations such as the Global Fund, World Bank, and USAID As senior advisor, he led a team to identify 24 million USD in procurement savings for the Ministry of Health in Mozambique through analytics and internal benchmarking of 100 million USD in spend on essential medicines As project leader, he led a team to uncover a 10% bias in forecast accuracy and inventory risk for the U.S. government by establishing Sales & Operations Planning (S&OP) across three logistics centers As senior advisor, he led a team to Improve order fill rate by 30% and on-time delivery by 34% for the central medical store in Kenya through supply chain strategy, planning, and distribution redesign As sourcing lead, he captured 23 million USD in savings for a global semiconductor manufacturer through analysis of 600 million USD in spend across 40 categories, 12 divisions, and consolidation of 1,800 suppliers As project leader, he led a team to assess inventory and distribution for a poverty reduction program in Indonesia, delivering a model to improve OTIF rate by over 50% and reduce operating cost by 40% As project leader, he led a team to analyze procurement for the National Emergency Response Council on HIV/AIDS in Swaziland, identifying 20 process improvements and establishing 29 metrics As project manager, he led a team to assess U.S. joint logistics operations focused on providing worldwide humanitarian assistance through planning, procurement, and delivery of supplies 114

115 Contact information Curriculum Vitae Robert Jan is a Manager in Deloitte Consulting s Supply Chain Strategy practice He worked for various companies in Consumer Business, Chemicals and High- Tech industry. His main focus area is supply chain planning and inventory management Robert Jan has a Master degree in Industrial Engineering & Management Science. He is certified Six Sigma Green Belt and APICS CPIM Robert Jan van Schuppen Manager Deloitte Consulting B.V. Contact details Gustav Mahlerlaan LA Amsterdam The Netherlands Mobile rvanschuppen@deloitte.nl Web Summary of relevant experience Supply Chain Planning improvement at global player in Beer industry, the Netherlands As project manager, he managed design of global S&OP framework, covering demand planning, supply planning, and financial planning processes. Conducted work sessions to agree on global S&OP framework with Group Supply Chain and functional representatives from different Operating Companies. Subsequently, managed implementation of S&OP framework at multiple EMEA OpCo s OWC reduction at global science-based company active in health and nutrition, the Netherlands As project manager, he identified and implemented inventory reduction opportunities through improved demand and supply planning, S&OP refresh, transportation optimization, SKU rationalization. Multiple Business Groups were in-scope, ranging from Specialty Chemicals / Plastics to Active Pharmaceutical Ingredients Supply Chain Planning improvement at Global Chemical Company, Germany As project manager, he managed design and implementation of global S&OP and improved demand planning and supply planning processes at one of the divisions. All four BU s of the divisions, covering all sales organizations in North and South America, Europe, and Asia-Pacific, and all 27 plants producing products sold by the division were in-scope. The project set the standard for further roll-outs across the company Supply Chain Planning improvement at leading producer of household products, United Kingdom As a team member, he assessed and benchmarked customer service performance in EMEA region (8 OpCo s). Identified process, methodological, and organizational changes in demand planning, S&OP, stock management, and the supply chain operating model 115

116 Contact information Curriculum Vitae Ann is a member of the Supply Chain Strategy group She joined Deloitte in January 2014, bringing 5 years of international experience working in supply chains, as well as experience as an advisor and coordinator within Médecins sans Frontières Ann has an advanced degree in Logistics & Supply Chain Management. She is fluent in English (native language) and proficient in French Ann Allen Manager Deloitte Consulting B.V. Contact details Gustav Mahlerlaan LA Amsterdam The Netherlands Mobile annallen@deloitte.nl Web Summary of relevant experience Within a project team, supported a global brewery on an extended S&OP topic, by providing supporting material for mature business units to engage in Collaborative Planning, Forecasting & Replenishment with their customers Developed supply chain strategy for a medical equipment company to support growth objectives and identified key areas for further development in order to support their strategic objectives. Ann s role was to work hand-in-hand with Project Manager to conduct interviews, analyze internal documents, conduct maturity assessments using the idisc toolkit, and prioritize improvement areas As an internal Supply Chain Advisor for MSF she advised country teams on their collaborative planning between medical department and operations which involved clarifying roles & responsibilities, identifying data requirements, putting into place appropriate processes and procedures, and training where necessary She also co-led an interdepartmental planning workshop between medical personnel and logistics staff in one of the organization s largest country operations in eastern Congo to identify problems in the end to end planning process and reach consensus on a way of working that was formalized in the country guideline As a Research Associate at INSEAD s Humanitarian Research Group she contributed to the evaluation of DG ECHO s Fleet Management in order to increase the efficiency and effectiveness of their fleet management system 116
 in Business Administration with a specialization in Transport and Supply Chain Management at the VU University Amsterdam, the Netherlands.")
117 Contact information Curriculum Vitae Kelly Pender is a Consultant at Deloitte Consulting and works in the Supply Chain Strategy service line of Deloitte s Strategy and Operations practice since She graduated for her Master of Science (MSc) in Business Administration with a specialization in Transport and Supply Chain Management at the VU University Amsterdam, the Netherlands. She also holds a Bachelor of Applied Science (BAsc) in Human Logistics from the Amsterdam University of Applied Sciences. She focuses on procurement, (healthcare/event/humanitarian) logistics & distribution, and process optimization. She has relevant project experience in: Kelly Pender Consultant Deloitte Consulting B.V. Contact details Gustav Mahlerlaan LA Amsterdam The Netherlands Mobile kpender@deloitte.nl Web Kelly is APICS CPIM and Lean Six Sigma Green Belt certified Her Master thesis focused on statistically analysing factors that influence warehouse locations in Europe for the fashion & consumer electronics industry. This research was conducted in cooperation with Deloitte Summary of relevant experience Assessed the forecasting processes of one of the largest global humanitarian UN agencies. Responsible for enabling analysis and improvements across global supply chains through a Tableau dashboard Assessed the medicine distribution for a healthcare institution through the Lean Six Sigma approach. Based on the results of the assessment and analysis a business case is developed for improvement opportunities Evaluated the cost model for a Logistics Service Provider active in retail. Conducted a cost-to-serve analysis and benchmarked the results with other LSPs. Based on the results of the analysis developed an advice for a future sustainable cost model, which fits best to their business Responsible for reducing invoice backlog of an international sportswear brand through intensive data analysis and prioritization of vendors and amounts for 25 countries in the P2P work stream. Involved in designing logistic improvement measures for a governmental institution. Main goal was to reduce external hire costs & reduce lead times. Analysed working/mgmt. processes, data and logistic routing and advised over 20 improvement measures in a Business Case Redeveloping the transport and routing of clients for a healthcare institution. This involved analysing and calculating measures to reduce costs and optimizing transport routes. Resulted in a business case including all possible measures and expected results Conducted the tendering process for the transport of clients for a healthcare institution. Designed the selection criteria, specifications and requirements together with the client in a workshop format 117
Safe Injection Equipment
 Safe Injection Equipment Industry Consultation 21 st 22 nd April 2015 Overview of UNICEF procurement of Safe Injection Equipment Rob Matthews, HTC Objective of Session Provide an overview of UNICEFs engagement
UNICEF Procurement Strategy for Safe Injection Equipment for
 Safe Injection Equipment Industry Consultation 21 st 22 nd April 2015 UNICEF Procurement Strategy for Safe Injection Equipment for 2016-2017 Rob Matthews, HTC Objective of Session Provide an overview of
UNICEF Procurement Strategy for Safe Injection Equipment for
 Safe Injection Equipment Industry Consultation 28 th 29 th March 2017 UNICEF Procurement Strategy for Safe Injection Equipment for 2018-2019 Rob Matthews, HTC Objective of Session Provide an overview of
UNICEF Nutritional Supply Chain Integration Study. June 2016
 UNICEF Nutritional Supply Chain Integration Study June 2016 1 Comparative Assessment of RUTF Supply Chain studies to inform transitional Nutrition Supply Chain Strategies 2 Objective of the study To consolidate
Ice-lined (ILR) & Solar Direct Drive (SDD) Refrigerators/ Freezers
 & Solar Direct Drive (SDD) Refrigerators/ Freezers") The Market Shaping Goal Shape markets for vaccines and other immunisation products to achieve moderate or high levels of healthy markets dynamics. Supply and Procurement Roadmap Ice-lined (ILR) & Solar
The Market Shaping Goal Shape markets for vaccines and other immunisation products to achieve moderate or high levels of healthy markets dynamics. Supply and Procurement Roadmap Ice-lined (ILR) & Solar
ANNEX I - TERMS OF REFERENCE
 ANNEX I - TERMS OF REFERENCE Review and Development of End User Monitoring (EUM) Standards and tools for Ready to Use Therapeutic Foods (RUTF) Supply Chain 1.0 Background The 2016 joint child malnutrition
Joint Assessment of National Health Strategies and Plans
 Joint Assessment of National Health Strategies and Plans Version 2: September 2011 Joint Assessment of National Health Strategies and Plans Joint Assessment Tool: the attributes of a sound national strategy
Polio tender overview. Industry Consultation UNICEF Supply Division January 2012
 Polio tender overview Industry Consultation UNICEF Supply Division 25-26 January 2012 Presentation Overview OPV Update: 2011 OPV Supply & Demand: 2012 Tender: strategic issues including Polio (OPV & IPV)
Presented by: Petter Storaas. Immunization refrigerators tender strategy 28 October 2016
 Presented by: Petter Storaas Immunization refrigerators tender strategy 28 October 2016 1 Cold chain refrigerator systems 16000 UNICEF CCE Procurement 2005-2015 (units) 14000 12000 10000 8000 6000 4000
Multiple Micronutrient Powder Supply & Outlook. UNICEF Supply Division
 Multiple Micronutrient Powder Supply & Outlook UNICEF Supply Division December 2013 Multiple Micronutrient Powder (MNP) Supply and Outlook December 2013 1. Summary MNP is a new and innovative product designed
Oral Polio Vaccine Supply Outlook. UNICEF Supply Division
 Oral Polio Vaccine Outlook UNICEF Division September 2014 Oral Polio Vaccine (OPV) Outlook September 2014 This update reports on anticipated OPV availability during 2H 2014 and 1Q 2015 for intensified
Global Fund Updates on QA, PPM, wambo.org and Supply Chain activities
 Global Fund Updates on QA, PPM, wambo.org and Supply Chain activities IPC meeting, WHO Headquarters, Geneva 22-23 June 2017 Martin Ellis, Head Supply Chain Department Sophie Logez, Manager, HPM, Supply
UNICEF s procurement process How to engage with UNICEF
 UNICEF s procurement process How to engage with UNICEF UNICEF Supply Division Dan ILIE, Contracts Officer UNICEF/UN059891/Romeo Agenda Who are we Supply & service delivery Japan and UNICEF Procurement
UNICEF Procurement Process and Control Oversights
 Safe Injection Equipment Industry Consultation 28 th 29 th March 2017 UNICEF Procurement Process and Control Oversights Rob Matthews, HTC Objective of Session UNICEF Procurement Framework Tendering Process
UNICEF Procurement and Supply Updates for OPV
 UNICEF Procurement and Supply Updates for OPV 11 th WHO/UNICEF Consultation with OPV/IPV Manufacturers and NRAs UNICEF Supply Division 25 th October 2012 Geneva Presentation overview Overview of OPV procurement
Informed Design: How Modeling Can Provide Insights to Improve Vaccine Supply Chains
 Informed Design: How Modeling Can Provide Insights to Improve Vaccine Supply Chains Well-performing immunization supply chains play a fundamental role in improving the coverage and equitable delivery of
GENERAL GUIDELINES FOR COLD CHAIN EQUIPMENT
 SUPPLY DIVISION COLD CHAIN SUPPORT PACKAGE PROCUREMENT GUIDELINES GENERAL GUIDELINES FOR COLD CHAIN EQUIPMENT Procurement Guidelines General Guidelines for Cold Chain Equipment Key information for UNICEF
Strategic inventory management through analytics
 Strategic inventory management through analytics BY SEEMA PHULL, ED LAWTON AND REGINALDO A. MONTAGUE EXECUTIVE SUMMARY Many organizations hold plenty of inventory, which in theory means they should be
Issues related to procurement of nutrition products
 Issues related to procurement of nutrition products Jan Komrska Nutrition Unit Medicines and Nutrition Centre Suppliers Meeting, 3 & 4 October 2011, Copenhagen OUTLINE Major developments since last meeting
WORLD INTELLECTUAL PROPERTY ORGANIZATION GENEVA INTERNAL AUDIT AND OVERSIGHT DIVISION INTERNAL REVIEW ON PROGRAM PERFORMANCE REPORTING PROCESS
 WIPO WORLD INTELLECTUAL PROPERTY ORGANIZATION GENEVA Reference: EV/01/2008 INTERNAL AUDIT AND OVERSIGHT DIVISION INTERNAL REVIEW ON PROGRAM PERFORMANCE REPORTING PROCESS Evaluation Section October 10,
MANHATTAN ACTIVE SUPPLY CHAIN TRANSPORTATION THE RIGHT SOLUTION FOR COMPLEX LOGISTICS NETWORKS
 MANHATTAN ACTIVE SUPPLY CHAIN TRANSPORTATION THE RIGHT SOLUTION FOR COMPLEX LOGISTICS NETWORKS ACTIVE, OPTIMIZED TRANSPORTATION MANAGEMENT Logistics complexities and service-level expectations have increased
Seba Ismaiel. UNICEF Procurement Process and Control Oversights + Outline of Tender Document
 Safe Injection Equipment Industry Consultation 21 st 22 nd April 2015 UNICEF Procurement Process and Control Oversights + Outline of Tender Document Seba Ismaiel Table of Content UNICEF Safe Injection
Integrated Planning The Sasol Oil Journey BACKGROUND LENUSHKA NAIDOO
 Integrated Planning The Sasol Oil Journey LENUSHKA NAIDOO BACKGROUND Historically, the portfolio of work for the planning function in Sasol Oil spanned production planning and high-level supply and demand
Georgia Economic Prosperity Initiative (EPI) July 16, 2014
 July 16, 2014") Supply Chain Benchmarking Survey Private Sector Competitiveness Georgia Economic Prosperity Initiative (EPI) July 16, 2014 Contents Introduction 2 Scope 4 Findings 11 Questions 28 1 Introduction Outcomes
Supply Chain Benchmarking Survey Private Sector Competitiveness Georgia Economic Prosperity Initiative (EPI) July 16, 2014 Contents Introduction 2 Scope 4 Findings 11 Questions 28 1 Introduction Outcomes
Predictive Planning Finance Transformation 12 June 2018
 Predictive Planning Finance Transformation 12 June 2018 Three main pillars drive and increase the maturity of the forecasting process Aligning Financial Strategy, Modelling Finance & Predictive & Operations
More than 2000 organizations use our ERM solution
 5 STEPS TOWARDS AN ACTIONABLE RISK APPETITE Contents New Defining Pressures Risk Appetite and Risk Tolerance Benefits The 5 Best of Practices Risk Assessments Benefits of an Actionable Risk Appetite More
Best practices in demand and inventory planning
 whitepaper Best practices in demand and inventory planning WHITEPAPER Best Practices in Demand and Inventory Planning 2 about In support of its present and future customers, Aptean sponsored this white
Gavi, the Vaccine Alliance Immunisation supply chain strategy
 Gavi, the Vaccine Alliance Immunisation supply chain strategy Daniel Thornton 30 October 2014, Copenhagen www.gavi.org Immunisation supply chain: an interconnected system involving flows of goods, funds
Active Transportation Management for the Automotive Industry
 Active Transportation Management for the Automotive Industry How Companies Can Sustainably Reduce Costs by Optimizing Transportation Processes Automotive manufacturers and suppliers fight with high costs
Effective Vaccine Management
 WHO & UNICEF Joint Statement DRAFT VERSION Effective Vaccine Management 1 P a g e The Context In the early days of EPI since its launch 40 years ago at the World Health Assembly (in May 1974), vaccines
FORECASTING & REPLENISHMENT
 MANHATTAN ACTIVE INVENTORY FORECASTING & REPLENISHMENT MAXIMIZE YOUR RETURN ON INVENTORY ASSETS Manhattan Active Inventory allows you to finally achieve a single, holistic view of all aspects of your inventory
Financial Management (FM) Harmonization Report and Guidance Note: Executive Summary. December 2012
 Harmonization Report and Guidance Note: Executive Summary. December 2012") Financial Management (FM) Harmonization Report and Guidance Note: Executive Summary December 2012 1 Financial Management Harmonization Report and Guidance Note: Executive Summary 1 Purpose of Report The
Financial Management (FM) Harmonization Report and Guidance Note: Executive Summary December 2012 1 Financial Management Harmonization Report and Guidance Note: Executive Summary 1 Purpose of Report The
Pillar II. Institutional Framework and Management Capacity
 PILLAR II. INSTITUTIONAL FRAMEWORK AND MANAGEMENT CAPACITY Pillar II. Institutional Framework and Management Capacity Pillar II assesses how the procurement system defined by the legal and regulatory framework
RUTF Tender Overview Francisco Blanco, Chief, Medicines and Nutrition Centre, UNICEF Supply Division
 RUTF Tender Overview Francisco Blanco, Chief, Medicines and Nutrition Centre, UNICEF Supply Division Consultation with RUTF Suppliers Copenhagen, 15th August, 2012 Overview of plans for RUTF Tender One
REVIEW OF BANK ASSISTANCE EFFECTIVENESS TO THE HEALTH SECTOR ( ) MANAGEMENT RESPONSE
 MANAGEMENT RESPONSE") AFRICAN DEVELOPMENT BANK GROUP REVIEW OF BANK ASSISTANCE EFFECTIVENESS TO THE HEALTH SECTOR (1987-2005) MANAGEMENT RESPONSE OPERATIONS EVALUATION DEPARTMENT (OPEV) 3 January 2006 MANAGEMENT RESPONSE REVIEW
AFRICAN DEVELOPMENT BANK GROUP REVIEW OF BANK ASSISTANCE EFFECTIVENESS TO THE HEALTH SECTOR (1987-2005) MANAGEMENT RESPONSE OPERATIONS EVALUATION DEPARTMENT (OPEV) 3 January 2006 MANAGEMENT RESPONSE REVIEW
ICMI PROFESSIONAL CERTIFICATION
 ICMI PROFESSIONAL CERTIFICATION Contact Center Management Competencies The ICMI Professional Certification Contact Center Management Competencies specify job role-specific knowledge, skills and abilities
UNICEF s Supply Function Nutrition Suppliers Meeting June 2017
 UNICEF s Supply Function Nutrition Suppliers Meeting 14-15 June 2017 Critical functions of Supply Division Support results for children with an effective, efficient supply operation Help meet UNICEF s
Best Practices in Demand and Inventory Planning
 W H I T E P A P E R Best Practices in Demand and Inventory Planning for Chemical Companies Executive Summary In support of its present and future customers, CDC Software sponsored this white paper to help
2011 Tender Overview. LLIN Suppliers Meeting UNICEF Supply Division Copenhagen, 28 th October, 2010
 2011 Tender Overview LLIN Suppliers Meeting UNICEF Supply Division Copenhagen, 28 th October, 2010 2011 TENDER METHODOLOGY REQUEST FOR PROPOSAL (RFP) SECTIONS: 1) PURPOSE; 2) BACKGROUND; 3) INSTRUCTION
Contracting and Tender process
 RUTF Pre-tender Industry Consultation 11-13 June 2018, Copenhagen Contracting and Tender process UNICEF Supply Division Akthem Fourati, Chief, Medicines and Nutrition Centre Jan Debyser, Contracts Manager
What we do. UNICEF Supply Division s work is a direct input to development programmes and emergency response
 Supply Division What we do UNICEF Supply Division s work is a direct input to development programmes and emergency response Effective, efficient supply operation for programmes Expertise on strategic-essential
11.1 TRACKING COMMODITY FINANCIAL FLOWS
 FIGURE 11-1. THE LOGISTICS CYCLE THE LOGISTICS CYCLE CHAPTER 11 FINANCING Serving Customers Cost of the health care products that are required by the health care system Source of funding for these products
Sponsor/CRO Partnership Optimization
 Insight Brief Sponsor/CRO Partnership Optimization Developing a CRO Governance Model Geoff Garabedian, Vice President and Managing Director, Consulting at Quintiles Josh Samon, Principal Life Sciences
Board Report Office of the Inspector General Agreed Management Actions Progress Report Year to Date (January to September 2017)
") Board Report Office of the Inspector General Agreed Management Actions Progress Report Year to Date (January to September 201) GF/B8/10 14-15 November 201 Geneva, Switzerland Board Information Key points
Board Report Office of the Inspector General Agreed Management Actions Progress Report Year to Date (January to September 201) GF/B8/10 14-15 November 201 Geneva, Switzerland Board Information Key points
Time to Shipment MRP Guide DBA Software Inc.
 Contents 3 Table of Contents 1 Benefits and Features 4 2 MRP Overview 6 3 MRP Phases 10 4 Phase 1 - Plan Times to Shipment 12 5 Phase 2 - Plan Supply Pipelines 25 6 Phase 3 - Generate Jobs and POs 34 7
the quick start guide
 RICS Public Sector property asset management Guidelines the quick start guide to property asset management Written for RICS by Alan D White and Keith Jones rics.org/publicsector INTRODUCTION Property asset
The SAP BusinessObjects. Supply Chain Performance
 SAP Solution in Detail SAP BusinessObjects Enterprise Performance Management Solutions SAP BusinessObjects Supply Chain Performance Management Improving Supply Chain Effectiveness The SAP BusinessObjects
GLOBAL LOGISTICS CLUSTER PREPAREDNESS WORKSHOP
 GLOBAL LOGISTICS CLUSTER PREPAREDNESS WORKSHOP 4-6 DECEMBER 2018 CAIRO, EGYPT http://www.logcluster.org/preparedness 1 Introduction The inaugural Global Logistics Cluster (GLC) Preparedness Workshop took
Guidance on portfolio, programme and project management
 Guidance on portfolio, programme and project management The Standard for Infrastructure Procurement and Delivery Management (SIPDM) defines the following two generic terms: Portfolio: collection of projects
REPORT 2015/077 INTERNAL AUDIT DIVISION
 INTERNAL AUDIT DIVISION REPORT 2015/077 Advisory engagement to assist the International Trade Centre in its efforts to develop a risk management framework 29 July 2015 Assignment No. VE2014/350/01 CONTENTS
GLOBAL PARTNERSHIP TO STOP TB STOP TB PARNTERSHIP SECRETARIAT 2003 WORKPLAN AND BUDGET EXECUTIVE SUMMARY
 GLOBAL PARTNERSHIP TO STOP TB STOP TB PARNTERSHIP SECRETARIAT 2003 WORKPLAN AND BUDGET EXECUTIVE SUMMARY DOCUMENT 6a Stop TB Coordinating Board, 28-29 October 2002, Cape Town, South Africa The Stop TB
Issue in Focus: Designing Products for Performance, Risk, and Compliance. Leveraging Product Analytics to Optimize Design Decisions and Tradeoffs
 Issue in Focus: Designing Products for Performance, Risk, and Compliance Leveraging Product Analytics to Optimize Design Decisions and Tradeoffs Tech-Clarity, Inc. 2013 Table of Contents Introducing the
The Stages of System Design
 1. ANALYSIS 1a - Advocacy, Assessment, or Event: Most countries engage in system design as a result of related planning activities or events such as during a new vaccine introduction, Effective Vaccine
CHAPTER 2: IMPLEMENTATION PHASES AND OFFERINGS
 CHAPTER 2: IMPLEMENTATION PHASES AND OFFERINGS Objectives Introduction The objectives are: Describe the purpose of the phase planning activity, preconditions, and deliverables in the implementation methodology.
Regional Supply Chain Director, East Africa Regional Office
 Regional Supply Chain Director, East Africa Regional Office Location: [Africa] [Kenya] Town/City: Nairobi Category: Supply Chain *Preferred location: Nairobi, Kenya (must be a Kenyan National) or any other
LLIN Supply Update. UNICEF Supply Division
 LLIN Supply Update UNICEF Supply Division April 2013 0 LLIN Supply Update April 2013 1. Summary In 2012, UNICEF procured 18 million Long Lasting Insecticidal Nets (LLINs). Annual LLIN procurement volume
Performance Management - Helping to Reduce World Poverty
 Department for International Development Performance Management - Helping to Reduce World Poverty REPORT BY THE COMPTROLLER AND AUDITOR GENERAL HC 739 Session 2001-2002: 12 April 2002 LONDON: The Stationery
TABLE OF CONTENTS DOCUMENT HISTORY
 TABLE OF CONTENTS DOCUMENT HISTORY 5 UPDATE 17D 5 Revision History 5 Overview 5 Optional Uptake of New Features (Opt In) 6 Update Tasks 6 Feature Summary 7 Demand Management 9 Forecast Unique Demand Segments
Organisational review of UNICEF
 Organisational review of UNICEF Request for proposals 1. Introduction While many gains have been made for the world s children, their situation remains grave in many countries. Making progress towards
Draft Proposal for the Establishment of a PMR Results Framework. May 13, 2013 draft Note PA
 Draft Proposal for the Establishment of a PMR Results Framework May 13, 2013 draft Note PA6 2013-2 Outline Background... 3 I. PMR Performance Evaluation System... 5 A. Methodology and Guidance for Evaluation...
This is the author s version of a work that was submitted/accepted for publication in the following source:
 This is the author s version of a work that was submitted/accepted for publication in the following source: Walker, Sue M., Eynstone-Hinkins, James, & Schmider, Anneke (2011) Implementation of ICD-11...
INTERNAL AUDIT DIVISION REPORT 2018/006. Audit of the United Nations Environment Programme Regional Office for Asia and the Pacific
 INTERNAL AUDIT DIVISION REPORT 2018/006 Audit of the United Nations Environment Programme Regional Office for Asia and the Pacific Effectiveness of the Office s regional presence needed to be enhanced
Global Fund Procurement Strategies & Implementation
 Global Fund Procurement Strategies & Implementation WHO/UNAIDs Annual Meeting with Manufacturers and Stakeholders 29 March 2017 Products Products Products Global Fund Procurement channels The Global Fund
An Executive s Guide to Driving ERP Efficiency in a Multiple Entity Environment
 An Executive s Guide to Driving ERP Efficiency in a Multiple Entity Environment for Optimal High-Level Performance #201 4238 Lozells Avenue Burnaby, BC V5A 0C4 +1-604-522-6300 sales@binarystream.com www.binarystream.com
Business Case for Value Realization During Implementation Delivering Projects on Time, on Budget, and on Value
 SAP Thought Leadership Value Realization Business Case for Value Realization During Implementation Delivering Projects on Time, on Budget, and on Value The Business Transformation Services group of SAP
LAVASTORM lavastorm.com. Five Technologies that Transform Auditing to Continuous Business Improvement
 Five Technologies that Transform Auditing to Continuous Business Improvement Executive Summary Internal Audit groups collect very valuable information about business operations, but in many organizations
MOPAN. Institutional report. World Food Programme (WFP) Multilateral Organisation Performance Assessment Network D O N O R
 Multilateral Organisation Performance Assessment Network D O N O R") COUNTRY MULTILATERAL D O N O R MOPAN Multilateral Organisation Performance Assessment Network Institutional report World Food Programme (WFP) Executive Summary. 2013 B. MOPAN COMMON APPROACH 2013 WFP COUNTRY
COUNTRY MULTILATERAL D O N O R MOPAN Multilateral Organisation Performance Assessment Network Institutional report World Food Programme (WFP) Executive Summary. 2013 B. MOPAN COMMON APPROACH 2013 WFP COUNTRY
The Next Generation of Inventory Optimization has Arrived
 The Next Generation of Inventory Optimization has Arrived Cutting-edge demand classification technology integrated with network optimization and simulation enables cost reduction and increased inventory
INVENTORY STRATEGY INVENTORY PLANNING AND CONTROL
 CHAPTER 7 INVENTORY STRATEGY INVENTORY PLANNING AND CONTROL 7.1 PURPOSES OF HOLDING INVENTORY Remember that the goal of a public health supply chain is to improve health outcomes. This goal is achieved
TRANSPORTATION MANHATTAN ACTIVE. A Comprehensive Solution for Complex Logistics Networks. With Manhattan Active Transportation you can:
 MANHATTAN ACTIVE TRANSPORTATION A Comprehensive Solution for Complex Logistics Networks LOGISTICS COMPLEXITIES AND SERVICE-LEVEL EXPECTATIONS have increased dramatically in today s world. Supply chains
GAVI Immunization Supply Chain Strategy. Allen Wilcox June 4, 2014
 GAVI Immunization Supply Chain Strategy Allen Wilcox June 4, 2014 Immunization Supply Chain: An Interconnected System Involving Flows of Goods, Funds and Data Immunisation planning Global supply chain
Finding Efficiencies in Zambia s Immunisation Supply Chain
 Finding Efficiencies in Zambia s Immunisation Supply Chain A Priority on Prevention Vaccines are at the core of Zambia s efforts to prevent childhood death and illness and move towards prevention rather
Audit of Human Resources Planning
 Health Canada Santé Canada Final Audit Report Audit of Human Resources Planning March 2012 Table of Contents Executive summary... i 1. Introduction... 1 1.1 Background... 1 1.2 Audit objective... 2 1.3
Predictive Project Analytics 2.0 Keep your project on target with Deloitte s data-driven insights. Risk Advisory
 Predictive Project Analytics 2.0 Keep your project on target with Deloitte s data-driven insights Risk Advisory 1 It s time for a new methodology According to Project Management Institute Research >50
Catalytic Investments for the Allocation Period
 36 th Board Meeting Catalytic Investments for the 2017-2019 Allocation Period GF/B36/04 Revision 2 16-17 November 2016, Montreux, Switzerland Board Decision Purpose of the paper: to present the Board with
A Framework for National Health Policies, Strategies and Plans
 WORLD HEALTH ORGANIZATION (WHO) CONSULTATION DOCUMENT A Framework for National Health Policies, Strategies and Plans Draft 3 June 2010 Source: WHO 2010 1 This paper reviews current practice in and the
Resource Management 2.0 The Next Chapter of Just-in-Time Resourcing
 Resource Management 2.0 The Next Chapter of Just-in-Time Resourcing Randy Mysliviec President and CEO Jenna Schofield Senior Consultant 2 2008-2017, Inc. All rights reserved. Just-in-Time Resourcing is
Discussion Paper: Shared Services
 Discussion Paper: Shared Services 23 November 2016 Overview This discussion paper presents an overview of the opportunities for the delivery of professional services for Western Sydney University (the
Preparing your organization for a Human Resource Outsourcing implementation
 IBM Global Technology Services Thought Leadership White Paper April 2013 Preparing your organization for a Human Resource Outsourcing implementation How to collaborate for a more successful transition
Presented by: Thomas Sorensen. Immunization refrigerators tenders Status and strategy 22 March 2018
 Presented by: Thomas Sorensen Immunization refrigerators tenders Status and strategy 22 March 2018 1 TENDER STATUS SINCE LAST MEETING Issuance and conclusion of RFP-DAN-2017-502469 to establish LTA prices
Mining information systems and the importance of appropriate architectural designs as key enablers for MIS deployments
 Mining information systems and the importance of appropriate architectural designs as key enablers for MIS deployments by Freddie Huyser, Optron Abstract The key in implementing mining information (MIS)
INTERNAL AUDIT DIVISION REPORT 2018/105. Audit of strategic support to the global humanitarian inter-agency coordination mechanisms
 INTERNAL AUDIT DIVISION REPORT 2018/105 Audit of strategic support to the global humanitarian inter-agency coordination mechanisms The Emergency Relief Coordinator needed to formulate a vision, mission
EXECUTIVE SUMMARY INTERNAL AUDIT REPORT. IOM Regional Office Cairo EG March Issued by the Office of the Inspector General
 EXECUTIVE SUMMARY INTERNAL AUDIT REPORT IOM Regional Office Cairo EG201702 19-30 March 2017 Issued by the Office of the Inspector General Page 1 of 9 Report on the Audit of IOM Regional Office Cairo Executive
Internal Audit of the Botswana Country Office
 Internal Audit of the Botswana Country Office September 2017 Office of Internal Audit and Investigations (OIAI) Report 2017/12 Internal Audit of the Botswana Country Office (2017/12) 2 Summary The Office
Auditing Standards and Practices Council
 Auditing Standards and Practices Council PHILIPPINE STANDARD ON AUDITING 315 UNDERSTANDING THE ENTITY AND ITS ENVIRONMENT AND ASSESSING THE RISKS OF MATERIAL MISSTATEMENT PHILIPPINE STANDARD ON AUDITING
Organizational & Management Review Draft Executive Summary
 DRAFT DOCUMENT FOR DISCUSSION AA The Global Fund to Fight AIDS, Tuberculosis and Malaria Organizational & Management Review Draft Executive Summary November 5, 2007 As it enters its second half-decade,
Catching Fraud During a Recession Through Superior Internal Controls. FICPA s 25 th Annual Accounting Show. J. Stephen Nouss September 29, 2010
 Catching Fraud During a Recession Through Superior Internal Controls FICPA s 25 th Annual Accounting Show J. Stephen Nouss September 29, 2010 1 Session Objectives Fraud Facts (2008 Association of Certified
GXS Active. Orders. Optimizing the Procure-to-Pay Process. Active Orders Process.
 www.gxs.com SM GXS Active Orders Optimizing the Procure-to-Pay Process GXS Active Orders automates the procure-to pay-process between companies and their global supplier community. Active Orders makes
TBM Awards Nomination Questionnaire
 Successful IT finance teams are more than just accountants. They fulfill several roles for helping the business get more value from technology spending and investments. As defined in the TBM Council s
Why_? Why invest in Inventory Optimization?
 Why_? Westernacher Knowledge Series Whitepaper Why invest in Inventory Optimization? For a profi table supply chain, effective inventory managment is a key factor which is often challenged by confl icting
Integrated Business Planning plus Your journey towards digital end-to-end planning
 Integrated Business Planning plus Your journey towards digital end-to-end planning Integrated Business Planning plus Your journey towards digital end-to-end planning New challenges in the market 04 From
Patrick Lydon (WHO) WHO Product Development for Vaccines Advisory Committee (PD-VAC) June 2017 Meeting
 WHO Product Development for Vaccines Advisory Committee (PD-VAC) June 2017 Meeting") The TSE Initiative is a multi-stakeholder effort. Current stakeholders are: WHO, UNICEF, Gavi, PATH, CHAI, JSI and Gates) Total Systems Effectiveness (TSE) Patrick Lydon (WHO) WHO Product Development for
The TSE Initiative is a multi-stakeholder effort. Current stakeholders are: WHO, UNICEF, Gavi, PATH, CHAI, JSI and Gates) Total Systems Effectiveness (TSE) Patrick Lydon (WHO) WHO Product Development for
Supplier Relationship Management: Building a Vendor Scorecard Process
 Supplier Relationship Management: Building a Vendor Scorecard Process Shannon Wampler Procurement & Supplier Diversity Services, University of Virginia Kristin Floyd Procurement & Supplier Diversity Services,
IMS Health Information Services Published Specifications (April 2015)
") IMS Health Information Services Published Specifications (April 2015) Introduction IMS Health is a leading provider of information and technology services for the healthcare industry, covering markets
IMS Health Information Services Published Specifications (April 2015) Introduction IMS Health is a leading provider of information and technology services for the healthcare industry, covering markets
WHO managerial reforms
 Managerial reforms Page 1 of 9 2 September 2011 WHO managerial reforms Preamble This paper is the first draft of proposals prepared by the Secretariat on managerial reforms at WHO. It synthesizes the thinking
How to Boost Introduction of Vaccines into Routine Immunization Programs: implications of procurement approaches on program costs
 How to Boost Introduction of Vaccines into Routine Immunization Programs: implications of procurement approaches on program costs 13 th International Rotavirus Symposium, Minsk, Belarus UNICEF/SUDA2014-XX228/Noorani
EVALUATION OF THE DECENTRALISATION STRATEGY AND PROCESS IN THE AFRICAN DEVELOPMENT BANK. Concept Note
 AFRICAN DEVELOPMENT BANK GROUP EVALUATION OF THE DECENTRALISATION STRATEGY AND PROCESS IN THE AFRICAN DEVELOPMENT BANK Concept Note OPERATIONS EVALUATION DEPARTMENT (OPEV) 22 October 2008 TABLE OF CONTENTS
POSSE System Review. January 30, Office of the City Auditor 1200, Scotia Place, Tower Jasper Avenue Edmonton, Alberta T5J 3R8
 1200, Scotia Place, Tower 1 10060 Jasper Avenue Edmonton, Alberta T5J 3R8 edmonton.ca/auditor POSSE System Review January 30, 2017 The conducted this project in accordance with the International Standards
Forecasting and Supply Planning for the Scale-up of New Point-of-Care EID/VL Technologies 1
 Forecasting and Supply Planning for the Scale-up of New Point-of-Care EID/VL Technologies 1 Purpose Developing a laboratory forecast is critical for ensuring the continuity of supplies and minimizing stockouts
Competitive Advantage from Production and Supply Chain Excellence Satyendra Dubey, Honeywell
 2015 Honeywell Users Group Europe, Middle East and Africa Competitive Advantage from Production and Supply Chain Excellence Satyendra Dubey, Honeywell Supplier processes Supplier processes SCOR model as