Truck GPS Data for Freight Planning
|
|
|
- Ambrose Harmon
- 6 years ago
- Views:
Transcription
 Florida DOT University of South Florida (USF) American Transportation Research Institute Date: March 6, 2012")
1 Truck GPS Data for Freight Planning presented to Florida Model Task Force, Orlando presented by Frank Tabatabaee Abdul Pinjari Jeff Short (ATRI) Florida DOT University of South Florida (USF) American Transportation Research Institute Date: March 6, 2012
2 Acknowledgements FDOT Systems Planning Office Frank Tabatabaee American Transportation Research Institute (ATRI) Jeff Short Dave Pierce Lisa Park Dan Murray 1 Graduate Students from University of South Florida Aayush Thakur Anissa Nur Irmania & Jonathan Koons
3 Background Significant growth in freight movement calls for improved freight planning and decision processes Major challenge: Inadequate data! Recent efforts to exploit technology for data collection GPS-based automatic vehicle monitoring and location (AVM) & AVL) data The ATRI-FPM Initiative Joint venture by ATRI and FHWA A national system for monitoring freight performance measures on key corridors Based on satellite data from trucking companies who use GPS technologies to monitor their fleet 2
4 Project Objectives Investigate the use of ATRI-FPM data for freight performance measurement and planning in Florida Develop methods for the following applications with the data 1. Derive freight performance measures for Florida s highways 2. Derive a truck-trip database (from ATRI-FPM data) to understand the characteristics of truck travel in Florida 3. Derive truck trip OD tables for the Florida Statewide Model 3

5 Freight Performance Measurement with ATRI-FPM GPS data Contributors Jeff Short, ATRI Dave Pierce, ATRI Lisa Park, ATRI Speeds Reliability measures Congestion Measures 4
6 APPLICATIONS OF ATRI'S DATA FOR THE STATE OF FLORIDA Average Highway Speeds Reliability Measurements Analysis of Chokepoints Measures of Corridor Demand and Freight Activity Intensity Truck Flow Analysis Origin and Destination Estimates Other Analysis
7 Application One: Average Highway Speeds Data are processed through a series of software programs to generate measures Those measures are plotted along a corridor map in a GIS environment Data can be analyzed both in terms of space mean speed and spot mean speed

8 Application One: Average Highway Speeds Sample Study Area, I-95 Miles

9 Application One: Average Highway Speeds Average Speeds by Hour, I-95 Miles 24-48
10 Application Two: Reliability Measures For both space and spot mean speed calculations, relevant reliability measures include the Travel Time Index (TTI) and Planning Time Index (PTI) TTI is the ratio of the average speed for a given highway segment at a particular time of day to the functional free flow speed of the same segment of highway. PTI is the ratio of the worst-case scenario average travel speed for a given highway segment at a particular time of day to the functional free flow speed of the same segment of highway.

11 Application Two: Reliability Measures Location of Study Corridors
12 Application Two: Reliability Measures Miami, FL - April-June 2010 Freeway Section (sorted from most congested to Polyline least congested) Length (mi) Morning Peak (6a-9a) Travel Time Index Midday (9a-4p) I-95 NB: SR 91 to SR I-95 SB: SR 84 to SR I-95 NB: I-195 to SR I-95 SB: SR 91 to I I-95 NB: US 1 to I I-95 SB: I-195 to US I-75 NB: SR 821 to I I-75 SB: I-595 to SR SR 826 NB: SR 836 to I SR 826 SB: I-75 to SR SR 91 NB: SR 821 to SR SR 91 SB: SR 852 to Sr I-75 NB: SR 826 to SR I-75 SB: SRI 821 to SR SR 826 EB: I-75 to I SR 826 WB: I-95 to I Evening Peak (4p-7p) Average Peak Period Morning Peak (6a-9a) Planning Time Index Midday (9a-4p) Evening Peak (4p-7p) Average Peak Period Travel Time Index and Planning Time Index for Eight Miami Corridors
13 Application Three: Analysis of Chokepoints Analysis of chokepoints can offer a better understanding of when, where and possibly why, congestion is occurring Study areas are often no more than 4 miles across, and are assessed in one hour increments Further analysis would provide quantification of which segments or directions of an interchange have the worst congestion

14 Application Three: Analysis of Chokepoints Bottleneck Analysis for I-4 at I-275 in Tampa from 2009 FHWA/ATRI Bottleneck Report
15 Application Four: Measures of Corridor Demand and Freight Activity Intensity Relative volume relationships between corridors. Freight Intensity Index: derived by dividing the number of position reads by the length of the segment. Data is indexed with the highest freight intensity receiving a value of 100. The FPM data can also be used to explore regional freight activities by determining the number of truck position data points contained within each county and dividing that figure by the length of the roadway segments in the county.

16 Application Four: Measures of Corridor Demand and Freight Activity Intensity Freight Intensity Index for Florida, April-June 2010

17 Application Four: Measures of Corridor Demand and Freight Activity Intensity Freight Intensity Analysis by County
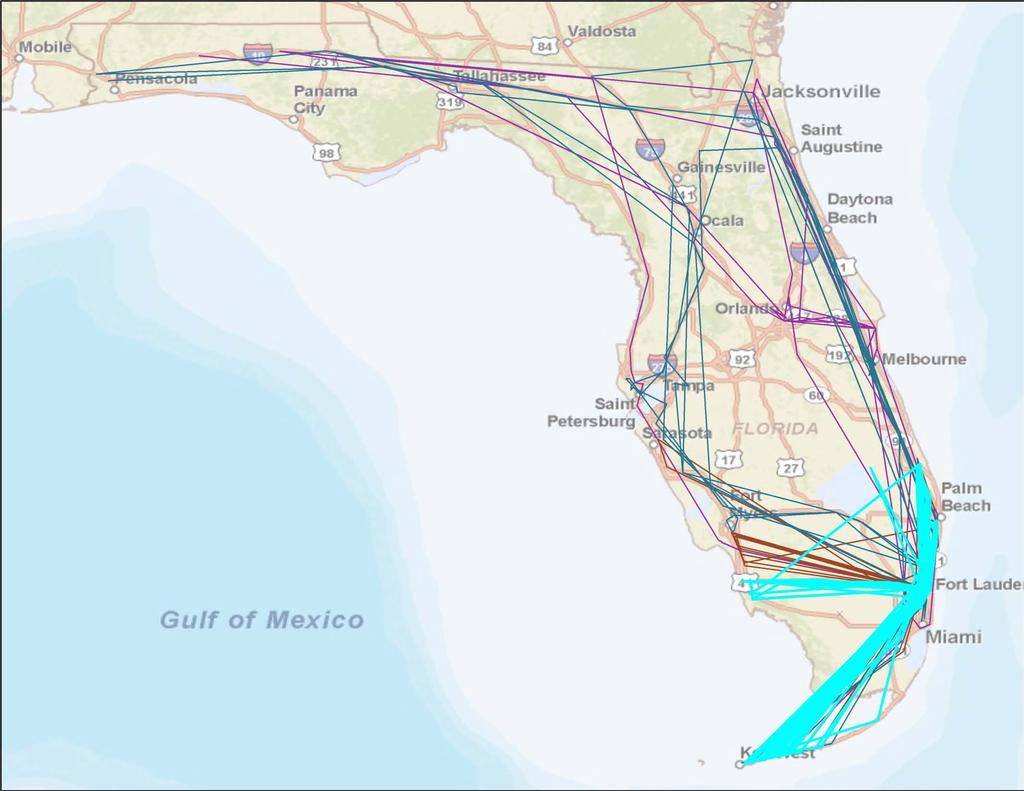
18 Application Five: Truck Flow Analysis Identify freight movement trends between geographic areas Insight into what routes are taken between two locations Sample of more than 1,000 trucks that originated in, or were traveling through, Miami on a given day; the traced paths after 7 days of truck movement are shown in red, as well as the percentage of the truck population that entered each state.

19 Miami 1,000 Truck Sample
20 1,000 Trucks After 24 Hours
21 Same 1,000 Trucks After 48 Hours
22 Same 1,000 Trucks After 72 Hours
23 Same 1,000 Trucks After 5 Days
24 Same 1,000 Trucks After 7 Days

25 Same 1,000 Trucks After 7 Days

26 25 Focus of Performance Measurement on Florida s Strategic Intermodal System (SIS)

27 PM Peak Period Speeds on Florida s SIS Highways

28 Jacksonville PM Peak Period Speeds on Florida s SIS Highways

29 Jacksonville PM Peak Period Speeds on Florida s SIS Highways

30 Tampa PM Peak Period Speeds on Florida s SIS Highways

31 PM Peak Period Speeds on Florida s SIS Highways Miami

32 Miami PM Peak Period Speeds on Florida s SIS Highways

33 Miami PM Peak Period Speeds on Florida s SIS Highways

34 33 Bottleneck Analysis
35 In-state truck routes in the data Florida I-75 Freight Route Choice Illustration 34 34

36 In-state routes unique trucks that were on I-75 during a 1week period (Oct 24-30) Florida I-75 Freight Route Choice 35 35

37 Close-up of route patterns in Gainesville /Ocala region Florida I-75 Freight Route Choice 36 36

38 1333 of the 4000 trucks crossed I-75 here 37 Florida I-75 Freight Route Choice 37

39 949 trucks took this route 308 trucks took this route Of the 1333 trucks that crossed I-75 here Florida I-75 Freight Route Choice 38 38
40 Project Objectives Investigate the use of ATRI-FPM data for freight measurement and planning in Florida Derive freight performance measures for Florida s highways Derive a truck-trip database from ATRI-FPM data Convert GPS data streams to truck trips, and analyze truck travel characteristics in Florida Billions of GPS data points! Needed to simplify the problem (Seasonality of truck flows) Derive truck trip OD tables for the Florida Statewide Freight model 39

41 Seasonality in the Florida Truck Count Data Vehicle Count Station Locations in Florida Count Stations SIS Highway Network 40
42 Truck Counts by Month of the Year Truck Flows in Florida (Counts for all Trucks) by Month 95th Percentile 75th Percentile Median 25th Percentile Trucks per day Mean 5th Percentile
43 Truck Counts by Month of the Year Trucks per day Florida Truck Flows (Counts for Single Unit Trucks) by Month Mean 95th Percentile 75th Percentile Median 25th Percentile 5th Percentile Trucks per day Florida Truck Flows (Counts for Tractor-Trailers) by Month 95th Percentile 75th Percentile Median 25th Percentile 5th Percentile Mean 42
44 Truck Counts by Day of Week Florida Truck Flows (Counts for all Trucks) by Day of Week 95th Percentile 75th Percentile Median Mean 25th Percentile 5th Percentile Trucks per day AADT Sunday Monday Tuesday Wednesday Thursday Friday Saturday 43
45 Truck Counts by Day of Week Florida Truck Flows (Counts for Single Unit Trucks) by Day of Week 95th Percentile 75th Percentile Median 25th Percentile Trucks per day Mean 5th Percentile 44 Trucks per day AADT Sunday Monday Tuesday Wednesday Thursday Friday Saturday Florida Truck Flows (Counts for Tractor-Trailers) by Day of Week Mean AADT Sunday Monday Tuesday Wednesday Thursday Friday Saturday 95th Percentile 75th Percentile Median 25th Percentile 5th Percentile
46 Conversion of GPS Data Streams to Truck Trips Seasonality analysis of the truck count data suggests Seasonal variation not significant Weekday vs. weekend differences Experience with one week of GPS data Take all trucks that were in Florida at any time during 1 week Start with GPS traces of those trucks within Florida (1.5 Million traces) Then trace those trucks outside Florida as well (4.35 Million traces) Initial results in next slides Next step: Derive trips from multiple weeks of data (2-3 months) 45

47 46 Examples of truck movements in the data
48 47 47
49 Distance vs. Time between Consecutive GPS Points: 1 Week GPS Data within and Outside Florida Distance between 2 consecutive points (in miles) > 400 Total Cum% % % Time difference between 2 consecutive points (in minutes) % % % % % % % % % % > % Total Cum% 32.28% 50.24% 67.03% 78.30% 91.57% 95.88% 99.50% 99.87% 99.97% 99.97% 99.99% %
50 Trips Extracted from 1 Week Data within Florida: Trip Length Distribution Length of trip (in miles) th Percentile 75th Percentile Median 25th Percentile 5th Percentile 49
51 Trips Extracted from 1 Week Data within Florida: Trip Duration Distribution Mean Duration of trip (in minutes)
 140 120 100 80 60")
52 Trips Extracted from 1 Week Data within & Outside FL: Trip Length Distribution Length of trip (in miles)
 220 200 180 160 140 120 100 80 60 40 20 0")
53 Trips Extracted from 1 Week Data within & Outside FL: Trip Duration Distribution Duration of trip (in minutes)

 Speeds")
54 Scatter Plots Trip length vs. Trip duration For 1-week dataset within Florida (52526 trips) Speeds range from 5mph to 65mph For 1-week dataset within & outside Florida ( trips) Speeds range from 5mph to 70mph 53
55 Conversion of GPS Data Streams to Truck Trips Next steps on deriving a truck trip database Validate and refine the algorithm Overlay the trips onto land-use GIS layers to refine trips data Derive trips from multiple weeks of data (2-3 months) 54
56 Project Objectives Investigate the use of ATRI-FPM data for freight measurement and planning in Florida Derive freight performance measures for FL highways Derive a truck-trip database from ATRI-FPM GPS data Derive truck trip OD tables for the Florida Statewide Freight model The trips derived from the GPS data is a sample (large sample) Need a way to arrive at the population of truck flows Exploring the use of different data sources and methods The 100% truck count data, and OD estimation methods Linking truck flows with commodity flows (e.g., Transearch) Parcel/TAZ-level industry employment data 55
57 Thank You Questions/Discussion 56
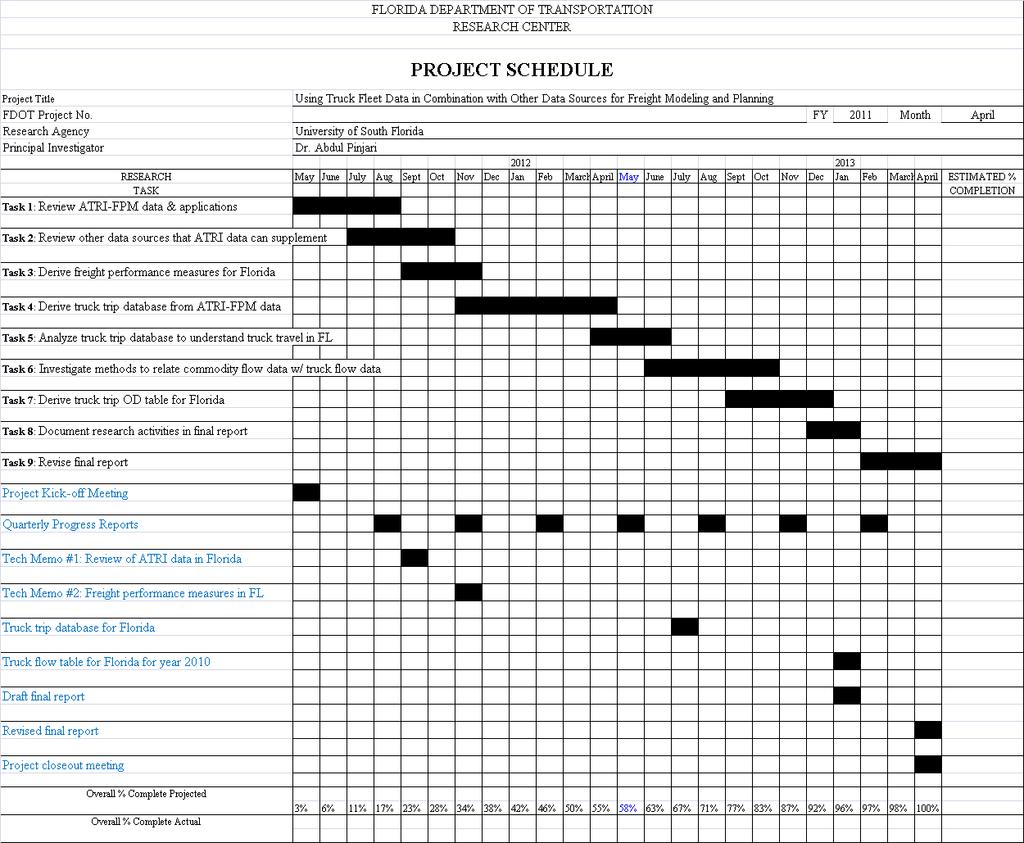
58 Additional Slides (for Q&A) 57 Task Schedule 1. Review ATRI s truck GPS (i.e., ATRI-FPM data) & applications May 2011 Aug Review other data sources that ATRI-FPM data can supplement, and how ATRI-FPM data can be combined w/ other data sources. July 2011 Oct Derive freight performance measures for Florida s highways Sept 2011 Nov Derive a truck trip database from ATRI s truck GPS data Nov 2011 April Analyze truck trip database to understand truck travel in FL April 2012 June Investigate ways to relate commodity flows with truck flows June 2012 Oct Derive a truck trip OD table for a reasonable level of geography Sept 2012 Dec and 9. Final research report, review by FDOT, and revisions Dec 2012 April 2013
59 Task 1: Review ATRI s data and Applications (Complete) Review ATRI s truck GPS data and applications Materials describing the data Review of the data in Florida Synthesis of the data applications Meeting between USF, ATRI, and FDOT Identify subsets of data for further applications Identify the geographical/network/temporal scope for applications Other Administrative Kick-off meeting mechanism to transfer large datasets between ATRI & USF Non-disclosure agreement between ATRI and USF 58
60 Task 2: Review other freight data sources that can be used in conjunction with ATRI s truck GPS data (Complete) Data reviewed Commodity flow data (e.g., Transearch, FAF) Traffic counts, ITS data, local survey data Literature reviewed Work with Freight GPS data NCHRP/NCFRP reports Freight-exclusive conference proceedings Work within Florida (e.g., disaggregation of FAF) 59
61 Task 3: Derive Freight Performance Measures for the highway network in Florida (ongoing, ATRI is the lead) Performance measures Speeds Reliability measures Congestion measures Geographical, network, and Temporal scope Florida s SIS network Peak travel months Different time periods of the day 60
62 Task 4: Derive a truck trip database from the ATRI-FPM data (ongoing, USF is the lead) GPS data streams are being converted into trips Identify trip end locations, determine non-congestion stops, stops at signals Trip start and end times, trip distance, speed, dwell time Will result in the following: Algorithms to convert the GPS data streams to truck trips A truck trip database for Florida Task 5: Analyze the truck trip database Analyze the truck trip travel characteristics such as trip distances, trip travel times, speeds, time of day, dwell time, etc. 61 Compare the above characteristics to those from available truck trip data (e.g., survey data)
63 Task 6: Investigate methods to relate commodity flows with truck flows Develop relationships between commodity flows and truck flows at an aggregate-level for which both commodity flow and truck flow data is available The above relationships can be used to derive truck flows at a disaggregate level (using commodity flows at disaggregate level) Other methods being reviewed as well Task 7: Derive a 2010 year truck trip OD table for the Florida Statewide model Tasks 8 and 9: Final report, and revisions. 62
64 Deliverables Kick-off meeting Quarterly progress reports Technical Memorandum-1 (Review of the applications of ATRI data) Freight performance measures for FL Truck trip database for Florida Truck flow OD table for Florida Final research report Project closure meeting 63
65 64
66 3 Truck ID = i Initialize x=0 Get record x for truck ID i from GPS database Is spot speed = 0? Y Flag x as Origin Initialize tl, tpt, tps, odwt, ddwt, sdwt, pm and ps x = x+1 Initialize and calculate td, trt and trs between x-1 and x x = x+1 N 1 Truck Trip Origin Destination Identification Variable descriptions: Algorithm Flag as incomplete trip with x-1 as destination, Calculate pm=pm-1 Flag as incomplete trip with x-1 as destination, Calculate pm=pm-1 Flag as complete trip with x-1 as destination Flag as complete trip with x-1 as destination Y Y Is spot speed = 0? N Is spot speed (x-1) = 0? N Y N Is spot speed (x-1) = 0? 1. Trip length (tl) Total spatial distance traveled by the truck between origin and destination 2. Trip time (tpt) Total time taken to travel from origin to destination 3. Trip speed (tps) Average speed of truck during the trip (tl/tpt) 4. Travel distance (td) Spatial distance between two geographic (GPS) location records 5. Travel time (trt) Time difference between two geographic (GPS) location records 6. Travel speed (tps) Average speed of truck between the two GPS records (td/trt) 7. Origin dwell time (odwt) Total time duration of stop at origin i.e. when the truck is not moving 8. Destination dwell time (ddwt) Total time duration of stop at destination 9. Stop dwell time (sdwt) Stop duration at traffic stops 10. Total stop dwell time (tsdwt) Total stop duration at traffic stops 11. Points motion (pm) Number of GPS records skipped when truck is in motion 12. Points stop (ps) Number of GPS records skipped when the truck is not moving or is at a stop 13. Points traffic stops (pts) Number of GPS records skipped when truck is at a traffic stop Calculate tl=tl+td; tpt=tpt+trt; tps=tl/tpt N Is spot speed = 0? Flag as incomplete trip Y Next Truck ID N Is trt>3 min? Y Flag as destination Is trt>0? Y N Record x is the last record? Y Next Truck ID Is td>528 ft & trt>30 min? Y N N N Is spot speed = 0? Y Is spot speed (x-1) = 0? Y Is sdwt>3 min? Y 3 Calculate tl=tl+td; tpt=tpt+trt; tps=tl/tpt; sdwt=0; pm=pm+1 N N Y Is trt>3 min? Y Is trs>0.2 mph? N N Is trt>3 min? Y Is td>528 ft? Y N Y N Is tl>0? N Is td>528 ft? N Y Is trt>3 min? N Calculate sdwt = sdwt+trt; tsdwt = tsdwt+trt; pts=pts+1 Y Is tl>0? Flag as estimated trip with x-1 as destination, Calculate pm=pm-1 2 Y Calculate tl=tl+td; tpt=tpt+trt; tps=tl/tpt; pm=pm+1 3 Is spot speed (x-1) = 0? Calculate ddwt=ddwt+trt 1 N Y Calculate tpt=tpt-trt; odwt=odwt+trt Flag x-1 as origin of next trip Calculate sdwt = sdwt+trt; tsdwt = tsdwt+trt; pts=pts+1 2 N Calculate tl=tl+td; tpt=tpt; tps=tl/tpt; ddwt=ddwt+trt Calculate tl=tl+td; tpt=tpt+trt; tps=tl/tpt Flag x as destination of complete trip Flag x as origin of next trip Y Is trt>3 min? Calculate sdwt = sdwt+trt; tsdwt = tsdwt+trt; pts=pts+1 2 N Calculate odwt = odwt+trt; ps=ps Flag x-1 as destination of complete trip Flag x-1 as origin of next trip
67 Trips Extracted from 1 Week Data within Florida Trip length Vs. Trip Duration Length of trip (in miles) > 400 Total Duration of the trip (in minutes) Total
68 Trips Extracted from 1 Week Data within & Outside FL Trip length Vs. Trip Duration Length of trip (in miles) > 400 Total Duration of the trip (in minutes) Total
Truck GPS Data for Freight Performance Measurement and Planning: Applications, Issues, and Opportunities
 Truck GPS Data for Freight Performance Measurement and Planning: Applications, Issues, and Opportunities presented to Florida Model Task Force, Freight Committee presented by Abdul Pinjari - University
Project Title: Using Truck GPS Data for Freight Performance Analysis in the Twin Cities Metro Area Prepared by: Chen-Fu Liao (PI) Task Due: 12/31/2013
 Task Due: 12/31/2013") Project Title: Using Truck GPS Data for Freight Performance Analysis in the Twin Cities Metro Area Prepared by: Chen-Fu Liao (PI) Task Due: 12/31/2013 TASK #5: IDENTIFY FREIGHT NODE, FREIGHT SIGNIFICANT
Project Title: Using Truck GPS Data for Freight Performance Analysis in the Twin Cities Metro Area Prepared by: Chen-Fu Liao (PI) Task Due: 12/31/2013 TASK #5: IDENTIFY FREIGHT NODE, FREIGHT SIGNIFICANT
I 94/90 (TWIN CITIES CHICAGO) 10/2/2009. Objectives
 10/2/2009. Objectives") USING ARCHIVED TRUCK GPS DATA FOR FREIGHT PERFORMANCE ANALYSIS ON INTERSTATE I 94/I 90 FROM THE TWIN CITIES TO CHICAGO Chen Fu Liao Minnesota Traffic Observatory Department of Civil Engineering 09/15/2009
USING ARCHIVED TRUCK GPS DATA FOR FREIGHT PERFORMANCE ANALYSIS ON INTERSTATE I 94/I 90 FROM THE TWIN CITIES TO CHICAGO Chen Fu Liao Minnesota Traffic Observatory Department of Civil Engineering 09/15/2009
Florida Freight Supplychain Intermodal Model
 Florida Freight Supplychain Intermodal Model Innovations in Travel Modeling 2014 April 29, 2014 Introduction Support freight plan development Office of Freight Logistics and Passenger Operations Evaluate
Freight Performance Analysis on I-94/I-90 From the Twin Cities to Chicago
 Freight Performance Analysis on I-94/I-90 From the Twin Cities to Chicago Chen-Fu Liao Minnesota Traffic Observatory Department of Civil Engineering Session 23: Freight and Rail Planning April 27-28, 2010
Florida Multimodal Statewide Freight Model
 Florida Multimodal Statewide Freight Model Model inputs and structure, and integration with regional truck-touring models Presented by Colin Smith, RSG Freight Issues in Florida Florida has a large, complex,
Using Archived Truck GPS Data for Freight Performance Analysis on I-94/I-90 from the Twin Cities to Chicago
 Using Archived Truck GPS Data for Freight Performance Analysis on I-94/I-90 from the Twin Cities to Chicago Final Report Prepared by: Chen-Fu Liao Department of Civil Engineering University of Minnesota
PORT OF FERNANDINA TRUCK CIRCULATION STUDY
 OCTOBER 2015 PREPARED FOR: I. Introduction... 1 II. Study Area... 1 III. Field Data Collection... 3 IV. Existing Traffic... 5 V. Truck Circulation Analysis... 8 VI. Peak Hour Intersection Analysis... 10
Estimation of Statewide Origin-Destination Truck Flows Using Large Streams of GPS Data: An Application for the Florida Statewide Model
 Estimation of Statewide Origin-Destination Truck Flows Using Large Streams of GPS Data: An Application for the Florida Statewide Model Akbar Bakhshi Zanjani Graduate Research Assistant Department of Civil
2013 Mid-Continent Research Symposium
 Mr. Tracy Troutner, Federal Highway Administration Dr. Nadia Gkritza, Iowa State University Dr. Jiangping Zhou, Iowa State University Dr. Bobby Martens, Iowa State University 2013 Mid-Continent Research
National Capital Region Congestion Report
 NATIONAL CAPITAL REGION TRANSPORTATION PLANNING BOARD National Capital Region Congestion Report 4th Quarter 2014 Metropolitan Washington Council of Governments 777 North Capitol Street, N.E., Suite 300,
Travel Time Reliability in the SLOCOG Region. October 27, 2014 San Luis Obispo Council of Governments Transportation Education Series
 Travel Time Reliability in the SLOCOG Region October 27, 2014 San Luis Obispo Council of Governments Transportation Education Series 1 Transportation Education Series - Agenda Grab Some Free Lunch!! Introductions
Statewide Bluetooth Data Collection
 Statewide Bluetooth Data Collection presented by Thomas Hill Florida Department of Transportation State Transportation Systems Modeling Division December 7, 2016 Purpose To develop and test the feasibility
Memphis, TN 38152, USA, Phone: ,
 0 0 0 0 Analysis of Freight Corridors Using Truck GPS Data Flaskou, M. (corresponding author) Graduate Research Assistant, Department of Civil Engineering, Intermodal Freight Transportation Institute,
National Capital Region Congestion Report
 Item #6 TPB Technical Committee May 2, 2014 NATIONAL CAPITAL REGION TRANSPORTATION PLANNING BOARD National Capital Region Congestion Report 4th Quarter 2013 (DRAFT) Metropolitan Washington Council of Governments
North I-75 Master Plan Summary
 North I-75 Master Plan Summary Florida Section ITE Annual Meeting November 3, 2017 The I-75 Relief Task Force Established by Secretary Boxold in October 2015 with broad membership Overarching goals Provide
TRANSPORTATION RESEARCH BOARD. Spatial Modeling for Highway Performance Monitoring System Data: Part 1. Tuesday, February 27, :00-4:00 PM ET
 TRANSPORTATION RESEARCH BOARD Spatial Modeling for Highway Performance Monitoring System Data: Part 1 Tuesday, February 27, 2018 2:00-4:00 PM ET The Transportation Research Board has met the standards
New Mexico Statewide Model
 New Mexico Statewide Model Fifth Largest State in land area 2005 Population 1.97 million 42% of state in Albuquerque and Santa Fe area Outside urban areas population density very low New Mexico Planning
Dec 20, 2007 Operations Performance Measures Conference Call
 Dec 20, 2007 Operations Performance Measures Conference Call Required Accuracy of Measures Performance Measure Traffic Engineering Transportation Planning Applications Traffic Management OPERATIONS Traveler
Developing a Methodology for Deriving Cost Impacts to the Trucking Industry that Generate from Freight Bottlenecks
 Developing a Methodology for Deriving Cost Impacts to the Trucking Industry that Generate from Freight Bottlenecks Principal Investigator: Jeffrey Short Senior Research Associate American Transportation
Origin-Destination Trips and Skims Matrices
 Origin-Destination Trips and Skims Matrices presented by César A. Segovia, AICP Senior Transportation Planner AECOM September 17, 2015 Today s Webinar Content Matrix Estimation Data sources Florida Application
SOUTHEAST FLORIDA FSUTMS USERS GROUP
 THE POWER OF WHERE AND WHEN SOUTHEAST FLORIDA FSUTMS USERS GROUP OD Data GPS Update Travel Time Validation Bill King, P.E. Sr. Director of Business Development 9/14/2018 1 AirSage The Leading Solutions
6.0 CONGESTION HOT SPOT PROBLEM AND IMPROVEMENT TRAVEL DEMAND MODEL ANALYSIS
 6.0 CONGESTION HOT SPOT PROBLEM AND IMPROVEMENT TRAVEL DEMAND MODEL ANALYSIS 6.1 MODEL RUN SUMMARY NOTEBOOK The Model Run Summary Notebook (under separate cover) provides documentation of the multiple
Telling the Freight (trucking/goods movement) story:
 story:") Telling the Freight (trucking/goods movement) story: Urban Mobility Report truck elements Trucks in Texas 100 Connection to Texas Freight Network Improving data for truck analyses Solutions/uses Observations
Telling the Freight (trucking/goods movement) story: Urban Mobility Report truck elements Trucks in Texas 100 Connection to Texas Freight Network Improving data for truck analyses Solutions/uses Observations
Using INRIX Data in Iowa. Kyle Barichello, Iowa DOT Skylar Knickerbocker, InTrans
 Using INRIX Data in Iowa Kyle Barichello, Iowa DOT Skylar Knickerbocker, InTrans What is probe data? What is INRIX data? INRIX Data Overview Purchased traffic data Covers Interstates, State Highway, some
Freight & Modal Data Program. MPOAC Freight Committee Quarterly Meeting January 26, 2017 Sunrise, Florida
 Freight & Modal Data Program MPOAC Freight Committee Quarterly Meeting January 26, 2017 Sunrise, Florida Overview Mission & Goals Freight Data Programs Recent and Upcoming Activities Mission & Goals FDOT
TAMING BIG DATA FOR SMARTER FUTURE
 2015 APA National Planning Conference Function Code: S585 TAMING BIG DATA FOR SMARTER FUTURE Ed Hutchinson OVERVIEW 1. Enterprise Information Management (EIM) 2. Data Clearing House 3. Florida Transportation
Goleta Ramp Metering Study
 DRAFT Technical Memorandum Goleta Ramp Metering Study Subtasks 2.1 and 2.2: Data Collection and Existing Baseline Analysis June 5, 2017 DRAFT Technical Memorandum Goleta Ramp Metering Study Subtasks 2.1
National Capital Region Congestion Report
 NATIONAL CAPITAL REGION TRANSPORTATION PLANNING BOARD National Capital Region Congestion Report 2nd Quarter 2014 Metropolitan Washington Council of Governments 777 North Capitol Street, N.E., Suite 300,
Arterial Performance Measures Re-Identification Software Demonstration
 Arterial Performance Measures Re-Identification Software Demonstration Stanley E. Young, Dennis So Ting Fong Arterial Performance Measures Re-Identification Software Demonstration Stanley E. Young Traffax,
NATMEC June 30, 2014 Anita Vandervalk, PE, PMP
 NATMEC June 30, 2014 Anita Vandervalk, PE, PMP Agenda 1. Florida s MPM Program 2. Research Efforts and Progress 3. Source Book 4. Transitioning to Real Time Data 5. Next Steps Importance of Mobility Providing
Linking Planning to Programming
 AASHTO SCOP Corridor Profile Studies Linking Planning to Programming Dave Perkins, Kimley-Horn P2P Link Corridor Performance-Based Needs Assessment Primary Measure Pavement Bridge Mobility Safety Freight
CLOGGED ARTERIES: AN EMPIRICAL APPROACH FOR IDENTIFYING AND ADDRESSING LOCALIZED HIGHWAY CONGESTION BOTTLENECKS
 CLOGGED ARTERIES: AN EMPIRICAL APPROACH FOR IDENTIFYING AND ADDRESSING LOCALIZED HIGHWAY CONGESTION BOTTLENECKS Vivek Sakhrani, PhD, CPCS Transcom Inc. (USA) Tufayel Chowdhury, CPCS Transcom Limited (Canada)
Innovative Assignment Process for a Statewide Model
 Innovative Assignment Process for a Statewide Model William G. Allen, Jr., PE TRB Innovations in Travel Modeling Conference Atlanta June 2018 1 New Statewide Travel Model for Kansas Conventional four-step
Long Range Transportation Plan Project Status Update
 HEPMPO Webinar Meeting Long Range Transportation Plan Project Status Update Michael Baker Jr., Inc. Foursquare Integrated Transportation Planning December 4, 2013 1 Meeting Agenda 1. Project Overview 2.
: Developing Freight Performance Measures Using GPS Truck Data
 -: Developing Freight Performance Measures Using GPS Truck Data Zach Johnson Department of Civil Engineering, University of Memphis, TN, Engineering Administration Bldg., Central Avenue, Memphis, TN,,
Analysis of Travel Time Reliability for Freight Corridors Connecting the Pacific Northwest
 Portland State University PDXScholar Civil and Environmental Engineering Faculty Publications and Presentations Civil and Environmental Engineering 11-2012 Analysis of Travel Time Reliability for Freight
Additional Performance Measure Discussion and Analysis Procedures
 APPENDIX D Additional Performance Measure Discussion and Analysis Procedures This appendix includes additional discussion and more detailed information about truck bottleneck performance measures and analysis
The Auckland Transport Models Project - Overview and Use to Date -
 The Auckland Transport Models Project - Overview and Use to Date - John Davies (Auckland Regional Council) Jojo Valero (Auckland Regional Council) David Young (David Young Consulting) Auckland Transport
Mobility Performance Measures
 Mobility Performance Measures Doug McLeod (MAP 21 measures) FDOT Mobility Performance Measures Program Manager TRB Performance Measurement Committee Jessica VanDenBogaert (additional performance measures)
Multi-Resolution Traffic Modeling for Transform 66 Inside the Beltway Projects. Prepared by George Lu, Shankar Natarajan
 Multi-Resolution Traffic Modeling for Transform 66 Inside the Beltway Projects Prepared by George Lu, Shankar Natarajan 2017 VASITE Annual Meeting, June 29, 2017 Outline Transform I-66 Inside the Beltway
Crystal Jones. Office of Freight Management and Operations. USDOT Federal Highway Administration
 Crystal Jones Office of Freight Management and Operations USDOT Federal Highway Administration September 2007 Context 25% of the U.S. GDP is related to international trade and is predicted to grow to 35%
2015 AMARILLO MPO EXTERNAL STUDY
 2015 AMARILLO MPO EXTERNAL STUDY Technical Summary August 2018 Prepared by the Texas A&M Transportation Institute 2015 Amarillo MPO External Study Using Cellular and GPS Data Technical Summary Texas Department
FREEWAY PERFORMANCE MEASUREMENT SYSTEM (PeMS): AN OPERATIONAL ANALYSIS TOOL
: AN OPERATIONAL ANALYSIS TOOL") FREEWAY PERFORMANCE MEASUREMENT SYSTEM (PeMS): AN OPERATIONAL ANALYSIS TOOL Tom Choe Office of Freeway Operations California Department of Transportation District 7 120 S Spring Street Los Angeles, CA
FREEWAY PERFORMANCE MEASUREMENT SYSTEM (PeMS): AN OPERATIONAL ANALYSIS TOOL Tom Choe Office of Freeway Operations California Department of Transportation District 7 120 S Spring Street Los Angeles, CA
Florida s Approach to Maximizing Advances in Data and Technology for Performance Management
 Florida s Approach to Maximizing Advances in Data and Technology for Performance Management June 2, 2015 Topics 1. Florida s MPM Program 2. Data needs and sources 3. Use of measured data vs modeled 4.
A geographic information system for dynamic ridematching
 University of South Florida Scholar Commons Graduate Theses and Dissertations Graduate School 2005 A geographic information system for dynamic ridematching Sasha Dos-Santos University of South Florida
Port Everglades Petroleum Commodity Flow Pilot Study
 Port Everglades Petroleum Commodity Flow Pilot Study presented by Peter Haliburton, Cambridge Systematics Min-Tang Li, FDOT-D4 December 9, 2015 Outline Objectives Technology Application Partners Data Analysis
Air Quality Analysis Technical Memorandum
 Air Quality Analysis Technical Memorandum Segment 2: State Road 400 (SR 400) / Interstate 4 (I-4) from West of SR 528 (Beachline Expressway) to West of SR 435 (Kirkman Road) Orange County (75280), Florida
Tampa, Florida: High Resolution Simulation of Urban Travel and Network Performance for Estimating Mobile Source Emissions
 74 Tampa, Florida: High Resolution Simulation of Urban Travel and Network Performance for Estimating Mobile Source Emissions Authors: Sashikanth Gurram, Abdul R. Pinjari, and Amy L. Stuart 74.1 Introduction
Modeling Truck Traffic Volume Growth Congestion
 Modeling Truck Traffic Volume Growth Congestion By Mr. Gregory Harris, P. E. (Principal Investigator) Office of Freight, Logistics and Transportation The University of Alabama in Huntsville Huntsville,
What is the Dakota County Principal Arterial Study?
 What is the Dakota County Principal Arterial Study? The Dakota County is underway and will address future designations of certain highways as Principal Arterials. What Are Principal Arterials? Principal
Interactive Data Visualization Tools for Travel Demand Model Datasets. Shuyao Hong
 Interactive Data Visualization Tools for Travel Demand Model Datasets Shuyao Hong GIS-T Symposium Phoenix, Arizona April 10-13, 2017 MAG Modeling Area Area: 16,080 Square Miles Population: 4.9 Million
Air Quality Technical Report PM2.5 Quantitative Hot spot Analysis. A. Introduction. B. Interagency Consultation
 Air Quality Technical Report PM2.5 Quantitative Hot spot Analysis I 65, SR44 to Southport Road (Segmented from SR44 to Main Street and Main Street to Southport Road) A. Introduction This technical report
Corpus Christi Metropolitan Planning Organization Regional Travel Speed Study Flynn Parkway, Suite 404 Corpus Christi, TX 78411
 Corpus Christi Metropolitan Planning Organization 2006 Regional Travel Speed Study Prepared for: Corpus Christi Metropolitan Planning Organization 5151 Flynn Parkway, Suite 404 Corpus Christi, TX 78411
Truck Route Choice Modeling using Large Streams of GPS Data
 CAIT-UTC-NC32 Truck Route Choice Modeling using Large Streams of GPS Data FINAL REPORT July 2017 Submitted by: Divyakant Tahlyan Abdul R. Pinjari, Ph.D. (Principal Investigator) Trang D. Luong, EIT Seckin
Chicago s Transportation Infrastructure: Integrating and Managing Transportation and Emergency Services
 Chicago s Transportation Infrastructure: Integrating and Managing Transportation and Emergency Services David Zavattero City of Chicago OEMC UIC IGERT Seminar May 21, 2009 /daz1d/present/uic-igert-data_may2009.ppt
OKI Congestion Management System Analysis. Data Collection Report Year 1
 OKI Congestion Management System Analysis Data Collection Report Year 1 May 2002 Prepared by the Ohio-Kentucky-Indiana Regional Council of Governments Acknowledgments Title OKI Congestion Management System
Freight Transportation Planning and Modeling Spring 2012
 Freight Model Validation Techniques Abstract Several reviews of validation techniques for statewide passenger and freight models have been published over the past several years. In this paper I synthesize
2015 ABILENE MPO EXTERNAL STUDY
 2015 ABILENE MPO EXTERNAL STUDY Technical Summary August 2018 Prepared by the Texas A&M Transportation Institute 2015 Abilene MPO External Study Using Cellular and GPS Data Technical Summary Texas Department
COMPASS Freight Study
 COMPASS Freight Study Using Readily Available Data to Understand Freight Mobility and Land Use Needs in a Growing Region Mary Ann Waldinger, COMPASS Donald Ludlow, CPCS COMPASS Area Anchors I-84 Trade
Massive GPS Travel Pattern Data for Urban Congestion Relief in the Twin Cities
 Massive GPS Travel Pattern Data for Urban Congestion Relief in the Twin Cities 27th Annual CTS Transportation Research Conference Paul Morris, PE SRF Consulting Group, Inc. November 3, 2016 Project Location
Presented to : I 710 Project Committee June 30, 2011
 Presented to : I 710 Project Committee June 30, 2011 Overview Metro s Public Private Partnership (PPP) program Traffic Effects of Tolling Trucks on I 710 Statutory Authority for Tolling Interstate Highways
Presented by Andrew Velasquez URS Corporation/Florida s Turnpike Enterprise
 Presented by Andrew Velasquez URS Corporation/Florida s Turnpike Enterprise Traffic and Revenue Study Assessment of the viability of tolling a facility and expected toll revenue over a long term time frame.
Traffic/Mobility Analytics
 Daniel P. Farley Section Chief Traffic Operations Deployment and Maintenance dfarley@pa.gov 717-783-0333 How PennDOT is using large vehicle probe and crowd source information to begin to better plan, design,
Department of Civil and Environmental Engineering. Department of Civil and Environmental Engineering
 1 ROAD USER IMPACTS DUE TO SPEED LIMIT REDUCTION IN WORK ZONES WHICH TOOL IS BEST: QUICKZONE OR VISUM? 4 Bhagavan Nadimpalli * 5 Department of Civil and Environmental Engineering University of Utah 7 S.
SR 60 Grade Separation over CSX Railroad Traffic Technical Memorandum
 To: Marlon Bizerra, PE From: Thirulokesh Krishnan Email: thirulokesh.krishnan@atkinsglobal.com Phone: 210.321.2019 Date: Nov 25, 2014 Ref: cc: Kim Warren, Doug Reed, PE Subject: SR 60 Grade Separation
Final Report. Improving Mobility Information with Better Data and Estimation Procedures
 Improving the Quality of Life by Enhancing Mobility University Transportation Center for Mobility DOT Grant No. DTRT06-G-0044 Improving Mobility Information with Better Data and Estimation Procedures Final
9. TRAVEL FORECAST MODEL DEVELOPMENT
 9. TRAVEL FORECAST MODEL DEVELOPMENT To examine the existing transportation system and accurately predict impacts of future growth, a travel demand model is necessary. A travel demand model is a computer
Exclusive Facilities for Trucks in Florida: An Investigation of the Potential for Reserved Truck Lanes and Truckways on the State Highway System
 Exclusive Facilities for Trucks in Florida: An Investigation of the Potential for Reserved Truck Lanes and Truckways on the State Highway System Stephen L. Reich, Janet L. Davis, Anthony J. Ferraro, and
Tampa, Florida: High-Resolution Simulation of Urban Travel and Network Performance for Estimating Mobile Source Emissions
 CHAPTER 90 Tampa, Florida: High-Resolution Simulation of Urban Travel and Network Performance for Estimating Mobile Source Emissions Sashikanth Gurram, Abdul R. Pinjari and Amy L. Stuart 90.1 Introduction
Analysis of Freight Transport Strategies and Methodologies
 Analysis of Freight Transport Strategies and Methodologies Florida Model Task Force Meeting Florida Department of Transportation RFP-DOT-16/17-9005-JP Project BE277 Donald Ludlow, AICP Vivek Sakhrani,
The ipems MAP-21 Module
 The ipems MAP-21 Module Producing the information you need from the National Performance Management Research Data Set (NPMRDS) January 2015 Innovation for better mobility Use the ipems MAP-21 Module to
4 th TRB International Conference on Innovations in Travel Modeling April 30, Vidya Mysore. presented at. Moderator
 presented at 4 th TRB International Conference on Innovations in Travel Modeling April 30, 2012 Moderator Vidya Mysore Vidya.mysore@dot.state.fl.us Florida DOT 5/16/2012 Agenda Overview Recent Advances
Proposed Comprehensive Update to the State of Rhode Island s Congestion Management Process
 Proposed Comprehensive Update to the State of Rhode Island s Statewide Planning Program January 2018 Summary Outline of of Action Steps 1. Develop Objectives for Congestion Management What is the desired
THE PROJECT. Executive Summary. City of Industry. City of Diamond Bar. 57/60 Confluence.
 THE PROJECT A freeway segment ranked 6th worst in the Nation, with levels of congestion, pollution and accidents that are simply unacceptable and which have Statewide and National implications. Executive
EXISTING AND FUTURE FREIGHT GOODS MOVEMENT ASSESSMENT
 Technical Memorandum EXISTING AND FUTURE FREIGHT GOODS MOVEMENT ASSESSMENT Prepared by: April 2014 TABLE OF CONTENTS 1. Introduction... 3 1.1 Study Purpose... 3 1.2 Data Reference List... 3 2. Data sources...
Refined Statewide California Transportation Model. Progress Report November 2009
 Refined Statewide California Transportation Model Progress Report November 2009 Study area - the State of California. Forecast trips made on a typical fall / spring weekday i.e. when schools are in session.
Neal Campbell (WSDOT) Mike Dahlem (City of Sumner) Kirk Wilcox (Parametrix)
 Mike Dahlem (City of Sumner) Kirk Wilcox (Parametrix)") Practical Solutions In the Real World APWA 2017 SPRING CONFERENCE April 27, 2017 PANEL Neal Campbell (WSDOT) Mike Dahlem (City of Sumner) Kirk Wilcox (Parametrix) Facilitator Dan McReynolds (Parametrix)
Practical Solutions In the Real World APWA 2017 SPRING CONFERENCE April 27, 2017 PANEL Neal Campbell (WSDOT) Mike Dahlem (City of Sumner) Kirk Wilcox (Parametrix) Facilitator Dan McReynolds (Parametrix)
Strategic Intermodal System
 Strategic Intermodal System Strategic Plan Status Report Florida Transportation Commission December 9 2003 1 Today s Presentation Update on SITAC Activities Strategic Plan Development Progress Public Workshop
NORTH I-75 MASTER PLAN Summary Report
 NORTH I-75 MASTER PLAN Summary Report Interstate 75 (SR 93) From the Florida s Turnpike Interchange to the I-10 Interchange Alachua, Bradford, Clay, Citrus, Columbia, Duval, Levy, Marion, and Sumter Counties,
VIII. LAND USE ISSUES
 VIII. LAND USE ISSUES The & Route 57 Land Use and Circulation Study (Land Use Study, Figure 6) was completed for the Town of Clay in November 1999 (Clough, Harbour & Associates). This study investigated
Welcome. Greater Charlotte Regional Freight Mobility Plan Steering Committee Kick off Meeting #1
 Greater Charlotte Regional Freight Mobility Plan Steering Committee Kick off Meeting #1 Centralina Council of Governments 525 N. Tryon Street, 12th Floor, Charlotte, NC Welcome June 19, 2015 9:00am 11:00am
All Roads Do Not End at the State Line: Methodologies for Enabling Geodata Sharing Across Boundaries
 All Roads Do Not End at the State Line: Methodologies for Enabling Geodata Sharing Across Boundaries presented to 22 nd Geospatial Information Systems for Transportation Symposium presented by Julie Chizmas,
Management. VA SITE Annual Meeting June 27, 2013 Jay Styles Performance and Strategic t Planning Manager, Business Transformation Office
 VDOT and MAP-21 Performance Management VA SITE Annual Meeting June 27, 2013 Jay Styles Performance and Strategic t Planning Manager, Business Transformation Office Overview Map-21- How is VDOT Preparing?
Multimodal National Freight Policy Freight Corridors
 Multimodal National Freight Policy Freight Corridors presented to TRB Executive Committee Policy Session presented by Lance R. Grenzeback Cambridge Systematics, Inc. January 26, 2011 Transportation leadership
Appendix G. Evaluation Plan
 Appendix G Evaluation Plan Twin Cities Ramp Meter Evaluation evaluation plan prepared for Minnesota Department of Transportation prepared by Cambridge Systematics, Inc. with SRF Consulting Group, Inc.
Maryland Statewide Transportation Model (MSTM)
") Maryland State Highway Administration (MD SHA) Maryland Statewide Transportation Model (MSTM) TRB Meeting Federal Surface Transportation Requirements in Statewide and Metropolitan Transportation Planning:
Maryland State Highway Administration (MD SHA) Maryland Statewide Transportation Model (MSTM) TRB Meeting Federal Surface Transportation Requirements in Statewide and Metropolitan Transportation Planning:
TDOT's New Staffs, Future Plans, and opportunities for Collaboration with MPOs
 TDOT's New Staffs, Future Plans, and opportunities for Collaboration with MPOs David Lee, Assistant Director February 7, 2017 Organizational Chart Long Range Planning Organizational Chart Data Management
idaxdata.com GPS Probe Data Collection and Applications
 GPS Probe Data Collection and Applications Scott Lee, PE scott.lee@ 425-614-6231 Presentation Overview Introduction to GPS Probe Data Collection Available Applications Through Dataset Providers Application
Congest-Shun. Tim Lomax Texas A&M Transportation Institute
 Congest-Shun An SEC Rival Discusses Mobility Data & How It Might Be Used to Design and Market Transportation Projects 58 th Annual Transportation Conference February 2015 Tim Lomax Texas A&M Transportation
Methods of Travel Time Measurement in Freight-Significant Corridors
 Methods of Travel Time Measurement in Freight-Significant Corridors Submitted to: Transportation Research Board Annual Meeting By: American Transportation Research Institute 2200 Mill Road Alexandria,
LOUISIANA DOTD TRAFFIC MONITORING/DATA COLLECTION PROGRAM & UPDATES
 LOUISIANA DOTD TRAFFIC MONITORING/DATA COLLECTION PROGRAM & UPDATES George Chike, P.E. Traffic Data Collection & Management System www.dotd.la.gov DOTD FIELD CREWS Routine traffic volume counts Vehicle
Florida s Mobility Performance Measures and Experience
 Florida s Mobility Performance Measures and Experience By Douglas S. McLeod (corresponding author) Florida Department of Transportation 605 Suwannee Street Tallahassee, FL 32399-0450 Tel. 850-414-4932
SIS Policy & Implementation
 SIS Policy & Implementation Performance Planning & Programming (before it was cool) presented by Carl Mikyska, Florida MPO Advisory Council October 25, 2017 Strategic Intermodal System (SIS) Background
A Travel Time Reliability Estimation and Valuation Approach for Transportation Planning Applications
 A Travel Time Reliability Estimation and Valuation Approach for Transportation Planning Applications Sabya Mishra a, Liang Tang b, Sepehr Ghader b, Subrat Mahapatra c, and Lei Zhang b* a University of
Use Big Data and Modeling Tools To Decipher Traffic Patterns: Case Studies in Virginia
 Use Big Data and Modeling Tools To Decipher Traffic Patterns: Case Studies in Virginia Agenda Need for O-D Data O-D Data Collection A Primer Big Data and StreetLight Data Use Modeling Tool for O-D Estimation
Assessment of Current Status, Plans, and Preliminary Alternatives for High Capacity Transportation in the I-5 Corridor
 CONNECTING THURSTON COUNTY AND THE CENTRAL PUGET SOUND Alternatives to Meet Transportation Needs in the I-5 Corridor Working Paper #1 June 2011 Assessment of Current Status, Plans, and Preliminary Alternatives
Estimating Work Zone Performance Measures on Signalized Arterial Arterials
 Estimating Work Zone Performance Measures on Signalized Arterial Arterials Minneapolis, MN Prepared By: Alliant Engineering, Inc. 233 Park Avenue South, Suite 300 Minneapolis, MN 55415 Prepared For: Minnesota
TM-1 District One Regional Model ( ) Executive Summary. February 2016
 Executive Summary. February 2016") TM-1 District One Regional Model (2010-2040) Executive Summary February 2016 This report: TM-1 Introduction to the D1RPM and Validation Report provides an overall reviews of the model and contains summary
TM-1 District One Regional Model (2010-2040) Executive Summary February 2016 This report: TM-1 Introduction to the D1RPM and Validation Report provides an overall reviews of the model and contains summary
APPENDIX A. City of Hudson LWRP and. O&G Truck Route Alternatives- Traffic Analysis
 APPENDIX A City of Hudson LWRP and O&G Truck Route Alternatives- Traffic Analysis LWRP Build-Out Traffic Generation Existing Zoning Area Total In Out 1A and 1B Residential 210 & 230 1,555 D.U 1,197 778