THE ECONOMIC IMPACT OF INFORMATION TECHNOLOGIES AFTER THE FINANCIAL CRISIS
|
|
|
- George Atkins
- 6 years ago
- Views:
Transcription


1 THE ECONOMIC IMPACT OF INFORMATION TECHNOLOGIES AFTER THE FINANCIAL CRISIS Dale W. Jorgenson, Harvard University Keynote Lecture to the Annual Conference of the Association des Économistes Québécois Hôtel Hilton du Casino du Lac-Leamy Gatineau, Québec May 19, 2011
2
3

4
5 INTRODUCTION TO THE WORLD KLEMS CONSORTIUM World KLEMS Consortium Formed August 19-20, 2010 What s New? 70 NAICS Industries Covering Before the Crisis The IT Boom, the Dot-Com Crash, and the Jobless Recovery After the Crisis Continuing Economic Growth and Convergence
6 EU KLEMS PROJECT Initial Release: March 15, EU Economies: U.S., Canada, Japan, and Korea Data Sources: Labor, Capital, and Intermediate Input Completion Date: June 30, 2008
7 IT-RELATED INDUSTRIES IT-Producing Industries Computer and peripheral equipment manufacturing Communications equipment manufacturing Semiconductor and other electronic component manufacturing Software publishing Information and data processing services Computer systems design and related services IT-Using Industries Construction Machinery Motor vehicles bodies and trailers and parts Other transportation equipment Miscellaneous manufacturing Printing and related support activities Wholesale Trade Retail Trade Air transportation Water transportation Truck transportation Transit and ground passenger transportation Pipeline transportation Other transportation and support activities Broadcasting and telecommunications Federal Reserve banks credit intermediation and related activities Securities commodity contracts and investments Insurance carriers and related activities Rental and leasing services and lessors of intangible assets Legal services Miscellaneous professional scientific and technical services Management of companies and enterprises Administrative and support services Waste management and remediation services Educational services Hospitals Nursing and residential care facilities Social assistance Performing arts spectator sports museums and related activities Other electronic products Newspaper; periodical; book publishers
8 NON-IT INDUSTRIES Farms Forestry fishing and related activities Oil and gas extraction Mining except oil and gas Support activities for mining Utilities Wood products Nonmetallic mineral products Primary metals Fabricated metal products Electrical equipment appliances and components Furniture and related products Food and beverage and tobacco products Textile mills and textile product mills Apparel and leather and allied products Paper products Petroleum and coal products Chemical products Plastics and rubber products Rail transportation Warehousing and storage Motion picture and sound recording industries Funds trusts and other financial vehicles Ambulatory health care services Amusements gambling and recreation industries Accommodation Food services and drinking places Other services except government Federal General government Federal Government enterprises S&L General Government S&L Government enterprises Real estate Household
9 ROLE OF INFORMATION TECHNOLOGY: Growth of Output OUTPUT SHARES OF IT: Computers, Communications Equipment, Semiconductors, Software, Information and Data Processing Services, Computer Systems Design and Related Services OUTPUT CONTRIBUTION BY TYPE: Computers, Communications Equipment, Semiconductors, Software, Information and Data Processing Services, Computer Systems Design and Related Services OUTPUT CONTRIBUTION OF IT: IT-Producing, IT-Using, and Non-IT Value Added
10 Log Scale (2000=1) 1000 Relative Prices of IT Industry Output, Information and data processing services Computer and peripheral equipment manufacturing Semiconductor and other electronic component manufacturing Computer systems design and related services Communications equipment manufacturing Software publishing
11 Value Added Shares of Information Technology by Type, Share of Current Dollar Value Added Information and data processing services Computer and peripheral equipment manufacturing Semiconductor and other electronic component manufacturing Total IT Computer systems design and related services Communications equipment manufacturing Software publishing
12
13
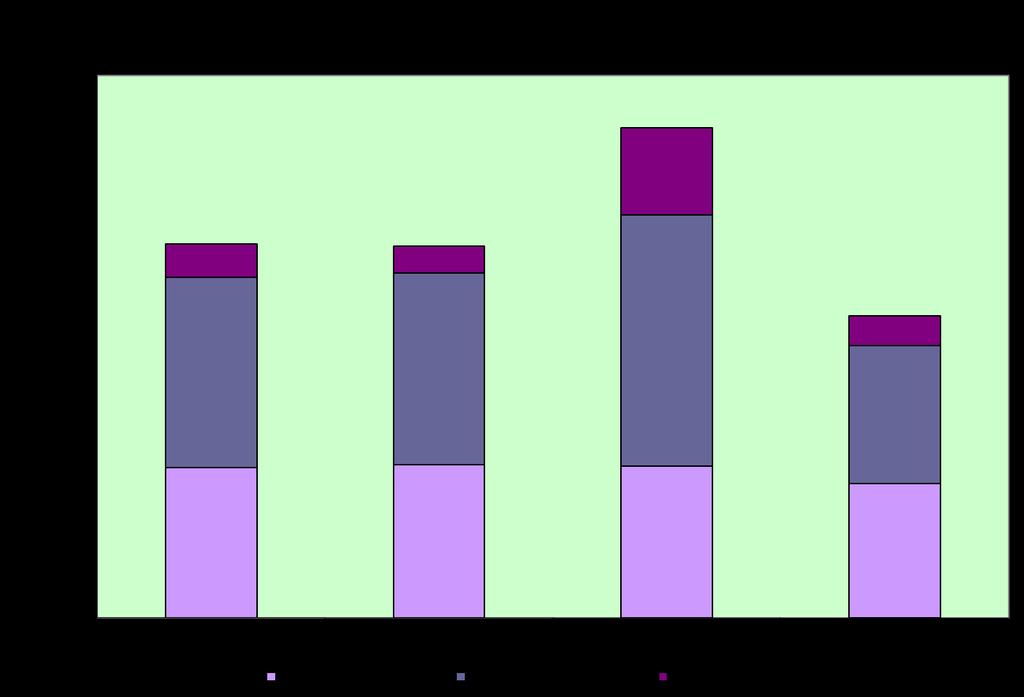
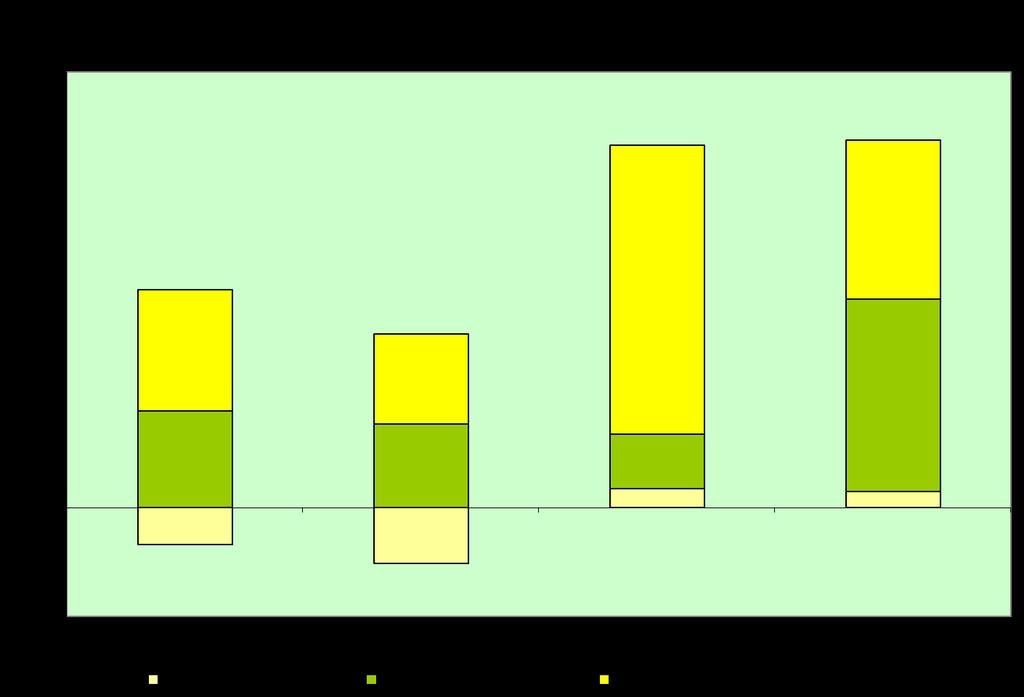
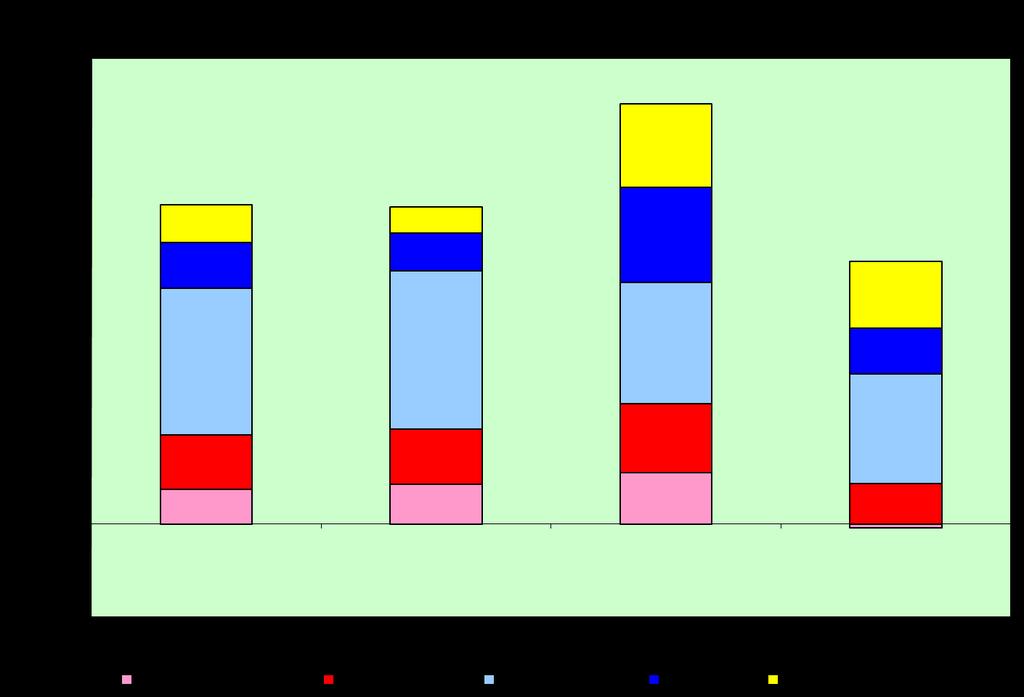
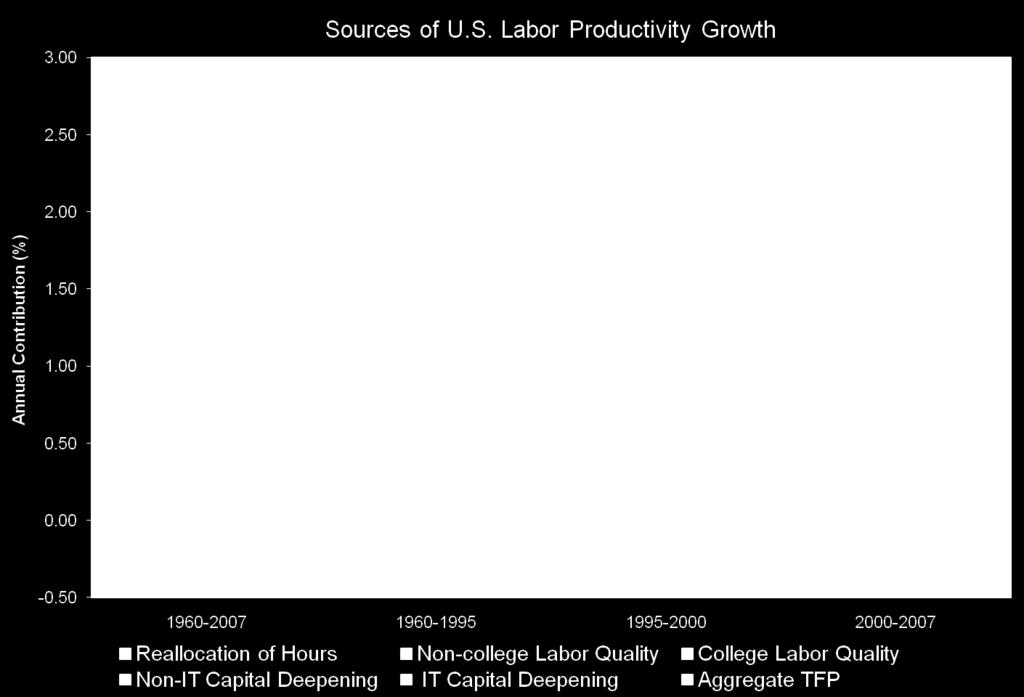
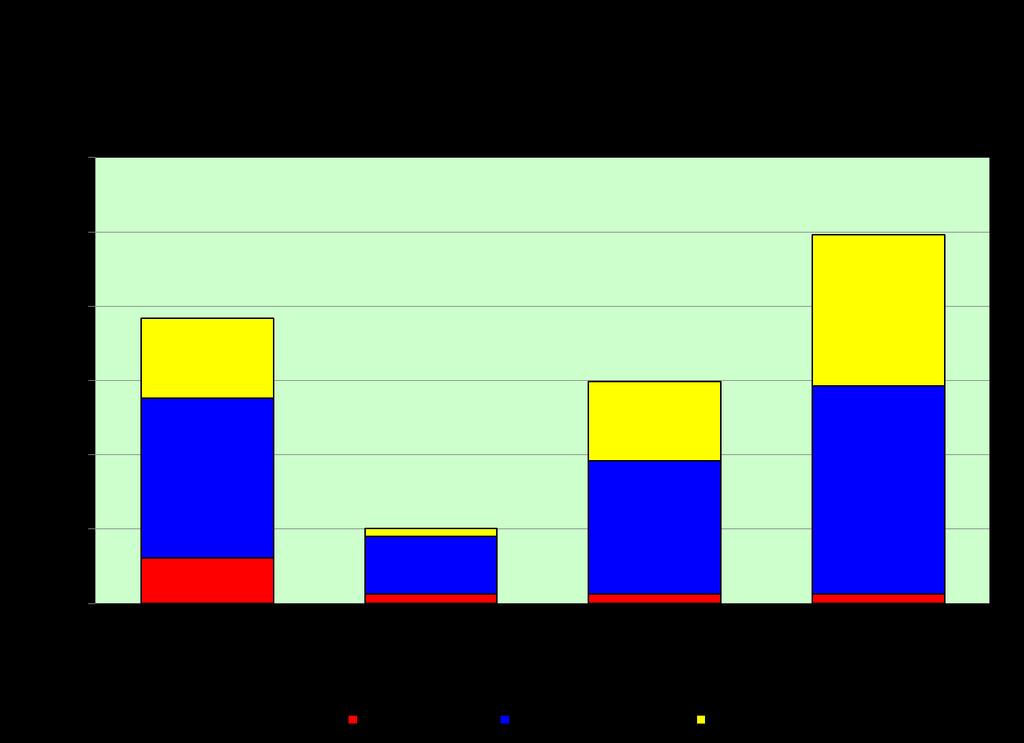
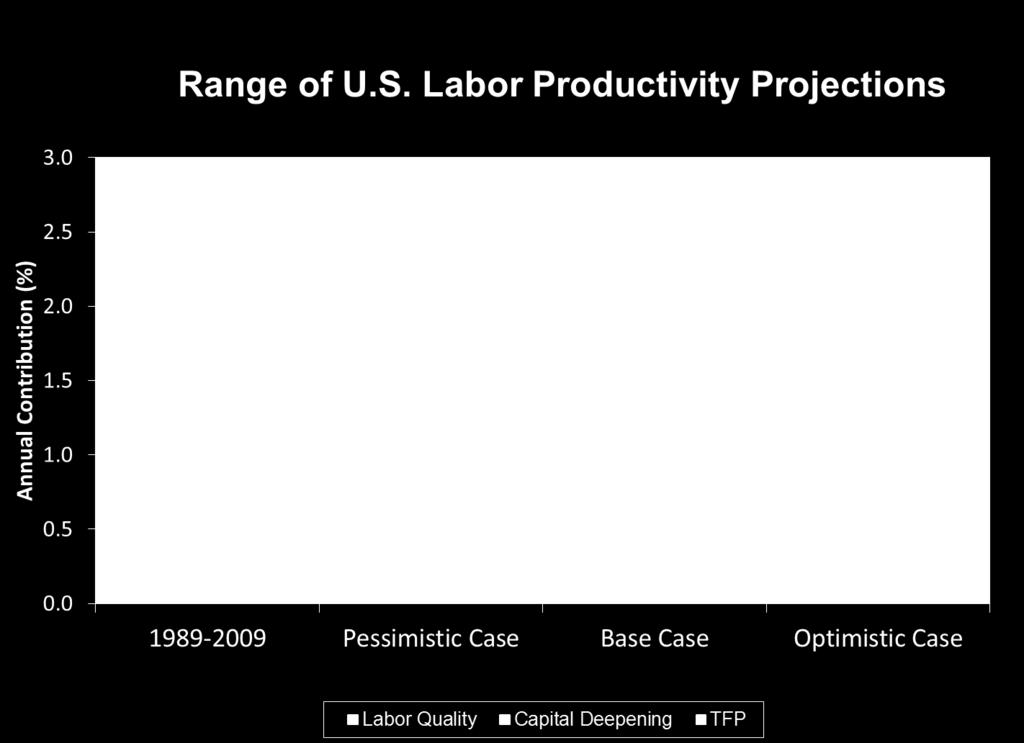
14 GROWTH IN THE NEW MILLENNIUM: IT Investment and Productivity Growth TOTAL FACTOR PRODUCTIVITY: IT-Producing, IT-Using, and Non-IT Production SOURCES OF U.S. ECONOMIC GROWTH: Capital Input, Labor Input, and TFP AVERAGE LABOR PRODUCTIVITY GROWTH: Capital Deepening, Labor Quality, TFP
15
16 Change in Contribution to Productivity: less : IT Users Retail Trade Miscellaneous professional scientific and technical services Federal Reserve banks credit intermediation and related Securities commodity contracts and investments Broadcasting and telecommunications Administrative and support services Motor vehicles bodies and trailers and parts Insurance carriers and related activities Newspaper; periodical; book publishers Other transportation equipment Air transportation Social assistance Hospitals Nursing and residential care facilities Miscellaneous manufacturing Legal services Printing and related support activities Transit and ground passenger transportation Other transportation and support activities Machinery Pipeline transportation Truck transportation Water transportation Other electronic products Performing arts spectator sports museums and related Waste management and remediation services Educational services Rental and leasing services and lessors of intangible assets Management of companies and enterprises Wholesale Trade Construction
17
18
19 GROWTH AT THE INDUSTRY LEVEL: Value Added and Productivity Growth VALUE ADDED GROWTH: IT-Producing Industries PRODUCTIVITY GROWTH: IT-Producing Industries CHANGE IN PRODUCTIVITY GROWTH: IT-Using Industries
20 Industry Contributions to Value Added Growth, Household Wholesale Trade Retail Trade Real estate S&L General Government Miscellaneous professional scientific Broadcasting and telecommunications Semiconductor and other electronic Securities commodity contracts and Computer and peripheral equipment Federal Reserve banks credit Ambulatory health care services Administrative and support services Machinery Insurance carriers and related activities Chemical products Software publishing Management of companies and Computer systems design and related Motor vehicles bodies and trailers and Other services except government Farms Truck transportation Hospitals Nursing and residential care Rental and leasing services and lessors Air transportation Construction Food services and drinking places Utilities Fabricated metal products Food and beverage and tobacco products Accommodation Plastics and rubber products Federal General government Other transportation and support Legal services Other electronic products Miscellaneous manufacturing Electrical equipment appliances Information and data processing Textile mills and textile product mills Educational services Social assistance Other transportation equipment Amusements gambling and Paper products S&L Government enterprises Printing and related support activities Warehousing and storage Communications equipment Performing arts spectator sports Nonmetallic mineral products Furniture and related products Mining except oil and gas Petroleum and coal products Motion picture and sound Federal Government enterprises Waste management and Forestry fishing and related Apparel and leather and allied Wood products Water transportation Support activities for mining Pipeline transportation Rail transportation Newspaper; periodical; book Transit and ground passenger Funds trusts and other financial Primary metals Oil and gas extraction
21 Industry Contributions to Productivity Growth, Wholesale Trade Retail Trade Semiconductor and other electronic Computer and peripheral equipment Securities commodity contracts and investments Farms Broadcasting and telecommunications Software publishing Textile mills and textile product mills Air transportation Rail transportation Motor vehicles bodies and trailers and parts Truck transportation Federal General government Machinery Miscellaneous manufacturing Other electronic products Miscellaneous professional scientific and Fabricated metal products Other transportation and support activities Plastics and rubber products Accommodation Information and data processing services Food and beverage and tobacco products Warehousing and storage Communications equipment manufacturing Other transportation equipment Petroleum and coal products Furniture and related products Social assistance Water transportation Waste management and remediation services Food services and drinking places Pipeline transportation Chemical products Domar weighted contribution Electrical equipment Mining except oil and gas Apparel and leather and Nonmetallic mineral products Paper products Performing arts spectator Administrative and support Printing and related support Motion picture and sound Amusements gambling and Household Wood products Federal Government Support activities for mining Computer systems design Transit and ground Forestry fishing and Educational services Primary metals Management of companies S&L Government enterprises Funds trusts and other Insurance carriers and Other services except S&L General Government Newspaper; periodical; Legal services Utilities Ambulatory health care Rental and leasing services Hospitals Nursing and Oil and gas extraction Real estate Federal Reserve banks Construction
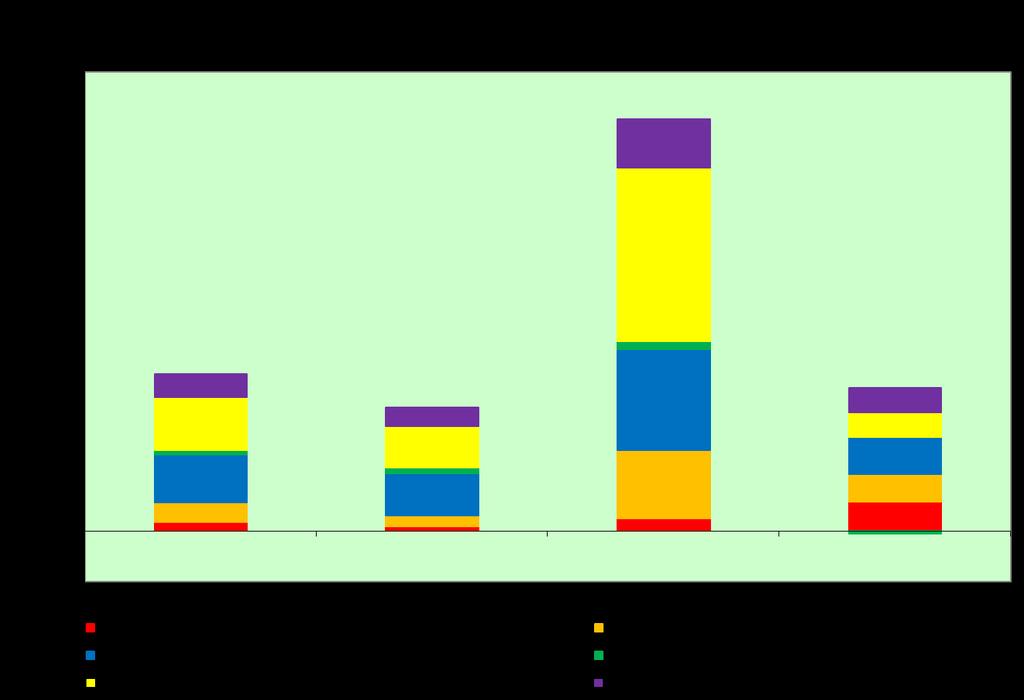
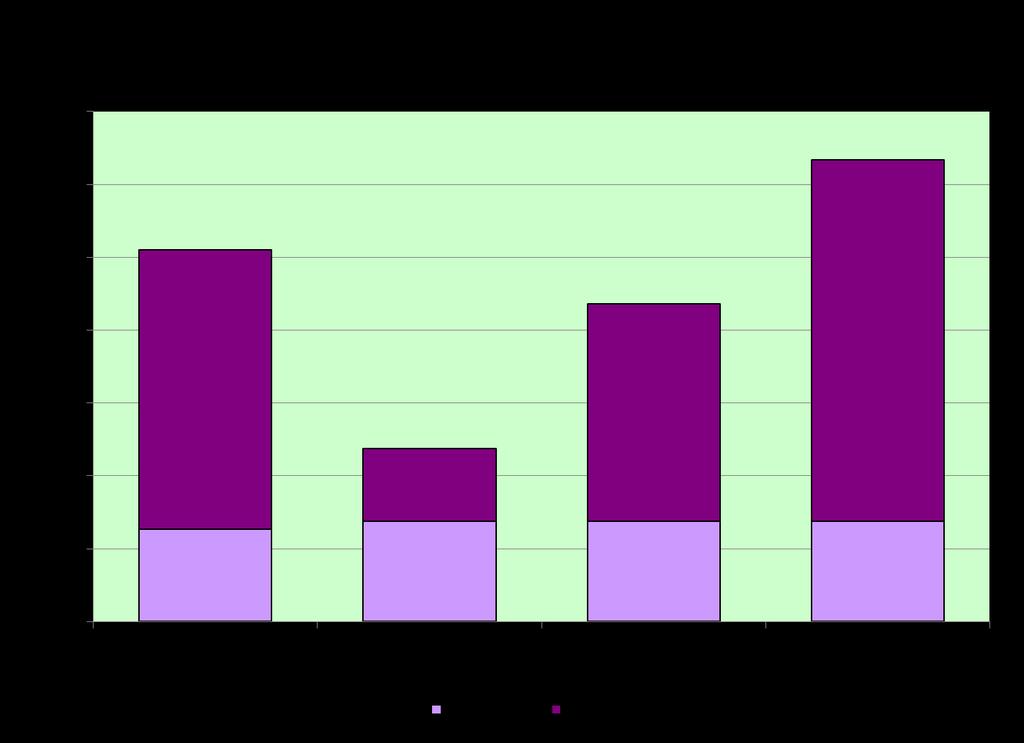
22 Projecting Growth of the U.S. and the World Economy Hours Worked from Labor Force Projections; Labor Quality from Projections of Educational Attainment Productivity Growth from Production Possibility Frontier: IT and Non-IT Productivity Growth, Capital Quality, and the Gap between Growth of Output and Capital GDP Growth Is the Sum of Growth in Hours Worked and Productivity Growth
23
24

25 Annual Contribution (%) Range of World Output Projections

26 Annual Contribution (%) Range of G7 Output Projections
 Range of Output")

27 Annual Contribution (%) Range of Output Projections for Developing and Transition Economies
28 THE ECONOMIC IMPACT OF INFORMATION TECHNOLOGIES FROM IT PRODUCTION TO UTILIZATION: Trade and Services to the Forefront THE WORLD ECONOMY: Continuing Economic Growth THE G7 ECONOMIES: Slower Growth CONVERGENCE: The Rise of Asia
STATE OF HAWAI'I. No. of. Total Average Rep. Units Average Quarterly Quarterly Industry March Employment Wages Wages January February March
 STATE OF HAWAI'I TOTAL, including government 37,439 598,205 6,028,316,620 10,077 596,822 598,744 599,049 TOTAL GOVERNMENT 6 123,628 1,526,182,323 12,345 121,692 123,988 125,205 Federal 1 32,650 483,102,256
STATE OF HAWAI'I. No. of. Total Average Rep. Units Average Quarterly Quarterly Industry September Employment Wages Wages July August September
 STATE OF HAWAI'I TOTAL, including government 37,044 581,957 6,080,565,857 10,448 581,677 578,368 585,826 TOTAL GOVERNMENT 6 118,031 1,532,738,257 12,986 118,907 114,660 120,525 Federal 1 34,864 560,380,978
Business-Facts: 3 Digit NAICS Summary 2015
 Business-Facts: 3 Digit NAICS Summary 25 McLean CRD 25 Polygon : MCLEAN, NAICS Code Business Description Establishment Employees Sales (in Millions) Agriculture, Forestry, Fishing and Hunting Crop Production
Business-Facts: 3 Digit NAICS Summary 2015
 Business-Facts: 3 Digit Summary 215 Lake Anne 215 Polygon 1: LAKE ANNE 2, 11 Agriculture, Forestry, Fishing and Hunting 111 Crop Production 112 Animal Production and Aquaculture 113 Forestry and Logging
11-Years From 2000 to 2011: Despite 30 Million Population Growth, First 11-Yr Job Loss Since 1927-'38
 40% 11-Years From 2000 to 2011: Despite 30 Million Population Growth, First 11-Yr Job Loss Since 1927-'38 % Total US Job Growth/Loss: Eleven Years Ending October Each Year 30% 20% 10% 0% October 2000 to
Appendix A NAICS Codes and Titles
 Appendix A NAICS Codes and Titles The current analysis of the US economy uses a classification system that is based on the 6-digit North American Industry Classification System (NAICS) introduced in year
EMPLOYMENT AND PAYROLLS 2006 ANNUAL AVERAGES. "Check Out Our Web Site:
 AN PAYROLLS 2006 S "Check Out Our Web Site: www.dllr.state.md.us/lmi/index.htm" MARYLAN EPARTMENT OF LABOR, LICENSING AN REGULATION Office of Workforce Information and Performance 1100 North Eutaw Street
Louisiana. NAICS code 1. Total recordable cases
 Table A-1. Percent relative standard errors for incidence rates of nonfatal occupational injuries and illnesses by industry and case types, 2012 recordable away from work, job transfer, or All industries
CITY OF CALERA BUSINESS LICENSE FEE CODE SCHEDULE **All licenses issued are required to pay a $10.00 issuance fee in addition to their license fee**
 CITY OF CALERA BUSINESS LICENSE FEE CODE SCHEDULE **All licenses issued are required to pay a $10.00 issuance fee in addition to their license fee** Code Description Schedule 111 Farming and Crop Production
BusinessCounts Methodology 2015A Release June 2015
 Introduction BusinessCounts is a geographic summary database of business establishments and employees for nearly ten million businesses and one hundred and thirty million employees. The database is available
APPLIED GEOGRAPHIC SOLUTIONS
 Version Release 2018 Introduction BusinessCounts is a geographic summary database of business establishments and employees for nearly ten million businesses and one hundred and thirty million employees.
BUSINESS-FACTS: 2 DIGIT SIC SUMMARY
 Project : South Tulsa BUSINESS-FACTS: 2 DIGIT SUMMARY Prepared For You 1.00 Mile Radius TOT All Industries MAN All Manufacturing ( 20-39) RET All Retailing ( 52-59) 01 Agricultural Production - Crops 02
Rising Flathead Valley 32 nd Annual Montana Economic Outlook Seminar February 6, 2007
 Rising Flathead Valley 32 nd Annual Montana Economic Outlook Seminar February 6, 2007 Center for Business Information and Research Flathead Valley Community College Director: Gregg Davis, Ph.D. Business
A Year of Unbalanced Growth:
 National Employment Law Project A Year of Unbalanced Growth: Industries, Wages, and the First 12 Months of Job Growth After the Great Recession DATA BRIEF February 2011 In this data brief, we draw on recent
Regional Competitive Industry Analysis
 Regional Competitive Industry Analysis Clackamas, Multnomah, and Washington Counties July 2017 Washington Multnomah Clackamas Michael Meyers, Economist (503) 229-6179 michael.meyers@oregon.gov Jill Cuyler,
Total fatal injuries (number) Total. Total Private industry Goods producing
 Total. Total Private industry Goods producing") TABLE A-2. Fatal occupational resulting from transportation and homicides, South Carolina, 2015 Transportation 2 Homicides 2 fatal 117 54 37 4 9 13 13 Private industry 105 47 33 4 6 11 11 Goods producing
TABLE A-2. Fatal occupational resulting from transportation and homicides, South Carolina, 2015 Transportation 2 Homicides 2 fatal 117 54 37 4 9 13 13 Private industry 105 47 33 4 6 11 11 Goods producing
San Diego Economy Drought-Resistant, With Exceptions KEY FINDINGS
 San Diego Economy Drought-Resistant, With Exceptions KEY FINDINGS On average, non-agricultural private sector businesses in San Diego County annually use 6,887 cubic feet (54,341 gallons) of water for
Business-Facts: 2 Digit SIC Summary 2010
 Business-Facts: Digit Summary Radius : 777 RICHMOND HWY, ALEXANDRIA, VA 6-8,. -. Miles, s + TOT All Industries 9 8,86,8. 6 MAN All Manufacturing ( -9).7 RET All Retailing ( -9) 8,9.7 9 ADM Public Administration
ABN AMRO Group N.V. Overview total assets 2016
 ABN AMRO Group N.V. Overview total assets 06 This document provides an overview of ABN AMRO s balance sheet composition and loan portfolio in 06, as part of the bank s commitment to provide further transparency
Economic Impacts. Refineries in Skagit County
 Economic Impacts of the Refineries in Skagit County February 13, 2015 Center for Economic and Business Research Prepared for the Economic Development Association of Skagit County Table of Contents Executive
This PDF is a selection from a published volume from the National Bureau of Economic Research
 This PDF is a selection from a published volume from the National Bureau of Economic Research Volume Title: Measuring Economic Sustainability and Progress Volume Author/Editor: Dale W. Jorgenson, J. Steven
FEDERAL RESERVE statistical release
 FEDERAL RESERVE statistical release G.17 (419) For release at 9:15 a.m. (EDT) August 17, 2017 INDUSTRIAL PRODUCTION AND CAPACITY UTILIZATION Industrial production rose 0.2 percent in July following an
Preparing for the Future in Troup County, Georgia
 Preparing for the Future in County, Georgia Assessment Report 2008 Business Development Produced for County and the Cities of LaGrange, West Point, and Hogansville PREPARING FOR THE FUTURE IN TROUP COUNTY,
Census 2002 Industry Codes
 Census 2002 Industry Codes (PEIO1ICD, PEIO2ICD, TEIO1ICD) For more information on the Census 2002 industry and occupations codes, go to http://www.bls.gov/cps/cpsoccind.htm 0170-0290 Agriculture, forestry,
List of CDP-ACS. The full list of classifications for CDP s Activity Classification System (CDP-ACS)
") List of CDP-ACS The full list of classifications for CDP s Activity Classification System (CDP-ACS) Contents Introduction to CDP-ACS... 3 List of CDP-ACS... 4 Page 2 of 10 CDP Worldwide 2018 @cdp www.cdp.net
List of CDP-ACS The full list of classifications for CDP s Activity Classification System (CDP-ACS) Contents Introduction to CDP-ACS... 3 List of CDP-ACS... 4 Page 2 of 10 CDP Worldwide 2018 @cdp www.cdp.net
Capitol Region Industry Clusters of Opportunity
 This report was prepared by the Labor Market Information Division (LMID) of the California Development Department to provide the Golden Sierra, North Central Counties Consortium, Sacramento and Training
Raj Jindal Louisiana Workforce Commission
 Raj Jindal Louisiana Workforce Commission Louisiana 2012 baseline employment (including self-employed): 2,004,830 2015 projected employment: 2,110,030-5.3% total growth - 1.7% average annual growth 2022
Vermont Short Term Employment Projections
 Short Term Employment Projections 2016-2018 Background Every year, the Department of Labor produces the state s short term employment projections. These projections use historical and current industry
The Employment Impact of the New Economy Initiative (NEI) on the Detroit Region and the State of Michigan
 on the Detroit Region and the State of Michigan") The Employment Impact of the New Economy Initiative (NEI) on the Detroit Region and the State of Michigan Prepared for the New Economy Initiative, A special project of the Community Foundation for Southeast
The Employment Impact of the New Economy Initiative (NEI) on the Detroit Region and the State of Michigan Prepared for the New Economy Initiative, A special project of the Community Foundation for Southeast
What Explains High Unemployment? The Aggregate Demand Channel Mian and Sufi Appendix
 What Explains High Unemployment? The Aggregate Demand Channel Mian and Sufi Appendix 1. Theory We provide the full analytical details of the model presented in section 2. Consumption allocation of consumers
Regional Competitive Industry Analysis
 Regional Competitive Industry Analysis Marion, Polk, and Yamhill Counties June 2017 Yamhill Polk Marion Michael Meyers, Economist (503) 229-6179 michael.meyers@oregon.gov Jill Cuyler, Research Analyst
Factors affecting output and employment
 Table V 2. Factors affecting industry output and employment, 2004 14 111 Crop production Output is expected to grow more slowly than GDP. Employment is projected to fall as a result of increasing productivity,
MANUFACTURING IN IOWA
 MANUFACTURING IN IOWA NOVEMBER 2011 INSIDE: SECTOR SIZE 2 KEY INDUSTRIES EARNINGS 4 EXPORTS 5 JOB TRENDS 6 GDP TRENDS 7 COUNTY DEPENDENCE 3 8 OVERVIEW Iowa s competitive strengths in manufacturing emerged
This note provides some measures of the economic importance of logistics and
 Activity in the Louisville Economy by Paul Coomes, Ph.D. Professor of Economics, and National City Research Fellow and Barry Kornstein Senior Research Analyst University of Louisville September 2003 This
ACCREDITATION SCHEDULE
 ACCREDITATION SCHEDULE ORGANISATION BSCIC Certifications Private Limited CERTIFICATE NUMBER S3931107IF (QMS) M3931107IF (Management Systems) LOCATIONS AND COUNTRIES COVERED BY ACCREDITATION Refer to Attachment
TVET REFORM PROJECT DISCUSSION PAPER INDUSTRY SKILLS COUNCILS. July 2010
 TVET REFORM PROJECT DISCUSSION PAPER INDUSTRY SKILLS COUNCILS July 2010 This paper sets out a rationale and proposal for the establishment of a network of Industry Skills Councils (ISC) in Bangladesh.
Convergence of NACE and NAICS
 VOORBURG GROUP ON SERVICES STATISTICS 16th Meeting Örebro, 17-21 September 2001 Convergence of NACE and NAICS Implications for Services Statistics Session on Classification Paul Johanis Statistics Canada
in Korean Industries ( ): Estimates from KIP Database
: Estimates from KIP Database") RIETI/G-COE Hi-Stat International Workshop on Establishing Industrial Productivity Database for China, India, Japan and Korea October 22, 2010, Tokyo The Productivity Performance in Korean Industries (1990-2008):
RIETI/G-COE Hi-Stat International Workshop on Establishing Industrial Productivity Database for China, India, Japan and Korea October 22, 2010, Tokyo The Productivity Performance in Korean Industries (1990-2008):
REGIONAL WORKFORCE PROFILE
 REGIONAL WORKFORCE PROFILE Lake of the Ozarks Regional Economic Development Council Camden County Miller County Morgan County NOVEMBER 2016 Table of Contents Topic Page Purpose 2 Executive Summary 3 Overview
State Purchasing Contract Environmental Impact Analysis
 State Purchasing Contract Environmental Impact Analysis September 2013 Prepared by Holly Lahd for the Minnesota Pollution Control Agency Funded through a Sustainable Materials Management grant from the
Manufacturing Sector Profile for Monroe RLMA
 Manufacturing Sector Profile for Monroe RLMA The Labor Market information (LMI) division of Research and Statistics helps provide information on various sectors in the regional economy. Reports and tables
Chapter 5 Flows, stocks and related concepts
 Draft annotated outline of Chapter 5 Chapter 5 Flows, stocks and related concepts Below is an annotated draft of Chapter 5. The text contains a number of issues which need to be discussed to guide further
Disclosure Topic Tables SASB
 Disclosure Topic Tables Health Care sector Biotechnology & Pharmaceuticals Drug Retailers Medical Equipment and Supplies Health Care Delivery Health Care Distributors Managed Care Water and Waste and Hazardous
MINISTRY OF PLANNING AND INVESTMENT LAO STATISTICS BUREAU
 Workshop on Energy Statistics for ASEAN Countries Kuala Lumpur, Malaysia 21-23 November 2016 Data Collection On Energy Statistics and Using Data to Establish The Supply and Use Table Sypaseut NAVONGSA
Table 2 - NAICS Canada 2002 to NAICS Canada 2007
 Table 2 - NAICS Canada 2002 to NAICS Canada 2007 * - part of 2007 industry; R - NAICS 2002 industry code reused with different content; T - title change; NU - NAICS 2002 industry code not used. 2002 NAICS
China. Li Shantong and He Janus Data Source. 2. Sector Classification
 China Li Shantong and He Janus 1 1. Data Source The source of the initial input-output (I-O) table for China is "Input-Output Table of China - 2002 from the Department of National Economy Accounting, State
Technical Note: Global Industry Classification Standards (GICS)
") Technical Note: Global Industry Classification Standards (GICS) 1 The Global Industry Classification Standard structure consists of 10 sectors, 24 industry groups, 68 industries and 154 sub-industries.
Technical Note: Global Industry Classification Standards (GICS) 1 The Global Industry Classification Standard structure consists of 10 sectors, 24 industry groups, 68 industries and 154 sub-industries.
Policy on Witnessing Activities and Scope Management for Certification and Verification Bodies
 Policy on Witnessing Activities and Scope Management for Certification and Verification Bodies PS22 1) Purpose In order to conform with ISO/IEC 17011 clause 7.5.6, INAB shall: ensure that appropriate mechanisms
March 2015 Manufacturing ISM Report On Business
 FOR RELEASE: April 1, 2015 Contact: Kristina Cahill Report On Business Analyst ISM, ROB/Research Tempe, Arizona 800/888-6276, Ext. 3015 E-mail: kcahill@ism.ws March 2015 Manufacturing ISM Report On Business
International Seminar on Early Warning and Business Cycle Indicators. 14 to 16 December 2009 Scheveningen, The Netherlands
 ESA/STAT/AC.202/S4.5 International Seminar on Early Warning and Business Cycle Indicators 14 to 16 December 2009 Scheveningen, The Netherlands Tracking the Mexican business cycle Yuriko Yabuta Mexico 2
Map of proposed GRI Business Activity Groups to Industry Classification Benchmark (ICB)
") Additional information about the project can be found at https://www.globalreporting.org/reporting/sector-guidance/topics-research/pages/default.aspx Map of proposed GRI Business Activity Groups to Industry
Additional information about the project can be found at https://www.globalreporting.org/reporting/sector-guidance/topics-research/pages/default.aspx Map of proposed GRI Business Activity Groups to Industry
Classification of Industry Group and Sector
 -1- Classification of Industry Group and Sector The classification of listed company s industry structure is to incorporate similar businesses into the same group, so as to provide appropriate investment
Measuring the Effect of Louisiana Agriculture on the State Economy Through Multiplier and Impact Analysis
 October 1995 Number 849 Measuring the Effect of Louisiana Agriculture on the State Economy Through Multiplier and Impact Analysis By David W. Hughes 1 Table of Contents Introduction... 3 Input-Output Model
NEW PRINCIPAL BUSINESS OR PROFESSIONAL ACTIVITY CODES
 NEW PRINCIPAL BUSINESS OR PROFESSIONAL ACTIVITY CODES These codes for the Principal Business or Professional Activity classify sole proprietorships by the type of activity they are engaged in to facilitate
At IBISWorld, we know that industry intelligence is more than assembling facts: It s combining data and insight to answer the questions that
 At IBISWorld, we know that industry intelligence is more than assembling facts: It s combining data and insight to answer the questions that successful businesses ask IBISWorld New Zealand Industry Reports
Regional Competitive Industry Analysis
 Regional Competitive Industry Analysis Baker, Union, and Wallowa Counties October 2017 Union Wallowa Baker Michael Meyers, Economist (503) 229-6179 michael.meyers@oregon.gov Jill Cuyler, Research Analyst
The Plan Bay Area. Page Copyright 2012 Pearson Addison-Wesley. All rights reserved.
 The Plan Bay Area Page 1 20-1 What is the Plan Bay Area? Plan Bay Area 2040 is a state-mandated, integrated long-range transportation and land use plan. As required by Senate Bill 375 (2008), all metropolitan
Appendix B. Conversion to the 1987 Standard Industrial Classification
 Appendix B. Conversion to the Standard Industrial Classification Effective with the publication of August 1990 data, all industry employment, hours, and earnings were converted to Standard Industrial Classification
A MAN UFACTURING COMEBACK 1. A Man ufacturing Comeback: Men s and Women s Employment Gains and Losses in March 2012
 A MAN UFACTURING COMEBACK 1 UNEMPLOYMENT A Man ufacturing Comeback: Men s and Women s Employment Gains and Losses in 2011 March 2012 In 2011 manufacturing employment increased for the first time in more
At IBISWorld, we know that industry intelligence is more than assembling facts: It s combining data and insight to answer the questions that
 At IBISWorld, we know that industry intelligence is more than assembling facts: It s combining data and insight to answer the questions that successful businesses ask IBISWorld China Industry Reports Agriculture,
Some thoughts on productivity and Greece
 Some thoughts on productivity and Greece Nikos Vettas Professor, Athens University of Economics and Business General Director, IOBE (vettas@iobe.gr, www.iobe.gr, http://www.aueb.gr/users/vettas) Bank of
IAF Informative Document for QMS Scopes of Accreditation
 IAF ID 1:2010 International Accreditation Forum, Inc. IAF Informative Document IAF Informative Document for QMS Scopes of Accreditation (IAF ID 1:2010) IAF ID 1:2010 International Accreditation Forum,
Acknowledgement: Ralph Prahl, Prahl & Associates, contributed critical review and analysis
 Subject Focus on Energy Evaluation Updating Industry Classification for Participants in Business To Oscar Bloch, Public Service Commission of Wisconsin From Eric Rambo, Bryan Ward, and Dan Belknap, PA
User Handbook February 2017
 Economic & Fiscal Impact Model User Handbook February 2017 Prepared by: 7505 E. McClintock Dr. Scottsdale, AZ 85251 Copyright Elliott D. Pollack & Co. All Rights Reserved GOODWILL ECONOMIC & FISCAL IMPACT
INDUSTRIAL PRODUCTION INDICES IN JULY Figure 1. Industrial Production Indices (2010 = 100)
") INDUSTRIAL PRODUCTION INDICES IN JULY 2017 1 According to the preliminary data the Industrial Production Index 2, seasonally adjusted 3, increased by 0.2% in July 2017 as compared to June 2017. In July
INDUSTRIAL PRODUCTION INDICES IN JULY 2017 1 According to the preliminary data the Industrial Production Index 2, seasonally adjusted 3, increased by 0.2% in July 2017 as compared to June 2017. In July
Table 1 shows the general form of China 2010 I-O Table:
 China Liu Yu 1 and Jie Chen The original 2010 Input-Output Table doesn t have multi-product sector. After some adjustments, the data tables are reclassified and re-balanced to provide the matrices required
Businesses, Employees, Occupation
 Businesses, Employees, Occupation BusinessCounts is a geographic summary database of business establishments and employees for over twelve million companies and one hundred and ten million employees. The
INTERNATIONAL TRADE REPORT ON ADRIATIC AND IONIAN AREA. STATISTICS DATA Update 2014
 INTERNATIONAL TRADE REPORT ON ADRIATIC AND IONIAN AREA STATISTICS DATA Update 2014 Ancona, May 2015 The aim of this work is to provide a contribution to identify the economic and commercial dimension of
27,000 sf Warehouse / Office ~ Two Buildings on 2 acres
 27,000 sf Warehouse / Office ~ Two Buildings on 2 acres 4106 Mariah Circle, Saint Lucie County, FL $595,000. Metzger Rd A B Mariah Circle Saint Lucie County Zoning: IL - Light Industrial 290 Frontage on
INDUSTRIAL PRODUCTION INDICES IN OCTOBER
 INDUSTRIAL PRODUCTION INDICES IN OCTOBER 2017 1 According to the preliminary data the Industrial Production Index 2, seasonally adjusted 3, decreased by 0.6% in October 2017 as compared to September 2017.
Schedule of Accreditation issued by United Kingdom Accreditation Service 2 Pine Trees, Chertsey Lane, Staines-upon-Thames, TW18 3HR, UK
 2 Pine Trees, Chertsey Lane, Staines-upon-Thames, TW18 3HR, UK Accredited to ISO 17021-1:2015 as an Environmental Verifier in Accordance with EMAS: Council Regulation (EC) No.1221/2009 Head Office Warwick
SWOT Analysis of Commodity Flow Datasets
 SWOT Analysis of Commodity Flow Datasets prepared for FDOT Transportation Statistics Office prepared by RS&H, Inc. 5/6/2015 Background Many users work with commodity flow data Modelers GIS analysts Policy
Industrial policy, Structural Change, and Pattern of Industrial Productivity Growth in Taiwan
 Industrial policy, Structural Change, and Pattern of Industrial Productivity Growth in Taiwan Tsu-tan Fu* Department of Economics & Center for Efficiency and Productivity Research Soochow University, Taiwan
PMI at 51.8% New Orders and Production Growing Employment and Inventories Contracting Supplier Deliveries Slower
 FOR RELEASE: 0:00 A.M. ET April, 206 Contact: Kristina Cahill Report On Business Analyst ISM, ROB/Research Manager Tempe, Arizona 800/888-6276, Ext. 305 E-mail: kcahill@instituteforsupplymanagement.org
Estimated Employment Multipliers for the City of Johannesburg
 Estimated Employment Multipliers for the City of Johannesburg Undertaken by Trade & Industrial Policy Strategies (TIPS) for The City of Johannesburg Metro 2015 Estimation of employment multipliers for
To be used in conjunction with the 2017/2018 Baldrige Excellence Builder
 To be used in conjunction with the 2017/2018 Baldrige Excellence Builder https://www.nist.gov/sites/default/files/documents/2017/02/09/2017-2018-baldrige-excellence-builder.pdf Application forms are included
Law Department Compensation Benchmarking Survey 2013 Edition. Questionnaire
 Law Department Compensation Benchmarking Survey 2013 Edition Questionnaire Conducted and Published by: and Deadline for Submission: June 4, 2013 Publication Date: August 2013 2013 Law Department Compensation
Moving Ohio Manufacturing Forward: Competitive Electricity Pricing
 Cleveland State University EngagedScholarship@CSU Urban Publications Maxine Goodman Levin College of Urban Affairs 2-1-2013 Moving Ohio Forward: Competitive Electricity Pricing Iryna Lendel Cleveland State
LA VERSION ELECTRONIQUE FAIT FOI
 International Forum, Inc. IAF Informative Document IAF Informative Document For QMS and EMS Scopes of Issue 2 (IAF ID 1: 2014) International Forum, Inc. 2014 International Forum, Inc. Issue 2 IAF Informative
Map of proposed GRI Business Activity Groups to Global Industry Classification Standard (GICS)
") Additional information about the project can be found at https://www.globalreporting.org/reporting/sector-guidance/topics-research/pages/default.aspx Map of proposed GRI Business Activity Groups to Global
Additional information about the project can be found at https://www.globalreporting.org/reporting/sector-guidance/topics-research/pages/default.aspx Map of proposed GRI Business Activity Groups to Global
Canadian International Merchandise Trade
 Catalogue no. 65-001-X Vol. 69, no. 9. Canadian International Merchandise Trade. Statistical tables Table 1 Merchandise trade of Canada, balance of payments basis, seasonally adjusted - Current dollars
Canadian International Merchandise Trade
 Catalogue no. 65-001-X Vol. 69, no. 12. Canadian International Merchandise Trade. Statistical tables Table 1 Merchandise trade of Canada, balance of payments basis, seasonally adjusted - Current dollars
Canadian International Merchandise Trade
 Catalogue no. 65-001-X Vol. 69, no. 7. Canadian International Merchandise Trade. Statistical tables Table 1 Merchandise trade of Canada, balance of payments basis, seasonally adjusted - Current dollars
Canadian International Merchandise Trade
 Catalogue no. 65-001-X Vol. 66, no. 9. Canadian International Merchandise Trade. Statistical tables Table 1 Merchandise trade of Canada, balance of payments basis, seasonally adjusted Current dollars Export
Schedule of Accreditation issued by United Kingdom Accreditation Service 2 Pine Trees, Chertsey Lane, Staines-upon-Thames, TW18 3HR, UK
 2 Pine Trees, Chertsey Lane, Staines-upon-Thames, TW18 3HR, UK provide quality management systems certification Sovereign House 29 Reddicap Hill Sutton Coldfield B75 7BQ Contact: Mr. Chris McMillan Tel:
Market Services sector turnover in 2009 is 1,013,479 million euros, 13.6% less than the previous year
 1 December 2010 Annual Services Survey 2009 (Results preview) Market Services sector turnover in 2009 is 1,013,479 million euros, 13.6% less than the previous year Employed personnel decreases 5.1% and
Gross Domestic Product by Industry Sources and Methods with Industry Details
 Catalogue no. 15-548-XIE Gross Domestic Product by Industry s and Methods with Industry Details How to obtain more information Specific inquiries about this product and related statistics or services should
Executive Summary Central region Number of establishments by division of industry manufacturing
 Executive Summary At present the structure of business trade, services and industrial activity, has changed dramatically. There are new kind of business in the economy, including the small scale industries
China. Liu Yu 1 and Li Xiangyang Data Source
 China Liu Yu 1 and Li Xiangyang 2 The China IO table in the GTAP 8 Data Base is constructed from key 2007 IO table published by National Bureau of Statistics of China (NBS) and some other data sources,
Stronger Economies. Session 2: More Data Exploration & Strategy Identification. Revised Data Snapshot
 Stronger Economies Together Session 2: More Data Exploration & Strategy Identification Revised Data Snapshot 1 Income and poverty Questions: Total in Poverty Minors (Age 0-17) in Poverty Real Median Household
OSHA s E-Recordkeeping: How to Submit Your Records. December 13, 2017
 OSHA s E-Recordkeeping: How to Submit Your Records December 13, 2017 Agenda Welcome Discussion: The who, what and when of OSHA s Electronic Injury Recordkeeping Rule How to Submit Injury Data Through OSHA
MCILS Study: Appendix A Sectors and Sub-sectors potentially requiring Industrial Sites in their location Sub-sector Descriptions
 MCILS Study: Appendix A Sectors and Sub-sectors potentially requiring Industrial Sites in their location Sub-sector Descriptions These are description of the various industries contained within the manufacturing;
Chicago s Manufacturing Base:
 CHICAGO S MANUFACTURING BASE: Chicago s Manufacturing Base: Chicago s manufacturing base is represented by companies that sell their goods outside of the region. By exporting, these manufacturers bring
The Gross National Product (GNP) is GDP added by net foreign income. National Income is GNP deducted by indirect net taxes (net) and depreciation.
 is GDP added by net foreign income. National Income is GNP deducted by indirect net taxes (net) and depreciation.") M E T A D A T A BASIC INFORMATION 1 Data Category : Gross Domestic Product (GDP) 2 Statistics Disseminator : Statistics Department, Bank Indonesia 3 Address : Jl. M.H. Thamrin No. 2 Jakarta 4 Contact :
M E T A D A T A BASIC INFORMATION 1 Data Category : Gross Domestic Product (GDP) 2 Statistics Disseminator : Statistics Department, Bank Indonesia 3 Address : Jl. M.H. Thamrin No. 2 Jakarta 4 Contact :
Regional Data Snapshot
 Regional Data Snapshot Target Industry Clusters SET Session 2 Kaysinger Basin Region, Missouri Table of contents 01 Overview 02 03 Target Industry Clusters Industry Cluster Comparison 01 overview Kaysinger
Balassa (1965) Comparative Advantage by Sector of Industry, Brazil
 Comparative Advantage by Sector of Industry, Brazil") Balassa (1965) Comparative Advantage by Sector of Industry, Brazil 1986-2001 Marc-Andreas Muendler University of California, San Diego August 17, 2007 This report describes the construction of a series
Balassa (1965) Comparative Advantage by Sector of Industry, Brazil 1986-2001 Marc-Andreas Muendler University of California, San Diego August 17, 2007 This report describes the construction of a series
Experiences From Human Resource Development Fund Malaysia
 Experiences From Human Resource Development Fund Malaysia Regional TVET Conference - TVET Quality Breakthrough 10 & 11 th October 2012 Melia Hotel, Hanoi, Viet Nam PEMBANGUNAN SUMBER MANUSIA BERHAD (545143-D)
CENSUS OF INDUSTRIAL PRODUCTION
 CENSUS OF INDUSTRIAL PRODUCTION TANZANIA MAINLAND 2013 SUMMARY REPORT Vision To become a one stop centre for official statistics in Tanzania Mission To produce quality official statistics and service that
MULTILATERAL TRADE NEGOTIATIONS THE URUGUAY ROUND
 MULTILATERAL TRADE NEGOTIATIONS THE URUGUAY ROUND RESTRICTED MTN.GNS/W/120 10 Julv y 1991 Special Distribution Group of Negotiations on Services SERVICES SECTORAL CLASSIFICATION LIST Note by the Secretariat